Article

The Future of Anticancer Drugs: A Cytotoxicity Assessment Study of CdSe/ZnS Quantum Dots

1
Department of Biology, Missouri State University, 901 S National Ave, Springfield, MO 65897, USA
2
Molecular Genetics Department, UT Southwestern Medical Center, Dallas, TX 75390, USA
3
Jordan Valley Innovation Center, Missouri State University, 524 N Boonville Ave, Springfield, MO 65806, USA
*
Author to whom correspondence should be addressed.
J. Nanotheranostics 2020, 1(1), 19-38; https://0-doi-org.brum.beds.ac.uk/10.3390/jnt1010003
Submission received: 23 June 2020 / Revised: 12 August 2020 / Accepted: 18 August 2020 / Published: 21 August 2020

Abstract

:
Quantum dots (QDs), including CdSe/ZnS, are nanoparticles emitting various wavelengths of fluorescent light depending on their size. Fluorescence allows them to be exploited for in vivo sensing/imaging of cancer cells. Nevertheless, thorough assessments of the effects of these commonly used QDs on cell stability are essentially required prior to their full applications. To investigate the effects of Cd QDs on the growth of human cervical cancer cells (HeLa), we utilized a growth assay, a reactive oxygen species (ROS) assay, an apoptosis assay, and RNA-seq. The growth assay results showed significant proliferation inhibition of HeLa cells by CdSe/ZnS. We revealed that smaller green CdSe/ZnS exerts more toxic effects than slightly larger yellow CdSe/ZnS. There were no significant increases of ROSs under the treatment of Cd QDs, which is consistent with the notion that low concentration of Cd QDs does not cause significant production of ROSs. In addition, we found that Cd QDs induced late apoptosis. RNA-Seq-based transcriptome analysis revealed that the exposure to green Cd QDs significantly upregulated antiapoptotic, antiproliferative, and antitumorigenic functions. The transcriptome profile also noted the downregulation of pro-proliferation, mitochondrial respiratory chain, detoxification, and receptor-mediated endocytosis. Taken together, our findings provide evidence that green CdSe/ZnS can be an alternative anticancer drug. In addition, our transcriptome analysis provides new insights into alteration of physiological state induced by CdSe/ZnS QDs in HeLa cancer cells.

1. Introduction

Cervical cancer is the second most common cancer found in women today [1]. It has been shown that human papillomavirus 18 (HPV-18) plays a major role in the development of cervical cancer [2]. Typically, low-income women in developing countries are at a higher risk for cervical cancer [2]. The cancer appears as ulcerative lesions that can damage the cervix and has been known to spread to the vagina [3]. Cervical cancer was first discovered in 1951 in a woman named Henrietta Lacks. Dr. George O. Grey obtained a tissue sample from Henrietta after her death and noticed the malignant growth of the tissue. Based on his findings, he named and created what is now known as the HeLa cell line after Henrietta Lacks. Interestingly, Henrietta’s cervical cancer cells became the first human cell line to be used in research [4]. From the creation of the cell line to the present, HeLa cells have been used in a broad range of research areas from understanding the effects of X-ray on human cells [5], to slowing the growth of cancer cells [6], to understanding telomerase activity [7], and finally to testing anticancer drugs such as sulfonamide CA IX inhibitors [8].
Nanotechnology has been incorporated into our everyday lives. Quantum dots (QDs), first synthesized by Ekimov in 1985, are extremely small semiconductors that emit a broad spectrum of fluorescence. Semiconductor QDs have a unique gift of controlling their energy by tailoring their size, shape and composition [9]. QD fluorescence emission wavelength is positively correlated with the particle’s size, with larger particles emitting at longer wavelengths. Their sizes typically range from 2–10 nm, and most of QDs are synthesized from II–VI group materials [10]. Although semiconducting QDs have been associated with in vitro cytotoxicity due to cytotoxic cores such as CdTe or CdSe, a core shell structure has been developed to minimize the cytotoxicity [11]. A core shell structure enhances the photoluminescence efficiency of single QDs, as the core can be CdSe, CdTe, and InP, and a shell-like structure can be ZnS (which wraps the core and makes QDs safer to use in biological systems) [12]. However, CdTe/CdS, CdTe (2–6 nm), CdSe/ZnS coated with PEG (polyethylene glycol)-amine (4.6 nm) that have been tested on HEK293T, HepG2, and HEKs have been reported to be cytotoxic [13,14,15,16]. On the other hand, CdSe/ZnS–PEG, CdSe, CdTe (6 nm) have not proven to be cytotoxic upon treating K562, Caco-2, primary rat hippocampal neuron, and intravenous administration into rats, respectively [13,14,17,18]. Recent studies have shown QDs used in in vitro imaging and pH sensing due to their brighter fluorescence when compared to more commonly used organic dyes. QDs have been used for biomedical devices such as biosensors. QDs biosensors can detect the biomarkers that cause diseases by analyzing sweat, salvia, and food products [19]. QDs have been utilized in the cancer imaging field, siRNA delivery, and magnetic resonance imaging (MRI) [20].
Despite their many beneficial applications, not much research has been done on the potential use of QDs for treating diseases such as cancer. Some studies have shown that CdSe/ZnS could be used as a nano-carrier for certain diabetes drugs [21], verified anticancer drugs (Doxorubicin) [22], and lung tumor inhibitors [23]. The present study aims to investigate the cytotoxic effects of CdSe/ZnS QDs on cervical cancer cells (HeLa cells) and assess their potential uses as anticancer drugs. We hypothesized that CdSe/ZnS QDs will inhibit the growth of HeLa cancer cells either by causing oxidative stress or inducing apoptosis as a result of Cd leaking from the core. In this regard, we investigated the effect of 6.1–9.5 nm CdSe/ZnS QDs on HeLa cells by determining levels of cell viability, reactive oxygen species (ROSs), and cell death. In addition, we utilized RNAseq analysis to quantify the transcriptomic alteration in CdSe/ZnS QD-treated HeLa cells. Lastly, we proposed the potential impacts induced by the cytotoxic effects of CdSe/ZnS QDs in HeLa cells.

2. Experimental Section

2.1. CdSe/ZnS Quantum Dots (QDs)

Yellow and green CdSe/ZnS QDs (6.1–9.5 nm) functionalized with carboxylic acids were suspended in water (1000 µg/mL). These QDs were obtained from NN-Labs (Fayetteville, AR, USA). The shell (ZnS) stabilizes the optical properties of the core (CdSe) and reduces the trap states from damaging environment. The emission peak of green and yellow CdSe/ZnS QDs is 530–550 nm and 570–585 nm, respectively (NNCrystal US Corporation, Fayetteville, AR, USA).

2.2. Culturing HeLa Cells and Non-Cancerous Mouse-Derived Fibroblast Cells

Cryopreserved HeLa S3 cells (authenticated by Gentica labs, Burlington, NC, USA) and mouse-derived fibroblast cells were thawed in a 37 °C water bath. Then, 13 mL of Gibco Dulbecco’s Modified Eagle Medium (DMEM) supplemented with 10% Fetal Bovine Serum (FBS) and 1% antibiotics were added into the thawed cells dropwise to avoid osmotic shock prior to centrifugation at 400 g for 10 min. The supernatant was removed after the centrifugation and 13 mL of fresh DMEM was added to the cells in a 25 cm3 flask. The flask was kept inside an incubator at 37 °C with 5% CO2/95% air atmosphere. When cells reached ~80% confluence, they were subcultured in a 75 cm3 flask.

2.3. Cell Viability Assay

The XTT assay used for this study was adapted from the manufacturer’s protocol (Biotium). The experiment was conducted over three consecutive days. On the first day, HeLa and mouse-derived fibroblast cells were seeded at a density of 7500 cells per well, with a total volume of 100 µL of DMEM (10% FBS and 1% antibiotics). The media was replaced with new fresh media (100 µL per well) on the second day, and varying doses of green and yellow CdSe/ZnS QDs, ranging from 0.8 µg/mL to 167 µg/mL, were added to the cells. For positive control experiments, HeLa cells were treated with Cisplatin at a final concentration of 1 mM. On day three, the XTT solution containing the XTT activator (PMS) in ratio of 200:1 was applied to each well allowing reduction of the XTT agent to form orange-colored formazan salts from the viable cells. An ELx808 Absorbance Microplate Reader (Bio Tek, Winooski, VT, USA) was utilized to analyze XTT absorbance (A450–A630 nm) after 7 h of XTT treatment. All experiments were conducted in triplicate and repeated thrice.

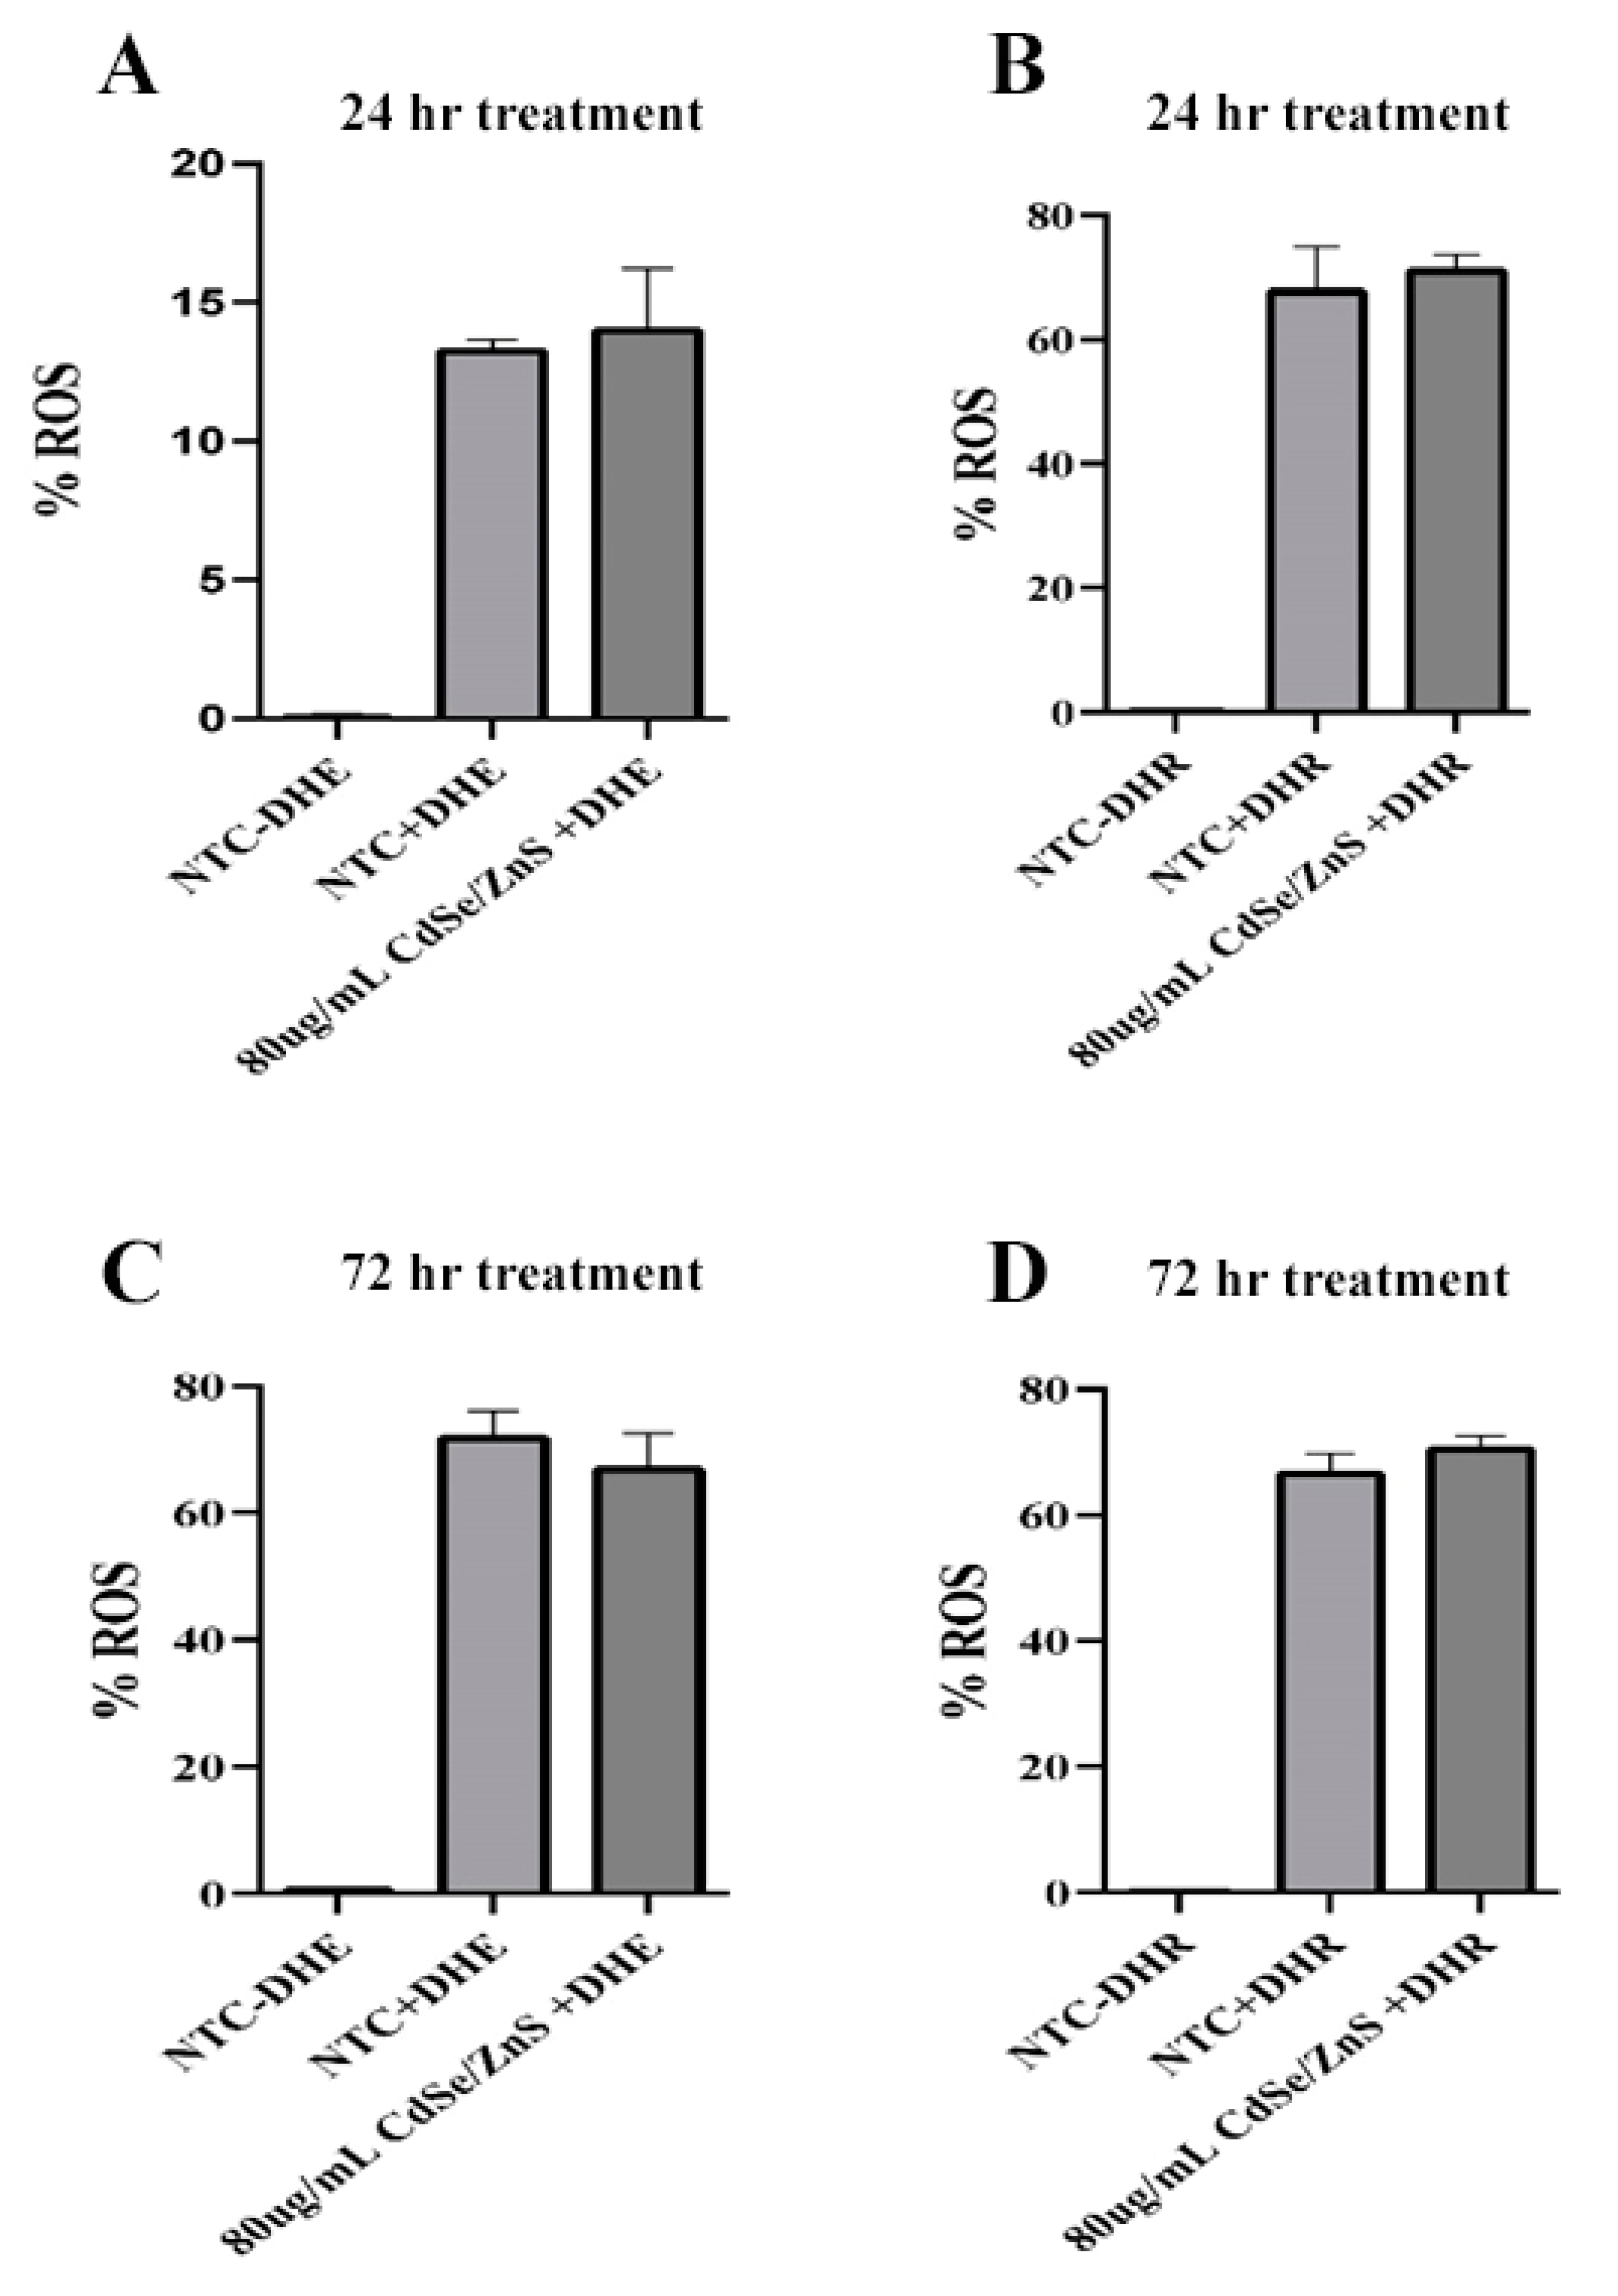
2.4. Reactive Oxygen Species (ROS) Assay

The ROS assay protocol was inspired by a previously established one [24] with minor adjustments. The ROS experiment was conducted over three to five days on a 24-well plate. On day one, 50,000 HeLa cells were plated per well with 500 µL of DMEM (10% FBS and 1% antibiotics) media. On day two, the media were refreshed, and the cells were treated with 80 µg/mL of green CdSe/ZnS QDs. After a 24-h and a 72-h treatment, cells in each well were washed with 500 µL of 1X phosphate buffered saline (PBS) twice. To dissociate adherent cells, 250 µL of trypsin with EDTA was added to each well. All dissociated individual cells from each well were collected in an Eppendorf tube and centrifuged at 400 g for 10 min at 22 °C. Dihydroethidium (DHE) or dihydrorhodamine 123 (DHR), known ROS indicators for superoxides and peroxynitrites, respectively, were added at a final concentration of 10 μM for each cell sample. The Eppendorf tubes were incubated in the dark for 30 min, and levels of ROSs were measured by a flow cytometer (Attune NxT acoustic focusing cytometer, Life Technologies, Carlsbad, CA, USA) at 518 nm/606 nm for DHE and at 507 nm/536 nm of DHR123.

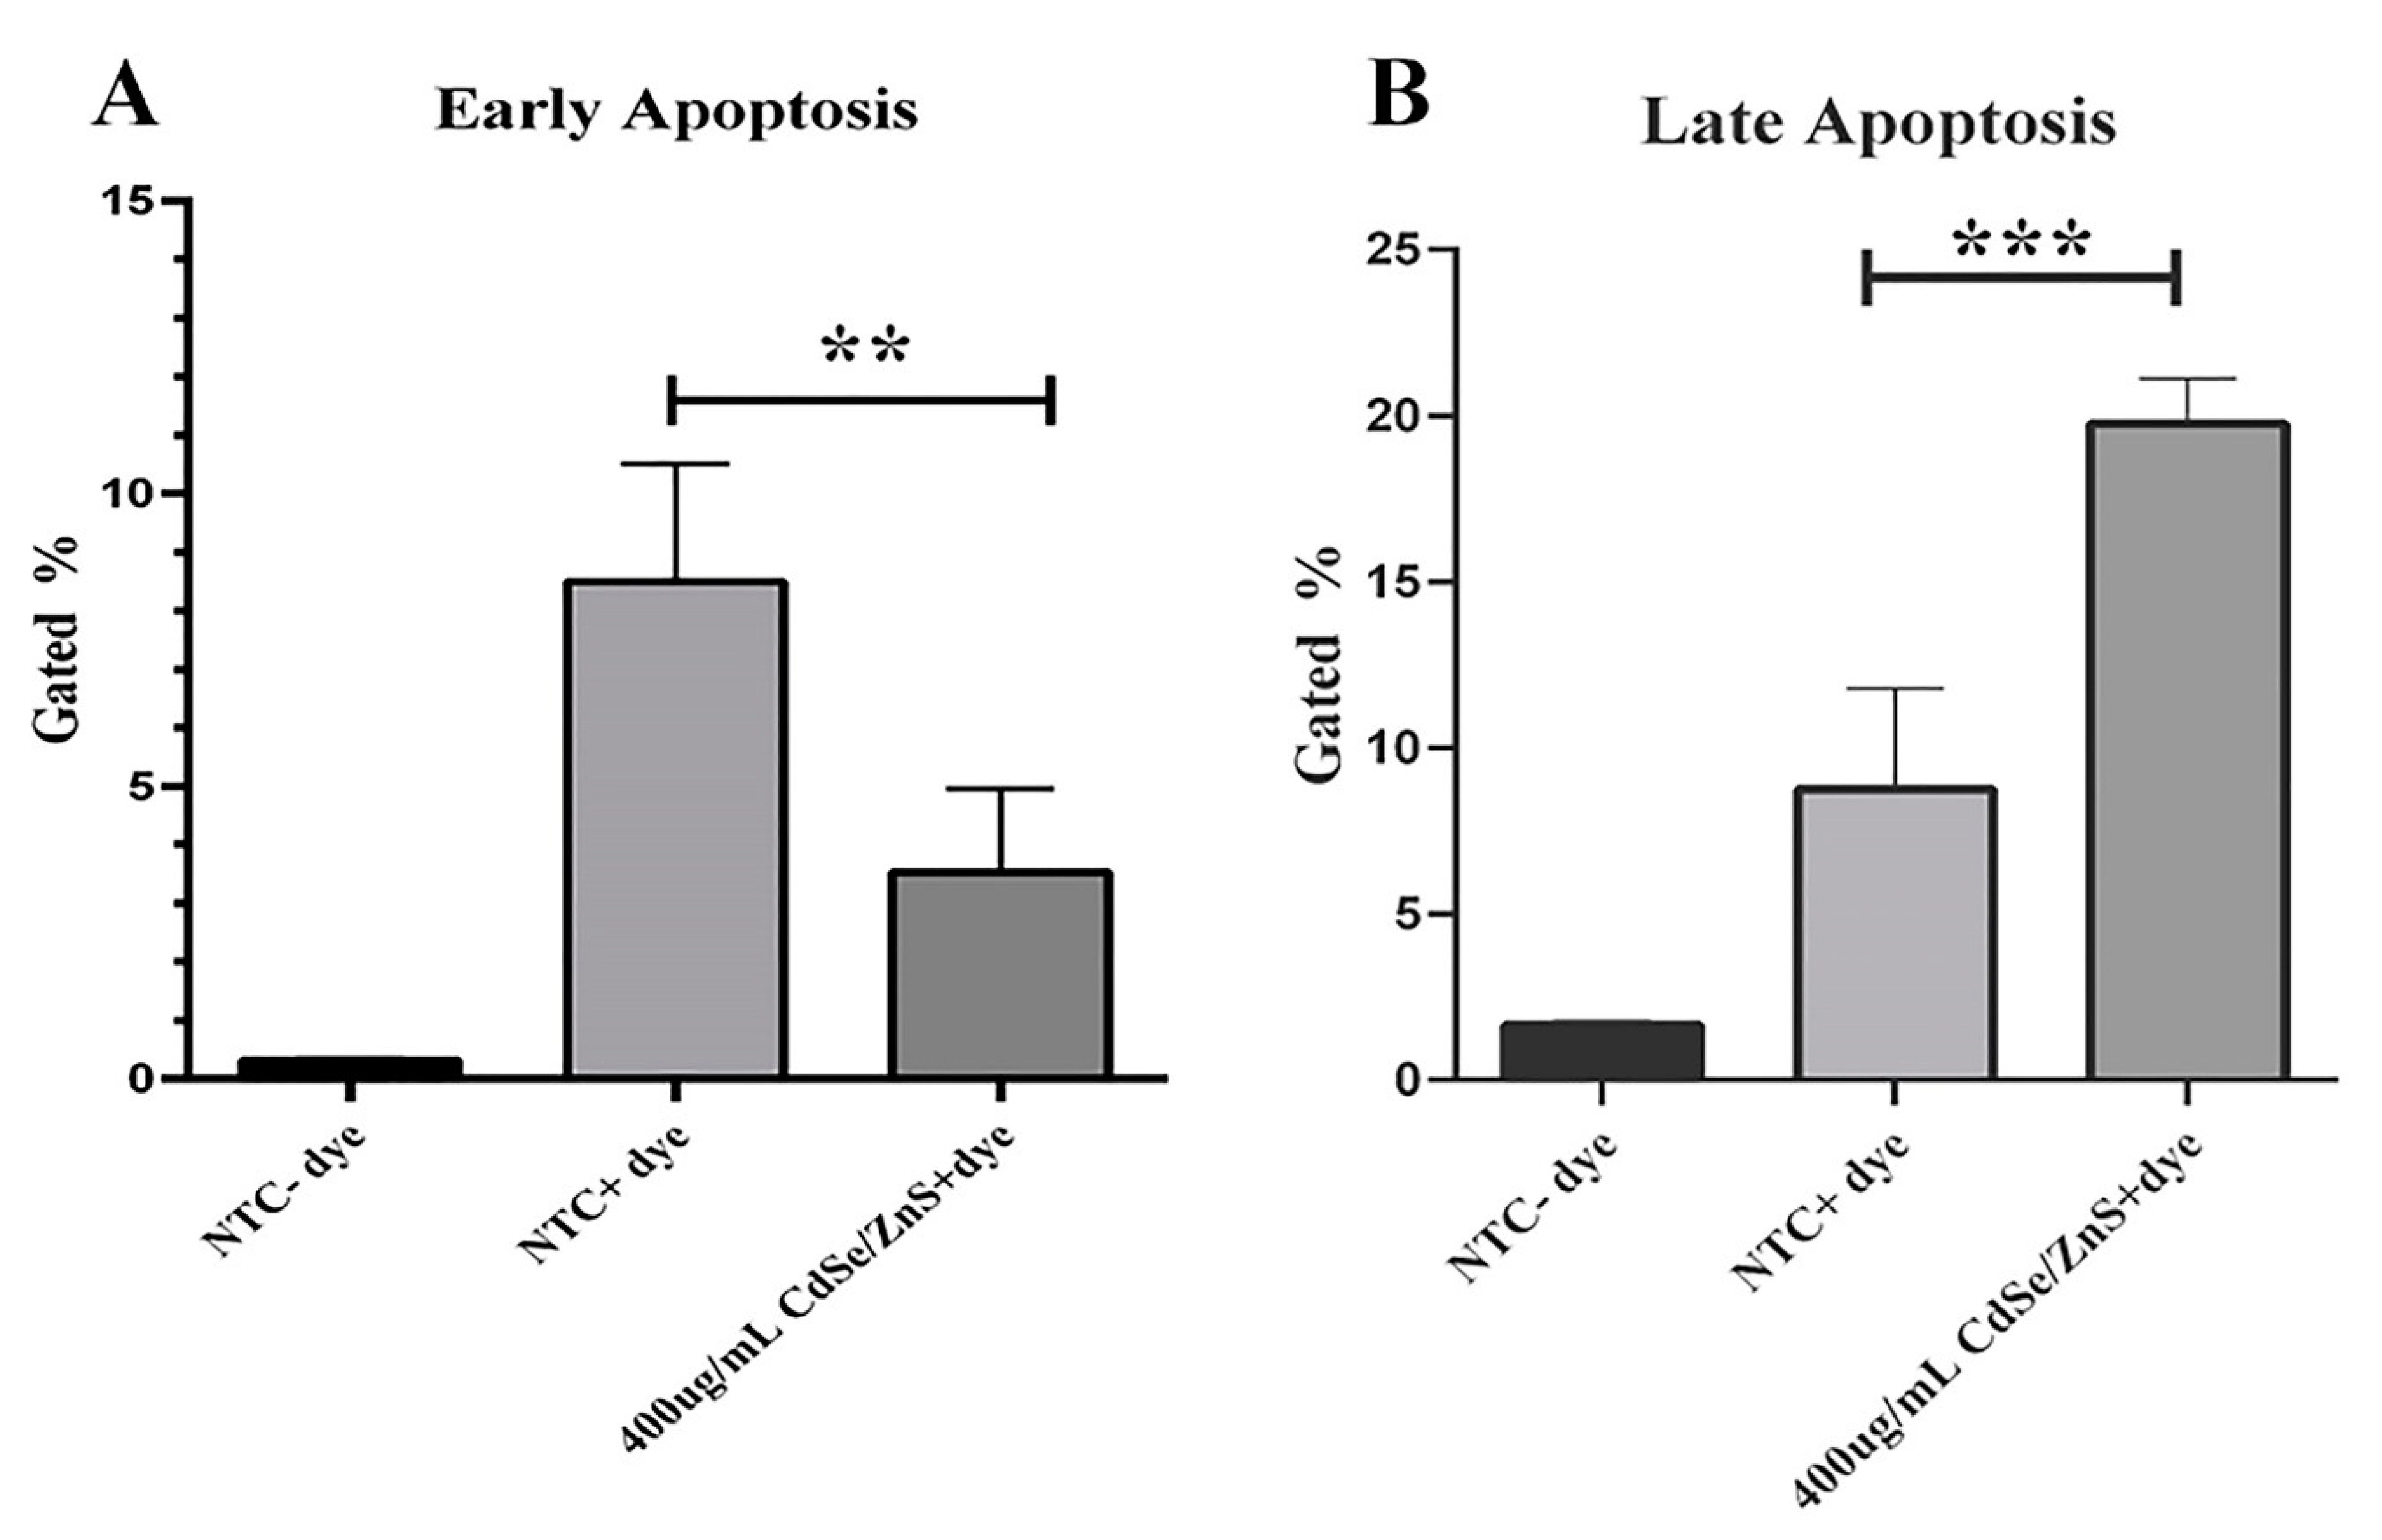
2.5. Apoptosis Assay

Our apoptosis assay was adapted from the manufacturer’s protocol (Thermo Fischer Scientific, Waltham, MA, USA, https://bit.ly/2mSZfhR). On day one, 50,000 of HeLa cells were seeded in a 24 well plate. The DMEM media (10% FBS and 1% antibiotics) was refreshed on day two, and cells were treated with 80 μg/mL of green CdSe/ZnS QDs. On day three, 250 µL of EDTA-free Trypsin was used to detach cells. All dissociated cells from each well were transferred to an Eppendorf tube and centrifuged at 400 g for 10 min at 22 °C. Cells from the treated group were incubated in 100 µL of 1X Annexin V binding buffer, 5 µL of AnnexinV-APC (BD Pharmingen, San Diego, CA, USA), and 5 µL of Propidium Iodide (BD Pharmingen) for 30 min in a humidifier. Just before the measurement of levels of apoptosis, 400 µL of 1X Annexin V binding buffer was added to the treated group. The apoptosis levels were measured by the Attune NxT acoustic flow cytometer (Life Technologies) using excitation/emission filter sets of 650/660 nm and 533/616 nm for Annexin-V-APC and Propidium Iodide, respectively.

2.6. Total RNA Extraction, mRNA Isolation, and cDNA Synthesis

One million HeLa cells were seeded in each well of a six-well plate and cultured for 24 h. The cells were then treated with 100 µg/mL of green CdSe/ZnS QDs for 24 h. A total RNA extraction was performed using the TRIzol protocol (Invitrogen, Carlsbad, CA, USA). After extraction, RNA was quantified by measuring the OD of 280 nm with a Qubit 3.0 Fluorometer, resulting in the acceptable range of 960–1200 ng/μL. Isolation of mRNA from the total RNA was done using the TruSeq Stranded mRNA LT Sample Preparation Kit (Illumina, San Diego, CA, USA). The cDNA was synthesized from newly purified mRNA by using SuperScript II Reverse Transcriptase. Each cDNA sample of six (three non-treated and three CdSe/ZnS QD treated) was ligated with unique adaptor. After 15 cycles of amplification of cDNA in a T100TM Thermal Cycler (BIO-RAD), each sample (50 ng/μL) was suspended in 30 μL of Resuspension Buffer from the Kit. These cDNAs were sequenced by an Illumina Hiseq 2500 sequencing system (Kansas Medical Genome Center), and 100 nucleotide sequences from each end of cDNA were read.

2.7. Basepair Transcriptome Analysis

cDNA sequence data were obtained from the University of Kansas Medical Genome Centre and analyzed with the Basepair website (www.basepairtech.com) using the pipeline RNA-seq. Total expression count (STAR) was conducted on non-treated and treated samples of 100 µg/mL green CdSe/ZnS QDs. The expression count STAR consists of a quality check to ensure the good quality and correct interpretation of each data set. Then, the reads were aligned with human reference genome (human hg19 genome) using differential expression (DESeq2, compare 2 groups) to get a comprehensive list of the differentially expressed genes (DEGs). This list of genes was further grouped based on their significance and analyzed using GOrilla to get Gene Ontology (GO) terms for highly significant upregulated and downregulated genes.

2.8. Statistical Analysis

GraphPad Prism 8.0 (GraphPad Software, Inc., San Diego, CA, USA) was used to conduct statistical analysis. One-way analysis of variance (ANOVA) and Dunnett’s multiple comparison test were used to assess the comparison between the treatment and control groups. A p-value less than 0.05 was considered statistically significant. If a p-value was less than 0.05, it was flagged with one asterisk (*). Two asterisks (**) indicated that the p-value < 0.0094, three asterisks (***) indicated that the p-value < 0.0007, and four asterisks (****) indicated that the p-value < 0.0001.

3. Results

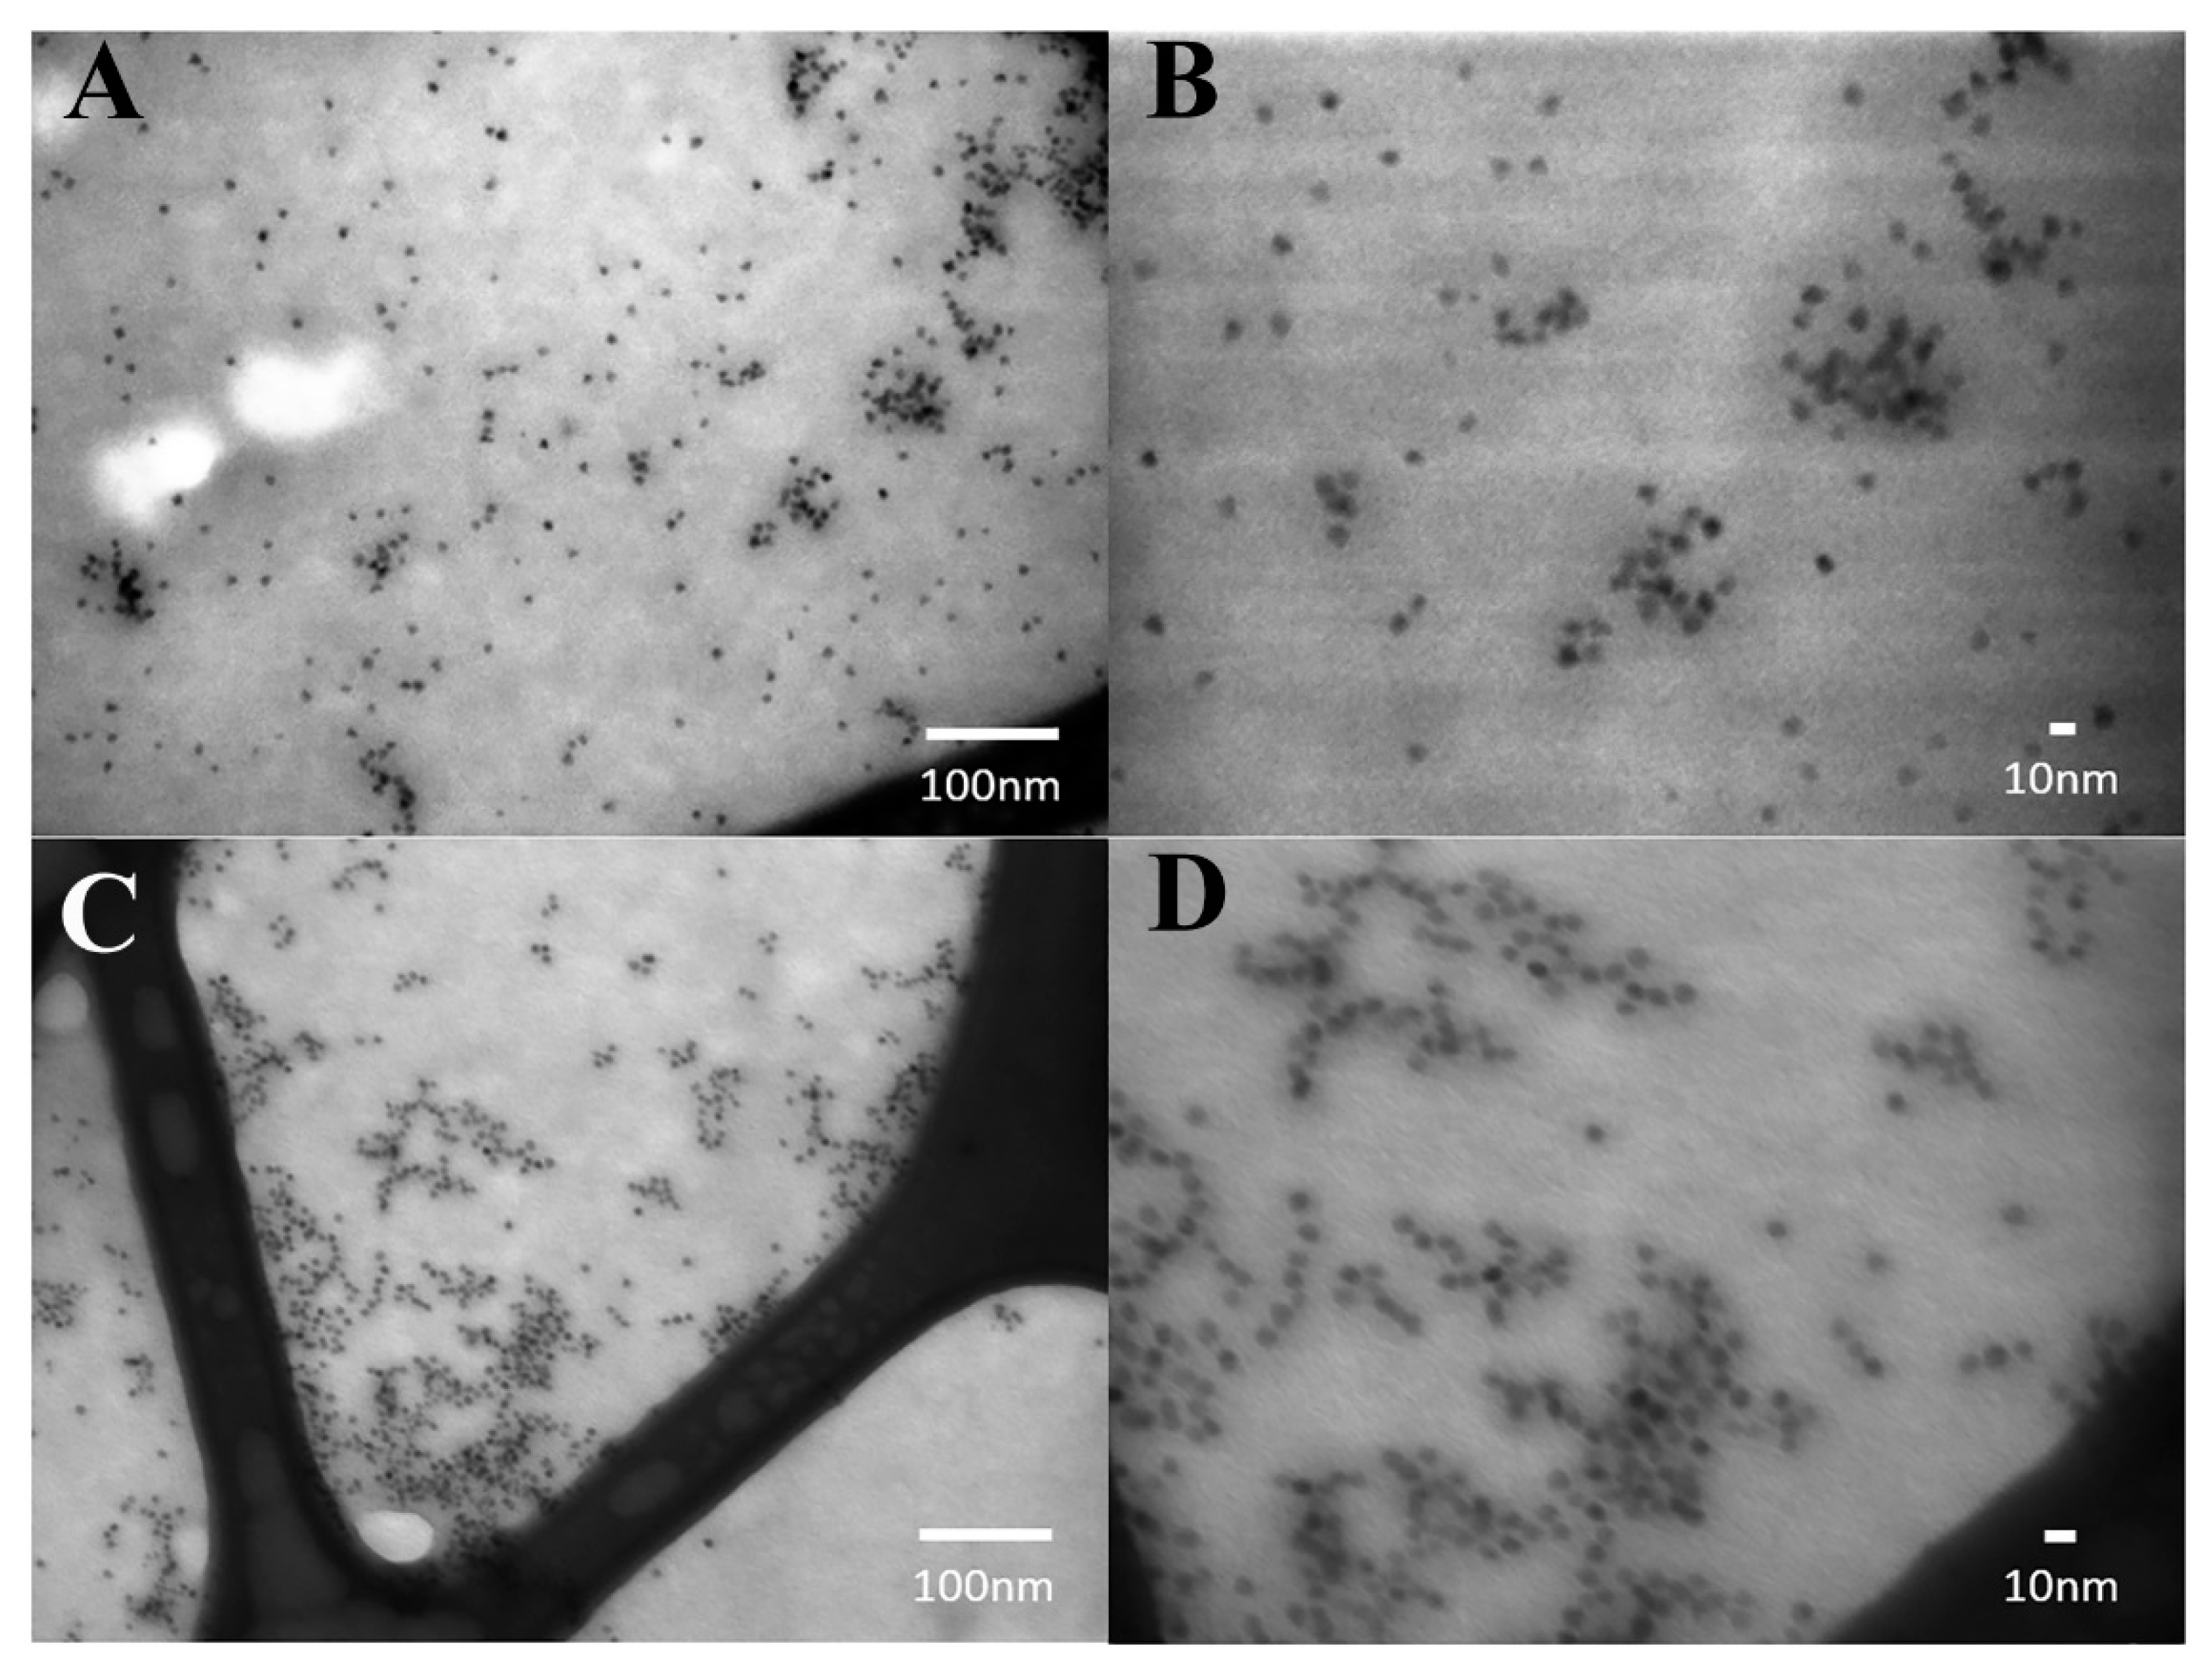
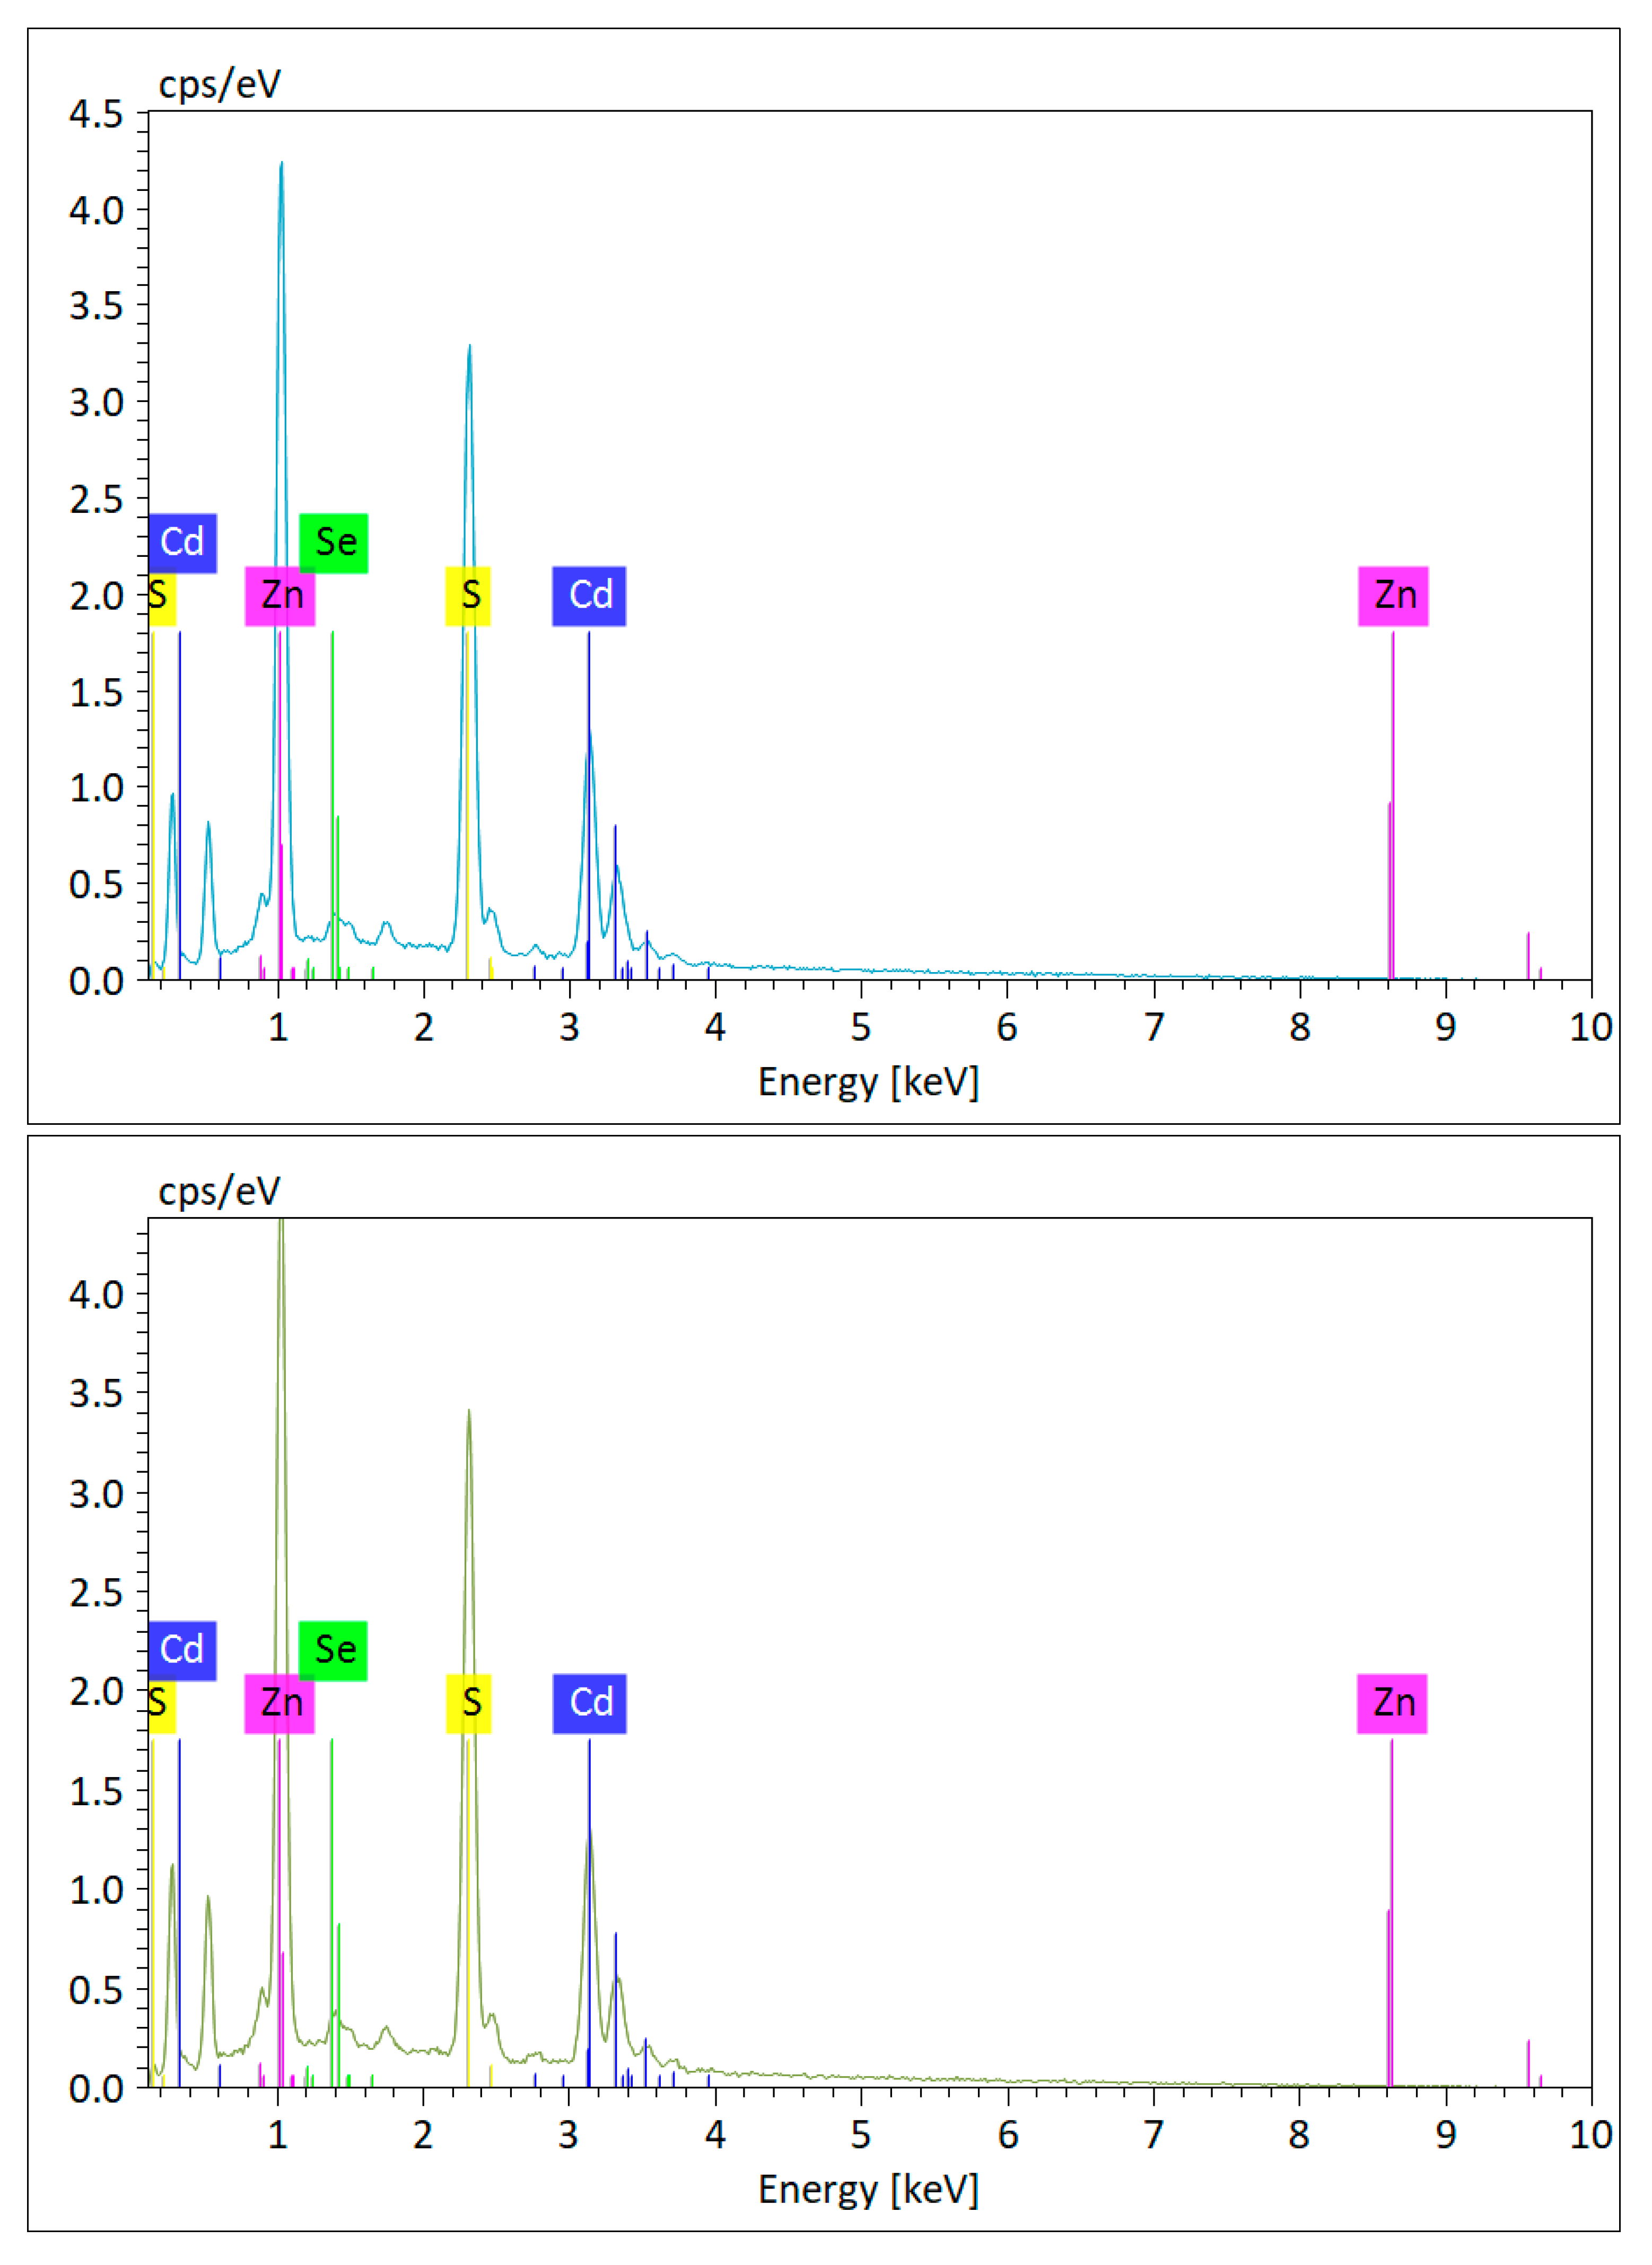
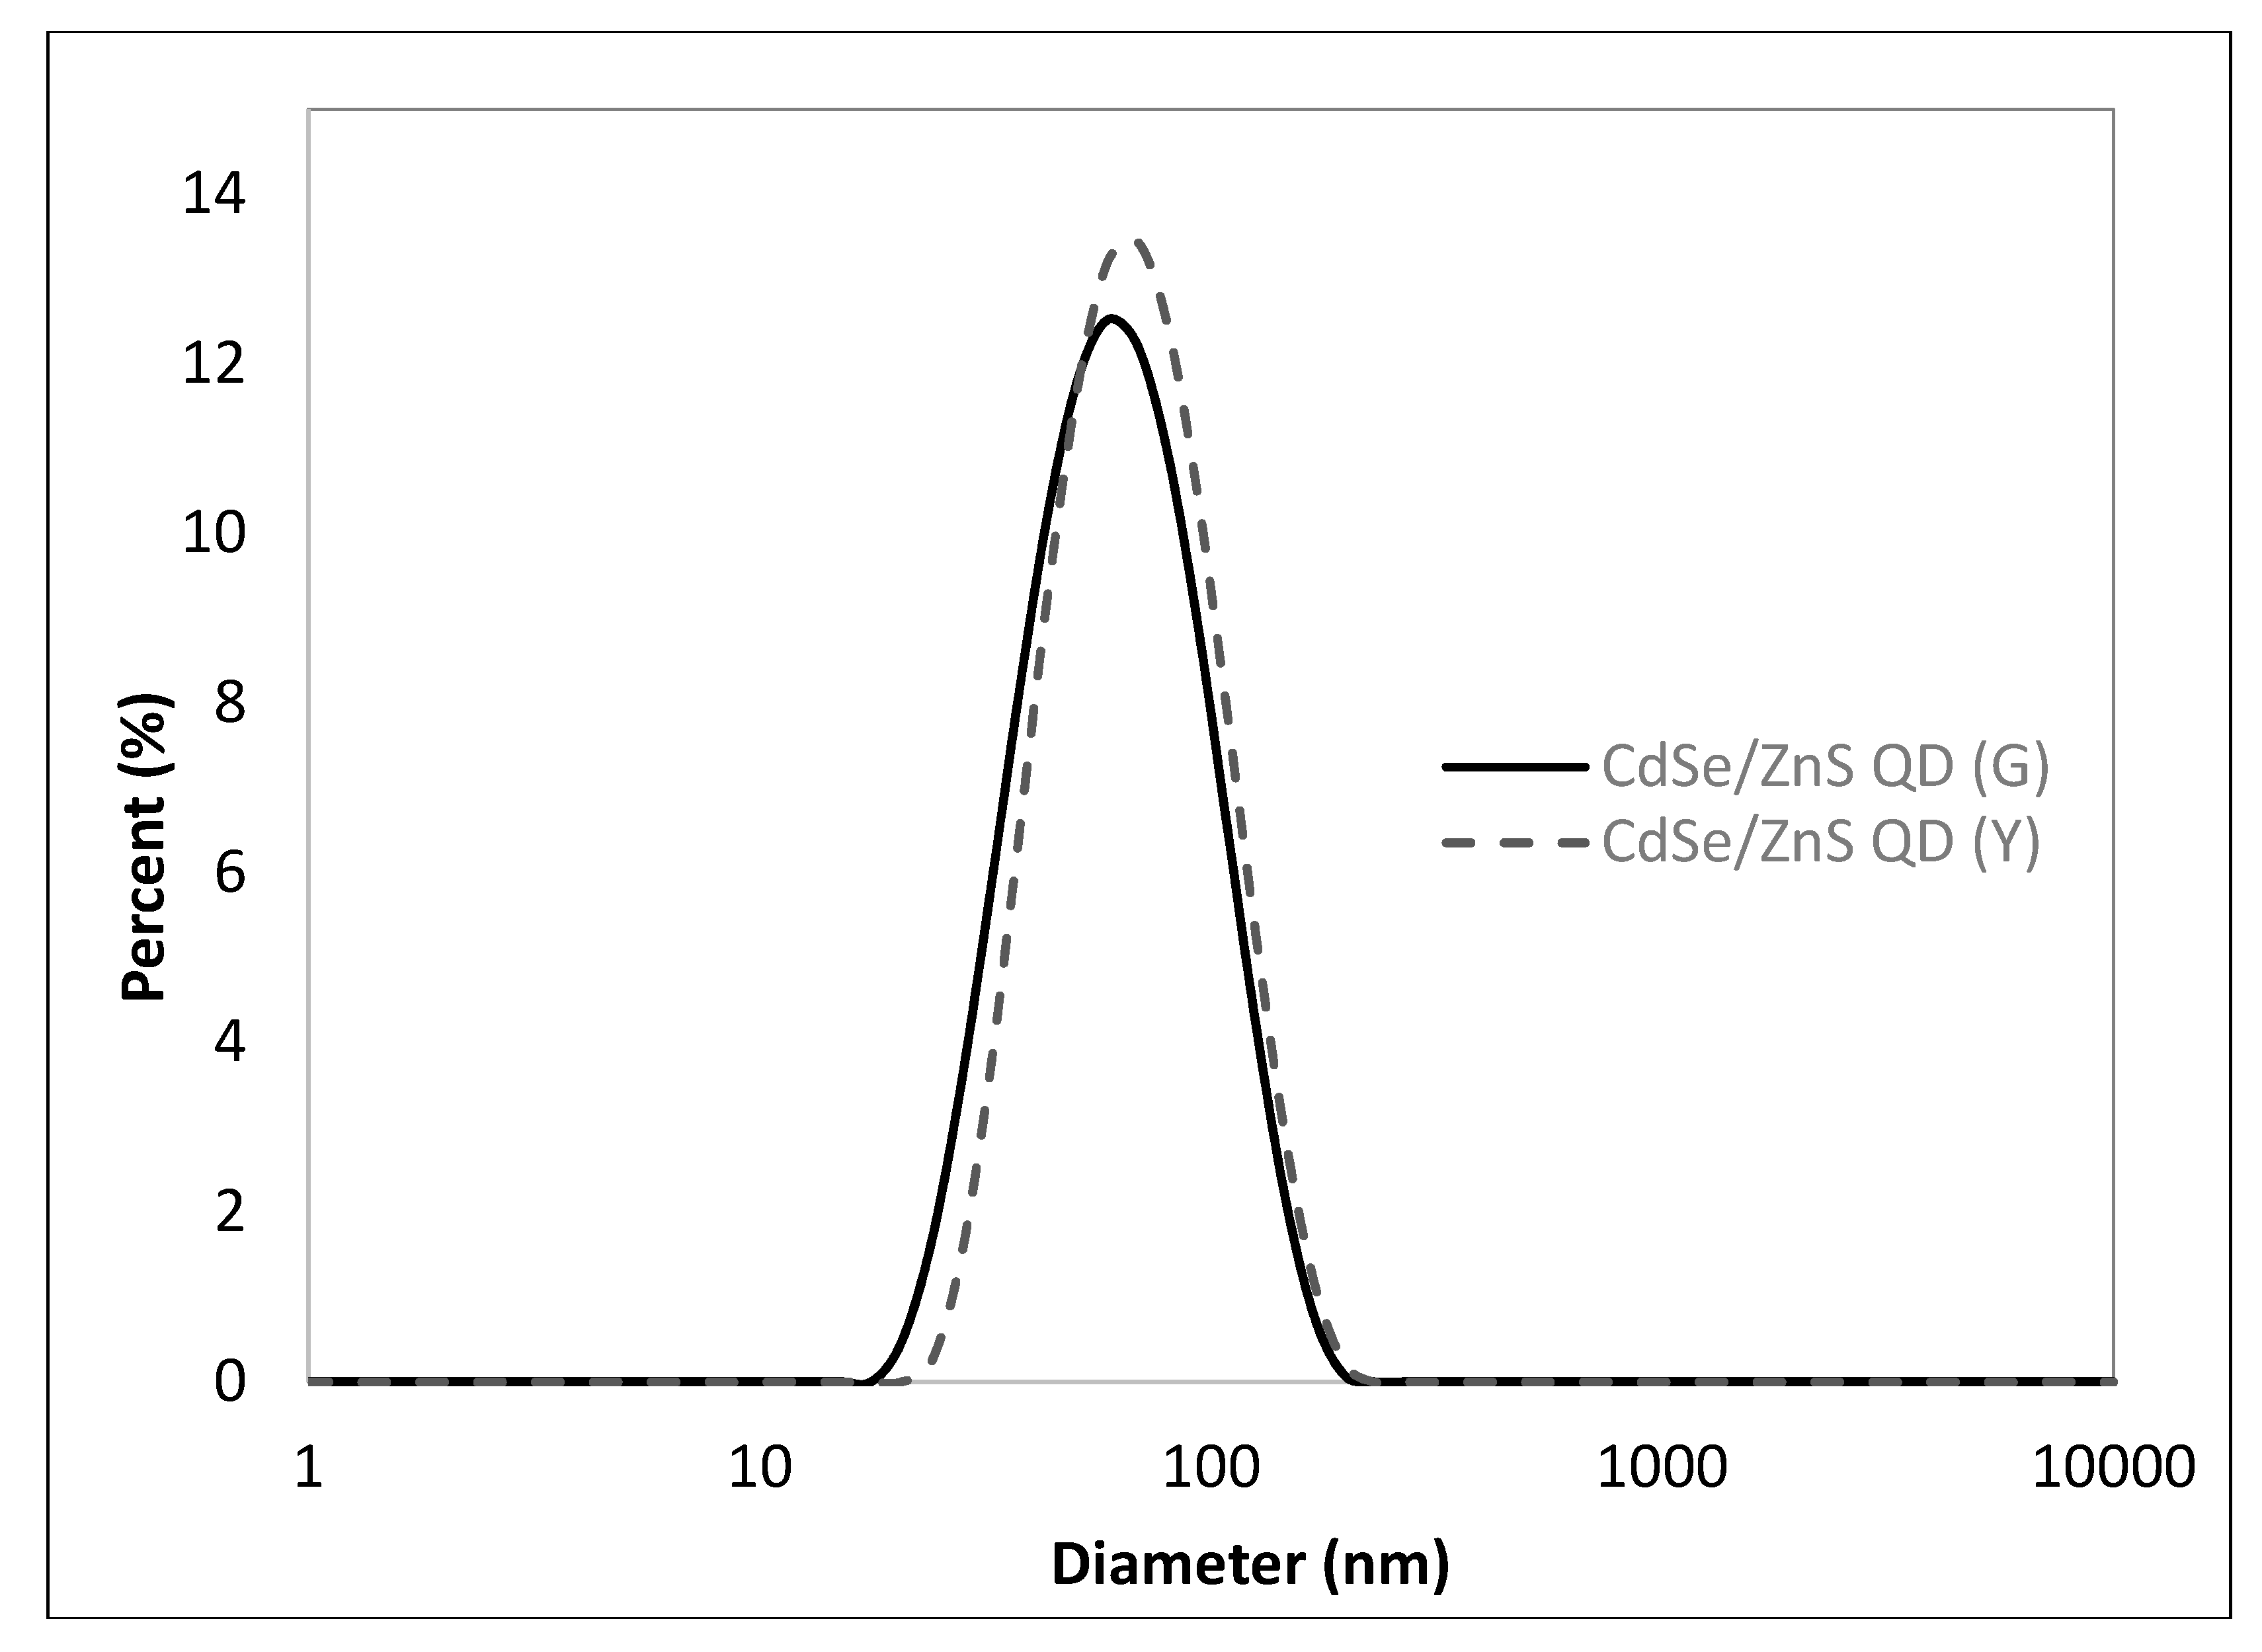
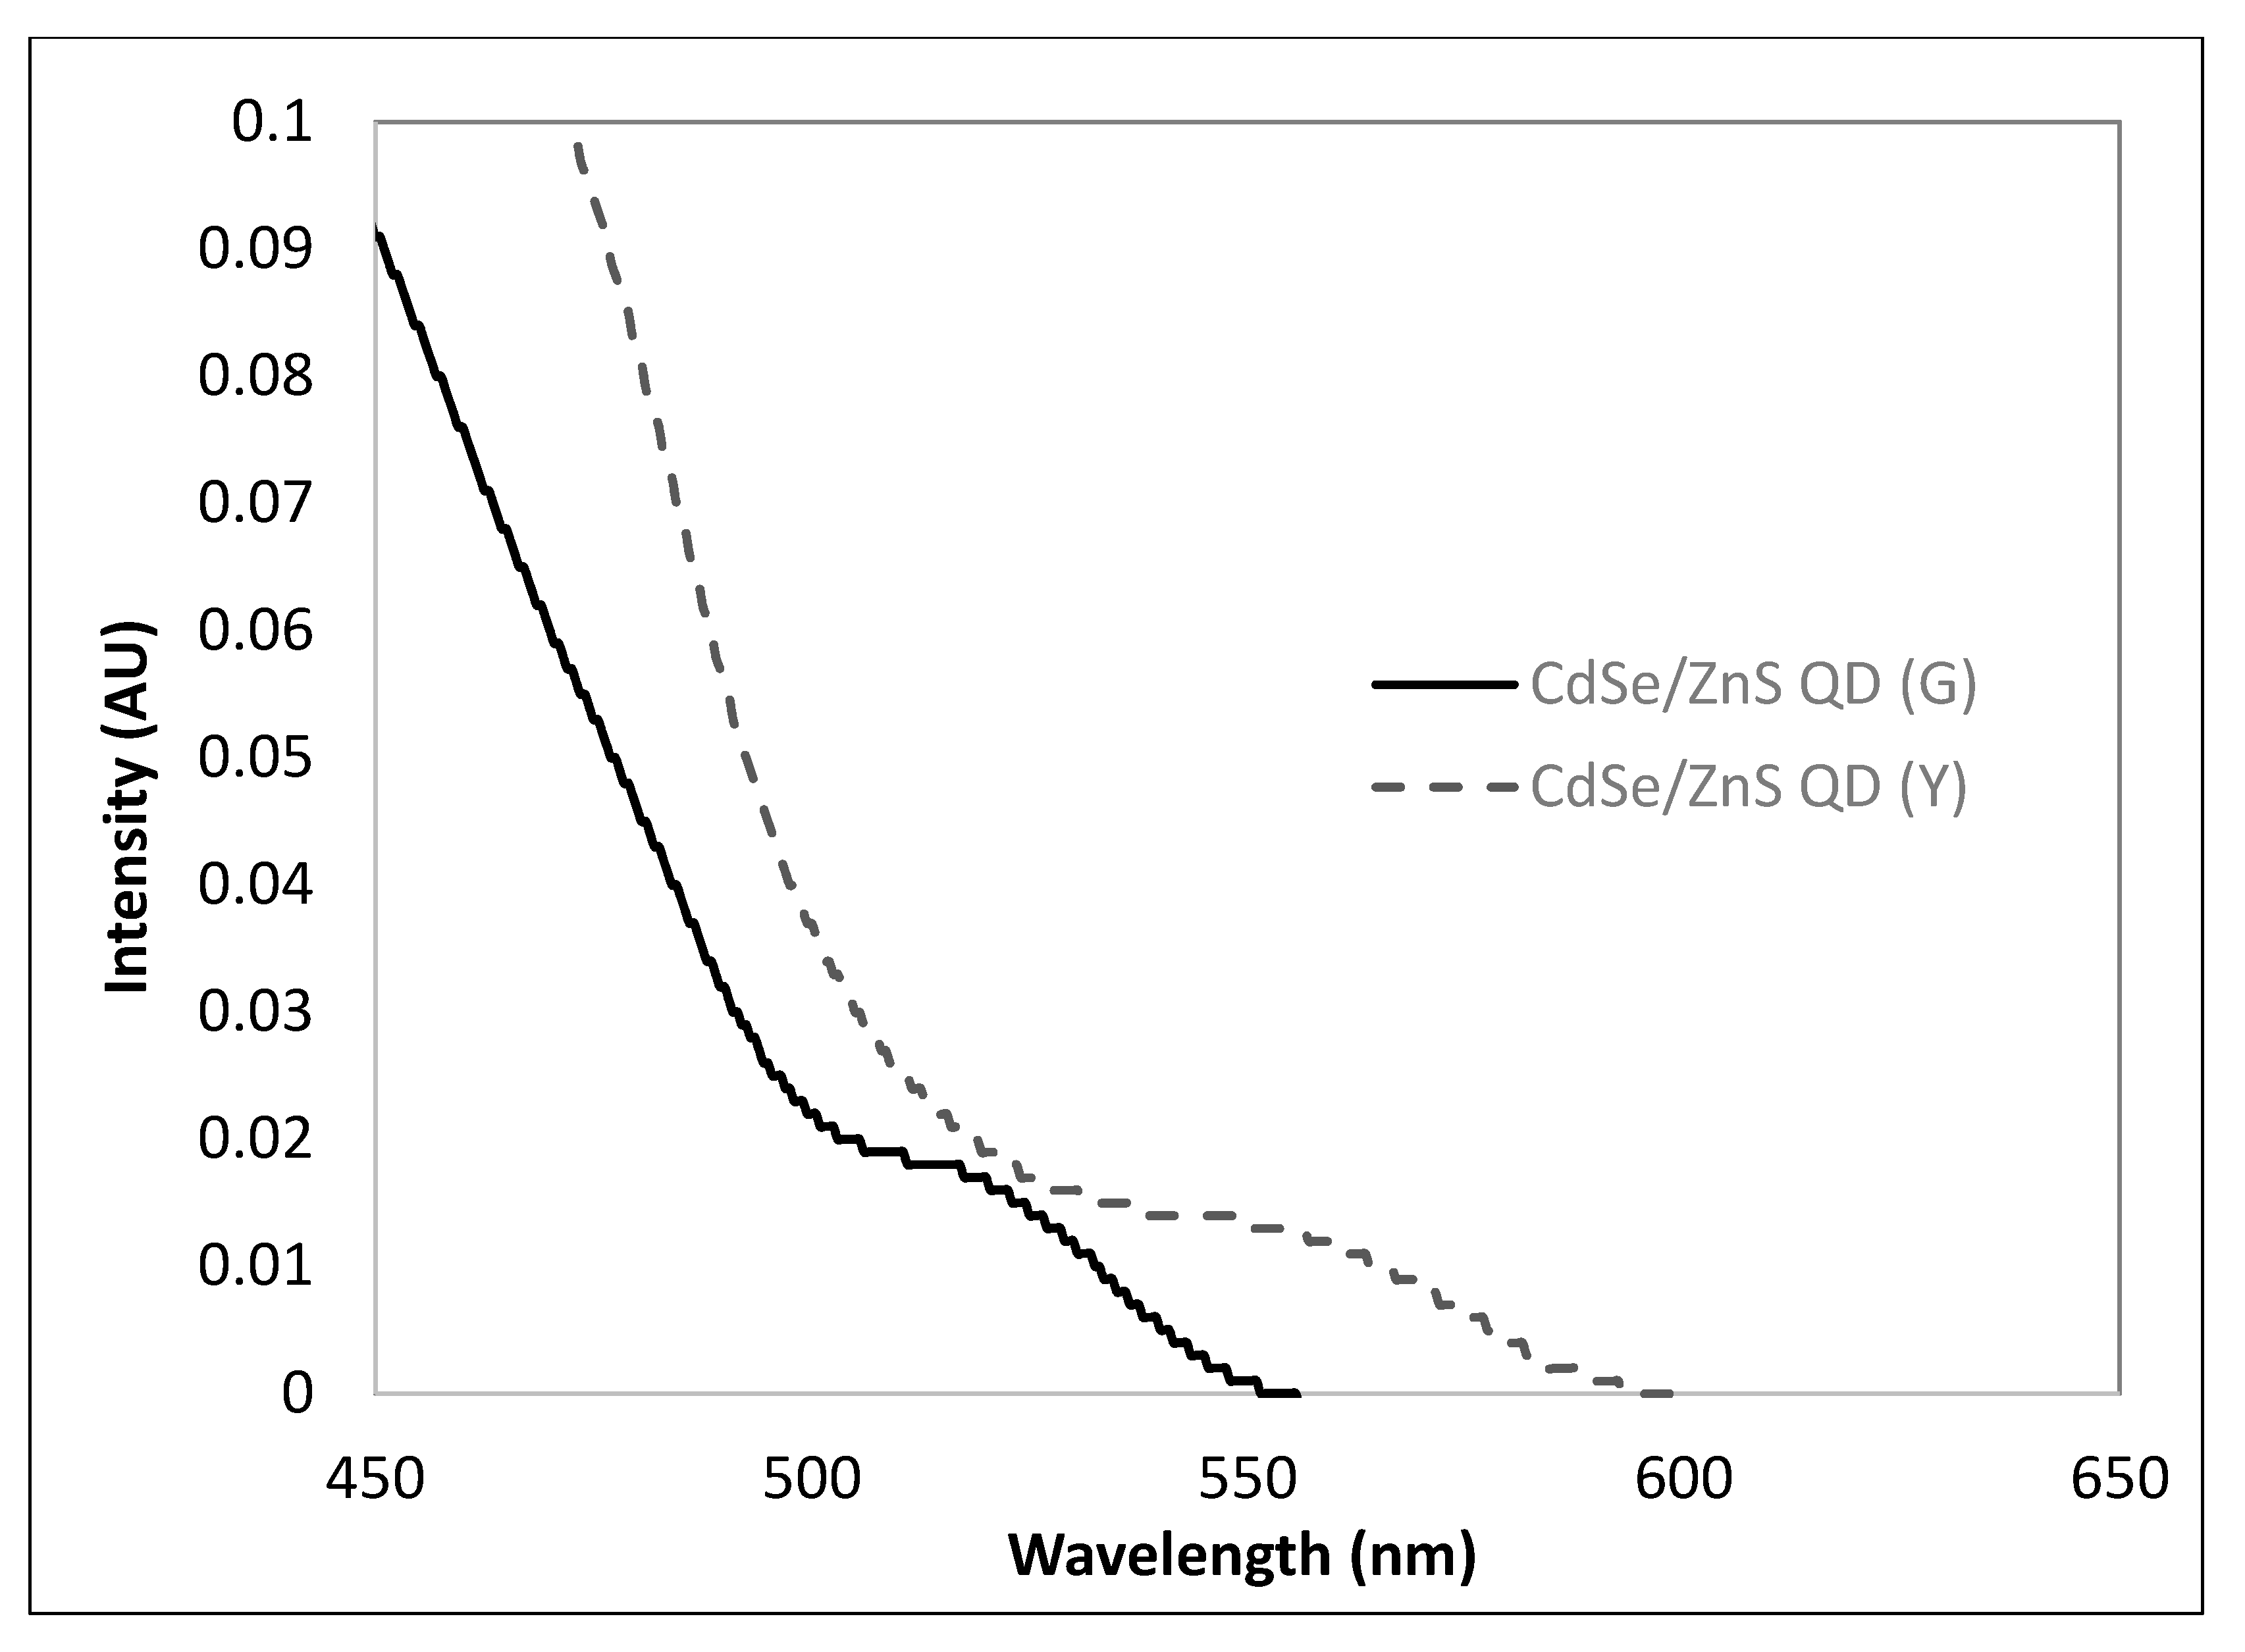
3.1. Chemophysical Properties of CdSe/ZnS QDs Used for This Study

A JEOL 7900F scanning electron microscope (SEM) with a scanning transmission electron microcopy (STEM) detector was used to image the individual QDs. The samples were diluted to a concentration of 100 µg/mL and were subsequently drop cast onto holy carbon film TEM grids and allowed to air dry in a desiccator box. Figure 1 shows the STEM images that approximate the CdSe/ZnS QD particle sizes in agreement with that of the data sheet values (6.1–9.5 nm) provided by the NNCrystal US Corporation (nn-labs.com).
Elemental composition of the CdSe/ZnS QDs was measured using a Bruker Quantax energy dispersive X-ray spectrometer (EDAX). A thick film of each of the CdSe/ZnS QDs (green and yellow) was deposited onto silicon substrates. The spectra of each QD sample is provided in Figure 2, which verifies the CdSe/ZnS composition.
A dynamic light scattering (DLS) technique was used to characterize the hydrodynamic size of the CdSe/ZnS QD dispersions in aqueous solution. QD samples at 100 µg/mL were tested using a Malvern Panalytical Zetasizer Ultra with a laser wavelength of 632 nm and scattering angle of 173°. DLS results showed a monodisperse peak with hydrodynamic diameters of 56.0 and 61.2 nm for the green and yellow QDs, respectively (Figure 3). The results indicate the formation of ligands shells (carboxylic acid ligands) outside of the core when the QDs were dispersed in aqueous solution.
Ultraviolet-visible (UV/Vis) absorption spectroscopy was conducted with a Shimadzu UV3600 UV-Vis-NIR Spectrometer with a range of 200–800 nm and a step size of 0.5 nm. Both CdSe/ZnS QD (green and yellow) samples were diluted to 100 µg/mL. Both the green and yellow CdSe/ZnS QDs showed no absorption at or above 600 nm. The first absorption peak for the CdSe/ZnS (G) and CdSe/ZnS (Y) were around 514 and 548 nm, respectively (Figure 4).

3.2. Cell Viability Assay

Cell viability assays were conducted on HeLa cells treated with either yellow or green CdSe/ZnS QDs, ranging from 0.8 to 167 µg/mL. A previous study demonstrated that smaller CdTe QDs (2.2 ± 0.1 nm) were more toxic than larger-size QDs (5.2 ± 0.1 nm) in rat pheochromocytoma cell cultures [25]. Our working hypothesis was that smaller green CdSe/ZnS QDs would be more toxic to HeLa cells than their larger counterparts (yellow CdSe/ZnS QDs). Our results showed that the green CdSe/ZnS QDs reduced cell viability significantly at the two highest concentrations (28 and 167 µg/mL): ~18% reduction of cell viability with 28 µg/mL and ~30% reduction with 167 µg/mL green QDs (Figure 5A). On the other hand, the yellow CdSe/ZnS only affected cell viability negatively at 176 µg/mL with ~30% viability reduction (Figure 5B). In addition, we tested whether green CdSe/ZnC QDs affected the viability of non-cancerous mouse-derived fibroblast. The treated QDs, ranging from 0.13 to 167 µg/mL, induced no viability defects (Figure 5C), suggesting that HeLa cells are more vulnerable to CdSe/ZnS QD-mediated viability defects than non-cancerous fibroblast cells.

3.3. ROS Assay

We reasoned that the reduced cell viability (Figure 5) might be caused by an increase in oxidative stress in HeLa cells treated with CdSe/ZnS QDs. In particular, smaller green QDs were the more effective cytotoxic agent (Figure 5A) and, therefore, we decided to use green QD-treated cells (80 µg/mL) for measuring superoxide and peroxynitrite levels with DHE and DHR123, respectively. Interestingly, our results revealed that the treated green CdSe/ZnS QDs for 24 h (Figure 6A,B) and for 72 h (Figure 6C,D) did not alter levels of superoxides nor peroxynitrites in HeLa cells. Therefore, we concluded that the viability reduction mediated by the treatment of these QDs is not due to alterations of superoxides and peroxynitrites, which is consistent with the findings that CdSe/ZnS has an insignificant effect on the production of ROSs [26].

3.4. Apoptosis Assay

Published studies have shown that green CdTe causes a significantly elevated apoptosis in two human breast cancer cell lines, MDA-MB468 and MCF-7 [27], and that 1.5 μM of 5 nm CdSe/ZnS QDs can induce early and late apoptosis in a pancreatic cancer cell line [28]. Therefore, we next tested the possibility that the reduced cell viability (Figure 5) might be attributed to an increase in apoptosis with the treatment of green CdSe/ZnS QDs in HeLa cells. For this, Annexin-V-APC and propidium iodide stained cells were used to measure the extent of early and late apoptosis, respectively. Though early apoptosis levels in QD-treated HeLa cells were statistically significantly decreased (Figure 7A), we observed that the mean of late apoptosis in the treated group was pronouncedly elevated (Figure 7B) when compared to the non-treated group. These results clearly indicate that the cell cytotoxicity we observed in Figure 5 was mainly attributed to elevated late apoptosis in HeLa cells treated with CdSe/ZnS QDs.

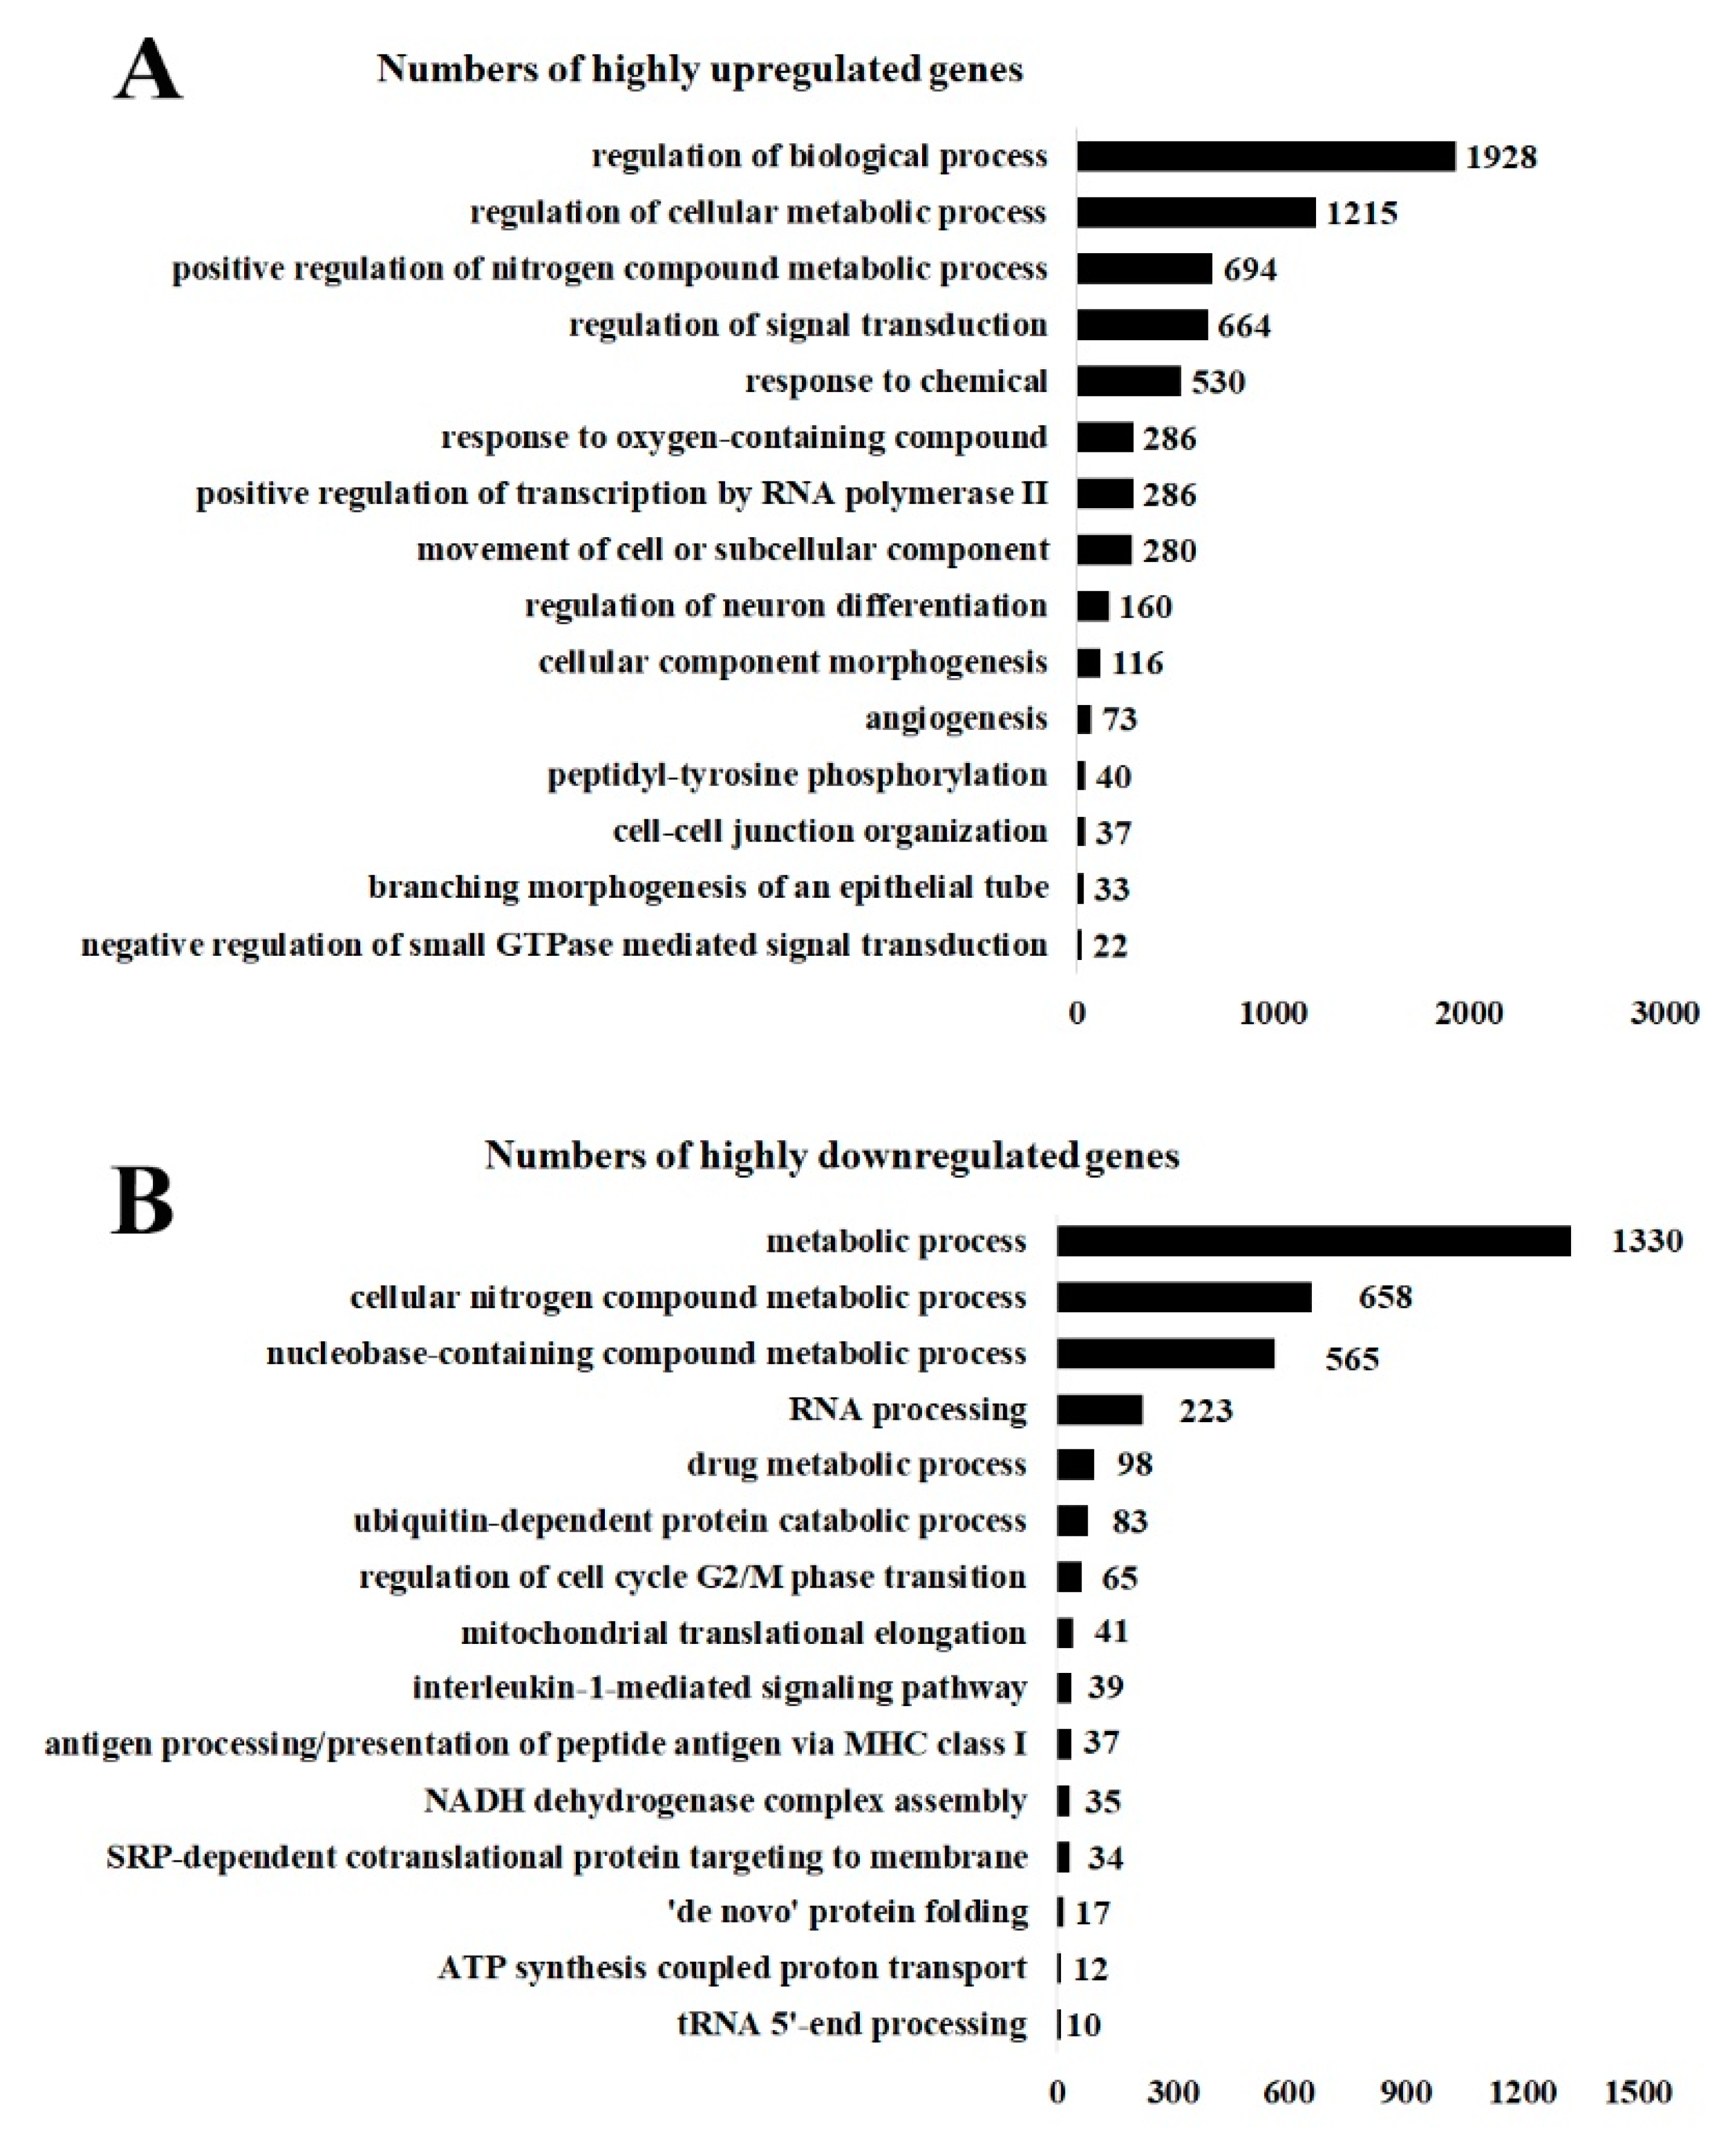
3.5. Upregulated and Downregulated Genes Analyzed by GoRilla: GoTerm

To understand the mechanism of CdSe/ZnS-mediated cell toxicity in more detail, we conducted a transcriptomic analysis to identify upregulated and downregulated genes with the QD treatment. Of 25,681 human genes, 3022 genes were determined to be significantly upregulated based on their positive q-value < 0.05, whereas 2734 genes were significantly downregulated. These differentially expressed genes (DEGs) were further analyzed using the GoRilla website (http://cbl-gorilla.cs.technion.ac.il/) to find Gene Ontology and functions related to each gene. Our results showed 313 gene functions associated with the upregulated genes. In particular, 63% of upregulated genes were responsible for regulation of biological processes, while 40% of the upregulated genes were responsible for regulation of metabolic processes (Figure 8A). Positive regulation of nitrogen compound metabolic processes (22%), regulation of signal transduction (21%), and response to chemicals (17.5%) were also upregulated. Furthermore, 9.4% of genes responsible for response to oxygen containing compounds, 9.4% of genes responsible for positive regulation of transcription by RNA polymerase II, 9.2% of genes responsible for movement of cell or subcellular components, 3% of genes responsible for regulation of cellular component morphogenesis, and 2% of genes responsible for angiogenesis were upregulated. Finally, 40, 37, and 33 upregulated genes were responsible for peptidyl-tyrosine phosphorylation, cell–cell junction organization, and branching morphogenesis of an epithelial tube, respectively (Figure 8A).
Our GoRilla GO term analysis picked up 136 downregulated functions. The similar functions were grouped together to show significantly downregulated functions upon the treatment (Figure 8B). It was found that 21.4% of downregulated genes were responsible for heterocycle metabolic processes, 17.0% were responsible for biosynthetic processes, and 10.9% were responsible for protein-containing complex assembly. Genes implicated in RNA processing (8.2% of all downregulated genes), cellular protein-containing complex assembly (7.9%), peptide metabolic processes (3.5%), leukocyte degranulation (3.4%), electron transport chains (2.4%), mitochondrial respiratory chain complex assembly (1.8%), and tumor necrosis factor-mediated signaling pathway (1.4%) were downregulated. Lastly, 35, 33, 21, 12, and 11 downregulated genes were responsible for regulation of cellular amino acid metabolic processes, NIK/NF-κB signaling, transcription elongation from RNA polymerase II promoter, ribosomal large subunit biogenesis, and DNA replication initiation, respectively (Figure 8B).
To further analyze the gene expression change caused by Cd QD treatment, we selected the most upregulated genes whose log2fold change was at least 1.5-fold. Most of the highly upregulated genes were involved in signaling, response to tumor necrosis factor, cellular response to tumor necrosis factor, and regulation of NIK/NF-κB signaling (Table 1). RORα gene implicated in cellular response to tumor necrosis factor was 1.92-fold upregulated (Table 1). RORα is known for enhancing the transcription of SEM3F that induces apoptosis and inhibits cell proliferation. Most processes that were highly downregulated upon the treatment were extracellular matrix organization, extracellular structure organization, tissue migration, mesenchyme migration, and regulation of blood pressure (Table 2). NOX1 (1.8-fold downregulated), a gene implicated in the generation of ROSs seems to be involved in most of these processes [29] (Table 2).

4. Discussion

According to the American cancer society, there will be at least 13,800 new cases of cervical cancer, and approximately 4290 women will die from it in 2020 [30]. There is a strong urge to find new alternative treatments to suit all patients. QDs have recently been used in cancer diagnosis and therapies due to their optical and chemical properties. However, there are few studies on the use of QDs as an anticancer drug. In our study, we are trying to understand the cytotoxic effects of CdSe/ZnS QDs on HeLa cancer cells. To our knowledge, we are the first to investigate the transcriptome profile of HeLa cells upon the treatment of CdSe/ZnS QDs. Therefore, our data provides the cornerstone of using CdSe/ZnS QDs as an alternative anticancer drug for cervical cancer.

4.1. Green CdSe/ZnS QDs Are More Effective in Reducing Viability of HeLa Cancer Cells than Yellow CdSe/ZnS QDs

Though quantum dots (QDs) are appealing alternatives for cancer research and treatments, their potential threat to the human cells has not been thoroughly documented. Furthermore, QDs can be coated with a spectrum of charged ligands, which makes it hard to draw a comprehensive conclusion when it comes to assessing the effects of QDs on cellular/tissue systems. Nevertheless, coating QDs with carboxylic acids appears to demonstrate minor toxicity in monocyte-derived dendritic cells (DCs) [31]. In this report the authors revealed that CdSe/ZnS QDs coated with polyethylene glycol (PEG)-COOH are not only safer but also more readily internalized into DCs when compared with QDs coated with PEG alone or with PEG-NH2 [31]. However, there is a contradictory report on the permeability of QDs-coated with COOH, which reports that QDs coated with PEG-COOH did not penetrate the epidermal layer of the skin [15]. Together, these opposing results indicate that cellular uptake rates of QDs coated with the same ligand depend on the cell type. On the cellular level, CdSe/ZnS QDs are reported to enter the cell through the plasma membrane and inhibit macrophage function [32,33]. The degradation of CdSe/ZnS and Cd/Zn happens inside the cell by releasing the harmful Cd2+ ions, which damages proteins and disrupts cellular signaling [34,35,36]. Therefore, it has been reported that functionalized or chemically modified CdSe/ZnS QDs exert less toxic impact on cells. For example, Bradburne and coworkers illustrated that polyethylene glycol (PEG)-conjugated QDs had minimal cytotoxicity in THP-1 cells [37]. In addition, QD-mediated cell toxicity, if any, strongly depends on its size. Most of investigations concluded that smaller QDs induce cellular toxicity more readily than larger QDs. A study conducted by Nagy et al. showed that 3–5 nm CdSe/ZnS tested on normal human bronchial epithelial (NHPE) caused more proliferation inhibition than 10 nm CdSe/ZnS. Another study was conducted on Escherichia coli to compare among green CdTe QDs (543 nm emission peak), yellow CdTe QDs (579 nm), and red CdTe QDs (647 nm) [38,39]. The study revealed that green CdTe QDs were the most toxic, followed by yellow CdTe QDs and Red CdTe QDs. The authors proposed that the green QD-mediated cell defects were most likely attributed to damaged E. coli cell membrane and subsequent nonspecific entry of ions and molecules to the cell. Without controversy, the present study also proved that smaller green CdSe/ZnS QDs are more toxic than their larger counterparts (yellow CdSe/ZnS QDs) based off of the cell viability assay shown in Figure 5.

4.2. Effects of Green CdSe/ZnS QDs on the Production of ROS

Nagy and coworkers have also claimed that ROS production is independent from the toxicity induced by CdSe/ZnS QDs, based on their experiments on NHPE cells testing different sizes of QDs (3–10 nm) and different ligands associated with the QDs [38]. Another study conducted by Horstmann et al. in yeast using yellow CdSe/ZnS QDs showed no significant increase in ROSs [26], and they interpreted that the functionalized QDs with a carboxyl group may stabilize the core CdSe and minimize Cd2+ ion leakage. Moreover, a study showed that ROS production depended on the cell type [40]. The authors from the study compared three different types of cells such as epithelial (BEAS-2B), fibroblast (HFF-1), and lymphoblastoid (TK6). Upon treatment, the three types of cells with CdSe/ZnS (4–10 nm) attached with carboxyl ligand, HFF-1 and BEAS-2B showed no signs of ROS production, while TK6 showed a significant elevation in ROS production [40]. The ROS measurement in the present study with green CdSe/ZnS QDs in HeLa cells reports no alteration of superoxide and peroxynitrite levels, in line with the above-mentioned data from different investigations (Figure 6). However, it is noteworthy to point out that our transcriptome analysis identified a few under-expressed genes responsible for ROS production, including SOD1 and COX17 [41,42]. Therefore, we cannot rule out the possibility that other ROSs might be altered in the presence of this Cd QD in our experiments.

4.3. Green CdSe/ZnS and Its Impact on Apoptosis

Most chemotherapeutic drugs exert their therapeutic efficacy thorough some key mechanisms associated with apoptosis. A study comparing the effects of different Cd compounds (2.2 nm CdSe, 2.2 nm CdTe, and 3.5 nm CdTe) on L929 fibroblasts showed that 2.2 nm CdSe and 2.2 nm CdTe led to highly apoptotic L929 cells [43]. The described apoptosis in L929 cells was due to fragmentation of nuclei and cytoplasmic organelles, but not by plasma membrane damage [43]. Another study by the same researchers testing 2.2 nm CdTe on AML12 cells has shown that there were two main mechanisms responsible for apoptosis induction, which were extrinsic pathways through death receptors and intrinsic pathways via dysregulation of mitochondria [44]. A common feature of apoptosis, regardless of whether it is through an extrinsic or intrinsic pathway, is a cascade of caspase activation for promoting apoptosis. Indeed, a study of C-phycocyanin (C-PC), a potential pro-apoptotic/anticancer drug in HeLa cells, induced activation of caspase 2, 3, 4, 6, 8, 9, and 10 [45].
Likewise, we found from our transcriptome analysis that a few genes (TNFRS9 and RBAK) whose roles are coupled with inducing caspase activities, were overexpressed in HeLa cells with CdSe/ZnS QDs [46,47]. As observed in Figure 7, where late apoptosis levels were induced significantly upon the treatment of green CdSe/ZnS QDs, the upregulation of the proapoptotic genes such as TNFRS9 and RBAK would explain that induction of apoptosis.

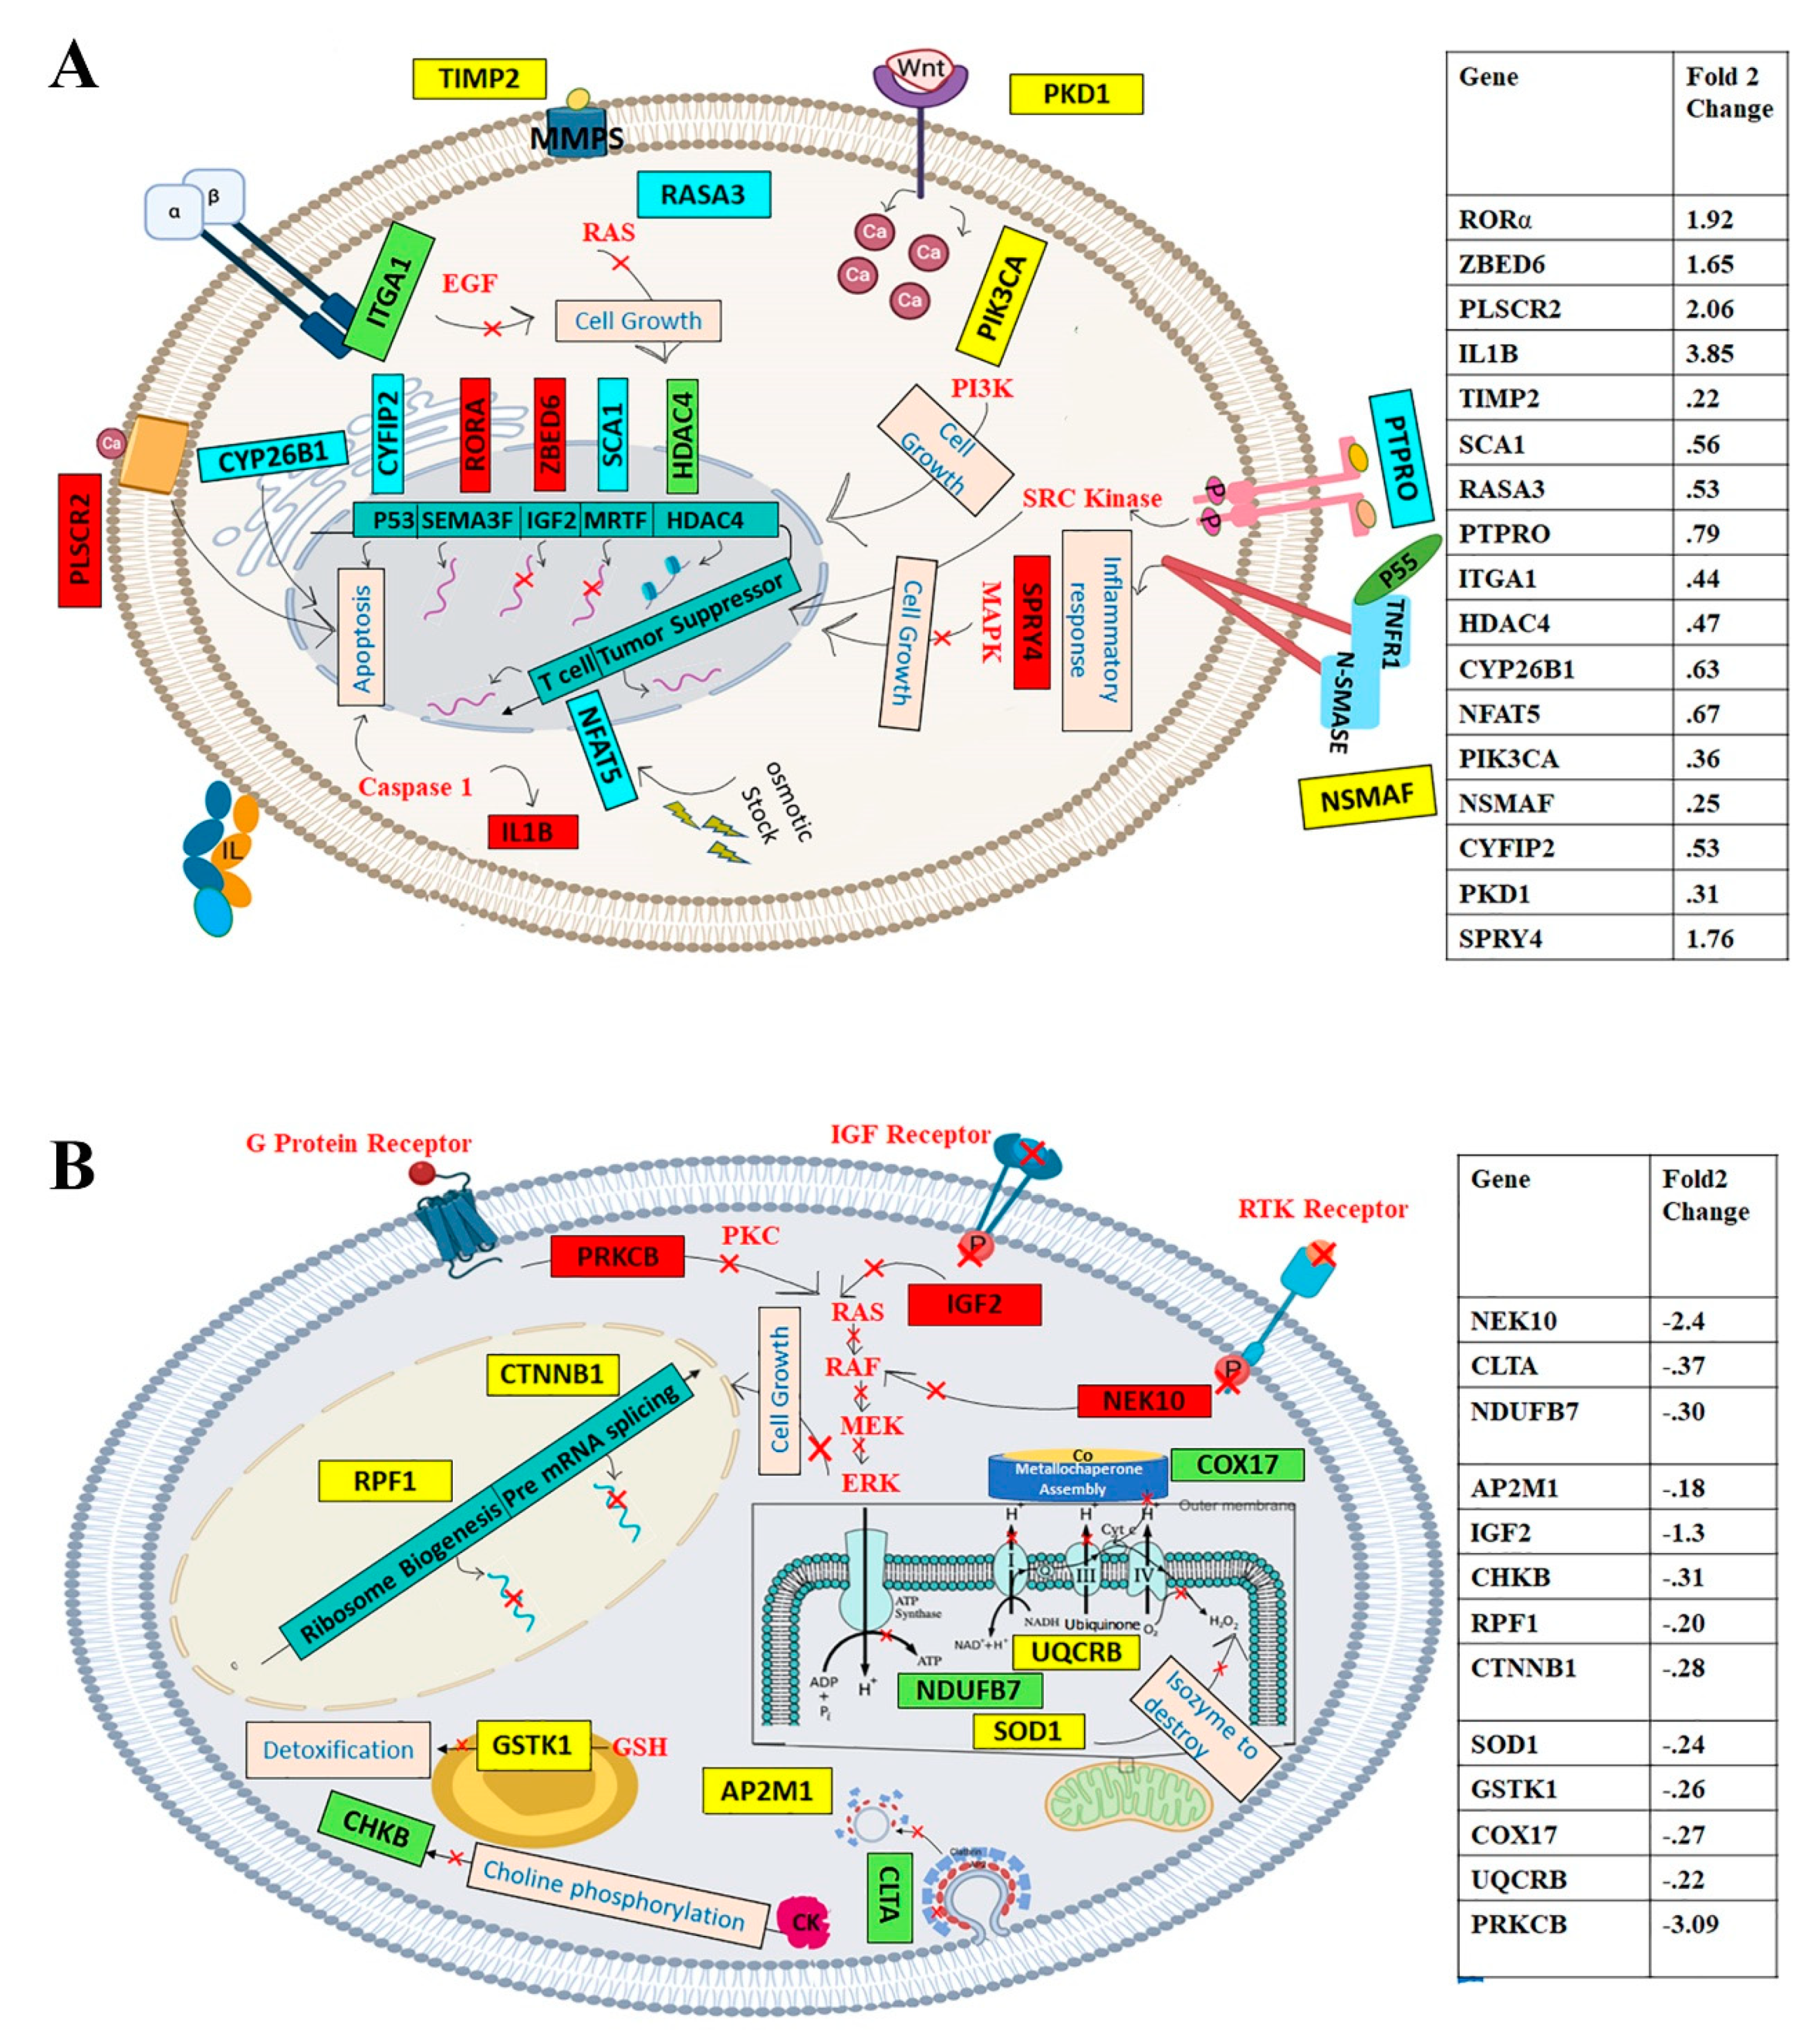
4.4. Upregulated Gene Expression and the Subsequent Impacts upon Green CdSe/ZnS QD Treatment

We have provided the potential cellular processes that are differentially regulated in response to CdSe/ZnS QDs (Figure 9A,B). A wide spectrum of gene functions upregulated after CdSe/ZnS QD treatment in HeLa cells include nuclear receptors (RORα), inhibitors of extracellular metalloproteinases (TIMP2), integrins (TRGA1), membrane receptors (PKD1), GTPase activating factors (RASA3), and inflammation (NSMAF) (Figure 9A). Almost all overexpressed mRNA transcripts shown in Figure 9A can be grouped into three categories based on their function: antiapoptotic, antiproliferative, and antitumorigenic. Antiproliferative or tumor suppressive genes from the upregulated gene model (Figure 5A) include RASA3 [48], ITGA1 [49], ZBED6 [50], PTPRO [51], PDK1 [52], RORα [53], and SPRY4 [54]. Of these, ZBED6 is a transcription repressor of IGF2, leading to suppressed proliferation [50]. In addition, RASA3, a negative regulator of RAS GTPase p21, is known to interact with a Gαi subunit to suppress the RAS-ERK1/2 pathway and inhibit proliferation [48]. As such, all of these upregulated antiproliferative genes may collectively create adverse conditions in the presence of CdSe/ZnS QD, leading to suppression of HeLa cell proliferation, as seen in our proliferation assay (Figure 5).
Cancer cells can often avoid or disable an apoptotic event. However, this does not seem to be the cases with CdSe/ZnS QDs in HeLa cells (Figure 7). Our RNAseq analysis (Figure 9A) helped us detect a number of proapoptotic genes overexpressed under this condition, including CYF1P2, NSMAF, PTPRO, and RORα [53,55,56,57]. Interestingly, CYFIP2 gene codes for the cytoplasmic fragile X mental retardation (FMR) 1 interacting protein 2, whose activity is associated with p53-mediated apoptosis [58]. It was found that the CYFIP2 promotor contains a p53-responsive element allowing p53 binding, which leads to the induction of CYFIP2. When overexpressed in DLD1 cells under TET control, CYFIP2 caused nuclear DNA fragmentation, indicative of apoptosis [58].
Lastly, at least two overexpressed genes, RORα (retinoid-related orphan receptor alpha) and TIMP2 (tissue inhibitor of metalloproteinases 2), from the Figure 9A are known to be implicated in suppressing cancer cell invasion or metastasis. One of the recent investigations on RORα-mediated tumor suppression revealed that overexpression of RORα downregulated MMP-9 and upregulated an MMP inhibitor (TIMP3) to inhibit cell migration and invasion [59]. Similarly, TIMP2 is also an anti-metastatic factor [60]. Given elevated levels of expression by these genes, we came to the conclusion that HeLa cell’s invasion ability may be compromised in the presence of CdSe/ZnS QDs.

4.5. Downregulated Cellular Functions Mediated by CdSe/ZnS QDs

We illustrated in Figure 9B the various downregulated processes due to CdSe/ZnS QD treatment in HeLa cells, including pro-proliferation, mitochondrial respiratory chain, detoxification, and receptor-mediated endocytosis. First, under expression of the following five pro-proliferation genes may, in part, account for the observed viability defects in HeLa cell with CdSe/ZnS QDs (Figure 5): RPF1 [61], PRKCB [62], IGF2 [63], NEK10 [64], and CTNNB1 [65]. In particular, the IGF2 (insulin growth factor 2)-mediated signal pathway is a well-established pathway for cell proliferation in a greater diversity of cell types. To promote proliferation, the pathway uses either PI3K/AKT or RAS/RAF/MEK/ERK cascade, and further, the PI3K/AKT is also implicated in inhibiting apoptosis [53]. Taken together, our discovery of the under expression of pro-proliferative genes (IGF2, RFP1, PRKCB, NEK10, and CTNNB1) is congruent with that of overexpression of anti-proliferative genes discussed in the above section, suggesting a clear antiproliferative role of CdSe/ZnS QDs in HeLa cells.
Second, our RNAseq analysis (Figure 9B) revealed significantly downregulated genes implicated in mitochondria-based electron transfer chain (ETC) function including UQCRB (ETC complex III subunit), NDUFB7 (ETC complex 1 subunit), and COX17 (associated with cytochrome C oxidase) [66,67,68]. We speculate that the impact of downregulation of these key ETC proteins would be associated with defects both in establishing the proton gradient across the mitochondrial inner membrane and in efficient production of ATP, which may account both for growth inhibition (Figure 5) and apoptosis (Figure 7) in the presence of CdSe/ZnS QDs. Third, based on under expression of genes for cellular detoxification (GSTK1) [69] and endocytosis (CLTA and AP2M1), we propose that CdSe/ZnS QDs play unfavorable roles in the detoxification of foreign substances and receptor-mediated endocytosis.

5. Conclusions

QDs are gaining fame recently in the cancer treatment world due to their unique properties and availability. CdSe/ZnS is one of the QD alternatives and has been used as a biosensor and nanodrug carrier. Few studies had tested different sizes of CdSe/ZnS on HeLa cancer cells. Through our study, we have compared two sizes of CdSe/ZnS QDs and their effect on HeLa cells. We have found that CdSe/ZnS QDs inhibit proliferation and induce apoptosis. Therefore, we conclude that CdSe/ZnS QDs can be used as a potential anticancer drug.

Author Contributions

conceptualization, B.H., J.S., and K.K.; methodology, B.H., J.S., H.R., R.P., and Q.W.; software, B.H.; validation, B.H. and K.K.; formal analysis, B.H., J.S., H.R., R.P., and Q.W.; investigation, B.H., H.R., R.P., Q.W., and J.S.; resources, K.K.; data curation, B.H. and J.S.; writing—original draft preparation, B.H.; writing—review and editing, B.H., R.P., Q.W., and K.K.; visualization, B.H.; supervision, K.K.; project administration, K.K.; funding acquisition, K.K. All authors have read and agreed to the published version of the manuscript.

Funding

This work was funded by the U.S. Army Engineer Research and Development Center—Environmental Laboratory through the Environmental Quality and Technology Program; Contract No. W912HZ19C0048.

Acknowledgments

We are also indebted to Laszlo Kovacs for generously providing the TruSeq Stranded mRNA LT Sample Preparation Kit (Illumina). We thank for Rishi Patel organizing regular face-to-face meetings and providing relevant input and feedback on this project.

Conflicts of Interest

The authors declare no conflict of interest.

References

  1. Gutiérrez-Hoya, A.; Zerecero-Carreón, O.; Valle-Mendiola, A.; Moreno-Lafont, M.; López-Santiago, R.; Weiss-Steider, B.; Soto-Cruz, I. Cervical Cancer Cells Express Markers Associated with Immunosurveillance. J. Immunol. Res. 2019, 2019, 1–10. [Google Scholar] [CrossRef] [Green Version]
  2. Cohen, P.A.; Jhingran, A.; Oaknin, A.; Denny, L. Cervical cancer. Lancet 2019, 393, 169–182. [Google Scholar] [CrossRef]
  3. Dillner, J.; Rebolj, M.; Birembaut, P.; Petry, K.-U.; Szarewski, A.; Munk, C.; de Sanjose, S.; Naucler, P.; Lloveras, B.; Kjaer, S.; et al. Long term predictive values of cytology and human papillomavirus testing in cervical cancer screening: Joint European cohort study. BMJ 2008, 337, a1754. [Google Scholar] [CrossRef] [PubMed] [Green Version]
  4. Lucey, B.P.; Nelson-Rees, W.A.; Hutchins, G.M. Henrietta Lacks, HeLa Cells, and Cell Culture Contamination. Arch. Pathol. Lab. Med. 2009, 133, 1463–1467. [Google Scholar]
  5. Puck, T.T.; Marcus, P.I. A rapid method for viable cell titration and clone production with HeLa cells in tissue culture: The use of X-irradiated cells to supply conditioning factors. Proc. Natl. Acad. Sci. USA 1955, 41, 432–437. [Google Scholar] [CrossRef] [PubMed] [Green Version]
  6. Hsiang, Y.; Hertzberg, R.; Hecht, S.; Liu, L. Camptothecin induces protein-linked DNA breaks via mammalian DNA topoisomerase I. J. Biol. Chem. 1985, 260, 14873–14878. [Google Scholar]
  7. Blackburn, E.H. Telomere states and cell fates. Nature 2000, 408, 53–56. [Google Scholar] [CrossRef] [PubMed]
  8. Koyuncu, I.; Gonel, A.; Durgun, M.; Kocyigit, A.; Yuksekdag, O.; Supuran, C.T. Assessment of the antiproliferative and apoptotic roles of sulfonamide carbonic anhydrase IX inhibitors in HeLa cancer cell line. J. Enzyme Inhib. Med. Chem. 2019, 34, 75–86. [Google Scholar] [CrossRef] [PubMed] [Green Version]
  9. Hakkarainen, T.; Schramm, A.; Viheriälä, J.; Guina, M. Site-Controlled Epitaxy of InAs Quantum Dots on Nanoimprint Lithography Patterns. In Molecular Beam Epitaxy; Elsevier: Amsterdam, The Netherlands, 2018; pp. 277–292. [Google Scholar]
  10. Ekimov, A.I.; Efros, A.L.; Onushchenko, A.A. Quantum size effect in semiconductor microcrystals. Solid State Commun. 1985, 56, 921–924. [Google Scholar] [CrossRef]
  11. Lin, L.Y.; Al-Jamal, W.T.; Kostarelos, K. Quantum-Dot Toxicity. In Encyclopedia of Nanotechnology; Bhushan, B., Ed.; Springer: Dordrecht, The Netherlands, 2012; pp. 2197–2200. [Google Scholar]
  12. Mahajan, S.; Rani, M.; Dubey, R.; Mahajan, J. Characteristics and properties of CdSe quantum dots. Int. J. Latest Res. Sci. Technol. 2013, 2, 518–521. [Google Scholar]
  13. Su, Y.; He, Y.; Lu, H.; Sai, L.; Li, Q.; Li, W.; Wang, L.; Shen, P.; Huang, Q.; Fan, C. The cytotoxicity of cadmium based, aqueous phase—Synthesized, quantum dots and its modulation by surface coating. Biomaterials 2009, 30, 19–25. [Google Scholar] [CrossRef] [PubMed]
  14. Zhang, Y.; Chen, W.; Zhang, J.; Liu, J.; Chen, G.; Pope, C. In vitro and in vivo toxicity of CdTe nanoparticles. J. Nanosci. Nanotechnol. 2007, 7, 497–503. [Google Scholar] [CrossRef] [PubMed]
  15. Ryman-Rasmussen, J.P.; Riviere, J.E.; Monteiro-Riviere, N.A. Penetration of Intact Skin by Quantum Dots with Diverse Physicochemical Properties. Toxicol. Sci. 2006, 91, 159–165. [Google Scholar] [CrossRef] [PubMed] [Green Version]
  16. Guo, G.; Liu, W.; Liang, J.; He, Z.; Xu, H.; Yang, X. Probing the cytotoxicity of CdSe quantum dots with surface modification. Mater. Lett. 2007, 61, 1641–1644. [Google Scholar] [CrossRef]
  17. Wang, L.; Nagesha, D.K.; Selvarasah, S.; Dokmeci, M.R.; Carrier, R.L. Toxicity of CdSe Nanoparticles in Caco-2 Cell Cultures. J. Nanobiotechnol. 2008, 6, 11. [Google Scholar] [CrossRef] [Green Version]
  18. Tang, M.; Xing, T.; Zeng, J.; Wang, H.; Li, C.; Yin, S.; Yan, D.; Deng, H.; Liu, J.; Wang, M.; et al. Unmodified CdSe Quantum Dots Induce Elevation of Cytoplasmic Calcium Levels and Impairment of Functional Properties of Sodium Channels in Rat Primary Cultured Hippocampal Neurons. Environ. Health Perspect. 2008, 116, 915–922. [Google Scholar] [CrossRef]
  19. Mansuriya, B.D.; Altintas, Z. Applications of Graphene Quantum Dots in Biomedical Sensors. Sensors 2020, 20, 1072. [Google Scholar] [CrossRef] [Green Version]
  20. Fang, M.; Peng, C.; Pang, D.-W.; Li, Y. Quantum Dots for Cancer Research: Current Status, Remaining Issues, and Future Perspectives. Cancer Biol. Med. 2012, 9, 151–163. [Google Scholar]
  21. Liu, H.; Tang, W.; Li, C.; Lv, P.; Wang, Z.; Liu, Y.; Zhang, C.; Bao, Y.; Chen, H.; Meng, X.; et al. CdSe/ZnS Quantum Dots-Labeled Mesenchymal Stem Cells for Targeted Fluorescence Imaging of Pancreas Tissues and Therapy of Type 1 Diabetic Rats. Nanoscale Res. Lett. 2015, 10, 265. [Google Scholar] [CrossRef] [Green Version]
  22. Jain, S.; Bharti, S.; Kaur Bhullar, G.; Tripathi, S.K. pH dependent drug release from drug conjugated PEGylated CdSe/ZnS nanoparticles. Mater. Chem. Phys. 2020, 240, 122162. [Google Scholar] [CrossRef]
  23. Kaviyarasu, K.; Kanimozhi, K.; Matinise, N.; Maria Magdalane, C.; Mola, G.T.; Kennedy, J.; Maaza, M. Antiproliferative effects on human lung cell lines A549 activity of cadmium selenide nanoparticles extracted from cytotoxic effects: Investigation of bio-electronic application. Mater. Sci. Eng. C 2017, 76, 1012–1025. [Google Scholar] [CrossRef] [PubMed]
  24. Balaiya, S.; Chalam, K. An In vitro Assay to Quantify Nitrosative Component of Oxidative Stress. J. Mol. Genet. Med. 2014, 8, 120. [Google Scholar] [PubMed] [Green Version]
  25. Lovrić, J.; Bazzi, H.S.; Cuie, Y.; Fortin, G.R.A.; Winnik, F.M.; Maysinger, D. Differences in subcellular distribution and toxicity of green and red emitting CdTe quantum dots. J. Mol. Med. 2005, 83, 377–385. [Google Scholar] [CrossRef]
  26. Horstmann, C.; Campbell, C.; Kim, D.S.; Kim, K. Transcriptome profile with 20 nm silver nanoparticles in yeast. FEMS Yeast Res. 2019, 19. [Google Scholar] [CrossRef] [PubMed] [Green Version]
  27. Naderi, S.; Zare, H.; Taghavinia, N.; Irajizad, A.; Aghaei, M.; Panjehpour, M. Cadmium telluride quantum dots induce apoptosis in human breast cancer cell lines. Toxicol. Ind. Health 2018, 34, 339–352. [Google Scholar] [CrossRef]
  28. He, S.-J.; Cao, J.; Li, Y.-S.; Yang, J.-C.; Zhou, M.; Qu, C.-Y.; Zhang, Y.; Shen, F.; Chen, Y.; Li, M.-M.; et al. CdSe/ZnS quantum dots induce photodynamic effects and cytotoxicity in pancreatic cancer cells. World J. Gastroenterol. 2016, 22, 5012. [Google Scholar] [CrossRef]
  29. Lim, S.D.; Sun, C.; Lambeth, J.D.; Marshall, F.; Amin, M.; Chung, L.; Petros, J.A.; Arnold, R.S. Increased Nox1 and hydrogen peroxide in prostate cancer. Prostate 2005, 62, 200–207. [Google Scholar] [CrossRef]
  30. Howlader, N.; Noone, A.; Krapcho, M.; Miller, D.; Brest, A.; Yu, M.; Ruhl, J.; Tatalovich, Z.; Mariotto, A.; Lewis, D.; et al. SEER Cancer Statistics Review; National Cancer Institute: Bethesda, MD, USA, 2019.
  31. Zhang, L.W.; Bäumer, W.; Monteiro-Riviere, N.A. Cellular uptake mechanisms and toxicity of quantum dots in dendritic cells. Nanomedicine 2011, 6, 777–791. [Google Scholar] [CrossRef] [Green Version]
  32. Pathakoti, K.; Hwang, H.-M.; Xu, H.; Aguilar, Z.P.; Wang, A. In vitro cytotoxicity of CdSe/ZnS quantum dots with different surface coatings to human keratinocytes HaCaT cells. J. Environ. Sci. 2013, 25, 163–171. [Google Scholar] [CrossRef]
  33. Derfus, A.M.; Chan, W.C.W.; Bhatia, S.N. Probing the Cytotoxicity of Semiconductor Quantum Dots. Nano Lett. 2004, 4, 11–18. [Google Scholar] [CrossRef] [Green Version]
  34. Kirchner, C.; Liedl, T.; Kudera, S.; Pellegrino, T.; Muñoz Javier, A.; Gaub, H.E.; Stölzle, S.; Fertig, N.; Parak, W.J. Cytotoxicity of Colloidal CdSe and CdSe/ZnS Nanoparticles. Nano Lett. 2005, 5, 331–338. [Google Scholar] [CrossRef] [PubMed]
  35. Wang, Y.; Wang, X.; Wang, C.; Peng, F.; Wang, R.; Xiao, X.; Zeng, J.; Kang, H.; Fan, X.; Sha, L.; et al. Transcriptomic Profiles Reveal the Interactions of Cd/Zn in Dwarf Polish Wheat (Triticum polonicum L.) Roots. Front. Physiol. 2017, 8, 168. [Google Scholar] [CrossRef] [PubMed] [Green Version]
  36. Winnik, F.M.; Maysinger, D. Quantum Dot Cytotoxicity and Ways to Reduce It. Acc. Chem. Res. 2013, 46, 672–680. [Google Scholar] [CrossRef] [PubMed] [Green Version]
  37. Bradburne, C.E.; Delehanty, J.B.; Boeneman Gemmill, K.; Mei, B.C.; Mattoussi, H.; Susumu, K.; Blanco-Canosa, J.B.; Dawson, P.E.; Medintz, I.L. Cytotoxicity of Quantum Dots Used for In Vitro Cellular Labeling: Role of QD Surface Ligand, Delivery Modality, Cell Type, and Direct Comparison to Organic Fluorophores. Bioconjug. Chem. 2013, 24, 1570–1583. [Google Scholar] [CrossRef] [PubMed]
  38. Nagy, A.; Steinbrück, A.; Gao, J.; Doggett, N.; Hollingsworth, J.A.; Iyer, R. Comprehensive Analysis of the Effects of CdSe Quantum Dot Size, Surface Charge, and Functionalization on Primary Human Lung Cells. ACS Nano 2012, 6, 4748–4762. [Google Scholar] [CrossRef] [PubMed]
  39. Fang, T.-T.; Li, X.; Wang, Q.-S.; Zhang, Z.-J.; Liu, P.; Zhang, C.-C. Toxicity evaluation of CdTe quantum dots with different size on Escherichia coli. Toxicology In Vitro 2012, 26, 1233–1239. [Google Scholar] [CrossRef]
  40. Manshian, B.B.; Soenen, S.J.; Al-Ali, A.; Brown, A.; Hondow, N.; Wills, J.; Jenkins, G.J.S.; Doak, S.H. Cell Type-Dependent Changes in CdSe/ZnS Quantum Dot Uptake and Toxic Endpoints. Toxicol. Sci. 2015, 144, 246–258. [Google Scholar] [CrossRef]
  41. Dimayuga, F.O.; Wang, C.; Clark, J.M.; Dimayuga, E.R.; Dimayuga, V.M.; Bruce-Keller, A.J. SOD1 overexpression alters ROS production and reduces neurotoxic inflammatory signaling in microglial cells. J. Neuroimmunol. 2007, 182, 89–99. [Google Scholar] [CrossRef] [Green Version]
  42. Remacle, C.; Coosemans, N.; Jans, F.; Hanikenne, M.; Motte, P.; Cardol, P. Knock-down of the COX3 and COX17 gene expression of cytochrome c oxidase in the unicellular green alga Chlamydomonas reinhardtii. Plant Mol. Biol. 2010, 74, 223–233. [Google Scholar] [CrossRef]
  43. Zhang, T.; Wang, Y.; Kong, L.; Xue, Y.; Tang, M. Threshold Dose of Three Types of Quantum Dots (QDs) Induces Oxidative Stress Triggers DNA Damage and Apoptosis in Mouse Fibroblast L929 Cells. Int. J. Environ. Res. Public Health 2015, 12, 13435–13454. [Google Scholar] [CrossRef]
  44. Zhang, T.; Hu, Y.; Tang, M.; Kong, L.; Ying, J.; Wu, T.; Xue, Y.; Pu, Y. Liver Toxicity of Cadmium Telluride Quantum Dots (CdTe QDs) Due to Oxidative Stress in Vitro and in Vivo. Int. J. Mol. Sci. 2015, 16, 23279–23299. [Google Scholar] [CrossRef] [PubMed] [Green Version]
  45. Li, B.; Gao, M.-H.; Zhang, X.-C.; Chu, X.-M. Molecular immune mechanism of C-phycocyanin from Spirulina platensis induces apoptosis in HeLa cells in vitro. Biotechnol. Appl. Biochem. 2006, 43, 155. [Google Scholar] [PubMed]
  46. Liu, C.C.; Wang, L.V.; Zhou, M.; Ye, J.; Chan, G.C.; Yang, M. Tashinone IIA Can Trigger the Apoptosis of a Megakaryocytic Cell Line CHRF- 288 through the TNFRSF9 Mediated Caspase-3 Activation Pathway. Blood 2008, 112, 4729. [Google Scholar] [CrossRef]
  47. Ruiz-Vela, A.; Opferman, J.T.; Cheng, E.H.; Korsmeyer, S.J. Proapoptotic BAX and BAK control multiple initiator caspases. EMBO Rep. 2005, 6, 379–385. [Google Scholar] [CrossRef] [PubMed] [Green Version]
  48. Nafisi, H.; Banihashemi, B.; Daigle, M.; Albert, P.R. GAP1(IP4BP)/RASA3 mediates Galphai-induced inhibition of mitogen-activated protein kinase. J. Biol. Chem. 2008, 283, 35908–35917. [Google Scholar] [CrossRef] [PubMed] [Green Version]
  49. Mattila, E.; Pellinen, T.; Nevo, J.; Vuoriluoto, K.; Arjonen, A.; Ivaska, J. Negative regulation of EGFR signalling through integrin-α1β1-mediated activation of protein tyrosine phosphatase TCPTP. Nat. Cell Biol. 2005, 7, 78–85. [Google Scholar] [CrossRef]
  50. Akhtar Ali, M.; Younis, S.; Wallerman, O.; Gupta, R.; Andersson, L.; Sjöblom, T. Transcriptional modulator ZBED6 affects cell cycle and growth of human colorectal cancer cells. Proc. Natl. Acad. Sci. USA 2015, 112, 7743–7748. [Google Scholar] [CrossRef] [Green Version]
  51. Motiwala, T.; Kutay, H.; Ghoshal, K.; Bai, S.; Seimiya, H.; Tsuruo, T.; Suster, S.; Morrison, C.; Jacob, S.T. Protein tyrosine phosphatase receptor-type O (PTPRO) exhibits characteristics of a candidate tumor suppressor in human lung cancer. Proc. Natl. Acad. Sci. USA 2004, 101, 13844–13849. [Google Scholar] [CrossRef] [Green Version]
  52. Holditch, S.J.; Brown, C.N.; Lombardi, A.M.; Nguyen, K.N.; Edelstein, C.L. Recent Advances in Models, Mechanisms, Biomarkers, and Interventions in Cisplatin-Induced Acute Kidney Injury. Int. J. Mol. Sci. 2019, 20, 3011. [Google Scholar] [CrossRef] [Green Version]
  53. Du, J.; Xu, R. RORα, a Potential Tumor Suppressor and Therapeutic Target of Breast Cancer. Int. J. Mol. Sci. 2012, 13, 15755–15766. [Google Scholar] [CrossRef] [Green Version]
  54. Alsina, F.C.; Irala, D.; Fontanet, P.A.; Hita, F.J.; Ledda, F.; Paratcha, G. Sprouty4 Is an Endogenous Negative Modulator of TrkA Signaling and Neuronal Differentiation Induced by NGF. PLoS ONE 2012, 7, e32087. [Google Scholar] [CrossRef] [PubMed] [Green Version]
  55. Jiao, S.; Li, N.; Cai, S.; Guo, H.; Wen, Y. Inhibition of CYFIP2 promotes gastric cancer cell proliferation and chemoresistance to 5-fluorouracil through activation of the Akt signaling pathway. Oncol. Lett. 2017, 13, 2133–2140. [Google Scholar] [CrossRef] [PubMed] [Green Version]
  56. Ren, W.; Yi, H.; Bao, Y.; Liu, Y.; Gao, X. Oestrogen inhibits PTPRO to prevent the apoptosis of renal podocytes. Exp. Ther. Med. 2019, 17, 2373–2380. [Google Scholar] [CrossRef] [PubMed] [Green Version]
  57. Montfort, A.; Martin, P.G.P.; Levade, T.; Benoist, H.; Ségui, B. FAN (factor associated with neutral sphingomyelinase activation), a moonlighting protein in TNF-R1 signaling. J. Leukoc. Biol. 2010, 88, 897–903. [Google Scholar] [CrossRef]
  58. Jackson II, R.S.; Cho, Y.-J.; Stein, S.; Liang, P. CYFIP2, a Direct p53 Target, is Leptomycin-B Sensitive. Cell Cycle 2007, 6, 95–103. [Google Scholar] [CrossRef]
  59. Su, J.; Su, B.; Xia, H.; Liu, F.; Zhao, X.; Li, J.; Zhang, J.; Shi, Y.; Zeng, Y.; Zeng, X.; et al. RORα Suppresses Epithelial-to-Mesenchymal Transition and Invasion in Human Gastric Cancer Cells via the Wnt/β-Catenin Pathway. Front. Oncol. 2019, 9, 1344. [Google Scholar] [CrossRef] [Green Version]
  60. Zhou, Y. Substantial reduction in risk of breast cancer associated with genetic polymorphisms in the promoters of the matrix metalloproteinase-2 and tissue inhibitor of metalloproteinase-2 genes. Carcinogenesis 2003, 25, 399–404. [Google Scholar] [CrossRef]
  61. Gao, X.; Nawaz, Z. Progesterone receptors-animal models and cell signaling in breast cancer: Role of steroid receptor coactivators and corepressors of progesterone receptors in breast cancer. Breast Cancer Res. 2002, 4, 182. [Google Scholar] [CrossRef]
  62. Saijo, K.; Mecklenbräuker, I.; Santana, A.; Leitger, M.; Schmedt, C.; Tarakhovsky, A. Protein kinase C beta controls nuclear factor kappaB activation in B cells through selective regulation of the IkappaB kinase alpha. J. Exp. Med. 2002, 195, 1647–1652. [Google Scholar] [CrossRef]
  63. Martins, A.S.; Olmos, D.; Missiaglia, E.; Shipley, J. Targeting the Insulin-Like Growth Factor Pathway in Rhabdomyosarcomas: Rationale and Future Perspectives. Sarcoma 2011, 2011, 1–11. [Google Scholar] [CrossRef] [Green Version]
  64. Ahmed, S.; Thomas, G.; Ghoussaini, M.; Healey, C.S.; Humphreys, M.K.; Platte, R.; Morrison, J.; Maranian, M.; Pooley, K.A.; Luben, R.; et al. Newly discovered breast cancer susceptibility loci on 3p24 and 17q23.2. Nat. Genet. 2009, 41, 585–590. [Google Scholar] [CrossRef] [PubMed]
  65. Yuan, S.; Wang, J.; Yang, F.; Tao, Q.; Zhang, J.; Wang, L.; Yang, Y.; Liu, H.; Wang, Z.; Xu, Q.; et al. Long noncoding RNA DANCR increases stemness features of hepatocellular carcinoma by derepression of CTNNB1: HEPATOLOGY, Vol. XX, No. X, 2015. Hepatology 2016, 63, 499–511. [Google Scholar] [CrossRef] [PubMed]
  66. Kim, H.-C.; Chang, J.; Lee, H.S.; Kwon, H.J. Mitochondrial UQCRB as a new molecular prognostic biomarker of human colorectal cancer. Exp. Mol. Med. 2017, 49, e391. [Google Scholar] [CrossRef] [PubMed] [Green Version]
  67. Mimaki, M.; Wang, X.; McKenzie, M.; Thorburn, D.R.; Ryan, M.T. Understanding mitochondrial complex I assembly in health and disease. Biochim. Biophys. Acta Bioenerg. 2012, 1817, 851–862. [Google Scholar] [CrossRef] [PubMed] [Green Version]
  68. Sun, H.; Chen, M.; Wang, Z.; Zhao, G.; Liu, J.-X. Transcriptional profiles and copper stress responses in zebrafish cox17 mutants. Environ. Pollut. 2020, 256, 113364. [Google Scholar] [CrossRef] [PubMed]
  69. Whitson, J.A.; Zhang, X.; Medvedovic, M.; Chen, J.; Wei, Z.; Monnier, V.M.; Fan, X. Transcriptome of the GSH-Depleted Lens Reveals Changes in Detoxification and EMT Signaling Genes, Transport Systems, and Lipid Homeostasis. Investig. Opthalmol. Vis. Sci. 2017, 58, 2666. [Google Scholar] [CrossRef] [PubMed]
Figure 1. STEM images of CdSe/ZnS (Green) and CdSe/ZnS (yellow). (A) Green CdSe/ZnS with low resolution (bar size 100 nm). (B) Green CdSe/ZnS with higher resolution (bar size 10 nm). (C) Yellow CdSe/ZnS with low resolution (bar size 100 nm). (D) Yellow CdSe/ZnS with high resolution (bar size 10 nm).
Jnt 01 00003 g001
Figure 2. EDAX (Energy Dispersive X-ray Spectrometer) spectra of CdSe/ZnS (green) (top) and CdSe/ZnS (yellow) (bottom) quantum dots (QDs), verifying the elemental composition.
Jnt 01 00003 g002
Figure 3. Intensity size distribution of CdSe/ZnS QDs (green) and CdSe/ZnS QDs (yellow) obtained by DLS (Dynamic Light Scattering) with hydrodynamic sizes of 56.0 and 61.2 nm, respectively.
Jnt 01 00003 g003
Figure 4. UV/Vis absorption spectra in the 450–650 nm range of each QD sample with absorption peaks for the green and yellow QDs at 514 and 548 nm, respectively.
Jnt 01 00003 g004
Figure 5. Cell viability inhibition with CdSe/ZnS QDs in HeLa and mouse-derived fibroblast cells. Varying doses of green or yellow CdSe/ZnS QDs were treated for 24 h in HeLa or mouse-derived fibroblast cells, and the resulting levels of viability at each concentration of QDs were measured using a spectrophotometer as indicated in the Methods section. (A) Reduced cell viability in HeLa cells with green CdSe/ZnS QDs. (B) Reduced cell viability in HeLa cells with yellow CdSe/ZnS QDs (**** p < 0.0001, *** p < 0.0005, ** p < 0.0076). NTC, non-treated control. (C) Cell viability test with green CdSe/ZnS in mouse-derived non-cancerous fibroblast cells.
Jnt 01 00003 g005
Figure 6. Assessment of reactive oxygen species levels. (A) HeLa cells were treated with 80 μg/mL of CdSe/ZnS QDs for 24 h and measured with DHE (Dihydroethidium) to detect superoxides. (B) HeLa cells were treated with 80 μg/mL of CdSe/ZnS QDs for 24 h and measured with DHR (Dihydrorhodamine 123) to detect peroxynitrites. (C) Superoxide levels were detected by DHE upon the treatment of 80 μg/mL of CdSe/ZnS QDs for 72 h. (D) Peroxynitrite levels were detected by DHR123 upon the treatment of 80 μg/mL of CdSe/ZnS QDs for 72 h. NTC, non-treated control.
Jnt 01 00003 g006
Figure 7. Increase in apoptosis. HeLa cells were treated with 80 µg/mL green CdSe/ZnS QDs for 24 h, and the resulting apoptosis was measured. (A) Levels of early apoptosis. (B) Levels of late apoptosis. ** p < 0.0094, and *** p < 0.0008. NTC, non-treated control.
Jnt 01 00003 g007
Figure 8. Gene Ontology terms of variously expressed genes upon the treatment of Cd QDs. A total of 5756 genes were found statistically significant with a q-value below 0.05. (A) 3022 genes were found upregulated among the 5756. (B) 2734 of 5756 genes were found downregulated.
Jnt 01 00003 g008
Figure 9. A proposed mechanism of physioloical changes with green CdSe/ZnS treatment in HeLa cells. (A) The upregulated genes are responsbile for antiapoptotic, antiproliferative, and antitumorigenic functions (see discussion section). The upregulated genes were color coded based on their log2fold change. A gene’s log2fold change above 1.00 is red, blue is a gene’s log2fold change between 0.50–0.90, green is a log2fold change ranging between 0.30–0.40, and yellow is the lowest log2fold change. (B) Green CdSe/ZnS seemed to downregulate the processes of pro-proliferation, mitochondrial respiratory chain, detoxification, and receptor-mediated endocytosis (see discussion section). Those downregulated genes were also color-coded.
Jnt 01 00003 g009
Table 1. GO term analysis with the top 74 upregulated genes. A total of 74 upregulated genes with a log2fold change of 1.5 or higher were analyzed using GoRilla.
Gene Ontology TermNo. of GenesCorresponding Highly Upregulated Genes
activation of phospholipase C activity2EGFR, GNA15, alpha 15 (gq class)
regulation of NIK/NF-kappaB signaling4EGFR; GPR97; IL1β; MIR30C2
cellular response to tumor necrosis factor4KCNJ11; RORA; IL8; MIR30C2
response to tumor necrosis factor4KCNJ11; RORA; IL8; MIR30C2
signaling6HTR7; EREG; KCNJ4; PKP2; GDF15; IL1β
astrocyte activation2EGFR; IL1β
positive regulation of interleukin-6 biosynthetic process2EREG; IL1β
EGFR—epidermal growth factor receptor; GNA15—guanine nucleotide binding protein; GPR97—g protein-coupled receptor 97; IL1β—interleukin 1 beta; MIR30C2—microrna 30c-2; KCNJ11—potassium inwardly rectifying channel, subfamily j, member 11; RORA—rar-related orphan receptor a; IL8—interleukin 8; HTR7—5-hydroxytryptamine (serotonin) receptor 7, adenylate cyclase-coupled; EREG—epiregulin; KCNJ4—potassium inwardly rectifying channel, subfamily j, member 4; PKP2—plakophilin 2; GDF15—growth differentiation factor 15.
Table 2. GO term analysis with the top 41 downregulated genes. A total of 41 highly downregulated genes with a log2fold change of at least 1.5 were selected and analyzed with GoRilla.
Gene Ontology TermNo. of GenesCorresponding Highly Downregulated Genes
mesenchyme migration3ACTA1, ACTC1, FOXF1
tissue migration3ACTA1, ACTC1, FOXF1
skeletal muscle thin filament assembly2ACTA1, ACTC1
epithelial cell differentiation involved in mammary gland alveolus development2ID2, FOXF1
regulation of systemic arterial blood pressure by hormone2EDN2, NOX1
endocrine process2EDN2, NOX1
extracellular matrix organization5A2M, NOX1, JAM3, EMILIN1, FOXF1
regulation of systemic arterial blood pressure mediated by a chemical signal2EDN2, NOX1
embryonic digestive tract morphogenesis2ID2, FOXF1
extracellular structure organization5A2M, NOX1, JAM3, EMILIN1, FOXF1
regulation of blood pressure3ID2, EDN2, NOX1
ACTA1—actin, alpha 1, skeletal muscle; ACTC1—actin, alpha, cardiac muscle 1; FOXF1—forkhead box f1; ID2—inhibitor of DNA binding 2, dominant negative helix-loop-helix protein; EDN2—endothelin 2; NOX1—nadph oxidase 1; A2M—alpha-2-macroglobulin; JAM3—junctional adhesion molecule 3; EMILIN1—elastin microfibril interfacer 1.

