
Assessment of Computational Tools for Predicting Supramolecular Synthons


Department of Chemistry, Kansas State University, Manhattan, KS 66506, USA
*
Author to whom correspondence should be addressed.
Chemistry 2021, 3(2), 612-629; https://0-doi-org.brum.beds.ac.uk/10.3390/chemistry3020043
Submission received: 25 March 2021
/
Revised: 23 April 2021
/
Accepted: 25 April 2021
/
Published: 3 May 2021
(This article belongs to the Special Issue Memorial Issue Dedicated to Dr. Howard D. Flack: The Man behind the Flack Parameter)
Abstract
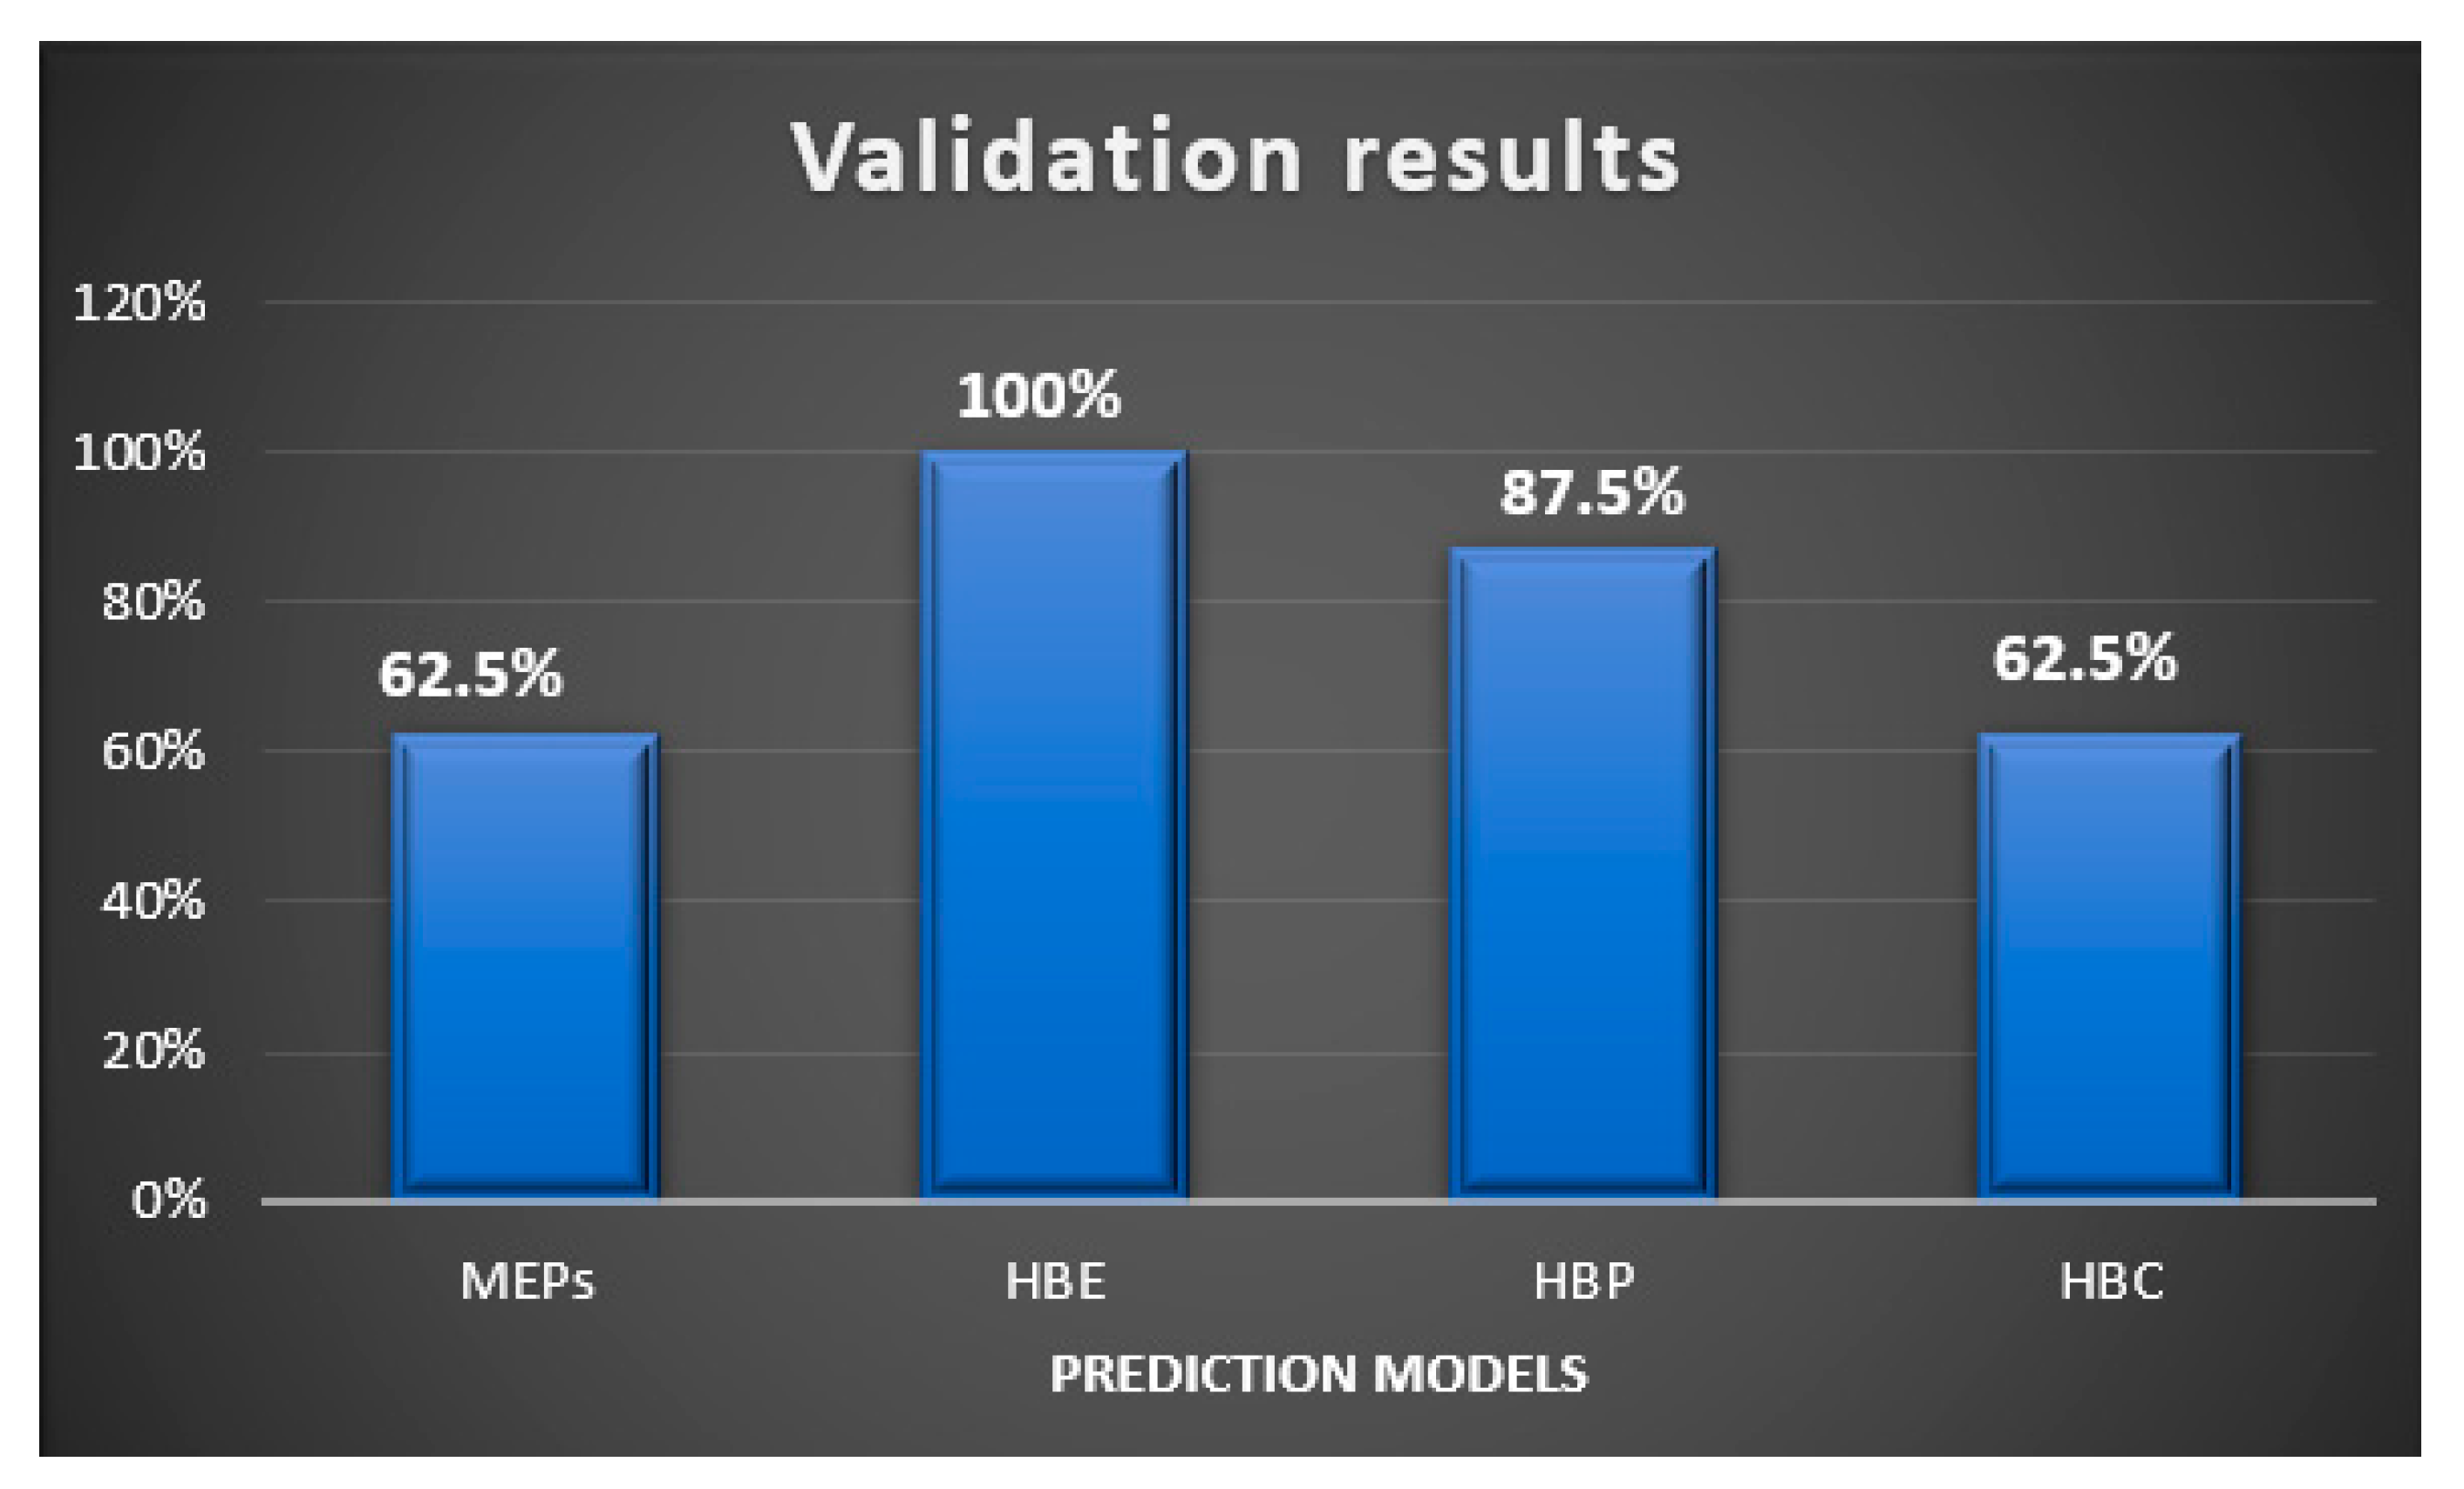
:The ability to predict the most likely supramolecular synthons in a crystalline solid is a valuable starting point for subsequently predicting the full crystal structure of a molecule with multiple competing molecular recognition sites. Energy and informatics-based prediction models based on molecular electrostatic potentials (MEPs), hydrogen-bond energies (HBE), hydrogen-bond propensity (HBP), and hydrogen-bond coordination (HBC) were applied to the crystal structures of twelve pyrazole-based molecules. HBE, the most successful method, correctly predicted 100% of the experimentally observed primary intermolecular-interactions, followed by HBP (87.5%), and HBC = MEPs (62.5%). A further HBC analysis suggested a risk of synthon crossover and synthon polymorphism in molecules with multiple binding sites. These easy-to-use models (based on just 2-D chemical structure) can offer a valuable risk assessment of potential formulation challenges.
1. Introduction
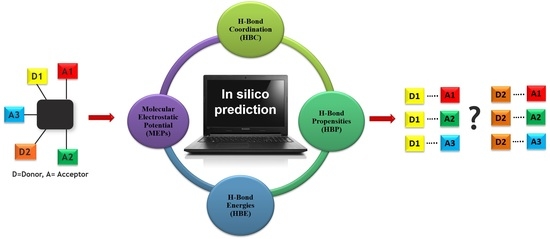
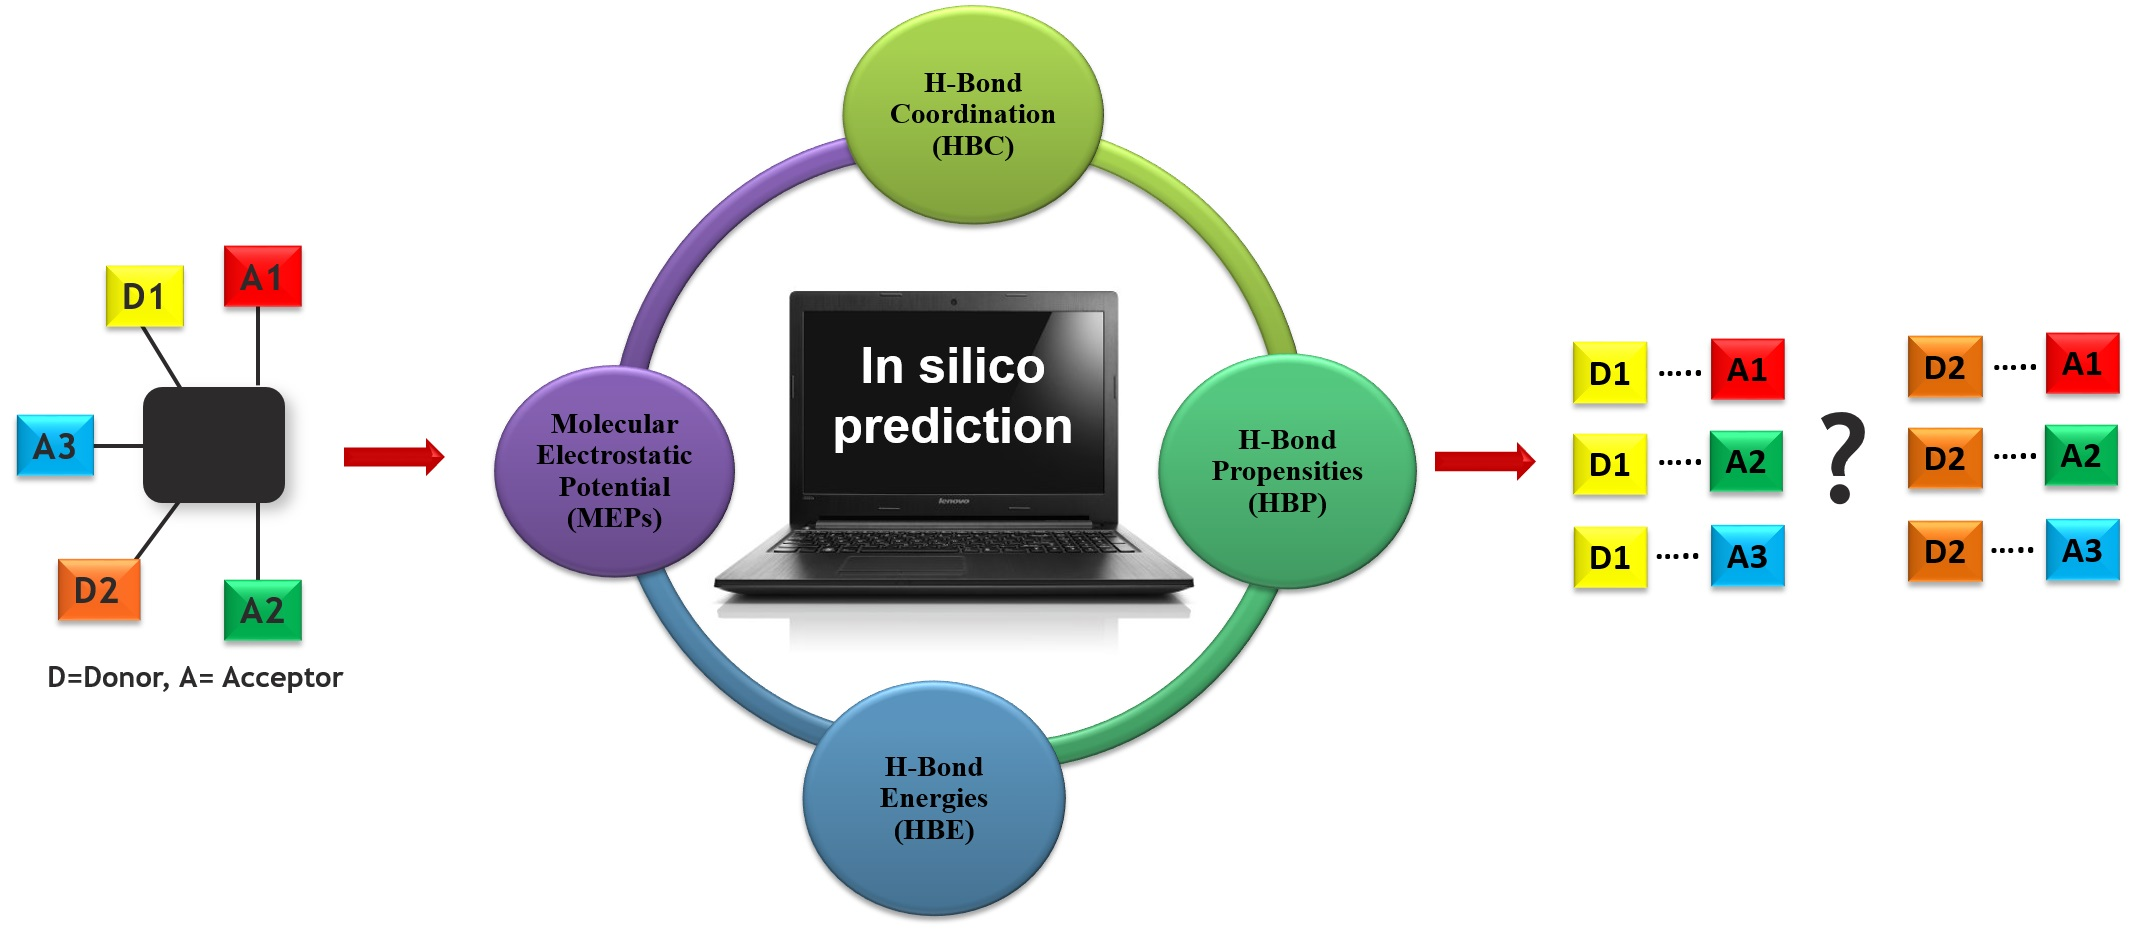
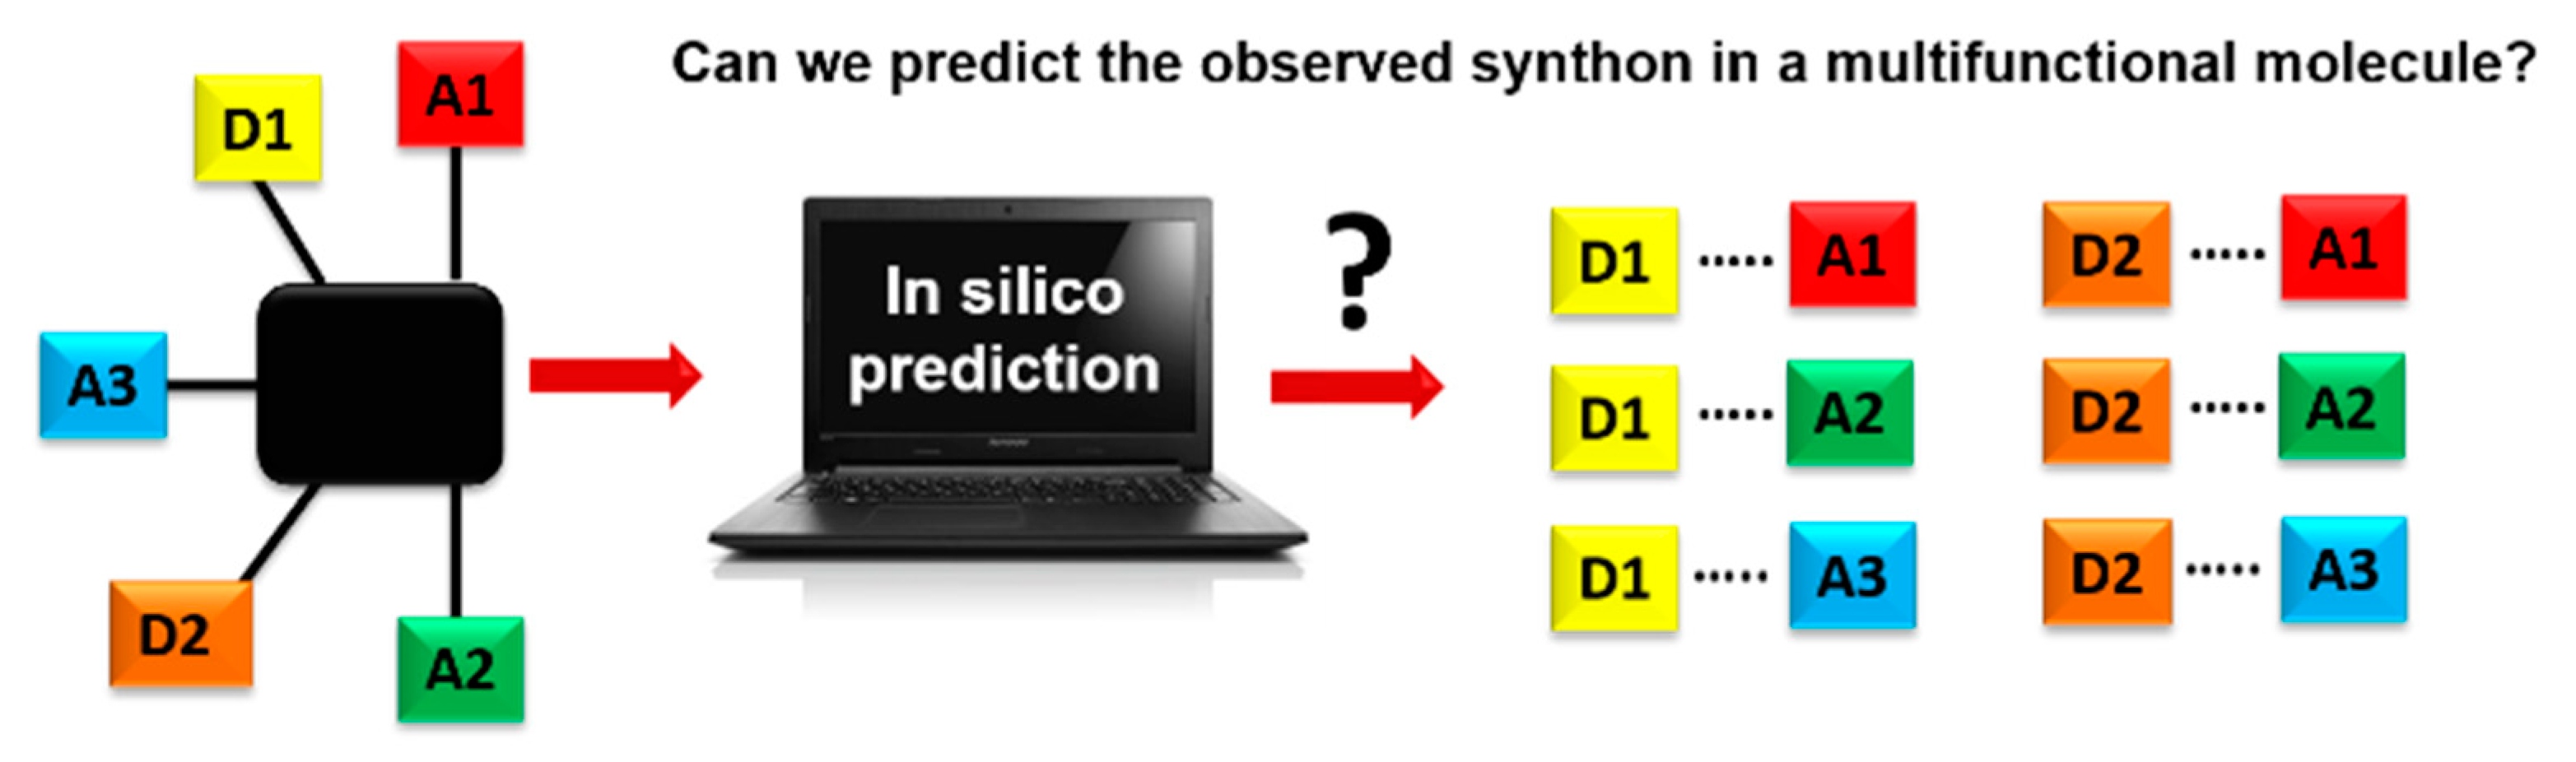
A key question in crystal engineering is, given a molecular structure, can we predict its crystal structure [1]? At the core of the crystal structure of most organic molecular solids is the supramolecular synthon [2,3,4,5], a “structural unit within supermolecules which can be formed and/or assembled by known or conceivable synthetic operations involving intermolecular interactions”, introduced by Desiraju in 1995 [2]. A reason for why this idea is so important to crystal engineering is the fact that detailed knowledge and control of intermolecular interactions is as vital to this field as is control of the covalent bond to molecular synthesis [6,7,8,9,10,11,12,13,14,15,16,17,18]. Furthermore, the synthon can serve as a valuable starting point for identifying the most likely ways in which molecules will aggregate [19,20]. This means that an important step towards predicting a crystal structure often involves finding the most likely synthons in molecules with competing molecular recognition sites, Scheme 1.
Many groups have proposed practical tools and avenues for a priori prediction of synthons in crystal structures of organic molecular solids. Some of these are based on electrostatics [21,22,23] and lattice energy calculations [24,25,26], with the focus purely on thermodynamic (enthalpic) factors [27]. For example, Hunter et al. converted maxima/minima on calculated molecular electrostatic potential surfaces into hydrogen-bond energies to determine synthon preference in multicomponent systems [28,29]. The preferred connectivity patterns of a molecule in the solid state in such cases is determined using Etter guidelines which states that the best hydrogen bond acceptor binds to the best donor [22]. The required ranking of best donor-acceptor pairs can be determined using molecular electrostatic potentials [21,23,30,31,32,33,34,35,36,37,38,39,40,41,42].
One way of accounting for kinetic factors that inevitably influence crystallization and assembly is to systematically analyze large swaths of structural information in the Cambridge Structural Database (CSD) [43]. Although an individual crystal structure does not provide information about kinetics of the seed formation and crystal growth, it is reasonable to assume that if a particular structural array is abundant in a database, it may reflect thermodynamic stability of a given crystal packing array, as well as a kinetic preference of its formation. Aakerӧy, co-workers and others have used structural informatics tools such as hydrogen-bond propensity [44], and hydrogen-bond coordination [45] developed by the Cambridge Crystallographic Data Centre (CCDC) to understand the synthon predictions in the co-crystal formation [23,46,47,48]. These tools have considerable potential for validation purposes in both single component and multi-component systems. Yet, despite these efforts, there is still a need for more additional studies that systematically analyze and compare the abilities and reliability of different methods for predicting which synthon(s) is/are most likely to appear in crystal structures of high-value organic chemicals such as pharmaceuticals and agrochemicals.
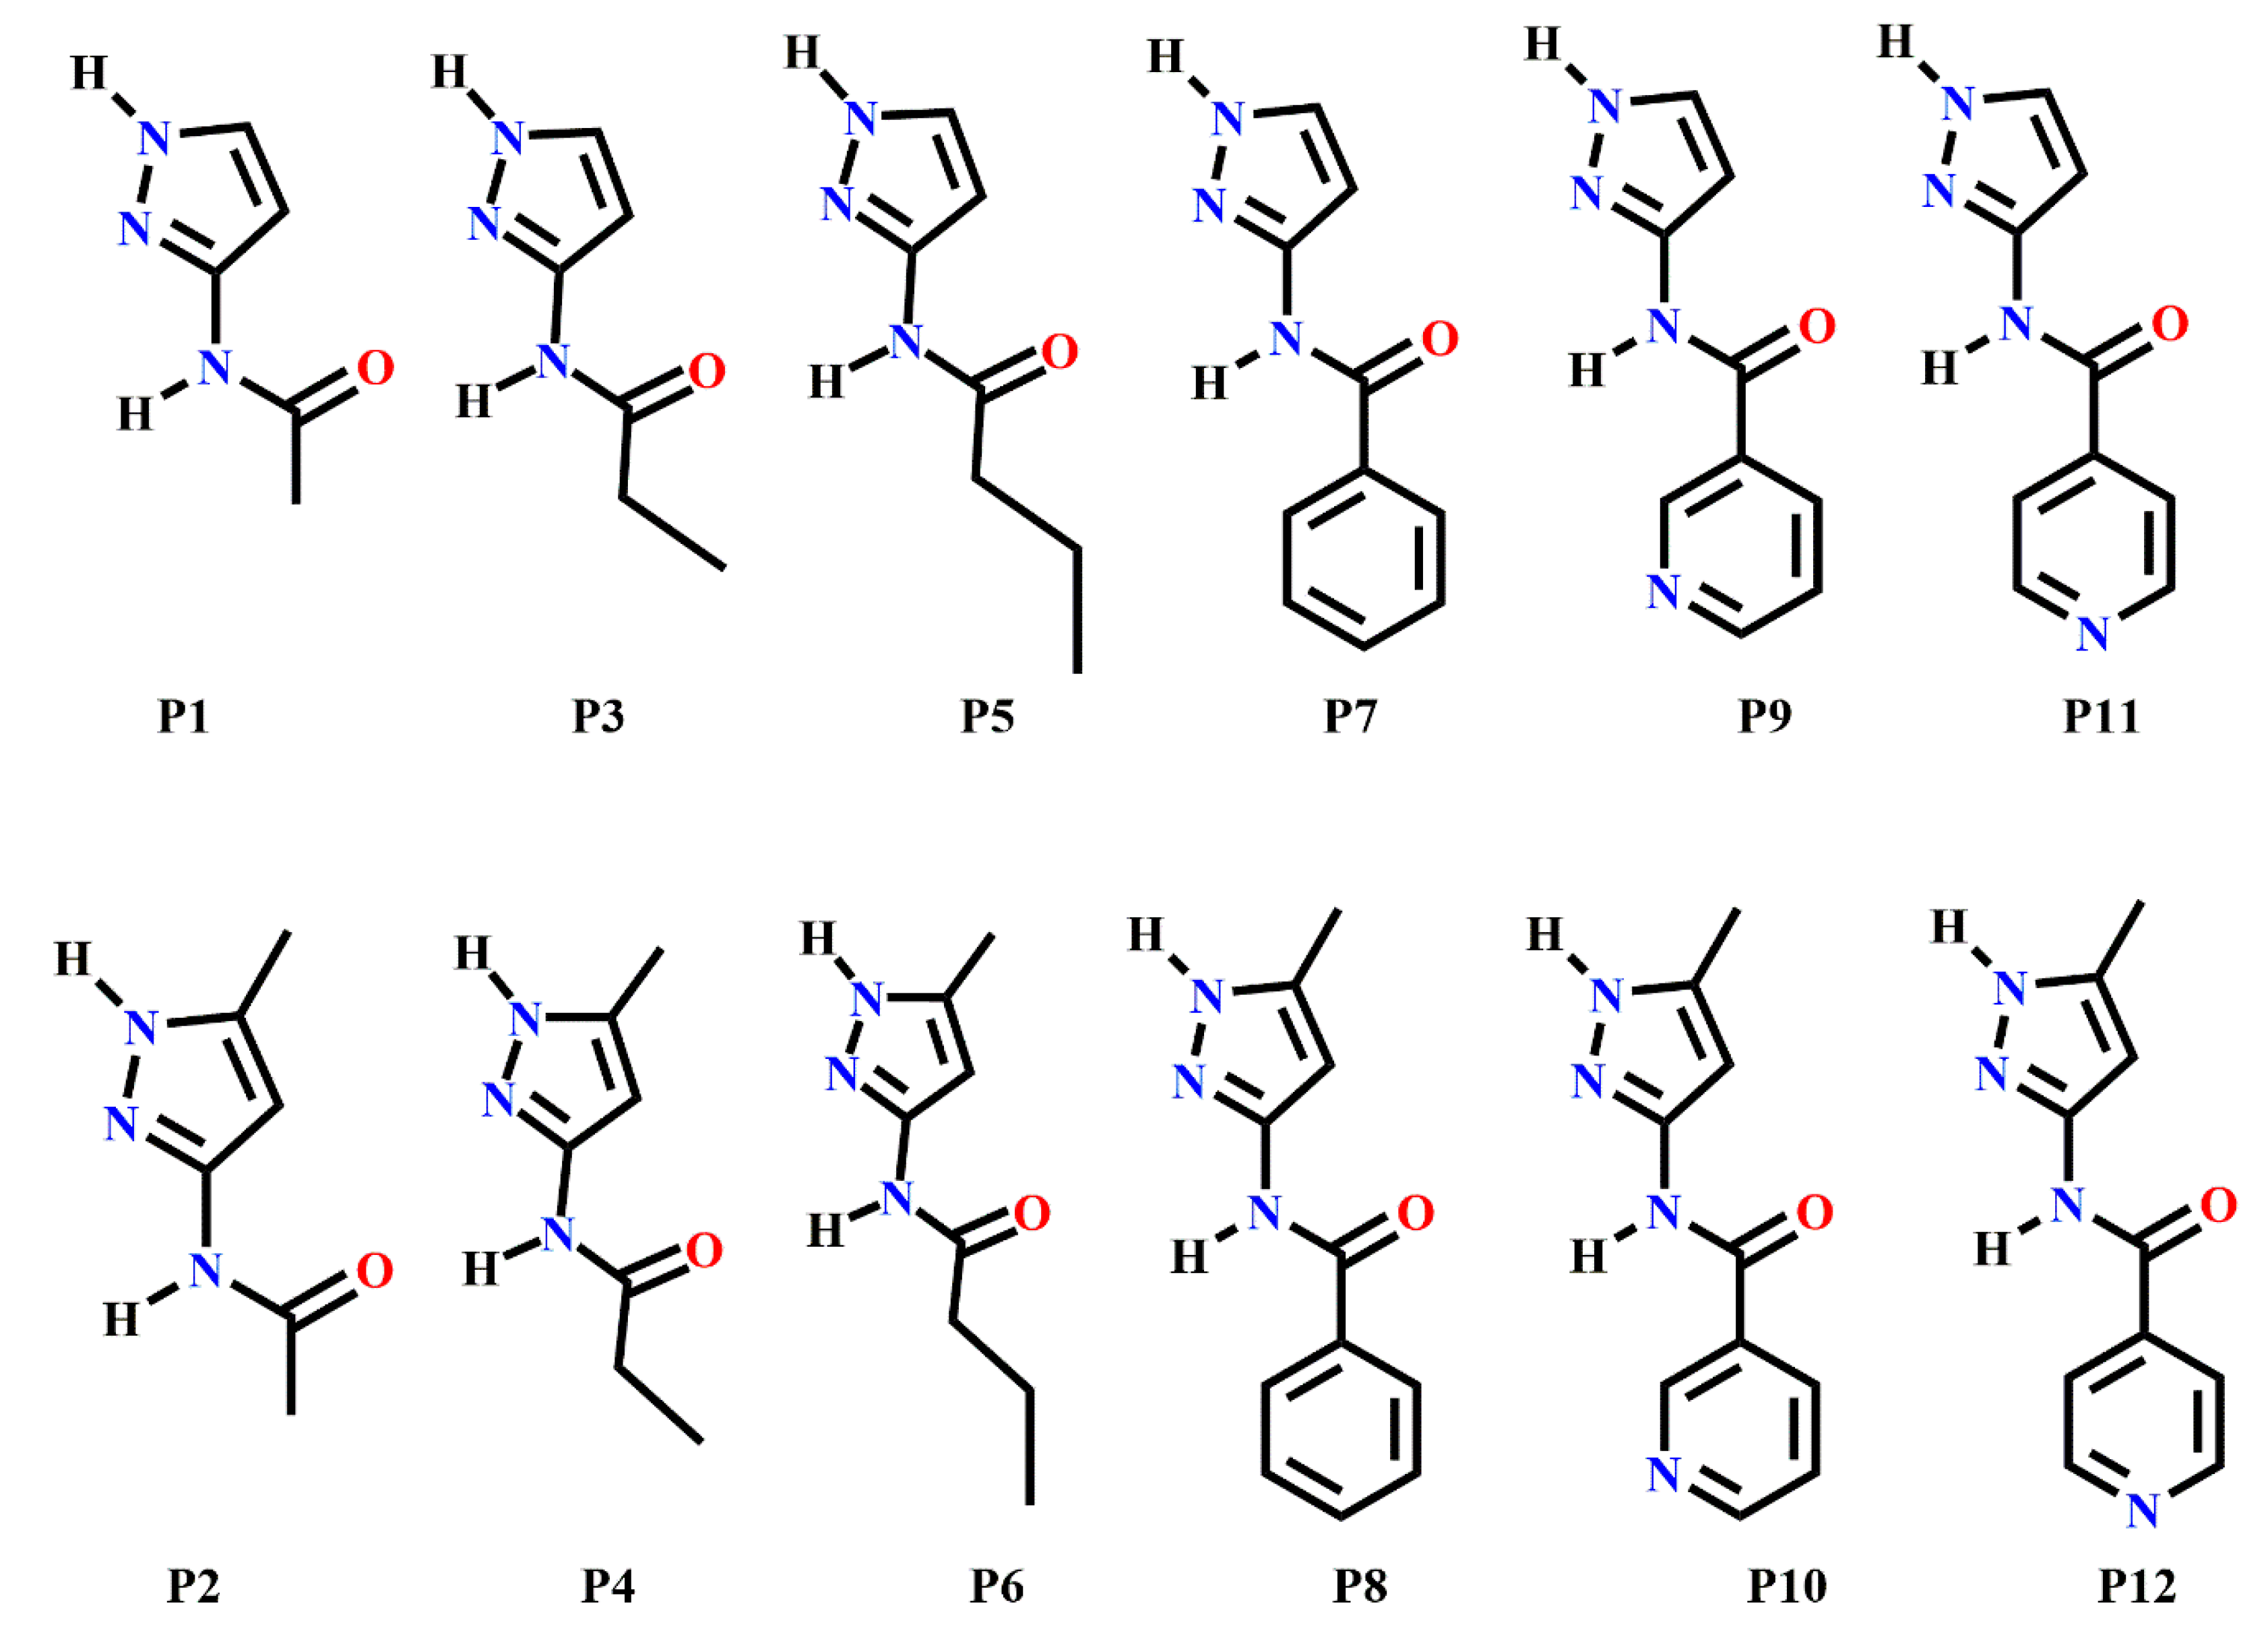
In order to address this issue, we have employed several known methods for synthon prediction in order to map out the structural landscape of a family of relatively flexible pyrazole containing molecules (P1–P12) capable of forming specific and competing intermolecular interactions, Scheme 2. We selected a pyrazole backbone because many compounds comprising this chemical functionality are known to possess a wide range of biological activities such as anti-microbial, anti-fungal, anti-tubercular, anti-inflammatory, anti-convulsant, anticancer, anti-viral, and so on [49,50,51,52,53,54,55,56,57]. The pyrazole-amide functionality is also present in some pharmaceutical related compounds such as Entrectinib, Graniseton, and Epirizol as well as antifungal compounds such as Furametpyr, Penthiopyrad and Tolfempyrad [58]. Due to the presence of multifunctional groups, these molecules are always at risk of synthon polymorphism. Therefore, knowledge gained from a successful use of tools such as molecular electrostatic potentials, hydrogen-bond energies, hydrogen-bond propensity and hydrogen-bond coordination, for predicting synthon appearances could have significant practical applications.
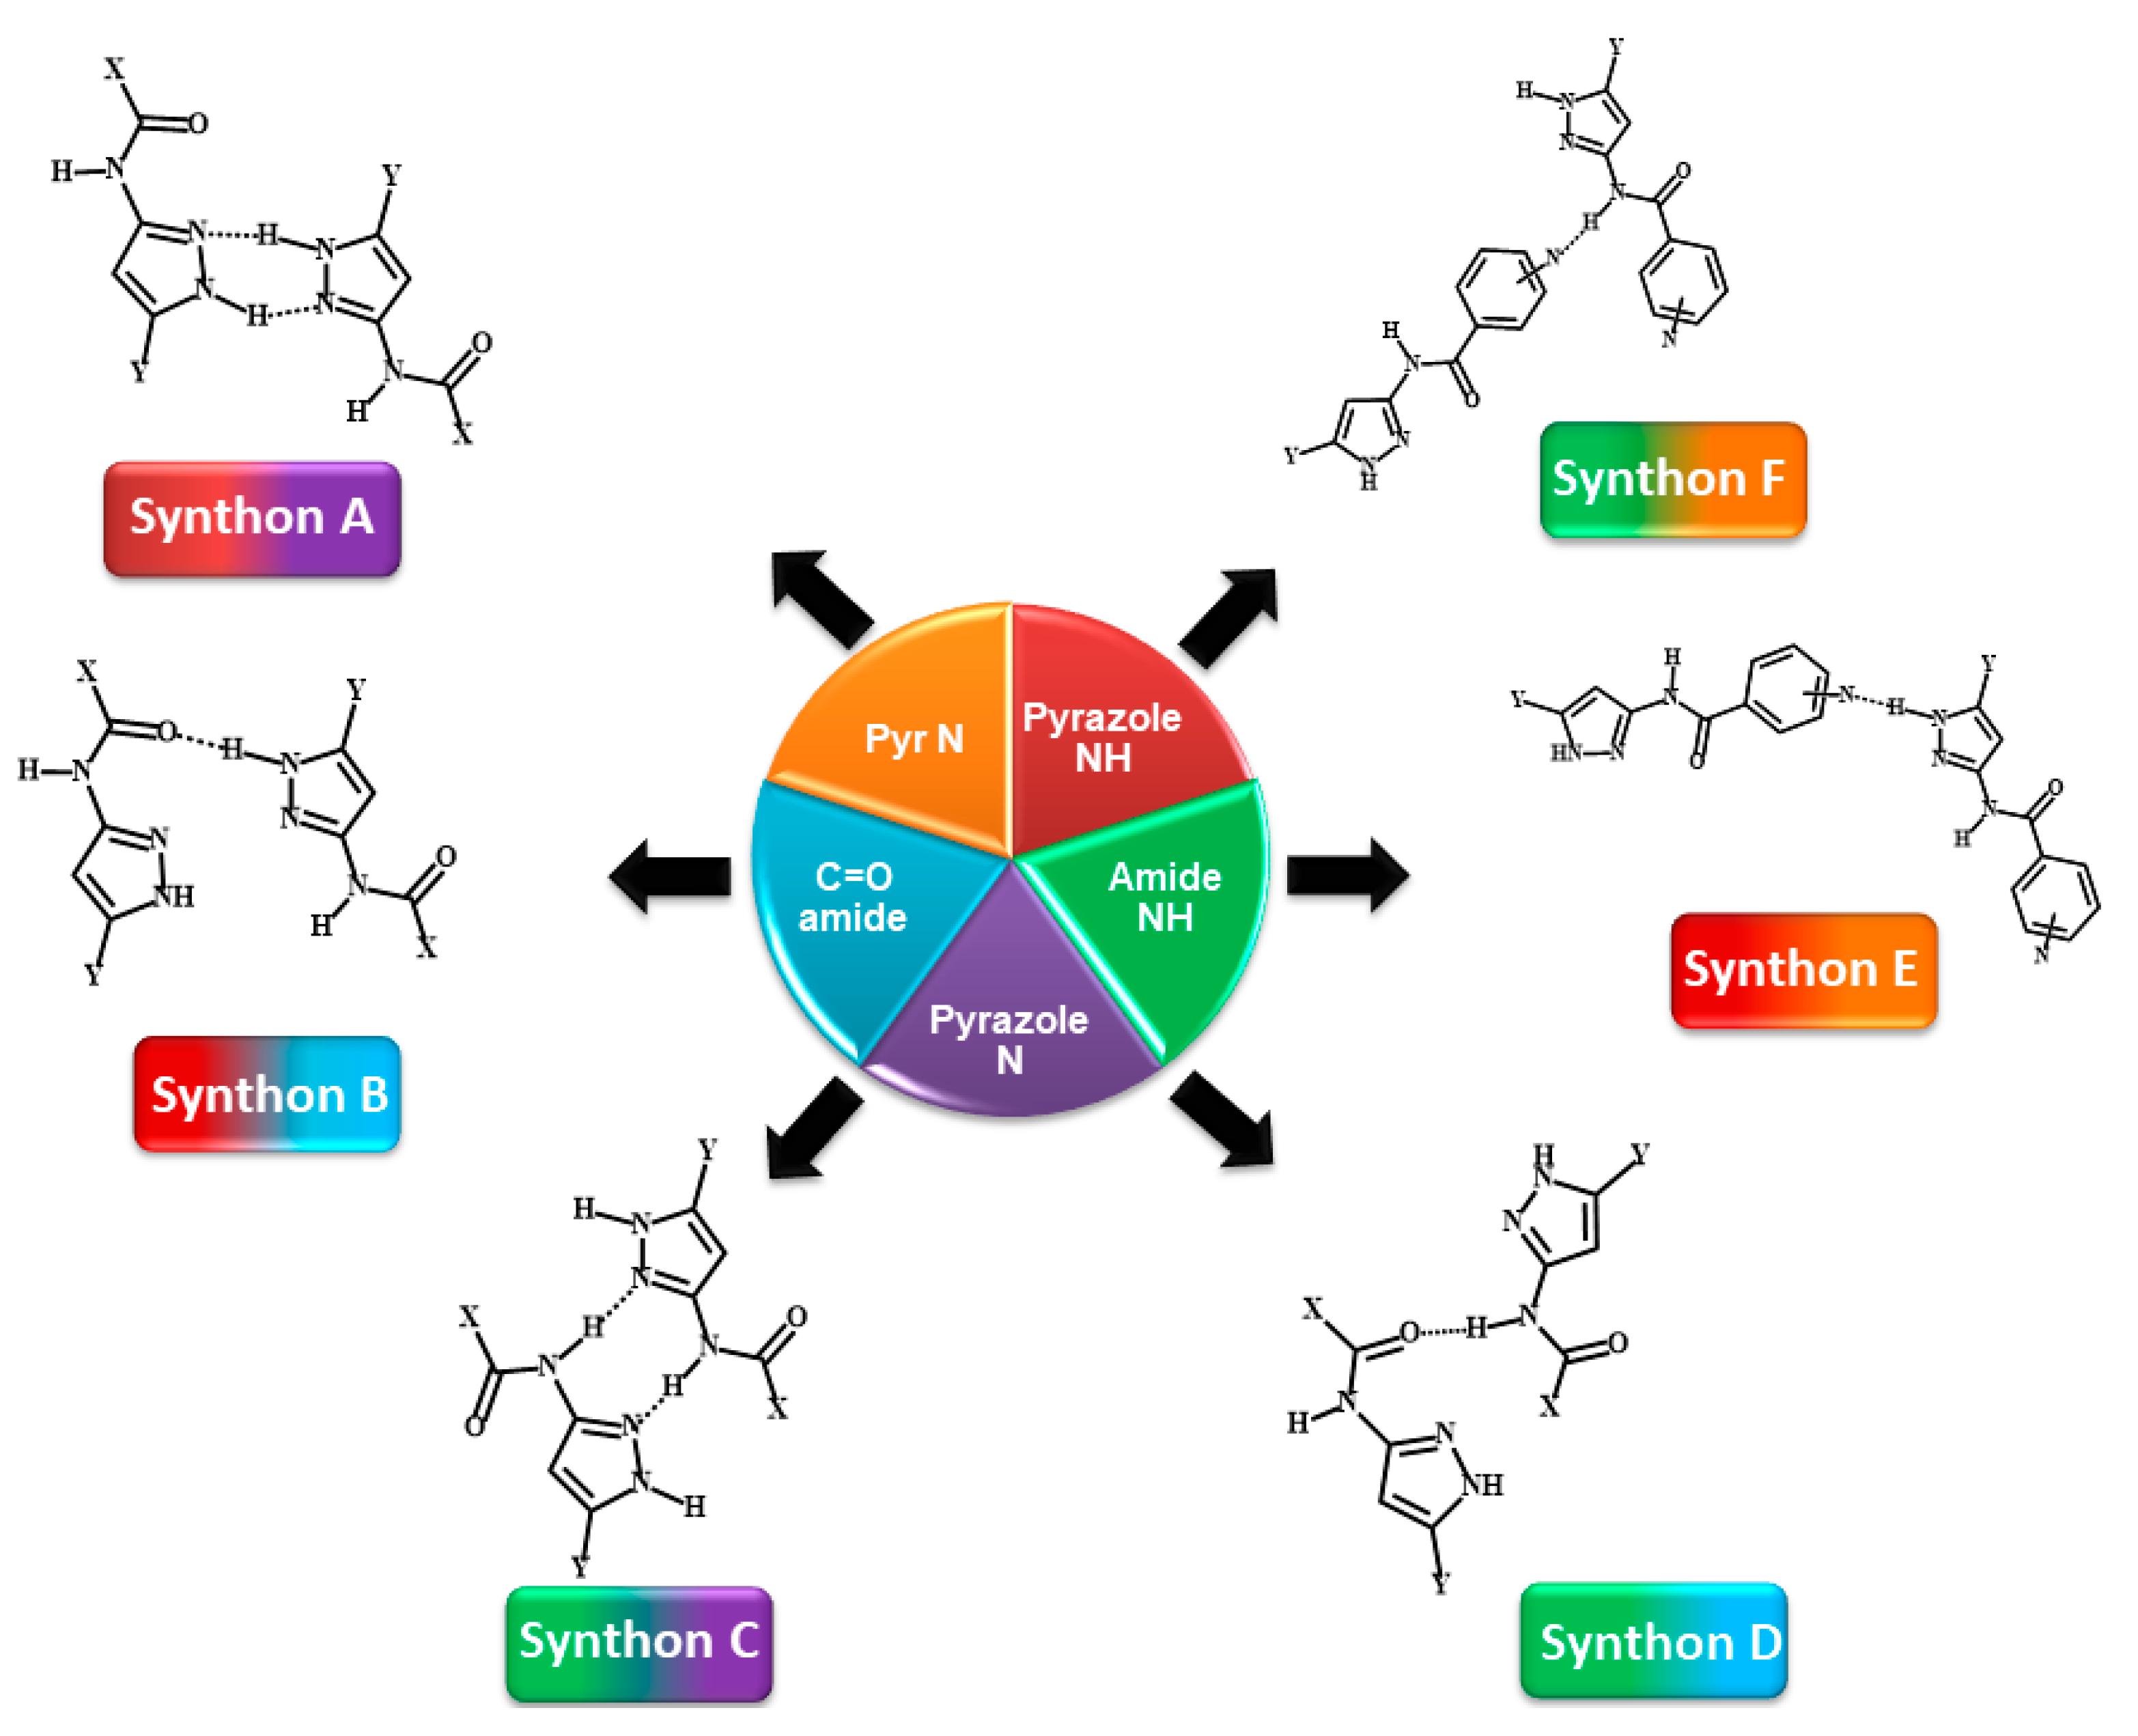
The target molecules, P1–P12 can be divided into two groups: Group 1 (P1–P8) includes molecules with two hydrogen-bond (HB) donors (pyrazole NH and amide NH) and two HB acceptors (pyrazole N and C=O of amide), leading to four possible/likely synthons; A-D, Scheme 3. It can be assumed that each molecule forms a combination of two synthons to satisfy all hydrogen-bond donors and acceptors leading to two possible synthon combinations; (A + D) or (B + C)).
Group 2 (P9–P12) comprises molecules with two HB donors (pyrazole NH and amide NH) and three HB acceptors (pyrazole N, carbonyl C=O and pyridine N) groups. Two additional synthons can therefore be postulated in this group, E and F, leaving a total of six possibilities, Scheme 3.
The overall outline for testing different predictive methods against experimental data is summarized in Scheme 4. We used four protocols for determining the most likely synthon in the crystal structures of P1–P12; molecular electrostatic potentials (MEPs), hydrogen-bond energies (HBE), hydrogen-bond propensities (HBP) and hydrogen-bond coordination (HBC). The prediction from each method was then compared to experimental data. The overall goal was to identify which approach is likely to deliver robust and transferable guidelines for estimating/predicting which hydrogen bonds are most likely to appear in molecular solids when there are numerous potential avenues for assembly.
The study was undertaken to address the following questions,
- Which method is more suitable for predicting the synthon outcome in the crystal structures of P1–P12?
- Is a combination of prediction methods better than individual methods?
- Which synthon is most optimal in group 1 (P1–P8) and how does adding an acceptor group affect the choice of synthon in P9–P12?
- Which molecules present the larger risk of synthon polymorphism, and which method is most suitable for predicting synthon polymorphism in this group of molecules?
2. Materials and Methods
2-Amino-pyrazole, 2-amino-5-methyl-pyrazole, acetic anhydride, propionic anhydride and benzoyl chloride were purchased from Sigma Aldrich (Milwaukee, WI, USA) and utilized without further purification. Synthetic procedures and characterization of all molecules are provided in the Supporting Information (SI). Melting points were measured using Fisher-Johns melting point apparatus. 1H NMR data were collected on a Varian Unity plus 400 MHz spectrophotometer in DMSO.
Additionally, Cambridge Structural Database (Version 5.38 and Mercury 3.9) based structural informatics tools such as hydrogen-bond propensity (HBP), and hydrogen-bond coordination (HBC) were used [59,60,61,62] to predict the synthons in the crystal structures of P1–P12.
2.1. Molecular Electrostatic Potentials (MEPs)
Molecular electrostatic potential surfaces of P1–P12 were generated with DFT B3LYP level of theory using 6-311++G** basis set in vacuum. All calculations were carried out using Spartan’08 software (Wavefunction, Inc., Irvine, CA, USA) [63]. All molecules were geometry optimized with the maxima and minima in the electrostatic potential surface (0.002 e/au isosurface) determined using positive point charge in the vacuum as a probe. The numbers indicate the Coulombic interaction energy (kJ/mol) between the positive point probe and the surface of the molecule at that particular point.
2.2. Hydrogen-Bond Energies (HBE)
The hydrogen-bond energies (HBE) were calculated using molecular electrostatic potentials (MEPs) combined with Hunter’s parameters [28,29]. The hydrogen-bond parameters, α (hydrogen-bond donor) and β (hydrogen-bond acceptor) were determined using maxima and minima on the MEPS, respectively (Equations (1) and (2)), and the free energy of interaction is given by the product, −α β [28]. Only conventional hydrogen-bonds donors (pyrazole N-H, O-H) and acceptors (O=C, pyridine, pyrazole N) were included. In the HBE approach, both single-point interactions and two-point interactions (dimeric synthons) were considered.
2.3. Hydrogen-Bond Propensity (HBP)
The hydrogen-bond propensity (HBP) is the probability of formation of an interaction based on defined functional groups and fitting data [44,46]. Possible values fall in the range of zero to one, where a value closer to zero indicates less likely occurrence and a value closer to one indicates a higher likely occurrence of an interaction in the given molecule.
2.4. Hydrogen-Bond Coordination (HBC)
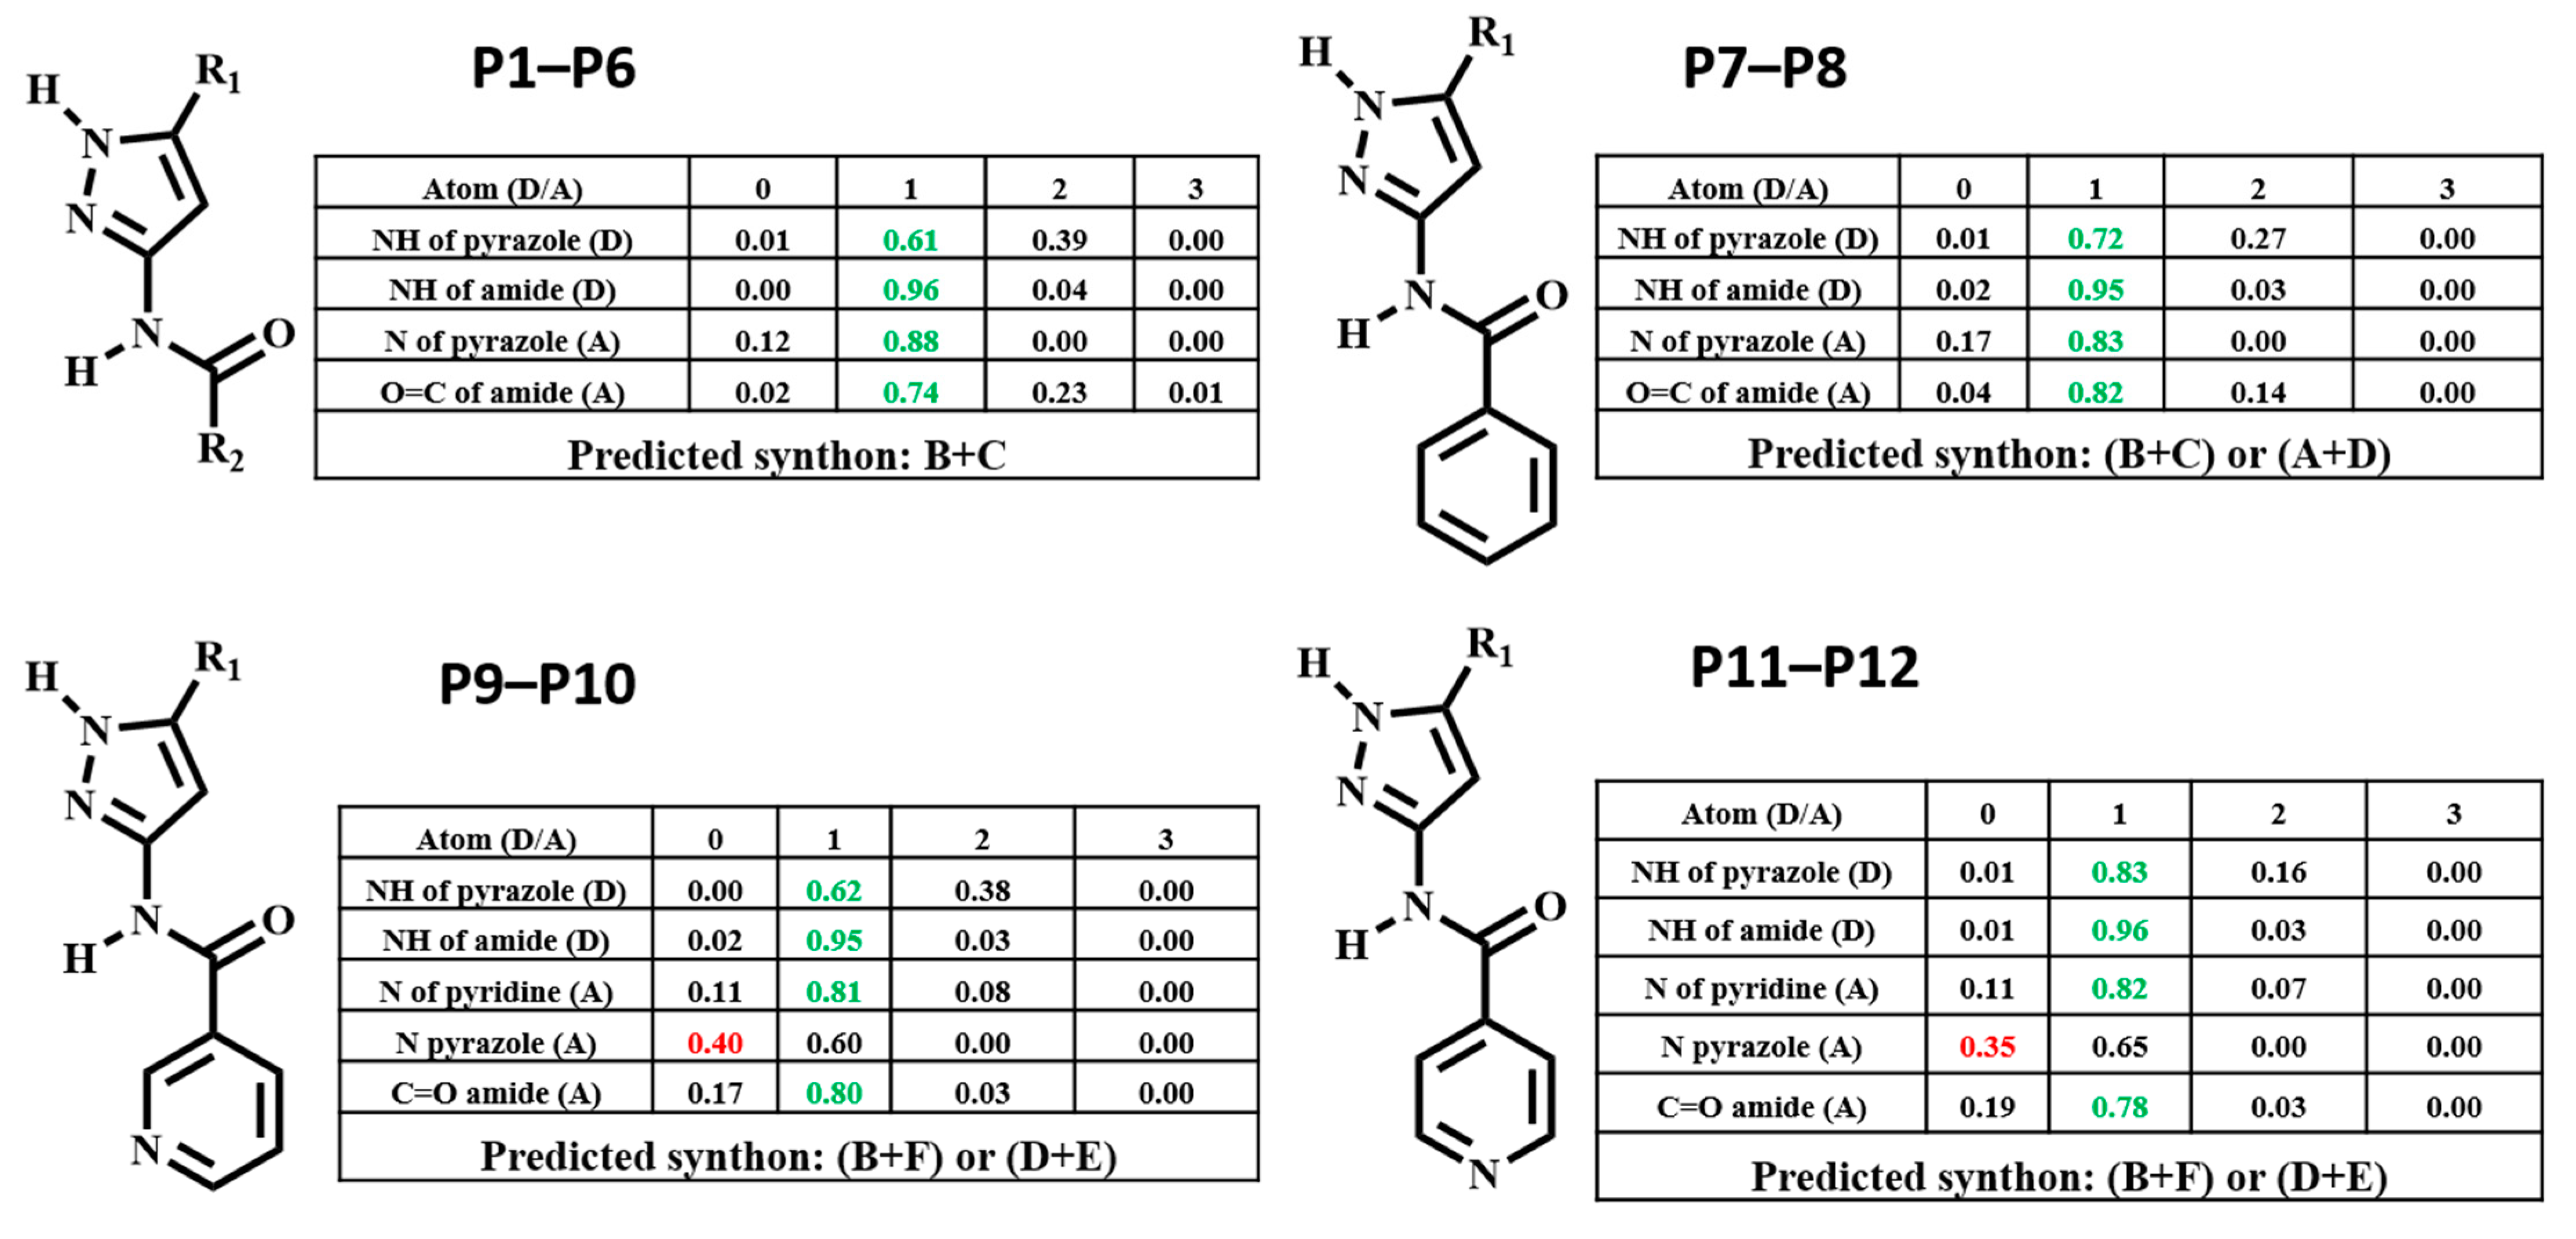
The hydrogen-bond coordination (HBC) is the probability of observing a coordination number for any given hydrogen-bond donor/acceptor atom [45]. The coordination number (CN) is defined as the number of intermolecular hydrogen-bonds formed between a donor and an acceptor. =0, =1, =2, =3 denotes the number of times a functional group donates or accepts. The CN with the highest probability corresponds to the most optimal (likely) hydrogen-bond interaction. The numbers that are colored relate to the outcome present in the selected H-bonding network, if this is green it indicates that the outcome is optimal, whereas if it’s red that indicates the outcome is sub-optimal.
3. Results
3.1. Molecular Electrostatics Potentials
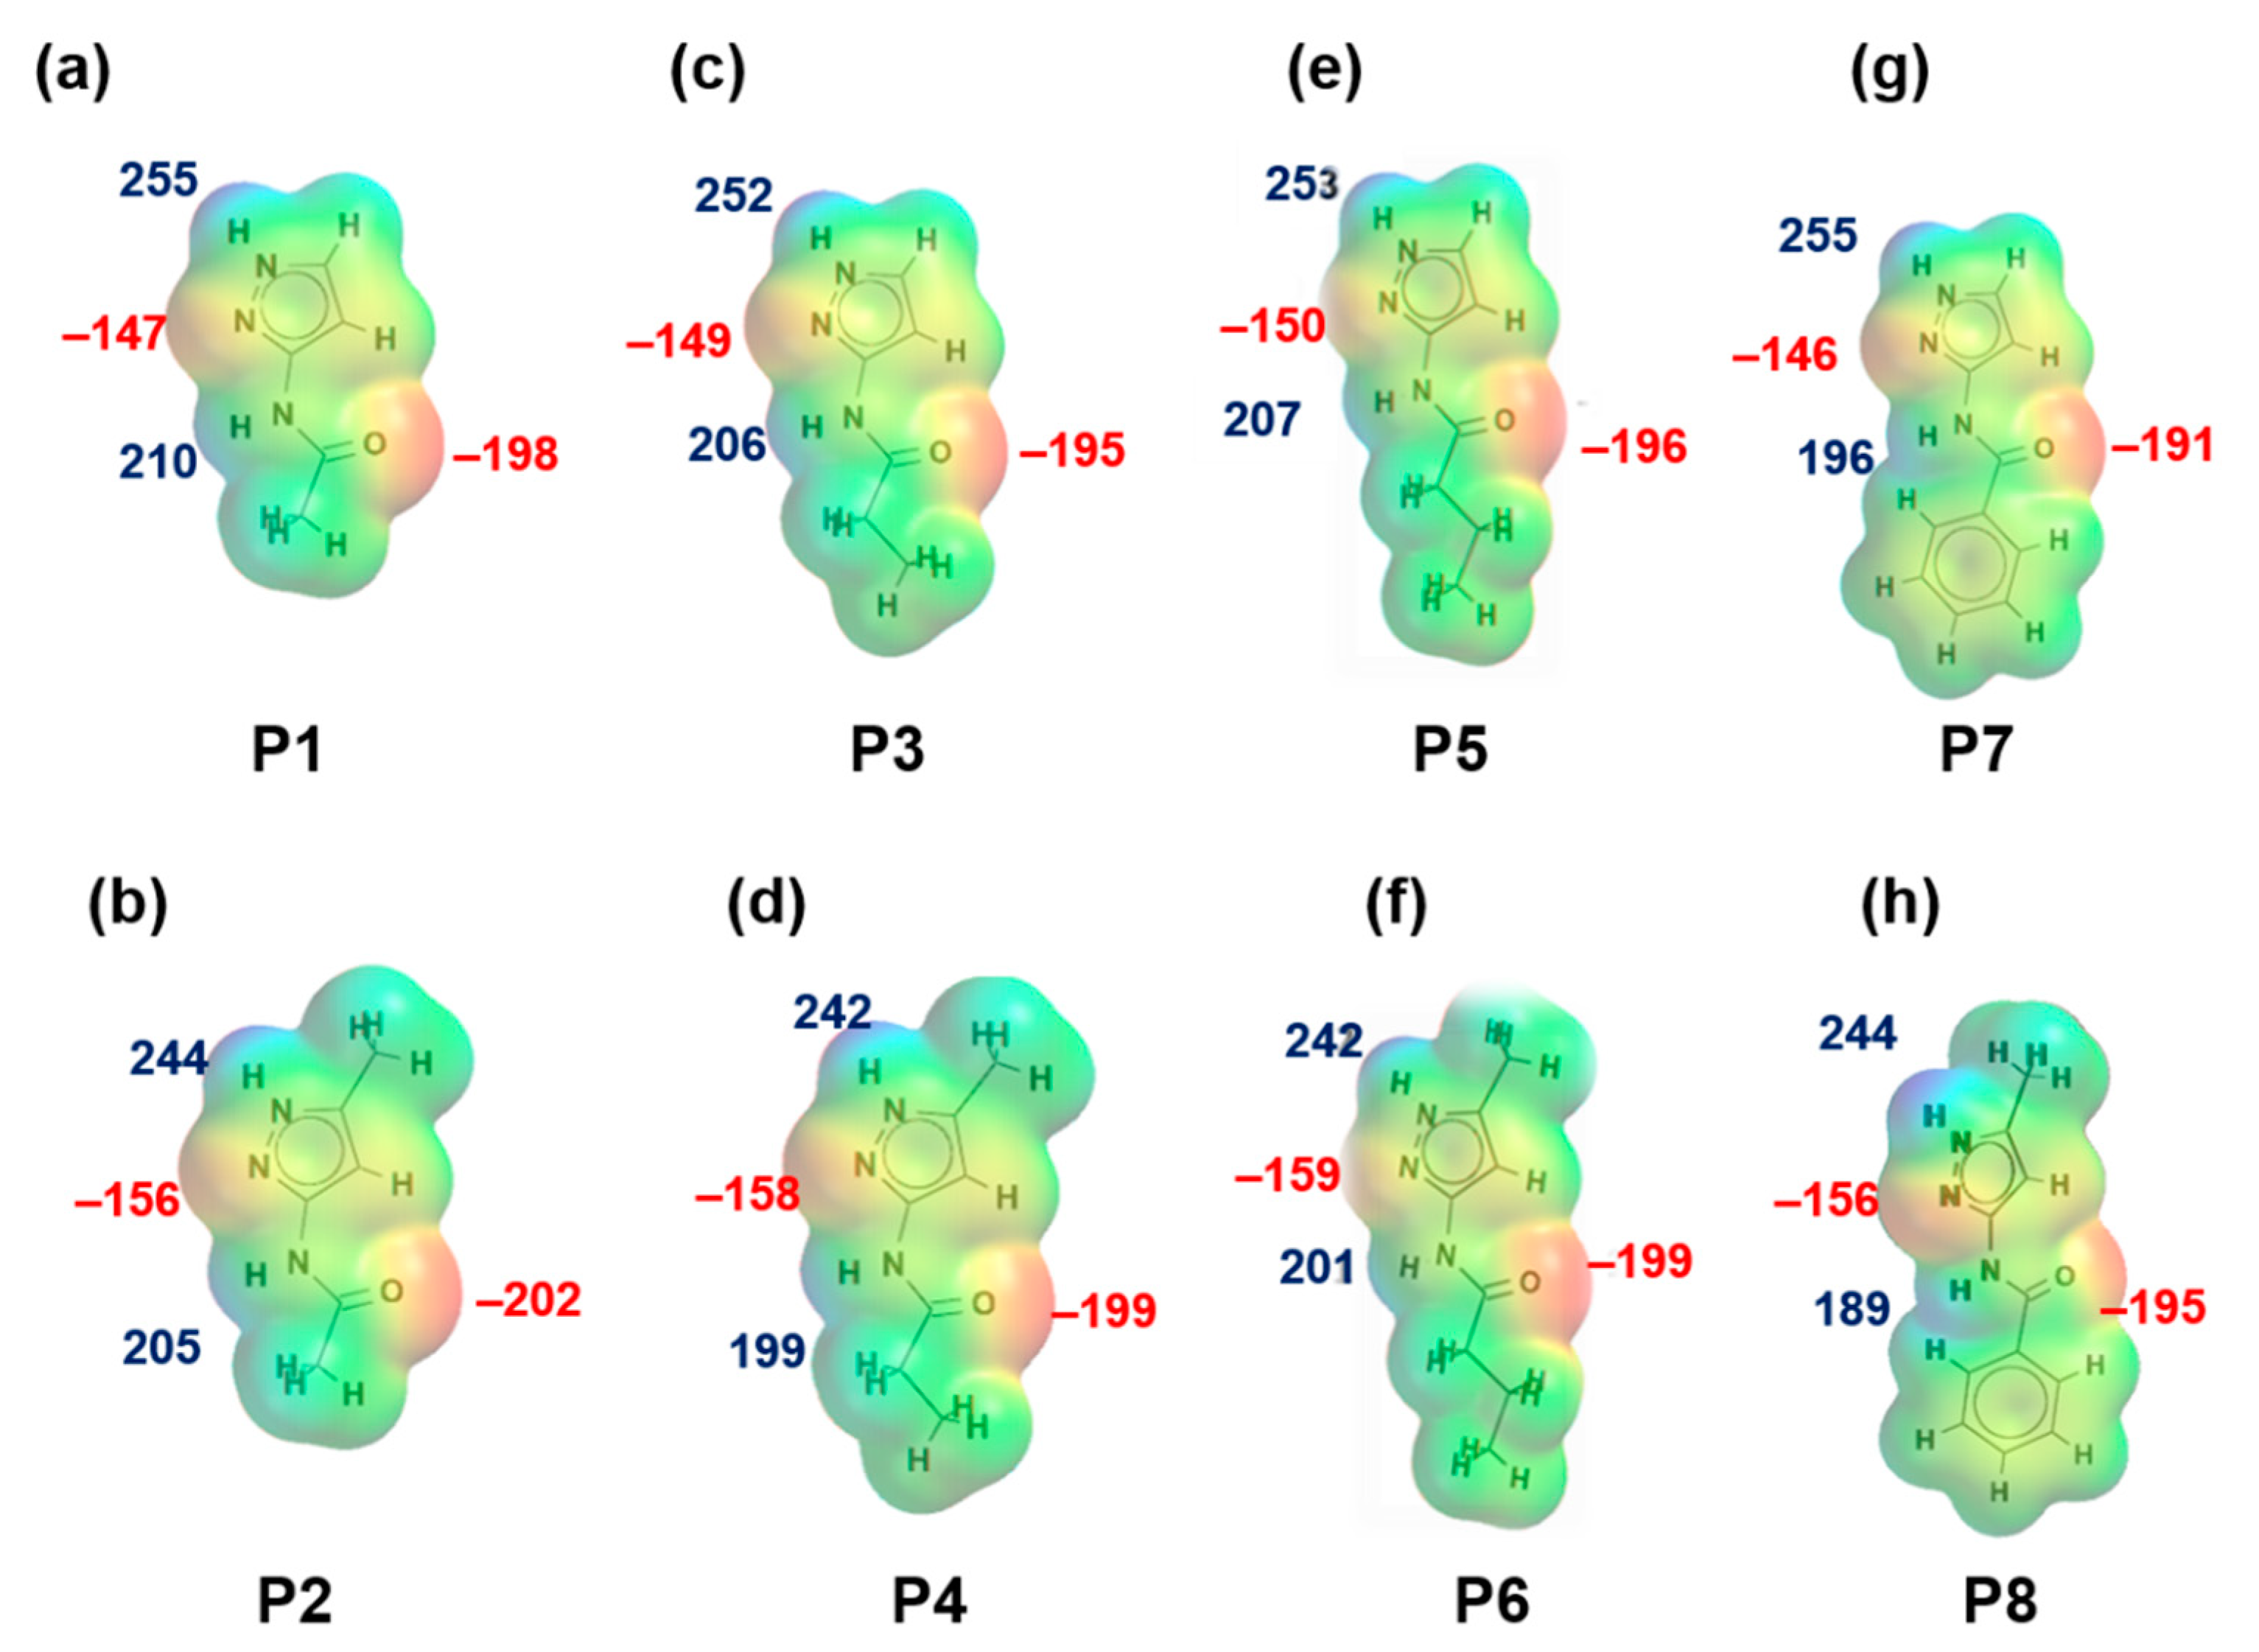
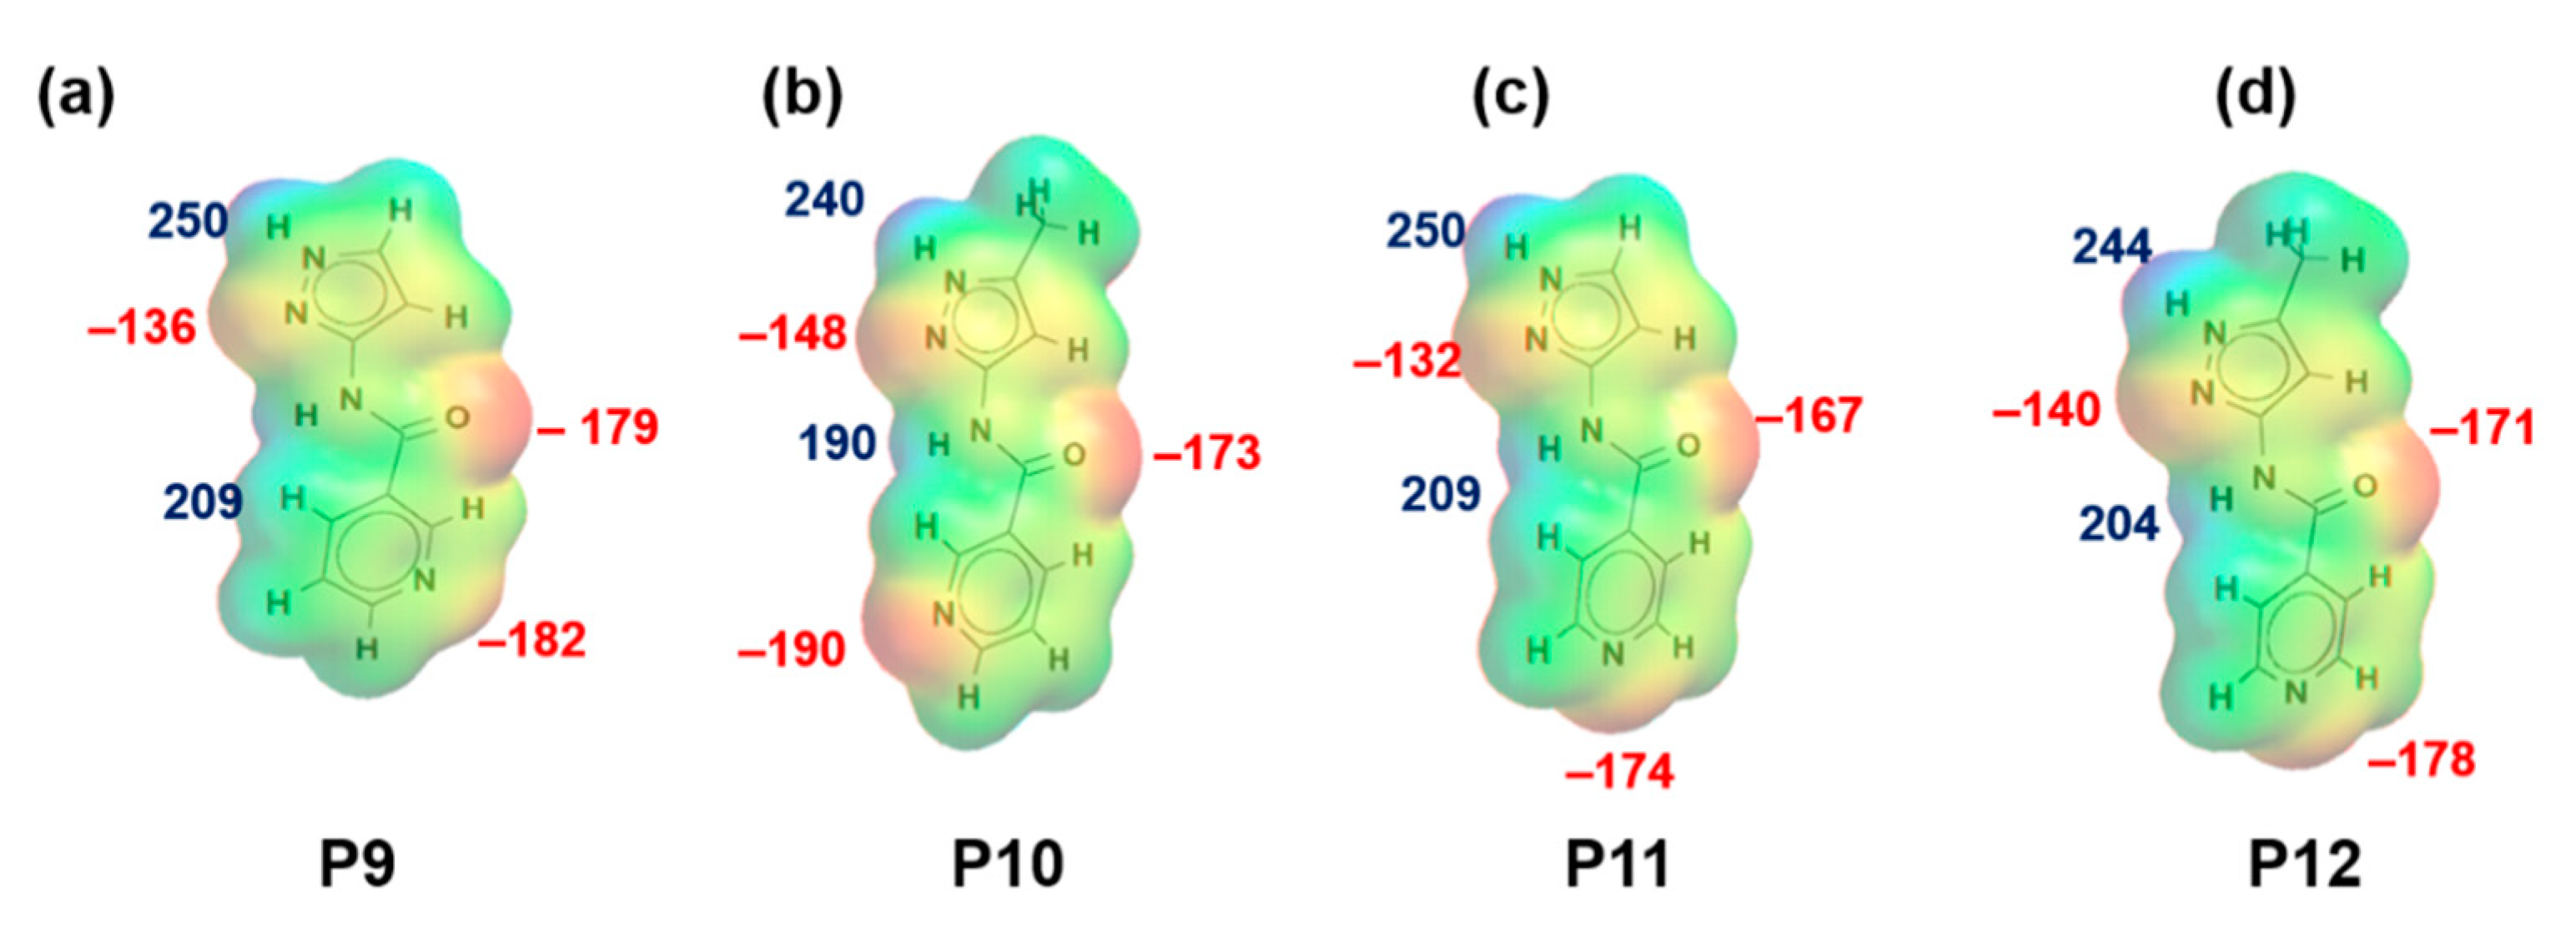
MEPs values for each hydrogen-bond donor (pyrazole NH and amide NH) and hydrogen-bond acceptor (pyrazole N, C=O (amide)) for P1–P8 (and additional pyridine N for P9–P12) are presented in Figure 1 and Figure 2, respectively. In group 1 (P1–P8), pyrazole NH is the best donor and C=O (amide) is the best acceptor (as ranked by electrostatic potentials) followed by amide NH and pyrazole N, therefore we can postulate that B + C is the most likely synthon. In group 2 (P9–P12), pyrazole NH is the best donor and pyridine N is the best acceptor followed by amide NH and C=O (amide), therefore D + E is the most likely synthon.
3.2. Hydrogen-Bond Energies (HBE)
Hydrogen-bond energies for each combination of synthons is presented in Table 1, See Supporting Information (SI) for additional details. Based on hydrogen-bond energies, in P1–P8, both A + D and B + C have very similar energies, and thus they can be expected to have equal chances of appearing. Based on a similar analysis, in P9–P12, A + F, A + D, and C + E, are equally possible.
3.3. Hydrogen-Bond Propensities (HBP)
The propensities calculations consider all possible interactions between two donors (pyrazole NH and amide NH) and two acceptors (pyrazole N and C=O) resulting in four propensity numbers for P1–P8. In molecules with an additional acceptor, P9–P12, six different combinations of propensities are obtained. The propensities of individual (see Supporting Information (SI) for details) and combination synthon are presented in Table 2. Based on combination approach in HBP, the most likely synthons to appear in P1–P8 are A + D and B + C and for P9–P12, synthons A + F and B + F.
3.4. Hydrogen-Bond Coordination (HBC)
HBC was calculated for each molecule, and the highest donor Coordination Number (CN) was matched with the highest acceptor CN in each molecule to determine the most likely synthon, Figure 3. Synthon (B + C) in P1–P6, (B + C) and (A + D) in P7–P8, (B + F) and (D + E) in P9–P12 were predicted to be the most likely synthon.
3.5. Experimentally Observed Crystal Structures
Suitable crystals of P1, P2, P3, P4, P7, P8, P10 and P11 were obtained by slow solvent evaporation method using methanol solvent. Few other solvents such as ethanol, THF, ethyl acetate etc. were tried to grow crystals for P5, P6, P9 and P12 with no positive hit. We obtained crystallographic data for eight (P1, P2, P3, P4, P7, P8, P10 and P11) out of twelve molecules. Our re-determination of the structure of P2 was consistent with the reported structure in the CSD (ARAGUV) [64] and the crystal structure of P8 is also reported in the CSD (PESQEK) [65], Figure 4 and Figure 5.
In group 1, six out of eight crystal structures (P1–P4, P7 and P8) were obtained. In five of the six, B + C was observed (P1–P4 and P7) and synthon (A + D) was found in P8. In group 2, when an extra acceptor group was added to the benzyl group, two crystal structures were obtained (P10 and P11). Synthon (A + F) is observed in P10 and (C + E) was observed in P11.
4. Discussion
4.1. Molecular Conformational Analysis
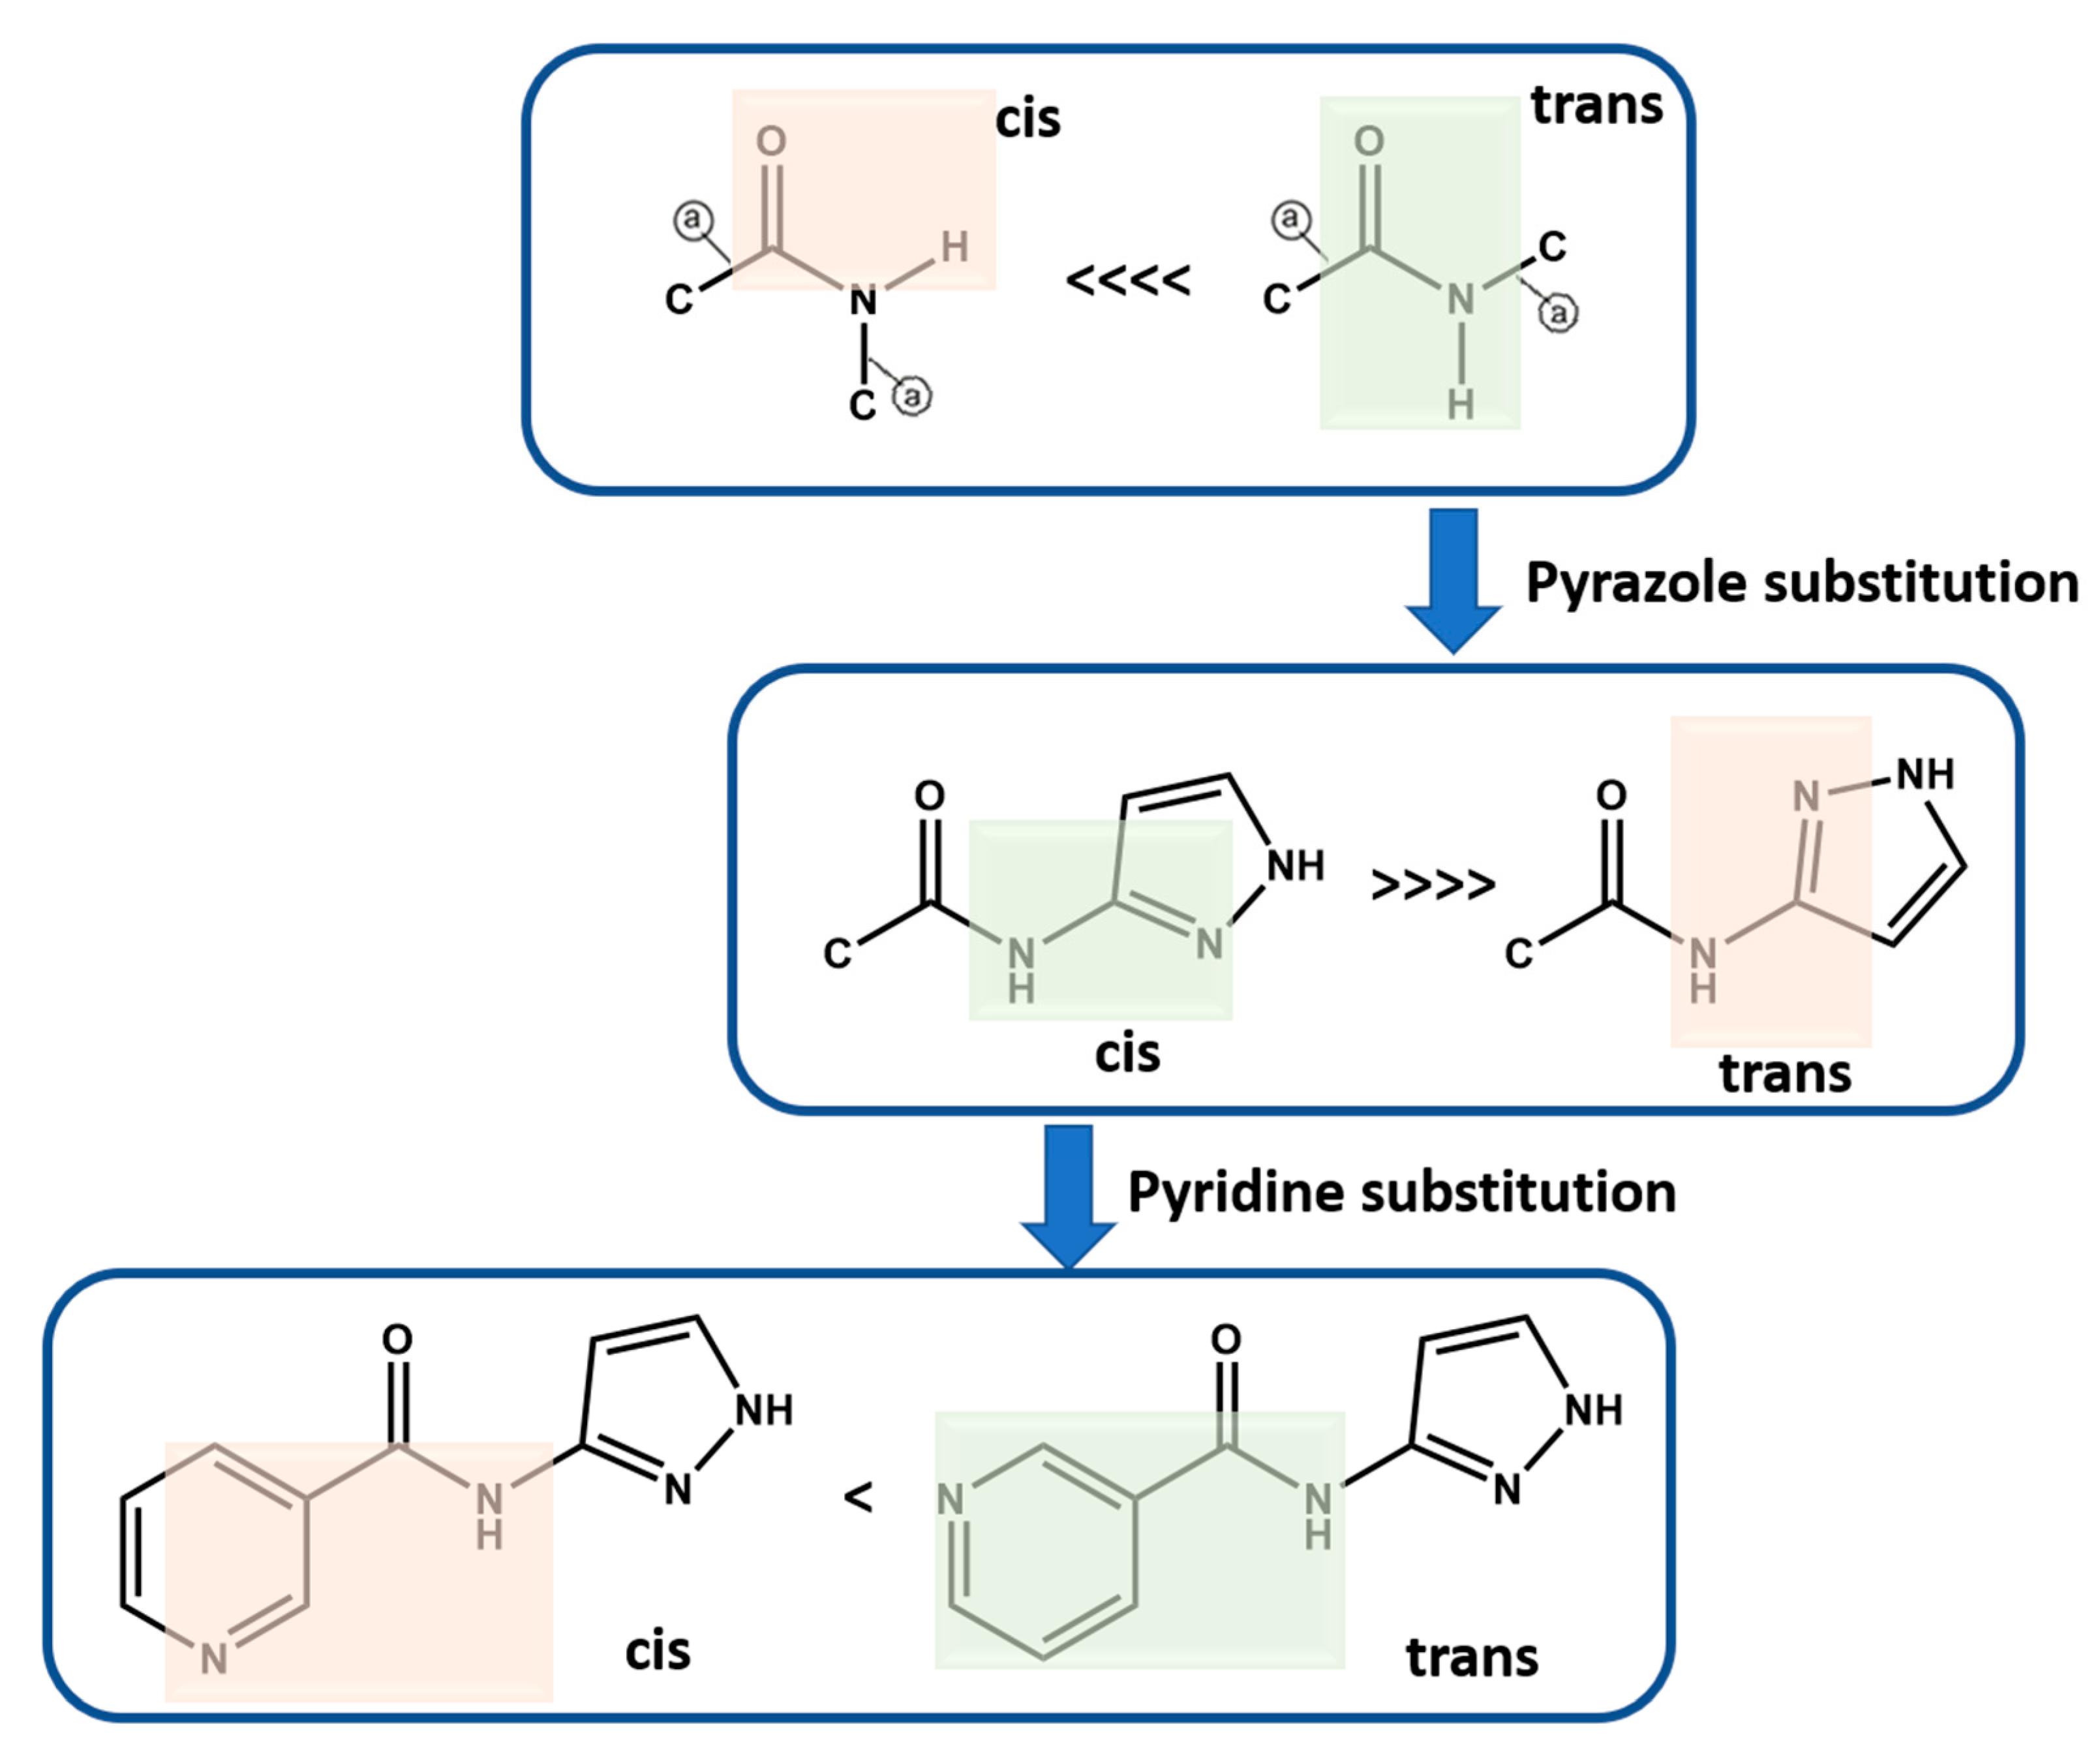
Molecular conformational analysis using DFT B3LYP (6-311++G** basis set in vacuum) shows that P1–P12 with amide functionality occur as trans instead of cis isomer as the stable conformation, which was further confirmed based on a CSD search (Scheme 5, See Supporting Information (SI) for details). When a pyrazole group is added to the amide functionality, the most stable conformation is when pyrazole functional groups are cis to the amide NH group. When meta-substituted pyridine is added to this group, the more stable conformation is when pyridine N is trans to the amide NH group. However, the second conformation is only ~4 kJ/mol higher in energy and therefore is observed in P10. It is worth noting that the energy optimized conformations are not necessarily completely identical to those that may appear in the solid state, where a variety of close contacts and packing forces may distort some geometric parameters away from idealized gas phase values. However, these idealized conformations are likely to be most relevant in the solution phase at the point when target molecules begin to recognize and bind to each other during nucleation and growth (Scheme 5, See Supporting Information (SI) for additional details).
4.2. Prediction Analysis
Four different methods (MEPs, HBE, HBP, and HBC) were used to predict synthons in group 1 and group 2 molecules.
In group 1 (P1–P8), Synthon (B + C) was predicted by all four methods, however, synthon (A + D) was predicted by HBE and HBP method. In group 2 (P9–P12), A total of six synthons (A, B, C, D, E and F) and six different combination possibilities (A + F, A + D, C + E, B + C, D + E and B + F), made it complex to predict such synthons. In group 2, (D + E) was predicted by MEPs and HBC. (B + F) was predicted by HBP and HBC. Synthon (A + F) was predicted by both HBE and HBP. (C + E) and (A + D) were predicted by HBE only (Figure 6).
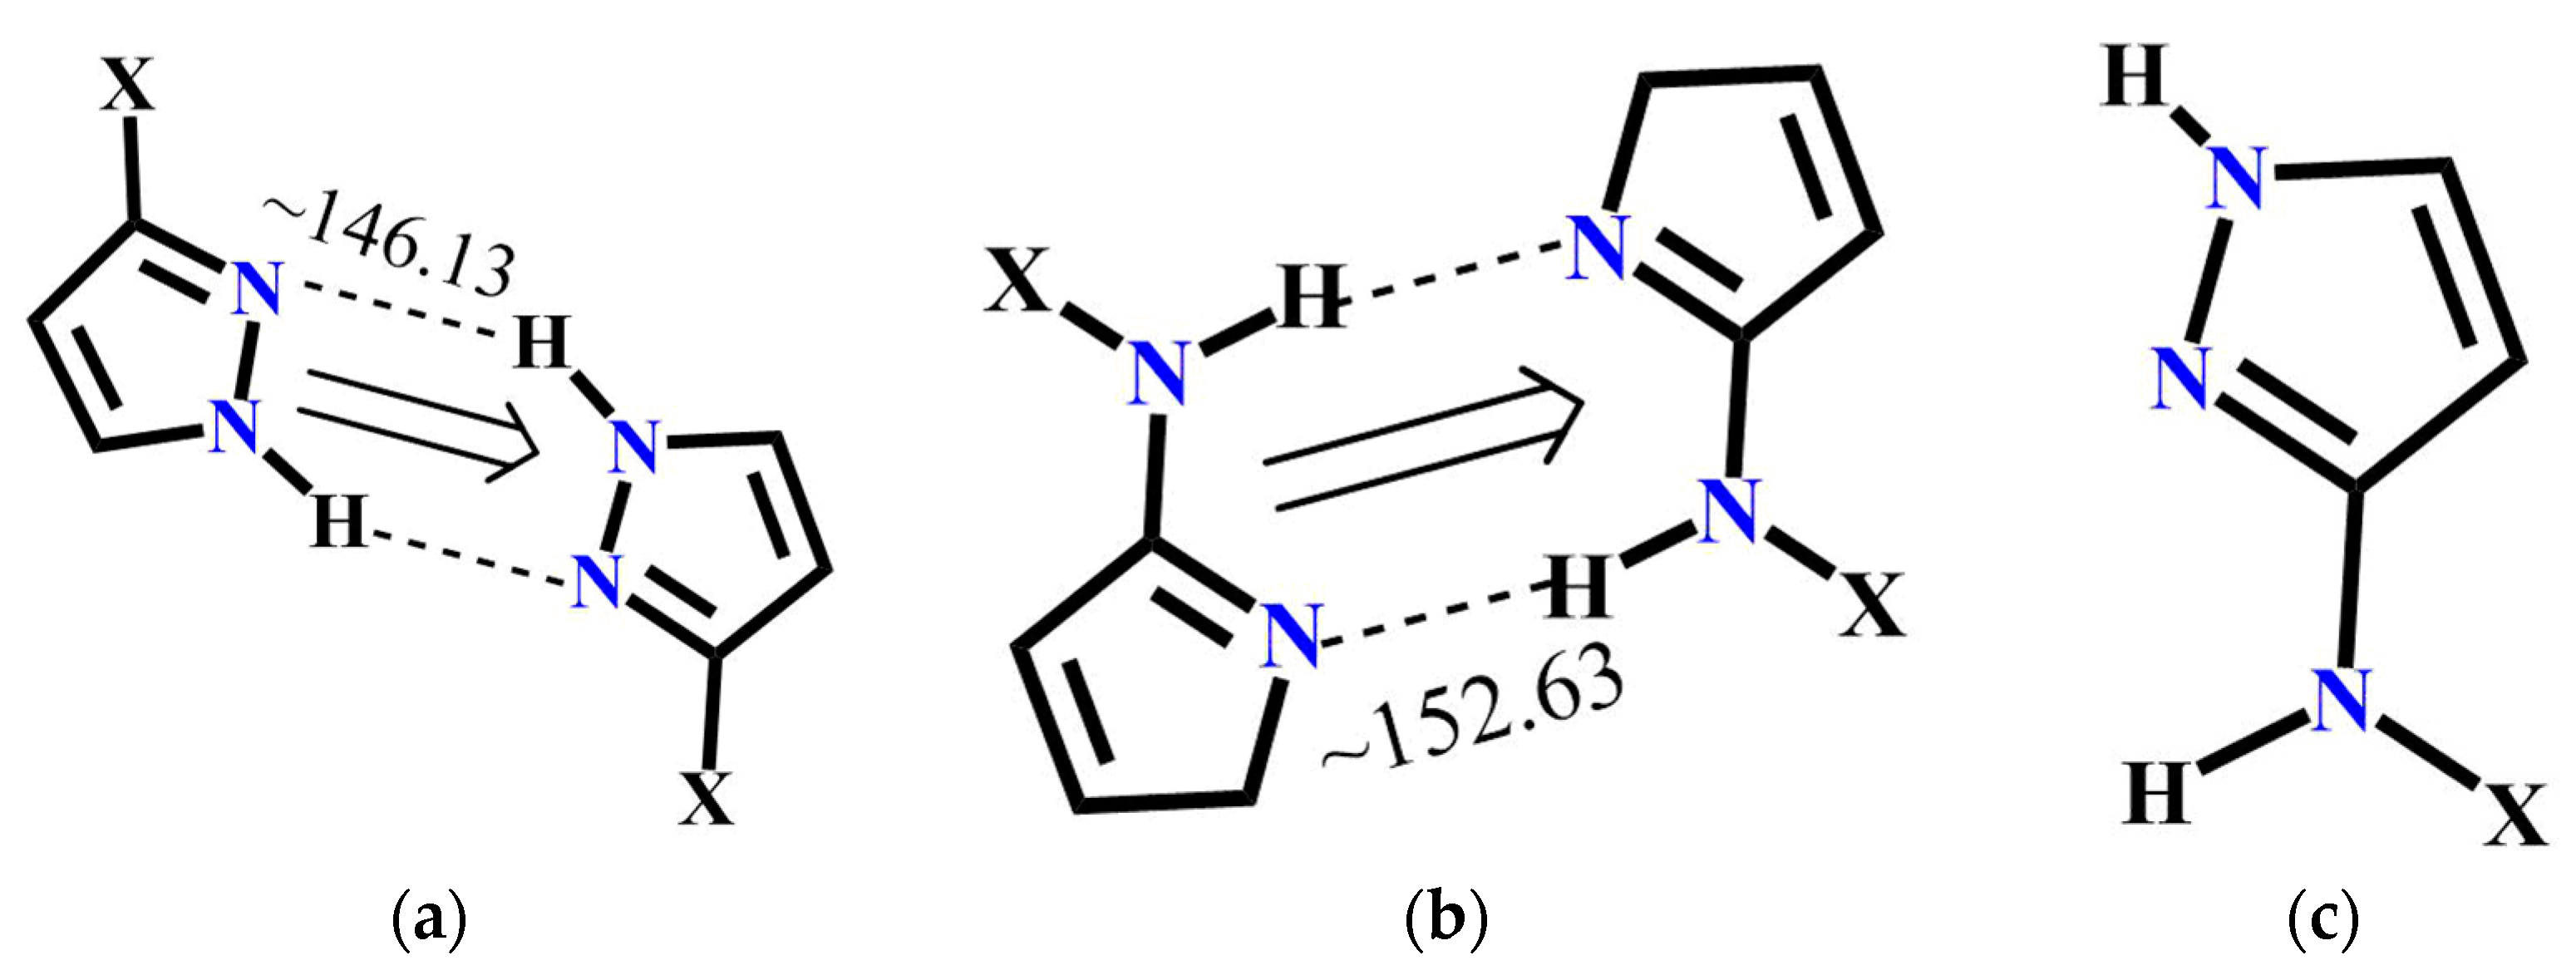
4.3. CSD Search-Molecular Geometric Complementarity
The molecular complementarity approach was used to determine whether synthon A or C is more likely to occur in pyrazole molecules with more than one binding site. The fragments used for CSD and resulting bond angles are listed in Figure 7. Based on this limited dataset, NH(amide)….N(pyrazole) interaction is more linear compared to NH(pyrazole....N(pyrazole) indicating that synthon C has a geometric preference over synthon A. Moreover, a search performed with similar pyrazole binding pockets in the CSD gave 12 hits and in every case, synthon C was preferred over A.
4.4. Validation Analysis
The comparison between the predictions from MEPs, HBE, HBP and HBC, and experimentally observed results is given in Table 3. In P1–P8 with two donors and two acceptor sites, B + C was predicted to be the most likely synthon by all four methods which was also observed experimentally in five of the six compounds, P1–P4, and P7. In P8, A + D was present which was predicted by HBE and HBP as a possible synthon. By increasing the number of acceptor choices to three in P9–P12 the challenge of getting the correct answer increased due to the enhanced possibility of synthon crossover and synthon polymorphism. In P10, A + F was observed but it was only predicted correctly by HBE and HBP. In P11, C + E was observed experimentally, and this was only predicted correctly by HBE.
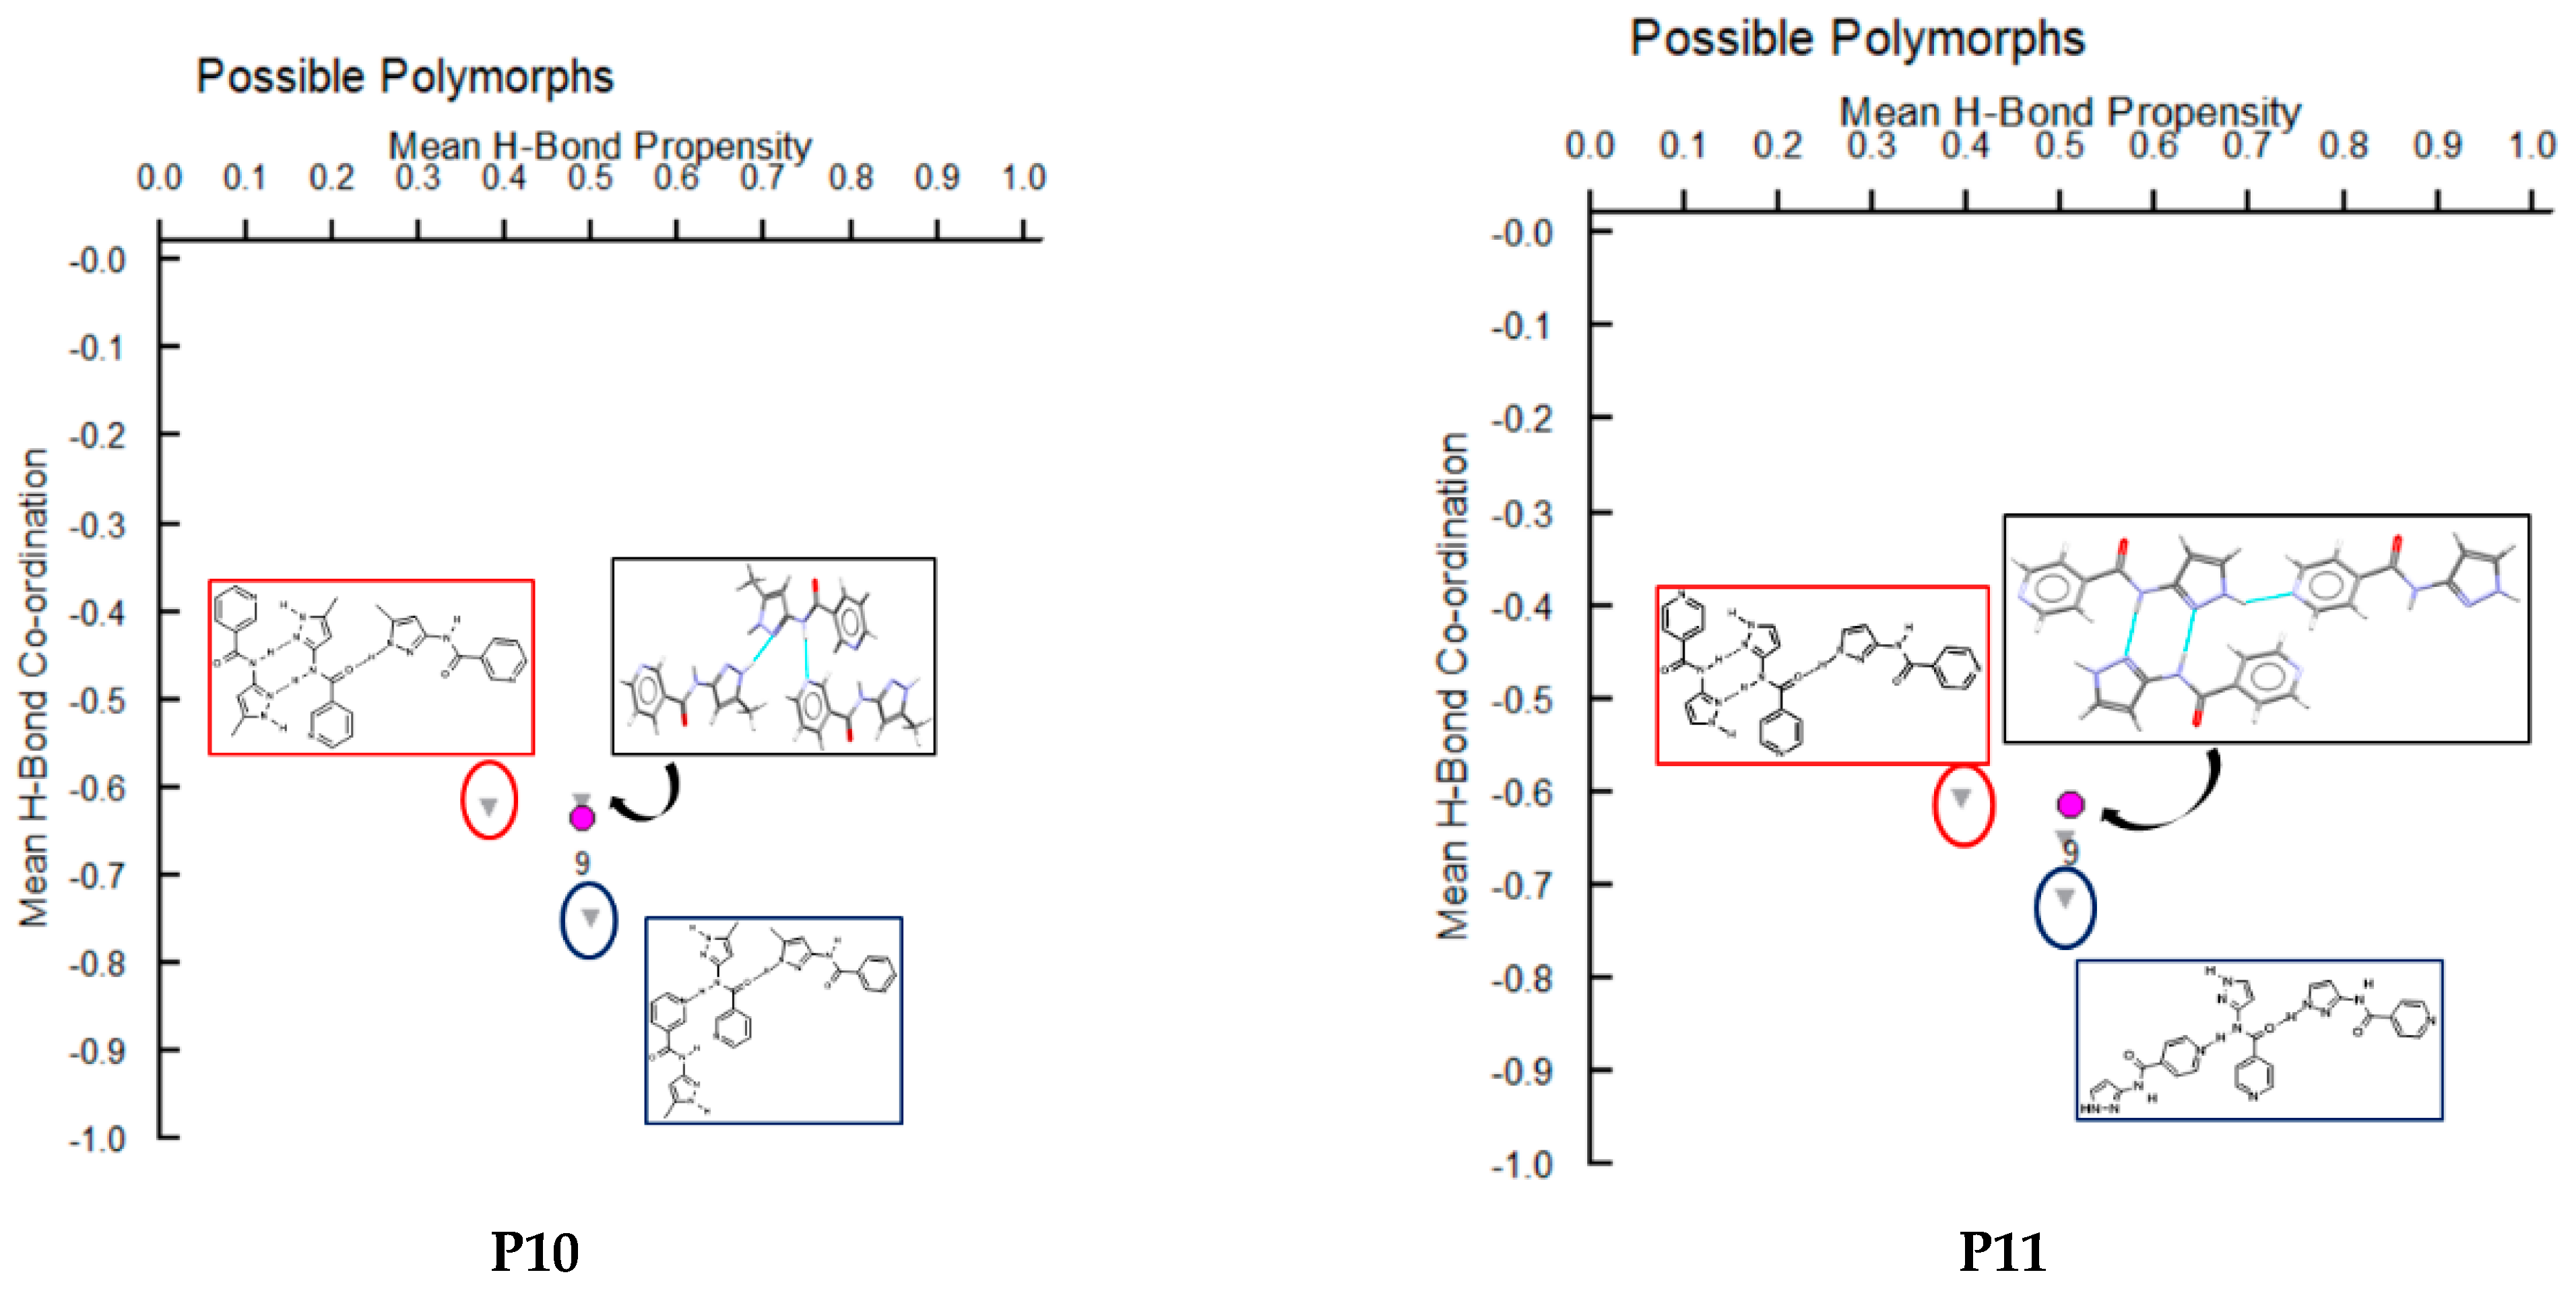
4.5. Polymorph Assessment of Experimental Structures
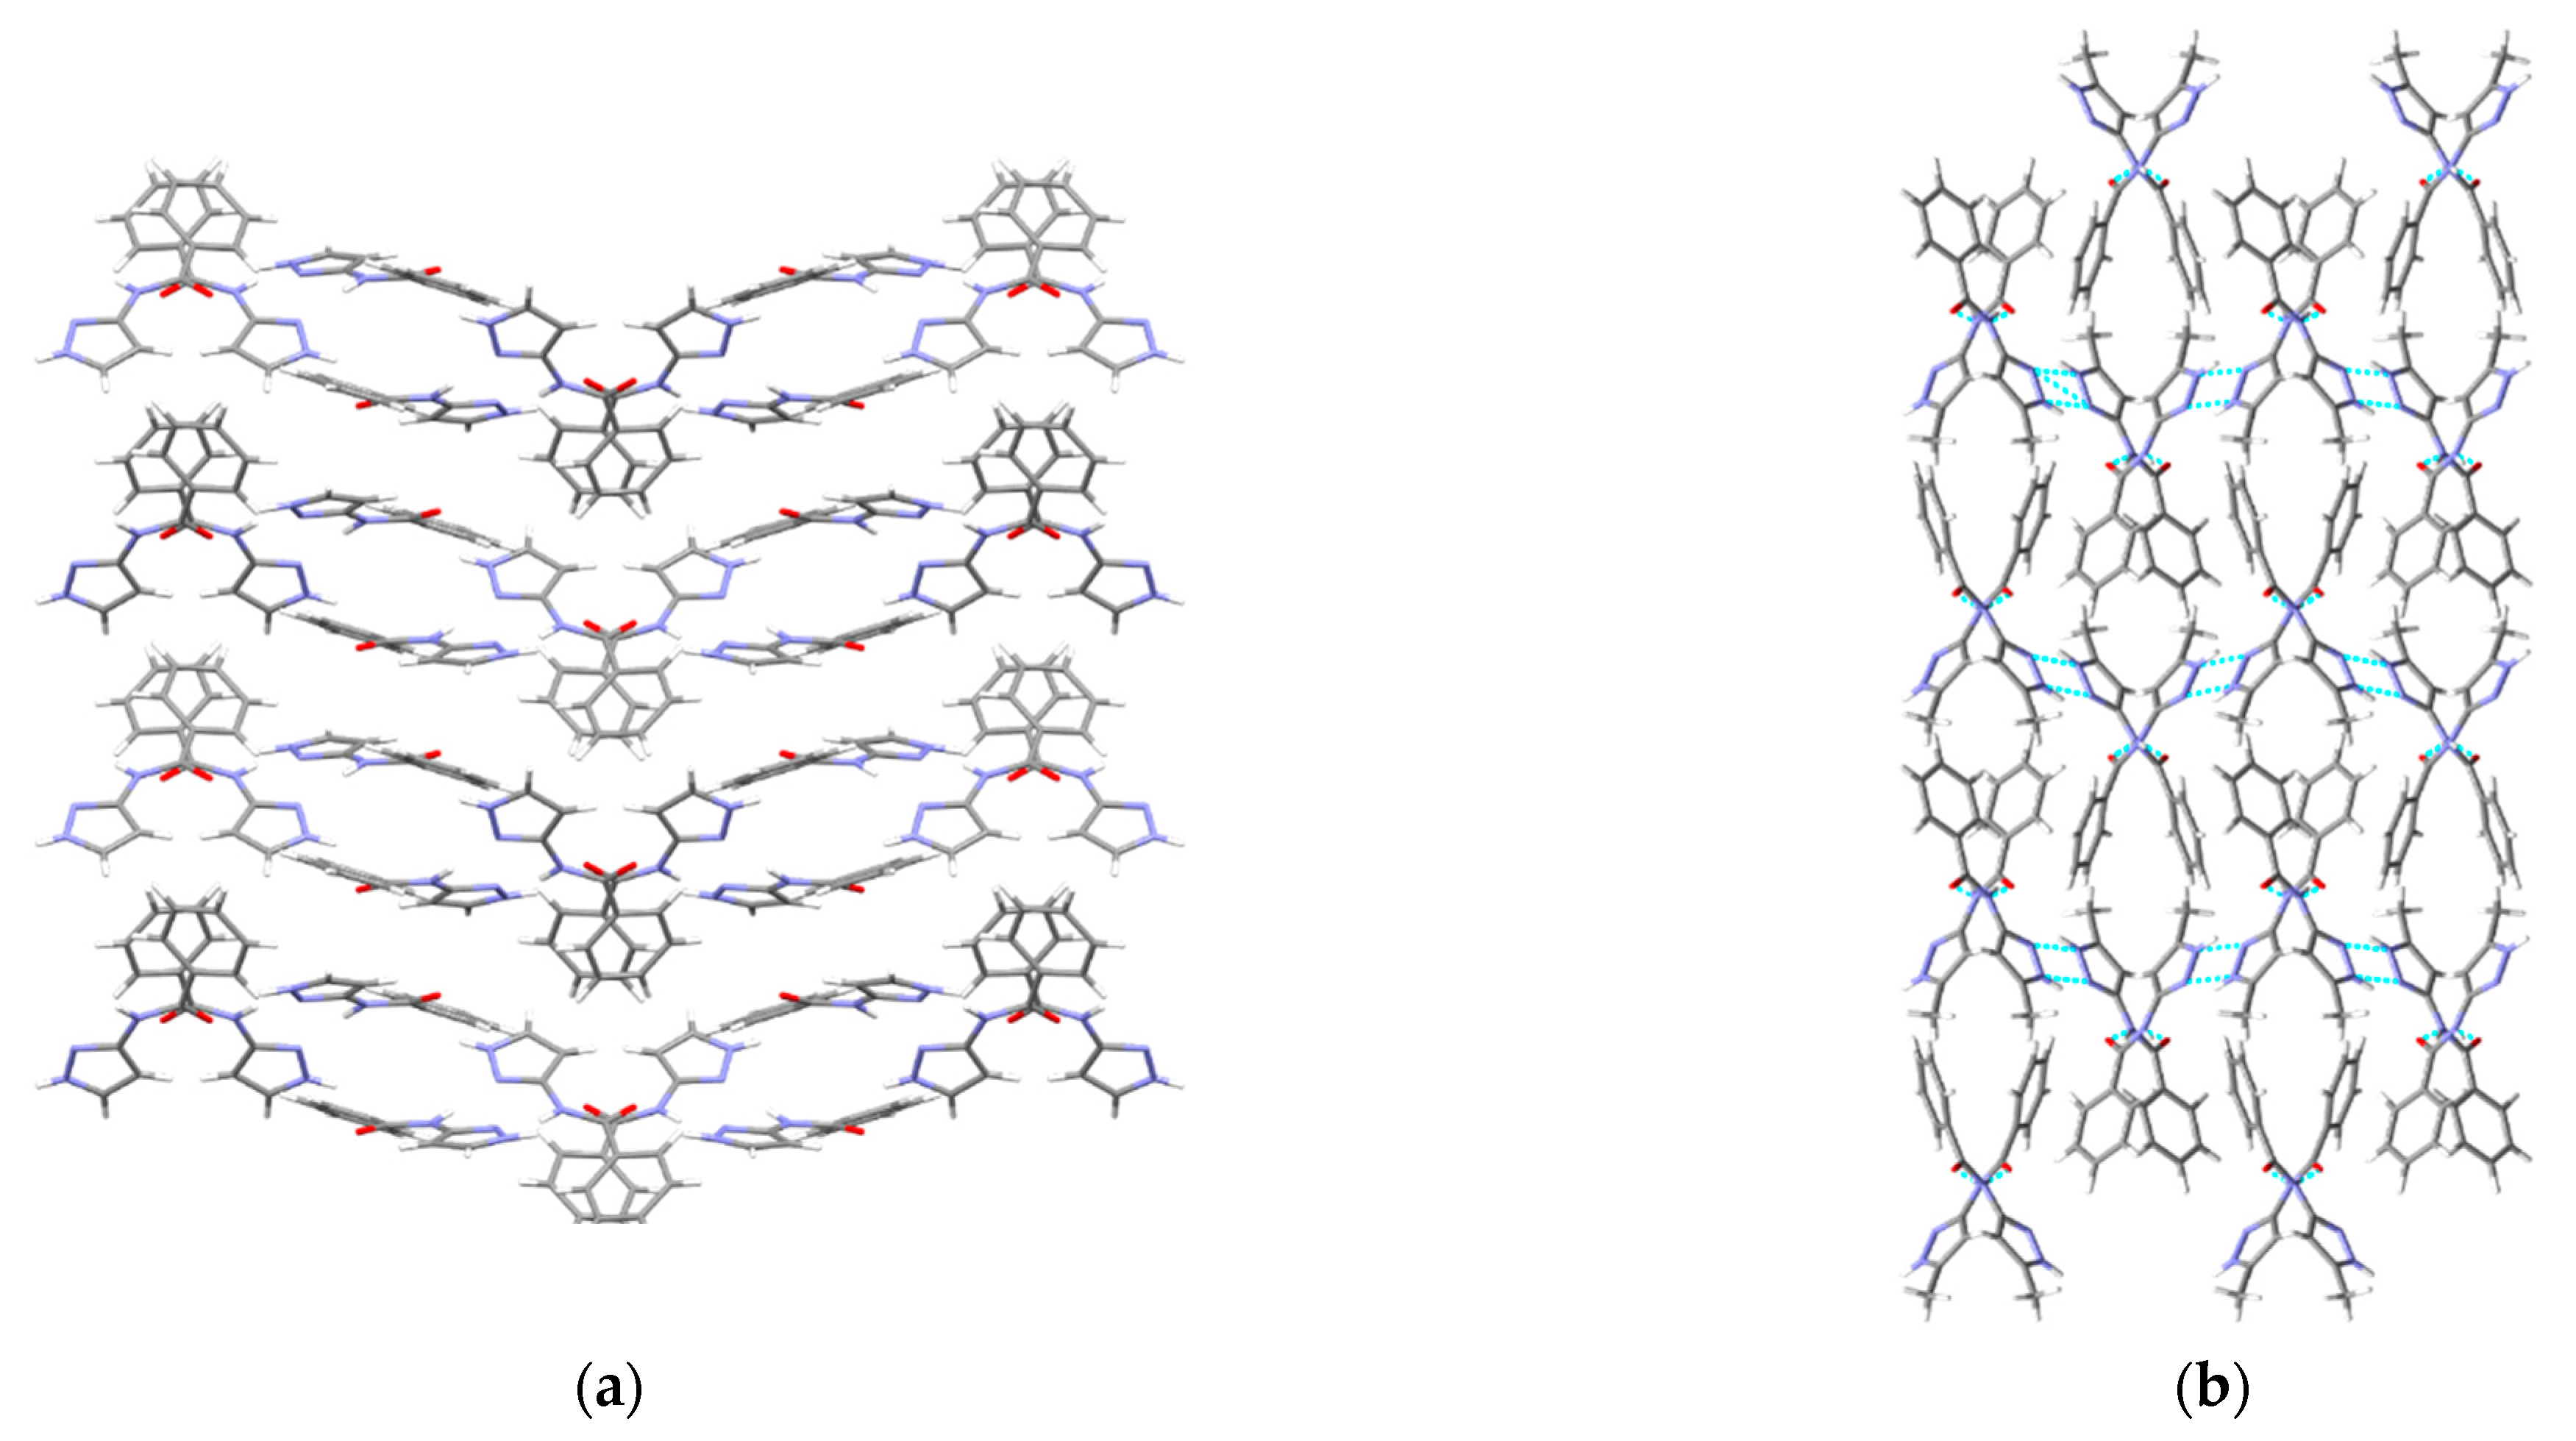
A hydrogen-bond likelihood analysis was performed to understand the risk of synthon polymorphism in these molecules with multiple binding sites. Experimental structure was imported into the predicted hydrogen-bond coordination table to compare it against the predicted structures. Hypothetical structures in this tool are generated based on the combination of HBP and HBC parameters for each molecule. A correlation of the HB propensity vs. the mean HB coordination for all putative synthons possible in the structure of a given molecule is plotted. The most likely synthons should be found in the lower right corner of the plot. In P1 (which is also a representative of P2, P3, P4, and P7), the experimental structure matched with the most likely synthon predicted by combined HBP an HBC. In P8, P10 and P11, the experimental structures do not contain the most likely synthon predicted by a combination of HBP and HBC, highlighting the possibility of other structures with more optimal hydrogen-bond patterns, which indicates a reasonable risk of polymorphism in these three compounds. In P8, B + C was predicted by all four methods to be the most likely hydrogen bond, yet A + D was observed experimentally. Interestingly, this structure leads to a polymeric structure as reported by Daidone et al. [65], Figure 8.
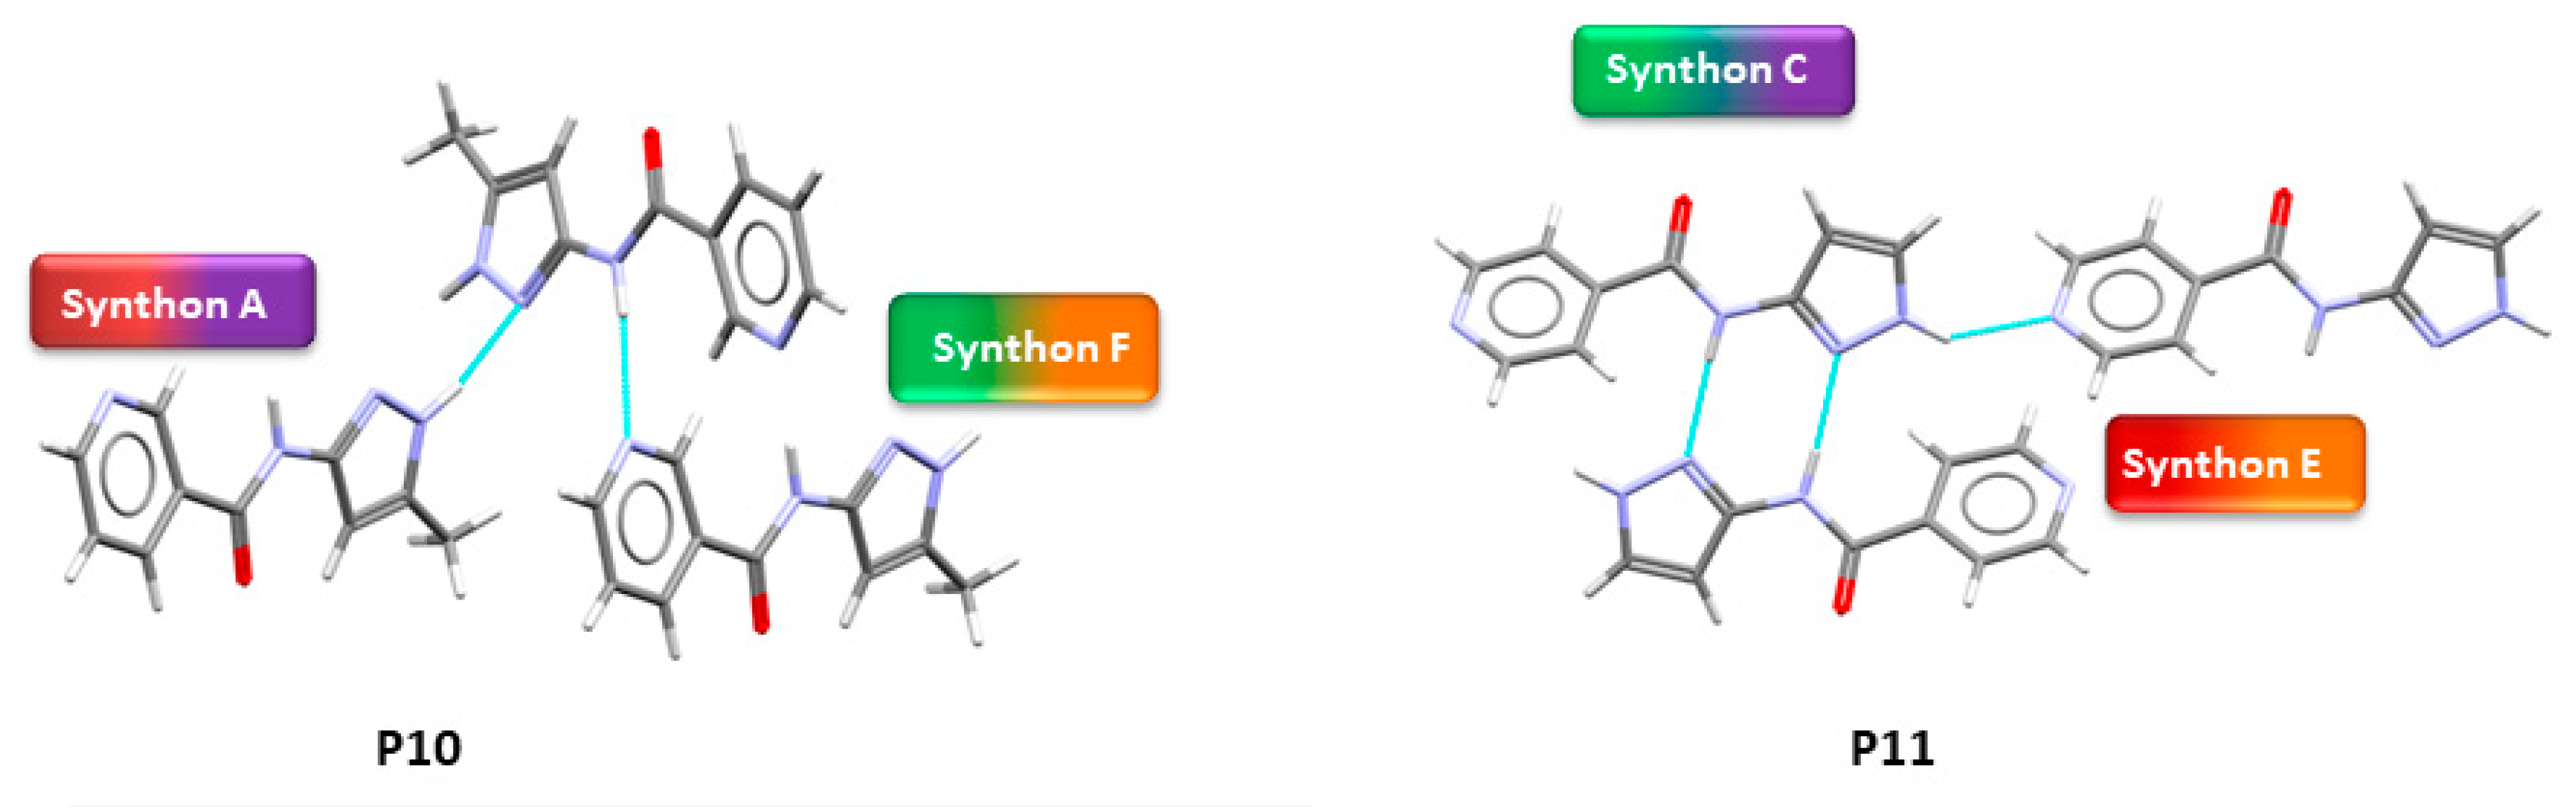
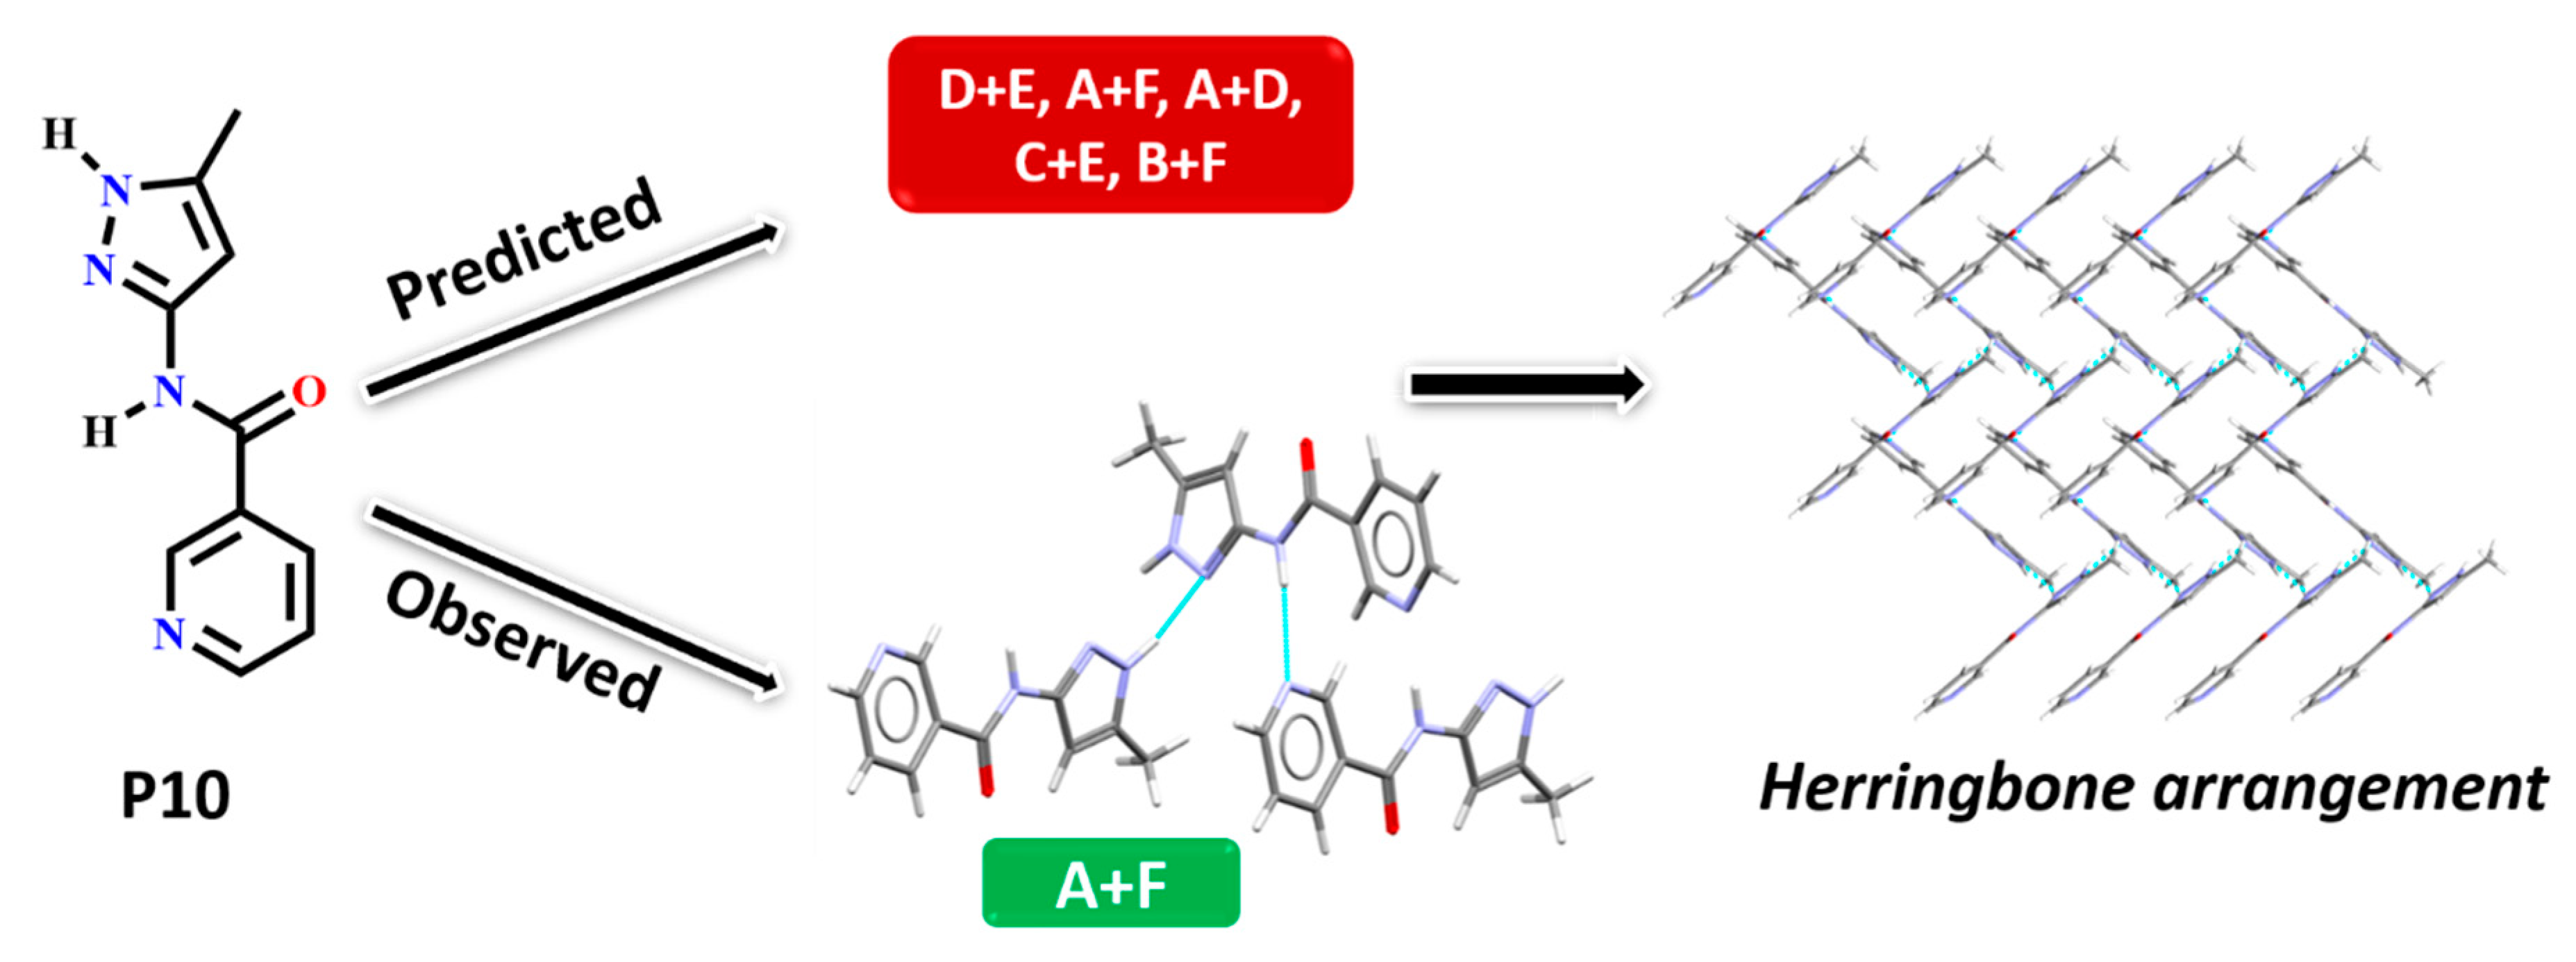
In P10, multiple synthons were predicted by different methods, such as D + E, A + F, A + D, C + E and B + F. However A + F is in fact observed experimentally (and accurately predicted by HBE and HBP methods). These results indicate that even though A + F is geometrically constrained, as seen in CSD search, it can still form experimentally. Due to steric hindrance with meta-substituted pyridine, synthon A is observed as single-point interaction instead of dimeric synthon, resulting in a herringbone type arrangement, Figure 9.
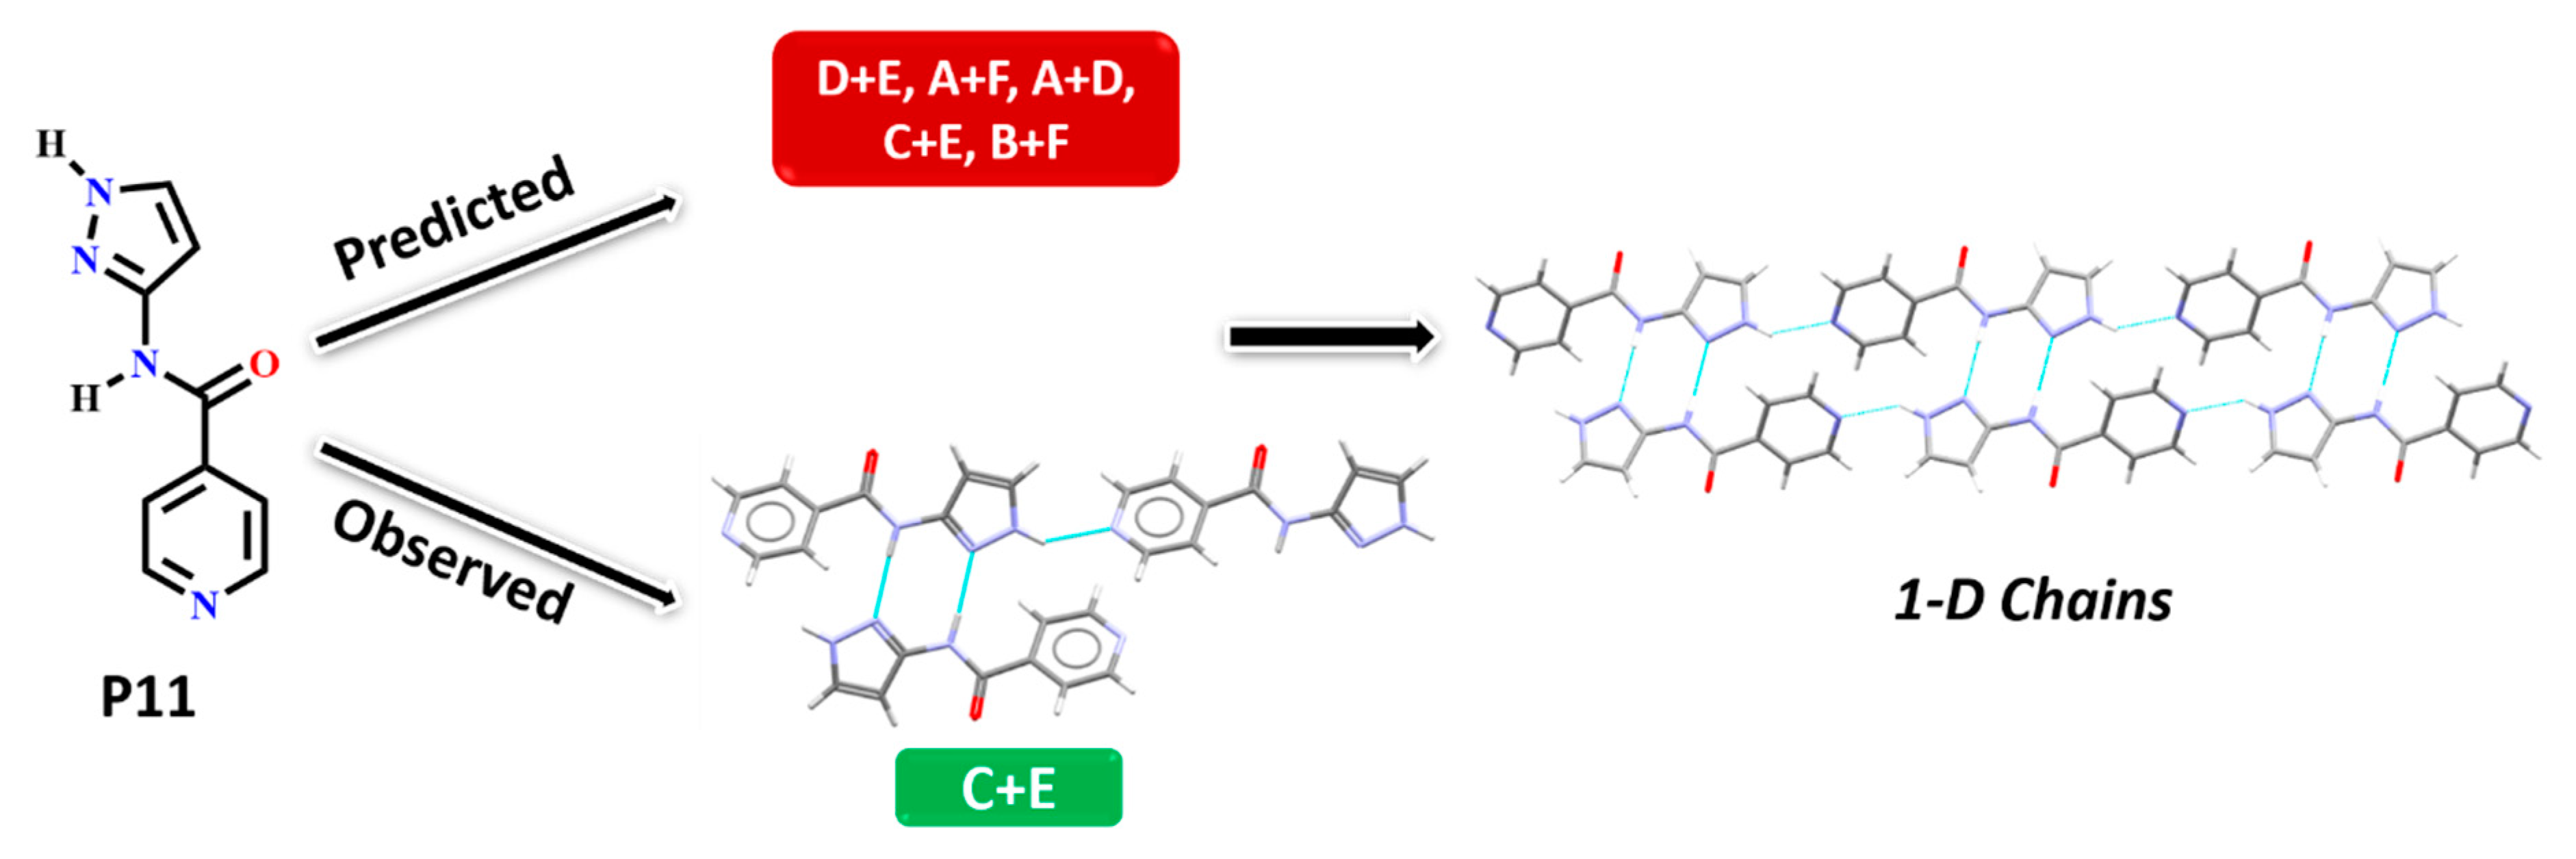
In P11, experimentally observed synthon C + E was predicted correctly only by the HBE method, in addition, it was not deemed to be the most likely interaction by the hydrogen-bond likelihood analysis. This is less surprising as synthon C is the most likely synthon among all possibilities due to its linearity and dimeric chelate effect, leaving E as an alternate option because the pyridine nitrogen atom is a better acceptor than the C=O moiety, Figure 10.
Additionally, molecules for which crystal structure was known were screened through hydrogen-bond coordination likelihood analysis to understand the risk of synthon polymorphism. This tool suggested that three out of eight molecules (P8, P10, P11), where crystal structure is known, have a chance of synthon crossover and synthon polymorphism, Figure 11. This tool is particularly useful as it can guide chemists to narrow down list of APIs that are at risk of delivering new structural polymorphs, which can cause havoc in late-stage formulation efforts.
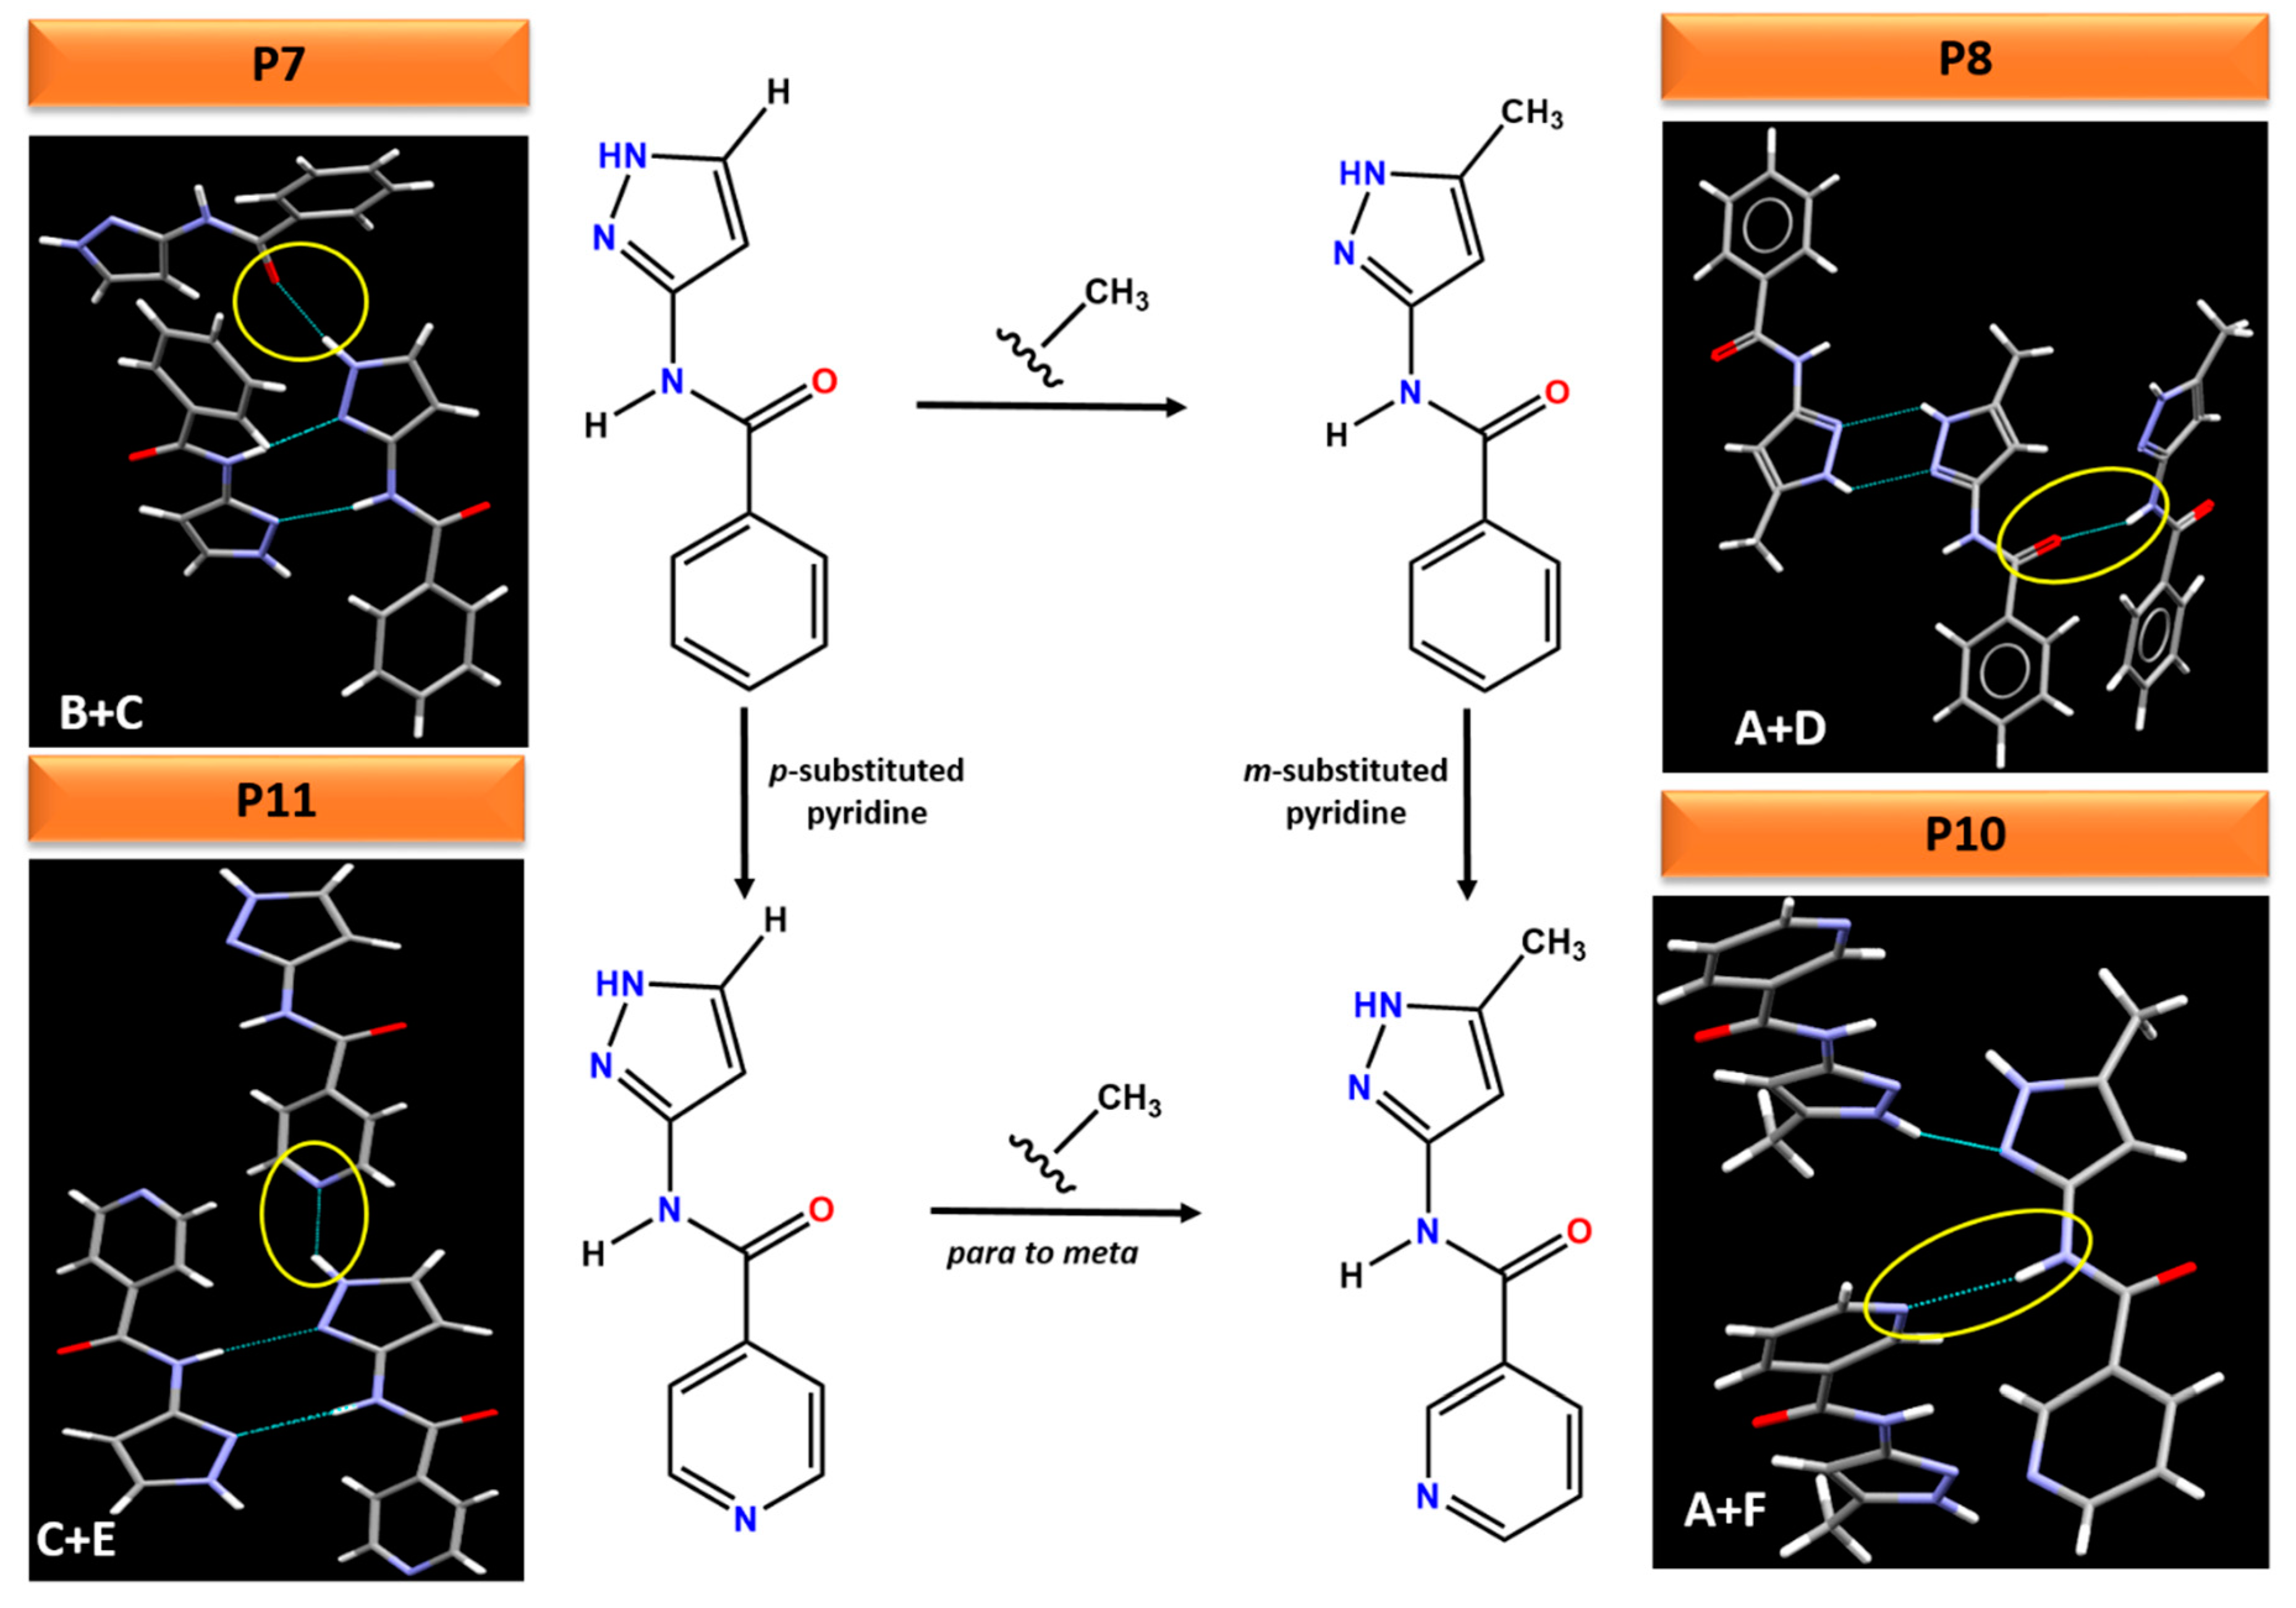
This work also highlights that small changes to a molecule can lead to profound changes in the hydrogen bonding, resulting in different packing arrangements in the crystal structure, Figure 12. For example, adding an electron donating methyl group to the pyrazole ring in P7 changes the synthon from (B + C) in P7 to (A + D) in P8. Comparing the electrostatic potential of P7 and P8, adding a methyl group decreases the charges on both H-bond donors (amide NH and pyrazole NH) whereas increase the charges on the H-bond acceptor (pyrazole N), highlighting these two molecules as a classic example of synthon crossover. The addition of pyridine (para or meta) group changes the ranking of H-bond acceptors in P10 and P11. Therefore, pyrazole NH and amide NH binds to pyridine N in P11 and P10 instead of C=O (as was observed in P7 and P8) respectively. The position of a substituent (meta vs. para) as well as addition of methyl group on the pyrazole ring also leads to different crystal packing. For example, changing the pyridine N from meta to para position and adding methyl group on the pyrazole ring changes the synthon from (A + F) in P10 to (C + E) in P11, resulting in varying packing arrangements.
Another key observation is the ability of hydrogen-bond propensity model to incorporate effect of aromaticity on the probability of hydrogen–bond interaction. For example, presence of aromatic groups such as phenyl and pyridine rings in molecules P8–P12 leads to higher values of donor and acceptor aromaticity (0.56) in the logistic regression model compared to molecules P1–P6 (0.27). This further impacts the final probability values where P1–P6 has higher HBP values for synthon B and D compared to P7 and P8, see Table 2 and Table S5 in Supporting Information for more details.
This study didn’t include extensive crystallization experiments to grow suitable crystals for P5, P6, P9 and P12 but it is possible that with further crystallization work, crystals of these molecules can be achieved. One of the reasons behind why P5 and P6 might be difficult to crystallize compared to P1–P4 is due to the presence of butyramide side chain which increases the number of rotatable bonds and hence number of conformations in the solution state. The possibility of multiple conformations very close in energy to each other can cause difficulties in crystallizing molecules by hindering the nucleation and crystal growth phase. Additionally, further crystallization work can also be done for molecules with risk of synthon polymorphism such as P8, P10 and P11 to validate the computational studies.
In this study, we examined two energy based, and two informatics-based protocols for predicting hydrogen—bond based synthons in crystal structures of a family of pyrazoles. The overall outcome gave the following ranking in terms pf predictive quality: HBE (100%) > HBP (87.5%) > HBC = MEPs (62.5%), Figure 13. Even though HBE is a step forward of MEPs method, it worked better than the latter in pyrazole based molecules because of inclusion of energies of dimeric interactions due to a chelating effect. It is important to note that even though pyrazole molecules studied in this work with high predictive success rate have with very limited structural diversity (<250 gmol−1 molecular weight, <3 rotatable bonds, limited functional groups), such models can be applicable to diverse and more flexible drug-like molecules with similar functional groups for prediction analysis. We encourage scientific community to test these CCDC provided tools on actual drug molecules to further understand their applicability and range of predictive ability of such tools.
5. Conclusions
One useful consequence of predicting a correct supramolecular synthon is the ability to predict the right crystal structure. Four prediction models based on molecular electrostatic potentials (MEPs), hydrogen-bond energies (HBE), hydrogen-bond propensity (HBP) and hydrogen-bond coordination (HBC) were studied for their ability to predict synthons in small pyrazole based targets, P1–P12. Molecules were grouped into categories based on number of conventional hydrogen-bond donors and acceptors, group 1 (P1–P8) and group 2 (P9–P12). In group 1, both HBE and HBP gave 100% success rate as predicted synthon matched with the experimental results for molecules P1–P4 and P7. However, when a strong acceptor group such as pyridine nitrogen was added as in P9–P12, synthon prediction became complex, so did the experimentally observed synthons. Only two crystal structures (P10 and P11) were obtained experimentally. HBE predicted the synthons correctly for both molecules whereas HBP predicted it correctly for P10. Additionally, hydrogen-bond coordination likelihood analysis suggested that P8, P10 and P11 are at risk of synthon crossover and synthon polymorphism based on the net putative interaction likelihoods. Methodologies used in this study are a valuable tool to determine which synthon is likely to form in the crystal structure of a molecule and if the molecule is at a risk of synthon polymorphism. Therefore, a simple health check on these molecules using structural informatics tools such as MEPs, HBE, HBP and HBC for mapping out the structural landscape of these types of molecules will have significant practical applications in various fields.
Supplementary Materials
The following are available online at https://0-www-mdpi-com.brum.beds.ac.uk/article/10.3390/chemistry3020043/s1, Figure S1. (a) Cis and trans amide functionality (both bonds are acyclic representing using symbol @) used to perform the torsion angle search. (b) Pie chart indicating number of structures with torsions for cis (yellow, ~32 structures, 0.5%) and trans (red, ~6303 Structures, 99.5%) conformations; Figure S2. (a)Propensity-coordination chart of P1-P6 molecules and (b) coordination of each functional group in all predicted motifs; Figure S3. Propensity-coordination chart of P7-P8 molecules and the coordination of each functional group in all predicted motifs; Figure S4. Propensity-coordination chart of P9-P10 molecules and the coordination of each functional group in all predicted motifs; Figure S5. Propensity-coordination chart of P11-P12 molecules and the coordination of each functional group in all predicted motifs; Figure S6. 1H NMR of 3-acetamido-1H-pyrazole, P1; Figure S7. 1H NMR of 3-acetamido-5methyl-1H-pyrazole, P2.; Figure S8. 1H NMR of 3-propamido-1H-pyrazole, P3; Figure S9. 1H NMR of 3-propamido-5methyl-1H-pyrazole, P4; Figure S10. 1H NMR spectrum of 3-butyramido pyrazole, P5; Figure S11. NMR spectrum of 3-butyramido 5-methyl pyrazole, P6; Figure S12. 1H NMR of 3-benzamido-1H-pyrazole, P7; Figure S13. 1H NMR of 3-benzamido-5methyl-1H-pyrazole, P8; Figure S14. 1H NMR of N-(pyrazole-2-yl)nicotinamide, P9; Figure S15. NMR spectrum of N-(5-methylpyrazol-2-yl)nicotinamide, P10; Figure S16. NMR spectrum of N-(pyrazole-2-yl)isonicotinamide, P11; Figure S17. NMR spectrum of N-(5-methylpyrazol-2-yl)isonicotinamide, P12; Table S1. Energies of each trans amide conformation relative to most stable trans conformation is shown below in kJ/mol. The conformations with duplicate energies were ignored. Note: methyl-based target molecule conformations are not shown here; Table S2. Hydrogen-bond energies (in kJ/mol) for each individual synthon for molecules P1-P12. Synthon A and C are dimeric synthons; therefore, energies are presented for pairs of molecules; Table S3. Hydrogen-bond energies (in kJ/mol) for each combination synthon for molecules P1-P12; Table S4. Functional groups used to determine the hydrogen-bond propensities for the P1-P12 target molecules. The labels in the figures can be explained as follows: Tn = atom makes n bonds, c = atom is cyclic, ![Chemistry 03 00043 i002]() = bond is acyclic, and Hn = n bonded hydrogen atoms; Table S5. Hydrogen-bond propensities for each individual synthon possible in molecules P1-P12; Table S6. Hydrogen-bond propensities for combination synthons possible in molecules P1-P12. Combination synthon propensities are calculated by multiplying the individual synthon propensities; Table S7. Experimental details of crystals obtained in this study.
= bond is acyclic, and Hn = n bonded hydrogen atoms; Table S5. Hydrogen-bond propensities for each individual synthon possible in molecules P1-P12; Table S6. Hydrogen-bond propensities for combination synthons possible in molecules P1-P12. Combination synthon propensities are calculated by multiplying the individual synthon propensities; Table S7. Experimental details of crystals obtained in this study.
 = bond is acyclic, and Hn = n bonded hydrogen atoms; Table S5. Hydrogen-bond propensities for each individual synthon possible in molecules P1-P12; Table S6. Hydrogen-bond propensities for combination synthons possible in molecules P1-P12. Combination synthon propensities are calculated by multiplying the individual synthon propensities; Table S7. Experimental details of crystals obtained in this study.
Author Contributions
B.S. and C.B.A. conceived and designed the experiments; B.S. and A.M. performed the experiments; A.S.S. and J.D. performed the single-crystal X-ray crystallography; B.S. and C.B.A. analyzed the data and wrote the paper. All authors have read and agreed to the published version of the manuscript.
Funding
This research was funded by the Johnson Cancer Research Center, Kansas State University.
Data Availability Statement
Details of chemical synthesis, calculations, and NMR and IR spectra are available online. The crystallographic data for this paper (CCDC 2072631-2072636) can be obtained free of charge via www.ccdc.cam.ac.uk/data_request/cif, or by emailing [email protected], or by contacting The Cambridge Crystallographic Data Centre, 12 Union Road, Cambridge CB2 1EZ, UK; Fax: +44-1223-336033.
Conflicts of Interest
The authors declare no conflict of interest. The funders had no role in the design of the study; in the collection, analyses, or interpretation of data; in the writing of the manuscript, or in the decision to publish the results.
References
- Price, S.L. Predicting crystal structures of organic compounds. Chem. Soc. Rev. 2014, 43, 2098–2111. [Google Scholar] [CrossRef] [Green Version]
- Desiraju, G.R. Supramolecular Synthons in Crystal Engineering—A New Organic Synthesis. Angew. Chem. Int. Ed. Engl. 1995, 34, 2311–2327. [Google Scholar] [CrossRef]
- Fedyanin, I.V.; Karnoukhova, V.A.; Lyssenko, K.A. Conformational analysis of a supramolecular synthon: A case study of 8-hydroxyquinoline. CrystEngComm 2018, 20, 652–660. [Google Scholar] [CrossRef]
- Thalladi, V.R.; Goud, B.S.; Hoy, V.J.; Allen, F.H.; Howard, J.A.K.; Desiraju, G.R. Supramolecular synthons in crystal engineering. Structure simplification, synthon robustness and supramolecular retrosynthesis. Chem. Commun. 1996, 3, 401–402. [Google Scholar] [CrossRef]
- Nangia, A.; Desiraju, G.R. Supramolecular Synthons and Pattern Recognition. In Design of Organic Solids; Weber, E., Aoyama, Y., Caira, M.R., Desiraju, G.R., Glusker, J.P., Hamilton, A.D., Meléndez, R.E., Nangia, A., Eds.; Springer: Berlin/Heidelberg, Germany, 1998; pp. 57–95. [Google Scholar] [CrossRef]
- Hofmann, D.W.M.; Kuleshova, L.N.; Antipin, M.Y. Supramolecular Synthons and Crystal Structure Prediction of Organic Compounds. Cryst. Growth Des. 2004, 4, 1395–1402. [Google Scholar] [CrossRef]
- Mukherjee, A.; Dixit, K.; Sarma, S.P.; Desiraju, G.R. Aniline-phenol recognition: From solution through supramolecular synthons to cocrystals. IUCrJ 2014, 1, 228–239. [Google Scholar] [CrossRef]
- Reddy, D.S.; Ovchinnikov, Y.E.; Shishkin, O.V.; Struchkov, Y.T.; Desiraju, G.R. Supramolecular Synthons in Crystal Engineering. 3. Solid State Architecture and Synthon Robustness in Some 2,3-Dicyano-5,6-dichloro-1,4-dialkoxybenzenes1. J. Am. Chem. Soc. 1996, 118, 4085–4089. [Google Scholar] [CrossRef]
- Desiraju, G.R. Crystal Engineering: A Holistic View. Angew. Chem. Int. Ed. 2007, 46, 8342–8356. [Google Scholar] [CrossRef] [PubMed]
- Desiraju, G.R. Designer crystals: Intermolecular interactions, network structures and supramolecular synthons. Chem. Commun. 1997, 16, 1475–1482. [Google Scholar] [CrossRef]
- Merz, K.; Vasylyeva, V. Development and boundaries in the field of supramolecular synthons. CrystEngComm 2010, 12, 3989–4002. [Google Scholar] [CrossRef]
- Desiraju, G.R. Crystal engineering: Solid state supramolecular synthesis. Curr. Opin. Solid State Mater. Sci. 1997, 2, 451–454. [Google Scholar] [CrossRef]
- Lehn, J.-M. Supramolecular Chemistry and Chemical Synthesis. In Chemical Synthesis: Gnosis to Prognosis; Chatgilialoglu, C., Snieckus, V., Eds.; Springer: Dordrecht, The Netherlands, 1996; pp. 511–524. [Google Scholar] [CrossRef]
- Desiraju, G.R. Crystal Engineering: From Molecule to Crystal. J. Am. Chem. Soc. 2013, 135, 9952–9967. [Google Scholar] [CrossRef] [PubMed]
- Lehn, J.-M. Supramolecular Chemistry—Scope and Perspectives Molecules, Supermolecules, and Molecular Devices (Nobel Lecture). Angew. Chem. Int. Ed. Engl. 1988, 27, 89–112. [Google Scholar] [CrossRef]
- Dunitz, J.D. Introduction. In X-ray Analysis and the Structure of Organic Molecules; © Verlag Helvetica Chimica Acta: Zürich, Switzerland, 1995; pp. 17–21. [Google Scholar] [CrossRef]
- Dunitz, J.D. Diffraction of X-Rays by Crystals. In X-ray Analysis and the Structure of Organic Molecules; © Verlag Helvetica Chimica Acta: Zürich, Switzerland, 1995; pp. 23–72. [Google Scholar] [CrossRef]
- Dunitz, J.D. Internal Symmetry of Crystals. In X-ray Analysis and the Structure of Organic Molecules; © Verlag Helvetica Chimica Acta: Zürich, Switzerland, 1995; pp. 73–111. [Google Scholar] [CrossRef]
- Dey, A.; Pati, N.N.; Desiraju, G.R. Crystal structure prediction with the supramolecular synthon approach: Experimental structures of 2-amino-4-ethylphenol and 3-amino-2-naphthol and comparison with prediction. CrystEngComm 2006, 8, 751–755. [Google Scholar] [CrossRef]
- Sarma, J.A.R.P.; Desiraju, G.R. The Supramolecular Synthon Approach to Crystal Structure Prediction. Cryst. Growth Des. 2002, 2, 93–100. [Google Scholar] [CrossRef]
- Aakeröy, C.B.; Wijethunga, T.K.; Desper, J. Molecular electrostatic potential dependent selectivity of hydrogen bonding. New J. Chem. 2015, 39, 822–828. [Google Scholar] [CrossRef]
- Etter, M.C. Encoding and decoding hydrogen-bond patterns of organic compounds. Acc. Chem. Res. 1990, 23, 120–126. [Google Scholar] [CrossRef]
- Sandhu, B.; McLean, A.; Sinha, A.S.; Desper, J.; Sarjeant, A.A.; Vyas, S.; Reutzel-Edens, S.M.; Aakeröy, C.B. Evaluating Competing Intermolecular Interactions through Molecular Electrostatic Potentials and Hydrogen-Bond Propensities. Cryst. Growth Des. 2018, 18, 466–478. [Google Scholar] [CrossRef]
- Singh, M.K. Predicting lattice energy and structure of molecular crystals by first-principles method: Role of dispersive interactions. J. Cryst. Growth 2014, 396, 14–23. [Google Scholar] [CrossRef]
- Atahan-Evrenk, S.; Aspuru-Guzik, A. Prediction and Calculation of Crystal Structures: Methods and Applications; Springer: Berlin/Heidelberg, Germany, 2014. [Google Scholar]
- Gharagheizi, F.; Sattari, M.; Tirandazi, B. Prediction of Crystal Lattice Energy Using Enthalpy of Sublimation: A Group Contribution-Based Model. Ind. Eng. Chem. Res. 2011, 50, 2482–2486. [Google Scholar] [CrossRef]
- Day, G.M. Current approaches to predicting molecular organic crystal structures. Crystallogr. Rev. 2011, 17, 3–52. [Google Scholar] [CrossRef]
- Musumeci, D.; Hunter, C.A.; Prohens, R.; Scuderi, S.; McCabe, J.F. Virtual cocrystal screening. Chem. Sci. 2011, 2, 883–890. [Google Scholar] [CrossRef]
- Hunter, C.A. Quantifying Intermolecular Interactions: Guidelines for the Molecular Recognition Toolbox. Angew. Chem. Int. Ed. 2004, 43, 5310–5324. [Google Scholar] [CrossRef] [PubMed]
- Scheiner, S. Comparison of Bifurcated Halogen with Hydrogen Bonds. Molecules 2021, 26, 350. [Google Scholar] [CrossRef]
- Hou, L.; Gao, L.; Zhang, W.; Yang, X.-J.; Wu, B. Quaternary Cocrystals Based on Halide-Binding Foldamers through Both Hydrogen and Halogen Bonding. Cryst. Growth Design 2021. [Google Scholar] [CrossRef]
- Aakeröy, C.B.; Chopade, P.D.; Desper, J. Avoiding “Synthon Crossover” in Crystal Engineering with Halogen Bonds and Hydrogen Bonds. Cryst. Growth Des. 2011, 11, 5333–5336. [Google Scholar] [CrossRef]
- Aakeröy, C.B.; Fasulo, M.; Schultheiss, N.; Desper, J.; Moore, C. Structural Competition between Hydrogen Bonds and Halogen Bonds. J. Am. Chem. Soc. 2007, 129, 13772–13773. [Google Scholar] [CrossRef]
- Zhang, Y.; Zhu, B.; Ji, W.-J.; Guo, C.-Y.; Hong, M.; Qi, M.-H.; Ren, G.-B. Insight into the Formation of Cocrystals of Flavonoids and 4,4′-Vinylenedipyridine: Heteromolecular Hydrogen Bonds, Molar Ratio, and Structural Analysis. Cryst. Growth Design 2021. [Google Scholar] [CrossRef]
- Aakeroy, C.B.; Spartz, C.L.; Dembowski, S.; Dwyre, S.; Desper, J. A systematic structural study of halogen bonding versus hydrogen bonding within competitive supramolecular systems. IUCrJ 2015, 2, 498–510. [Google Scholar] [CrossRef] [PubMed] [Green Version]
- Perera, M.D.; Desper, J.; Sinha, A.S.; Aakeröy, C.B. Impact and importance of electrostatic potential calculations for predicting structural patterns of hydrogen and halogen bonding. CrystEngComm 2016, 18, 8631–8636. [Google Scholar] [CrossRef]
- Zheng, Q.; Unruh, D.K.; Hutchins, K.M. Cocrystallization of Trimethoprim and Solubility Enhancement via Salt Formation. Cryst. Growth Design 2021, 21, 1507–1517. [Google Scholar] [CrossRef]
- Aakeröy, C.B.; Wijethunga, T.K.; Desper, J.; Đaković, M. Electrostatic Potential Differences and Halogen-Bond Selectivity. Cryst. Growth Des. 2016, 16, 2662–2670. [Google Scholar] [CrossRef]
- Wang, L.; Liu, S.; Chen, J.-m.; Wang, Y.-x.; Sun, C.C. Novel Salt-Cocrystals of Berberine Hydrochloride with Aliphatic Dicarboxylic Acids: Odd–Even Alternation in Physicochemical Properties. Mol. Pharm. 2021, 18, 1758–1767. [Google Scholar] [CrossRef]
- Gunawardana, C.A.; Desper, J.; Sinha, A.S.; Ðaković, M.; Aakeröy, C.B. Competition and selectivity in supramolecular synthesis: Structural landscape around 1-(pyridylmethyl)-2,2′-biimidazoles. Faraday Discuss. 2017, 203, 371–388. [Google Scholar] [CrossRef] [PubMed]
- Aakeröy, C.B.; Beatty, A.M.; Helfrich, B.A. “Total Synthesis” Supramolecular Style: Design and Hydrogen-Bond-Directed Assembly of Ternary Supermolecules. Angew. Chem. Int. Ed. 2001, 40, 3240–3242. [Google Scholar] [CrossRef]
- Bennion, J.C.; Matzger, A.J. Development and Evolution of Energetic Cocrystals. Acc. Chem. Res. 2021, 54, 1699–1710. [Google Scholar] [CrossRef] [PubMed]
- Groom, C.R.; Allen, F.H. The Cambridge Structural Database in Retrospect and Prospect. Angew. Chem. Int. Ed. 2014, 53, 662–671. [Google Scholar] [CrossRef] [PubMed]
- Wood, P.A.; Feeder, N.; Furlow, M.; Galek, P.T.A.; Groom, C.R.; Pidcock, E. Knowledge-based approaches to co-crystal design. CrystEngComm 2014, 16, 5839–5848. [Google Scholar] [CrossRef]
- Galek, P.T.A.; Chisholm, J.A.; Pidcock, E.; Wood, P.A. Hydrogen-bond coordination in organic crystal structures: Statistics, predictions and applications. Acta Crystallogr. Sect. B 2014, 70, 91–105. [Google Scholar] [CrossRef] [PubMed]
- Nauha, E.; Bernstein, J. “Predicting” Crystal Forms of Pharmaceuticals Using Hydrogen Bond Propensities: Two Test Cases. Cryst. Growth Des. 2014, 14, 4364–4370. [Google Scholar] [CrossRef]
- Sarkar, N.; Aakeröy, C.B. Evaluating hydrogen-bond propensity, hydrogen-bond coordination and hydrogen-bond energy as tools for predicting the outcome of attempted co-crystallisations. Supramol. Chem. 2020, 32, 81–90. [Google Scholar] [CrossRef]
- Sarkar, N.; Sinha, A.S.; Aakeröy, C.B. Systematic investigation of hydrogen-bond propensities for informing co-crystal design and assembly. CrystEngComm 2019, 21, 6048–6055. [Google Scholar] [CrossRef]
- Naim, M.; Alam, O.; Nawaz, F.; Alam, M.; Alam, P. Current status of pyrazole and its biological activities. J. Pharm. Bioallied Sci. 2016, 8, 2–17. [Google Scholar] [CrossRef]
- Ansari, A.; Ali, A.; Asif, M.; Shamsuzzaman. Review: Biologically active pyrazole derivatives. New J. Chem. 2017, 41, 16–41. [Google Scholar] [CrossRef]
- Karrouchi, K.; Radi, S.; Ramli, Y.; Taoufik, J.; Mabkhot, Y.N.; Al-Aizari, F.A.; Ansar, M.h. Synthesis and Pharmacological Activities of Pyrazole Derivatives: A Review. Molecules 2018, 23, 134. [Google Scholar] [CrossRef] [PubMed] [Green Version]
- Zhang, J.; Tan, D.-J.; Wang, T.; Jing, S.-S.; Kang, Y.; Zhang, Z.-T. Synthesis, crystal structure, characterization and antifungal activity of 3,4-diaryl-1H-Pyrazoles derivatives. J. Mol. Struct. 2017, 1149, 235. [Google Scholar] [CrossRef]
- El Shehry, M.F.; Ghorab, M.M.; Abbas, S.Y.; Fayed, E.A.; Shedid, S.A.; Ammar, Y.A. Quinoline derivatives bearing pyrazole moiety: Synthesis and biological evaluation as possible antibacterial and antifungal agents. Eur. J. Med. Chem. 2018, 143, 1463–1473. [Google Scholar] [CrossRef] [PubMed]
- Du, S.; Tian, Z.; Yang, D.; Li, X.; Li, H.; Jia, C.; Che, C.; Wang, M.; Qin, Z. Synthesis, Antifungal Activity and Structure-Activity Relationships of Novel 3-(Difluoromethyl)-1-methyl-1H-pyrazole-4-carboxylic Acid Amides. Molecules 2015, 20, 8395–8408. [Google Scholar] [CrossRef] [Green Version]
- Meta, E.; Brullo, C.; Tonelli, M.; Franzblau, S.G.; Wang, Y.; Ma, R.; Baojie, W.; Orena, B.S.; Pasca, M.R.; Bruno, O. Pyrazole and imidazo[1,2-b]pyrazole Derivatives as New Potential Antituberculosis Agents. Med. Chem. 2019, 15, 17–27. [Google Scholar] [CrossRef]
- Sun, J.; Zhou, Y. Synthesis and antifungal activity of the derivatives of novel pyrazole carboxamide and isoxazolol pyrazole carboxylate. Molecules 2015, 20, 4383–4394. [Google Scholar] [CrossRef] [Green Version]
- Liu, J.J.; Zhao, M.Y.; Zhang, X.; Zhao, X.; Zhu, H.L. Pyrazole derivatives as antitumor, anti-inflammatory and antibacterial agents. Mini Rev. Med. Chem. 2013, 13, 1957–1966. [Google Scholar] [CrossRef] [PubMed]
- Wu, J.; Wang, J.; Hu, D.; He, M.; Jin, L.; Song, B. Synthesis and antifungal activity of novel pyrazolecarboxamide derivatives containing a hydrazone moiety. Chem. Cent. J. 2012, 6, 51. [Google Scholar] [CrossRef] [Green Version]
- Taylor, R.; Macrae, C.F. Rules governing the crystal packing of mono- and dialcohols. Acta Crystallogr. Sect. B 2001, 57, 815–827. [Google Scholar] [CrossRef] [PubMed]
- Bruno, I.J.; Cole, J.C.; Edgington, P.R.; Kessler, M.; Macrae, C.F.; McCabe, P.; Pearson, J.; Taylor, R. New software for searching the Cambridge Structural Database and visualizing crystal structures. Acta Crystallogr. Sect. B 2002, 58, 389–397. [Google Scholar] [CrossRef] [PubMed]
- Macrae, C.F.; Edgington, P.R.; McCabe, P.; Pidcock, E.; Shields, G.P.; Taylor, R.; Towler, M.; van de Streek, J. Mercury: Visualization and analysis of crystal structures. J. Appl. Crystallogr. 2006, 39, 453–457. [Google Scholar] [CrossRef] [Green Version]
- Macrae, C.F.; Bruno, I.J.; Chisholm, J.A.; Edgington, P.R.; McCabe, P.; Pidcock, E.; Rodriguez-Monge, L.; Taylor, R.; van de Streek, J.; Wood, P.A. Mercury CSD 2.0—New features for the visualization and investigation of crystal structures. J. Appl. Crystallogr. 2008, 41, 466–470. [Google Scholar] [CrossRef]
- Shao, Y.; Molnar, L.F.; Jung, Y.; Kussmann, J.; Ochsenfeld, C.; Brown, S.T.; Gilbert, A.T.B.; Slipchenko, L.V.; Levchenko, S.V.; O’Neill, D.P.; et al. Advances in methods and algorithms in a modern quantum chemistry program package. Phys. Chem. Chem. Phys. 2006, 8, 3172–3191. [Google Scholar] [CrossRef] [PubMed]
- Lu, Y.; Kraatz, H.B. Metal complexes of 3-acetamido-5-methylpyrazole. Inorg. Chim. Acta 2004, 357, 159–166. [Google Scholar] [CrossRef]
- Daidone, G.; Maggio, B.; Raimondi, M.V.; Bombieri, G.; Marchini, N.; Artali, R. Comparative Structural Studies of 4-Diazopyrazole Derivatives by X-Ray Diffraction and Theoretical Investigation. Heterocycles 2005, 65, 2753. [Google Scholar] [CrossRef]
Scheme 1.
Schematics of using an in-silico approach for predicting synthons in a multifunctional molecule. Hydrogen-bond donor, D, and hydrogen-bond acceptor, A.
Scheme 1.
Schematics of using an in-silico approach for predicting synthons in a multifunctional molecule. Hydrogen-bond donor, D, and hydrogen-bond acceptor, A.

Scheme 2.
Target molecules (P1–P12) employed in this study.

Scheme 3.
Representations of six postulated synthons in a generic pyrazole-amide; A, N-H (pyrazole)…N (pyrazole); B, N-H (pyrazole)…C=O (amide); C, N-H (amide)…N (pyrazole); D, N-H (amide)…C=O (amide); E, NH (pyrazole)…N (aromatic) and F, NH (amide)…N (aromatic). (Y = H, CH3; X = methyl, ethyl, or benzyl).

Scheme 4.
The road map for synthon predictions.
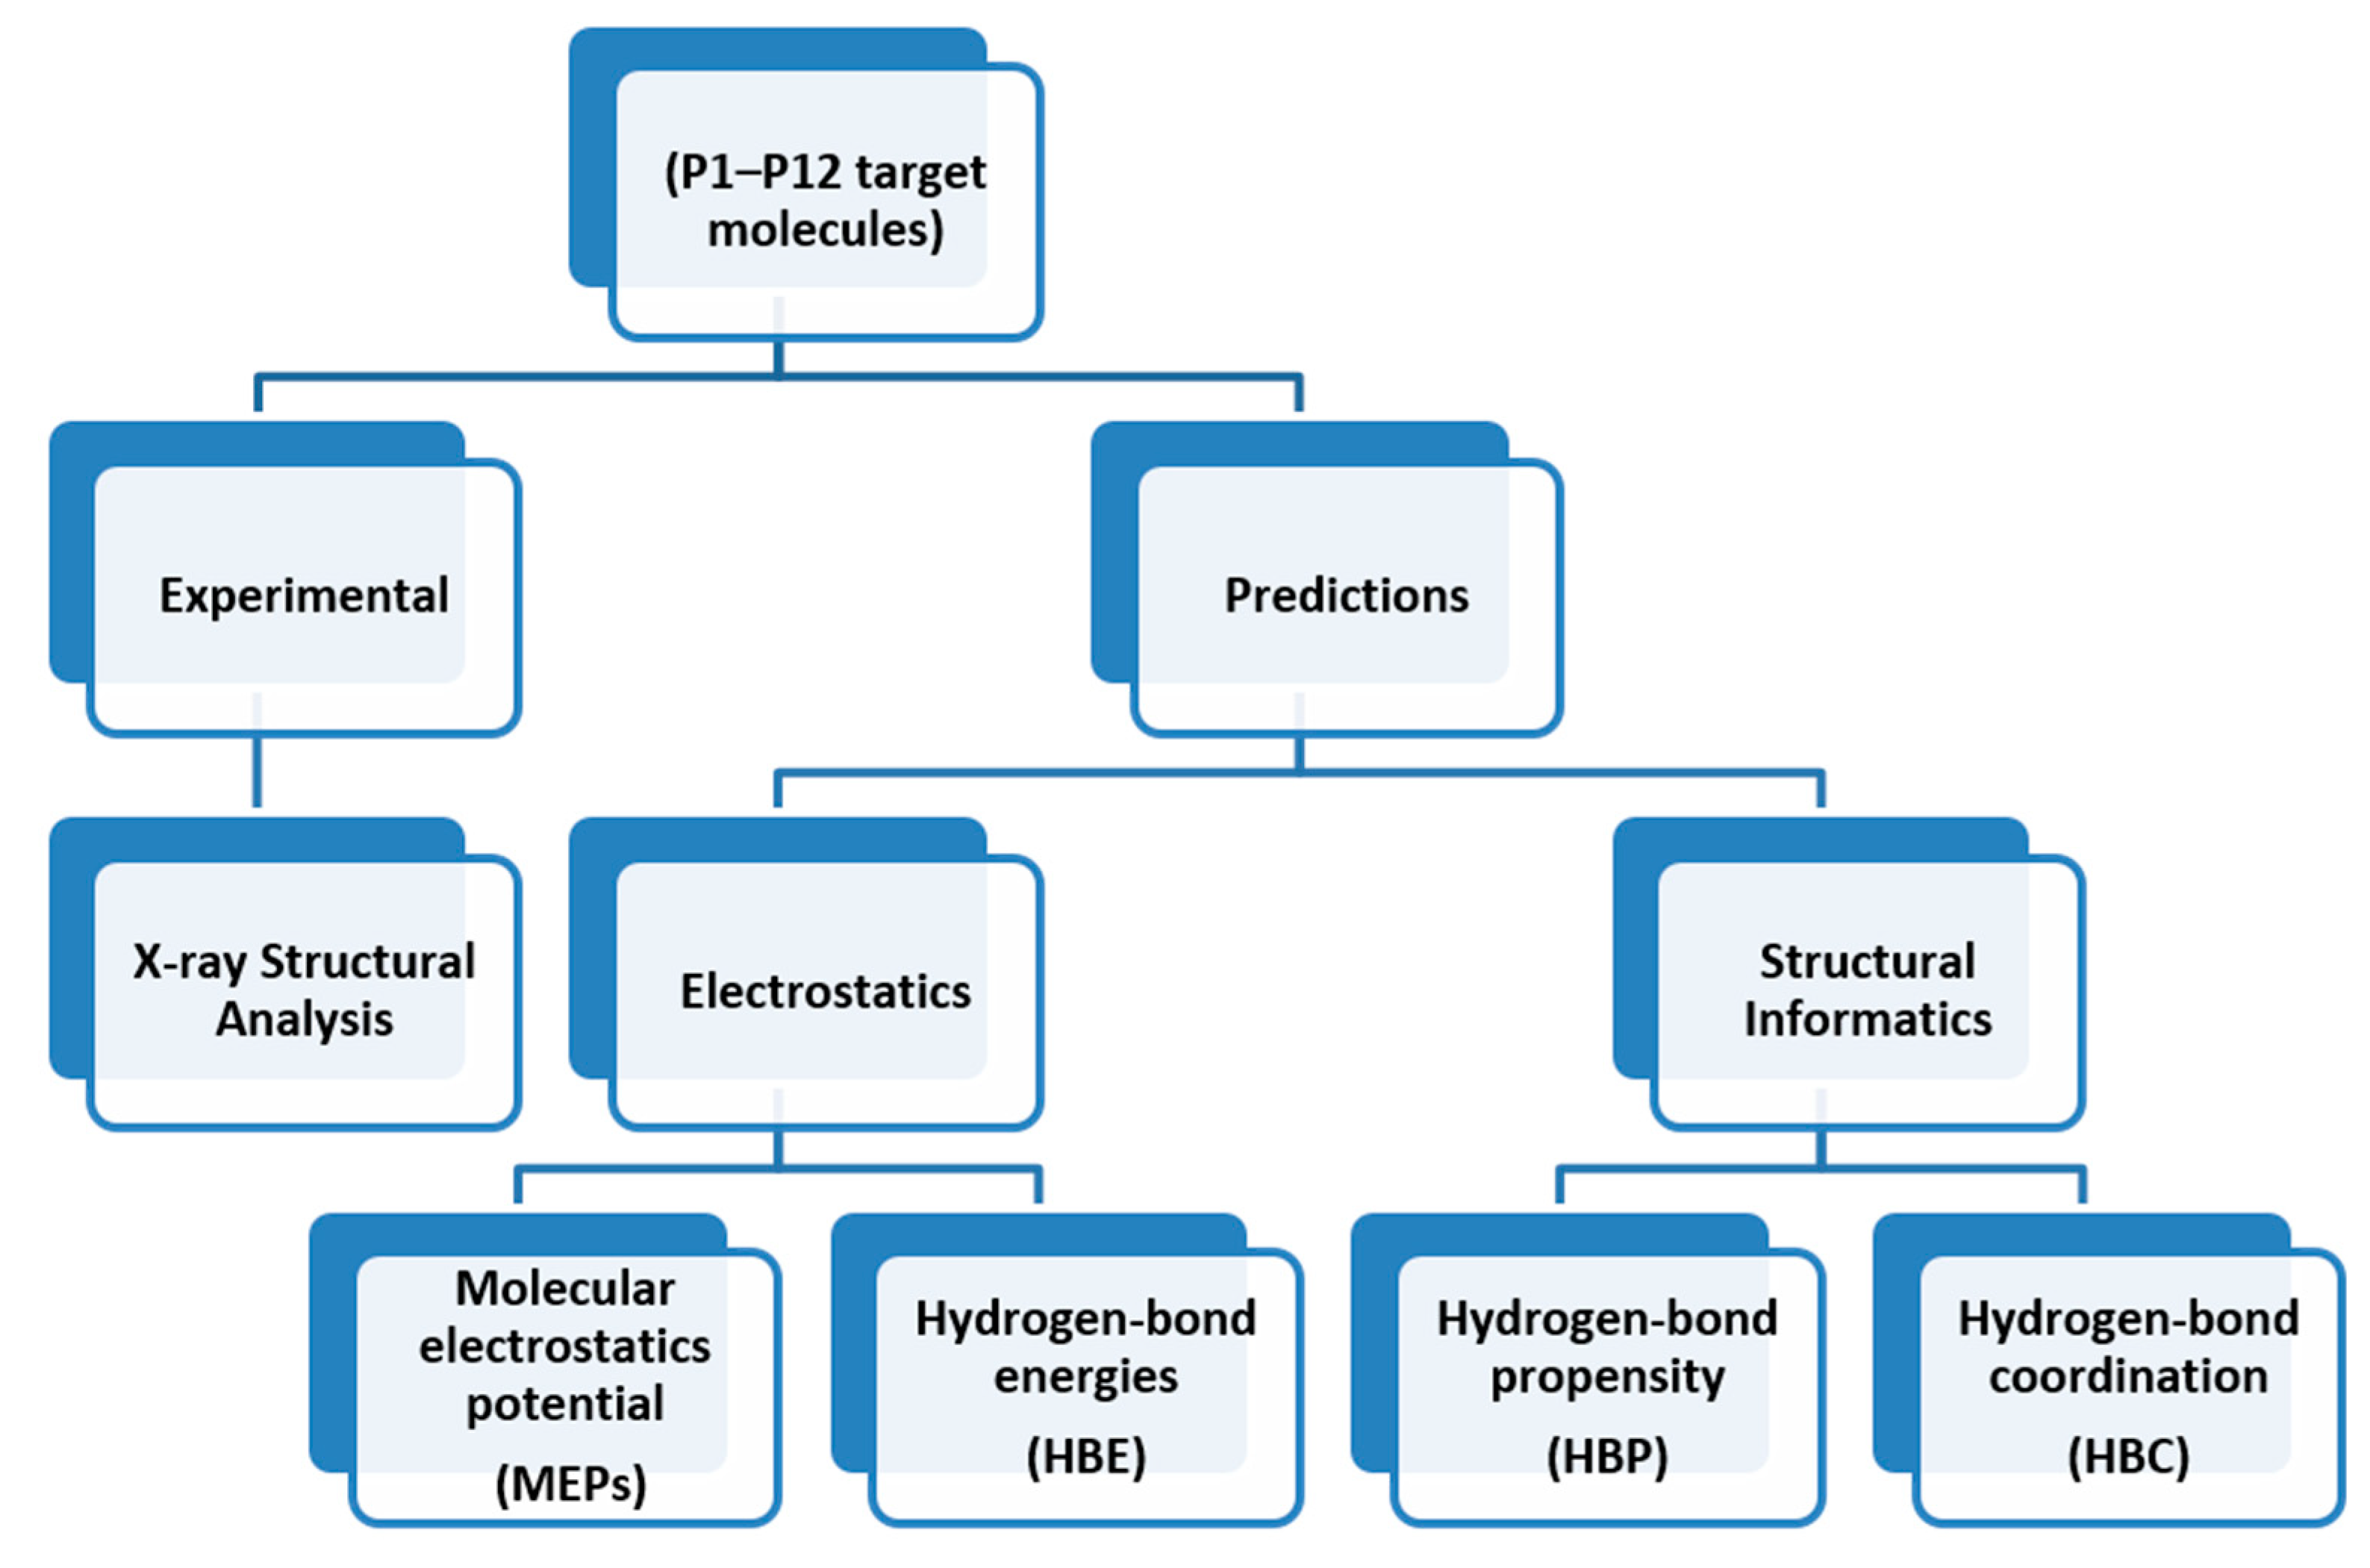
Figure 1.
Electrostatic potential values (in kJ/mol); (a) P1, (b) P2, (c) P3, (d) P4, (e) P5, (f) P6, (g) P7 and (h) P8. Red indicates MEPs on hydrogen-bond acceptors and blue indicates MEPs on hydrogen-bond donors.
Figure 1.
Electrostatic potential values (in kJ/mol); (a) P1, (b) P2, (c) P3, (d) P4, (e) P5, (f) P6, (g) P7 and (h) P8. Red indicates MEPs on hydrogen-bond acceptors and blue indicates MEPs on hydrogen-bond donors.

Figure 2.
Electrostatic potential values (in kJ/mol); (a) P9, (b) P10, (c) P11 and (d) P12. Red indicates MEPs on hydrogen-bond acceptors and blue indicates MEPs on hydrogen-bond donors.
Figure 2.
Electrostatic potential values (in kJ/mol); (a) P9, (b) P10, (c) P11 and (d) P12. Red indicates MEPs on hydrogen-bond acceptors and blue indicates MEPs on hydrogen-bond donors.

Figure 3.
Predicted hydrogen-bond coordination P1–P12 (D: hydrogen-bond donor, A: hydrogen-bond acceptor; green: optimal interactions, red: sub-optimal interactions).
Figure 3.
Predicted hydrogen-bond coordination P1–P12 (D: hydrogen-bond donor, A: hydrogen-bond acceptor; green: optimal interactions, red: sub-optimal interactions).

Figure 4.
Crystal structures showing synthons (B + C) observed in P1, P2, P3, P4, P7 and (A + D) observed in P8.
Figure 4.
Crystal structures showing synthons (B + C) observed in P1, P2, P3, P4, P7 and (A + D) observed in P8.

Figure 5.
Crystal structures showing synthon (A + F) observed in P10 and (C + E) in P11.

Scheme 5.
Molecular conformation analysis of P1–P12 using DFT B3LYP (6-311++G** basis set in vacuum). Green highlights the more stable conformation. Green highlights the likely conformation whereas red highlight the less likely conformation. ![Chemistry 03 00043 i001]() indicates acyclic moiety.
indicates acyclic moiety.
 indicates acyclic moiety.
Scheme 5.
Molecular conformation analysis of P1–P12 using DFT B3LYP (6-311++G** basis set in vacuum). Green highlights the more stable conformation. Green highlights the likely conformation whereas red highlight the less likely conformation. ![Chemistry 03 00043 i001]() indicates acyclic moiety.
indicates acyclic moiety.
indicates acyclic moiety.
Figure 6.
Summary of synthons predicted in P1–P12.
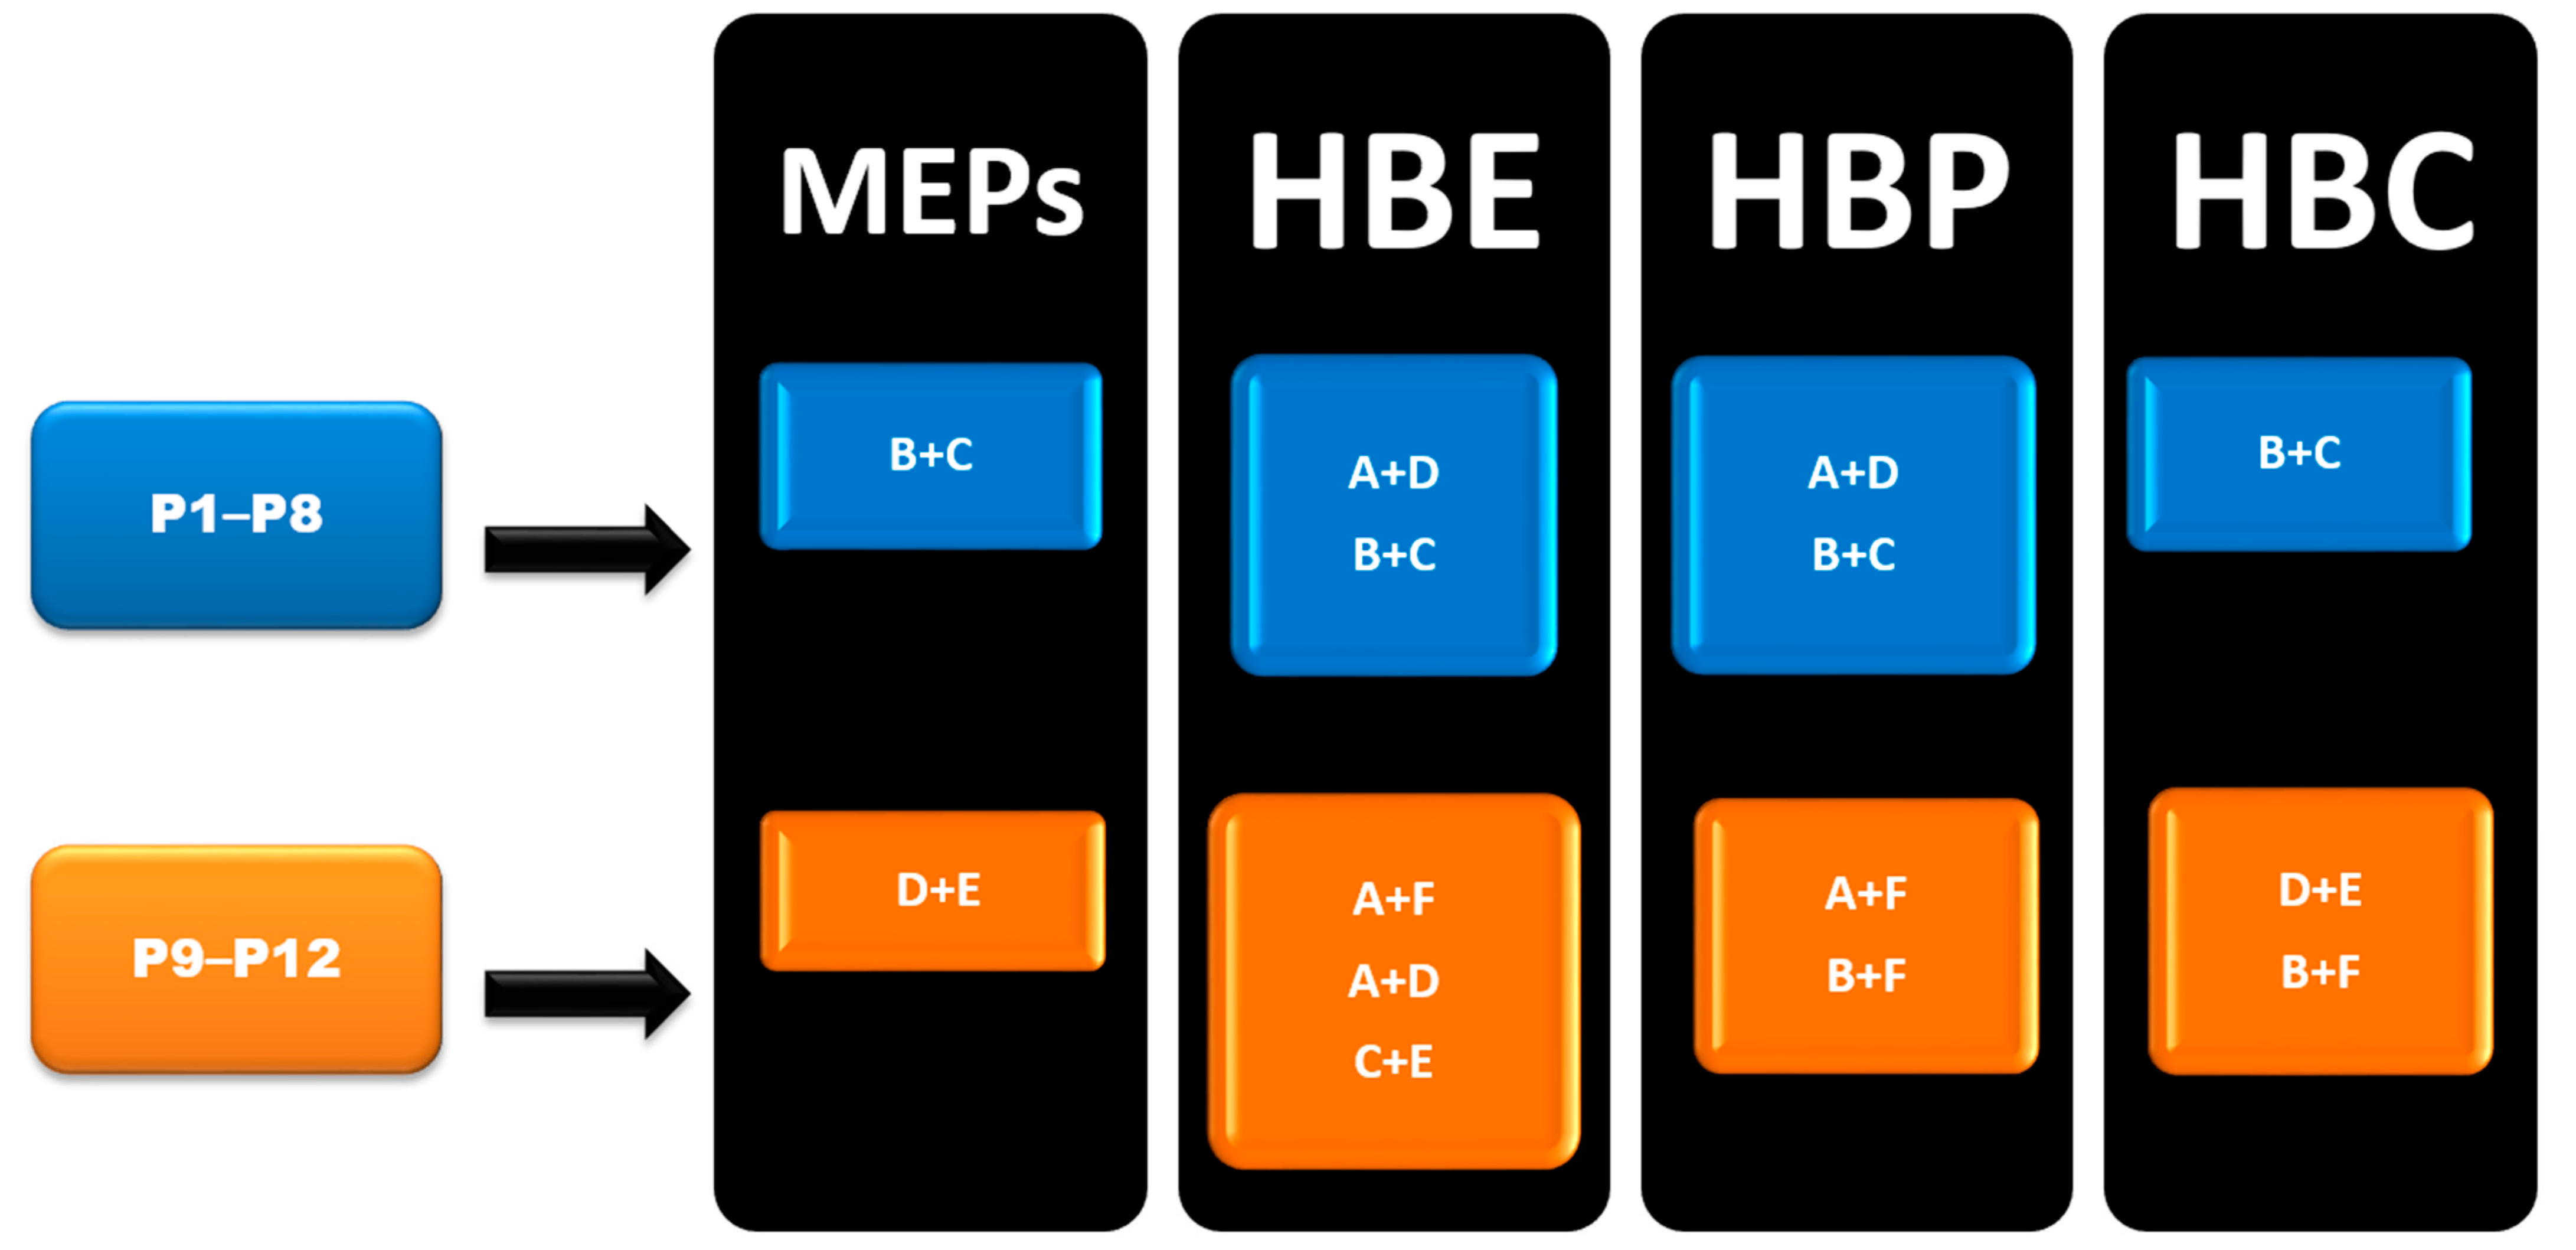
Figure 7.
Pyrazole fragments used to perform CSD molecular complementarity search (a) Average bond angle for A (22 structures in CSD); (b) average bond angle for B (35 structures in CSD) and (c) pyrazole fragment for CSD search.
Figure 7.
Pyrazole fragments used to perform CSD molecular complementarity search (a) Average bond angle for A (22 structures in CSD); (b) average bond angle for B (35 structures in CSD) and (c) pyrazole fragment for CSD search.

Figure 8.
Hydrogen-bonding observed in the crystal structure of (a) P7 and (b) P8 along the crystallographic a-axis.
Figure 8.
Hydrogen-bonding observed in the crystal structure of (a) P7 and (b) P8 along the crystallographic a-axis.

Figure 9.
Synthon and packing observed in the crystal structure of P10 leading to herringbone-like structure.
Figure 9.
Synthon and packing observed in the crystal structure of P10 leading to herringbone-like structure.

Figure 10.
Synthon and packing observed in the crystal structure of P11 leading to 1-D chains along the crystallographic a-axis.
Figure 10.
Synthon and packing observed in the crystal structure of P11 leading to 1-D chains along the crystallographic a-axis.

Figure 11.
Polymorph assessment of P1, P8, P10 and P11 molecules showing the experimental structure and more stable hypothetical structure.
Figure 11.
Polymorph assessment of P1, P8, P10 and P11 molecules showing the experimental structure and more stable hypothetical structure.


Figure 12.
Comparison of subtle variations on the molecular fragments leading to different hydrogen bonding interactions in crystal structures of P7, P8, P10 and P11.
Figure 12.
Comparison of subtle variations on the molecular fragments leading to different hydrogen bonding interactions in crystal structures of P7, P8, P10 and P11.

Figure 13.
Validation results of supermolecular synthons observed in the pyrazole analogues using four different prediction models.
Figure 13.
Validation results of supermolecular synthons observed in the pyrazole analogues using four different prediction models.


Table 1.
Hydrogen-bond energies (in kJ/mol) for each combination synthon for molecules P1–P12. Green shade indicates the most likely predicted synthons by this method.
Table 1.
Hydrogen-bond energies (in kJ/mol) for each combination synthon for molecules P1–P12. Green shade indicates the most likely predicted synthons by this method.
| (A +() F) | (A + D) | (C + E) | (B + C) | (D + E) | (B + F) | |
|---|---|---|---|---|---|---|
| AVG (P1–P8) | N/A | −52 ± 2 | N/A | −50 ± 2 | N/A | N/A |
| AVG (P9–P12) | −44 ± 2 | −43 ± 1 | −43 ± 2 | −41 ± 1 | −37 ± 2 | −37 ± 2 |
Table 2.
Hydrogen-bond propensities (probability of interaction between a hydrogen-bond acceptor and donor) for combination synthons in molecules P1–P12. Combination synthon propensities are calculated by multiplying the individual synthon propensities. Green shade indicates the most likely predicted synthons by this method.
| Synthon (A + F) | Synthon (A + D) | Synthon (C + E) | Synthon (B + C) | Synthon (D + E) | Synthon (B + F) | |
|---|---|---|---|---|---|---|
| P1 | N/A | 0.35 | N/A | 0.34 | N/A | N/A |
| P2 | N/A | 0.35 | N/A | 0.30 | N/A | N/A |
| P3 | N/A | 0.39 | N/A | 0.36 | N/A | N/A |
| P4 | N/A | 0.39 | N/A | 0.37 | N/A | N/A |
| P5 | N/A | 0.33 | N/A | 0.31 | N/A | N/A |
| P6 | N/A | 0.35 | N/A | 0.32 | N/A | N/A |
| P7 | N/A | 0.18 | N/A | 0.19 | N/A | N/A |
| P8 | N/A | 0.16 | N/A | 0.17 | N/A | N/A |
| P9 | 0.23 | 0.13 | 0.19 | 0.13 | 0.19 | 0.23 |
| P10 | 0.24 | 0.12 | 0.19 | 0.13 | 0.18 | 0.23 |
| P11 | 0.21 | 0.12 | 0.17 | 0.12 | 0.19 | 0.23 |
| P12 | 0.22 | 0.12 | 0.18 | 0.12 | 0.19 | 0.23 |
Table 3.
Experimental vs. predicted synthons in the crystal structures of P1–P14, P7–P8 and P10-P11.
Table 3.
Experimental vs. predicted synthons in the crystal structures of P1–P14, P7–P8 and P10-P11.
| Experimental | MEPs | HBE | HBP | HBC | |
|---|---|---|---|---|---|
| Group 1 | |||||
| P1 | Synthon (B + C) | Yes | Yes | Yes | Yes |
| P2 | Synthon (B + C) | Yes | Yes | Yes | Yes |
| P3 | Synthon (B + C) | Yes | Yes | Yes | Yes |
| P4 | Synthon (B + C) | Yes | Yes | Yes | Yes |
| P7 | Synthon (B + C) | Yes | Yes | Yes | Yes |
| P8 | Synthon (A + D) | No | Yes | Yes | No |
| Group 2 | |||||
| P10 | Synthon (A + F) | No | Yes | Yes | No |
| P11 | Synthon (C + E) | No | Yes | No | No |
| Overall | 62.5% | 100% | 87.5% | 62.5% | |
Publisher’s Note: MDPI stays neutral with regard to jurisdictional claims in published maps and institutional affiliations. |
© 2021 by the authors. Licensee MDPI, Basel, Switzerland. This article is an open access article distributed under the terms and conditions of the Creative Commons Attribution (CC BY) license (https://creativecommons.org/licenses/by/4.0/).
Share and Cite
MDPI and ACS Style
Sandhu, B.; McLean, A.; Sinha, A.S.; Desper, J.; Aakerӧy, C.B. Assessment of Computational Tools for Predicting Supramolecular Synthons. Chemistry 2021, 3, 612-629. https://0-doi-org.brum.beds.ac.uk/10.3390/chemistry3020043
AMA Style
Sandhu B, McLean A, Sinha AS, Desper J, Aakerӧy CB. Assessment of Computational Tools for Predicting Supramolecular Synthons. Chemistry. 2021; 3(2):612-629. https://0-doi-org.brum.beds.ac.uk/10.3390/chemistry3020043
Chicago/Turabian StyleSandhu, Bhupinder, Ann McLean, Abhijeet S. Sinha, John Desper, and Christer B. Aakerӧy. 2021. "Assessment of Computational Tools for Predicting Supramolecular Synthons" Chemistry 3, no. 2: 612-629. https://0-doi-org.brum.beds.ac.uk/10.3390/chemistry3020043