Article

Investigation into the Re-Arrangement of Copper Foams Pre- and Post-CO2 Electrocatalysis

by
Jennifer A. Rudd
1,
Sandra Hernandez-Aldave
1,
Ewa Kazimierska
1,
Louise B. Hamdy
1,
Odin J. E. Bain
1,
Andrew R. Barron
1,2,3,4 and
Enrico Andreoli
1,*
1
Energy Safety Research Institute, Swansea University, Bay Campus, Swansea SA1 8EN, UK
2
Department of Chemistry, Rice University, Houston, TX 77007, USA
3
Department of Materials Science and Nanoengineering, Rice University, Houston, TX 77007, USA
4
Faculty of Engineering, Universiti Teknologi Brunei, Jalan Tungku Link, Gadong BE1410, Brunei
*
Author to whom correspondence should be addressed.
Submission received: 30 April 2021 / Revised: 8 June 2021 / Accepted: 21 June 2021 / Published: 28 June 2021
(This article belongs to the Special Issue 2021 Profile Papers by Chemistry' Editorial Board Members)

Abstract

:
The utilization of carbon dioxide is a major incentive for the growing field of carbon capture. Carbon dioxide could be an abundant building block to generate higher-value chemical products. Herein, we fabricated a porous copper electrode capable of catalyzing the reduction of carbon dioxide into higher-value products, such as ethylene, ethanol and propanol. We investigated the formation of the foams under different conditions, not only analyzing their morphological and crystal structure, but also documenting their performance as a catalyst. In particular, we studied the response of the foams to CO2 electrolysis, including the effect of urea as a potential additive to enhance CO2 catalysis. Before electrolysis, the pristine and urea-modified foam copper electrodes consisted of a mixture of cuboctahedra and dendrites. After 35 min of electrolysis, the cuboctahedra and dendrites underwent structural rearrangement affecting catalysis performance. We found that alterations in the morphology, crystallinity and surface composition of the catalyst were conducive to the deactivation of the copper foams.

1. Introduction

As the concentration of carbon dioxide (CO2) in the atmosphere increases daily, scientists are searching for a way to stem the tide. Carbon capture is becoming ever more efficient and has recently been commercialized by companies such as Climeworks [1,2] and Carbon Engineering [3,4]; however, captured CO2 has marginal commercial value (USD 3–35 per ton) [5,6]. Therefore, research is being carried out on the sustainable conversion of CO2 into higher-value fuels and related carbon-based products, such as methane, ethylene and propanol [7,8,9,10]. Nevertheless, it is important to note that, currently, only CO2 obtained through direct air capture, coupled with electrochemical conversion using renewable energy, can be viewed as sustainable [11].
Carbon dioxide is a stable molecule that commonly only reacts through high kinetic barriers. Therefore, a catalyst is required to promote these reactions. Copper is an important CO2 reduction catalyst due to its unique properties; until 2018, it was the only metal reported capable of generating higher value products than carbon monoxide (CO) and formate from CO2 in appreciable quantities [12,13,14,15]. Therefore, the use of copper as an electrocatalyst for CO2 reductions is widely extended, employing solid copper surfaces [16,17,18,19], copper foil [20,21,22,23], copper nanoparticles [24,25,26], copper nanocrystals [27,28,29], or hollow copper metal–organic framework (MOF) [30,31,32]. However, frequently, they are sensitive to minor contaminants present in water or bicarbonate solution [33,34,35,36], requiring extensive purification of both the copper surface and reaction medium before electrocatalysis. Such pre-treatments are expensive and time-consuming, making the process industrially unviable. Moreover, a number of performance indicators must be achieved for commercialization, such as 300 mA/cm2 current density, low over-potentials and high faradaic efficiency, for selected products [37,38].
Copper foams have shown good tolerance against minor contaminants, as they remain active without electropolishing or scavenging the reaction solution [34,36,39]. The fabrication of copper foams has been previously reported, using electrodeposition. The electrodeposition using the soft templating effect of hydrogen bubbles has been used to generate highly porous copper foam structures on the surface of a copper disc electrode [39,40]. Shin et al. [41] and Kim et al. [42] reported that the addition of chemical additives, such as hydrochloric acid (HCl), ascorbic acid and others, could change the size and morphology of the pores. However, in order to be used as an electrocatalyst, the morphology of the microstructures and crystal facets needs to be investigated, ensuring that they are optimum for CO2 reduction.
The microstructures and crystal facets of copper strongly contribute to the CO2 reduction mechanism and product distribution [43,44]. Theoretical and experimental research has demonstrated that the cube-like structures such as Cu(100) facet promote the production of ethylene and the Cu(111) facet the production of methane [13]. Moreover, cube-like structures have been found to promote the formation of propanol. Propanol is an interesting CO2 reduction product with current efficiencies and current densities that are commonly low due to the intrinsic complexity of C-C bond formation [20,45,46], translating into high economic barriers to the commercialization of this process [37]. Kim et al. reported the development of copper nanoparticle ensembles loaded onto carbon paper, which re-arranged during catalysis into cube-like particles. These particles could convert CO2 into a mixture of n-propanol, acetone and allyl alcohol with a combined faradaic efficiency of 5.9% at −0.81 V vs. RHE [46]. The total current density was 12.7 mA/cm2, corresponding to a partial current density jn-propanol ∼ 0.75 mA/cm2. Ren et al. designed a copper catalyst with a “high surface population of defects” by electroreducing anodized Cu nanoparticles, leading to nanocrystals in a rough, square shape [47]. Using this catalyst, n-propanol was generated with 10.6% faradaic efficiency at −0.85 V vs. RHE. Long-term electrolysis was also carried out at −0.95 V and n-propanol could be continuously produced with a current density of jn-propanol ∼ −1.74 mA/cm2 for 6 h. Grosse et al. reported copper nanocubes that underwent structural change during catalysis [48] and a small quantity of n-propanol was produced ~1.8% at −0.96 V vs. RHE.
Considering the importance of the copper microstructure on CO2 electroreduction, we turned our attention to the fabrication of copper foams under various conditions, aiming to tune the microstructure of the copper foam and its capabilities as an electrocatalyst. In the past, we have reported that the impregnation of a copper foam with poly(acrylamide) enhanced the production of ethylene, reaching faradaic efficiencies of 26% and an overall reduction current density of 60 mA/cm2 [49]. Therefore, in this work, we further investigated the addition of nitrogen-containing moieties, using urea. The addition of nitrogen-containing moieties can tune the properties of the copper catalyst to potentially give higher current densities, promote C-C bond formation and lead to greater product selectivity [45,50,51]. We expected the modification of copper foam with the simplest amide, i.e., carbamide, also known as urea, could stabilize carbon monoxide adsorbed intermediates *CO on copper promoting C-C bond formation. Urea was previously used with copper [52] or to electrodeposit copper [53], but not to change the properties of the copper in the attempt to promote C-C bond formation in CO2 reduction. We wanted to establish whether the addition of urea would promote the formation of n-propanol and increase the current density of copper foam catalysts. Interestingly, we found that whilst urea did not enhance selectivity for n-propanol, it instead improved the lifetime of the copper foam impacting on CO2 catalysis.

2. Materials and Methods

2.1. Materials

Potassium bicarbonate (99.5%, Sigma Aldrich, St. Louis, MO, USA), Copper sulphate pentahydrate (99.9%, Sigma Aldrich), Urea (99.5%, Sigma Aldrich), Hydrochloric Acid (37.5%, Sigma Aldrich), Sulphuric acid (95–98%, Sigma Aldrich), Perchloric acid (70% ACS reagent, Sigma Aldrich), Argon gas (99.998%, BOC, Industrial Gases, UK), Carbon dioxide gas (99.995%, BOC). All reagents were used without further purification. Deionized water with 15 MΩ.cm resistance from Merck Elix type 2 water purification system.

2.2. Copper Foam Preparation

The preparation was adapted from our previous work [49]. A 3 mm diameter copper rod (99.99%, Goodfellow, Huntingdon, UK) was cut into cylindrical pieces and embedded into a polycarbonate body with Araldite epoxy (Huntsman Advanced Materials, Basel, Switzerland). The electrode was mechanically polished with 0.3 μm alumina slurry, followed by rinsing and ultrasonication in deionized water for 1 min. Copper foam was electrodeposited on the copper disc by submerging in 0.2 M of CuSO4, 1.5 M of H2SO4(aq) and 4–73 mM of HCl(aq) and applying a fixed cathodic current of 3 A cm–2 for 15 s. Urea-modified copper foam was synthesized by (i) dissolving a mass of urea corresponding to a 10–100 mM concentration and (ii) dip-coating unmodified electrodeposited copper foam in an H2O solution of 100 mM concentration urea for 1 min. The electrodeposited foams were submerged in deionized water for 5 min to remove traces of electrodeposition solution before electrochemical measurements.
The foams are denoted as follows: CF-xH, CF-18H-xU and CF-18H-DCU, where CF = copper foam, xH = concentration in millimoles of HCl added to electrodeposition bath, xU = concentration in millimoles of urea added to deposition bath and DCU = dip-coated in aqueous 100 mM urea solution.

2.3. Material Characterization

Scanning electron microscopy images were taken using field emission gun scanning electron microscopy (FEG-SEM JEOL 7800F, JEOL, Tokyo, Japan). XPS was performed using a Kratos Axis Supra (Kratos Analytical, Kyoto, Japan), utilizing a monochromated Al-Kα X-ray source, 15 mA emission current, magnetic hybrid lens and slot aperture. Region scans were performed using a pass energy of 40 eV and a step size of 0.1 eV. Prior to XPS analysis, the copper foams were dried in a vacuum desiccator for 24 h. Scans were run of the copper foams after initial synthesis and again after their use as catalysts. It was possible to preclude the presence of CO2 catalysis contaminants such as zinc and lead potentially deposited onto the surface from the electrolyte during electrolysis [54]. XRD measurements were carried out on a Bruker D8 Discover diffractometer (Bruker Corporation, Billerica, MA, USA) with Cu-Kα source radiation (λ = 0.15418 nm). Data were recorded in the 2θ range of 35°–100° in 0.04° increments with a step time of 0.5 s.

2.4. CO2 Electrocatalysis

The electrocatalysis was carried out following the procedure established by Ahn et al. [49] and is detailed in full in the SI. Minor changes to the previously reported procedure are detailed here. The electrolyte solution was prepared by saturating a 0.1 M KHCO3 solution with CO2 by bubbling at 40 mL/min for 1 h prior to use. The pH of the solution was measured at 6.8. The electrolysis cell was saturated with CO2 gas flowing at 40 mL/min for 5 min before a cathodic potential (from −0.70 to −1.04 V vs. RHE) was applied. Electrolysis was carried out by setting the voltage at reducing potentials for a total of 35 min. Gas headspace samples were taken from the cell using a gastight syringe for manual injection into the GC sampling loop on the 5th, 20th and 35th minute. The electrolysis run was temporarily stopped after gas sample injection and the ohmic drop remeasured before starting the next segment. Each set of gas-phase product measurements was repeated at least three times. The CO2 electrolysis was performed using a three-electrode setup: a 3 mm diameter copper rod (99.99%, Goodfellow, London, UK) cut into cylindrical pieces and embedded into a polycarbonate body with Araldite epoxy (Huntsman Advanced Materials, Basel, Switzerland), an Ag/AgCl (3.4 M of KCl, +0.210 V vs. SHE, Innovative Instruments Inc., Indian Trail, NC, USA) reference electrode and a 2.5 cm × 5 cm piece of platinum mesh electrode (Goodfellow, UK) as a counter electrode. The set up consisted of a custom-made H-cell constructed from polypropylene body (1.6 cm diameter, 7 cm length), with a Nafion window (Nafion NRE-212 membrane, 0.05 mm thick, Alfa Aesar, Haverhill, MA, USA). The electrolyte volume inside the cell was 4 mL, the headspace volume was 6.2 mL.

2.5. Electrocatalysis Product Analysis

Liquid phase products were quantified at the end of the 35 min run using a Bruker AV-500 Nuclear Magnetic Resonance (NMR) instrument running a water suppression experiment [49]. A DMSO standard was added to the NMR tube to make a 0.1 mM concentration. Peak areas of the liquid products were then integrated and compared to the standard to obtain concentrations. Gaseous products were quantified using an Agilent 7820A gas chromatograph (Agilent Technologies, Cheadle, UK), equipped with a thermal conductivity detector and flame ionization detector coupled to a methanizer. A dual column setup was utilized, HP-PLOT Q and HP-PLOT 5A (Agilent Technologies), for the separation of hydrocarbons and permanent gases, respectively. For full details see the supporting information.

3. Results

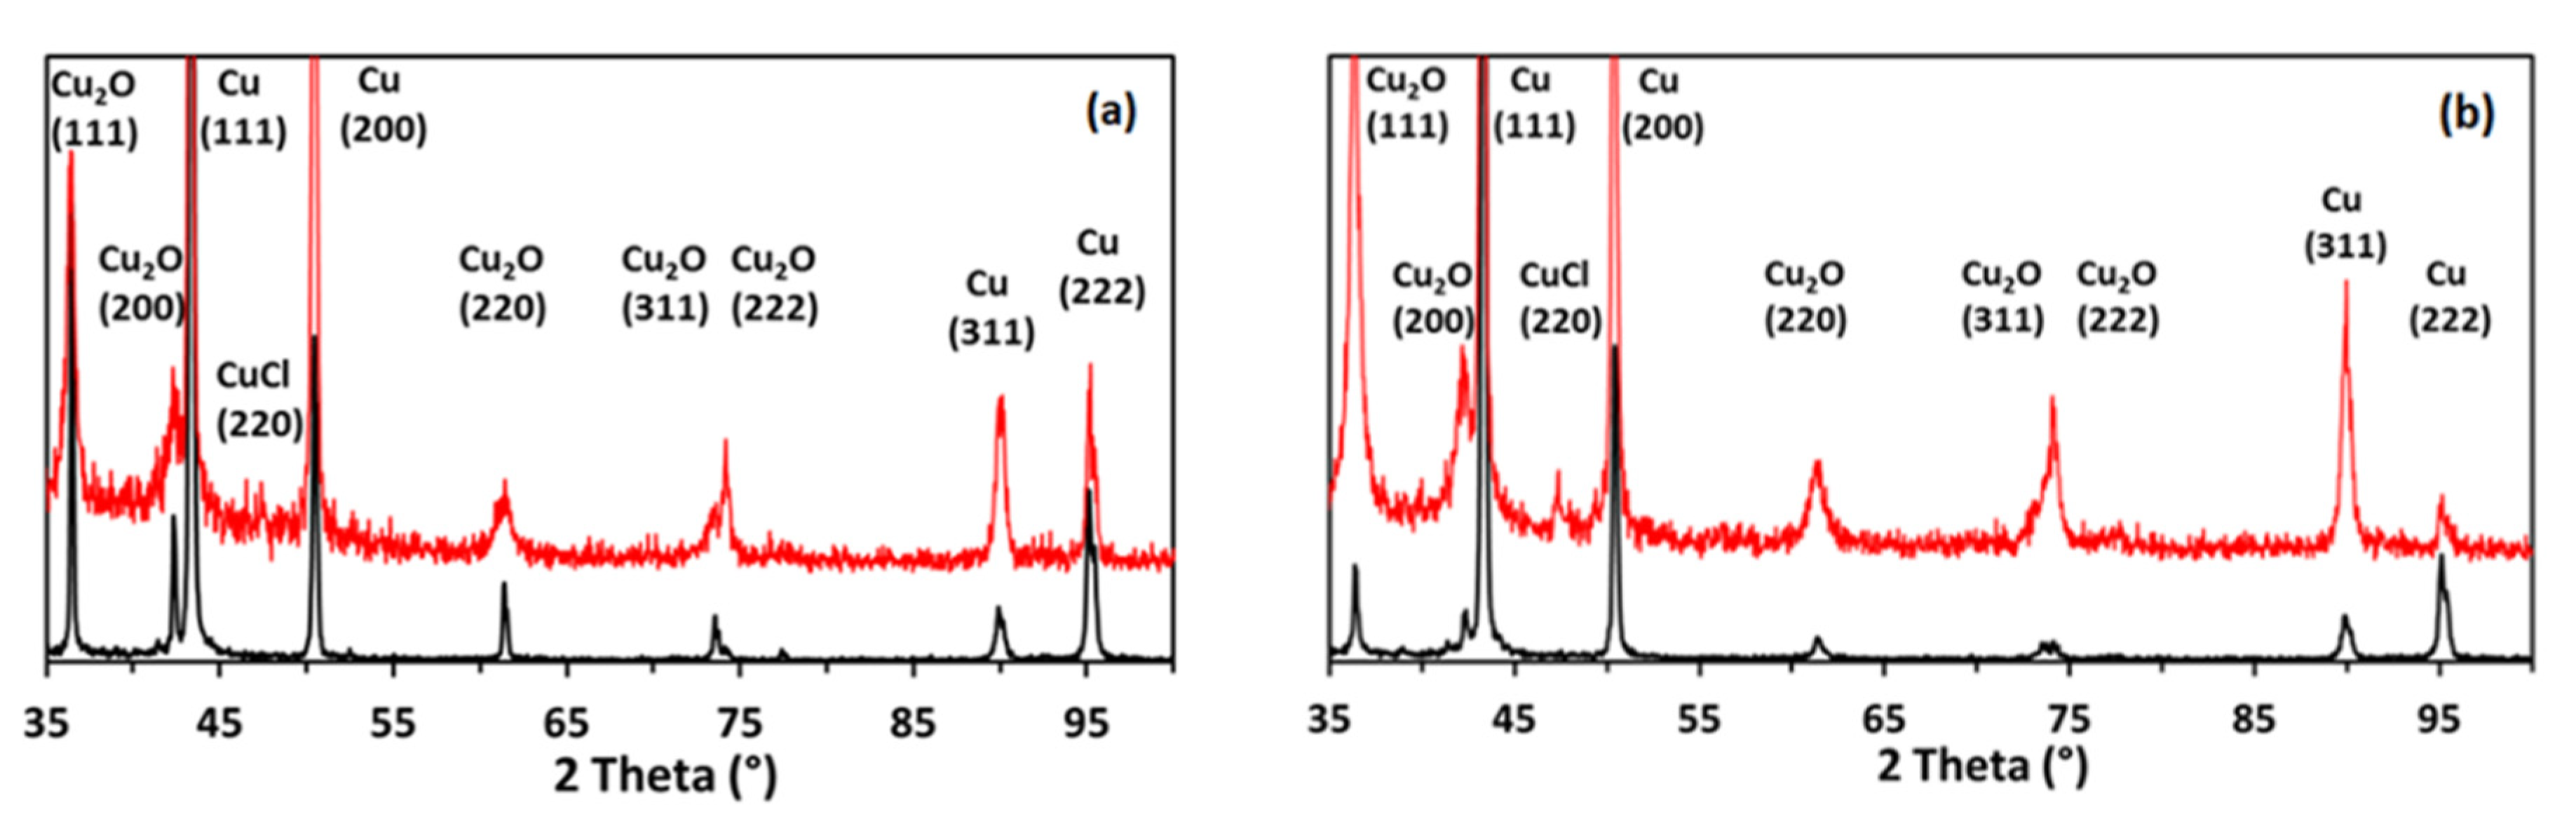
3.1. Effect of HCl on the Copper Foams

We decided to vary the hydrochloric acid (HCl) concentration and look at the effects of the different foams on CO2 reduction. In our experiments, the sulfuric acid (H2SO4) concentration was fixed at 1.5 M and the copper sulphate concentration was 0.2 M. The HCl concentration was varied from 4 to 73 mM. These experimental conditions differ from those previously reported by Kim et al. (0.4 M CuSO4/0.7 M H2SO4 [42]) and Shin et al. (0.4 M of CuSO4/1.5 M of H2SO4/1–50 mM of HCl [41]).
Scanning electron microscopy (SEM) was used to image the foams (SI Figure S1). The concentration of hydrochloric acid added to the electrodeposition bath affected the morphology of the copper foams. Shin et al. reported that increasing the concentration of HCl in the deposition bath from 1 to 50 mM altered the morphology of the foam walls, making them higher density [41]. Our copper foams, formed in the presence of small amounts of HCl, had thin wall widths and small pore diameters; large amounts of HCl led to thicker wall widths and larger pore diameters. This is summarized in SI Table S1.
Closer inspection of the structure of CF-18H foam (Figure 1) reveals that the top surface comprises thousands of cube-like structures, technically termed cuboctahedra [55]. Although the electrodeposition of various copper foams has previously been reported [14,40,41,42,49,50,56], to the best of our knowledge, no foams primarily consisting of cuboctahedra agglomerates have previously been observed. The edges of the pores comprise the same type of cuboctahedra interspersed with dendritic structures. Cuboctahedra were also found at the base of the pores. There are two different sizes of cuboctahedra; the majority are large, approximately 450 × 750 nm (width × height) in size, interspersed with smaller cuboctahedra of about 250 × 250 nm. The smaller cuboctahedra are predominantly near the bottom of the pore, whereas the larger ones dominate the top of the pores.
In order to investigate the crystal facets of the copper the foams, we have performed an ex situ X-ray diffraction of the foams (XRD, Figure 2). XRD analyses of all of the copper foams show that both Cu metal and Cu2O are present in the foam. The presence of millimolar concentrations of HCl during foam deposition seems not to affect the crystalline orientations of Cu0 formed. Compared to the Liu foams, ours contained more Cu2O peaks corresponding to different crystalline phases. The same peaks were observed by Dutta et al. in their copper foam electrocatalysts [56]. Our foams have a high surface roughness (vide infra), which would have made them more prone to oxidation. The XRD patterns of our foams show the preferred orientation of Cu(111), with appreciable contribution from Cu(200) and Cu2O(111)/Cu2O(200). To preclude the Cu(111) phase coming only from the copper disc upon which the foam was grown, we also carried out XRD on the copper foam on a carbon tab. The Cu(111) peak is present in the pattern of the copper disc alone and the copper foam on the carbon tab (SI Figure S2), confirming that the observed peak had contribution from the foam.
A preliminary CO2 electrocatalytic activity study of the different copper foams was performed at −0.81 V vs. RHE. This potential was chosen as it was the minimum overpotential required to produce appreciable quantities of n-propanol. The liquid products were analyzed, using NMR spectroscopy, to observe which foam was best at converting CO2 to n-propanol. The effect of changing HCl content of copper foam deposition solution on the electrocatalytic performance of copper foams is shown in SI Figure S3. At −0.81 V vs. RHE, adding 7 mM of HCl into the copper foam deposition bath gave the best faradaic efficiency for n-propanol, about 2.4%. However, the addition of 18 mM of HCl gave practically the same (within the experimental error) faradaic efficiency of n-propanol, 2.3%, and greater faradaic efficiency for ethanol production, about 3.3%. Therefore, the 18 mM of HCl copper foam was used for further experiments. The gaseous products on 18 mM of HCl copper foam were found to be carbon monoxide, ethylene, ethane and the by-product hydrogen (SI Table S2).

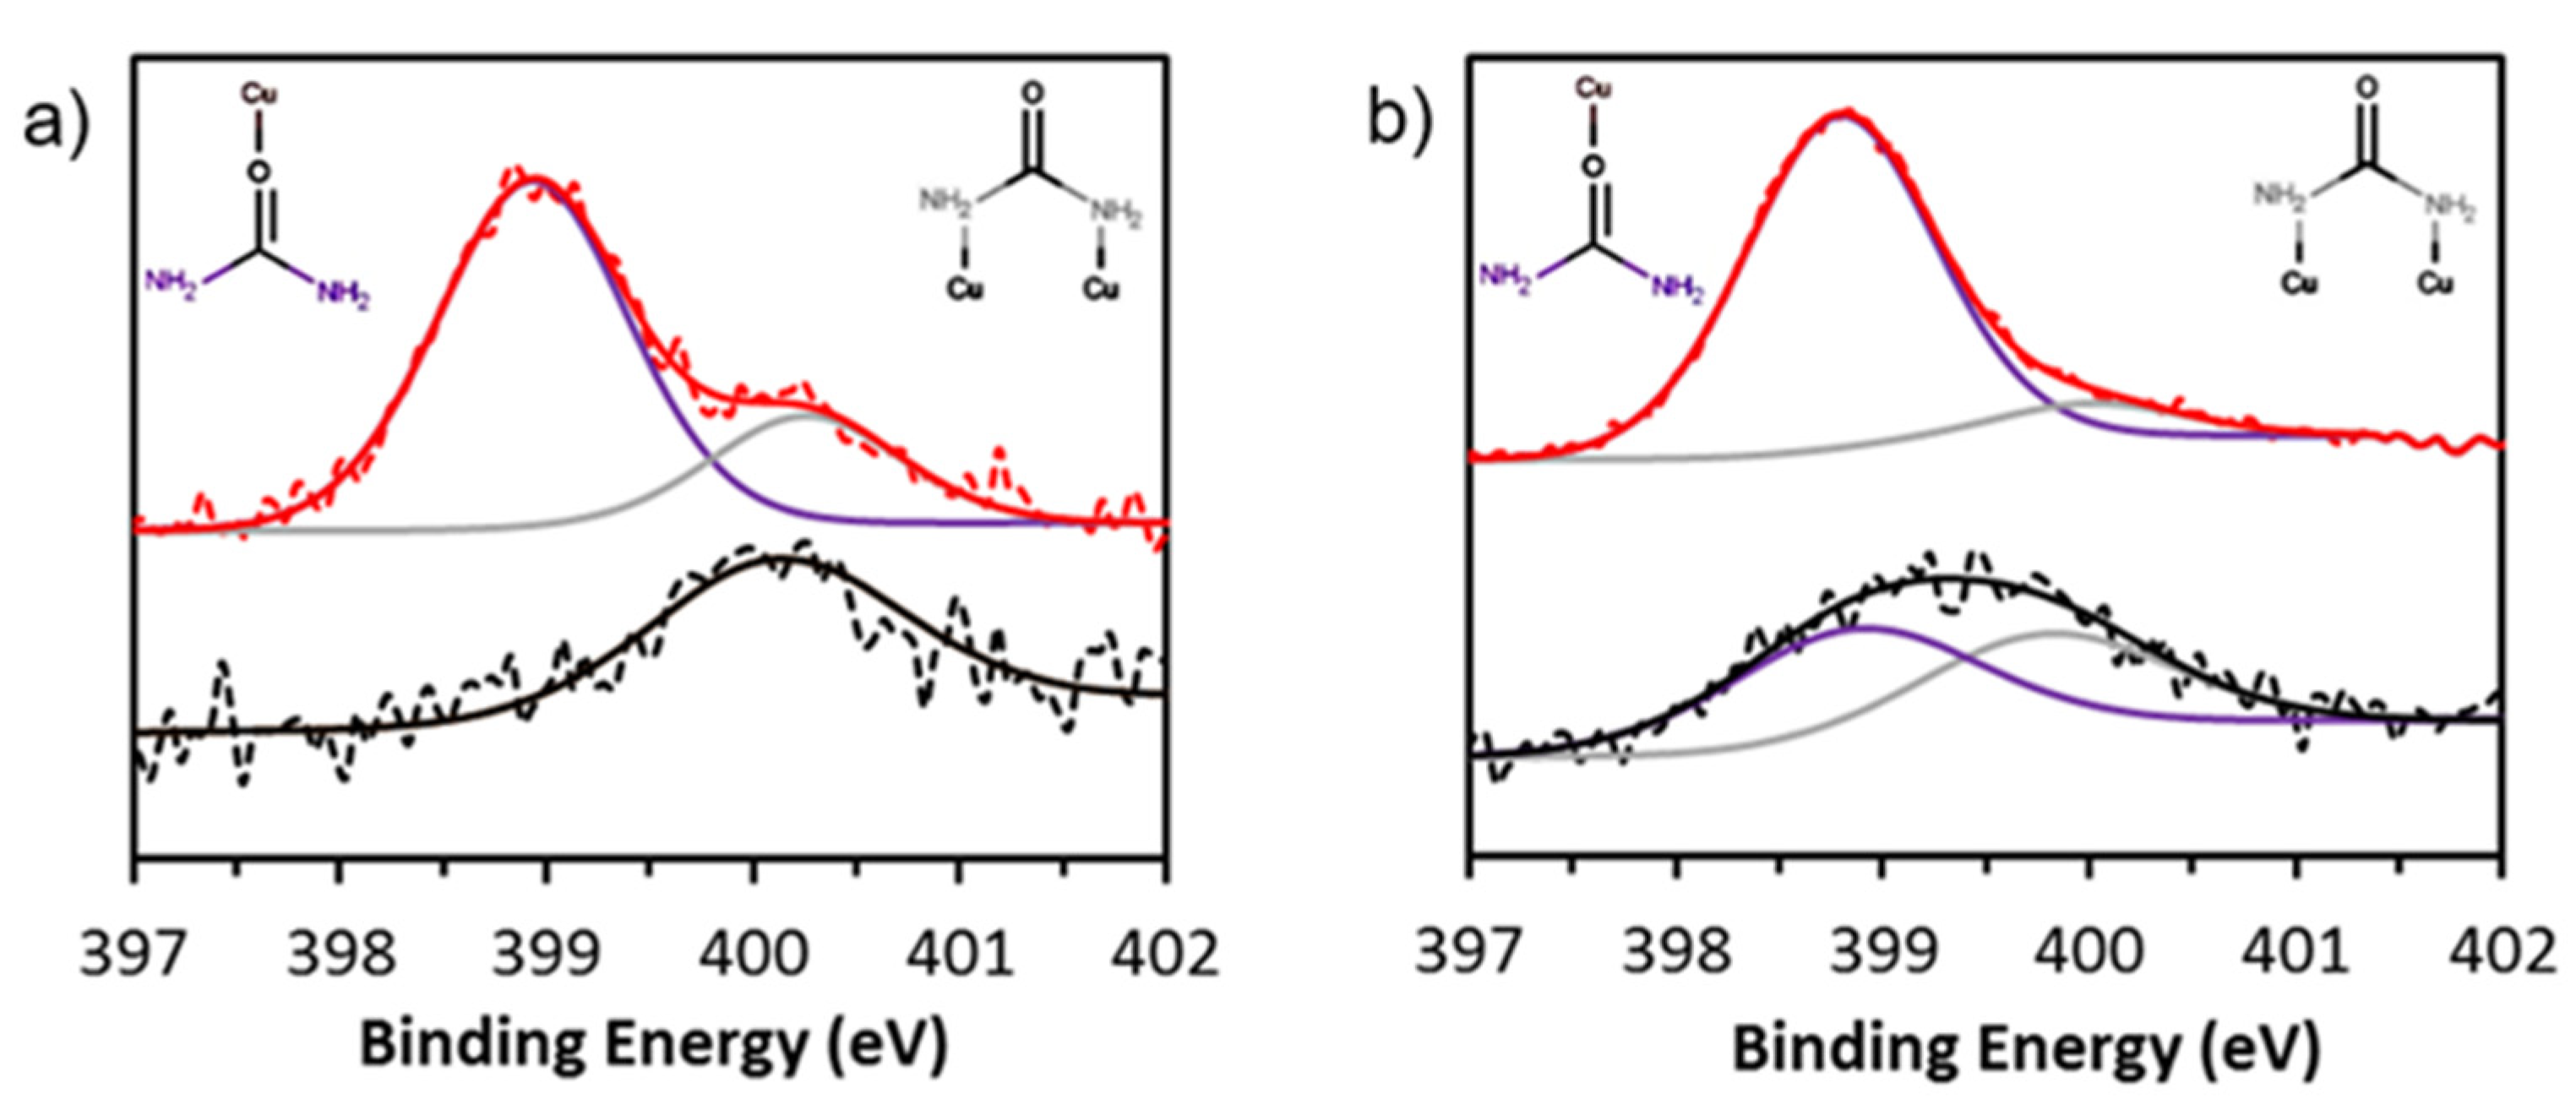
3.2. Effect of Urea on the Copper Foams

The catalyst fabricated employing 18mM HCl CF-18H was modified by adding urea in the foam electrodeposition bath to make CF-18H-xU (x represents the concentration, in mM, of urea employed). The electrodeposited foams were submerged in deionized water for 5 min to remove traces of the electrodeposition solution before electrochemical measurements. The copper foam formed from solutions with added 100 mM of urea (CF-18H-100U) has a flattened and less well-defined porous structure compared to CF-18H (SI Figure S4). This indicates that urea affects the deposition of the foam possibly being integrated to form urea-modified copper foams. The wall widths between the pores range from 5.9 to 23.5 μm, with an average width of 18.2 µm. The pore diameters range from 29.4 to 58.8 µm, smaller than CF-18H by 10 µm (data are summarized in SI Table S1).
In Figure 3, the top layer of CF-18H-100U is made of cuboctahedra and the lower layers comprise larger cuboctahedra interspersed with dendritic structures similar to what observed for CF-18H (Figure 1). The cuboctahedra at the surface are about 180 × 185 nm and the larger cuboctahedra at the bottom of the pores are around 300 × 300 nm. This is a similar size to those reported by Grosse et al., who grew 222 ± 47 nm copper cubes on carbon paper and copper foils [48]. The porous network spreads throughout the structure. Small cracks are observed in the urea-modified copper foam structure and are shown in detail in SI Figure S4. The structure around the crack comprises cuboctahedra interspersed with dendrites and, therefore, no overall change in the foam is caused as a result of the cracks.
The copper foam dip-coated in urea, CF-18H-DCU, exhibited a structure substantially similar to that of CF-18H, confirming that no morphological changes were observed upon wetting with the urea solution. Figure 4 depicts the top, edge and bottom of a pore in CF-18H-DCU. The dendritic copper coats the copper disc electrode at the bottom of the pore, but the cuboctahedra make up most of the pore edge. The cuboctahedra at the top of the pore are approximately 650 × 850 nm (height × width). At the bottom of the pore, the cuboctahedra are smaller, about 500 × 500 nm. These cuboctahedra are comparable in size with the largest of the copper cubes tested by Grosse et al. [48] (580 nm), who demonstrated that a larger cube size leads to greater selectivity for the formation of CO2 reduction products over the competing hydrogen evolution reaction. The 580 nm cube size also leads to the highest faradaic efficiency for n-propanol produced, compared to the other two cube sizes tested (220 and 320 nm).
The XRD analysis of urea-modified foams shows that peaks relating to Cu and Cu2O are present in both the electrodeposited and dip-coated copper-urea foams (Figure 5). The modified foams show the preferred orientation of Cu(111), with peaks corresponding to Cu(200), Cu(311), Cu(222) and Cu2O(111) also present. Comparing the two urea concentration extremes (10 and 100 mM): the ratio of Cu(111):Cu(200) is 1:0.35, Cu(111):Cu(220) is 1:0.1 and Cu(111):Cu(311) is 1:0.1 for CF-18H-10U. The ratios are slightly lower for CF-18H-100U, with ratios of Cu(111):Cu(200) 1:0.30, Cu(111):Cu(220) 1:0.03 and Cu(111):Cu(311) 1:0.06. This suggests that the crystal face of the copper foam does not change with the increasing concentration of urea.
The ratios of Cu(111) to Cu(200), Cu(311) and Cu(222) phases are unchanged between CF-18H-100U and CF-18H-DCU, indicating that the method by which urea is impregnated into the foam does not change the copper phases present in the foam. As expected, there is little difference between the XRD of CF-18H and CF-18H-DCU. Cuprous oxide is also present in the Cu-18H-xU (x = 10–100) foams with the main component being the Cu2O(111) phase (Figure 5).
The presence of urea on the copper surface was confirmed using X-ray photoelectron spectroscopy (XPS) and the spectra are presented in Figure 6. Nitrogen was detected in both copper foams modified with urea. There was no nitrogen in the CF-18H sample, which had no urea. The protonation state appeared to affect the binding of urea on copper. The foam CF-18H-100U deposited from acidified urea solution showed a single nitrogen signal at 400.0 eV (red dotted trace in Figure 6a), possibly corresponding to urea bound to the copper foam through nitrogen. It is known that, in acidic media, the carbonyl oxygen of urea is protonated [57], leaving the nitrogen free to interact with copper. This was also observed in the case of CF-18H-DCU, though the XPS signal consisted of the convolution of two peaks at 399.8 eV and 398.9 eV (blue dotted trace in Figure 6a). The peak at 399.8 eV (purple trace) can be assigned to urea bound to copper through nitrogen, related to the 400.0 eV peak of CF-18H-100U.
The peak at 398.9 eV (green trace) is tentatively assigned to urea bound to copper through the carbonyl group [49]. The copper 2p signals are consistent for all samples and confirm the presence of copper metal (Figure 6b). Weak satellite peaks are observed around 947 eV. These are consistent with the presence of Cu2O, which was also observed by XRD. The most intense feature of the copper Auger signal of CF-18H-100U is found at 918.4 eV, consistent with the CF-18H copper Auger (Figure 6c). However, the Auger of CF-18H-DCU shows a stronger feature at 916.1 eV compared to 918.4 eV. The peak at 916.1 eV is dominant and indicates a surface richer in Cu2O over Cu in the case of the dip-coated foam [58].
The electrochemical properties of CF-18H and CF-18H-100U, in addition to the dip-coated catalyst CF-18H-DCU, were also compared. The double-layer capacitance method of determining the electrochemically active surface area was used [59]. As shown in Table 1, the copper foams have similar electrochemically active surface areas (ECSA), meaning that they are unaffected by the addition of urea in the deposition bath or dip-coating step. The foam surface area is between 225 and 240 times larger than the electrode geometric surface area for the sample prepared using 18 mM of HCl without and with urea, respectively. This is double that observed in our previous work [49] and quadruple of that achieved by Dutta et al. [56]. The cyclic voltammograms and corresponding current vs. scan rate plots are provided in SI Figure S5, the current density calculations in SI Table S3.

3.3. CO2 Electrocatalytic Activity of Foams

The CO2 electrocatalytic activity of the copper foams deposited in the presence of different amounts of urea (CF-18H-xU) was tested at −0.83 V vs. RHE. The liquid products of the urea copper foams are depicted in SI Figure S6. The faradaic efficiency increases with the concentration of urea until ~60 m; afterwards, a plateau is observed, making CF-18H-100U the foam of choice for further study.
The three foams, CF-18H, CF-18H-100U and CF-18H-DCU, were then tested for their activity as CO2 reduction catalysts at various potentials in a 0.1 M KHCO3 solution while bubbling CO2 at 40 mL/min. All products of electrocatalysis for CF-18H and CF-18H-100U are available in Figure 7 and SI Figure S7. We note that the CO2 electrolysis experiments were affected by significant variability, as also observed in other studies [14,15,60]. In some instances, the values of faradaic efficiency of one material fell within the error bars of the other and vice versa. In such a case, no claim could be made for either of the two catalysts, CF-18H and CF-18H-100U, performing better than the other, particularly in the case of n-propanol production (Figure 7c). However, some significant differences could be appreciated, such as the CF-18H foam promoting the electroreduction of CO2 to ethylene more effectively than the CF-18H-100U foam at −0.93 V vs. RHE. Interestingly, i-propanol was generated using the CF-18H foam, albeit in small quantities—the maximum average faradaic efficiency is 0.87% at −0.93 V vs. RHE (SI Table S4). This was lower for CF-18H-100U, 0.11%. A representative NMR spectrum is depicted in SI Figure S8 for CO2 electrolysis using CF-18H at −0.83 V vs. RHE.
The dip-coated catalyst CF-18H-DCU demonstrated a different catalytic trend with n-propanol increasing with more negative potentials compared to CF-18H and CF-18H-100U. For CF-18H and CF-18H-100U, the C1, C2 and C3 product distributions resulting from the electrocatalytic reduction of CO2 are shown in Figure 8. As the potential became more reductive, the overall faradaic efficiency for carbon-based products decreased progressively in favor of hydrogen evolution (data are summarized in SI Table S4).
However, at more negative potentials, there was also a trade-off in the production of more C2 + C3 products (ethylene + propanol) in place of C1 products. At −0.70 V vs. RHE, only C1 products were detected in the form of carbon monoxide and formate, but no methane. C2 and C3 products were first observed at −0.75 V vs. RHE. At −0.83 V vs. RHE, C2 + C3 products were dominant over C1 products, a trend which continued with increasing potential. Trace amounts of methane and methanol were only observed at this potential. n-Propanol was the dominant C3 product and production peaked at −0.83 V vs. RHE. i-Propanol and trace amounts of acetone were the other C3 products observed.
The CF-18H and CF-18H-100U catalysts are compared to literature catalysts in Table 2. The urea-modified foam has an overall higher current density in total, compared to previously reported catalysts.

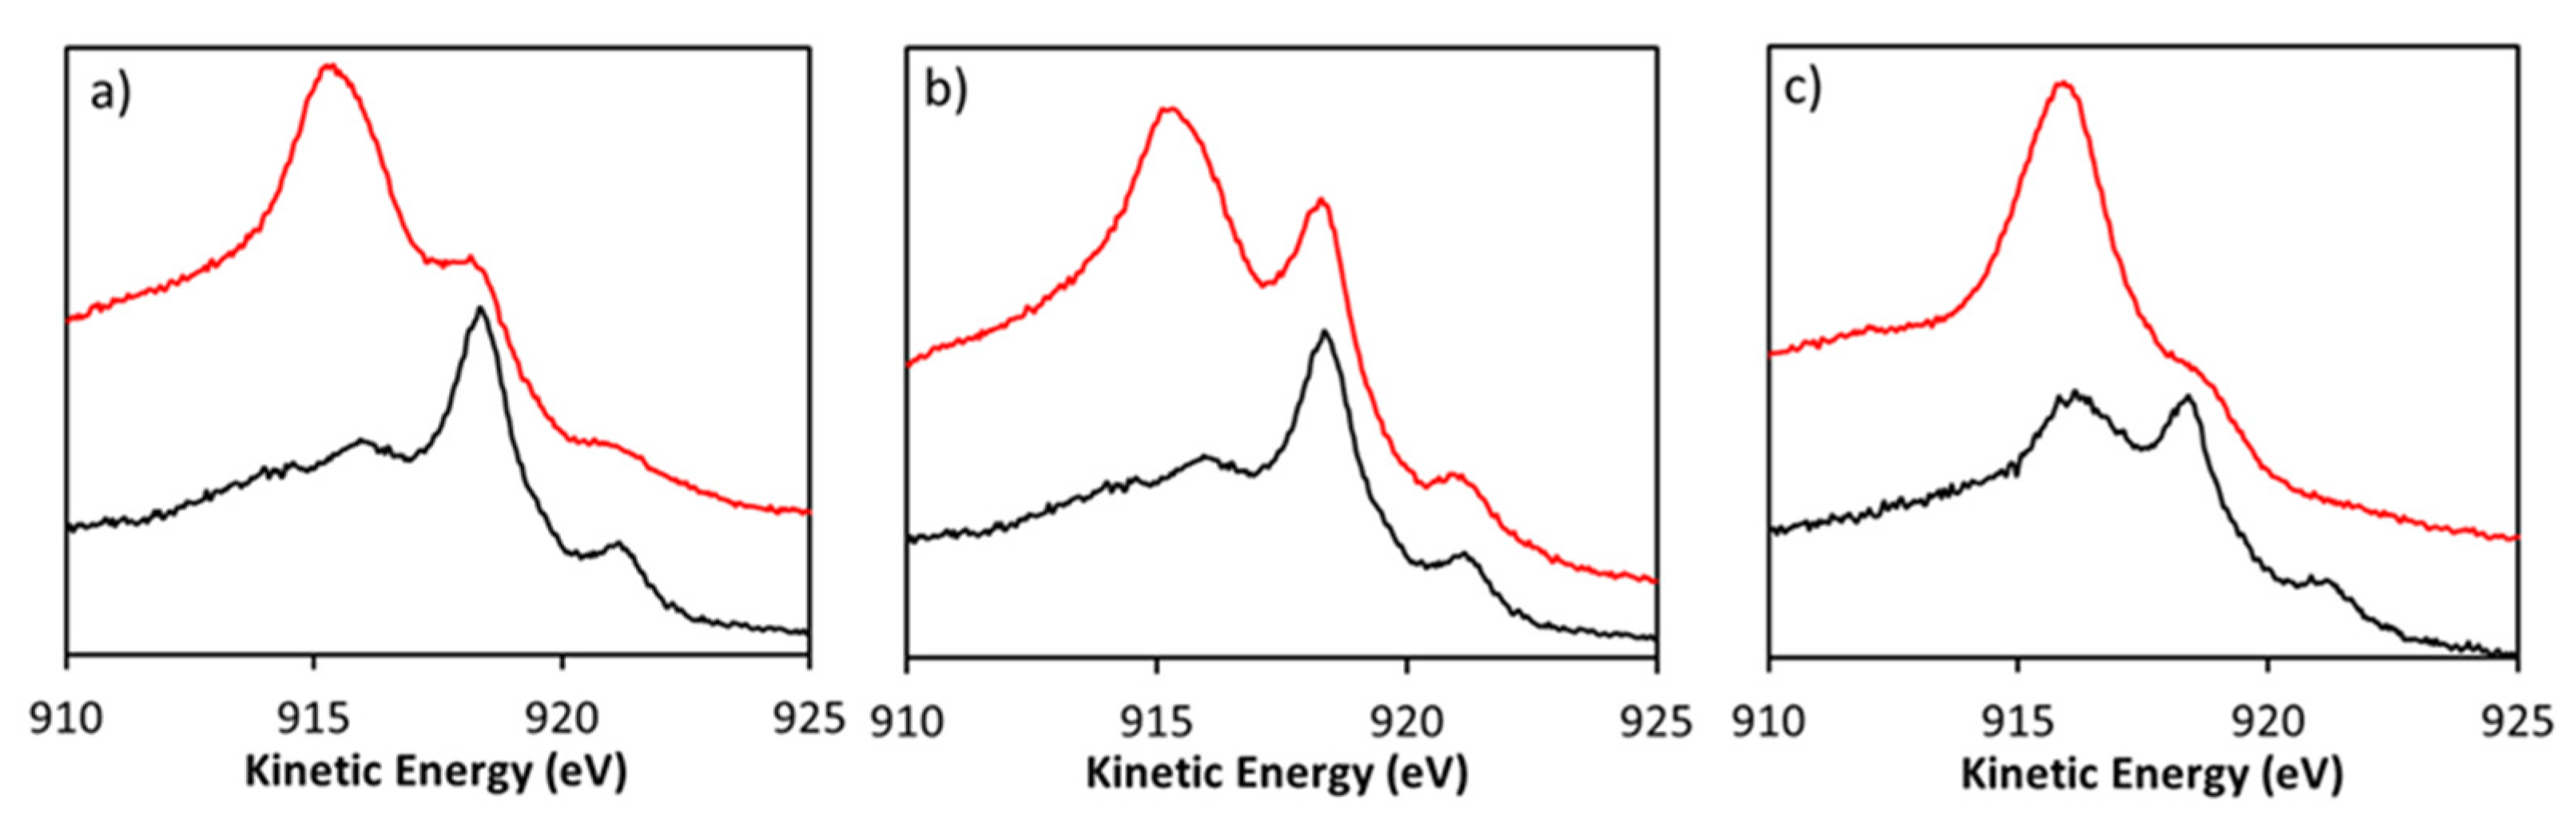
3.4. Post-Catalysis Characterization

The CF-18H and CF-18H-100U foams were characterized after catalysis to look at their response to the applied potential. The analysis in this section is based on results gained from ex situ measurements, including SEM, XRD and XPS. SEM revealed that multiple cracks had formed both on the surface and further into the porous network of CF-18H. The cuboctahedra observed before electrolysis (Figure 1) were no longer present after 35 min of electrolysis (Figure 9). The dendrites, a minor component in the as-prepared foams, became the only component of the foam after electrolysis, as shown in Figure 9b. However, the microstructure of the foam did not show apparent changes in the absence of CO2 under the same reduction conditions.
This same phenomenon was observed for CF-18H-100U. The cuboctahedra, present as the major component of the foam before electrolysis (Figure 3), are no longer present after 35 min (Figure 9f). Therefore, we hypothesize that the copper foam responded to the process conditions of CO2 electrolysis by re-arranging in situ during catalysis.
XRD analysis of the copper foams after electrolysis corroborated the findings in the SEM of less crystalline materials (Figure 10). For CF-18H, the peak intensity was reduced and, as can be observed in Figure 10a, the peaks are generally broader, indicative of smaller crystallite size. The rise of baseline at low diffraction angles suggests that an amorphous phase was also formed upon catalysis. Post-catalysis, there was a significant increase in the relative peak intensity for Cu(200); pre-catalysis, the Cu(111):Cu(200) ratio was 1:0.14, while, post-catalysis, it was 1:0.39 with a significant loss of Cu(111) domains. There is also a small yet detectable peak at 47.5°, tentatively assigned to the presence of trace amounts of CuCl(220) phase [64] (Figure 10a), which is localized on the surfaces of the foam, as seen from the Cu LMM Auger spectra discussed later. Although care was taken to avoid any contamination in the CO2 electrolysis cell, there appears to have been a trace amount of chloride ions in solution to form insoluble Cu2O-derived CuCl [64]. It follows that chloride contaminations were introduced during the electrolysis possibly due to the Ag/AgCl reference electrode and the small solution volume in the cathodic compartment (3.5 mL). Comparable changes were observed for CF-18H-100U (Figure 10b). In line with the transition of the copper from cuboctahedra to dendrites, there is also a decrease in the Cu2O(311) facet and an increase of Cu2O(222). CF-18H-100U displays an increased orientation of the Cu(220) phase and a more equal spread of orientations post-electrolysis.
The presence of chloride contaminations was also observed in the XPS spectra of the foams after electrolysis (Figure 11). Before electrolysis, the Auger signal of CF-18H is typical for copper metal, with its most intense feature centered at 918.7 eV [65]. After 35 min of electrolysis, the main feature is found at 915.6 eV, which is attributed to CuCl [66,67]. The Cu Auger of CF-18H-100U displays similar behavior, although it retains a higher Cu metal content post-electrolysis, compared to CF-18H. Corresponding peaks were observed in the Cl 2p spectra. Comparatively, more CuCl is present in the post-catalysis XPS spectra of CF-18H than for CF-18H-100U. For CF-18H and CF-18H-100U, the Cu 2p peaks were unchanged before and after 35 min of electrolysis (SI Figure S9, to be compared with Figure 6b). For CF-18H-DCU, both Cu2O and copper metal are present on the surface of the foam before electrolysis, with the Cu2O Cu(LMM) becoming dominant after 35 min (Figure 11c).
A key concern of the work was whether the urea would withstand the electrolysis conditions and remain bound to the copper foam surface. XPS analysis after 35 min of electrolysis was carried out to verify this. The dip-coated and non-dip-coated foams behaved differently. CF-18H-100H started with all the nitrogen in one environment at 400.3 eV (Figure 12). However, after electrolysis, there were two nitrogen environments, 398.9 eV and 400.3 eV. As stated earlier in the paper, we ascribe the peak at 398.9 eV to urea bound to the copper through the carbonyl, whereas the peak at 400.3 eV is assigned to urea bound through the amine. We assume that the acid present in the formation of CF-18H-100U protonates the carbonyl oxygen of the urea [57], forcing urea to coordinate through the amine groups (giving rise to the single peak at 400.3 eV pre-catalysis).
In the alkaline environment during catalysis (due to proton consumption), the urea carbonyl group is de-protonated, allowing the urea to bind to copper in its preferential form, through the carbonyl group, giving rise to the peak at 398.9 eV. Some urea must continue to bind through the amine groups to leave the minor peak at 400.3 eV. In contrast, for CF-18H-DCU, urea is coated onto the copper foam from a pH 7 aqueous solution. Urea in water hydrates on both carbonyl and amine sides [68], leading to a mixture of nitrogen-bound and carbonyl-bound urea on the copper surface before electrolysis (Figure 12). After catalysis, most of the urea seems instead to be predominantly carbonyl-bound. We tentatively suggest that the difference in reactivity between CF-18H-100U and CF-18H-DCU could in part be due to the binding modes of the urea at the start and during catalysis. The complex and numerous changes observed upon electrolysis have a significant impact on the catalytic activity of the copper foams. CF-18H showed no catalytic activity for n-propanol after 2 h of electrolysis, whereas CF-18H-100U was still active with a faradaic efficiency of about 1%.

4. Conclusions

This work describes a procedure for the fabrication of cuboctahedral porous copper electrodes under various conditions. The formation of the foams was analyzed using different concentrations of HCl during electrodeposition. It was confirmed that the concentration of HCl affects the average wall width and pore size of the foam, thereby making them, respectively, thicker and larger at higher HCl concentrations. The addition of urea did not significantly change the crystalline structure of the resulting urea-modified foams. Correspondingly, we did not observe a significant change in the faradaic efficiency of CO2 conversion to n-propanol between plain and urea-modified foams.
After CO2 electrolysis, the foam changed from a cuboctahedral to a dendritic morphology, suggesting that the copper responded to CO2 electrolysis by re-arranging in situ during catalysis. The re-arrangement of the copper has been characterized ex situ using SEM and corroborated with XRD. The presence of urea and its method of binding to the copper seems to have affected the catalyst response and structure–activity relationships. Indeed, pristine foams showed no catalytic activity for n-propanol after 2 h of electrolysis, while urea-modified foams continued showing faradaic efficiencies of about 1%.

Supplementary Materials

The following are available online at https://0-www-mdpi-com.brum.beds.ac.uk/article/10.3390/chemistry3030048/s1, Experimental details including chemical reagents and electrocatalysis procedures. Figure S1 and Table S1 contains SEM images, wall and pore sizes, of copper foams. Figure S2 presents the XRD of a copper foam on carbon. Table S2, S4 and Figure S7 show the faradaic efficiencies of CO2 reduction to liquid and gaseous products. Figure S5 contains the cyclic voltammetries and current vs. scan rate plots to determine ECSA of copper foams. Figure S8 presents the NMR spectrum showing the formation of i-propanol upon CO2 reduction. XPS spectra Cl 2p and Cu 2p of copper foams.

Author Contributions

Conceptualization, J.A.R. and E.A.; methodology, J.A.R., L.B.H. and O.J.E.B.; formal analysis, J.A.R., O.J.E.B. and E.A.; investigation, J.A.R., E.K., L.B.H. and O.J.E.B.; data curation, J.A.R., E.K., L.B.H. and O.J.E.B.; writing—original draft preparation, J.A.R. and E.A.; writing—review and editing, J.A.R., E.A. and S.H.-A.; supervision, E.A.; project administration, E.A. and A.R.B.; funding acquisition, E.A. and A.R.B. All authors have read and agreed to the published version of the manuscript.

Funding

This work is part of the Reducing Industrial Carbon Emissions (RICE) and Flexible Integrated Energy Systems (FLEXIS) research operations funded by the Welsh European Funding Office (WEFO) through the Welsh Government. Financial support was also provided by the Engineering and Physical Sciences Research Council (EPSRC) through the SUSTAIN Manufacturing Hub (EP/S018107/1) and grant EP/N009525/1. The Welsh Government is also acknowledged for the Sêr Cymru II Recapturing Talent Fellowship partly funded by the European Regional Development Fund (ERDF). We would like to acknowledge the assistance provided by Swansea University College of Engineering AIM Facility, which was funded in part by the EPSRC (EP/M028267/1), the European Regional Development Fund through the Welsh Government (80708) and the Ser Solar project via the Welsh Government. JAR would like to acknowledge Dr Joel Loveridge for helpful NMR discussions.

Data Availability Statement

The data presented in this study are available in supplementary material.

Conflicts of Interest

The authors declare no conflict of interest.

References

  1. Graf, F. STOREandGO, Innovative large-scale energy STOragE technologies AND Power-to-Gas concepts after Optimisation, H2020. Impact 2018, 2018, 81–83. [Google Scholar] [CrossRef]
  2. Reisch, M. Solvay adds DuPont battery materials. Chem. Eng. News 2017, 95, 14–15. [Google Scholar] [CrossRef]
  3. Keith, D.W.; Holmes, G.; Angelo, D.S.; Heidel, K. A Process for Capturing CO2 from the Atmosphere. Joule 2018, 2, 1573–1594. [Google Scholar] [CrossRef] [Green Version]
  4. Holmes, G.; Nold, K.; Walsh, T.; Heidel, K.; Henderson, M.A.; Ritchie, J.; Klavins, P.; Singh, A.; Keith, D.W. Outdoor Prototype Results for Direct Atmospheric Capture of Carbon Dioxide. Energy Procedia 2013, 37, 6079–6095. [Google Scholar] [CrossRef] [Green Version]
  5. Zapantis, A.; Townsend, A.; Rassool, D. Policy Priorities to Incentivise Large Scale Deployment of CCS; Thought Leadership Report; Global CCS Institute: Docklands, Australia, 2019. [Google Scholar]
  6. Irlam, L. Global Costs of Carbon Capture and Storage; Global CCS Institute: Docklands, Australia, 2017. [Google Scholar]
  7. Voiry, D.; Shin, H.S.; Loh, K.P.; Chhowalla, M. Low-dimensional catalysts for hydrogen evolution and CO2 reduction. Nat. Rev. Chem. 2018, 2, 0105. [Google Scholar] [CrossRef]
  8. Rao, H.; Schmidt, L.C.; Bonin, J.; Robert, M. Visible-light-driven methane formation from CO2 with a molecular iron catalyst. Nat. Cell Biol. 2017, 548, 74–77. [Google Scholar] [CrossRef] [PubMed]
  9. Lu, Q.; Jiao, F. Electrochemical CO2 reduction: Electrocatalyst, reaction mechanism, and process engineering. Nano Energy 2016, 29, 439–456. [Google Scholar] [CrossRef] [Green Version]
  10. Schlögl, R.; Abanades, C.; Aresta, M.; Azapagic, A.; Blekkan, E.A.; Cantat, T.; Centi, G.; Duic, N.; El Khamlichi, A.; Hutchings, G.; et al. Novel Carbon Capture and Utilisation Technologies: Research and Climate Aspects; SAPEA: Berlin, Germany, 2018. [Google Scholar]
  11. Nørskov, J.K.; Weckhuysen, B.; Centi, G.; ChorkendorffI, S.R.; Marin, G.; Grimaud, A.; Rossmeisl, J.; Strasser, P.; Koper, M.; Roldan, B.; et al. Research needs towards sustainable production of fuels and chemicals. Energy X 2019. Available online: https://www.energy-x.eu/wp-content/uploads/2019/10/Energy-X-Research-needs-report.pdf (accessed on 28 June 2021).
  12. Yoshio, H.; Katsuhei, K.; Shin, S. Production of CO and CH4 in electrochemical reduction of CO2 at metal electrodes in aqueous hydrogencarbonate solution. J. Chem. Lett. 1985, 14, 1695–1698. [Google Scholar]
  13. Hori, Y. Modern Aspects of Electrochemistry; Springer: New York, NY, USA, 2008; Volume 2. [Google Scholar]
  14. Dutta, A.; Morstein, C.E.; Rahaman, M.; López, A.C.; Broekmann, P. Beyond Copper in CO2 Electrolysis: Effective Hydrocarbon Production on Silver-Nanofoam Catalysts. ACS Catal. 2018, 8, 8357–8368. [Google Scholar] [CrossRef]
  15. Kuhl, K.P.; Hatsukade, T.; Cave, E.R.; Abram, D.N.; Kibsgaard, J.; Jaramillo, T.F. Electrocatalytic Conversion of Carbon Dioxide to Methane and Methanol on Transition Metal Surfaces. J. Am. Chem. Soc. 2014, 136, 14107–14113. [Google Scholar] [CrossRef]
  16. Hori, Y. Electrochemical CO2 Reduction on Metal Electrodes. In Modern Aspects of Electrochemistry; Vayenas, C.G., White, R.E., Gamboa-Aldeco, M.E., Eds.; Springer: New York, NY, USA, 2008; pp. 89–189. [Google Scholar]
  17. Hori, Y.; Murata, A.; Takahashi, R. Formation of hydrocarbons in the electrochemical reduction of carbon dioxide at a copper electrode in aqueous solution. J. Chem. Soc. Faraday Trans. 1 Phys. Chem. Condens. Phases 1989, 85, 2309–2326. [Google Scholar] [CrossRef]
  18. DeWulf, D.W.; Jin, T.; Bard, A.J. Electrochemical and Surface Studies of Carbon Dioxide Reduction to Methane and Ethylene at Copper Electrodes in Aqueous Solutions. J. Electrochem. Soc. 1989, 136, 1686–1691. [Google Scholar] [CrossRef]
  19. Montoya, J.H.; Peterson, A.A.; Nørskov, J.K. Insights into C-C Coupling in CO2 Electroreduction on Copper Electrodes. ChemCatChem 2013, 5, 737–742. [Google Scholar] [CrossRef]
  20. Nitopi, S.; Bertheussen, E.; Scott, S.B.; Liu, X.; Engstfeld, A.K.; Horch, S.; Seger, B.; Stephens, I.E.L.; Chan, K.; Hahn, C.; et al. Progress and Perspectives of Electrochemical CO2 Reduction on Copper in Aqueous Electrolyte. Chem. Rev. 2019, 119, 7610–7672. [Google Scholar] [CrossRef] [Green Version]
  21. Lv, W.; Zhou, J.; Bei, J.; Zhang, R.; Wang, L.; Xu, Q.; Wang, W. Electrodeposition of nano-sized bismuth on copper foil as electrocatalyst for reduction of CO2 to formate. Appl. Surf. Sci. 2017, 393, 191–196. [Google Scholar] [CrossRef]
  22. Lv, W.; Zhou, J.; Kong, F.; Fang, H.; Wang, W. Porous tin-based film deposited on copper foil for electrochemical reduction of carbon dioxide to formate. Int. J. Hydrogen Energy 2016, 41, 1585–1591. [Google Scholar] [CrossRef]
  23. Lum, Y.; Yue, B.; Lobaccaro, P.; Bell, A.T.; Ager, J.W. Optimizing C-C Coupling on Oxide-Derived Copper Catalysts for Electrochemical CO2 Reduction. J. Phys. Chem. C 2017, 121, 14191–14203. [Google Scholar] [CrossRef] [Green Version]
  24. Cheng, T.; Xiao, H.; Goddard, W.A. Nature of the Active Sites for CO Reduction on Copper Nanoparticles; Suggestions for Optimizing Performance. J. Am. Chem. Soc. 2017, 139, 11642–11645. [Google Scholar] [CrossRef] [PubMed] [Green Version]
  25. Kas, R.; Kortlever, R.; Yılmaz, H.; Koper, M.T.M.; Mul, G. Manipulating the Hydrocarbon Selectivity of Copper Nanoparticles in CO2 Electroreduction by Process Conditions. ChemElectroChem 2015, 2, 354–358. [Google Scholar] [CrossRef]
  26. Dongare, S.; Singh, N.; Bhunia, H. Electrocatalytic reduction of CO2 to useful chemicals on copper nanoparticles. Appl. Surf. Sci. 2021, 537, 148020. [Google Scholar] [CrossRef]
  27. Huang, J.; Yang, T.; Zhao, K.; Chen, S.; Huang, Q.; Han, Y. Copper-comprising nanocrystals as well-defined electrocatalysts to advance electrochemical CO2 reduction. J. Energy Chem. 2021, 62, 71–102. [Google Scholar] [CrossRef]
  28. Zhang, Z.; Zhang, J.; Jia, A.-P.; Lu, J.-Q.; Huang, W. Morphology-dependent CO Reduction Kinetic and Surface Copper Species Evolution of Cu2O Nanocrystals. J. Phys. Chem. C 2020, 124, 21568–21576. [Google Scholar] [CrossRef]
  29. Gorginpour, F.; Zali-Boeini, H. Synergistic effect of copper nanocrystals-nanoparticles incorporated in a porous organic polymer for the Ullmann C-O coupling reaction. Mol. Catal. 2021, 504, 111460. [Google Scholar] [CrossRef]
  30. Kung, C.-W.; Audu, C.O.; Peters, A.W.; Noh, H.; Farha, O.K.; Hupp, J.T. Copper Nanoparticles Installed in Metal-Organic Framework Thin Films are Electrocatalytically Competent for CO2 Reduction. ACS Energy Lett. 2017, 2, 2394–2401. [Google Scholar] [CrossRef]
  31. Kim, M.K.; Kim, H.J.; Lim, H.; Kwon, Y.; Jeong, H.M. Metal-organic framework-mediated strategy for enhanced methane production on copper nanoparticles in electrochemical CO2 reduction. Electrochim. Acta 2019, 306, 28–34. [Google Scholar] [CrossRef]
  32. Rayer, A.V.; Reid, E.; Kataria, A.; Luz, I.; Thompson, S.J.; Lail, M.; Zhou, J.; Soukri, M. Electrochemical carbon dioxide reduction to isopropanol using novel carbonized copper metal organic framework derived electrodes. J. CO2 Util. 2020, 39, 101159. [Google Scholar] [CrossRef]
  33. Dutta, A.; Rahaman, M.; Hecker, B.; Drnec, J.; Kiran, K.; Montiel, I.Z.; Weber, D.J.; Zanetti, A.; López, A.C.; Martens, I.; et al. CO2 electrolysis—Complementary operando XRD, XAS and Raman spectroscopy study on the stability of CuxO foam catalysts. J. Catal. 2020, 389, 592–603. [Google Scholar] [CrossRef]
  34. Klingan, K.; Kottakkat, T.; Jovanov, Z.P.; Jiang, S.; Pasquini, C.; Scholten, F.; Kubella, P.; Bergmann, A.; Cuenya, B.R.; Roth, C.; et al. Reactivity Determinants in Electrodeposited Cu Foams for Electrochemical CO2 Reduction. ChemSusChem 2018, 11, 3449–3459. [Google Scholar] [CrossRef] [PubMed]
  35. Zhong, S.; Yang, X.; Cao, Z.; Dong, X.; Kozlov, S.M.; Falivene, L.; Huang, J.-K.; Zhou, X.; Hedhili, M.N.; Lai, Z.; et al. Efficient electrochemical transformation of CO2 to C2/C3 chemicals on benzimidazole-functionalized copper surfaces. Chem. Commun. 2018, 54, 11324–11327. [Google Scholar] [CrossRef]
  36. Kuhl, K.P.; Cave, E.R.; Abram, D.N.; Jaramillo, T.F. New insights into the electrochemical reduction of carbon dioxide on metallic copper surfaces. Energy Environ. Sci. 2012, 5, 7050–7059. [Google Scholar] [CrossRef]
  37. Jouny, M.; Luc, W.W.; Jiao, F. General Techno-Economic Analysis of CO2 Electrolysis Systems. Ind. Eng. Chem. Res. 2018, 57, 2165–2177. [Google Scholar] [CrossRef]
  38. Hernandez-Aldave, S.; Andreoli, E. Fundamentals of Gas Diffusion Electrodes and Electrolysers for Carbon Dioxide Utilisation: Challenges and Opportunities. Catalysts 2020, 10, 713. [Google Scholar] [CrossRef]
  39. Nikolić, N.D.; Branković, G.; Pavlović, M.G.; Popov, K.I. The effect of hydrogen co-deposition on the morphology of copper electrodeposits. II. Correlation between the properties of electrolytic solutions and the quantity of evolved hydrogen. J. Electroanal. Chem. 2008, 621, 13–21. [Google Scholar] [CrossRef]
  40. Shin, H.-C.; Dong, J.; Liu, M. Nanoporous Structures Prepared by an Electrochemical Deposition Process. Adv. Mater. 2003, 15, 1610–1614. [Google Scholar] [CrossRef]
  41. Shin, H.-C.; Liu, M. Copper Foam Structures with Highly Porous Nanostructured Walls. Chem. Mater. 2004, 16, 5460–5464. [Google Scholar] [CrossRef]
  42. Kim, J.-H.; Kim, R.-H.; Kwon, H.-S. Preparation of copper foam with 3-dimensionally interconnected spherical pore network by electrodeposition. Electrochem. Commun. 2008, 10, 1148–1151. [Google Scholar] [CrossRef]
  43. Garza, A.J.; Bell, A.T.; Head-Gordon, M. Mechanism of CO2 Reduction at Copper Surfaces: Pathways to C2 Products. ACS Catal. 2018, 8, 1490–1499. [Google Scholar] [CrossRef] [Green Version]
  44. Kortlever, R.; Shen, J.; Schouten, K.J.P.; Calle-Vallejo, F.; Koper, M.T.M. Catalysts and Reaction Pathways for the Electrochemical Reduction of Carbon Dioxide. J. Phys. Chem. Lett. 2015, 6, 4073–4082. [Google Scholar] [CrossRef]
  45. Han, Z.; Kortlever, R.; Chen, H.Y.; Peters, J.C.; Agapie, T. CO2 Reduction Selective for C ≥ 2 Products on Polycrystalline Copper with N-Substituted Pyridinium Additives. ACS Central Sci. 2017, 3, 853–859. [Google Scholar] [CrossRef] [Green Version]
  46. Kim, D.; Kley, C.S.; Li, Y.; Yang, P. Copper nanoparticle ensembles for selective electroreduction of CO2 to C2–C3 products. Proc. Natl. Acad. Sci. USA 2017, 114, 10560–10565. [Google Scholar] [CrossRef] [Green Version]
  47. Ren, D.; Wong, N.T.; Handoko, A.D.; Huang, Y.; Yeo, B.S. Mechanistic Insights into the Enhanced Activity and Stability of Agglomerated Cu Nanocrystals for the Electrochemical Reduction of Carbon Dioxide to n-Propanol. J. Phys. Chem. Lett. 2016, 7, 20–24. [Google Scholar] [CrossRef] [PubMed]
  48. Grosse, P.; Gao, D.; Scholten, F.; Sinev, I.; Mistry, H.; Cuenya, B.R. Dynamic Changes in the Structure, Chemical State and Catalytic Selectivity of Cu Nanocubes during CO2 Electroreduction: Size and Support Effects. Angew. Chem. Int. Ed. 2018, 57, 6192–6197. [Google Scholar] [CrossRef] [Green Version]
  49. Ahn, S.; Klyukin, K.; Wakeham, R.J.; Rudd, J.A.; Lewis, A.R.; Alexander, S.; Carla, F.; Alexandrov, V.; Andreoli, E. Poly-Amide Modified Copper Foam Electrodes for Enhanced Electrochemical Reduction of Carbon Dioxide. ACS Catal. 2018, 8, 4132–4142. [Google Scholar] [CrossRef]
  50. Dutta, A.; Rahaman, M.; Mohos, M.; Zanetti, A.; Broekmann, P. Electrochemical CO2 Conversion Using Skeleton (Sponge) Type of Cu Catalysts. ACS Catal. 2017, 7, 5431–5437. [Google Scholar] [CrossRef]
  51. Xie, M.S.; Xia, B.Y.; Li, Y.; Yan, Y.; Yang, Y.; Sun, Q.; Chan, S.H.; Fisher, A.; Wang, X. Amino acid modified copper electrodes for the enhanced selective electroreduction of carbon dioxide towards hydrocarbons. Energy Environ. Sci. 2016, 9, 1687–1695. [Google Scholar] [CrossRef]
  52. Hao, G.L.; Xu, Q.P.; Han, F.S.; Li, W.D.; Bai, S.M. Processing and damping behaviour of porous copper. Powder Met. 2009, 52, 145–150. [Google Scholar] [CrossRef]
  53. Zhang, Q.B.; Abbott, A.; Yang, C. Electrochemical fabrication of nanoporous copper films in choline chloride-urea deep eutectic solvent. Phys. Chem. Chem. Phys. 2015, 17, 14702–14709. [Google Scholar] [CrossRef] [PubMed]
  54. Wuttig, A.; Surendranath, Y. Impurity Ion Complexation Enhances Carbon Dioxide Reduction Catalysis. ACS Catal. 2015, 5, 4479–4484. [Google Scholar] [CrossRef] [Green Version]
  55. Coxeter, H.S.M. Regular Polytopes, 3rd ed.; Dover Publications: Methuen, MA, USA, 1973. [Google Scholar]
  56. Dutta, A.; Rahaman, M.; Luedi, N.C.; Mohos, M.; Broekmann, P. Morphology Matters: Tuning the Product Distribution of CO2 Electroreduction on Oxide-Derived Cu Foam Catalysts. ACS Catal. 2016, 6, 3804–3814. [Google Scholar] [CrossRef]
  57. Wen, N.; Brooker, M.H. Urea protonation: Raman and theoretical study. J. Phys. Chem. 1993, 97, 8608–8616. [Google Scholar] [CrossRef]
  58. Biesinger, M.C. Advanced analysis of copper X-ray photoelectron spectra. Surf. Interface Anal. 2017, 49, 1325–1334. [Google Scholar] [CrossRef]
  59. Li, C.W.; Kanan, M.W. CO2 Reduction at Low Overpotential on Cu Electrodes Resulting from the Reduction of Thick Cu2O Films. J. Am. Chem. Soc. 2012, 134, 7231–7234. [Google Scholar] [CrossRef]
  60. Morales-Guio, C.G.; Cave, E.R.; Nitopi, S.; Feaster, J.; Wang, L.; Kuhl, K.P.; Jackson, A.; Johnson, N.C.; Abram, D.N.; Hatsukade, T.; et al. Improved CO2 reduction activity towards C2+ alcohols on a tandem gold on copper electrocatalyst. Nat. Catal. 2018, 1, 764–771. [Google Scholar] [CrossRef]
  61. Rahaman, M.; Dutta, A.; Zanetti, A.; Broekmann, P. Electrochemical Reduction of CO2 into Multicarbon Alcohols on Activated Cu Mesh Catalysts: An Identical Location (IL) Study. ACS Catal. 2017, 7, 7946–7956. [Google Scholar] [CrossRef]
  62. Rahaman, M.; Kiran, K.; Montiel, I.Z.; Grozovski, V.; Dutta, A.; Broekmann, P. Selective n-propanol formation from CO2 over degradation-resistant activated PdCu alloy foam electrocatalysts. Green Chem. 2020, 22, 6497–6509. [Google Scholar] [CrossRef]
  63. Wang, H.; Matios, E.; Wang, C.; Luo, J.; Lu, X.; Hu, X.; Li, W. Rapid and Scalable Synthesis of Cuprous Halide-Derived Copper Nano-Architectures for Selective Electrochemical Reduction of Carbon Dioxide. Nano Lett. 2019, 19, 3925–3932. [Google Scholar] [CrossRef] [PubMed]
  64. Shang, Y.; Guo, L. Nanocrystal Facets: Facet-Controlled Synthetic Strategy of Cu2O-Based Crystals for Catalysis and Sensing. Adv. Sci. 2015, 2. [Google Scholar] [CrossRef]
  65. Seah, M.P. AES: Energy calibration of electron spectrometers. IV. A re-evaluation of the reference energies. J. Electron. Spectrosc. Relat. Phenom. 1998, 97, 235–241. [Google Scholar] [CrossRef]
  66. Gaarenstroom, S.W.; Winograd, N. Initial and final state effects in the ESCA spectra of cadmium and silver oxides. J. Chem. Phys. 1977, 67, 3500–3506. [Google Scholar] [CrossRef]
  67. Battistoni, C.; Mattogno, G.; Paparazzo, E.; Naldini, L. An XPS and Auger study of some polynuclear copper compounds. Inorg. Chim. Acta 1985, 102, 1–3. [Google Scholar] [CrossRef]
  68. Lee, C.; Stahlberg, E.A.; Fitzgerald, G. Chemical Structure of Urea in Water. J. Phys. Chem. 1995, 99, 17737–17741. [Google Scholar] [CrossRef]
Figure 1. SEM images of CF-18H at various magnifications. (a) ×300, (b) ×15,000 and (c) ×35,000 magnifications. These images are taken of the top portion of the foam.
Chemistry 03 00048 g001
Figure 2. XRD of CF-4H (black, at the bottom), CF-18H (blue, in the middle) and CF-73H (red, at the top).
Chemistry 03 00048 g002
Figure 3. Morphology study of CF-18H-100U, displaying the different structures at the top, middle and bottom of the pore.
Chemistry 03 00048 g003
Figure 4. SEM of CF-18H-DCU. (a) Overview, (b) view down a pore, (c,d) ×15,000 and ×70,000 magnifications, respectively, of the surface of the foam, focusing on the cuboctahedra and (e,f) ×15,000 and ×70,000 magnifications, respectively, of the bottom of the foam, focusing on the cuboctahedra.
Chemistry 03 00048 g004
Figure 5. XRD of 18 mM HCl copper foams with added 10 mM urea (black, at the bottom), 100 mM urea in deposition bath (solid red, in the middle), or dip-coated from a 100 mM urea neutral aqueous solution (dotted red, at the top).
Chemistry 03 00048 g005
Figure 6. XPS spectra of the (a) nitrogen 1s signal from samples of CF-18H-DCU (top, dotted blue trace) and CF-18H-100U (bottom, dotted red trace), with fittings in solid lines, (b) copper 2p signal from CF-18H (bottom, black), CF-18H-100U (middle, red) and CF-18H-DCU urea (top, blue) and (c) copper Auger LMM peak from samples of CF-18H (bottom, black), CF-18H-100U (middle, red) and CF-18H-DCU (top, blue).
Chemistry 03 00048 g006
Figure 7. Faradaic efficiencies of (a) hydrogen (b) carbon-based gas products and (c) liquid products versus potential, corrected to RHE, for copper foams CF-18H (solid lines) and CF-18H-100U (dashed lines). Data for formate are provided in SI Figure S7.
Chemistry 03 00048 g007
Figure 8. Bar chart depicting the product distribution from CO2 reduction at different electrocatalytic reduction potentials comparing CF-18H and CF-18H-100U.
Chemistry 03 00048 g008
Figure 9. SEM images of CF-18H (ac) and of CF-18H-100U (df) after 35 min of CO2 electrolysis at −0.83 V vs. RHE in 0.1 M of KHCO3 and 40 mL/min CO2.
Chemistry 03 00048 g009
Figure 10. The XRD patterns of (a) CF-18H and (b) CF-18H-100U before electrolysis (bottom black pattern) and post 35 min electrolysis (top red pattern), offset for clarity. For each material, both spectra were normalized to their respective Cu(111) peak and scaled to the “before electrolysis” Cu(111) peak.
Chemistry 03 00048 g010
Figure 11. Cu LMM Auger signal of (a) CF-18H (b) CF-18H-100U and (c) CF-18H-DCU, before electrolysis (black signal) and post 35 min electrolysis (red signal).
Chemistry 03 00048 g011
Figure 12. Nitrogen 1s peak of (a) CF-18H-100U and (b) CF-18H-DCU, before electrolysis (bottom black signal) and post 35 min electrolysis (top red signal). The hypothesized integration of urea with the copper foam is depicted at the top of the figure and color-coded with XPS fittings.
Chemistry 03 00048 g012
Table 1. Summary of capacitance and surface area of copper foams electrodeposited with and without urea. Applied potential of −0.81 V vs. RHE for CF-18H, −0.81 V vs. RHE for CF-18H-100U and −0.79 V vs. RHE for CF-DCU. The geometric and ECSA normalized current densities of CO2 electrolysis at the corresponding applied potentials are also listed as jgeometric and jECSA, respectively.
CF-18-100UCF-18H-100UCF-18H-DCU
Capacitance (µF)447474472
Electrochemically active surface area (cm2)16.016.916.9
Surface roughness factor225238237
jgeometric (mA/cm2)31.026.838.0
jECSA (mA/cm2)0.140.110.17
Table 2. A comparison of the best faradaic efficiencies (FE) and geometric current densities reported in the literature for the electroreduction of CO2 to n-PrOH (entries ordered by n-propanol partial geometric current density).
WorkPotential versus RHE (V)FE n-PrOH (%)Total Geometric Current Density (mA/cm2)n-Propanol Partial Geometric Current Density (mA/cm2)Ref.
Rahaman−0.913.1−19.5−2.56 a[61]
Rahaman−0.858.2−30.5−2.50[62]
CF-18H-100U−0.834.93−37.6−1.85This work
Dutta−0.877.1−24.2−1.72[33]
Ren−0.8510.6−14.2−1.50[47]
Wang−0.807.5−20.0−1.5[63]
Wang−0.6410.0−12.0−1.2[63]
Rahaman−0.6513.7−8.4−1.15[62]
CF-18H−0.833.34−29.4−0.98This work
Kim−0.815.9−12.7−0.75[46]
Han−1.1011.8−1.0−0.12[45]
Grosse−1.051.0−10.0−0.10[48]
a Value reported in reference [62].
Publisher’s Note: MDPI stays neutral with regard to jurisdictional claims in published maps and institutional affiliations.

