Impact of Feeding Pattern on the Structure and the Economic Performance of Dairy Cow Sector


1
Agricultural Economics Research Institute, Hellenic Agricultural Organization—DIMITRA, 11528 Athens, Greece
2
Department of Applied Informatics, University of Macedonia, Egnatia 156, 54006 Thessaloniki, Greece
3
School of Veterinary Medicine, Aristotle University of Thessaloniki, 54006 Thessaloniki, Greece
*
Author to whom correspondence should be addressed.
Dairy 2021, 2(1), 122-134; https://0-doi-org.brum.beds.ac.uk/10.3390/dairy2010012
Submission received: 25 December 2020
/
Revised: 20 February 2021
/
Accepted: 26 February 2021
/
Published: 3 March 2021
Abstract
:In dairy farms, the feeding cost, which includes the expenses for purchased feed but also the expenses for feed production, constitutes a very large part of production cost (more than 60%), which indicates the economic importance of the feeding strategy. This study discerns three different feeding strategies: landless farms only purchasing feed from markets (“Purchasing”), farms for which home-grown feeds stand for more than 10% of feeding costs (“Producing”) and farms with less than 10% home-grown feeds (“Multi-purpose”). Based on technical and economic data from 47 dairy cow farms in Greece, alternative scenarios of development of the dairy sector are determined taking into account the dependence on on-farm feed production. Through a parametric programming model, the study provides insights regarding the optimal structure of the system under different scenarios (changing availability of variable capital, changes in milk prices). The results indicate that “Purchasing” farms are the preferred option when variable capital is abundant and milk prices are satisfactory, while “Producing” are the ones surviving with milk prices significantly lower than the actual ones in Greece and European Union. “Multi-purpose” farms perform worse than the other two and are sidelined in both scenarios, as they do not seem to be able to specialize in the dairy enterprise or in crop production and thus to minimize costs.
1. Introduction
The development of effective feeding strategies is one of the main concerns for dairy farms worldwide as feeding is the main factor affecting milk yield and quality [1,2,3,4]. Furthermore, feeding costs have been reported as the major cost driver in dairy farms, from the USA [3] to the European Union (EU) [5], while in Greece, they account for more than 55% of total costs [6,7]. As Finneran et al. [8] point out “….As feed cost constitutes such a large proportion of total variable costs, it is clear that prudent management of feed costs can significantly impact on the profitability and sustainability of ruminant production systems”.
The discussion regarding feeding strategies is highly relevant to the intensification process in the dairy sector. In several studies internationally, intensification is characterized in terms of less grazing [9], which is combined with concentrate supplementation in order to achieve profit maximization [10]. Specialized dairy systems increased the provision of concentrates and based animal nutrition on silage, thus decreasing the importance of grazing and disconnecting from the use of land [11]. Llanos et al. [12] in Uruguay discerned different types of intensification based on the provision of concentrates, while Alvazez et al. [13] used stocking rates (cows per hectare)– along with milk per cow, milk per hectare and feed per cow—to characterize farms according to their level of intensification. In European systems, forage is still the main feed for dairy farms [11] but in Northern Europe, at least one part of energy intake still comes from grazing [14] with decreasing trends. According to Reijs et al. [5], apart from Irish farms, which graze up to their totality—at least to a degree—in the UK the percentage of grazing farms was estimated to 80–85%, in the Netherlands around 70% and in Germany around 50%. They found significant differences in the economic performance—including production costs and labor—across farm types categorized according to the percentage and strategy of grazing.
Nowadays, less or no-grazing systems provide opportunities for increasing productivity and economic performance [14]. Considering that the availability of land limited the expansion of dairy farms, a shift from grazing to confinement allowed their rapid growth [11]. Alvarez and Arias [15] reported a positive relationship between technical efficiency and size in terms of land use, while increases in stocking rates indicator reduced efficiency [13]. For Gonzalez-Mejia et al. [16] the characterization of farm intensification of dairy farms in Wales and England was based on increasing margins per liter of milk by increasing grazing (extensive farms) or intensification to maximize margins per hectare (intensive farms). Clay et al. [17] underlined that total confinement of cows around the year is met in very intensive operations and relies on feed produced off-farm. Specialization on the dairy enterprise can be associated with higher profitability.
In Greece, dairy farms have followed intensification paths, much like many other countries worldwide. Important elements of this intensification include higher investments and economic characteristics [6,7,18,19] but also the adoption of more effective practices, such as wider use of artificial insemination and new technologies for semen selection [20], innovations in machine milking [21] and higher level of environmental practices—including wastewater and manure treatment [22]. However, a fundamental difference from other European countries is that very few Greek dairy farms graze [6,7,18,23]. There is an increasing trend of disconnecting totally from the use of land and of basing feed procurement on markets. Another alternative is to produce a small part of the feeds on-farm, by cultivating own or rented land. This option can increase the control that farms have on feed quality and availability, however, they are burdened with costs relating to land rent and additional fixed costs for machinery and crop storage. The economic effects of the choice between feed procurement from markets or production on-farm has received relatively less attention than the role of grazing. Finneran et al. [8] presented a model which provides a full-cost approach for calculating the economic effects of production of feedstuff on dairy production. In Greece, Siafakas et al. [18] examined the economic effects of producing feedstuff on-farm and found that this option is not always efficient but is rather contingent upon specific prerequisites.
The purpose of this study is to show how the choice of dairy farms to produce feedstuff or to buy exclusively from markets—thus specializing on the dairy enterprise—can impact the future trajectories of the sector. For this reason, the profiles of three dairy farm types are depicted, each one of which engages in different degrees in the procurement of feedstuff from markets or in on-farm cultivation. A parametric programming model is designed to investigate the prospects of each type and to illustrate the structure of the sector under various scenarios of external conditions. Therefore, the study focuses on and analyses the managerial decisions and practices of farmers regarding feedstuff provision.
2. Materials and Methods
2.1. The Greek Dairy Sector
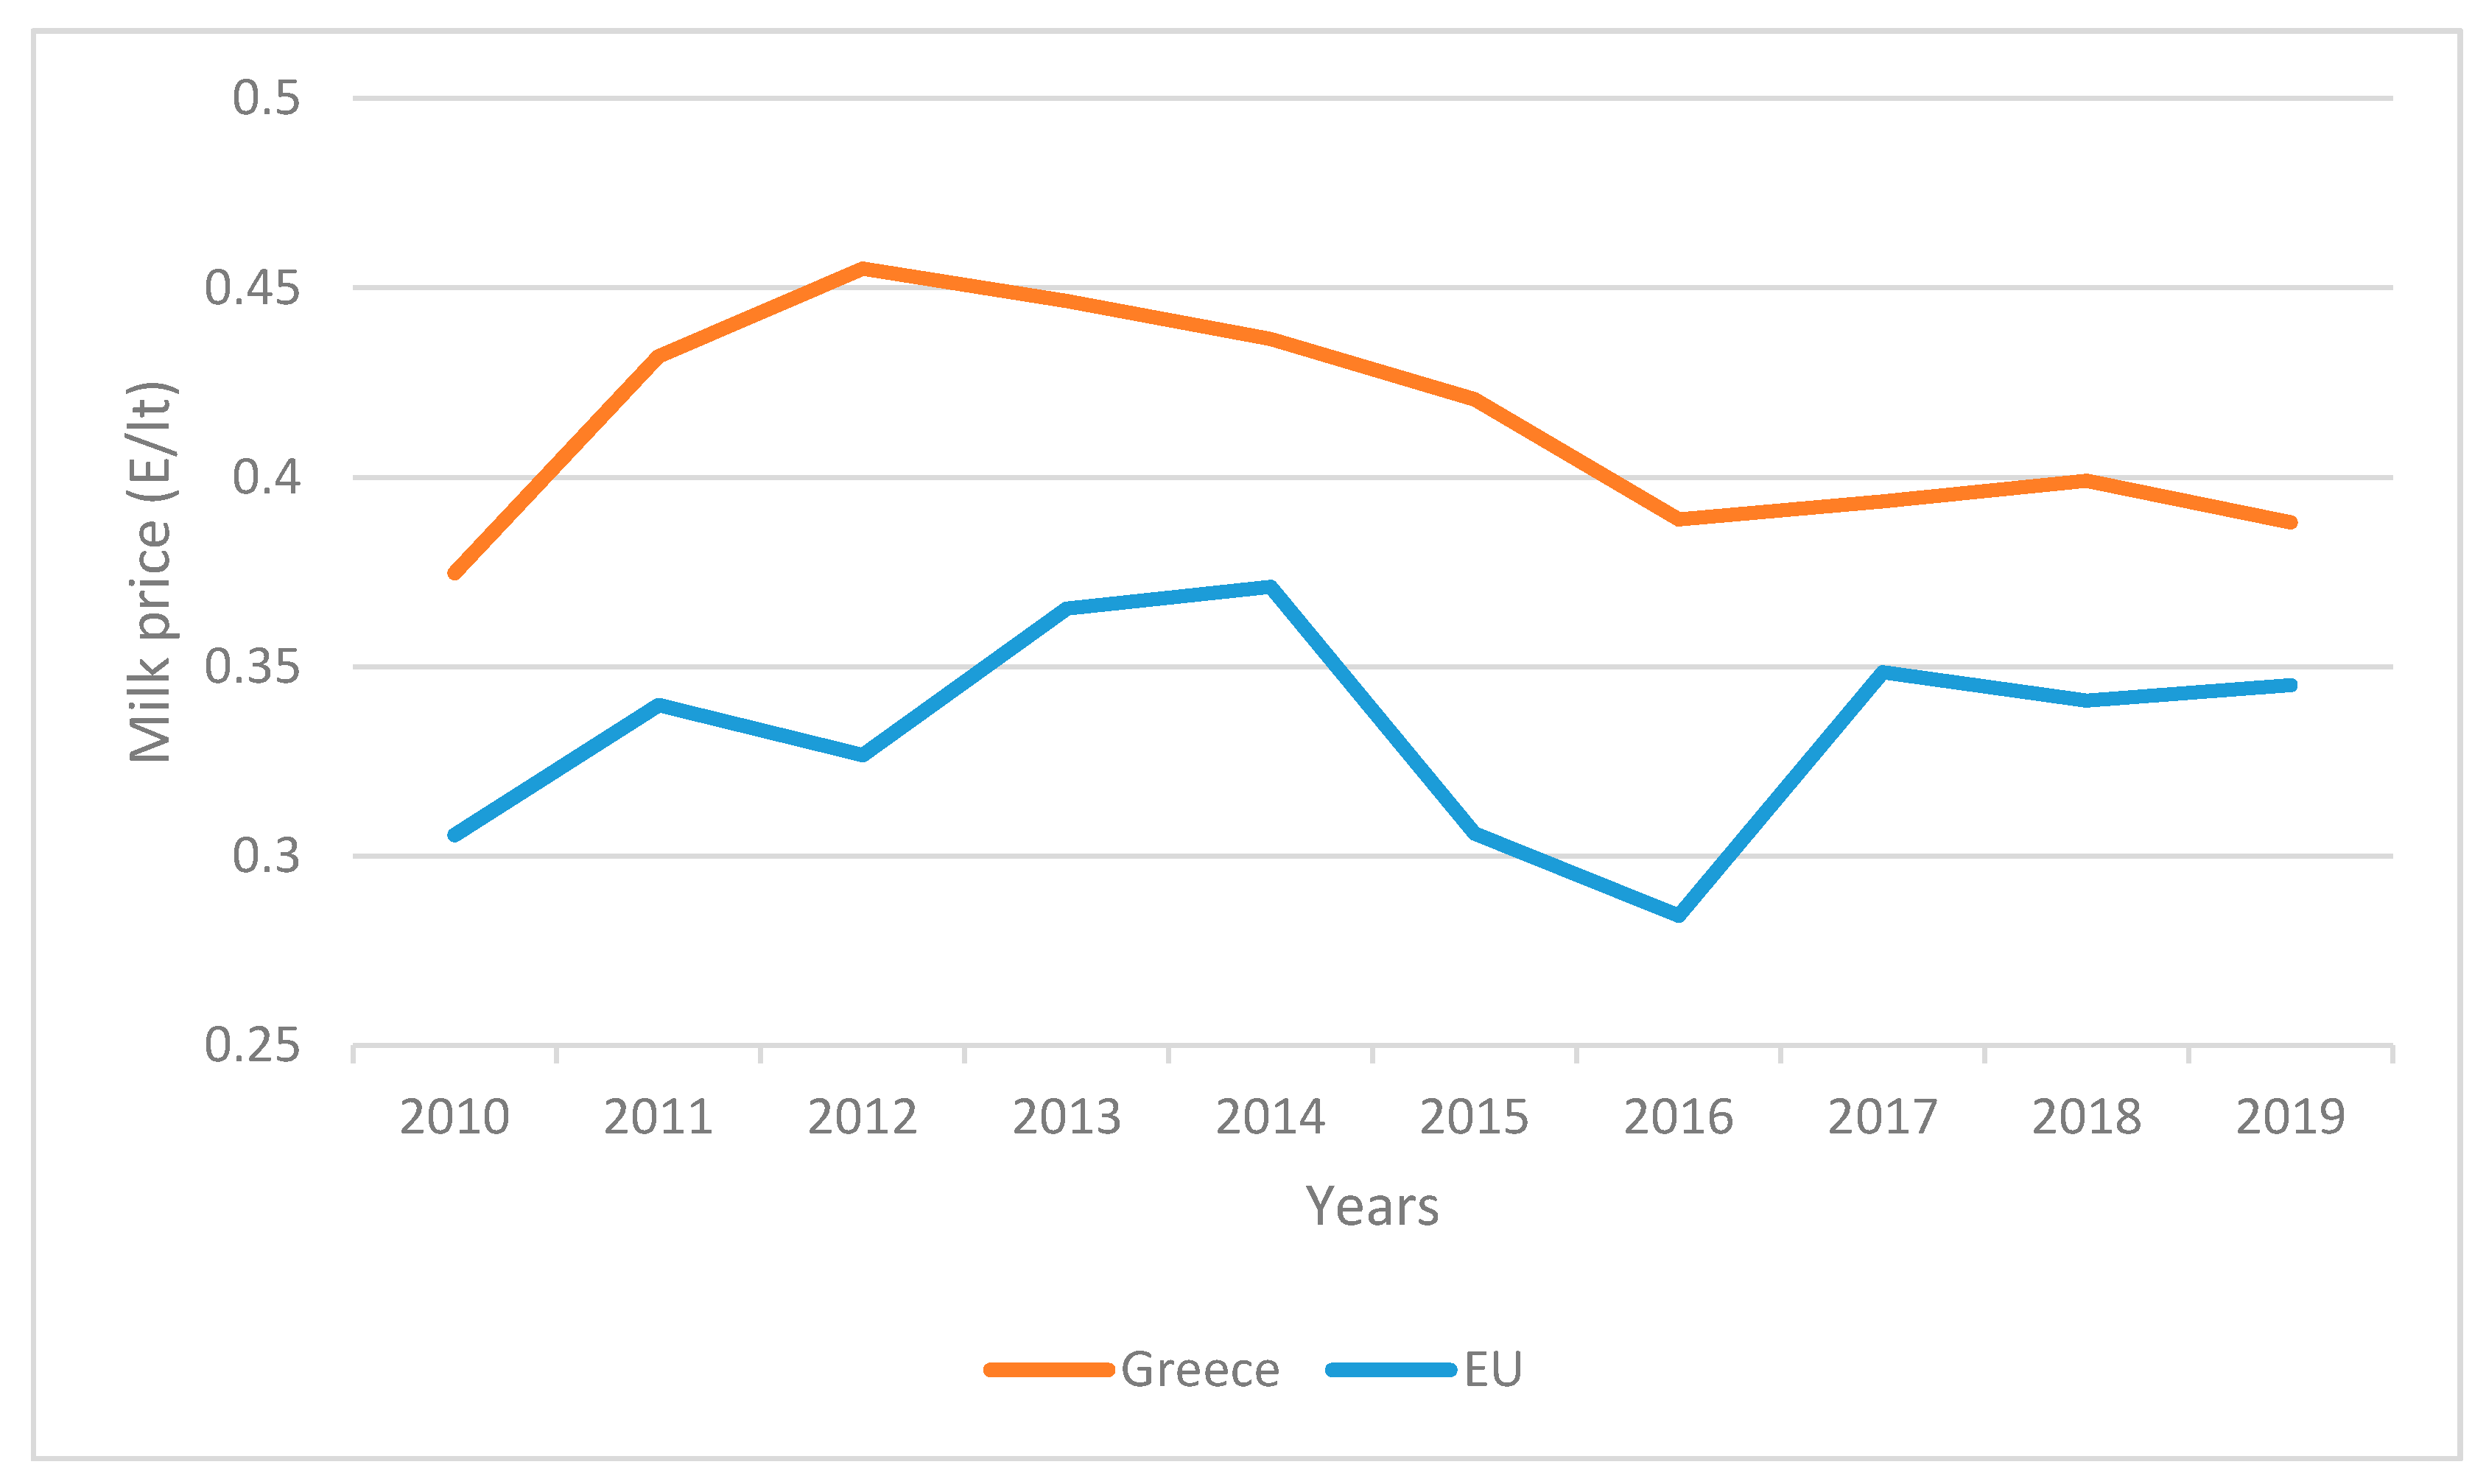
The Greek dairy cattle sector has witnessed great changes since early 2000s, according to processed data from ELGO—DIMITRA [24], which is the designated Greek Organization for supervision of milk balances. The number of farms decreased every year from 2001 (12,402 farms) to 2018 (2884 farms), with a total decrease of 76.7%, while milk production was reduced by 10.4%. However, this reduction was mainly witnessed from 2010 onwards, when milk production dropped by 10.6% and the number of farms by 36.8%. Therefore, average production per farm has almost tripled since 2001 and has increased by more than 40% since 2010. More than 80% of production and 70% of farms are situated in the northern part of the country (Regions of East Macedonia and Thrace, Central Macedonia, Western Macedonia and Thessaly). The fresh milk market in Greece is oligopolistic with six companies controlling 70% [25]. Milk prices from 2010 onwards did not exhibit significant reductions (Figure 1) and are generally higher than European Union (EU) averages [26]. This is due to the fact that Greece only achieves about 40% of self-sufficiency in raw cow milk as well as to this was partially due to the fact that large intensive farms were able to bargain acceptable prices with industries.
These developments illustrate the intensification process of Greek dairy farms. Large entrepreneurial farms are characterized by investments in automated systems, state-of-the-art buildings and improved genetic material. These are combined with modern techniques in artificial insemination, milking and animal health, as well as specialized staff and practitioners. Grazing is totally abandoned by these farms and cows are confined all the year and fed with specialized rations. Despite unfavorable external conditions, which also included reduced liquidity and lack of financing, and chronic structural problems until then (e.g., small average farm size, lack of modernization, high dependence on subsidies, low level of cooperation), farms continued to increase in size and productivity during the Greek economic crisis due to their dynamic strategies [7].
2.2. Methodological Background and Model Specification
The empirical analysis in this paper is based on Linear Programming (LP) and Parametric Programming (PP), which are non-parametric methods of mathematical programming. In particular, LP is a mathematical procedure for optimum resource allocation, which maximizes or minimizes a linear objective function subject to linear constraints [27,28,29,30]. The algebraic expression of a LP problem is:
where:
xj the activities
cj the contribution of each activity xj to the objective function (gross margin),
Ζ the objective function,
αij the requirements per unit of xj for input i, where the availability of the specific resource is Ai.
The solution produces an optimum combination of activities that leads to cost minimization or output maximization. The mathematical expression of PP is the same, however, the availability (Ai) of an input (Right-Hand-Side Parametric Programming (RHS-PP)) or the value of a variable in the objective function (cj) (Price Parametric Programming (PPP)), are allowed to vary within an acceptable range, yielding a set of alternative optimal plans. This way, the method provides the sensitivity of LP results to changes in specific variables or constraints of interest.
In the dairy sector, mathematical programming models have been used widely for least-cost ration design [31,32] or to derive optimal dairy farm organization plans [33,34]. Environmental issues of the dairy sector were examined by Acosta-Alba et al. [35] and, more recently, by Larrea-Gallegos and Vazquez-Rowe [36] combining Life Cycle Assessments with mathematical programming methods. Regarding policy assessments, Moraes et al. [37] used an LP model to derive diets for dairy cattle in order to examine effects of environmental policies on diet formulation taking into account methane emissions, while Theodoridis [23] used a mathematical programming model to assess the impact of farm policies. The effects of policies on farm organization were also examined by Ramsden et al. [38] with a linear programming model.
The LP and PP models in this application aimed at the maximization of the gross margin, under a set of physical and economic constraints. The structure (Linear Programming Matrix) was common for all models and is presented as Supplementary Material. The alternative activities included in the objective function, by means of which the maximization of gross margin was sought, were three farm types (xj), identified through on-site research. Type 1 were “Purchasing” farms which did not produce any feeds and purchased exclusively from markets. Type 2 accounted for “Producing” farms, which cultivated land for feedstuff, and for which crop production expenses stood for at least 10% of total feeding costs. Type 3 “Multi-purpose” farms produced some feeds but to a lower extent than “Producing” (less than 10% of total feeding costs). The choice of the 10% cut-off point was based on the average of this research (14.6%) combined with recent previous research in Greece (8.7% in Mitsopoulos et al. [6]; 12.2% in Ragkos et al. [7]). This way, the solution of the model accounted for the number of farms of each type under optimal use of available resources. The specific characteristics of each Type are presented in detail in the following Section.
The following constraints were included in the model (αij, Ai)
- Land constraints, which involved arable land only for the production of feedstuff. Farms cultivated non-irrigated land with winter cereal (mainly wheat and barley) and irrigated land with corn (for concentrate or for silage) and lucerne (for forage). Land requirements were expressed per farm.
- Labor requirements per farm were expressed in hours/year and were discerned between family members and hired workers. For the analysis, each person working full-time on the farm corresponded to 1 Labor Unit (LU) equal to 1750 h per year. Each farm type required a specific number of hours of family and hired labor. The available family labor (LU) was calculated for the sampled farms and then extrapolated, since there were no official data on the actual farm family employment in the sector. The wage of labor was 3.5 €/h, however the implicit wage of family labor was not included in gross margin calculations.
- Variable capital requirements included feeding costs (purchased feedstuff and inputs for crop production for feedstuff (seeds, pesticides, fertilizers, irrigation water, fuel, hired machinery)), veterinary expenses, other farm management expenses etc. These requirements were expressed per farm in a separate constraint in the model, summing up the individual elements of variable costs, and were expressed against the availability of variable capital.
By means of LP, RHS-PP and PPP, three Scenarios were examined
- Scenario 1 (S1). Optimization of the current situation with LP to show the optimal organization of the sector with the current availability of inputs (land, labor, capital). The solution would depict how the existing situation differed from the optimal and which structural adjustments were actually required.
- Scenario 2 (S2). Changing availability of variable capital. This Scenario simulated the effects of capital availability and helped understand how changes in variable capital—limited liquidity and scarce loans—would impact the structure of the dairy sector at a local/regional level. The lower availability of financial resources was pointed out as a limiting factor of the sustainability of dairy farmers [39]. The Scenario was examined with RHS-PP where the availability of variable capital on the right-hand side of the relevant constraint was allowed to vary.
- Scenario 3 (S3). Changes in milk prices. This Scenario examined the consequences of increasing farmer milk prices or of reducing them closer to average prices in the EU and internationally. It has been pointed out that the positive effects of intensification on economic performance and efficiency have been motivated by high milk prices [40,41]. This Scenario was investigated by means of PPP in the vector of milk prices of each one of the three farm types included in the model. As prices changed, different sectoral organization was depicted.
Data for the analysis were derived from a farm management survey of dairy farms in 2016–2017 in Northern Greece (Macedonia, Thrace and Thessaly). In total 47 farms were surveyed (1.5% of Greek dairy cattle farms, 9% of national cow milk production). Using a carefully designed questionnaire, detailed technical and economic data were recorded: fixed capital endowments (buildings, machinery, land reclamation, herd size and structure), crop production for feedstuff (acreage, land rent, expenses for inputs), costs of purchased feedstuff, other expenses related to animal production, labor requirements and wages (family and hired) as well as milk yields and prices, meat production and prices and income support payments. Τhe Kruskal-Wallis non-parametric test was applied to evaluate differences among farm types, while differences between specific farm types were evaluated using the Mann-Whitney U-test. All analyses were conducted using the IBM SPSS statistical software (version 25.0). Significance was declared at p-value ≤ 0.05.
3. Results
3.1. Technical and Economic Indicators
Table 1 summarizes the technical and economic data of the “average” farm of each one of the three farm types as well as of the average farm of the whole sample—which is reported for benchmarking between the three types. These indicators were used in the model matrix. The “Purchasing” farm was considerably larger (173 cows) compared to the “Producing” and “Purchasing” farms (139 and 133 cows respectively). Moreover, milk yields and prices were higher for the “Purchasing” farm. Despite the difference in size, the “Producing” farm had the highest labor requirements—due to crop production—and the “Purchasing” had lowest (and 40% lower than the “Producing” farm when expressed per cow). An important difference was also reflected in the synthesis of labor resources, as only 26% of labor came from the farm family for the “Purchasing” farm, while this percentage was 58% for the “Producing” and 51% for the “Multi-purpose”.
Table 2 reports the financial results of the three farm types. Evidently, milk was the most important source of income for all types, while other sources included sales of calf meat or of young calves. Income payments (Single Farm Payment, coupled payments for cereals) were not included in the financial results nor in the model. Variable expenses stood for the highest percentage of total costs for all types, especially feeding costs (purchased feedstuff and own crops). Costs under ‘other expenses’ account for 13.8% to 15.6% of total costs and include all other variable (paid) expenses related to capital such as costs for veterinary drugs and care; electricity and water; waste management (septic tanks and/or biological treatment as well as manure management). As a result of achieving the highest gross revenue and despite high expenses, the “Purchasing” farm achieved the highest gross margin, followed by the “Producing”, which had the lowest expenses. Despite being the smallest in size, the “Multi-purpose” farm operated with higher total expenses than the “Producing” farm and achieved considerably lower gross revenue than both other farms, thus showing the lowest gross margin. Table 2 also presents the returns to land and labor, both of which were negative for the “Multi-purpose” farm, while the “Purchasing” farm demonstrated an impressive return of 14.6 €/h.
3.2. Results of Mathematical Programming
Table 3 presents the optimization results for the existing situation (Scenario 1) and depicts what would happen if available resources were reorganized optimally to maximize gross margin. The fundamental difference between the existing and optimal situations was that “Multi-purpose” farms were not included in the optimal plan, which consisted of 27 “Purchasing” and 20 “Producing” farms. The number of cows increased by 11.3% and milk production by 17.9%, which led to a significant increase of 5.9% in average yield (8446 lt/cow compared to 7975 lt/cow in the existing situation). Although labor requirements were almost the same in the existing and the optimal situation (360 and 357 LU respectively), there was an important change in the contribution of hired labor, from only 177 LU (49% of total labor) in the existing situation to 208 LU in the optimized situation (58%). In addition, the increase in the number of “Purchasing” farms led to the cultivation of less land (18.2% and 16.8% reduction for irrigated and non-irrigated land respectively). As a result of these changes, the optimal plan achieved an increase of 15.4% in gross margin, although the use of variable capital remained the same (16.8 mil.€).
Table 4 presents the results of RHS-PP (S2), where the availability of variable capital was allowed to vary. Four optimal solutions were derived (S2.1–S2.4), each one of which corresponded to an increase in variable capital. Solution S1 shows the optimal situation when 16.80 mil. € of variable capital were available, like in the existing situation. Under scarcity of variable capital, “Producing” farms prevailed also in S1.2, where 200 farms cultivated the whole available acreage (12,398 ha of irrigated and 4142 ha of non-irrigated land) for the production of feedstuff. In S1.3, where the availability of capital increased significantly, “Producing” farms stopped increasing and 458 “Purchasing” farms were introduced in the optimal structure of the system. The number of cows per farm and milk production per farm increased compared to S1.1 and S1.2 (from 139 to 163 and from 1.13 mil. tons to 1.38 mil tons respectively). As a result, variable capital per farm (283 thousand € and 369 thousand € respectively) and gross margin (186 thousand € and 210 thousand € respectively) per farm also increased. All available arable land was cultivated in S1.3 and available family labor was fully utilized (1827 LU compared to 1025 LU in S1.2). The effects of a further increase in variable capital were reflected in S1.4 (424.9 mil. €, i.e., 407 thousand € per farm), where only “Purchasing” farms were included in the optimal structure. Available family labor was fully utilized but the number of hired workers was increased significantly (5159 LU).
The evolution of the structure of the system can be understood betted by examining shadow prices of land, labor and capital (Table 4). The shadow price of land was 450 €/ha (aggregated for irrigated and non-irrigated), which was considerably higher than the return to land calculated for the average farm (24.74 €/ha) but lower than the return for “Producing” farm (528 €/ha). For labor, the shadow price was 4.63 €/ha, which was higher than the return of the average sample farm (3.60 €/h), but considerably lower than the return of “Purchasing” farm (14.62 €/ha). As expected, the return to capital decreased across optimal plans, as its availability increased, from 0.66 €/€ in S1.1 to 0.51 €/€ in S1.4.
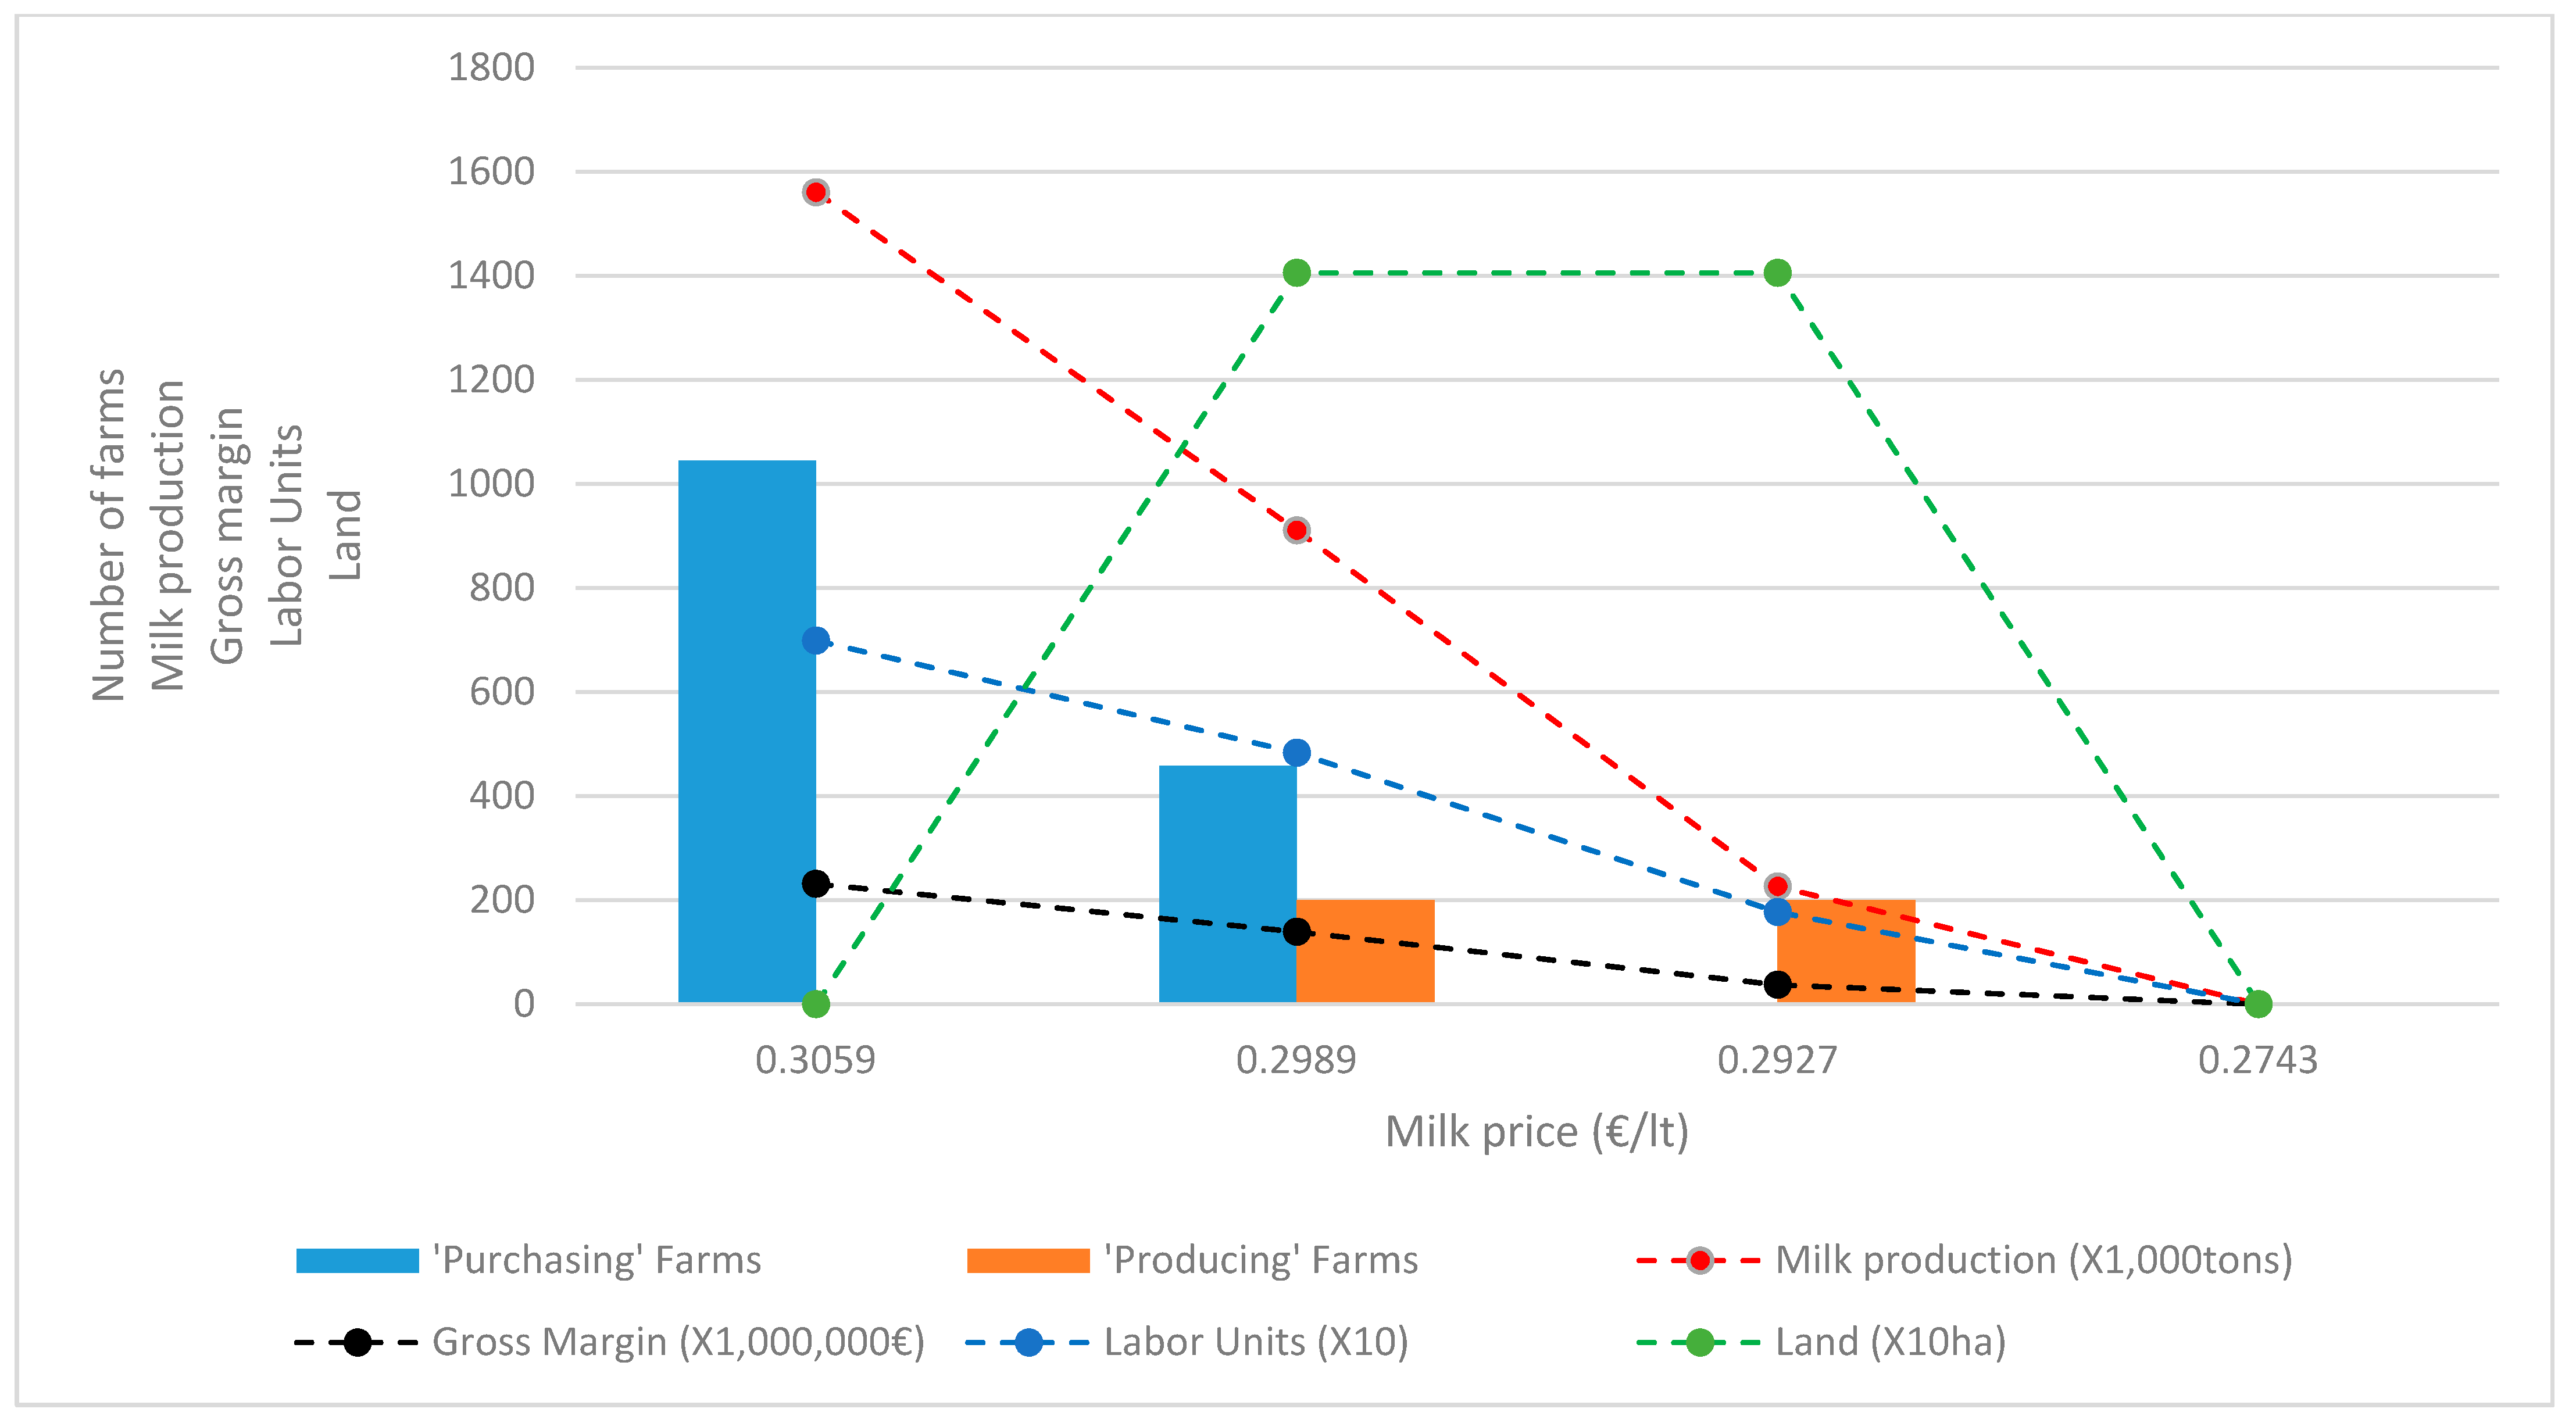
The results of PPP are presented in Figure 2, which illustrates that the structure of the system was affected within a relatively small range of farmer milk prices. The upper bound was 0.3059 €/lt (S2.1), over which “Purchasing” farms prevailed—given the high availability of capital—and the lower was 0.2743 €/lt (S2.4), under which no type of farm could survive. Between these two extremes, two intermediate plans are presented in Figure 2, in which, however, milk prices differed very little. In particular, for milk price 0.2989 €/lt “Purchasing” farms were reduced and “Producing” farms appeared and, as a result, all available land was cultivated. Then, with an additional slight decrease in milk price (0.2927 €/lt), “Purchasing” farms were ruled out. Nevertheless, “Producing” farms seemed to be able to survive within the lower price range (from 0.2927 €/lt to 0.2743 €/lt). As in Scenario 2, “Multi-purpose” farms were not included in any optimal plan.
4. Discussion
As expected, “Purchasing” farms were considerably larger in size compared to other types, in line with van der Pol et al. [14] and Peyraud et al. [11]. In addition, the profiles of “Purchasing” and “Producing” farms coincided with the technical and economic indicators reported by Mitsopoulos et al. [6] for a sample of 123 Greek dairy farms. As size increased, yields were considerably higher, along with milk prices, while labor requirements and land acreage per cow reduced (especially for farms rearing over 150 cows). This is also in line with Peyraud et al. [11] and Alvarez and Arias [15], who underlined that land per cow was reduced due to the intensification process. However, a notable difference lied between fixed capital expenses of this study and of Mitsopoulos et al. [6]. Although fixed expenses for average farms did not differ substantially (782.8 €/cow in [6] compared to 755 €/cow in this study), notable differences were found between larger farms in [6] (732.8 €/cow for farms rearing 101–150 cows and 729.3 €/cow for farms with >151 cows respectively) and the farms in this study (399 €/cow, 785 €/cow and 926 €/cow for “Purchasing” “Producing” and “Multi-purpose” farms respectively). This is partially justified by the fact that “Producing” farms had lower investments in crop production, while “Multi-purpose” farms were burdened with excessive costs for equipment. Concerning labor, the minimum wage in Greece (650 € per month) was higher than the return to labor of the average farm (3.60 €/h), almost equal to the return of the “Producing” farm (4.02 €/h) but more than three times lower than the return of the “Purchasing” farm (14.62 €/h).
Regarding the role of on-farm feed cultivation, the results of this study converge with the ones by Siafakas et al. [18] for Greece, who investigated the efficiency of dairy farms in relation to the sources of feed. Both studies confirmed that farms which specialized in the dairy enterprise were more efficient. In Siafakas et al. [18], eight out of nine farms which did not grow any feedstuff were fully efficient, which is verified by the findings of this study, as the “Purchasing” farm had lower production costs, lower labor requirements per cow, increased yields and higher product prices. In both studies, feeding costs were not always reduced when feedstuff was produced on-farm—which is particularly relevant for “Multi-purpose” farms in this study—and efficient farms cultivated significantly less land than inefficient ones. Feeding costs were higher for the average farm in Siafakas et al. [18] (2396 €/cow compared to 2073 €/cow in this study), however the average farm was considerably smaller (117 cows compared to 143 in this study).
The profile of “Multi-purpose” farms reflects a defensive behavior, like the “Go with the flow” strategies described by Lemery et al. [43] and analyzed by Ragkos et al. [7] for Greek dairy farms. Indeed, “Multi-purpose” farms were the smallest and had the lowest milk yield across the three types, while they were the only ones operating with net losses and negative return to land and labor. Since they were not included in the optimal plan in any of the LP or PP models, it was verified that this farm type could not ensure survival in adverse external conditions, when prices were low or capital was scarce. The strategy of these farms lied between “Producing” and “Purchasing”, as they were mainly dependent on markets for feedstuff but also engaged in crop production, however in a less systematic and efficient way. Failing to specialize in the dairy enterprise or to increase the efficiency of crop production, they did not achieve the advantages of neither of the other two types.
“Purchasing” farms required the vast availability of capital and higher milk prices, which aligned with what Basset-Mens et al. [44] suggested in their Life Cycle Assessment study of dairy farms in New Zealand. Thus, these farms reflected a highly intensive system dependent on external inputs, which has been found to entail low resource use efficiency from an environmental perspective [17,39] but leads to higher levels of economic performance when these inputs are more available, as in S1.3 and 1.4. This explains how “Purchasing” farms emerged in the past few years and that it should be expected to see more of them in the following period, if the two aforementioned conditions continue to be met. This finding coincides with Ragkos et al. [7], in that farms that undertook ”Act upon” strategies in their study, like the dynamic “Purchasing” farms, managed to expand when external conditions were favourable—even when they were less favorable but did not cross a lower threshold. In this context, sustainable intensification [17,19] has been proposed as a most promising pathway for the development of dairy farming [45]. However, Clay et al. [17] outline a set of conditions which would render this pattern more sustainable over time, including developments in the external environment, such as the emergence of “state-run companies and cooperatives…..putting up capital investment in technologies infrastructure….that further stimulate dairy intensification at a regional level”.
The fact that “Producing” farms were able to survive as milk prices reduced verifies that on-farm feed production provides flexibility to farms [46] and renders them less vulnerable to external shocks. However, it should be stressed that the price limits set by the PPP (Figure 2) were considerably lower than actual average prices for the three farm types (Table 1), which, in turn were significantly higher than the national average (Figure 1), mainly due to their large size of the sampled farms. Furthermore, as already explained in Section 2, prices in Greece have always been higher than the higher bound reported in Figure 2 (0.3059 €/lt) for the last 10 years and never dropped below 0.35 €/lt. On the other hand, the cut-off price of 0.3059 €/lt as well as the lower bound of 0.2743 €/lt were not far from international milk prices, as Hemme [47] reported an average international price of 33.4$ for 2018, equal to 0.2905 €/lt. Average world prices in the decade 2010–2019 showed a remarkable fluctuation from 0.271$/lt on average in 2016 to 0.558$/lt in February 2014, due to market and non-market factors (e.g., input prices and/or weather conditions). According to the Milk Market Observatory of the EU [26], the average milk price for EU-27 was 32.85 €/lt on July 2020 and ranged between 25.68 €/lt to 40.21 €/lt (for EU-28) from 2010 to 2020. These considerable fluctuations demonstrated that although domestic prices remained significantly higher—especially for large farms—a scenario of abrupt decreases in prices to adapt to EU and world averages would have significant negative impact on “Purchasing” farms and would initiate a cycle of structural adaptations.
A factor that should also be considered when interpreting the findings of this study is policy income support. These payments—which include the Single Farm Payment and coupled payments for crops such as cereal and legumes—were not included in the financial results in order to depict the competitive situation of each farm type. A previous study by Ragkos et al. [7] showed that these payments were around 5.5% of total gross output for an average dairy farm of 140 cows. It should be expected that the continuation of these payments would be beneficial, especially for “Producing” and “Multi-purpose” farms which cultivate land and are entitled to payments also for crop production—thus partially reducing their feeding costs. Nonetheless, the importance of revenues from milk is substantial and constitutes the crucial factor regulating the income of farms, unlike other sectors in Greece for which policy has been shown to play a much more significant role in their viability. According to Karanikolas and Martinos [48], in 2008 the Farm Family Income of Greek farms was based on subsidies by more than 60%.
The study focused on the economic performance of farms and also accounted for social aspects including employment. Future research, however, is required to shed light on the overall sustainability of each farm type and of each trajectory, especially in terms of environmental impact. Since highly intensive farms have been proven to have low environmental efficiency in some cases, it would be challenging to see whether holistic sustainability considerations could alter the optimal structure of the dairy sector depicted in this paper. Such research could also integrate the relationships between feeding patterns and manure and waste management from large dairy farms. This approach could have important policy implications, in assisting to allocate structural funds more effectively, also based on environmental indicators.
A limitation of this study is that is focuses on large dairy farms and does not account for the prospects of smaller ones. However, these farms are actually the result of the intensification and modernization process of the sector and reflect modern trends. Therefore, it should be expected that these farms will play a key role in the future.
5. Conclusions
This study presented an analysis of potential future trajectories of Greek dairy farms, which were discerned to three types based on the degree of reliance on markets for procurement of feeds. Three scenarios were tested by means of linear and parametric programming, illustrating how the sector would respond under changing availability of variable capital or under reduced milk prices. The results indicated that farms which did not cultivate any feedstuff were more specialized in the dairy enterprise, achieved the highest economic results and had better prospects when prices were high and variable capital was easily available. On the other hand, on-farm feed production was proven more beneficial when milk prices were considerably lower than the actual ones in Greece and the EU. However, it was shown that engagement in feed production should be carefully organized in order to have a positive contribution in economic performance and to justify the required investments in equipment.
Supplementary Materials
The following are available online at https://0-www-mdpi-com.brum.beds.ac.uk/2624-862X/2/1/12/s1.
Author Contributions
Conceptualization, A.R., G.K. and A.T.; methodology, A.R., G.K. and A.T.; validation, A.R. and A.T.; formal analysis, A.R., G.K. and A.T.; investigation, A.R., G.K. and A.T.; resources, G.K.; data curation, A.R., G.K. and A.T.; writing—original draft preparation, A.R.; writing—review and editing, A.R., G.K. and A.T.; supervision, A.T. All authors have read and agreed to the published version of the manuscript.
Funding
This research has been co-financed by the European Union and Greek national funds through the Operational Program Competitiveness, Entrepreneurship and Innovation, under the call RESEARCH—CREATE—INNOVATE (project acronym RawCheese; project code: T1EDK-03989).
Institutional Review Board Statement
Not applicable.
Informed Consent Statement
Informed consent was obtained from all subjects involved in the study.
Data Availability Statement
The data presented in this study will be available on request from the corresponding author.
Conflicts of Interest
The authors declare no conflict of interest.
References
- Etgen, W.M.; Reaves, P.M. Dairy Cattle Feeding and Management, 6th ed.; John Wiley & Sons: Hoboken, NJ, USA, 1978. [Google Scholar]
- Albright, J.L. Feeding behavior of dairy cattle. J. Dairy Sci. 1993, 76, 485–498. [Google Scholar] [CrossRef]
- Khanal, A.R.; Gillespie, J.; MacDonald, J. Adoption of technology, management practices, and production systems in US milk production. J. Dairy Sci. 2010, 93, 6012–6022. [Google Scholar] [CrossRef] [PubMed]
- Miller, W.J. Dairy Cattle Feeding and Nutrition; Elsevier: Amsterdam, The Netherlands, 2012. [Google Scholar]
- Reijs, J.W.; Daatselaar, C.H.G.; Helming, J.F.M.; Jager, J.; Beldman, A.C.G. Grazing Dairy Cows in North-West Europe; Economic Farm Performance and Future Developments with Emphasis on the Dutch Situation; LEI Report 2013-001; Wageningen UR: The Hague, The Netherlands, 2013; p. 124. [Google Scholar]
- Mitsopoulos, Ι.; Ragkos, A.; Abas, Ζ.; Lagka, V.; Bampidis, V.; Dotas, V.; Aggelopoulos, S.; Skapetas, V. Technical and economic analysis of dairy cattle farming in Central Macedonia. In Proceedings of the 3rd Panhellenic Conference of Animal Production Technology, Thessaloniki, Greece, 4 February 2011; pp. 513–524. (In Greek). [Google Scholar]
- Ragkos, A.; Theodoridis, A.; Fachouridis, A.; Batzios, C. Dairy farmers’ strategies against the crisis and the economic performance of farms. Procedia Econ. Financ. 2015, 33, 518–527. [Google Scholar] [CrossRef] [Green Version]
- Finneran, E.; Crosson, P.; O’kiely, P.; Shalloo, L.; Forristal, D.; Wallace, M. Simulation modelling of the cost of producing and utilising feeds for ruminants on Irish farms. J. Farm Manag. 2010, 14, 95–116. [Google Scholar]
- Bernués, A.; Riedel, J.L.; Asensio, M.A.; Blanco, M.; Sanz, A.; Revilla, R.; Casasús, I. An integrated approach to studying the role of grazing livestock systems in the conservation of rangelands in a protected natural park (Sierra de Guara, Spain). Livest. Prod. Sci. 2005, 96, 75–85. [Google Scholar] [CrossRef]
- Hanson, G.D.; Ford, S.A.; Parsons, R.L.; Cunningham, L.C.; Muller, L.D. Increasing intensity of pasture use with dairy cattle: An economic analysis. J. Prod. Agric. 1998, 11, 175–179. [Google Scholar] [CrossRef]
- Peyraud, J.L.; van den Pol, A.; Dillon, P.; Delaby, L. Producing milk from grazing to reconcile economic and environmental performances. In Proceedings of the 23th General Meeting of the European Grassland Federation, Kiel, Germany, 29 August–2 September 2010; pp. 163–164. [Google Scholar]
- Llanos, E.; Astigarraga, L.; Picasso, V. Energy and economic efficiency in grazing dairy systems under alternative intensification strategies. Eur. J. Agron. 2018, 92, 133–140. [Google Scholar] [CrossRef]
- Álvarez, A.; del Corral, J.; Solís, D.; Pérez, J.A. Does intensification improve the economic efficiency of dairy farms? J. Dairy Sci. 2008, 91, 3693–3698. [Google Scholar] [CrossRef]
- van den Pol, A.; Vellinga, T.V.; Johansen, A.; Kennedy, E. To graze or not to graze, thats the question. In Proceedings of the 22nd General Meeting of the European Grassland Federation, Uppsala, Sweden, 9–12 June 2008; Volume 13, pp. 706–716. [Google Scholar]
- Alvarez, A.; Arias, C. Technical efficiency and farm size: A conditional analysis. Agric. Econ. 2004, 30, 241–250. [Google Scholar] [CrossRef]
- Gonzalez-Mejia, A.; Styles, D.; Wilson, P.; Gibbons, J. Metrics and methods for characterizing dairy farm intensification using farm survey data. PLoS ONE 2018, 13, e0195286. [Google Scholar] [CrossRef] [Green Version]
- Clay, N.; Garnett, T.; Lorimer, J. Dairy intensification: Drivers, impacts and alternatives. Ambio 2020, 49, 35–48. [Google Scholar] [CrossRef] [Green Version]
- Siafakas, S.; Tsiplakou, E.; Kotsarinis, M.; Tsiboukas, K.; Zervas, G. Identification of efficient dairy farms in Greece based on home grown feedstuffs, using the Data Envelopment Analysis method. Livest. Sci. 2019, 222, 14–20. [Google Scholar] [CrossRef]
- Garnett, T.; Appleby, M.C.; Balmford, A.; Bateman, I.J.; Benton, T.G.; Bloomer, P.; Burlingame, B.; Dawkins, M.; Dolan, L.; Fraser, D.; et al. Sustainable intensification in agriculture: Premises and policies. Science 2013, 341, 33–34. [Google Scholar] [CrossRef]
- Mitsopoulos, I.; Ragkos, A.; Theodoridis, A. Exploring the reproduction practices of dairy farms: A typology. International J. Agric. Resour. Gov. Ecol. 2014, 10, 146–163. [Google Scholar] [CrossRef]
- Mitsopoulos, I.; Ragkos, A.; Dotas, V.; Skapetas, V.; Bambidis, V.; Lagka, V.; Abas, Z. The Milking Profile of Dairy Cattle Farms in Central Macedonia (Greece). Sci. Pap. Anim. Sci. Biotechnol. 2013, 46, 412–417. [Google Scholar]
- Abas, Z.; Ragkos, A.; Mitsopoulos, I.; Theodoridis, A. The environmental profile of dairy farms in Central Macedonia (Greece). Procedia Technol. 2013, 8, 378–386. [Google Scholar] [CrossRef] [Green Version]
- Theodoridis, A. Impact of the Common Agricultural Policy on Dairy Sector. Ph.D. Thesis, School of Agriculture, Aristotle University of Thessaloniki, Thessaloniki, Greece, 2008. (In Greek). [Google Scholar]
- ELGO—DIMITRA (Multiple Years). Available online: https://www.elgo.gr/index.php?option=com_content&view=article&id=888&Itemid=1267&lang=el#%CF%83%CF%84%CE%B1%CF%84%CE%B9%CF%83%CF%84%CE%B9%CE%BA%CE%AC (accessed on 1 December 2020).
- Koutouzidou, G.; Ragkos, A.; Koutsou, S.; Vazakidis, A.; Theodoridis, A. Towards an integrated policy framework to improve market outcomes in dairy supply chains. In Proceedings of the ERA-12 Conference, Athens, Greece, 24–26 October 2017. [Google Scholar]
- Milk Market Observatory of the European Commission. Historical EU Price Serie of Cow’s Raw Milk in €/100 kg. 2020. Available online: https://ec.europa.eu/info/sites/info/files/food-farming-fisheries/farming/documents/eu-milk-historical-price-series_en.xls (accessed on 1 December 2020).
- Sultan, A. Linear Programming: An Introduction with Applications; Academic Press Inc.: San Diego, CA, USA, 1993. [Google Scholar]
- Rardin, R.L. Optimization in Operations Research; Prentice Hall: Upper Saddle River, NJ, USA, 1998. [Google Scholar]
- Matouek, J.; Gärtner, B. Understanding and Using Linear Programming (Universitext); Springer: New York, NY, USA, 2006. [Google Scholar]
- Bazaraa, M.S.; Jarvis, J.J.; Sherali, H.D. Linear Programming and Network Flows, 2nd ed.; John Wiley & Sons, Inc.: Hoboke, NJ, USA, 2010. [Google Scholar]
- Žgajnar, J.; Juvančič, L.; Kavčič, S. Combination of linear and weighted goal programming with penalty function in optimisation of a daily dairy cow ration. Agric. Econ. 2009, 55, 492–500. [Google Scholar] [CrossRef] [Green Version]
- Notte, G.; Cancela, H.; Pedemonte, M.; Chilibroste, P.; Rossing, W.; Groot, J.C. A multi-objective optimization model for dairy feeding management. Agric. Syst. 2020, 183, 102854. [Google Scholar] [CrossRef]
- Val-Arreola, D.; Kebreab, E.; France, J. Modeling small-scale dairy farms in central Mexico using multi-criteria programming. J. Dairy Sci. 2006, 89, 1662–1672. [Google Scholar] [CrossRef] [Green Version]
- Castelán-Ortega, O.A.; Martínez-García, C.G.; Mould, F.L.; Dorward, P.; Rehman, T.; Rayas-Amor, A.A. Optimal management of on-farm resources in small-scale dairy systems of Central Mexico: Model development and evaluation. Trop. Anim. Health Prod. 2016, 48, 951–958. [Google Scholar] [CrossRef]
- Acosta-Alba, I.; Lopéz-Ridaura, S.; van der Werf, H.M.; Leterme, P.; Corson, M.S. Exploring sustainable farming scenarios at a regional scale: An application to dairy farms in Brittany. J. Clean. Prod. 2012, 28, 160–167. [Google Scholar] [CrossRef]
- Larrea-Gallegos, G.; Vázquez-Rowe, I. Optimization of the environmental performance of food diets in Peru combining linear programming and life cycle methods. Sci. Total Environ. 2020, 699, 134231. [Google Scholar] [CrossRef]
- Moraes, L.E.; Wilen, J.E.; Robinson, P.H.; Fadel, J.G. A linear programming model to optimize diets in environmental policy scenarios. J. Dairy Sci. 2012, 95, 1267–1282. [Google Scholar] [CrossRef] [PubMed]
- Ramsden, S.; Gibbons, J.; Wilson, P. Impacts of changing relative prices on farm level dairy production in the UK. Agric. Syst. 1999, 62, 201–215. [Google Scholar] [CrossRef]
- Cortez-Arriola, J.; Groot, J.C.; Rossing, W.A.; Scholberg, J.M.; Massiotti RD, A.; Tittonell, P. Alternative options for sustainable intensification of smallholder dairy farms in North-West Michoacán, Mexico. Agric. Syst. 2016, 144, 22–32. [Google Scholar] [CrossRef]
- Reinhard, S.; Lovell, K.; Thijssen, G. Econometric estimation of technical and environmental efficiency: An application to Dutch dairy farms. Am. J. Agric. Econ. 1999, 81, 44–60. [Google Scholar] [CrossRef]
- Ledgard, S.F.; Finlayson, J.D.; Sprosen, M.S.; Wheeler, D.M.; Jollands, N.A. Effects of intensification of dairy farming in New Zealand on whole-system resource use efficiency and environmental emissions. Pages 226–260. In Life Cycle Assessment in the Agri-Food Sector; Halberg, N., Ed.; Danish Institute of Animal Science: Tjele, Demark, 2004. [Google Scholar]
- Alaouze, C.M. Shadow Prices in Linear Programming Problems; Papers 96/18; New South Wales—School of Economics: Sydney, Australia, 1996. [Google Scholar]
- Lemery, B.; Ingrand, S.; Dedieu, B.; Degrange, B. Agir en situation d’incertitude: Le cas des eleveurs de bovins allaitants. Économie Rural Agric. Aliment. Territ. 2005, 288, 57–69. [Google Scholar] [CrossRef] [Green Version]
- Basset-Mens, C.; Ledgard, S.; Boyes, M. Eco-efficiency of intensification scenarios for milk production in New Zealand. Ecol. Econ. 2009, 68, 1615–1625. [Google Scholar] [CrossRef]
- Zhang, X.; Davidson, E.A.; Mauzerall, D.L.; Searchinger, T.D.; Dumas, P.; Shen, Y. Managing nitrogen for sustainable development. Nature 2015, 528, 51–59. [Google Scholar] [CrossRef] [PubMed] [Green Version]
- Delsalle, L.; Perez, R.; Dedieu, B.; Girard, N.; Hang, G.; Larrañaga, G.; Magda, D. Adaptive strategies of cattle livestock farmers facing multiple uncertainties in a district of the Argentinian pampa. In Proceedings of the 10th European IFSA Symposium Producing and Reproducing Farming Systems: New Modes of Organisation for the Sustainable Food Systems of Tomorrow, Aarhus, Denmark, 1–4 July 2012. [Google Scholar]
- Hemme, T. IFCN Dairy Report 2019; IFCN: Kiel, Germany, 2019. [Google Scholar]
- Karanikolas, P.; Martinos, N. Greek Agriculture Facing Crisis: Problems and Prospects. 2012. Available online: http://ardinrixi.gr/archives/3811 (accessed on 1 December 2020).
Figure 1.
Fluctuation of average milk prices in Greece and European Union 2010–2019 (Source: ELGO—DIMITRA (multiple years) and [26]).
Figure 1.
Fluctuation of average milk prices in Greece and European Union 2010–2019 (Source: ELGO—DIMITRA (multiple years) and [26]).

Figure 2.
Price Parametric Programming results. Effects on the structure of the sector by changes in milk prices—Scenario 3.
Figure 2.
Price Parametric Programming results. Effects on the structure of the sector by changes in milk prices—Scenario 3.


Table 1.
Technical and economic indicators of dairy farm types according to feeding pattern.
| Technical Indicators | “Purchasing” Farm | “Producing” Farm | “Multi-Purpose” Farm | Average Farm | ||||
|---|---|---|---|---|---|---|---|---|
| per Farm | per Cow | per Farm | per Cow | per Farm | per Cow | per Farm | per Cow | |
| Farms | 8 | 20 | 19 | 47 | ||||
| Cows | 173 | - | 139 | 133 | 143 | |||
| Milk production (×1000 lt/year) | 1493 | - | 1131 | 989 | 1135 | |||
| Milk yield (kg/cow/year) * | - | 8628.4 a | - | 8138.5 ab | - | 7437.8 b | - | 7975.1 |
| Average milk price (€/kg) * | 0.441 a | - | 0.435 ab | - | 0.436 b | - | 0.437 | - |
| Cultivated land (ha) * | - | - | 83.0 a | 0.60 | 19.3 b | 0.14 | 43.1 | 0.30 |
| Labor requirements (h/year) | 11699 | 67.4 | 15,469 | 111.1 | 11,930 | 89.5 | 13,395 | 93.9 |
| Family (hours/year) * | 3059 a | 17.6 | 8971 b | 64.4 | 6094c | 45.7 | 6801 | 47.7 |
| Hired (hours/year) | 8640 | 49.8 | 6498 | 46.7 | 5836 | 43.8 | 6594 | 46.2 |
* Denotes statistically different values at the 95% level using the non-parametric Kruskal-Wallis test. Numbers with different superscripts are different at the 5% level (p < 0.05).
Table 2.
Financial results of dairy farm types according to feeding strategy.
| “Purchasing” | “Producing” | “Multi-Purpose” | Whole Sample | |
|---|---|---|---|---|
| Gross revenue (€) | 704,423 | 537,839 | 477,469 | 541,789 |
| Milk | 659,201 | 493,319 | 432,847 | 497,108 |
| Others1 | 45,222 | 44,520 | 44,622 | 44,681 |
| Production expenses (€) | 574,733 | 510,489 | 545,200 | 535,457 |
| Land | 0 | 28,994 | 11,081 | 16,817 |
| Labor | 40,902 | 47,279 | 38,295 | 42,562 |
| Capital (€) | 533,831 | 446,689 | 482,696 | 476,078 |
| Variable (€) | 464,731 | 337,540 | 359,535 | 368,081 |
| Feeding costs (€) | 375,132 | 268,469 | 292,773 | 296,449 |
| Other expenses (€) | 89,599 | 69,071 | 66,762 | 71,632 |
| Fixed (Annual expenses) (€) | 69,100 | 109,149 | 123,161 | 107,997 |
| Gross margin (€) * | 239,692 a | 200,299 ab | 117,934 b | 173,708 |
| Net profit/loss (€) * | 129,690 a | 14,878 b | −54,603 c | 6332 |
| Return to land (€) | - | 43,871 | −43,522 | 1075 |
| Return to labor (€/hour) * | 14.62 a | 4.02 b | −1.40 b | 3.60 |
1 Not including income support (Single Farm Payment, coupled payments). * Denotes statistically different values at the 95% level using the non-parametric Kruskal-Wallis test. Numbers with different superscripts are different at the 5% level (p < 0.05).
Table 3.
Results of Linear Programming in the existing situation—Scenario 1.
| Existing Situation | Optimized Situation | |
|---|---|---|
| Number of farms | ||
| “Purchasing” | 8 | 27 |
| “Producing” | 20 | 20 |
| “Multi-purpose” | 19 | 0 |
| Cows | 6691 | 7451 |
| Milk production (mil.lt.) | 53.3 | 62.9 |
| Average yield (lt/cow) | 7975 | 8446 |
| Labor (LU 1) | 360 | 357 |
| Family | 183 | 150 |
| Hired | 177 | 208 |
| Irrigated land (ha) | 1515 | 1239 |
| Non-irrigated land (ha) | 498 | 414 |
| Gross margin 2 (mil.€) | 8.5 | 9.8 |
| Variable capital (mil.€) | 16.8 | 16.8 |
1 LU = 1750 h/year. 2 Numbers reported here stand for the total gross margin minus expenses for hired labor.
Table 4.
Right-Hand-Side Parametric Programming results. Sectoral structure under various levels of capital availability—Scenario 2.
Table 4.
Right-Hand-Side Parametric Programming results. Sectoral structure under various levels of capital availability—Scenario 2.
| Scenario 2.1 | Scenario 2.2 | Scenario 2.3 | Scenario 2.4 | |
|---|---|---|---|---|
| Number of farms | ||||
| Purchasing | 0 | 0 | 458 | 1045 |
| Producing | 59 | 200 | 200 | 0 |
| Multi-purpose | 0 | 0 | 0 | 0 |
| Cows | 8240 | 27,800 | 107,115 | 180,785 |
| Cows per farm | 139 | 139 | 163 | 173 |
| Milk production (mil. lt) | 67.0 | 226.2 | 910.7 | 1560.2 |
| Average yield (lt/cow) | 7975 | 8137 | 8502 | 8630 |
| Labor (LU 1) | 524 | 1768 | 4833 | 6986 |
| Family | 304 | 1025 | 1827 | 1827 |
| Hired | 220 | 743 | 3006 | 5159 |
| Irrigated land (ha) | 3679 | 12,398 | 12,398 | 0 |
| Non-irrigated land (ha) | 1228 | 4142 | 4142 | 0 |
| Gross margin 2 (mil. €) | 11.0 | 37.2 | 138.7 | 231.4 |
| Variable capital (mil. €) | 16.8 | 56.7 | 226.3 | 424.9 |
| Shadow price * of land (€/ha) | 450.01 | |||
| Shadow price * of labor(€/h) | 4.63 | |||
| Shadow price * of capital (€/€) | 0.66 | 0.66 | 0.54 | 0.51 |
1 LU = 1750 h/year. 2 Numbers reported here stand for the total gross margin minus expenses for hired labor. * Following the definition by Alaouze [42], shadow prices of the three production factors reflect the additional gross margin that would result if one additional ha was cultivated; one additional hour of labor was used and one additional € of variable capital was invested.
Publisher’s Note: MDPI stays neutral with regard to jurisdictional claims in published maps and institutional affiliations. |
© 2021 by the authors. Licensee MDPI, Basel, Switzerland. This article is an open access article distributed under the terms and conditions of the Creative Commons Attribution (CC BY) license (http://creativecommons.org/licenses/by/4.0/).
Share and Cite
MDPI and ACS Style
Ragkos, A.; Koutouzidou, G.; Theodoridis, A. Impact of Feeding Pattern on the Structure and the Economic Performance of Dairy Cow Sector. Dairy 2021, 2, 122-134. https://0-doi-org.brum.beds.ac.uk/10.3390/dairy2010012
AMA Style
Ragkos A, Koutouzidou G, Theodoridis A. Impact of Feeding Pattern on the Structure and the Economic Performance of Dairy Cow Sector. Dairy. 2021; 2(1):122-134. https://0-doi-org.brum.beds.ac.uk/10.3390/dairy2010012
Chicago/Turabian StyleRagkos, Athanasios, Georgia Koutouzidou, and Alexandros Theodoridis. 2021. "Impact of Feeding Pattern on the Structure and the Economic Performance of Dairy Cow Sector" Dairy 2, no. 1: 122-134. https://0-doi-org.brum.beds.ac.uk/10.3390/dairy2010012