Article

Characterization of Chemical and Bacterial Compositions of Dairy Wastewaters

Department of Food Sciences, STELA Dairy Research Center, Institute of Nutrition and Functional Foods (INAF), Université Laval, Québec, QC G1V 0A6, Canada
*
Author to whom correspondence should be addressed.
Submission received: 22 January 2021 / Revised: 11 March 2021 / Accepted: 24 March 2021 / Published: 1 April 2021

Abstract

:
The dairy industry produces large amounts of wastewater, including white and cleaning wastewater originating principally from rinsing and cleaning-in-place procedures. Their valorization into process water and non-fat milk solids, in the case of white wastewater, or the renewal of cleaning solutions could be achieved using pressure-driven membrane processes. However, it is crucial to determine the intrinsic characteristics of wastewaters, such as proximate composition and bacterial composition, to optimize their potential for valorization. Consequently, white and cleaning wastewaters were sampled from industrial-scale pasteurizers located in two different Canadian dairy processing plants. Bacterial profiles of dairy wastewaters were compared to those of tap waters, pasteurized skim milk and unused cleaning solutions. The results showed that the physicochemical characteristics as well as non-fat milk solids contents differed drastically between the two dairy plants due to different processing conditions. A molecular approach combining quantitative real-time polymerase chain reaction (qPCR) and metabarcoding was used to characterize the bacteria present in these solutions. The cleaning solutions did not contain sufficient genomic DNA for sequencing. In white wastewater, the bacterial contamination differed depending on the dairy plant (6.91 and 7.21 log10 16S gene copies/mL). Psychrotrophic Psychrobacter genus (50%) dominated white wastewater from plant A, whereas thermophilic Anoxybacillus genus (56%) was predominant in plant B wastewater. The use of cold or warm temperatures during the pasteurizer rinsing step in each dairy plant might explain this difference. The detailed characterization of dairy wastewaters described in this study is important for the dairy sector to clearly identify the challenges in implementing strategies for wastewater valorization.

1. Introduction

High milk production has resulted in a significant increase of water consumption in dairy plants and subsequent wastewater release [1]. More specifically, and according to Balannec, et al. [2], between 0.2 and 10 L of effluents or dairy wastewater are generated per L of milk processed. Most of these effluents are generated during cleaning operations [3].
The principle of cleaning-in-place (CIP) is to circulate cleaning solutions in industrial equipment in a closed circuit. The CIP procedure generally consists of five steps. The first rinsing step (pre-rinse) is usually done with warm water to remove most organic residues. It is followed by alkaline (pH > 10) and acidic (pH < 2) cleaning steps, each followed by a water rinse step. The duration of rinsing and circulation steps, as well as the microbial and chemical compositions of the cleaning solutions, may vary depending on a number of factors such as the dairy plant main production, the type of equipment to be cleaned, or the composition of the fouling layer [1,4].
In milk processing plants, wastewater generated by the CIP procedure can be classified into white wastewater (WW), and cleaning wastewater (CW). White wastewater is generated by the first rinsing step and has a composition similar to that of diluted milk. Volumes of milk losses in wastewater are estimated to be 0.5% to 2.5% of total milk processed in a dairy plant [5]. Cleaning wastewaters are generated at the rinsing steps of each cleaning solution (acid and alkaline) and contain residues of caustic and acidic cleaning solutions (phosphoric acid or nitric acid) [4,6].
Due to their large volumes and high organic content (chemical [COD] and biochemical [BOD] oxygen demands ranging between 0.1 and 100 g/L), WW and CW require treatment to reduce their environmental footprint [7,8]. Specifically, different physicochemical (coagulation, flocculation) or biological (biofiltration, activated sludge processes) [8,9] treatments have proven to be efficient and to meet the standard norms for dairy effluent discharge [8]. However, to improve the sustainability of dairy plants, there is an opportunity to recover rather than discard the dairy constituents found in effluents. A number of strategies using pressure-driven membrane technologies such as ultrafiltration (UF), nanofiltration (NF) or reverse osmosis (RO) have been suggested for this purpose. A popular solution has been regenerating water from effluents [1,2,10,11]. Brião et al. [12] also suggested concentrating WW by RO to manufacture “dulce de leche”, and Gésan-Guiziou, et al. [13] proposed a membrane filtration system for recycling caustic cleaning solutions in dairy plants, according to their COD.
Studies evaluating the recovery of milk solids from dairy WW [2,6,11,12,14,15] were performed mainly using synthetic WW or model systems consisting of reconstituted milk protein concentrate [2,6,14,16]. Consequently, to the best of our knowledge, no study focused on the global portrait of bacterial ecosystems found in dairy WW and CW, and consequently to the challenges and issues related to the reuse of milk solids as ingredients. Finally, the specific microbiological characteristics of dairy effluents in different dairy plants has never been studied. Thus, the aim of this study was to characterize the chemical compositions and complex bacterial ecosystems of WW and CW from two different Canadian dairy plants, which cannot be easily performed using traditional culture techniques on growth medium. For this purpose, a high-throughput amplicon sequencing approach was combined with quantitative real-time polymerase chain reaction (qPCR) targeting the 16S ribosomal RNA (rRNA) gene. This method has several advantages in comparison with culturing methods. Indeed, 16S rRNA is an effective reference method for bacterial identification, classification and quantification in a given environment [17]. Since it is considered that <1% of bacterial species are culturable [18,19], using this sequencing and culture-independent method allowed us to obtain accurate information regarding contaminated environments such as dairy samples [20,21].

2. Materials and Methods

2.1. Sample Collection

Two batches of dairy WW, single-used alkaline and acidic CW, tap water, pasteurized skim milk and unused acidic and alkaline solution were collected from two industrial Canadian dairy processing plants (plants A and B; one batch of each fluid from each plant). White wastewater collected separately (~150 L of each WW batch separated into different sterilized 20 L containers) was recovered after the first step of CIP procedure, corresponding to the rinsing water recovered after skimmed milk pasteurization (flow rates ranged from 30,000 L/h to 35,000 L/h). Alkaline and acidic wastewaters were sampled after the second and fourth step of CIP procedures, respectively. The samples from both plants were cooled rapidly (4 °C) after collection and maintained at 4 °C during shipping to Université Laval. Once received, wastewater samples were frozen at −30 °C until analysis. For both dairy plants, acid and alkaline cleaning solutions were composed of nitric acid and caustic soda solutions, respectively. Alkaline and acidic CW solutions were heated during the cleaning process to 80–95 °C and 65–75 °C, respectively. The concentrations, as well as the other specific operating parameters of the CIP process, were different for each dairy plant but necessarily kept confidential. Tap water, pasteurized milk and unused acidic and alkaline solution samples were used as controls for the metabarcoding analysis. Each dairy fluid (WW, CW, tap water, pasteurized skim milk and unused acidic and alkaline solution) from each batch was separated in three different samples for chemical and microbial analyses.

2.2. Chemical Analysis of Dairy Wastewater

Prior to analysis, WW and CW were thawed overnight at 4 °C. For both WW, the pH was recorded using a hand-held pH-meter (VWR Symphony pH-meter model SP20, Thermo Orion, West Chester, PA, USA). The total solids (TS) and ash contents were determined by the air-drying methods (AOAC International 990.20 and 945.46, respectively). The protein content was analyzed by the Dumas method with a nitrogen to-protein conversion factor of 6.38 (ISO 14891 2002F/IDF 185 2002F). The fat content was analyzed by the Mojonnier method (AOAC International 989.05). The lactose content was calculated by difference. Finally, the five day biochemical oxygen demand (BOD5) and COD were analyzed externally (Eurofins EnvironeX, Quebec City, QC, Canada) according to the ISO 17025 standard. Regarding acidic and alkaline CW, the determination of pH, TS content as well as BOD5 and COD were similar as described for WW. The mineral content (Na+, K+, Ca2+ and Mg2+) in the CW was analyzed by optical emission spectrometry with an inductively coupled plasma as atomization and excitation source (ICP-OES Agilent 5110 SVDV Agilent Technologies, Victoria, Australia). The electrical conductivity (EC) was measured using an electrical conductivity meter (Orion star A122, Thermo Fisher Scientific, Waltham, MA, USA). The determination of total suspended solids (TSS) was performed by the air-drying method described by Ni’am and Othman [22].

2.3. Metabarcoding Analysis of Dairy Wastewater

2.3.1. Preparation of Samples and Genomic DNA Extraction

Phenol-chloroform genomic DNA extraction was performed in triplicate on samples as described by Chamberland, et al. [23] with the following modifications. Volumes of 5 mL of WW and pasteurized milk, 15 mL of unused CW (cleaning solutions prepared before CIP operations) and 15 mL of single-used alkaline and acidic CW (recovered after CIP operations) were centrifuged at 15,000× g for 30 min at 4 °C and the pellets were then recovered for extraction. One liter of tap water was filtered through a 0.2 μm sterile polycarbonate membrane filter (Fisher Scientific, Ottawa, ON, Canada) and the total genomic DNA was extracted from these samples using the same protocol described by Chamberland et al. [23]. The volume of each sample used for the DNA extraction was chosen according to preliminary tests and depending on the genomic DNA concentration detected in these samples. The dried DNA pellet of each sample was resuspended in 50 µL of sterile deionized water, except for tap water samples which were resuspended in 30 µL of sterile deionized water. The amount and purity of extracted genomic DNA was determined using a Nanodrop ND-1000 spectrophotometer (NanoDrop Technologies, Wilmington, DE, USA). The genomic DNA extracted from CW and WW were considered satisfactory when the ratio of the absorbance measured at 260 and 280 nm (A260/A280) was higher than 1.50 [24]. The degradation level of the extracted DNA was determined by agarose gel (0.8% (w/v)) electrophoresis of each genomic DNA sample (data not shown).

2.3.2. Quantification of 16S Gene Copies, High-Throughput Amplicon Sequencing and Bioinformatics

DNA samples from WW and CW were sequenced at the Institut de Biologie Intégrative et des Systèmes (IBIS, Université Laval, Québec, QC, Canada) using a high-throughput amplicon sequencing method (MiSeq, Illumina, San Diego, CA, USA) targeting the V6-V8 region of the 16S rRNA gene [25]. Raw paired-end reads obtained during sequencing were deposited in the GenBank database under the accession number PRJNA667972. The metabarcoding was coupled to a real-time PCR (qPCR) quantification method using the universal 16S rRNA primers 1048F (Sequence 5′-3′: GTGSTGCAYGGYTGTCGTCA) and 1175R (Sequence 5′-3′: ACGTCRTCCMCACCTTCCTC) (Life Technologies, ThermoFischer Scientific, Waltham, MA, USA) [26]. The qPCR was performed using an ABI7500 Fast system (software v2.0.5, Applied Biosystems, Foster City, CA, USA). The qPCR reagents and conditions, sequencing and bioinformatics analysis were performed according to the methods described by Chamberland, et al. [23]. The number of 16S gene copies were not normalized on each OTU (operational taxonomic unit) according to Louca, et al. [27]. Only sequenced samples with more than 1000 reads after filtering through the bioinformatics analysis pipeline were retained.

2.4. Statistical Analysis

Analyses were performed in triplicate for all samples. A Student’s t-test was conducted using Statistical System Software (SAS v9.2, SAS Institute Inc., Cary, NC, USA) to detect significant differences between the chemical compositions of WW and CW samples and the differences between the total number of 16S copies in the dairy fluids (tap water, pasteurized milk and WW) (Student’s t-test (α = 0.05)).

3. Results

3.1. Chemical Characteristics and Composition of Dairy Wastewaters

The chemical compositions of WW and single-used CW are presented in Table 1 and Table 2, respectively. As shown in Table 1, both WW solutions were alkaline (pH 8.23 and 12.45 in plants A and B, respectively) (p < 0.05). The dairy residues found in WW of plant B were less diluted, with significantly higher TS (3.12 g/L vs. 0.50 g/L), protein (0.15 g/L vs. 0.01 g/L), lactose (2.22 g/L vs. 0.33 g/L) and ash (0.73 g/L vs. 0.16 g/L) contents compared to the WW of plant A (p < 0.05). This is in line with the higher COD and BOD5 values of plant B WW (354.50 and <3 mg/L, respectively) compared to plant A WW (21.50 and 4.50 mg/L, respectively). However, the fat content was similar for both WW (0.00 g/L vs. 0.03 g/L) (p > 0.05). The acid CW from plant B had a higher conductivity (14.25 ± 0.13 µS/cm vs. 5.35 ± 0.10 µS/cm) and Ca2+ content (177.04 ± 0.43 mg/L vs. 12.22 ± 1.45 mg/L) (p < 0.05) than that from plant A. Conversely, acid CW from plant A had a higher pH (1.82 ± 0.06 vs. 1.17 ± 0.01) and Na+ content (154.96 ± 13.09 mg/L vs. 22.75 ± 3.54 mg/L) than that of plant B (p < 0.05). Alkaline CW had a significantly higher Na+ content (ranging from 4032.80 mg/L and 10665.22 mg/L) than acid CW for both plants (ranging from 22.75 mg/L and 154.96 mg/L), due to the principal active ingredient of alkaline CW (sodium hydroxide, NaOH). Similarly, alkaline CW also had higher TS (between 9.59 and 28.06 g/L), and consequently a higher COD (between 475 and 1500 mg/L), than acid CW (Table 2).

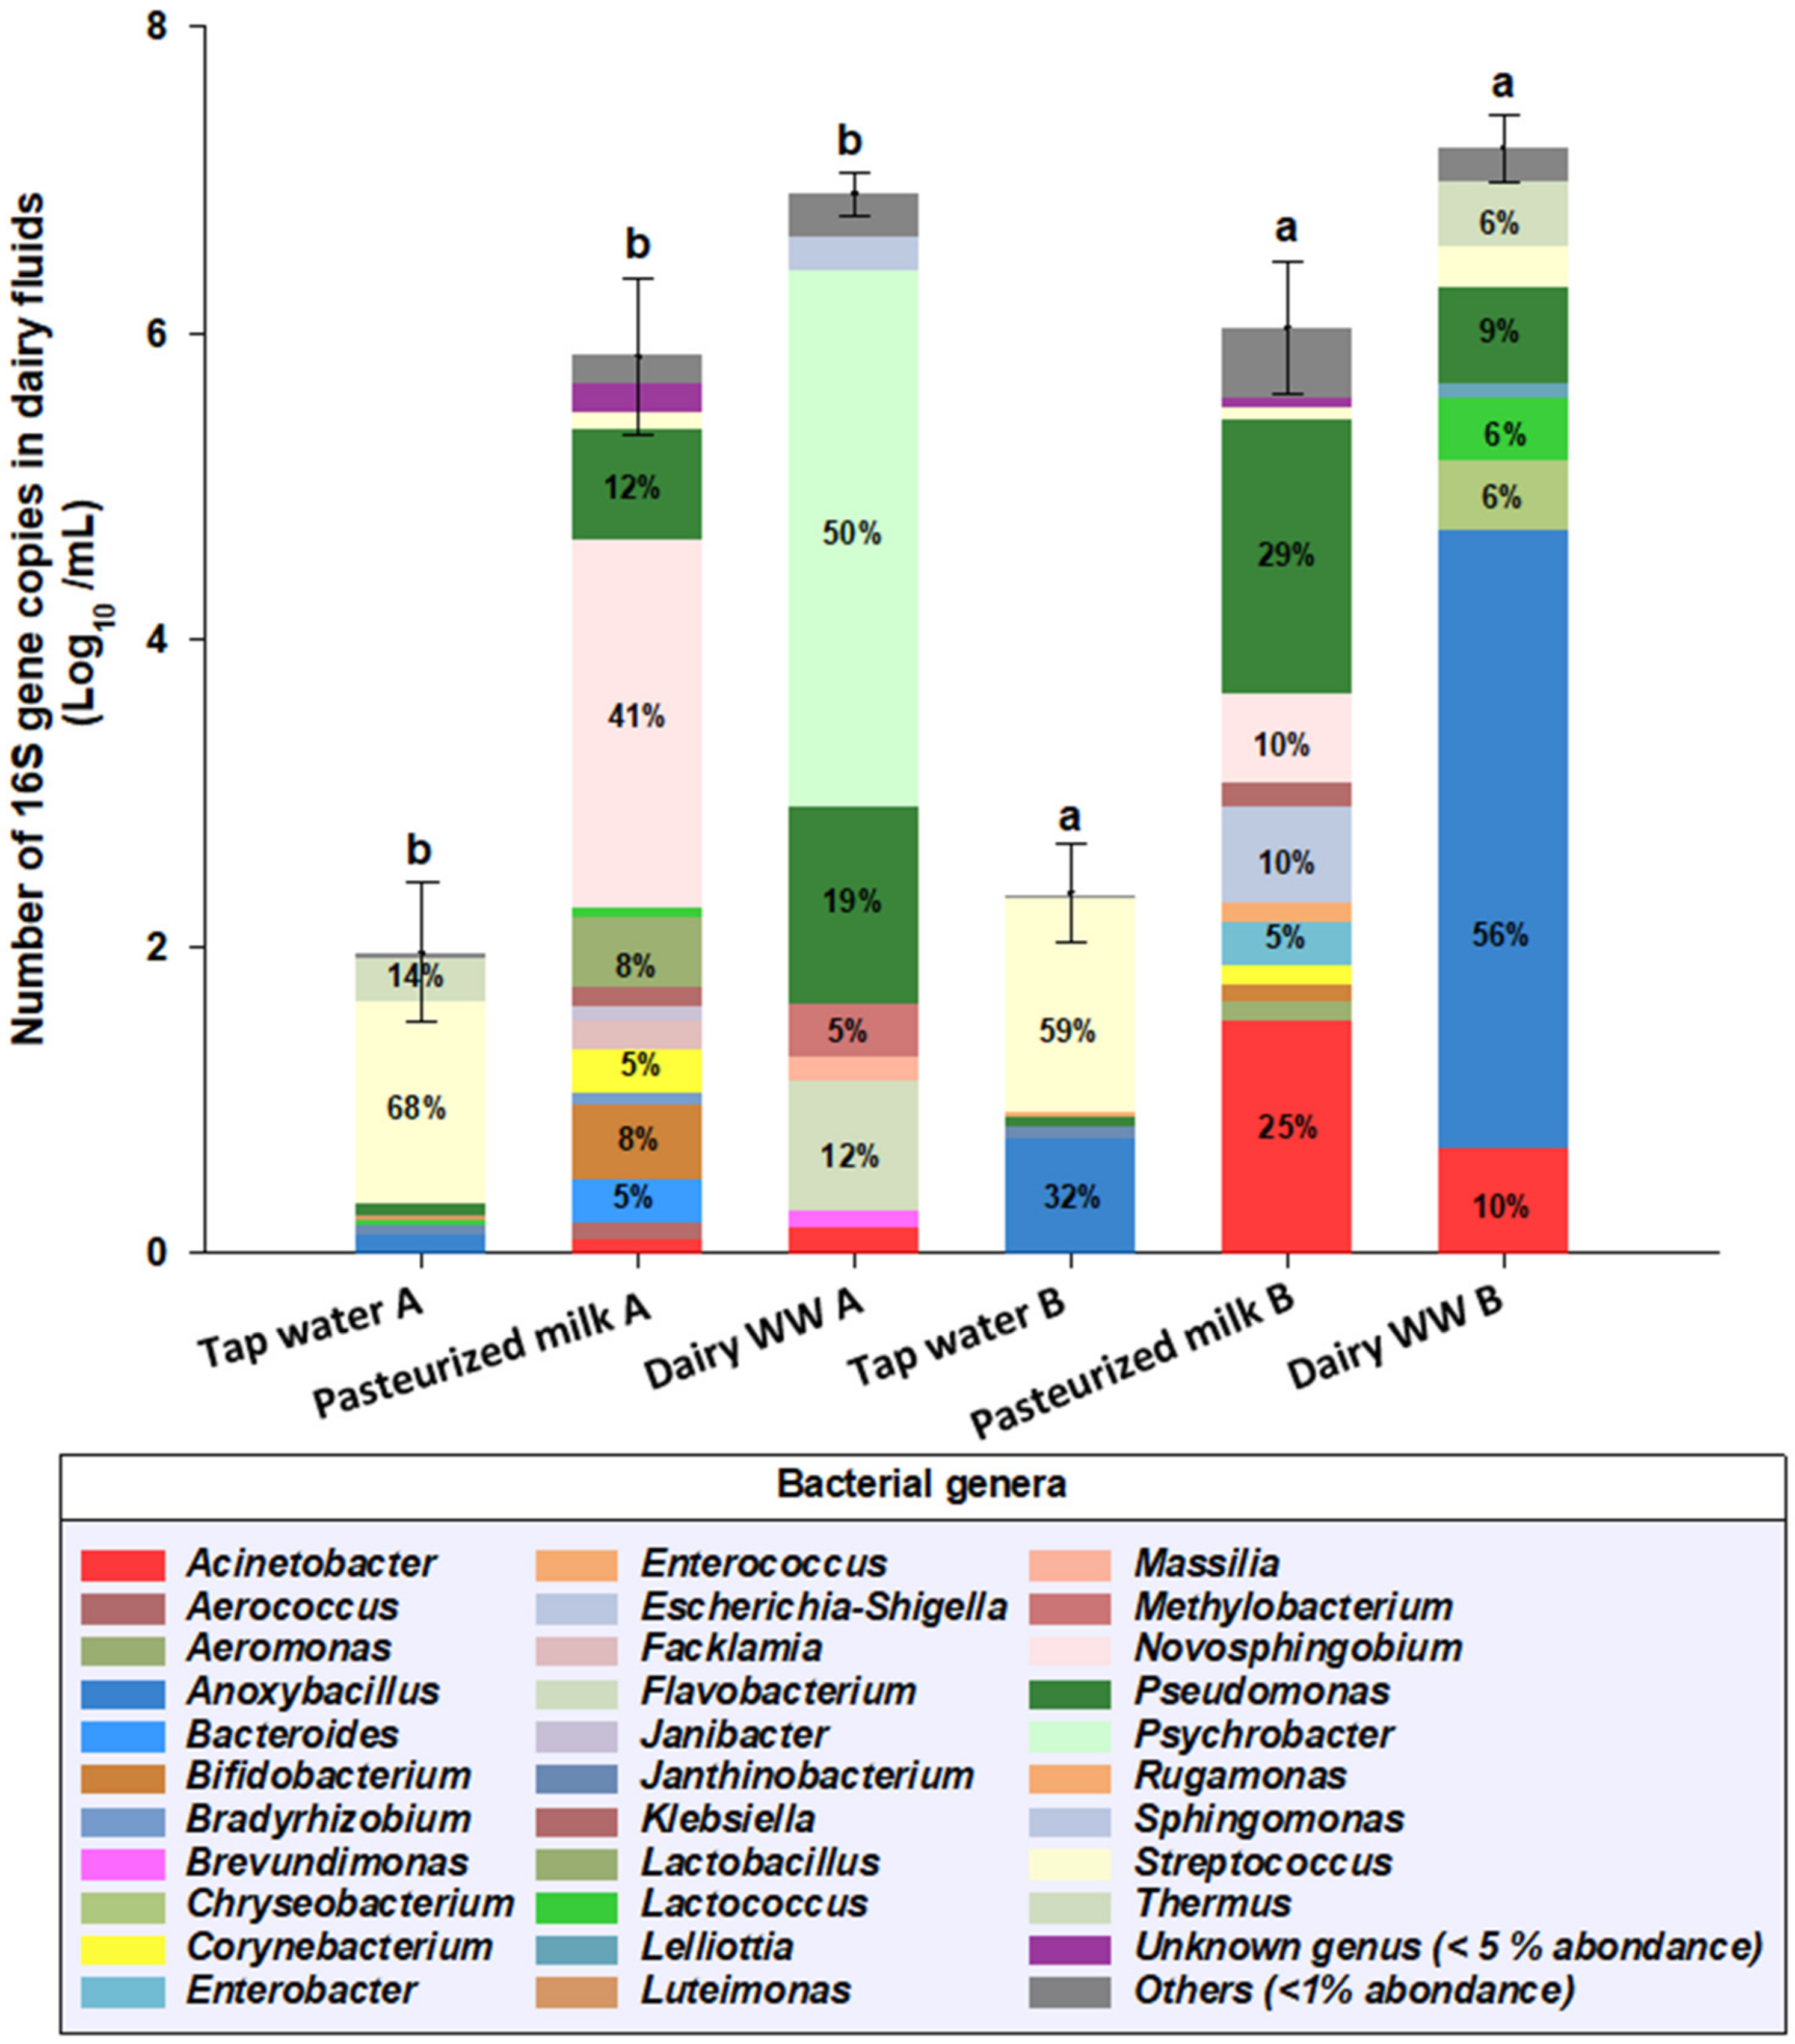
3.2. Bacterial Communities Founds in Dairy Fluids

Figure 1 and Supplementary Table S1 present the different bacterial communities found in tap water, pasteurized skim milk and WW recovered from dairy plants A and B. Results obtained for CW are not presented since it was impossible to extract a sufficient quantity of genomic DNA to assess the bacterial community profile, leading to fewer than 1000 reads per sample. Considering the total number of 16S gene copies per milliliter obtained by qPCR, tap water, pasteurized milk and WW from dairy plant A were significantly different from those of dairy plant B (p < 0.05). The total number of 16S gene copies per mL in WW differed from plant A to plant B, with values of 6.91 ± 0.06 log10/mL and 7.21 ± 0.02 log10/mL, respectively. Specifically, the WW from plant A was mostly dominated by Psychrobacter sp. (3.48 log10/mL) while Anoxybacillus sp. (4.03 log10/mL) was the main contaminant in WW from plant B. Low numbers of of 16S gene copies of Acinetobacter sp. (0.17 and 0.69 log10/mL for plant A and B, respectively) and Pseudomonas sp. (1.29 and 0.63 log10/mL for plant A and B, respectively) were detected in WW from both dairy plants, while Thermus sp. was only detected in plant B (0.41 log10/mL). The total number of 16S gene copies found in tap water was 1.48 ± 0.46 and 1.87 ± 0.32 log10/mL for plants A and B, respectively. Tap water was dominated by Streptococcus sp. with similar numbers of 16S gene copies, 1.00 and 1.11 log10/mL, respectively. Low numbers of 16S gene copies of Anoxybacillus sp. (0.09 and 0.60 log10/mL for plants A and B, respectively) and Pseudomonas sp. (0.05 log10/mL for both dairy plants) were detected in both plants while Thermus sp. was only present in plant A, but at a very low concentration (0.21 log10/mL). Pasteurized skim milk had similar total numbers of 16S gene copies for plants A and B, with values of 5.85 ± 0.51 and 6.04 ± 0.43 log10/mL, respectively. Pseudomonas sp. and Acinetobacter sp. were detected at higher concentrations in plant B (1.77 vs. 0.73 log10/mL and 1.53 vs. 0.09 log10/mL respectively for plants A and B) while Novosphingobium sp. was the main bacterial contaminant in plant A (2.39 vs. 0.59 log10/mL).

4. Discussion

The purpose of this study was to determine the proximate composition and bacterial ecosystem of WW and CW originating from two different Canadian dairy plants from the perspective of water reuse for the dairy industry. Our results demonstrated that the chemical characteristics of WW and CW were drastically different between the dairy plants. Since the quantity of genomic DNA sequenced in CW was fewer than 1000 reads per sample (data not shown), it was considered that no bacterial DNA was found in CW. However, different bacterial communities found in each WW were characterized. These differences could be potentially explained by the different processing practices and CIP procedures implemented in each dairy plant.

4.1. Differences in the Chemical Characteristics of White and Cleaning Wastewater

White wastewater generated from the rinsing step of milk pasteurizers is composed of milk solids diluted in tap water originating from the dairy plant’s drinking water system [6]. The concentration of milk solids on a dry basis was significantly higher in plant B compared to plant A, except for the fat content (Table 1). The variation in the content of milk solids can be explained by the duration of the rinsing step before recovery of WW samples since the milk solids concentration in WW decreased continuously during rinsing due to increased dilution with tap water over time [1]. In addition, the dry matter values obtained for the WW from the present study are within the range (0.4 g/L to 54.3 g/L) found in different dairy WW in the study by Vourch, et al. [1]. The WW were diluted and contained less protein than those analyzed by Brião, et al. [12] (average of 0.6 g/L), consequently their COD was also lower than the average (380–9500 mg/L) [1,12,28,29]. Surprisingly, very low BOD5 value was measured from WW from plant A whereas this parameter was not detected for WW from plant B as well as acid and alkaline CW. BOD5 is defined as the biochemical oxygen demand of wastewater measured in both dairy plants over 5 days under specific standard conditions [30]. More specifically, this parameter is based on the metabolic activity of aerobic microorganisms. In this context, the low value and apparent absence of BOD5 in the different dairy effluents could probably be due to a nutritive balance not compatible with microbial growth or the presence of a very low amount of viable bacteria. Indeed, BOD5 analyses were performed on alkaline and acid CW which represent extreme conditions for bacterial growth (pH ranged from 1.17 to 12.59). Similarly, low/absence of BOD5 for WW could be due to a very low contamination of these effluents due to the application of a pasteurization treatment and high pH values obtained in this study (8.23 and 12.45 for plant A and B, respectively) which were higher compared to those previously published (average from 6.6 and 7.9) [1,12]. Differences in rinsing of pasteurizers and sampling procedures could explain these results. Indeed, a water flush was undertaken for the recovery of WW. Toward the end of the water flush procedure, a caustic rinse with NaOH started. If sampling was performed at the end of the water flush, contamination of WW with NaOH could occur.
The differences in chemical characteristics and composition observed between acid and alkaline CW could be related to different CIP and sampling procedures between the two dairy plants. The experimental results obtained, however, are difficult to compare with data in the literature since most published work has been undertaken on dairy wastewater and not specifically on acid and alkaline effluents, separately. Considering this point, the pH values of acid and alkaline CW were higher than those published in previous studies (pH ranging from 5.50 to 10.37) while COD values were lower (ranging from 1500–14,000 mg/L) [29,31]. None of the dairy wastewaters (WW and CW) met the dairy effluent discharge quality specified in Canadian regulatory requirements (Canada Wastewater Systems Effluent Regulations, 2020; Wastewater Treatment Practice and Regulations in Canada and Other Jurisdictions, 2018), First, COD values of WW and alkaline CW for plant B were higher than the Canadian regulatory standards (maximum value of 150 mg/L). Second, the extreme acid and alkaline pH values of CW (dairy plants A and B) and WW (dairy plant B) (average 6–9 according to Canadian regulatory standards) did not allow their direct discharge into the environment or their reuse as a dairy ingredient, respectively. Finally, the concentration of suspended solids in alkaline CW exceeded current standards (maximum value of 0.03 g/L). Consequently, subsequent treatment of these dairy effluents is necessary for possible reuse to ensure sustainable dairy wastewater management. Reverse osmosis seems to be the most suitable technology due to its efficiency in generating process water [1,32] and it was demonstrated as an economically profitable alternative compared to other techniques used for treatment of wastewater in the dairy industry [11,33]. By using this membrane treatment, milk solids in WW can also be retained and reused, however, it will be necessary to make sure that these wastewaters are not contaminated with alkaline cleaning solutions.

4.2. Bacterial Genera Found in Dairy White Wastewaters

A total of 31 bacterial genera (unclassified genera were not included) were identified in dairy fluids (WW, tap water and pasteurized milk) originating from two Canadian dairy plants. Of these, 7 genera (Acinetobacter sp., Anoxybacillus sp., Pseudomonas sp., Psychrobacter sp., Steptococcus sp. and Thermus sp.) are discussed below due to their detection in WW and their occurrence in milk and dairy products [34].
Pseudomonas sp. and Acinetobacter sp. were identified in WW sampled from both dairy plants. The presence of these bacteria in these fluids could be correlated to their detection in pasteurized milk. Indeed, Pseudomonas is considered the predominant psychrotolerant bacteria in raw milk and a major contributor to milk spoilage [35]. Similarly, psychrotrophic Acinetobacter has been frequently detected in cold-stored raw milk [35,36]. Both Pseudomonas sp. and Acinetobacter sp. are heat sensitive and usually do not survive pasteurization [37]. However, Quigley, et al. [38] and Ding, et al. [39] showed that low numbers of Pseudomonas sp. could survive through commercial pasteurization and may contribute to the pasteurized milk microflora. Specific Acinetobacter sp. strains may also survive to pasteurization due to their ability to resist heat treatment [40]. The ability of Acinetobacter sp. and Pseudomonas sp. to survive cleaning processes in the dairy industry [41] to form biofilms in pasteurizers, heat exchangers, pasteurization pipelines, and direct steam injection sensor probes [42] could also explain their occurrence in pasteurized milk from both dairy plants and subsequent detection in WW. Numerous studies have also reported that Pseudomonas sp. can originate from drinking water distribution systems [43] and from water used for rinsing, including cooling water and water recovered after equipment cleaning in dairy plants [44,45]. Despite the fact that Pseudomonas sp. was detected in tap water from both dairy plants, it would be surprising to find that this fluid contributed significantly to the contamination of WW by Pseudomonas sp., due to the very low number of 16S gene copies detected in tap water (0.05 log10/mL) compared to WW (1.29 and 0.63 log10/mL). In the dairy industry, both Pseudomonas sp. and Acinetobacter sp. present a considerable challenge because many species can produce heat-stable lipases and proteases that cause quality defects during product storage [46]. However, it is important to note that the total number of 16S gene copies for these two genera was very low (ranging from 0.05 to 1.29 log10/mL) and that it was not possible to validate their viability.
Some bacterial communities characterized in the WW samples differed according to the dairy plant environment from which the WW was sourced. Psychrobacter sp. was mainly detected in WW from plant A whereas Anoxibacillus sp. was the most predominant bacterial genus in WW from plant B. Psychrobacter sp. is a Gram-negative psychrophilic genus found in a variety of marine and terrestrial environments [47]. Most strains are psychrotrophic and grow at 5 °C with an optimum temperature close to 20 °C. Psychrobacter sp. was previously detected in raw milk [48] and cheese, but is not usually expected to survive the pasteurization process [49] which could explain its absence in pasteurized milk from both dairy plants. Consequently, its presence in pasteurized milk or dairy products could have originated from post-processing contamination [50]. However, of all the dairy fluids analyzed, only WW from plant A was found to contain Psychrobacter sp. Consequently, we could hypothesize that plant A used cold water during the rinsing step to remove pasteurized milk and biofilms remaining in the pasteurization system, which could be the origin of these psychrophilic bacteria in WW. Anoxybacillus sp. is a Gram-positive thermophilic genus isolated from hot springs and found in extreme environments [51]. It has been detected in very low abundance in water springs and drinking water [52] explaining its presence in tap water (<1.0 log10 16S gene copies/mL) recovered from both dairy plants. However, Anoxybacillus sp. is widely studied in the dairy sector since strains of the spore former Anoxybacillus flavithermus have been specifically and frequently found as a contaminant of dairy processing and milk powders [53]. Indeed, A. flavithermus can attach and form biofilms on stainless steel surfaces in milk powder manufacturing plants and is able to survive the high temperature short time (HTST) pasteurization [50,53,54]. Contamination of dairy fluids with A. flavithermus could be due to its predominance in raw milk, its enrichment or introduction to dairy equipment, or a combination of these different factors [54]. Our study detected Anoxybacillus sp. (4.03 log10 16S gene copies/mL) only in WW from dairy plant B. Due to their resistance to heat treatment and their absence in pasteurized milk; it would be surprising if contamination of WW by Anoxybacillus sp. originated from raw milk. Anoxybacillus sp. strains can grow in the regeneration sections of heat exchangers [55], consequently the pasteurization system could be the main possible source of contamination due to CIP temperature parameters and the tap water used, especially in plant B, which contained 32% of Anoxybacillus sp. Interestingly, Anoxybacillus sp. was absent in WW of plant A even though it was detected in tap water originating from both dairy plants. Consequently, and contrary to the explanation for the detection of Psychrobacter sp. in plant A, we could hypothesize that plant B used warm water during the rinsing step to remove the remaining pasteurized milk in the pasteurization system. This could explain the predominance of thermophilic bacteria in WW from plant B. The detection of low numbers of 16S gene copies of Thermus sp., an extreme thermophile genus detected in hot water sources in the dairy industry [56] and heat-resistant Streptococcus sp. strains [39] only in WW from plant B supports this hypothesis.
From the perspective of regenerating water from WW using reverse osmosis, the bacterial diversity and communities characterized in both dairy WW would not be problematic due to the low number of 16S gene copies per milliliter (ranging from 0.12 to 4.03 log10 16S gene copies/mL) obtained for each bacterial genus. However, by analyzing the global profile of bacterial genera in WW using metabarcoding, the main difference found in the WW of both dairy plants is the predominance of psychrotrophic bacteria for plant A and predominance of thermophilic bacteria for plant B. Consequently, despite their low concentration, some bacterial genera, such as thermophilic spore-forming bacteria, could potentially cause spoilage of dairy products since they are resistant to heat applications. Thus, WW containing lower numbers of thermophilic bacteria are preferable for downstream applications. In addition, some precautions should be considered to evaluate the quality of tap water used in the dairy plants.

5. Conclusions

In the present study, we demonstrated that chemical and bacterial composition of wastewaters depends on multiple environmental factors specific to each dairy plant. More specifically, and regarding the results obtained in this work, different key challenges to water reclamation in dairy industries could be identified. The first is the presence of thermophilic spore-forming bacteria in WW which could represent a challenge for their reuse due to their negative impact on product and by-products quality. Consequently, CIP procedure parameters such as temperature may be important elements to consider. Similarly, and in relation with alkaline pH values calculated for WW, a better control during the recovery of WW is necessary during CIP to avoid its potential contamination by cleaning solution (alkaline and acidic). Finally, the quality of tap water used in dairy plants is a major factor since it can indirectly affect the quality of dairy products. An implementation of water quality studies and monitoring programs and the use of water treatment technologies (ozone and ultraviolet (UV) systems) would minimize this problem. To expand the possibilities for using and valorizing WW, work is currently underway to evaluate the evolution of bacterial communities during concentration of WW by reverse osmosis. The final objective is to generate process water and milk solids, and to ensure optimal quality for their recovery into dairy products.

Supplementary Materials

The following are available online at https://0-www-mdpi-com.brum.beds.ac.uk/article/10.3390/dairy2020016/s1, Table S1. Bacterial communities found in dairy white wastewater recovered from pasteurizers, as well as tap water and pasteurized skim milk from two Canadian dairy plants (A and B) (n = 2, ± standard deviation [SD]).

Author Contributions

Conceptualization, S.A., J.C., Y.P., S.L. and A.D.; Methodology, S.A., F.B.-S., M.-H.L., S.L. and A.D.; Software, S.A.; Validation, S.A., V.P., S.L. and A.D.; Formal Analysis, S.A., F.B.-S., M.-H.L.; Investigation, S.A. and F.B.-S.; Resources, S.A., F.B.-S., M.-H.L., J.C., V.P., Y.P., S.L. and A.D.; Data Curation, S.A. and F.B.-S.; Writing—Original Draft Preparation, S.A. and A.D.; Writing—Review and Editing, S.A., J.C., M.-H.L., Y.P., S.L. and A.D.; Visualization, S.A. and A.D.; Supervision, S.L., A.D.; Project Administration, A.D.; Funding Acquisition, A.D. All authors have read and agreed to the published version of the manuscript.

Funding

This research was funded by Natural Sciences and Engineering Research Council of Canada (NSERC), grant number RDCPJ-500562-16 and the Consortium de recherche et innovations en bioprocédés industriels au Québec (CRIBIQ), grant number 2015-035-C16. Parmalat Canada and Saputo are thanked for their financial support.

Institutional Review Board Statement

Not applicable.

Informed Consent Statement

Not applicable.

Data Availability Statement

Data is contained within the article.

Acknowledgments

Parmalat Canada and Saputo are thanked for providing us WW and CW batches. Finally, the authors also thank Diane Gagnon for assistance with chemical analysis.

Conflicts of Interest

The authors declare no conflict of interest.

References

  1. Vourch, M.; Balannec, B.; Chaufer, B.; Dorange, G. Treatment of Dairy Industry Wastewater by Reverse Osmosis for Water Reuse. Desalination 2008, 219, 190–202. [Google Scholar] [CrossRef]
  2. Balannec, B.; Vourch, M.; Rabiller-Baudry, M.; Chaufer, B. Comparative Study of Different Nanofiltration and Reverse Osmosis Membranes for Dairy Effluent Treatment by Dead-End Filtration. Sep. Purif. Technol. 2005, 42, 195–200. [Google Scholar] [CrossRef]
  3. Fernández, P.; Riera, F.A.; Álvarez, R.; Álvarez, S. Nanofiltration Regeneration of Contaminated Single-Phase Detergents Used in the Dairy Industry. J. Food Eng. 2010, 97, 319–328. [Google Scholar] [CrossRef]
  4. Seale, B.; Bremer, P.; Flint, S.; Brooks, J.; Palmer, J. Overview of the Problems Resulting from Biofilm Contamination in the Dairy Industry. In Biofilms in the Dairy Industry; Teh, K.H., Flint, S., Brooks, J., Knight, G., Eds.; John Wiley & Sons, Ltd.: Chichester, UK, 2015; pp. 49–64. ISBN 978-1-118-87628-2. [Google Scholar]
  5. Daufin, G.; Escudier, J.-P.; Carrère, H.; Bérot, S.; Fillaudeau, L.; Decloux, M. Recent and Emerging Applications of Membrane Processes in the Food and Dairy Industry. Food Bioprod. Process. 2001, 79, 89–102. [Google Scholar] [CrossRef]
  6. Balannec, B.; Gésan-Guiziou, G.; Chaufer, B.; Rabiller-Baudry, M.; Daufin, G. Treatment of Dairy Process Waters by Membrane Operations for Water Reuse and Milk Constituents Concentration. Desalination 2002, 147, 89–94. [Google Scholar] [CrossRef]
  7. Slavov, A.K. Dairy Wastewaters—General Characteristics and Treatment Possibilities—A Review. Food Technol. Biotechnol. 2017, 55. [Google Scholar] [CrossRef] [PubMed]
  8. Kushwaha, J.P.; Srivastava, V.C.; Mall, I.D. An Overview of Various Technologies for the Treatment of Dairy Wastewaters. Crit. Rev. Food Sci. Nutr. 2011, 51, 442–452. [Google Scholar] [CrossRef]
  9. Chi, F.H.; Cheng, W.P. Use of Chitosan as Coagulant to Treat Wastewater from Milk Processing Plant. J. Polym. Environ. 2006, 14, 411–417. [Google Scholar] [CrossRef]
  10. Ghernaout, D. Water Reuse: Extenuating Membrane Fouling in Membrane Processes. Am. J. Chem. Eng. 2018, 6, 25. [Google Scholar] [CrossRef]
  11. Suárez, A.; Riera, F.A. Production of High-Quality Water by Reverse Osmosis of Milk Dairy Condensates. J. Ind. Eng. Chem. 2015, 21, 1340–1349. [Google Scholar] [CrossRef]
  12. Brião, V.B.; Vieira Salla, A.C.; Miorando, T.; Hemkemeier, M.; Cadore Favaretto, D.P. Water Recovery from Dairy Rinse Water by Reverse Osmosis: Giving Value to Water and Milk Solids. Resour. Conserv. Recycl. 2019, 140, 313–323. [Google Scholar] [CrossRef]
  13. Gésan-Guiziou, G.; Alvarez, N.; Jacob, D.; Daufin, G. Cleaning-in-Place Coupled with Membrane Regeneration for Re-Using Caustic Soda Solutions. Sep. Purif. Technol. 2007, 54, 329–339. [Google Scholar] [CrossRef]
  14. Vourch, M.; Balannec, B.; Chaufer, B.; Dorange, G. Nanofiltration and Reverse Osmosis of Model Process Waters Fromthe Dairy Industry to Produce Water for Reuse. Desalination 2005, 172, 245–256. [Google Scholar] [CrossRef]
  15. Bennani, C.F.; Ousji, B.; Ennigrou, D.J. Reclamation of Dairy Wastewater Using Ultrafiltration Process. Desalination Water Treat. 2015, 55, 297–303. [Google Scholar] [CrossRef]
  16. Luo, J.; Ding, L. Influence of PH on Treatment of Dairy Wastewater by Nanofiltration Using Shear-Enhanced Filtration System. Desalination 2011, 278, 150–156. [Google Scholar] [CrossRef]
  17. Chamberland, J.; Lessard, M.-H.; Doyen, A.; Labrie, S.; Pouliot, Y. A Sequencing Approach Targeting the 16S RRNA Gene Unravels the Biofilm Composition of Spiral-Wound Membranes Used in the Dairy Industry. Dairy Sci. Technol. 2017, 96, 827–843. [Google Scholar] [CrossRef] [Green Version]
  18. Amann, R.I.; Ludwig, W.; Schleifer, K.H. Phylogenetic Identification and in Situ Detection of Individual Microbial Cells without Cultivation. Microbiol. Rev. 1995, 59, 143–169. [Google Scholar] [CrossRef]
  19. Pace, N.R. A Molecular View of Microbial Diversity and the Biosphere. Science 1997, 276, 734–740. [Google Scholar] [CrossRef]
  20. Delbès, C.; Ali-Mandjee, L.; Montel, M.-C. Monitoring Bacterial Communities in Raw Milk and Cheese by Culture-Dependent and -Independent 16S rRNA Gene-Based Analyses. Appl. Environ. Microbiol. 2007, 73, 1882–1891. [Google Scholar] [CrossRef] [Green Version]
  21. McGarvey, J.A.; Miller, W.G.; Sanchez, S.; Stanker, L. Identification of Bacterial Populations in Dairy Wastewaters by Use of 16S rRNA Gene Sequences and Other Genetic Markers. Appl. Environ. Microbiol. 2004, 70, 4267–4275. [Google Scholar] [CrossRef] [Green Version]
  22. Ni’am, M.F.; Othman, F. Experimental Design of Electrocoagulation and Magnetic Technology for Enhancing Suspended Solids Removal from Synthetic Wastewater. Int. J. Sci. Eng. 2014, 7, 178–192. [Google Scholar] [CrossRef] [Green Version]
  23. Chamberland, J.; Beaulieu-Carbonneau, G.; Lessard, M.-H.; Labrie, S.; Bazinet, L.; Doyen, A.; Pouliot, Y. Effect of Membrane Material Chemistry and Properties on Biofouling Susceptibility during Milk and Cheese Whey Ultrafiltration. J. Membr. Sci. 2017, 542, 208–216. [Google Scholar] [CrossRef]
  24. Lemarchand, K.; Berthiaume, F.; Maynard, C.; Harel, J.; Payment, P.; Bayardelle, P.; Masson, L.; Brousseau, R. Optimization of Microbial DNA Extraction and Purification from Raw Wastewater Samples for Downstream Pathogen Detection by Microarrays. J. Microbiol. Methods 2005, 63, 115–126. [Google Scholar] [CrossRef] [PubMed]
  25. Comeau, A.M.; Li, W.K.W.; Tremblay, J.-É.; Carmack, E.C.; Lovejoy, C. Arctic Ocean Microbial Community Structure before and after the 2007 Record Sea Ice Minimum. PLoS ONE 2011, 6, e27492. [Google Scholar] [CrossRef]
  26. Nakatsuji, T.; Chiang, H.-I.; Jiang, S.B.; Nagarajan, H.; Zengler, K.; Gallo, R.L. The Microbiome Extends to Subepidermal Compartments of Normal Skin. Nat. Commun. 2013, 4, 1431. [Google Scholar] [CrossRef] [PubMed] [Green Version]
  27. Louca, S.; Doebeli, M.; Parfrey, L.W. Correcting for 16S rRNA Gene Copy Numbers in Microbiome Surveys Remains an Unsolved Problem. Microbiome 2018, 6, 41. [Google Scholar] [CrossRef] [PubMed]
  28. Tawfik, A.; Sobhey, M.; Badawy, M. Treatment of a Combined Dairy and Domestic Wastewater in an Up-Flow Anaerobic Sludge Blanket (UASB) Reactor Followed by Activated Sludge (AS System). Desalination 2008, 227, 167–177. [Google Scholar] [CrossRef]
  29. Janczukowicz, W.; Zieliński, M.; Dębowski, M. Biodegradability Evaluation of Dairy Effluents Originated in Selected Sections of Dairy Production. Bioresour. Technol. 2008, 99, 4199–4205. [Google Scholar] [CrossRef] [PubMed]
  30. Preininger, C.; Klimant, I.; Wolfbeis, O.S. Optical Fiber Sensor for Biological Oxygen Demand. Anal. Chem. 1994, 66, 1841–1846. Available online: https://0-pubs-acs-org.brum.beds.ac.uk/doi/pdf/10.1021/ac00083a011 (accessed on 13 March 2020). [CrossRef]
  31. Sarkar, B.; Chakrabarti, P.P.; Vijaykumar, A.; Kale, V. Wastewater Treatment in Dairy Industries—Possibility of Reuse. Desalination 2006, 195, 141–152. [Google Scholar] [CrossRef]
  32. Yapıcıoğlu, P.; Yeşilnacar, M.I. Energy Cost Assessment of a Dairy Industry Wastewater Treatment Plant. Environ. Monit. Assess. 2020, 192, 536. [Google Scholar] [CrossRef]
  33. Chamberland, J.; Benoit, S.; Doyen, A.; Pouliot, Y. Integrating Reverse Osmosis to Reduce Water and Energy Consumption in Dairy Processing: A Predictive Analysis for Cheddar Cheese Manufacturing Plants. J. Water Process Eng. 2020, 38, 101606. [Google Scholar] [CrossRef]
  34. Parente, E.; Ricciardi, A.; Zotta, T. The Microbiota of Dairy Milk: A Review. Int. Dairy J. 2020, 107, 104714. [Google Scholar] [CrossRef]
  35. De Oliveira, G.B.; Favarin, L.; Luchese, R.H.; McIntosh, D. Psychrotrophic Bacteria in Milk: How Much Do We Really Know? Braz. J. Microbiol. 2015, 46, 313–321. [Google Scholar] [CrossRef] [PubMed]
  36. Gurung, M.; Nam, H.M.; Tamang, M.D.; Chae, M.H.; Jang, G.C.; Jung, S.C.; Lim, S.K. Prevalence and Antimicrobial Susceptibility of Acinetobacter from Raw Bulk Tank Milk in Korea. J. Dairy Sci. 2013, 96, 1997–2002. [Google Scholar] [CrossRef] [PubMed]
  37. Ranieri, M.L.; Boor, K.J. Short Communication: Bacterial Ecology of High-Temperature, Short-Time Pasteurized Milk Processed in the United States. J. Dairy Sci. 2009, 92, 4833–4840. [Google Scholar] [CrossRef]
  38. Quigley, L.; O’Sullivan, O.; Stanton, C.; Beresford, T.P.; Ross, R.P.; Fitzgerald, G.F.; Cotter, P.D. The Complex Microbiota of Raw Milk. FEMS Microbiol. Rev. 2013, 37, 664–698. [Google Scholar] [CrossRef] [PubMed] [Green Version]
  39. Ding, R.; Liu, Y.; Yang, S.; Liu, Y.; Shi, H.; Yue, X.; Wu, R.; Wu, J. High-Throughput Sequencing Provides New Insights into the Roles and Implications of Core Microbiota Present in Pasteurized Milk. Food Res. Int. 2020, 137, 109586. [Google Scholar] [CrossRef] [PubMed]
  40. Dumalisile, P.; Witthuhn, R.C.; Britz, T.J. Impact of Different Pasteurization Temperatures on the Survival of Microbial Contaminants Isolated from Pasteurized Milk. Int. J. Dairy Technol. 2005, 58, 74–82. [Google Scholar] [CrossRef]
  41. Langsrud, S.; Seifert, L.; Møretrø, T. Characterization of the Microbial Flora in Disinfecting Footbaths with Hypochlorite. J. Food Prot. 2006, 69, 2193–2198. [Google Scholar] [CrossRef] [PubMed]
  42. Cherif-Antar, A.; Moussa–Boudjemâa, B.; Didouh, N.; Medjahdi, K.; Mayo, B.; Flórez, A.B. Diversity and Biofilm-Forming Capability of Bacteria Recovered from Stainless Steel Pipes of a Milk-Processing Dairy Plant. Dairy Sci. Technol. 2016, 96, 27–38. [Google Scholar] [CrossRef]
  43. Vaz-Moreira, I.; Nunes, O.C.; Manaia, C.M. Diversity and Antibiotic Resistance in Pseudomonas Spp. from Drinking Water. Sci. Total Environ. 2012, 426, 366–374. [Google Scholar] [CrossRef] [PubMed]
  44. Dixon, M.; Flint, S.; Palmer, J.; Love, R.; Biggs, P.; Beuger, A. Analysis of Culturable and Non-Culturable Bacteria and Their Potential to Form Biofilms in a Primary Treated Dairy Wastewater System. Environ. Technol. 2018, 39, 2185–2192. [Google Scholar] [CrossRef]
  45. Chiesa, F.; Lomonaco, S.; Nucera, D.; Garoglio, D.; Dalmasso, A.; Civera, T. Distribution of Pseudomonas Species in a Dairy Plant Affected by Occasional Blue Discoloration. Ital. J. Food Saf. 2014, 3. [Google Scholar] [CrossRef] [PubMed] [Green Version]
  46. Yuan, L.; Sadiq, F.A.; Burmølle, M.; Wang, N.; He, G. Insights into Psychrotrophic Bacteria in Raw Milk: A Review. J. Food Prot. 2019, 82, 1148–1159. [Google Scholar] [CrossRef] [PubMed]
  47. Denner, E.B.M.; Mark, B.; Mark, B.; Busse, H.-J.; Busse, H.-J.; Turkiewicz, M.; Lubitz, W. Psychrobacter Proteolyticus Sp. Nov., a Psychrotrophic, Halotolerant Bacterium Isolated from the Antarctic Krill Euphausia Superba Dana, Excreting a Cold-Adapted Metalloprotease. Syst. Appl. Microbiol. 2001, 24, 44–53. [Google Scholar] [CrossRef]
  48. Hantsis-Zacharov, E.; Halpern, M. Culturable Psychrotrophic Bacterial Communities in Raw Milk and Their Proteolytic and Lipolytic Traits. Appl. Environ. Microbiol. 2007, 73, 7162–7168. [Google Scholar] [CrossRef] [Green Version]
  49. Quigley, L.; McCarthy, R.; O’Sullivan, O.; Beresford, T.P.; Fitzgerald, G.F.; Ross, R.P.; Stanton, C.; Cotter, P.D. The Microbial Content of Raw and Pasteurized Cow Milk as Determined by Molecular Approaches. J. Dairy Sci. 2013, 96, 4928–4937. [Google Scholar] [CrossRef]
  50. Techer, C. MC SPOILAGE OF ANIMAL PRODUCTS | Microbial Milk Spoilage. Encycl. Food Microbiol. 2014, 3, 446–452. [Google Scholar]
  51. Goh, K.M.; Kahar, U.M.; Chai, Y.Y.; Chong, C.S.; Chai, K.P.; Ranjani, V.; Illias, R.M.; Chan, K.-G. Recent Discoveries and Applications of Anoxybacillus. Appl. Microbiol. Biotechnol. 2013, 97, 1475–1488. [Google Scholar] [CrossRef]
  52. Rusiñol, M.; Martínez-Puchol, S.; Timoneda, N.; Fernández-Cassi, X.; Pérez-Cataluña, A.; Fernández-Bravo, A.; Moreno-Mesonero, L.; Moreno, Y.; Alonso, J.L.; Figueras, M.J.; et al. Metagenomic Analysis of Viruses, Bacteria and Protozoa in Irrigation Water. Int. J. Hyg. Environ. Health 2020, 224, 113440. [Google Scholar] [CrossRef] [PubMed]
  53. Dettling, A.; Wedel, C.; Huptas, C.; Hinrichs, J.; Scherer, S.; Wenning, M. High Counts of Thermophilic Spore Formers in Dairy Powders Originate from Persisting Strains in Processing Lines. Int. J. Food Microbiol. 2020, 108888. [Google Scholar] [CrossRef] [PubMed]
  54. Kable, M.E.; Srisengfa, Y.; Xue, Z.; Coates, L.C.; Marco, M.L. Viable and Total Bacterial Populations Undergo Equipment- and Time-Dependent Shifts during Milk Processing. Appl. Environ. Microbiol. 2019, 85, e00270-19. [Google Scholar] [CrossRef] [PubMed] [Green Version]
  55. Burgess, S.A.; Brooks, J.D.; Rakonjac, J.; Walker, K.M.; Flint, S.H. The Formation of Spores in Biofilms of Anoxybacillus flavithermus. J. Appl. Microbiol. 2009, 107, 1012–1018. [Google Scholar] [CrossRef]
  56. Quigley, L.; O’Sullivan, D.J.; Daly, D.; O’Sullivan, O.; Burdikova, Z.; Vana, R.; Beresford, T.P.; Ross, R.P.; Fitzgerald, G.F.; McSweeney, P.L.H.; et al. Thermus and the Pink Discoloration Defect in Cheese. mSystems 2016, 1. [Google Scholar] [CrossRef] [PubMed] [Green Version]
Figure 1. Bacterial communities found in dairy wastewater (WW) recovered from pasteurizers, tap water and pasteurized skim milk of two Canadian dairy plants (A and B). The bar length represents the number of 16S gene copies of the bacterial genus in these fluids and the percentages indicate the proportion of the specific bacterial genus. Values below 4% were not presented. For the same effluent (tap water, pasteurized milk, or dairy WW) different letters indicate significant differences (Student’s t-test, p < 0.05, n = 2, ± standard deviation [SD]).
Dairy 02 00016 g001
Table 1. Chemical characteristics of white wastewater generated during the cleaning procedure of pasteurizers from two Canadian dairy plants (A and B).
Indicator 1Plant APlant B
pH8.23 ± 0.07 b12.45 ± 0.19 a
TS (g/L)0.50 ± 0.04 b3.12 ± 0.24 a
Ash (g/L)0.16 ± 0.0 b0.73 ± 0.03 a
Lactose (g/L)0.33 ± 0.03 b2.22 ± 0.18 a
Protein (g/L)0.01 ± 0.00 b0.15 ± 0.00 a
Fat (g/L)0.00 ± 0.00 a0.03 ± 0.02 a
COD (mg/L)21.50 ± 0.71 b354.50 ± 2.12 a
BOD5 (mg/L)4.50 ± 0.71ND 2
1 Ash, protein and fat were expressed on a dry basis. TS: Total solids, COD: Chemical oxygen demand, BOD5: five day biochemical oxygen demand. 2 Not detected: value below the detection limit of <3 mg/L. For the same indicator, different letters (a,b) indicate significant differences (Student’s t-test, p < 0.05, n = 2, ± standard deviation [SD]).
Table 2. Chemical characteristics of cleaning acidic and alkaline wastewater generated after the cleaning of the pasteurizers of two dairy plants (A and B).
Component 1Acid CWAlkaline CW
Plant APlant BPlant APlant B
pH1.82 ± 0.06 c1.17 ± 0.01 d12.59 ± 0.01 a12.31 ± 0.10 b
EC (μS/cm)5.35 ± 0.10 d14.25 ± 0.13 c67.97 ± 2.70 a30.06 ± 0.65 b
TS (g/L)0.74 ± 0.04 c0.93 ± 0.02 d28.06 ± 0.38 a9.59± 0.56 b
TSS (g/L)0.02 ± 0.00 d0.01 ± 0.00 c0.19 ± 0.06 b0.21± 0.02 a
Ca2+ (mg/L)12.22 ± 1.45 d177.04 ± 0.43 a45.15 ± 1.76 b18.81 ± 1.98 c
Mg2+ (mg/L)1.89 ± 0.17 b7.07 ± 0.05 a0.82 ± 0.10 c0.23 ± 0.03 d
K+ (mg/L)0.76 ± 0.09 d1.57 ± 0.06 c9.41 ± 0.26 a6.48 ± 0.07 b
Na+ (mg/L)155 ± 13 c23 ± 4 d10,665 ±191 a4033 ± 46 b
COD (mg/L)25 ± 1 d26 ± 0 c1500 ± 7 a475 ± 62 b
BOD5 (mg/L)ND 2NDNDND
1 CW: Cleaning wastewater, EC: electrical conductivity, TS: total solids, TSS: total suspended solids, COD: chemical oxygen demand, BOD5: five day biochemical oxygen demand. 2 Not detected: value below the detection limit of <3 mg/L. For the same effluent (acid or alkaline) and indicator, different letters (a–d) indicate significant differences (Student’s t test, p < 0.05, n = 2, ± standard deviation [SD]).
Publisher’s Note: MDPI stays neutral with regard to jurisdictional claims in published maps and institutional affiliations.

