Article

New Treatment Option for Clinical and Subclinical Mastitis in Dairy Cows Using Acoustic Pulse Technology (APT)

1
Armenta Ltd., Ra’anana 4321545, Israel
2
Regalim Dairy Farm, Regavim 3782000, Israel
3
Kedem Dairy Farm, Masuot Itzhak 7985800, Israel
4
Gal-Yam Dairy Farm, Kfar Glikson 3781500, Israel
5
Israeli Cattle Breeders Association, Caesarea 3781500, Israel
*
Author to whom correspondence should be addressed.
Submission received: 3 March 2021 / Revised: 19 April 2021 / Accepted: 28 April 2021 / Published: 18 May 2021

Abstract

:
The effect of acoustic pulse technology (APT) on recovery, culling, milk yield, and economic benefits for 118 cows with subclinical mastitis was compared with a no-treatment control (59 vs. 59), and another 118 APT-treated cows with clinical mastitis were compared with antibiotic-treated controls (59 vs. 59). Recovery was defined as a decrease in somatic cell count (SCC) to <250 × 103 cells/mL in at least two out of three monthly milk recordings after treatments. For the subclinically infected cows, APT treatment resulted in 65.5% recovery, 0% culling, and additional milk yield of 2.74 L/cow per day compared to 35.6% recovery and 5.1% culling in the no-treatment controls. For the clinically infected cows, APT treatment resulted in 67.8% recovery, 6.8% culling, and additional milk yield of 3.9 L/cow per day compared to 35.6% recovery and 32.2% culling in the antibiotic-treated group. Bacteriological analysis was run for 95 (80%) cows with clinical mastitis (APT-46; AB-49). For cows with Escherichia coli infection, 85.7% (18/21) treated with APT recovered vs. 17.6% (3/17) in the antibiotic-treated group; for cows with streptococcal infection, 66.0% (12/18) in the APT-treated group recovered vs. 44.4% (8/18) in the antibiotic-treated group.

Graphical Abstract

1. Introduction

Acoustic pulse therapy (APT), also referred to as low-intensity shockwave (SW) treatment, affects cells by mechanotransduction, which constructively influences and promotes recovery [1] by converting the mechanical stimulus into biochemical responses in different cell types, such as migration, proliferation, differentiation of important cellular functions, and apoptosis [2,3]. As a result, local homeostasis and positive regulation of cell vitality promote conditions for tissue self-healing and the secretion of anti-inflammatory cytokines [4], induction of neovascularization and matrix remodeling [5,6,7], and production of angiogenesis-related growth factors such as vascular endothelial growth factor and endothelial nitric oxide synthase. This results in new vessel growth with improved blood supply [8], increased cell proliferation, accelerated tissue regeneration, upregulated healing expression of transforming growth factor α-1 and production of NO, and suppression of nuclear factor kappa-light-chain-enhancer of activated B cell (NF-ĸB) and proinflammatory cytokine production [7,9]. Shockwaves have an immunomodulatory effect mainly through anti-inflammatory factors, shifting macrophages from M1 (proinflammatory activity) to M2 (anti-inflammatory activity) [9,10,11]. Moreover, SWs increase T-cell polarization and directed migration via the release of cellular ATP and feedback mechanisms [12], as well as cell proliferation and interleukin (IL)-2 expression [13].
In mastitis, mammary gland inflammation is, in most cases, a response to pathogen invasion into the gland. Recognition of the pathogens by the innate immune system and epithelial cells through pattern-recognition receptors such as Toll-like receptors [14,15], which activates nuclear factors such as NF-κB and the release of proinflammatory cytokines such as IL-1β, IL-8, IL-17, and tumor necrosis factor-α, triggers immediate immune and inflammatory responses in which the endothelial–mammary barriers are open, allowing for the crucial cellular and humoral infiltration from blood to milk [15,16,17]. During this cytokine storming, polymorphonuclear cells and macrophages combat the pathogen, and vast obliteration of mammary tissues or limited areas of deep damage can occur in the gland regardless of bacterial clearance [17,18]. Thus, to reduce this tissue damage, farmers prefer early aggressive treatment, frequently antibiotics. The damage to the udder tissues has a direct negative influence on milk quality, i.e., high somatic cell count (SCC), low-quality proteins, and lowered milk coagulation properties [19] that can eventually lead to culling of the cow. The degree of healing is questionable because in most studies, elimination of the pathogens is the end point, rather than full recovery from mastitis, i.e., a return to pre-infection productivity levels [20].
The economic influence of mastitis on the cows′ value is also related to lactation number, period, or stage in the lactation and pregnancy. Younger and/or pregnant cows have higher value. Time in lactation from parturition can be divided into three periods. In period 1, milk production increases to a peak after 3–6 weeks. The increased production is due to continuation of the lactogenesis period, proliferation of lobuloalveolar cells, and an increase in the RNA: DNA ratio, the number of ribosomes, the endoplasmic reticulum, and the number of mitochondria per cell. Period 2 is termed galactopoiesis: milk production is maintained at the same level for weeks and then starts to decline. During this period, lobuloalveolar cell proliferation and the RNA:DNA ratio in the milk are stable. In period 3, the cow’s mammary gland undergoes regression or involution, and recovery from infection can slow the involution rate [21]. Thus, if the gland recovers from the infection, increased milk production during period 1, longer milk persistence during period 2, and slower involution rate in period 3 are expected.
Acoustic pulse technology was specifically developed for the treatment of dairy cows (APT-X, Armenta Ltd., Ra’anana, Israel). The therapeutic effects are distributed over a large area generated by using high air pressure to repeatedly drive a projectile to collide against an anvil, connected to a treatment head [22]. The acoustic pulse is noninvasive and the treatment zone covers about 3487 cm3 (213 in3) of the udder tissue. The APT-X is a hand-held device powered by air pressure from pressurized air cylinders, allowing easy access to treatment sites with no effect on the milking routine (Figure 1). Moreover, milk discarding is not required either during or after the treatment.
In previous studies [22], Leitner, unpublished data], APT was assessed on hundreds of cows with clinical and subclinical mastitis on several dairy farms, and resulted in 70–80% recovery, i.e., a decrease in the SCC to <250 × 103 cells/mL in all three monthly milk recordings, or in the second and third recordings, and a return to normal milk production. Moreover, when APT was compared to antibiotics, >90% of the cows treated with APT remained in the herd for at least 90 days (end of the experiment) and were productive and profitable, compared to only 50% of the cows treated with antibiotics.
The present study aimed to further assess the effect of APT treatment, compared to no treatment for subclinical mastitic cows or antibiotic treatment for clinical mastitic cows by the local teams on the farm as routinely used. The treatment included cows with subclinical mastitis as identified by SCC elevation to >400 × 103 cells/mL by the routine milk recording or clinical mastitis, showing clinical signs such as welling, pain, changes in milk with or without decreased yield, and an increase in its conductivity. The analyses compared recovery, culling, milk yield (MY), and economic benefits following APT treatment.

2. Materials and Methods

2.1. Study Layout

Israeli-Holstein cows at 1st–5th lactation from seven farms (n = 236) with clinical (seven farms) or subclinical (four farms) mastitis with SCC > 400 × 103 cells/mL were chosen for the study. The cows were milked thrice daily (05:00, 13:00, and 20:00 h) in a parlor equipped with an online computerized AfiFarm Herd Management data-acquisition system (Afimilk, Afikim, Israel) [23] or SCR Dairy Cow Monitoring and Herd Management systems (SCR, Netanya, Israel) [24]. Subclinical mastitic cows were identified with SCC > 400 × 103 cells/mL following the routine monthly milk recording and a quarterly California mastitis test (CMT; scale of 0, T, 1, 2, 3) on day of treatment for verifying the inflamed quarter. Cows with more than two quarters with CMT > 2 or all quarters with CMT < 1 were excluded. Clinical udder infections were detected by the dairy staff and/or by the online computerized management system. The level of inflammation was recorded by CMT, assuming that CMT > 3 equals 5 × 10⁶ cells/mL. The cows were in different lactations and days in milk (DIM), with different daily MYs and histories of infection. The cows were paired according to type of inflammation (clinical or subclinical), farm, lactation, SCC (or CMT), DIM, and MY (for clinical cases MY was that recorded by the online system on -3 to -1 days) by the researchers and each pair was randomly divided by the farm personnel (envelopes chosen) as follows: subclinical—for APT treatment (APT) or no-treatment control (NT); clinical—for APT treatment or antibiotic treatment (AB). For the clinical cases, sterile samples were taken for bacteriological analysis (at the laboratory of the National Service for Udder Health and Milk Quality, Israel Dairy Board, Caesarea, Israel). Milk recording was performed for up to 2 months before treatment and 3 months post-treatment; routine monthly MY and SCC (Fossomatic FC, Foss Electric, Hilleröd, Denmark) were recorded by the Israeli Cattle Breeders Association (ICBA, Caesarea, Israel), and management decisions (dry off, culling) were taken by the farmer and the local veterinarian. Daily MY of all cows was recorded by the data-acquisition system.

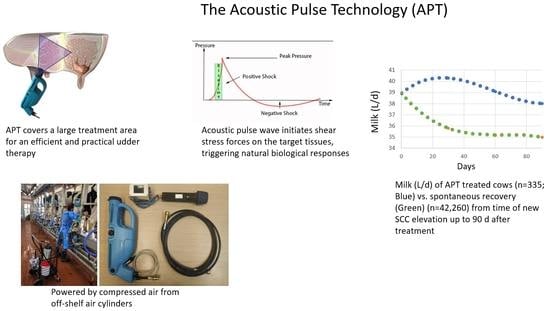
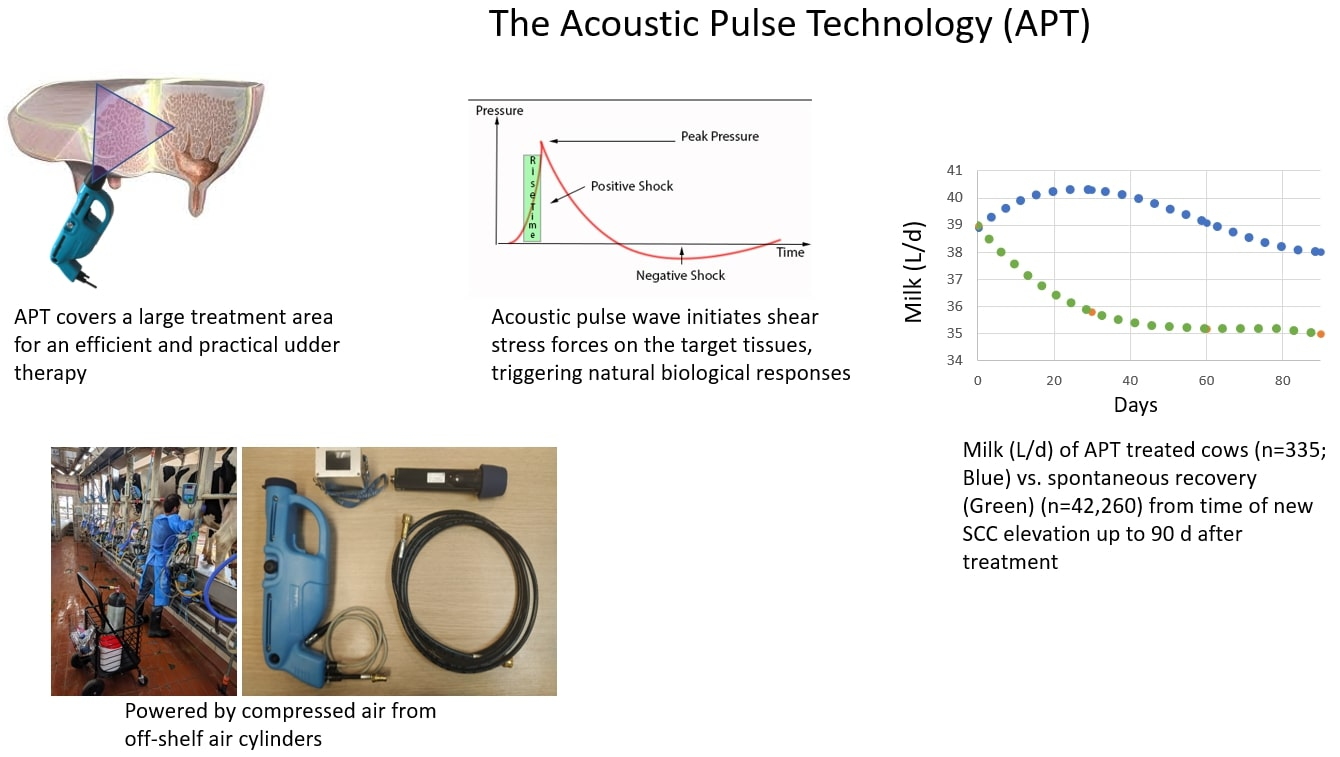
2.2. Acoustic Pulse Technology and Antibiotic Treatment Protocols

Cows with subclinical mastitis were treated 15 days after milk recording, and those with clinical mastitis 1–2 days post-milk recording. The SWs were delivered over two regions of the mastitis-inflamed quarter in three treatments performed 3 days apart. The APT treatment session included a total of 400 pulses (2.5 min/treatment), at a SW frequency of ~3 Hz. The antibiotic treatment consisted of 30 mL × 3 days intramuscular injection (IM) of Gentaject 50 Veterinary (Phibro, Israel), or intramammary infusion (IMM) of Ubrolexin (Boehringer Ingelheim Animal Health Ltd., Berkshire, UK), both acting against a wide range of Gram-positive and Gram-negative bacteria. The APT treatment was performed by the local farm teams.

2.3. Recovery from Inflammation

Recovery from inflammation was defined as a decrease in SCC to <250 × 103 cells/mL in at least two of the three monthly milk recordings after treatment.

2.4. Statistical Analyses

Statistical analysis was performed separately for subclinical APT vs. NT groups, and clinical APT vs. AB groups. To normalize the SCC, data were converted to log10: LSCC = log10 (SCC × 103). Recovery data were tested by multivariable model designed with a logistic model statement using the GLIMMIX procedure of SAS (version 9.2, SAS Institute, Cary, NC, USA), with recovery result as the dependent variable.
Percent recovery = intercept + Herd + Lactation number + Group + DIM + error, where: % recovery = ln P/(1 − P); P = probability of recovery; Herd = 4 or 7 commercial dairy herds; Lactation number = first, second, third, and more lactations; Group = APT or control (NT or AB) groups. All variables were considered as fixed effects except for DIM, which was considered a continuous effect. To compare levels within a variable, Bonferroni adjustment was run for multiple comparisons. Data are presented as means and SEM. Probability values ≤0.05 were considered significant, whereas 0.05 < P ≤ 0.10 was considered a tendency.

2.4.1. Subclinical Mastitis

(i)
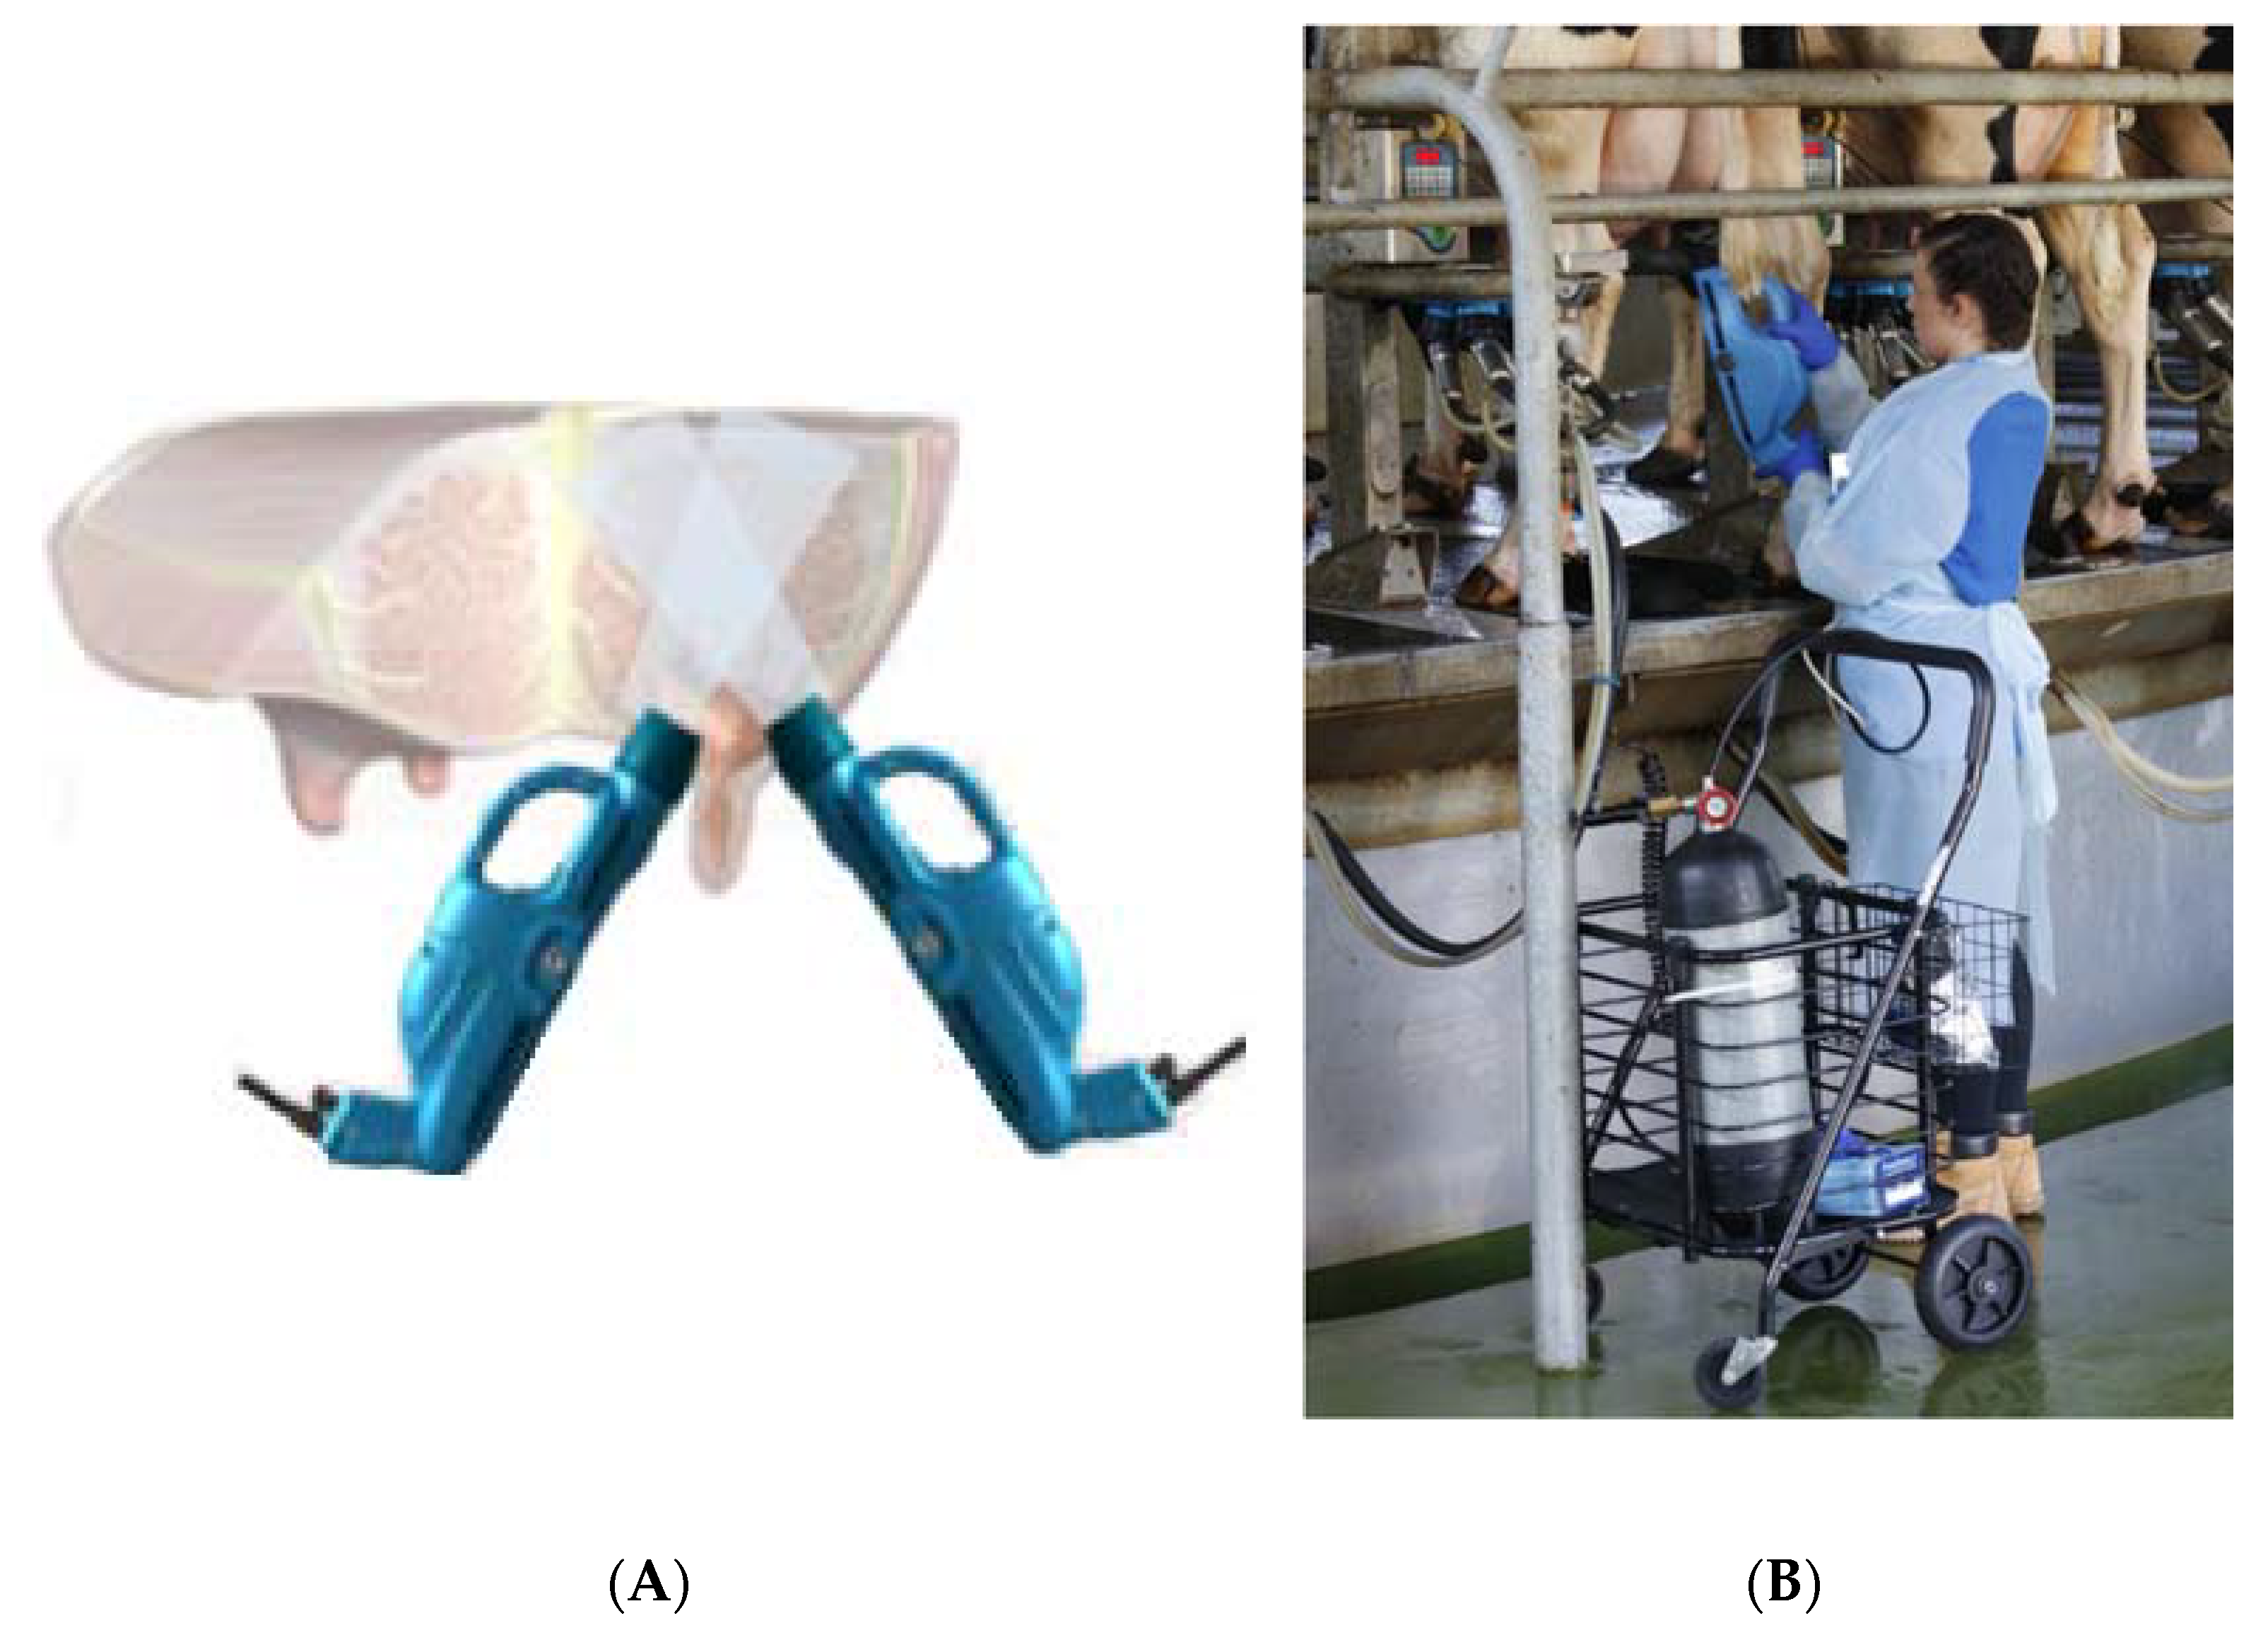
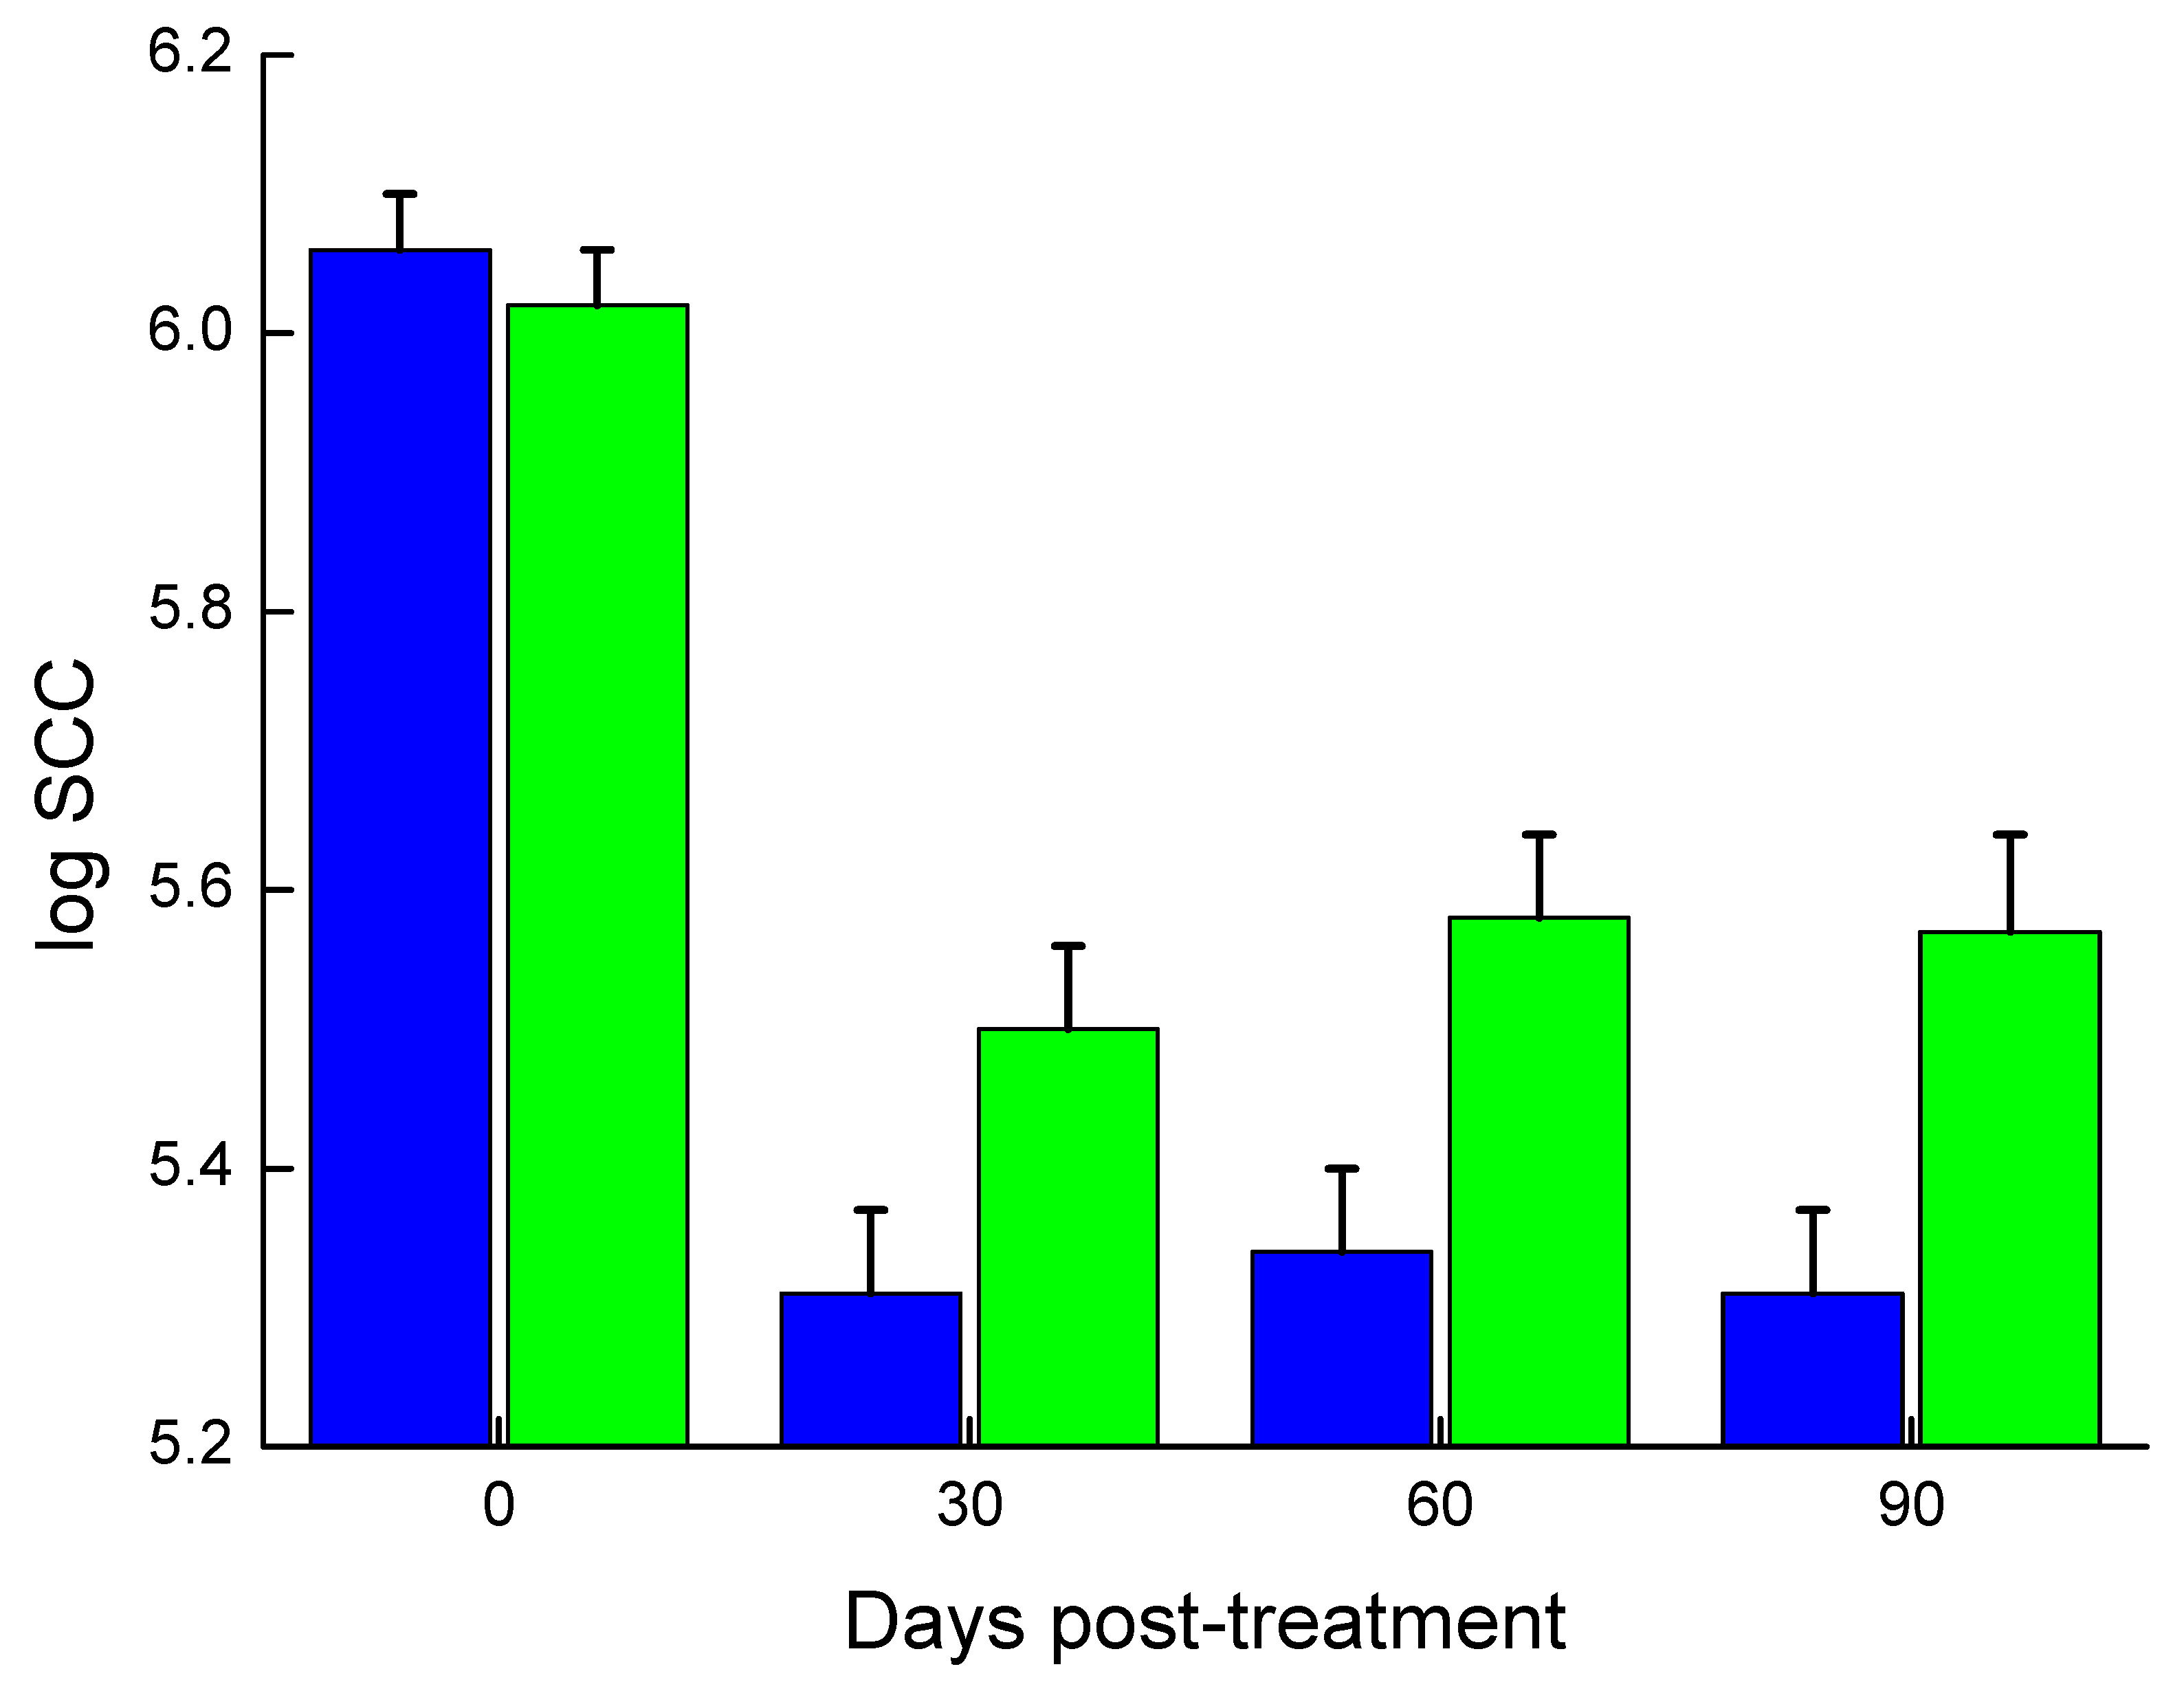
Log SCC was analyzed from the data of the milk recording days (0, 30, 60, and 90 days after subclinical mastitis diagnosis) by PROC MIXED procedure of SAS with the general form: log SCC = Intercept + Herd + Lactation number + Group + Time + Group × Time + error, where: Herd = 4 dairy farms; Lactation number = 1, 2, 3, or more; Group = 2 experimental groups (APT vs. NT); Time = 4 different time points.
(ii)
Daily MY was tested throughout the study period (90 days) by PROC MIXED procedure of SAS with the general form: Daily MY = Intercept + Herd + Lactation number + Group + Day from treatment + Group × Day from treatment + error, where: Herd = 4 dairy farms; Lactation number = 1, 2, 3 or more lactations; Group = 2 experimental groups (APT vs. NT). All variables were considered as fixed effects except for days from treatment, which was considered a continuous effect.
(iii)
Because subclinical mastitis was diagnosed at different times during the lactation and because of the strong effect of DIM on milk level, another test was performed to check the effect of time of infection on MY. This analysis included period of mastitis: 0–50 days, 51–120 days, 121–220 days. The statistical model was produced by PROC MIXED procedure of SAS with the general form: Daily MY = Intercept + Herd + Lactation number + Group + Day from treatment + Period + Group × Day from treatment + Group × Period + error, where: Herd = 4 dairy farms; Lactation number = 1, 2, 3, or more lactations; Group = 2 experimental groups (APT vs. NT); Period = the 3 periods of mastitis. All variables were considered fixed effects except for days from treatment which was considered a continuous effect.

2.4.2. Clinical Mastitis

(i)
Chi-square test was used for univariate examination of the association between recovered vs. non-recovered cows and type of bacteria causing the mastitis.
(ii)
Milk yield of the clinical mastitis group was total milk produced by the APT or AB cows at different time points during the study (0, 30, 60, and 90 days). At each time point, the sum of MY by all cows in the group was calculated and the percentage of change from time 0 was calculated. The statistical model tested the difference in milk % compared to time 0 (which was considered as 100%) at every time point in each experimental group. For the statistical analysis, we used the PROC MIXED procedure of SAS with the general form: % of milk produced in each group = Intercept + Herd + Lactation number + Group + Time + Group × Time + error, where: Herd = 7 dairy farms; Lactation number = 1, 2, 3 or more lactations; Group = 2 experimental groups (APT vs. AB); Time = 4 different time points.

3. Results

3.1. Cows with Subclinical Mastitis

Cows with subclinical mastitis were paired and divided (n = 59 × 2) for APT or NT such that there were no significant differences between the groups in lactation number, DIM, MY, or log SCC on the day of treatment (0) (Table 1).
In the 90 days after treatment, in the control (NT) group, three cows (5.1%) were culled due to mastitis events and in addition, the inflamed glands of four cows (6.8%) were dried off. In contrast, all cows treated by APT remained in the herds and none had their glands dried off.

3.1.1. Recovery from Mastitis

In the APT group, 65.5% of the cows recovered compared to 35.6% in the NT group (P < 0.001). The log SCC levels after treatment are summarized in Figure 2. The tendency (group × time interaction) of log SCC for all 59 APT-treated cows (recovered or not) was lower (P < 0.01) than that of the NT group, which remained in the herd but without dried-off glands (52/59). The difference in log SCC was higher as time from treatment progressed (Figure 2).

3.1.2. Milk Yield

The daily milk yield of the two groups was not significantly different at time 0 (Table 1). The changes in the average of individual MY for APT vs. NT cows from treatment to 90 days post-treatment are summarized in Figure 3. The trend line for MY was found to be significantly higher (P < 0.024) in the APT group, with an average of 4–7% more milk. To calculate the difference in the volume of milk streamed into the bulk milk tank over 90 days, the sum of the daily MYs was examined. This calculation took in account the daily MYs of all 59 cows in each group. When a cow was culled, its contribution was 0 until the end of the study. No difference was recorded on day 0 between APT and NT groups (2483 vs. 2546 L, respectively). During the 90 days post-treatment, the APT group yielded 2.74 L/cow per day more milk than the NT group. For the 90 days post-treatment, the APT group yielded 14,549 L more milk than the NT group.
The effect of the period in which the cows were infected was tested. Three subgroups were established: (1) from parturition to 50 days postpartum, APT (n = 16) vs. NT (n = 24); (2) between 51 and 120 days postpartum, APT (n = 23) vs. NT (n = 13); (3) between 121 and 220 days postpartum, APT (n = 16) vs. NT (n = 18). No differences were found in lactation number or DIM between the two subgroups in any of the three periods. The differences in average MY at time 0 for APT and NT subgroups for period 1—44.8 vs. 44.53 L; period 2—42.63 vs. 40.45 L; period 3—38.74 vs. 39.7 L were not significant. Due to the variation in MY among the cows, the yield at time 0 was calculated as 100% and thereafter as the difference from day 0. From treatment and up to 60 days after treatment, MY of the APT cows during period 1 (DIM < 50) increased by an average of 7.6% in comparison to the NT cows which, on average, maintained a stable milk level (Figure 4A). In period 2 (DIM 51–120), MY of the APT cows was higher compared to the NT cows by 8.9% (Figure 4B). In period 3, the difference was negligible (Figure 4C).
To calculate the difference in MY between the treatments, the percent difference in each period was transformed into liters of milk/day. Two assumptions were made: average MY (L/day) was 50, 40, 30 for periods 1, 2, and 3, respectively and lactation persisted for 305 days. The expected difference in MY between APT and NT for each period, and the mean over periods, are summarized in Table 2. The largest difference in MY was for cows infected in early lactation, which actually represents an average of 956 L milk between APT and NT cows. During period 2, the difference was ~700 L. The major difference was due to a sharp decrease in the MY of the NT cows. These results indicate that if cows were infected in early or mid-lactation and were not treated with APT, the expected average milk loss for the 305 days in lactation would be ~550 L per cow.

3.2. Cows with Clinical Mastitis

The cows with clinical mastitis were divided by the farmer at time of inflammation appearance with close supervision of the researcher, to balance the groups in terms of lactation number, DIM, and MY. Overall, 59 cows were treated by APT and 59 cows by AB. No significant differences were found in lactation number, DIM, MY, or log SCC on the day of treatment (Table 3).
During the 90 days after treatment in the APT group, four cows (8.5%) were culled due to mastitis and in one cow (1.7%), the inflamed gland was dried off. At the same time, in the AB group, 19 cows (32.2%) were culled and in one cow (1.7%), the inflamed gland was dried off.

3.2.1. Recovery

Recovery based on SCC of the APT group was 67.8% compared to 35.6% of the AB group, significant at P < 0.001. Forty-six cows in the APT treated group and 49 cows in the antibiotic treated group were sampled for bacteriology. Cows infected with Streptococcus dysgalactiae, Strep. uberis, and other streptococci were grouped together in one group, Escherichia coli was separated in another group and Pseudomonas spp., Corynebacterium, coagulase-negative staphylococci grouped as other (Table 4). Of the E. coli-infected cows, 85.7% treated with APT were recovered vs. 17.6% of the AB-treated group, in cows with streptococci infection, 66.0% were cured vs. 44.4% in the AB-treated group, and in the other group, 100% of the APT treated cows vs. 57.1% of the AB-treated cows were recovered (no follow-up cultures were taken; Table 4). Overall, of the cows sampled, 37/46 (80.5%) that were treated with APT recovered compared to 19/49 (38.7%) that were treated with antibiotics (P < 0.0001).

3.2.2. Milk Yield

Due to the high number of culled cows in the days and weeks after treatment, the summed milk volume milked into the bulk tank during the 90 days was examined. On day 0, the total milk of the APT group sent to the bulk tank was lower, 2140 L vs. 2485 L for the AB group. The three measurement points—30, 60, and 90 days—were calculated as percentage of day 0 (100%). An up to 3% increase in total milk in the bulk tank was recorded up to 60 days for the APT group compared to a significant decrease (P < 0.001) for the AB group (Figure 5). During the 90 days post-treatment, the APT group yielded 3.9 L/cow per day more milk than the AB group. Overall, the APT group of 59 cows yielded 20,709 L more milk than the AB-treated group.

4. Discussion

Decades of progress in dairy cow genetics, in parallel with intensive management mechanization and nutritional changes, have led to increased milk production and milk solids. However, the focus on maximizing milk production has damaged the overall longevity and life efficiency of the herd. In this respect, percent culling of cows and replacement by first-calving heifers, both planned and forced, is high, and the causes of premature culling and increased numbers of replacement heifers are on the rise. Planned voluntary cow replacement in the herd is important for maintaining a healthy and profitable operation, including the sale of old cows, those with low milk production, etc., and determines the number of calves raised for replacement. Forced (involuntary) culling, on the other hand, due to death, infertility, and disease, reduces the number of cows that are planned for culling or increases the number of calves that need to be raised. Studies calculating the longevity of cows, herd economics, and the reasons for culling [25,26,27] have shown that at least 50% of all culls are primarily declared as health-related, with mastitis carrying the most direct culling risk [28]. However, the reasons for culling decisions can be, for example, low milk production, with previous mastitis being a potential cause of this low production. The retention payoff of mastitic cows decreases and therefore, cow longevity is also reduced [29,30].
Mastitis is still primarily responsible for significant economic losses to the dairy industry worldwide [31]. The stage and involved cost of the mastitis can be divided into (see Blum et al. [17] for E. coli): (1) initiation and establishment of the infection and consequent inflammation involving direct costs of labor, drugs, and discarded milk; (2) the healing process of the infection with clearing of the pathogen or a shift to chronic mastitis. The major cause of lower MY and quality is damage to gland areas that result in almost no milk production, while at the same time, signaling inflammation with increased SCC, among other factors, involved in mastitis [17]. All of these ultimately lower income due to decreased milk production and lower price paid for lower milk quality. In both stages, as was found in this study, using antibiotic treatment, or no treatment on a high number of cows leads to unprofitable cows for the farmer and therefore, involuntarily culling, despite the fact that in some glands the bacteria are cleared (cured).
In the current study, the number of untreated cows culled due to subclinical mastitis infection was 5%, and that of the clinically infected cows that were treated with AB was 32.4%. The spontaneous recovery in the NT group was ~35%, similar to the recovery when cows were treated with antibiotics, compared to ~65% that recovered after the APT treatment. As a result, there is a higher probability of more cows being culled due to the inflammation, above the number already culled within the timeframe of this study, owing to persistence of that inflammation. The AB treatment included two products, IM injection of Gentaject or IMM of Ubrolexin, for mainly streptococci and E. coli. Since no bacteriological samples were taken after treatment, calculation of cure (elimination of the bacteria) was not possible. However, low recovery and culling indicated that in most cows, this treatment actually did not result in full recovery. In comparison, in the APT-treated group, no cow with subclinical infection was culled, while only 6.8% of those with clinical infection were culled. The recovery of cows with subclinical and clinical mastitis was 65.5% and 67.8%, respectively, with lowered SCC and higher MY, resulting in a profitable cow in the herd. Based on the current and previous studies [22], and on our knowledge of the influence of mechanotransduction of SW on local homeostasis and positive regulation of cell vitality—promoting tissue self-healing capabilities and anti-inflammatory (cytokine secretion) [4] as well as immunomodulatory effects [9,10,11], we can assume that the SWs trigger and help in self-healing, including possible clearance of the bacteria (although this was not tested). Additional studies should be performed to prove possible clearance of the bacteria. A growing awareness by consumers, animal welfare debates, and the spread of antimicrobial-resistant bacteria (AMR) are influencing the decision-making progress of reducing antibiotics used in livestock production [32,33]. Therefore, any mastitis treatment should be evidence-based to encourage the judicious use of antibiotics and its proper use [34].
Milk loss due to mastitis can be short-lived or permanent and can be measured in the individual cow and or in the bulk milk tank. During the infection, a cow’s MY can decrease for a certain amount of time and then increase, increase to lower levels, or remain low compared to the level before the infection. In contrast, at the bulk tank level, the decrease is not only due to the individual influence, but also, and mainly, to cow culling. The effect of culling cows was seen mainly in the clinical cases with 30–40% of evident milk loss. The individual MY trend was shown in the subclinically infected cows treated with APT. During period 1, milk production increased, reaching a peak at 3–6 weeks. The increase in production was probably due to continuation of the lactogenesis period and healing of the tissue and lobuloalveoli. During period 2, the milk production leveled off, in comparison to a sharp decrease in the NT cows, suggesting healing, which results in longer persistence. Comparing milk production of subclinical mastitic cows after APT treatment vs. NT showed: an average increase of 7.6% vs. maintained milk level in period 1, a slight increase and then maintained milk level vs. reduction of 6.7% in period 2, and negligible differences in period 3. Thus, the expected average milk gain for 305 days of lactation from the APT treatment is ~550 L.
A calculation based on 100 cows with mastitis, 70% subclinical and 30% clinical, was performed to show the number of replacement heifers needed to maintain the overall level of milk production. Accordingly, for subclinically inflamed cows of the NT group, five or six cows will need to be introduced every 100 days, and another 19 for clinical mastitis treated with AB, resulting in ~25 new heifers overall. In contrast, only six new heifers are needed when APT is the preferred treatment. Thus, in the Israeli dairy herd of 120,000 cows/year, about 20% of the cows/year are infected with subclinical inflammation (SCC of 500–1000 × 103 cells/mL) and an additional 20% have clinical inflammation (SCC > 1000 × 103 cells/mL) (unpublished data), totaling 48,000 cows/year. Consequently, if the APT treatment is introduced for the entire Israeli dairy herd, only 2880 (6 × 480) cows will be involuntarily culled, compared to 12,000 (25 × 480) cows that are not treated or treated with AB.

Author Contributions

G.L.: Conceptualization, Data curation, Investigation, Methodology, Validation, Visualization, Writing—original draft, Writing—review & editing; E.P.: Writing—review & editing, Supervision; D.G.: Project administration, Resources, Supervision, Writing—review & editing; D.H.: Data curation, Investigation, Resources; O.A.: Data curation, Investigation, Resources; A.Z.: Data curation, Investigation, Resources; Y.L.: Data curation, Formal analysis, Methodology, Writing—review & editing. All authors have read and agreed to the published version of the manuscript.

Funding

This research received no external funding.

Institutional Review Board Statement

All methods were carried out in accordance with the relevant guidelines and regulations, and all treatment protocols were approved by the Institutional Animal Care Committee of the Agricultural Research Organization, the government-sanctioned body for such authorizations in Israel (IL 787/18).

Informed Consent Statement

Not applicable.

Data Availability Statement

All the raw data regarding this work are available from G. Leitner.

Acknowledgments

The authors are grateful to the teams of the dairy herds for allowing conductance of the study and for their technical assistance and care of the animals.

Conflicts of Interest

The authors declare no conflict of interest.

References

  1. Huang, C.; Holfeld, J.; Schaden, W.; Orgill, D.; Ogawa, R. Mechanotherapy: Revisiting physical therapy and recruiting mechanobiology for a new era in medicine. Trends Mol. Med. 2013, 19, 555–564. [Google Scholar] [CrossRef]
  2. Rohringer, S.; Holnthoner, W.; Hackl, M.; Weihs, A.M.; Rünzler, D.; Skalicky, S.; Karbiener, M.; Scheideler, M.; Pröll, J.; Gabriel, C.; et al. Molecular and cellular effects of in vitro shockwave treatment on lymphatic endothelial cells. PLoS ONE 2014, 9, e114806. [Google Scholar] [CrossRef]
  3. d’Agostino, M.C.; Craig, K.; Tibalt, E.; Respizzi, S. Shock wave as biological therapeutic tool: From mechanical stimulation to recovery and healing, through mechanotransduction. Int. J. Surg. 2015, 24, 147–153. [Google Scholar] [CrossRef] [PubMed]
  4. de Girolamo, L.; Stanco, D.; Galliera, E.; Vigano, M.; Lovati, A.B.; Marazzi, M.G.; Romeo, P.; Sansone, V. Soft-focused extracorporeal shock waves increase the expression of tendon-specific markers and the release of anti-inflammatory cytokines in an adherent culture model of primary human tendon cells. Ultrasound Med. Biol. 2014, 40, 1204–1215. [Google Scholar] [CrossRef]
  5. Ito, K.; Fukumoto, Y.; Shimokawa, H. Extracorporeal shock wave therapy for ischemic cardiovascular disorders. Am. J. Cardiovasc. Drugs 2011, 11, 295–302. [Google Scholar] [CrossRef] [PubMed]
  6. Holfeld, J.; Tepeköylü, C.; Blunder, S.; Lobenwein, D.; Kirchmair, E.; Dietl, M.; Kozaryn, R.; Lener, D.; Theurl, M.; Paulus, P.; et al. Low energy shock wave therapy induces angiogenesis in acute hind-limb ischemia via VEGF receptor 2 phosphorylation. PLoS ONE 2014, 9, e103982. [Google Scholar] [CrossRef]
  7. Tara, S.; Miyamoto, M.; Takagi, G.; Kirinoki-Ichikawa, S.; Tezuka, A.; Hada, T.; Takagi, I. Low-energy extracorporeal shock wave therapy improves microcirculation blood flow of ischemic limbs in patients with peripheral arterial disease: Pilot study. J. Nippon Med. Sch. 2014, 81, 19–27. [Google Scholar] [CrossRef] [Green Version]
  8. Waugh, C.; Morrissey, D.; Jones, E.; Riley, G.; Langberg, H.; Screen, H. In vivo biological response to extracorporeal shockwave therapy in human tendinopathy: Response of tendinopathy to shockwave therapy. Eur. Cells Mater. 2015, 29, 268–280. [Google Scholar] [CrossRef] [PubMed]
  9. Davis, T.A.; Stojadinovic, A.; Anam, K.; Amare, M.; Naik, S.; Peoples, G.E.; Tadaki, D.; Elster, E.A. Extracorporeal shock wave therapy suppresses the early proinflammatory immune response to a severe cutaneous burn injury. Int. Wound J. 2009, 6, 11–21. [Google Scholar] [CrossRef]
  10. Shao, P.L.; Chiu, C.C.; Yuen, C.M.; Chua, S.; Chang, L.T.; Sheu, J.J.; Sun, C.K.; Wu, C.J.; Wang, C.J.; Yip, H.K. Shock wave therapy effectively attenuates inflammation in rat carotid artery following endothelial denudation by balloon catheter. Cardiology 2010, 115, 130–144. [Google Scholar] [CrossRef]
  11. Mantovani, A.; Biswas, S.K.; Galdiero, M.R.; Sica, A.; Locati, M. Macrophage plasticity and polarization in tissue repair and remodeling. J. Pathol. 2013, 229, 176–185. [Google Scholar] [CrossRef]
  12. Yip, L.; Woehrle, T.; Corriden, R.; Hirsh, M.; Chen, Y.; Inoue, Y.; Ferrari, V.; Insel, P.A.; Junger, W.G. Autocrine regulation of T-cell activation by ATP release and P2X7 receptors. FASEB J. 2009, 23, 1685–1693. [Google Scholar] [CrossRef] [PubMed] [Green Version]
  13. Yu, T.; Junger, W.G.; Yuan, C.; Jin, A.; Zhao, Y.; Zheng, X.; Zeng, Y.; Liu, J. Shockwaves increase T-cell proliferation and IL-2 expression through ATP release, P2X7 receptors, and FAK activation. Am. J. Physiol. Cell Physiol. 2010, 298, C457–C464. [Google Scholar] [CrossRef] [PubMed] [Green Version]
  14. Porcherie, A.; Cunha, P.; Trotereau, A.; Roussel, P.; Gilbert, F.B.; Rainard, P.; Germon, P. Repertoire of Escherichia coli agonists sensed by innate immunity receptors of the bovine udder and mammary epithelial cells. Vet. Res. 2012, 43, 1–8. [Google Scholar] [CrossRef] [Green Version]
  15. Blum, S.E.; Heller, E.D.; Jacoby, S.; Krifuks, O.; Leitner, G. Comparison of the immune responses associated with experimental bovine mastitis caused by different strains of Escherichia coli. J. Dairy Res. 2017, 84, 190–197. [Google Scholar] [CrossRef] [PubMed]
  16. Oviedo-Boyso, J.; Valdez-Alarcón, J.J.; Cajero-Juárez, M.; Ochoa-Zarzosa, A.; López-Meza, J.E.; Bravo-Patino, A.; Baizabal-Aguirre, V.M. Innate immune response of bovine mammary gland to pathogenic bacteria responsible for mastitis. J. Infect. 2007, 54, 399–409. [Google Scholar] [CrossRef] [PubMed]
  17. Blum, S.E.; Heller, E.D.; Jacoby, S.; Krifuks, O.; Merin, U.; Silanikove, N.; Lavon, Y.; Leitner, G. Physiological response of mammary glands to Escherichia coli infection: A conflict between glucose need for milk production and immune response. Sci. Rep. 2020, 10, 9602. [Google Scholar] [CrossRef]
  18. Akers, R.M.; Nickerson, S.C. Mastitis and its impact on structure and function in the ruminant mammary gland. J. Mammary Gland Biol. Neoplasia 2011, 16, 275–289. [Google Scholar] [CrossRef]
  19. Leitner, G.; Merin, U.; Silanikove, N. Effects of glandular bacterial infection and stage of lactation on milk clotting parameters: Comparison among cows, goats and sheep. Int. Dairy J. 2011, 21, 279–285. [Google Scholar] [CrossRef]
  20. Leitner, G.; Blum, S.E.; Krifuks, O.; Edery, N.; Merin, U. Correlation between milk bacteriology, cytology and mammary tissue histology in cows: Cure from the pathogen or recovery from the inflammation. Pathogens 2020, 9, 364. [Google Scholar] [CrossRef]
  21. Akers, R.M. A 100-year review: Mammary development and lactation. J. Dairy Sci. 2017, 100, 10332–10352. [Google Scholar] [CrossRef]
  22. Leitner, G.; Zilberman, D.; Papirov, E.; Shefy, S. Assessment of acoustic pulse therapy (APT), a non-antibiotic treatment for dairy cows with clinical and subclinical mastitis. PLoS ONE 2018, 13, e0199195. [Google Scholar] [CrossRef] [PubMed]
  23. Afimilk. AfiFarm Herd Management Data-Acquisition System. Available online: http://www.afimilk.com (accessed on 12 June 2020).
  24. SCR. SCR Dairy Cow Monitoring and Herd Management systems. Available online: http://www.scrdairy.com (accessed on 12 June 2020).
  25. Weigel, K.A.; Palmer, R.W.; Caraviello, D.Z. Investigation of factors affecting voluntary and involuntary culling in expanding herds in Wisconsin using survival analysis. J. Dairy Sci. 2003, 86, 1482–1486. [Google Scholar] [CrossRef]
  26. De Vries, A. Cow longevity economics: The cost benefit of keeping the cow in the herd. In Proceedings of the Cow Longevity Conference, Stockholm, Sweden, 27–28 August 2013. [Google Scholar]
  27. De Vries, A. Economic trade-offs between genetic improvement and longevity in dairy cattle. J. Dairy Sci. 2017, 100, 4184–4192. [Google Scholar] [CrossRef]
  28. Beaudeau, F.; Seegers, H.; Ducrocq, V.; Fourichon, C.; Bareille, N. Effect of health disorders on culling in dairy cows: A review and critical discussion. Ann. Zootech. 2000, 49, 293–311. [Google Scholar] [CrossRef]
  29. Cha, E.; Bar, D.; Hertl, J.A.; Tauer, L.W.; Bennett, G.; González, R.N.; Schukken, Y.H.; Welcome, F.L.; Gröhn, Y.T. The cost and management of different types of clinical mastitis in dairy cows estimated by dynamic programming. J. Dairy Sci. 2011, 94, 4476–4487. [Google Scholar] [CrossRef] [Green Version]
  30. Cha, E.; Hertl, J.A.; Bar, D.; Gröhn, Y.T. The cost of different types of lameness in dairy cows calculated by dynamic programming. Prevent. Vet. Med. 2010, 97, 1–8. [Google Scholar] [CrossRef]
  31. Halasa, T.; Huijps, K.; Østerås, O.; Hogeveen, H. Economic effects of bovine mastitis and mastitis management: A review. Vet. Q. 2007, 29, 18–31. [Google Scholar] [CrossRef]
  32. Economou, V.; Gousia, P. Agriculture and food animals as a source of antimicrobial-resistant bacteria. Infect. Drug Resist. 2015, 8, 49–61. [Google Scholar] [CrossRef] [Green Version]
  33. Magouras, I.; Carmo, L.P.; Stärk, K.D.; Schüpbach-Regula, G. Antimicrobial usage and-resistance in livestock: Where should we focus? Front. Vet. Sci. 2017, 4, 148. [Google Scholar] [CrossRef] [Green Version]
  34. Pyörälä, S. Treatment of mastitis during lactation. Ir. Vet. J. 2009, 62, S40–S44. [Google Scholar] [CrossRef] [Green Version]
Figure 1. (A): A schematic diagram of the APT X, an acoustic pulse technology (APT) hand-held device (Armenta Ltd. Ra’anana, Israel) showing the target-projectiles of the shock waves when treating the cow’s udder tissues. (B): Acoustic Pulse Technology (APT)—X device in use at the milking parlor.
Dairy 02 00022 g001
Figure 2. Average log SCC and SE at treatment (time 0) and 30, 60, and 90 days thereafter of cows with subclinical mastitis according to acoustic pulse technology (APT) treatment (n = 59; ) or no-treatment (NT) control (n = 52; ). The trend line (group × time interaction) of log SCC was significantly lower (P < 0.01) for the APT vs. NT group.
Dairy 02 00022 g002
Figure 3. Average of individual daily milk yield (MY) of cows with subclinical mastitis under acoustic pulse technology (APT) treatment (n = 59; Dairy 02 00022 i001) or no treatment (NT) as a control (n = 59; Dairy 02 00022 i002
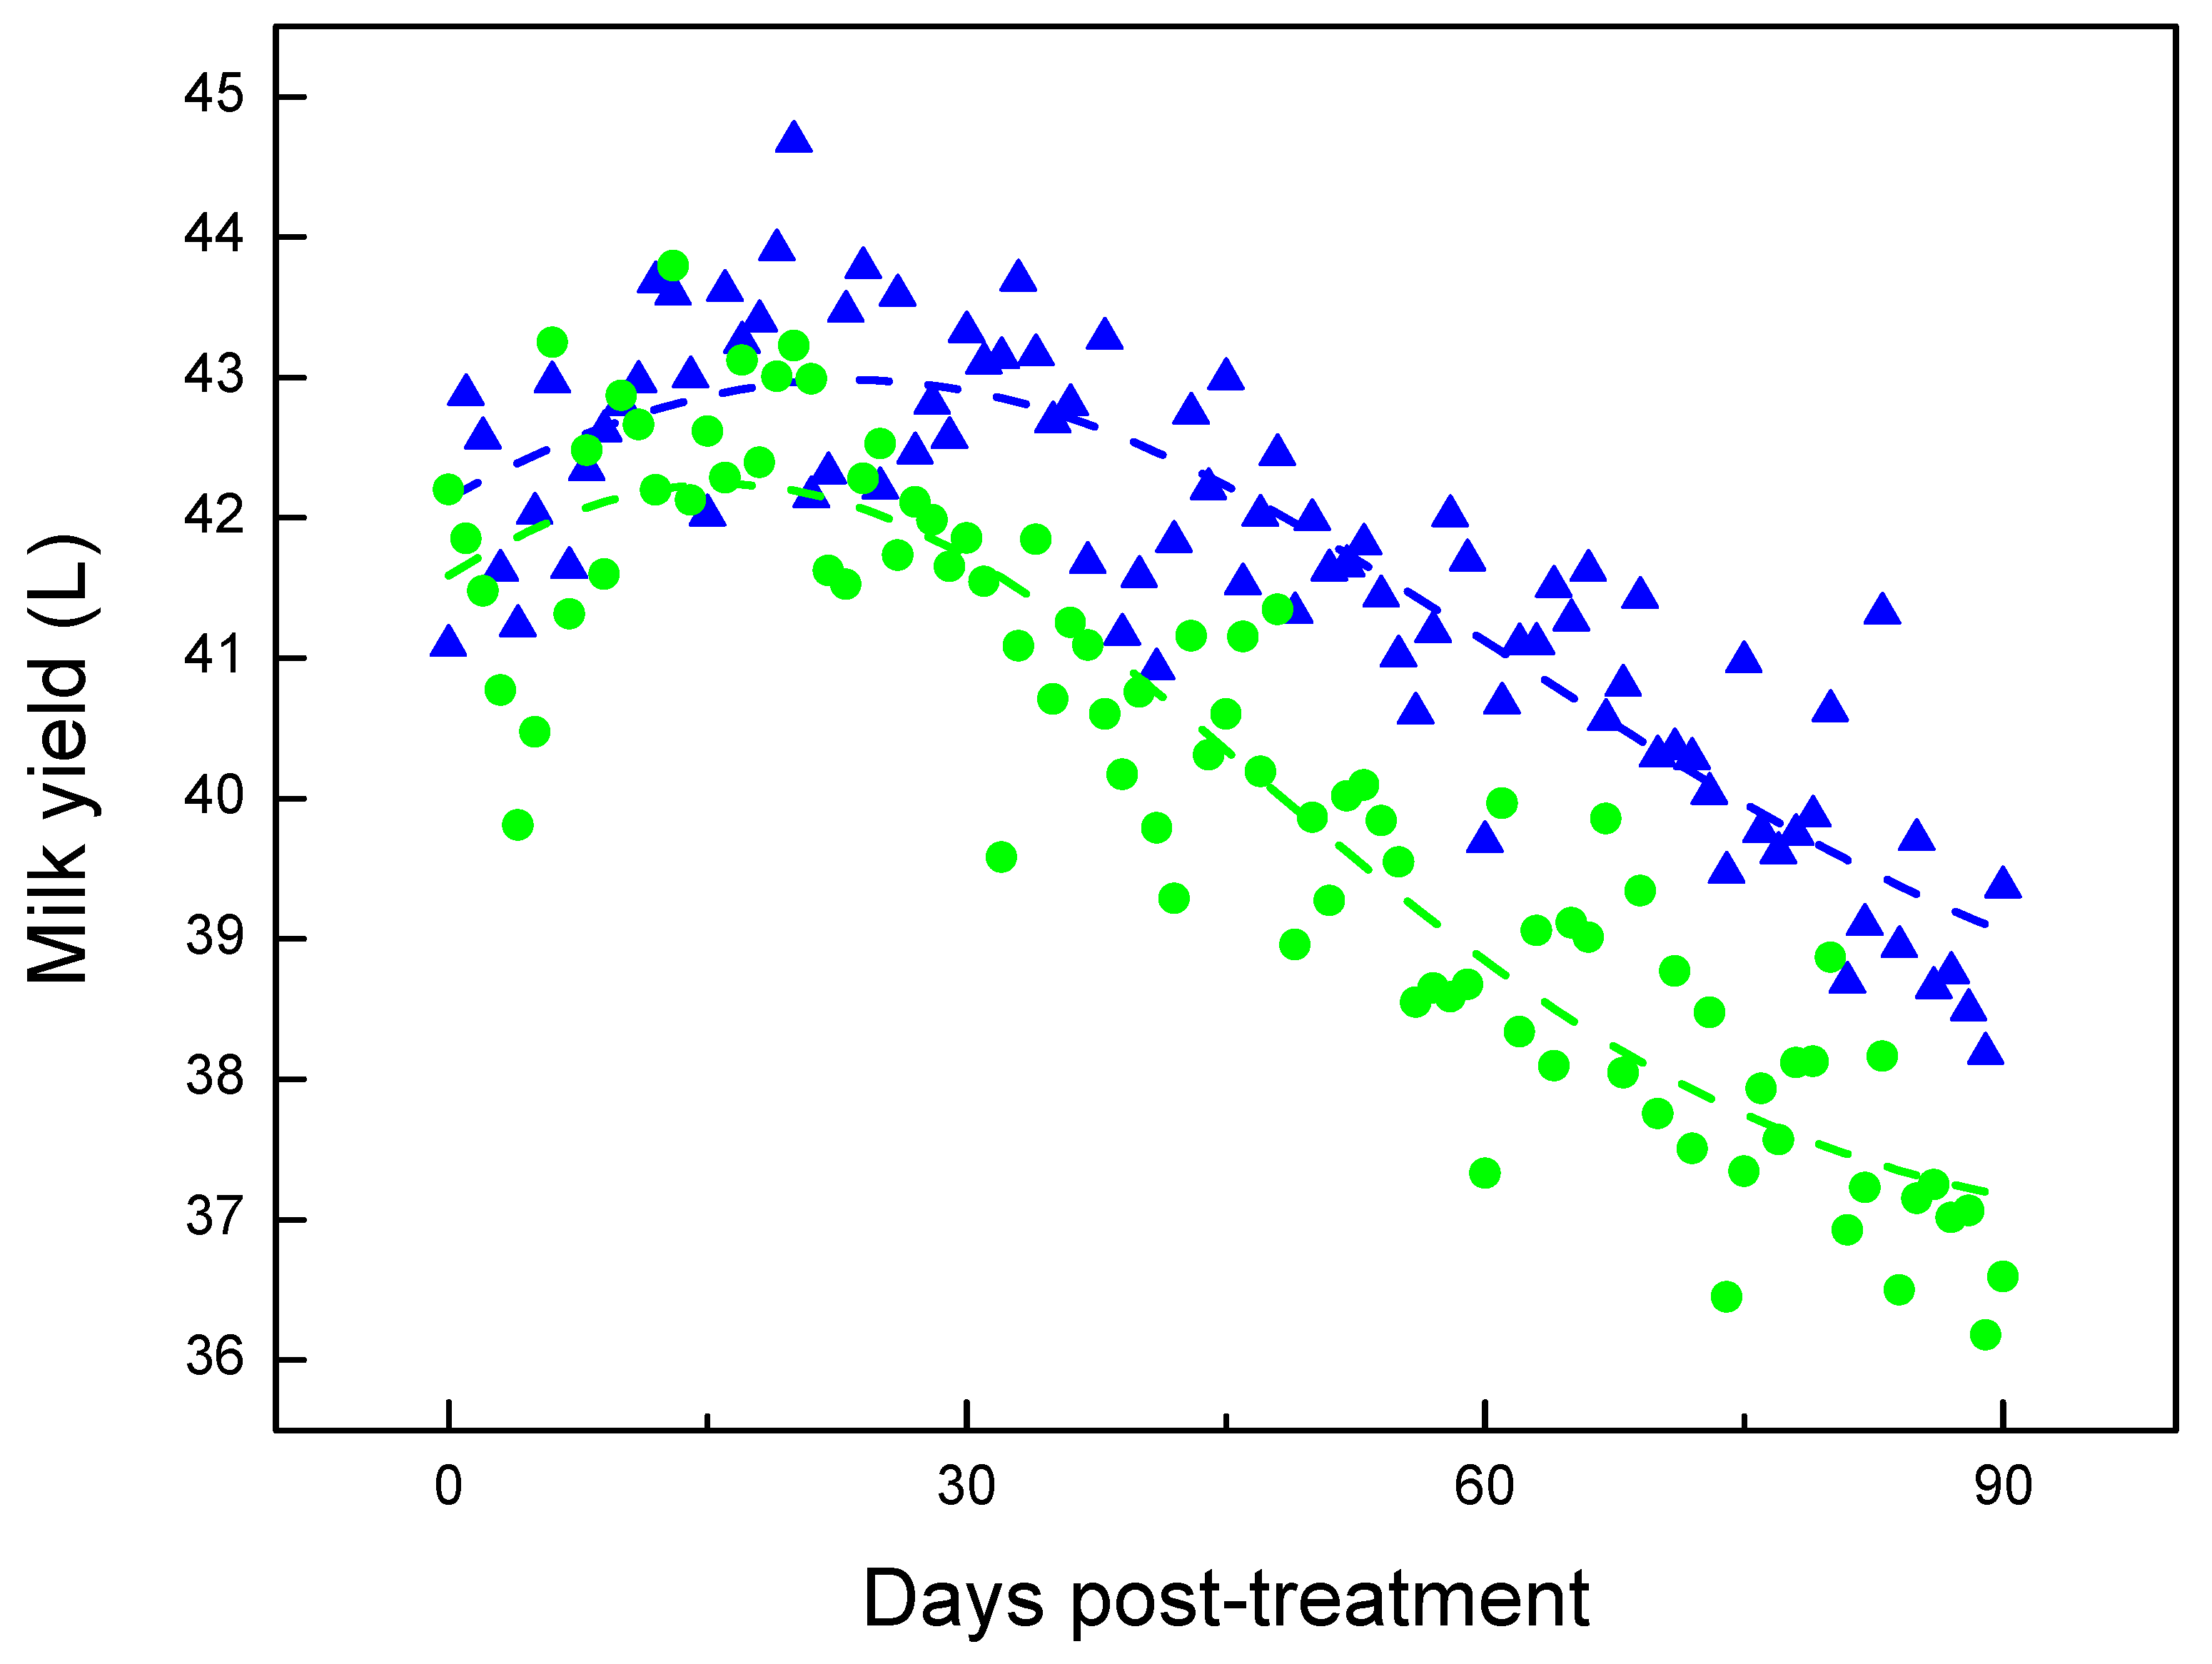
). The trend line for MY was significantly higher (P < 0.024) in the APT vs. NT group.
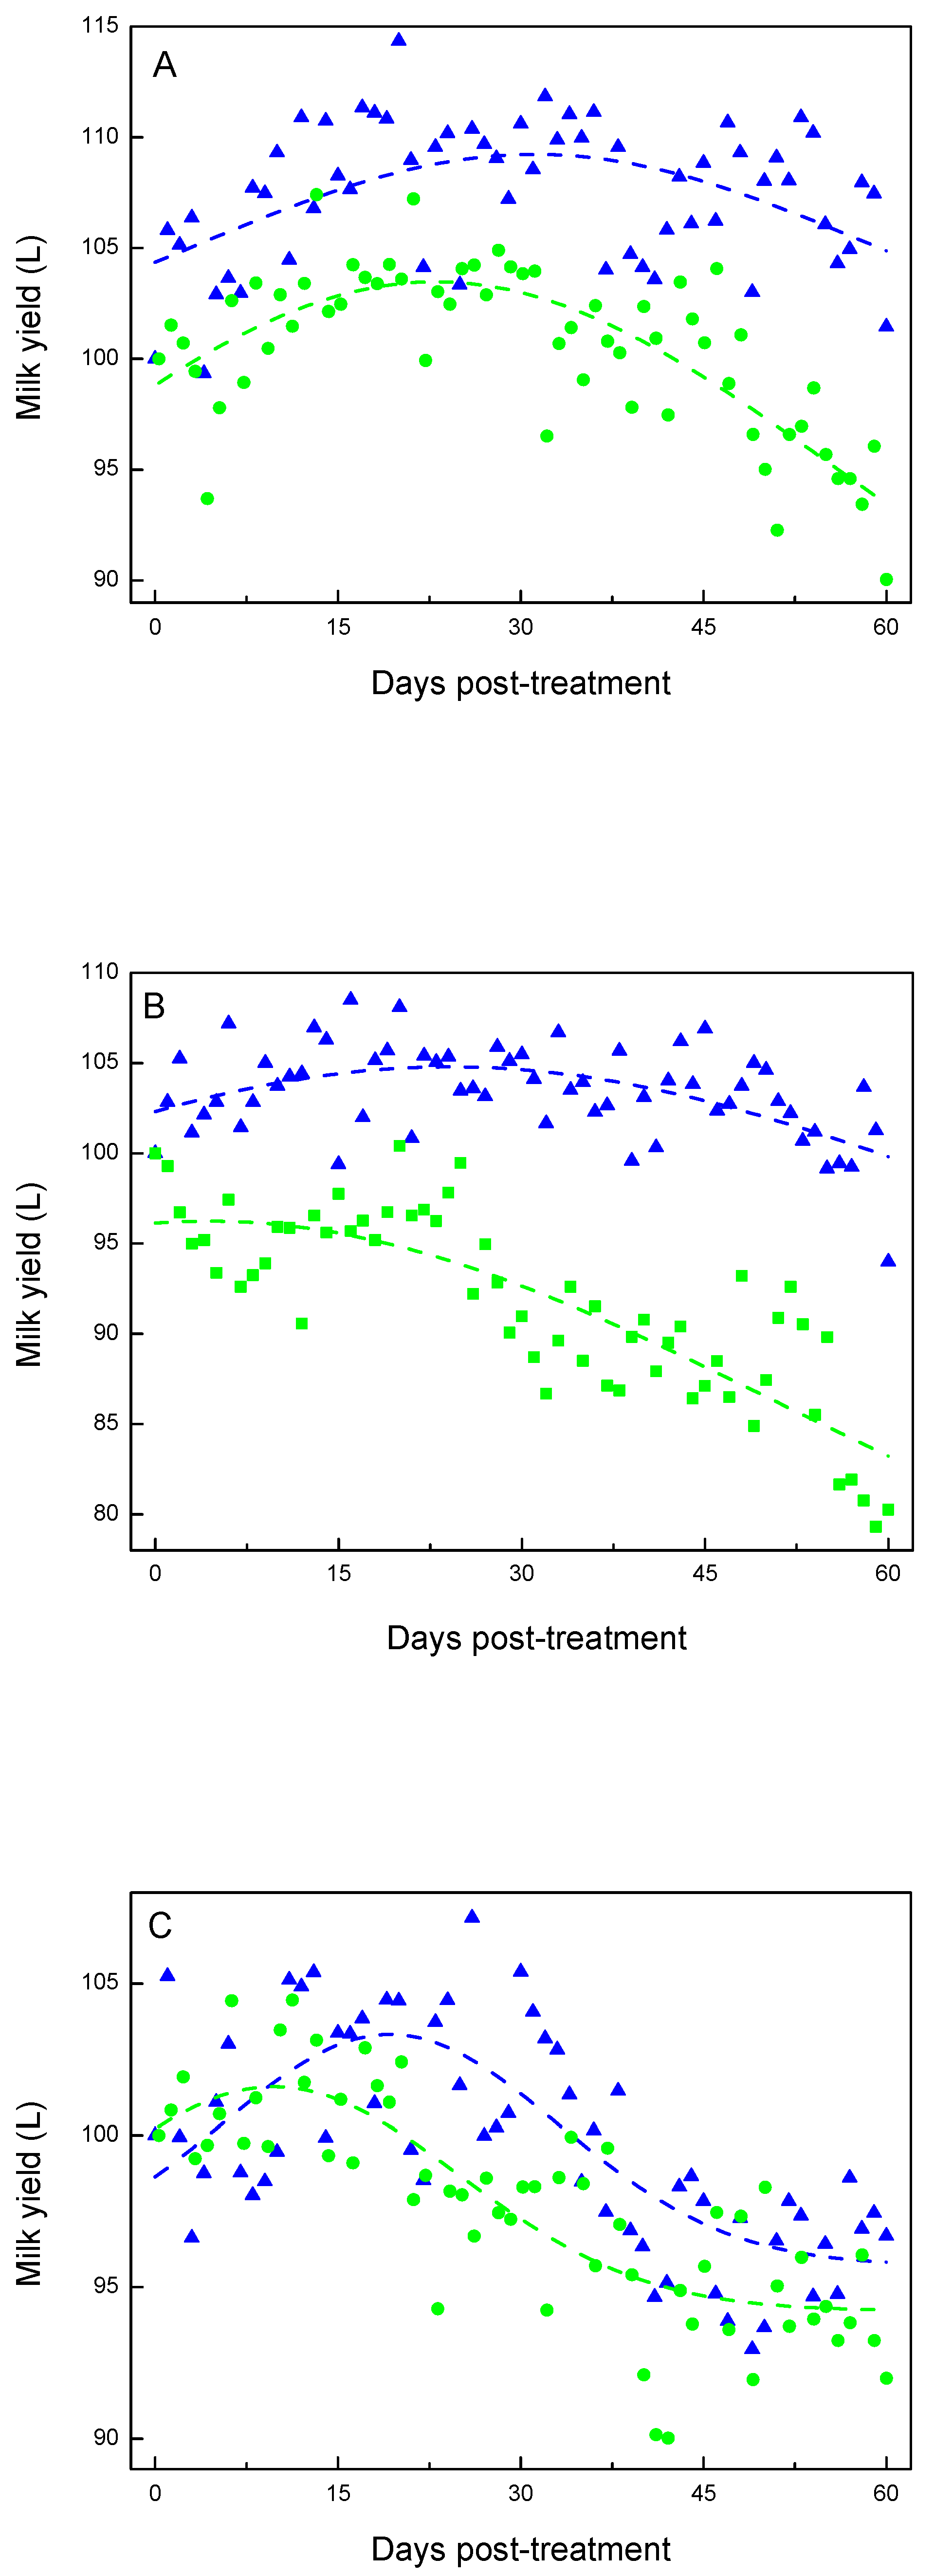
Dairy 02 00022 g003
Figure 4. Average individual daily milk yield relative to day of treatment (time 0; calculated as 100%) in cows with subclinical mastitis and treated by acoustic pulse technology (APT; Dairy 02 00022 i001) or not treated (NT; Dairy 02 00022 i002) during different periods of lactation. (A) Period 1—from parturition to 50 days postpartum, APT (n = 16) vs. NT (n = 24). (B) Period 2—51–120 days postpartum, APT (n = 23) vs. NT (n = 13). (C) Period 3—121–220 days postpartum, APT (n = 16) vs. NT (n = 18).
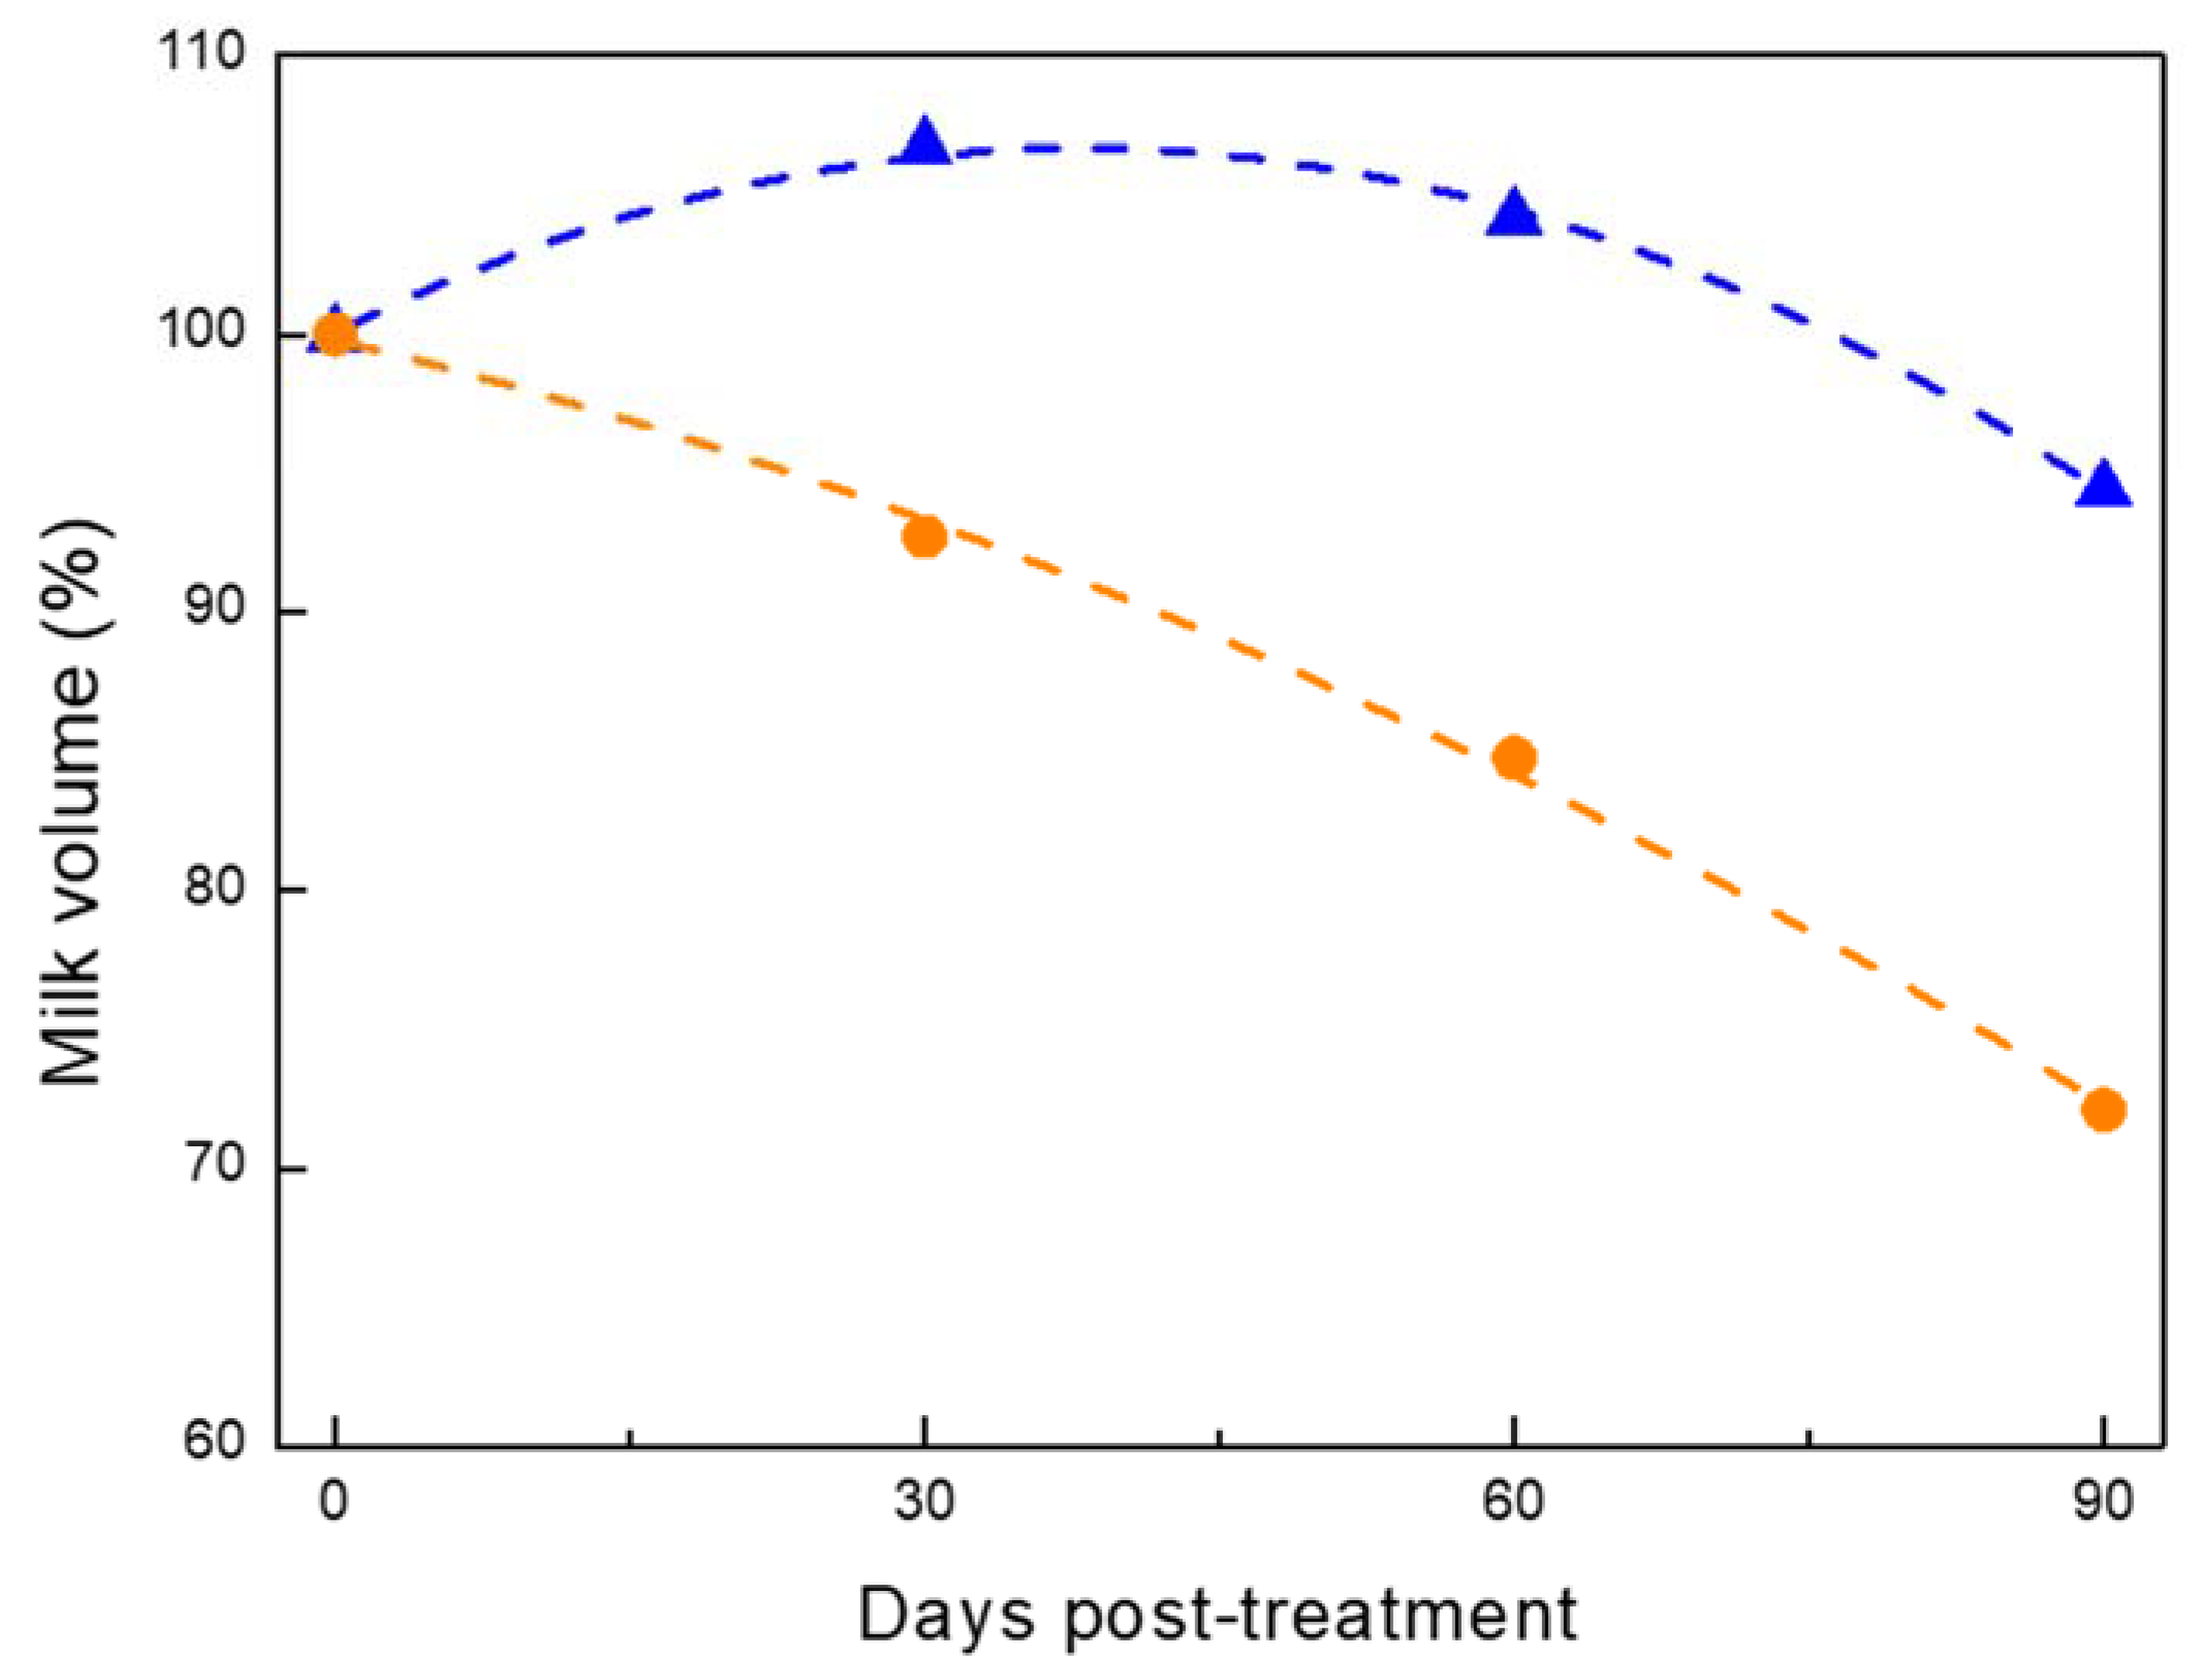
Dairy 02 00022 g004
Figure 5. Changes in summed milk volume milked into the bulk tank at treatment (time 0; 100%) and 30, 60, and 90 days post-treatment of cows with clinical mastitis treated with acoustic pulse technology (APT; Dairy 02 00022 i001) vs. antibiotics (AB; Dairy 02 00022 i003).
Dairy 02 00022 g005
Table 1. Lactation number, days in milk, milk yield, and SCC at time of treatment (day 0) for subclinically infected cows treated by acoustic pulse technology (APT) (n = 59) or no-treatment (NT) controls (n = 59). Values are averages and SE.
Group APTNTP [F]
Lactation 2.18 ± 0.102.20 ± 0.110.91
Days in milk 103.1 ± 10.5099.4 ± 10.700.81
Milk yield (L/day)41 ± 91.1742.6 ± 1.180.69
log SCC6.06 ± 0.046.02 ± 0.040.50
Table 2. Expected milk yield (MY) for 305 days in lactation under acoustic pulse technology (APT) treatment vs. no-treatment (NT) control in periods 1, 2, and 3, assuming MY of 50, 40, and 30 L/day, respectively.
Period APT vs. Control (%)Assumed MY (L/Day)Difference in MY (L/Day) (APT vs. NT)Day from Treatment to 305 DaysTotal Milk (L) (APT vs. NT)
1 (up to 50 days) 7.65503.83250956.3
2 (51–120 days)8.90403.56200712.0
3 (121–220 days)−0.1630−0.04150−7.2
Total5.46402.45200553.7
Table 3. Lactation number, days in milk, milk yield, and SCC at time of treatment (day 0) for clinically infected cows treated by acoustic pulse technology (APT) (n = 59) or antibiotics (AB) (n = 59). Values are averages and SE.
GroupAPTABP [F]
Lactation2.26 ± 0.182.47 ± 0.100.08
Days in milk126.0 ± 11.30113.5 ± 11.600.46
Milk yield (L/day)38.1 ± 1.1441.6 ± 1.600.13
log SCC6.62 ± 0.036.52 ± 0.040.41
Table 4. Recovery of cows identified as having clinical mastitis and treated with acoustic pulse technology (APT) or antibiotics (AB) according to bacteriological analysis.
GroupBacteriaAPTABP [F]
Total tested 46/59 (78.0%)49/59 (83.1%)NS
RecoveredE. coli18/21 (85.7%)3/17 (17.6%)<0.001
Streptococci12/18 (66.0%)8/18 (44.4%)0.02
Other 17/7 (100%)8/14 (57.1%)0.01
Total recovery 27/46 (80.5%)19/49 (38.7%)<0.001
1 Pseudomonas spp., Corynebacterium, coagulase-negative staphylococci.
Publisher’s Note: MDPI stays neutral with regard to jurisdictional claims in published maps and institutional affiliations.

