Article

Microfiltration and Ultrafiltration Process to Produce Micellar Casein and Milk Protein Concentrates with 80% Crude Protein Content: Partitioning of Various Protein Fractions and Constituents

by
Prafulla Salunke
1,
Chenchaiah Marella
1,2 and
Lloyd E. Metzger
1,3,*
1
Midwest Dairy Foods Research Center, Department of Food and Dairy Science, South Dakota State University, Brookings, SD 57007, USA
2
Idaho Milk Products, Jerome, ID 83338, USA
3
Valley Queen Cheese, Milbank, SD 57252, USA
*
Author to whom correspondence should be addressed.
Submission received: 15 March 2021 / Revised: 27 June 2021 / Accepted: 3 July 2021 / Published: 19 July 2021
(This article belongs to the Section Milk Processing)

Abstract

:
The objective of the study reported in this research paper was to produce micellar casein concentrate (MCC) and milk protein concentrate (MPC) with 80% crude protein relative to total solids (TS) using MF and UF processes respectively. Additionally, capillary gel electrophoresis (CGE) was used to study the protein fractions in retentate and permeate. For MCC production, 227 L of pasteurized SM was subjected to MF using 0.5-micron spiral wound polyvinylidene fluoride membrane. During the process, diafiltration (DF) water was added at six intervals, totaling 100% of the feed volume. For MPC production, 227 L of pasteurized SM from the same lot was subjected to UF using 10 kDa Polyethersulfone membranes. During the process, DF water was added at four different intervals, with a final total addition of 40% of the feed volume. Both processes used a volume reduction of five. There were significant (p < 0.05) differences in all of the compositional parameters, except fat and casein for the MF retentate (MFR) and UF retentate (UFR). UFR had a higher crude protein (CP), TS, lactose, ash and calcium content as compared to MFR and this affected the CP/TS ratio found in both the retentates. The differences in membrane pore sizes, operating pressures and level of DF used all contributed to the differences in final CP/TS ratio obtained. The CGE analysis of individual protein fractions present in the UFR and MFR showed that UFR has a β-lactaglobulin to α-lactalbumin (α-LA) ratio similar to SM, whereas the MFR has a higher ratio, indicating preferential transmission for α-LA by the MF membrane. The results from this study show that MF and UF processes could be used for production of MCC and MPC with similar CP/TS ratio with careful selection of operating parameters, and that CGE can be used for detailed analysis of various protein fractions.

1. Introduction

In the last 30–35 years, the dairy industry has seen a surge in membrane technology application and has developed new ingredients in the form of liquid and dried concentrates. Membrane-mediated fractionation is a physical pressure-driven molecular separation process. The separation is determined by the membrane characteristics (molecular weight cutoff value) and the molecular size of the individual components present in the feed. Two of the major separation technologies employed in the dairy industry are ultrafiltration (UF), and microfiltration (MF) [1]. These two processes differ in membrane characteristics, pore size and operating pressure. During UF all the proteins are retained, whereas MF selectively retains casein (CN) and permeates serum proteins (SP).
UF is primarily used to produce dairy ingredients that have an increased protein content and reduced lactose contents, such as milk protein concentrate (MPC) and whey protein concentrate (WPC). Since the typical UF membrane has a pore size of approximately 10 kD, it retains the fat, CN, SP and colloidal minerals, whereas particles below 10 kD in size—such as lactose and soluble minerals—pass through the membrane into the permeate [1,2,3]. A major application of UF processing is the production of MPC varying in protein content from 50% to 85%. MPC contains whey proteins and caseins in the same proportions as in milk. The food industry typically uses MPCs as gelling, foaming or emulsifying ingredients and for their nutritional value.
MF has historically been used in whey protein isolate manufacture to remove fat. However more recently MF has been used to remove SP from skim milk to produce micellar casein concentrate (MCC). During separation of skim milk using MF, the difference in the molecular weight (MW) and size of casein micelles (0.02–0.40 μm in diameter) in the colloidal state and the SP (0.003–0.010 μm, [4]) is exploited. Relative to UF, MF has a more porous (0.1–0.5 µm) membrane, so it retains residual fat, micellar casein and micellar minerals; while it permeates SP, peptides, non-protein nitrogen (NPN) and other solutes (serum minerals and lactose). Therefore, this method increases the ratio of casein to total protein and casein to true protein [5,6,7,8] in a protein concentrate.
The feasibility of producing MCC by MF has been demonstrated previously [5,6,9,10,11]. A wide variation is observed in the type of membrane (ceramic or polymeric), and processing conditions (temperature, trans membrane pressure (TMP), diafiltration (DF) level, raw material, pH) used to produce MCC. Temperatures range from 4–50 °C, membrane pore size from 0.1–0.5 microns, TMP from 5–175 kPa, and DFs level from 0 to as high as 250% have been used [5,6,7,8,9,11,12].
Membrane materials commonly used for UF and MF of skim milk include ceramic (inorganic) and polymeric (organic) materials [5,6,11,13]. Polymeric membranes have several advantages, including being compact, having low capital and operating costs, being the cheapest per square meter, having a smaller space requirement, being easy to replace, following standardized dimensions, and are familiar to most US dairy processors. However, they are not suitable for very viscous products and for liquids containing a large number of suspended particles that may block a spacer. Furthermore, polymeric membranes are more challenging to clean, have low recovery of soluble constituents, and have reduced membrane life compared to ceramic membranes. Their propensity to foul and exhibit low flux compared with ceramic MF membranes [12] is a concern and reduces their cost advantage per square meter. The newer polymeric membranes are available with heat/thermo and chemical stability and low operating costs [7,13].
Whether in a research or industrial scale, efficient production of retentate and permeate products at target composition is important. Multiple factors influence both the composition of the retentate and permeate removal efficiency during UF and MF. These factors include the initial skim milk composition, the heat treatment history of the skim milk, crossflow velocity, TMP, temperature, concentration factor, DF levels, and the rejection characteristics of the membrane used. It becomes prudent to know the efficiency of separation of proteins during operation, as it not only has an effect on the economics of products but also on product quality. The Kjeldhal method is an analytical process generally used for crude fraction analysis of total nitrogen, non-casein nitrogen (NCN) and NPN, with which crude protein (CP), True protein (TP), CN and SP are calculated. However, this method does not give the separation efficiency of individual protein fractions. With the advent of specialized processes to produce α-LA [6] and β–CN [14] knowledge of the efficiency of separation, it is important in the partitioning of CN (β–CN, αS1-CN, αS2-CN, κ-CN, γ-CN) fractions and major SP (β-LG, α-LA) fractions in various streams of retentate and permeate. Electrophoresis has been used for measuring individual protein fractions qualitatively and quantitatively [15,16,17,18].
In recent years, there has been increased interest in assessing the suitability and efficiency of polymeric membranes for the production of MPC and MCC. Many researchers have studied the UF and MF systems under different processing conditions as reported earlier. For the optimized and tailored functionality of MPC or MCC, proper membrane selection, control of composition and processing parameters is required. Membrane separation technologies and selective fractionation of milk affect the CP to TS ratio and also the CN and WP ratios, which has a profound effect on the functional and rheological properties of the products made [6,7,8]. Many of the formulations require similar protein content from the ingredients. The current research on MF focuses on SP removal and increasing protein content. However, there is no literature comparing manufacture of MPC and MCC using UF and MF, respectively, to produce protein concentrates with a similar protein ratio relative to total solids. It is prudent to know how the various protein fractions and other constituents end up in retentate and permeate when the similar protein content is targeted. The objective of the experiment was to produce MPC and MCC retentates having similar total crude protein/TS ratio using UF and MF, respectively, and analyze various constituents and protein fractions.

2. Materials & Methods

2.1. Experimental Design and Statistical Analysis

A total of 600 kg of raw milk (at 4 °C) obtained from the South Dakota State University, Brookings, USA, dairy farm (month of September to November) was subjected to mechanical centrifugal separation (392, Separators Inc, Indianapolis, IN, USA) and the skim milk obtained was batch pasteurized at 63 °C for 30 min and cooled to 4 °C. The pasteurized skim milk was divided into two equal portions. One portion was processed into MCC using MF as described below. The other portion was processed into MPC using UF as described below. The experiment was designed to produce 80.0% total nitrogen to total solids ratio in the final MF and UF retentate. Three replicates of MCC and MPC were produced from three different lots of milk. Samples of feed, permeate and retentate were analyzed for their composition as described below. Statistical analysis of the collected data was done using the Proc GLM analysis of SAS (SAS Institute Inc., Cary, NC, USA) with a Type I error rate (α) of 0.05 to test for significant differences among the treatments. The mean value comparisons were made at a 0.05 level of significance using least significance difference (LSD) and the results were considered significant at p < 0.05.

2.2. Microfiltration

A portion (227 L) of each replicate of pasteurized skim milk was microfiltered to a final retentate volume of 45.4 L resulting in a volume reduction ratio (VRR) of approximately 5 (on a feed volume basis). MF was performed using two 0.5 µm polyvinylidene fluoride spiral wound membranes (3838 element format, Dominick Hunter Filtration Divison—N.A, Parker Hannifin Corporation, Oxnard, CA, USA) arranged in parallel as shown in Figure 1. Each membrane element was 97 mm in diameter and 762 mm in length with a 1.1 mm feed spacer and a total surface area of 4.3 m2. Microfiltration was performed at 23.3 °C using a transmembrane pressure of 86.2 kPa (34.5 kPa inlet and 103.4 kPa differential). The low TMP was selected because barrier layer formation on the membrane surface is a major performance factor and an improved separation of micellar CNs, and whey protein has been reported at low TMP [6,19]. In order to control the viscosity of the retentate and to maximize the SP removal, DF water was added at 6 different intervals totaling 100% (on a feed volume basis).
In preliminary studies, we observed that during startup of the MF process the initial permeate collected was cloudy and potentially contained some CN. Consequently, during the startup of MF, the permeate produced for the first 5 min was recirculated back to the retentate in the balance tank. Similar observations were reported by other researchers [12]. This phenomenon occurs because, in hydrophobic polymeric membranes, CN and SP separation requires the formation of a boundary layer on the surface of the membrane [9,12,19,20].

2.3. Ultrafiltration

A portion (227 L) of each replicate of pasteurized skim milk was ultrafiltered to a final retentate volume of 45.4 L, resulting in a volume reduction of approximately 5 (on the feed volume basis). UF was performed using two 10 kD polyether sulfone spiral wound membranes (3838 element format, Dominick Hunter Filtration Divison—N.A, Parker Hannifin Corporation, Oxnard, CA, USA) arranged in parallel as shown in Figure 1. Each membrane element was 97 mm in diameter and 965 mm in length with a 1.1 mm feed spacer and a total surface area of 5.7 m2. Ultrafiltration was performed at 23.3 °C using a 276 kPa transmembrane pressure (207 kPa inlet and 138 kPa differential). In order to control the viscosity of the retentate and to remove additional lactose and soluble minerals, DF water was added at 4 different intervals totaling 40% (on the feed volume basis). During start-up, the permeate was recirculated back to the retentate balance tank for 5 min.

2.4. Chemical Analysis

The skim milk, retentate and permeate samples from MPC and MCC manufacture were collected and immediately cooled to 4 °C. The TS, total fat and ash of each sample were determined using standard wet chemistry procedures [21]. The TN, CP, NPN and NCN were determined using micro-Kjeldhal analysis [21] except the modified NCN extraction method was used [22]. The true protein, casein and serum protein were calculated by differences using the CP, NCN and NPN values [21]. Lactose was measured using a HPLC based method [23] for milk except a sample size of 1g was used. The HPLC system (Beckman Coulter Inc., Fullerton, CA, USA) for measuring lactose content included a solvent delivery module (System Gold 125), a multichannel wavelength scanning detector (190–600 nm; System Gold 168 detector) and a 20-μL sample injection loop (Rheodyne, Rohnert Park, CA, USA). The HPLC system also included a refractive index detector (RI-2031, Jasco Corporation, Hachioji, Japan) and a model 631 column heater (Alltech, Deerfield, IL, USA). A 300- × 7.80-mm ion exclusion column (ROA-Organic Acid, Phenomenex Inc., Torrance, CA, USA) maintained at 65 °C was used for separation of lactose. Sulfuric acid (0.013 N) was used as mobile phase at a flow rate of 0.6 mL/min. The mobile phase was prepared by dissolving 360 µL of HPLC grade sulfuric acid (Sigma-Aldrich, St. Louis, MO, USA) in one liter of HPLC-grade water (Fisher Scientific, Pittsburgh, PA, USA). Calcium was determined by atomic absorption spectroscopy (AAnalyst 200, PerkinElmer instruments LLC, Shelton, CT, USA) at a 422.67 nm wavelength [24] except for modifications for liquid samples. For SM and permeate 5 mL of sample and 25 mL 15% TCA were mixed. For retentate samples, 3 mL of sample and 2 mL of HPLC grade water (Fisher Scientific, Pittsburg, PA, USA) were mixed and then 29.5 mL of TCA were added and mixed.

2.5. Percent SP, Ash, Calcium and Lactose Removal

The SP, ash, calcium and lactose removal were calculated using quantities of their respective constituent in skim milk and in permeate collected from the process. The percent removal of a particular constituent was calculated by dividing the respective constituent mass in the permeate (g) by constituent mass (g) in the original skim milk and multiplying by 100.

2.6. Capillary Gel Electrophoresis (CGE)

The individual protein fractions present in the skim milk, as well as the retentate and permeate from MF and UF were determined using CGE. Each sample was diluted to 10 mg/mL of protein using HPLC grade water. After dilution 10 µL of each sample, 85 µL of sample buffer (Beckman-Coulter), 2 µL of internal standard (10 kDa protein) and 5 µL of β-mercaptoethanol were added to a micro-vial. Each micro-vial was capped tightly, mixed thoroughly and then heated in a water bath at 90 °C for 10 min. The vials were cooled to room temperature prior to injection. The CGE was carried out using a Beckman P⁄ACE MDQ capillary electrophoresis system (Beckman-Coulter, Fullerton, CA, USA) equipped with a UV detector set at 214 nm. The separation was performed using a 50-µm bare fused silica capillary (20.2 cm effective length from the inlet to the detection window). All solutions and reagents were obtained as a part of the ProteomeLabTM SDS-MW Analysis Kit (Beckman-Coulter) that is designed for the separation of protein-SDS complexes using a replaceable gel matrix. The gel is formulated to provide an effective sieving range of approximately 10–225 kDa. A SDS-MW size standard (recombinant proteins 10–225 kDa supplied with the ProteomeLab SDS-MW Analysis Kit) was used to estimate the molecular weight of the proteins in each sample. A capillary preconditioning method was run every three samples. It consisted of a basic rinse (0.1 N NaOH, 5 min, 344.7 kPa), followed by an acidic rinse (0.1 N HCl, 2 min, 344.7 kPa), a water rinse (HPLC grade water, 2 min, 344.7 kPa) and finally a SDS Gel rinse (SDS gel fill, 10 min, 275.8 kPa). After the preconditioning steps the sample was electrokinetically introduced at 5 kV for 20 s. The separation was performed at a constant voltage of 15 kV (25 °C temperature and 20 bar pressure) with reverse polarity in the SDS-molecular weight gel buffer. Actual current values were recorded to determine the efficiency of each electrophoretic run. Molecular weight standards (ProteomeLab and Beckman-Coulter) and available pure milk protein fractions (Sigma, USA) were also separated using the method as described above to determine migration times.
The peaks in the capillary electropherogram were identified by comparing the migration time of molecular weight standards and pure standard samples as well as by comparison to results reported by other researchers [17,25,26,27]. The area of each identified peak was calculated from the electropherogram using a valley-to valley approach [27]. The area of the each identified individual CN fraction (αS1-CN, αS2-CN, β-CN, κ-CN and γ-CN), SP fraction (α-LA, β-LG, peptides (peaks between 10 kDa and 20 kDa), and NPN fraction (all positive peaks below 10 kDa) was calculated as percentage of total area (positive peaks). Furthermore, to compare the results with Kjeldhal analysis, the calculated CN, SP and NPN area was expressed as a percentage of the total positive peak area.

3. Results and Discussion

The statistical analysis (mean square and p-values probabilities) of the experimental data are presented in the online Supplementary File including Supplementary Tables S1 and S6.

3.1. SM Composition

The mean composition of pasteurized skim milk used in each replicate for MF and UF is shown in Table 1. The small variation in TS, fat, lactose, ash, calcium, CP, NCN and NPN content of the skim milk represents normal week-to-week variations in the raw milk supply, as well as variation in separation efficiency. The CN/CP, CN/TP, SP/CP and SP/TP ratios of skim milk from each replicate were similar, indicating minimal variation in skim milk between the replicates. The CN/CP, CN/TP, SP/CP and SP/TP ratios can be used as a measure of protein hydrolysis and are an indicator of milk quality [10,12] since NCN and NPN increase during extended refrigerated storage [28]. Additionally, if skim milk is pasteurized at a high temperature for an extended time, the CN/TP ratio, as determined by Kjeldhal analysis, increases [9]. This occurs as a result of interactions between SP and CN, which cause a reduction in NCN content [29]. In the present study, the average CN/TP ratio of 82.33% in the skim milk was similar to values reported by other researchers [10,12] and indicates that the milk was fresh and properly pasteurized.

3.2. Flux

Flux is flow rate per unit area. Maintaining flux rate over time is important for efficient separation. As the concentration of the milk increases, there is a decrease in the flux rate. Figure 2 shows the average process flux rate during the MF and UF process. The average flux rate in the UF run was higher (15 L m−2 h−1) as compared to MF runs which was at 12.3 L m−2 h−1. This is because of the difference in membrane characteristics of UF and MF as well as TMP and DF used in processing. DF is the easiest way to regain and maintain flux rate [5,19,30] and to improve separation efficiency. The sequential DF was done to maintain and restore flux rate as well as maintain the viscosity of the circulating retentate. DF water, 100% and 40% (on feed basis) was added in six intervals during MF and UF process (Figure 2) to maximize removal of solutes and still have similar VRR (5) (Figure 3). Sequential addition of DF water improves flux rates during the concentration process [5,30,31]. However, the 100% DF used for MF led to the production of 50% more permeate as compared to UF. Similar concerns of a lengthy process and voluminous permeate handling were reported for MF by other researchers [9]. The feed volume, 5 VRR and DF levels used in the study resulted in a process time of about 2–2.5 h for UF and 5–5.5 h for MF process (Figure 2 and Figure 3).

4. Wet chemistry

4.1. Retentate and Permeate Proximate Composition

The mean composition of the retentates and permeates from MF and UF are shown in Table 2. There were significant (p < 0.05) differences in all the compositional parameters except fat for the MF and UF, retentates and permeates. The UF retentate (UFR) and UF permeate (UFP) had significantly (p < 0.05) higher TS, lactose, ash and calcium content as compared with the MF retentate (MFR) and MF permeate (MFP), respectively. The UFR had a significantly (p < 0.05) higher CP content as compared to the MFR however, the UFP had a significantly (p < 0.05) lower CP content as compared to the MFP. This affected the CP/TS ratio found in both the retentates. This experiment targeted a 80.0% CP/TS ratio in both the retentates; however, actual results were higher for MFR (81.71%) and lower for UFR (77.18%) and were significantly (p < 0.05) different. In order to achieve the desired 80% CP/TS ratio the DF level would need to be decreased for MF and the DF level would need to be increased for UF. Using similar conditions, but using 50% DF other researchers [8] were able to achieve 80% CP/TS in UF retentate. The MFP and UFP had 9.65% and 3.51% CP/TS ratio, respectively. The observed differences in retentate and permeate composition and CP/TS ratio were expected because of the differences in membrane selectivity and process parameters used in MF and UF.

4.2. Retentate and Permeate Protein Ratios

The mean protein content and protein ratios of the retentate are given in Table 3. There was a significant (p < 0.05) treatment effect in all of the protein fractions and protein ratios except CN content in the MFR and UFR as shown in Table 3. The UFR had a significantly (p < 0.05) higher NCN, NPN, TP and SP content compared with the MFR. However, there was no difference in the CN content of the two retentates. The MFR had a significantly (p < 0.05) higher CN/CP, CN/TP ratio and significantly (p < 0.05) lower SP/CP, SP/TP, NPN/CP and NPN/TP ratio compared with the UFR. As shown in Table 3, the MFR had 92.62 CN/TP while it was 82.68 in the UFR. The CN/TP in the UFR was similar to the skim milk (82.33), indicating that UF is a concentration process for all the proteins in milk.
There was a significant (p < 0.05) effect of treatment on all the protein and protein ratios of permeate, except for CN and the CN/CP ratio (Table 4). The MFP had significantly (p < 0.05) higher NCN, TP, SP, SP/CP and SP/TP content and significantly (p < 0.05) lower NPN, CN/TP, NPN/CP, and NPN/TP content compared with UFP (Table 4). No differences were observed in fat and CN content of permeates obtained during MF or UF processing. The differences in MFP and UFP results are expected as MFR had lower CP, NCN, TP and SP compared with UFR (Table 3). This selective separation of skim milk components causes significant changes in the various ratios of the retentates and permeates of UF and MF.
The membrane characteristics, TMP and DF level all contributed to different retentate and permeate ratios. To have the same protein/TS ratio, the DF level used in MF was high as SP and other soluble constituents were removed. Due to different processing conditions and membrane characteristics used by researchers, it is very difficult to compare results. However, using 0.3 µm PVDF MF membrane at 50 °C, three-stage process (two DF stages) and a bleed and feed process, 81.37% protein/TS ratio in MF retentate was achieved [9], whereas other group [32] reported 87.62% protein/TS ratio using a spiral wound UF membrane at 38 °C using a VRR of 6 (after DF) with three DF stages.

4.3. Removal of SP, Ash, Calcium, and Lactose

The mean percent SP, ash, calcium and lactose removal from MFR and UFR produced using MF and UF, respectively are shown in Table 5. The MFR produced using MF had significantly (p < 0.05) higher percent SP, ash, calcium and lactose removal compared with UFR produced from UF.
The soluble, low MW constituents, including lactose, SP, ash (calcium) and NPN were removed from the MFR. The SP removal of UFR was virtually zero, as the UF process retains most of the SP. These differences are due to membrane characteristics, DF water used and process differences. This led to the observed differences in the retentate nitrogen fractions, thus the protein ratios and change in the protein/TS ratio. Hence, even though the CN content was high, due to removal of soluble constituents, the protein/TS ratio in MFR remained at 80%. In the UFR all the major proteins (CN and whey proteins) are retained and a DF rate of 40% of the feed, it retained more soluble constituents, leading to the 80% protein/TS ratio. Membrane characteristics strongly affect the removal of constituents. The non-protein permeate solids are permeated readily in wide pore membrane than the tighter membrane like UF [33]. Sequential addition of DF water raises CN content in the retentate by washing out SP, lactose and mineral salts [5,6,19,30,31]. The SP removal was affected strongly by the target concentration factor and DF [16]. Using appropriate DF and MF parameters and temperature manipulation, the CN/TP ratio could be increased to as high as 96%, while maximizing serum protein removal [6,9,12,14,19,31,34,35].
For polymeric membranes at 50 °C at 3.00× concentration factor, 39% SP removal in a single-stage has been reported [12], whereas others have reported about a 70% SP removal from skim milk in a three-stage process [9]. For maximizing the SP removal using polymeric membranes to produce MCC from skim milk at lower temperatures (22 °C) optimized operating parameters (operating pressure, DF) have been reported [5,6]. Using selective DF and a polymeric membrane, the CN can be increased up to 95% of the true protein [6]. Use of lowest pressure (34.5 kPa and highest DF level (150%) contributed to 81.45% SP removal, taking the CN/TP ratio to 0.96 [5]. Controlling the initial startup and sequential DF to maintain flux rates reduce these problems and increase the rate of SP removal.
Besides membrane characteristics, the DF used is responsible for removal of SP, ash calcium and lactose from the retentate. Various authors have reported that lactose and soluble minerals such as calcium are removed because of DF [36,37,38]. More DF was used in MF than UF to remove the soluble constituents. The UF at lower temperature leads to more calcium removal [2,37] as solubility of calcium is higher. The MCC manufactured at 10 °C had higher WP and low calcium compared to MCC manufactured at 50 °C [39].

5. Capillary Gel Electrophoresis

5.1. Skim Milk

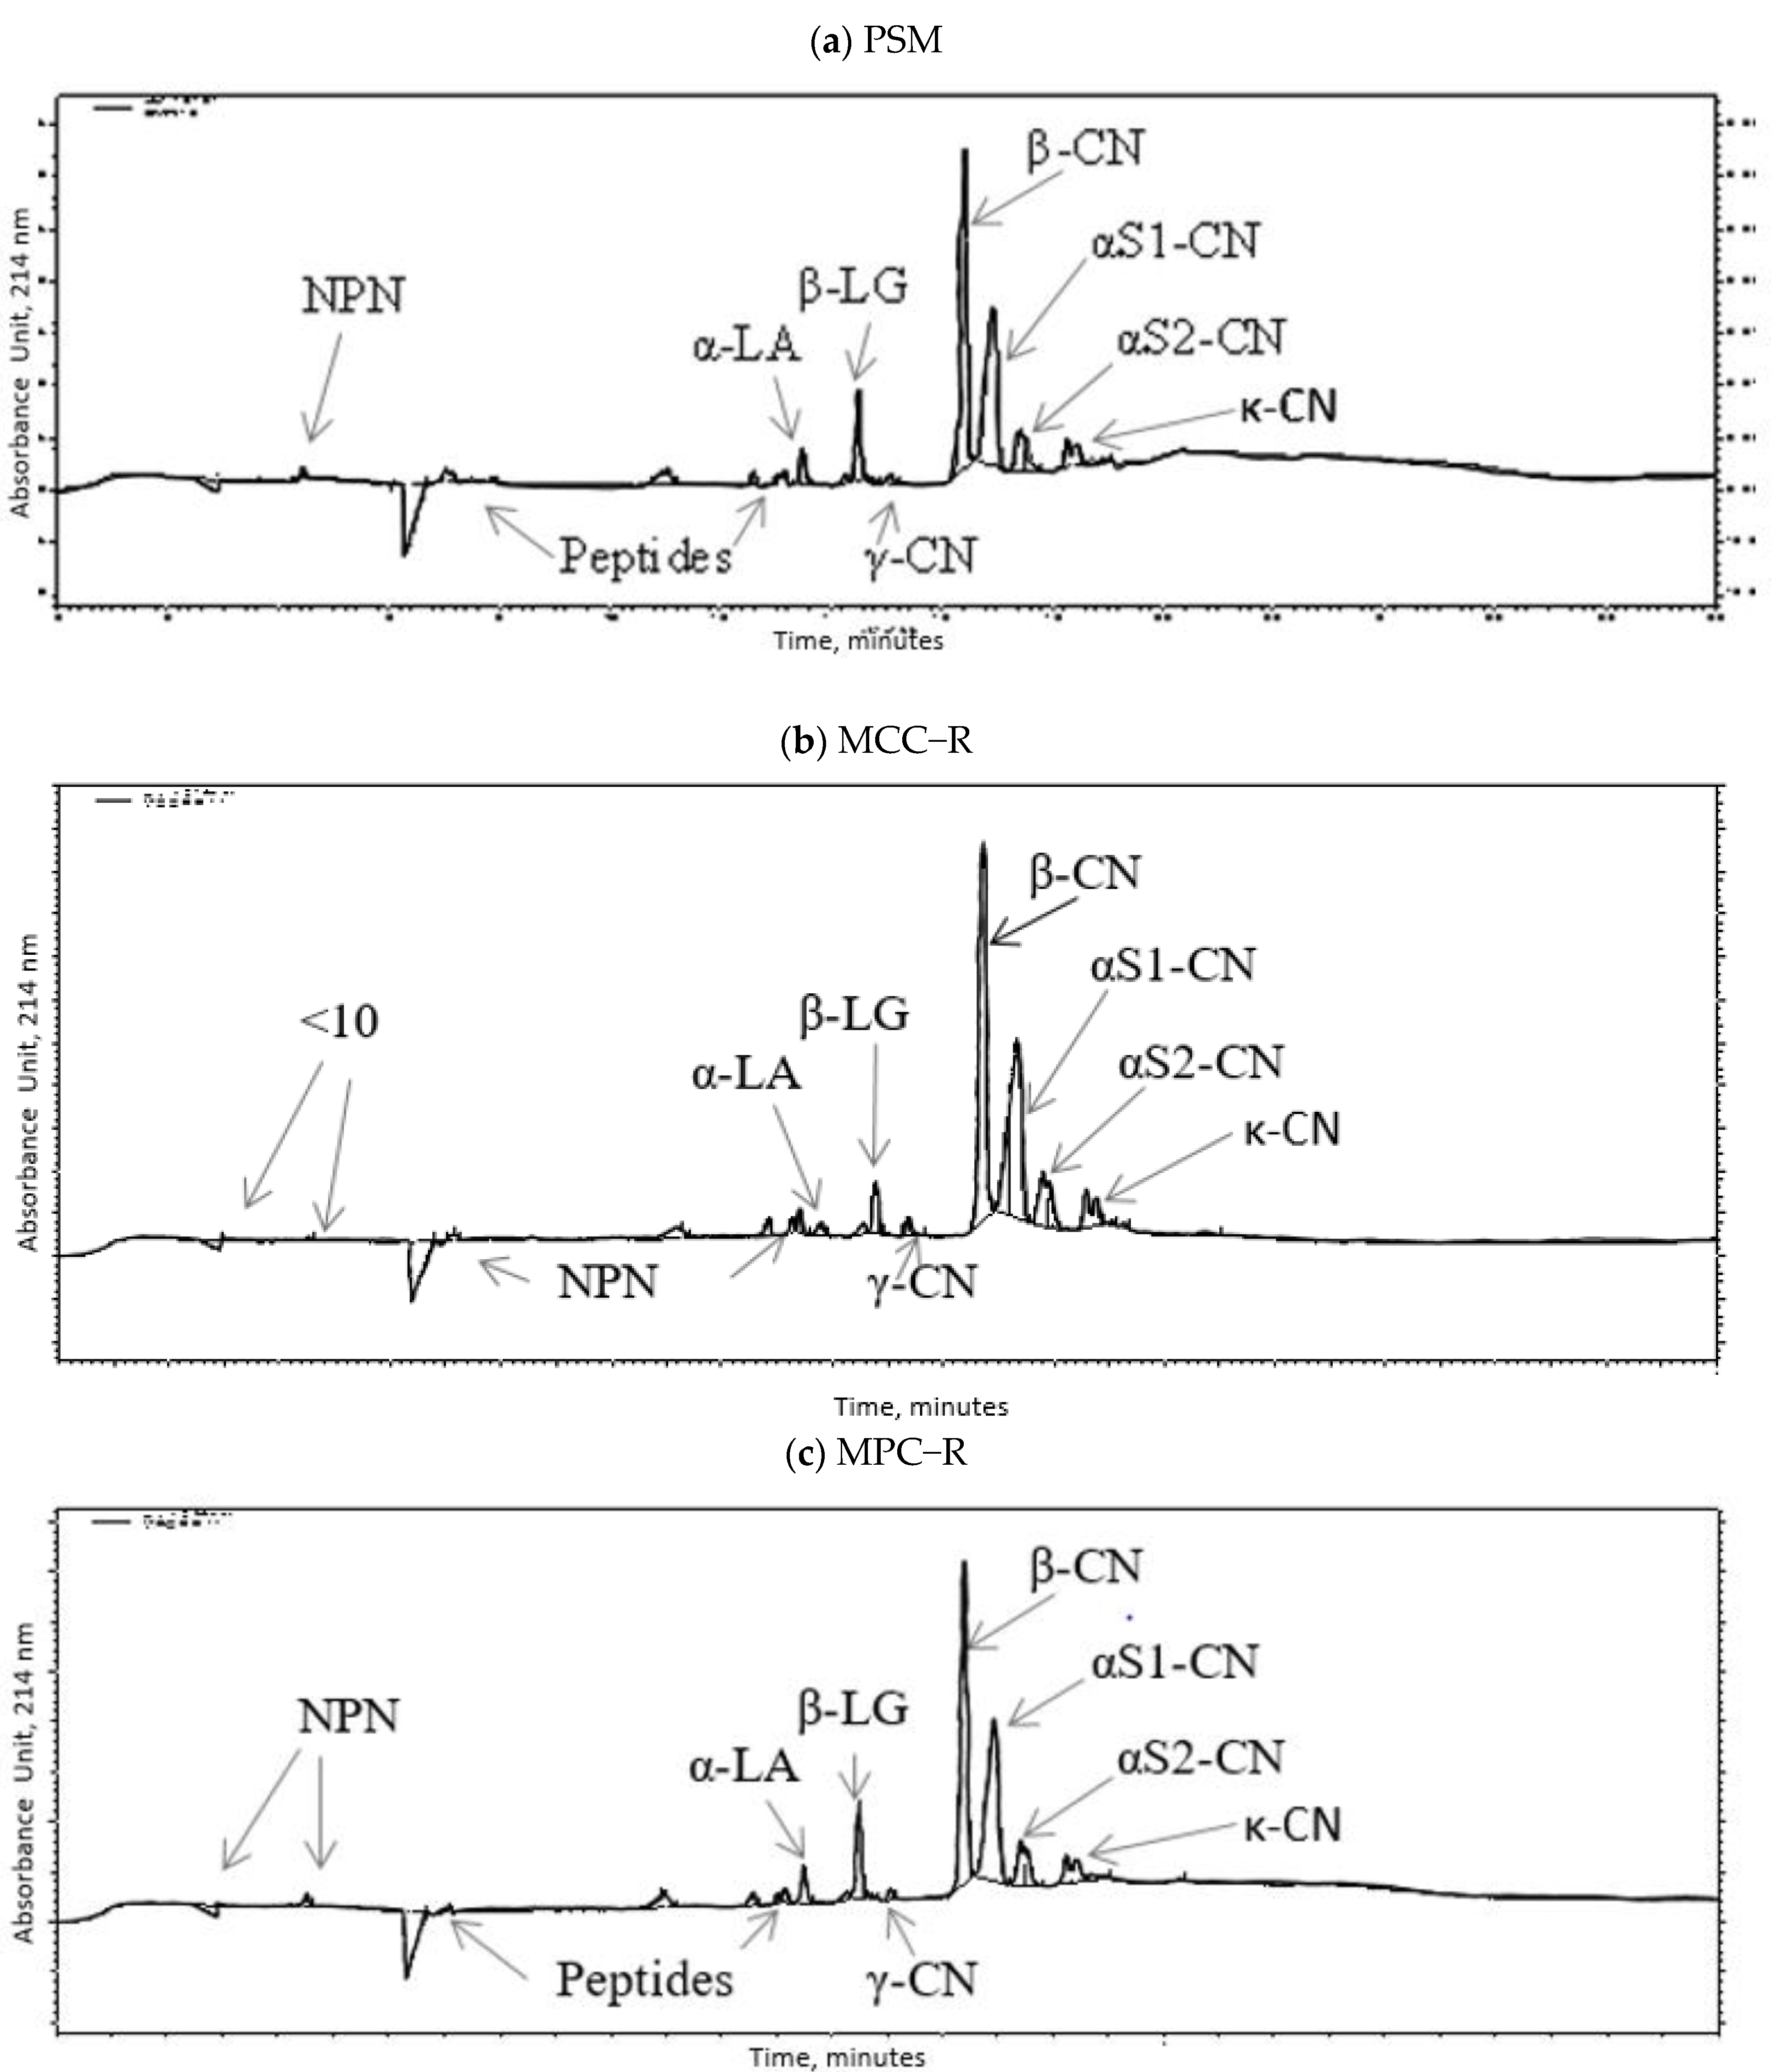
A representative CGE electrophoreogram for skim milk is shown in Figure 4a. The various CN, whey proteins and other protein fractions are identified. As shown in Figure 4a, among the caseins, β-CN eluted first, followed by αS1-CN, even though the MW of the later is lower. Similar phenomenon was reported by other researchers [17,25]. The αs1-CN has a reduced electrophoretic velocity as a result of its negatively charged regions, which may adopt an extended conformation in the presence of SDS [25]. Therefore, αs1-CN has an increased apparent size and slower migration under SDS-PAGE conditions [17,25].
The κ-CN has a low MW relative to other caseins, but it eluted after all the other casein fractions. The reduced migration of κ-CN may be attributed to the glycosylation of κ-CN [17,18,40]. The peak profile obtained on CGE was similar in all replicates, which indicated that no major modification or changes occurred in individual fractions due to the handling and pasteurization of the skim milk.
The various protein fractions observed and quantified in the CGE electrophoreogram of each replicate of skim milk are shown in Table 6. The ratio of peak areas for CN fractions β-CN:αS1-CN:αS2-CN:κ-CN:γ-CN determined by CGE was 4.1:4.0:1.0:0.7:0.3, whereas the ratio of major SP (β-LG: α-LA) obtained was 2.42 in skim milk and was similar in all replicates. Previous research has reported that in the normal milk, the CN fractions (β-CN:αS1-CN:αS2-CN:κ-CN:γ-CN) are in the ratio of 4:4:1:1:0.4, whereas major SP (β-LG:α-LA) are in the ratio of 1.86 [40,41,42]. The γ-CN content in the present study was 2.87%. This indicates that the milk was of good quality since the γ-CN is a hydrolytic product of plasmin enzyme action on β-CN. The ratios of various protein fractions (CN, SP and NPN) analyzed by CGE method were similar among the replicates (Table 6). In the present study, the average CN/TP ratio of 83.84% (CGE analysis) in the skim milk was similar to the value of 82.33% determined using Kjeldhal analysis.

5.2. Retentate and Permeate Composition-CGE Analysis

The various protein fractions in the MFR and UFR determined with CGE analysis are shown in Figure 4b,c. The MFR had a significantly (p < 0.05) higher casein fractions (β-CN, αS1-CN, αS2-CN, γ-CN) except κ-CN, and had significantly (p < 0.05) lower SP fractions (α-LA, β-LG, and peptides) content compared with UFR.
Similarly, the total casein content was significantly (p < 0.05) higher, whereas total SP content was significantly (p < 0.05) lower in MFR as compared to the UFR. No significant differences (p > 0.05) were found in NPN content between the MFR and UFR. As can be seen from Figure 4, the peak profile of the CN fractions in MFR and UFR are similar, indicating the membrane process did not have an effect on the CN fractions. However, the α-LA and β-LG peak in MFR decreased as compared with UFR, indicating that SP passed through the MF membrane. The CN fractions (β-CN: αS1-CN: αS2-CN: κ-CN: γ-CN) ratio was 3.8: 3.7: 1.0: 0.7: 0.4 in MFR, while in UFR, it was 4.0: 4.0: 1.0: 0.7: 0.4. The UFR CN fraction ratio was similar to that of skim milk (Table 6), whereas MFR had slightly lower values for β-CN and αS1-CN. The γ1-CN was concentrated in both MFR and UFR because it has a MW of 20-21 kD [43], which is higher than the β-LG fraction [40,42].
In the UFR, the ratio of β-LG: α-LA was 2.57, which was similar to the SM β-LG: α-LA ratio of 2.42 (Table 6), indicating that they were both retained by the membrane. The MFR had a higher β-LG: α-LA ratio of 3.57 as compared to the UFR and SM. This indicates that during the MF process, α-LA was preferentially removed as compared to β-LG.
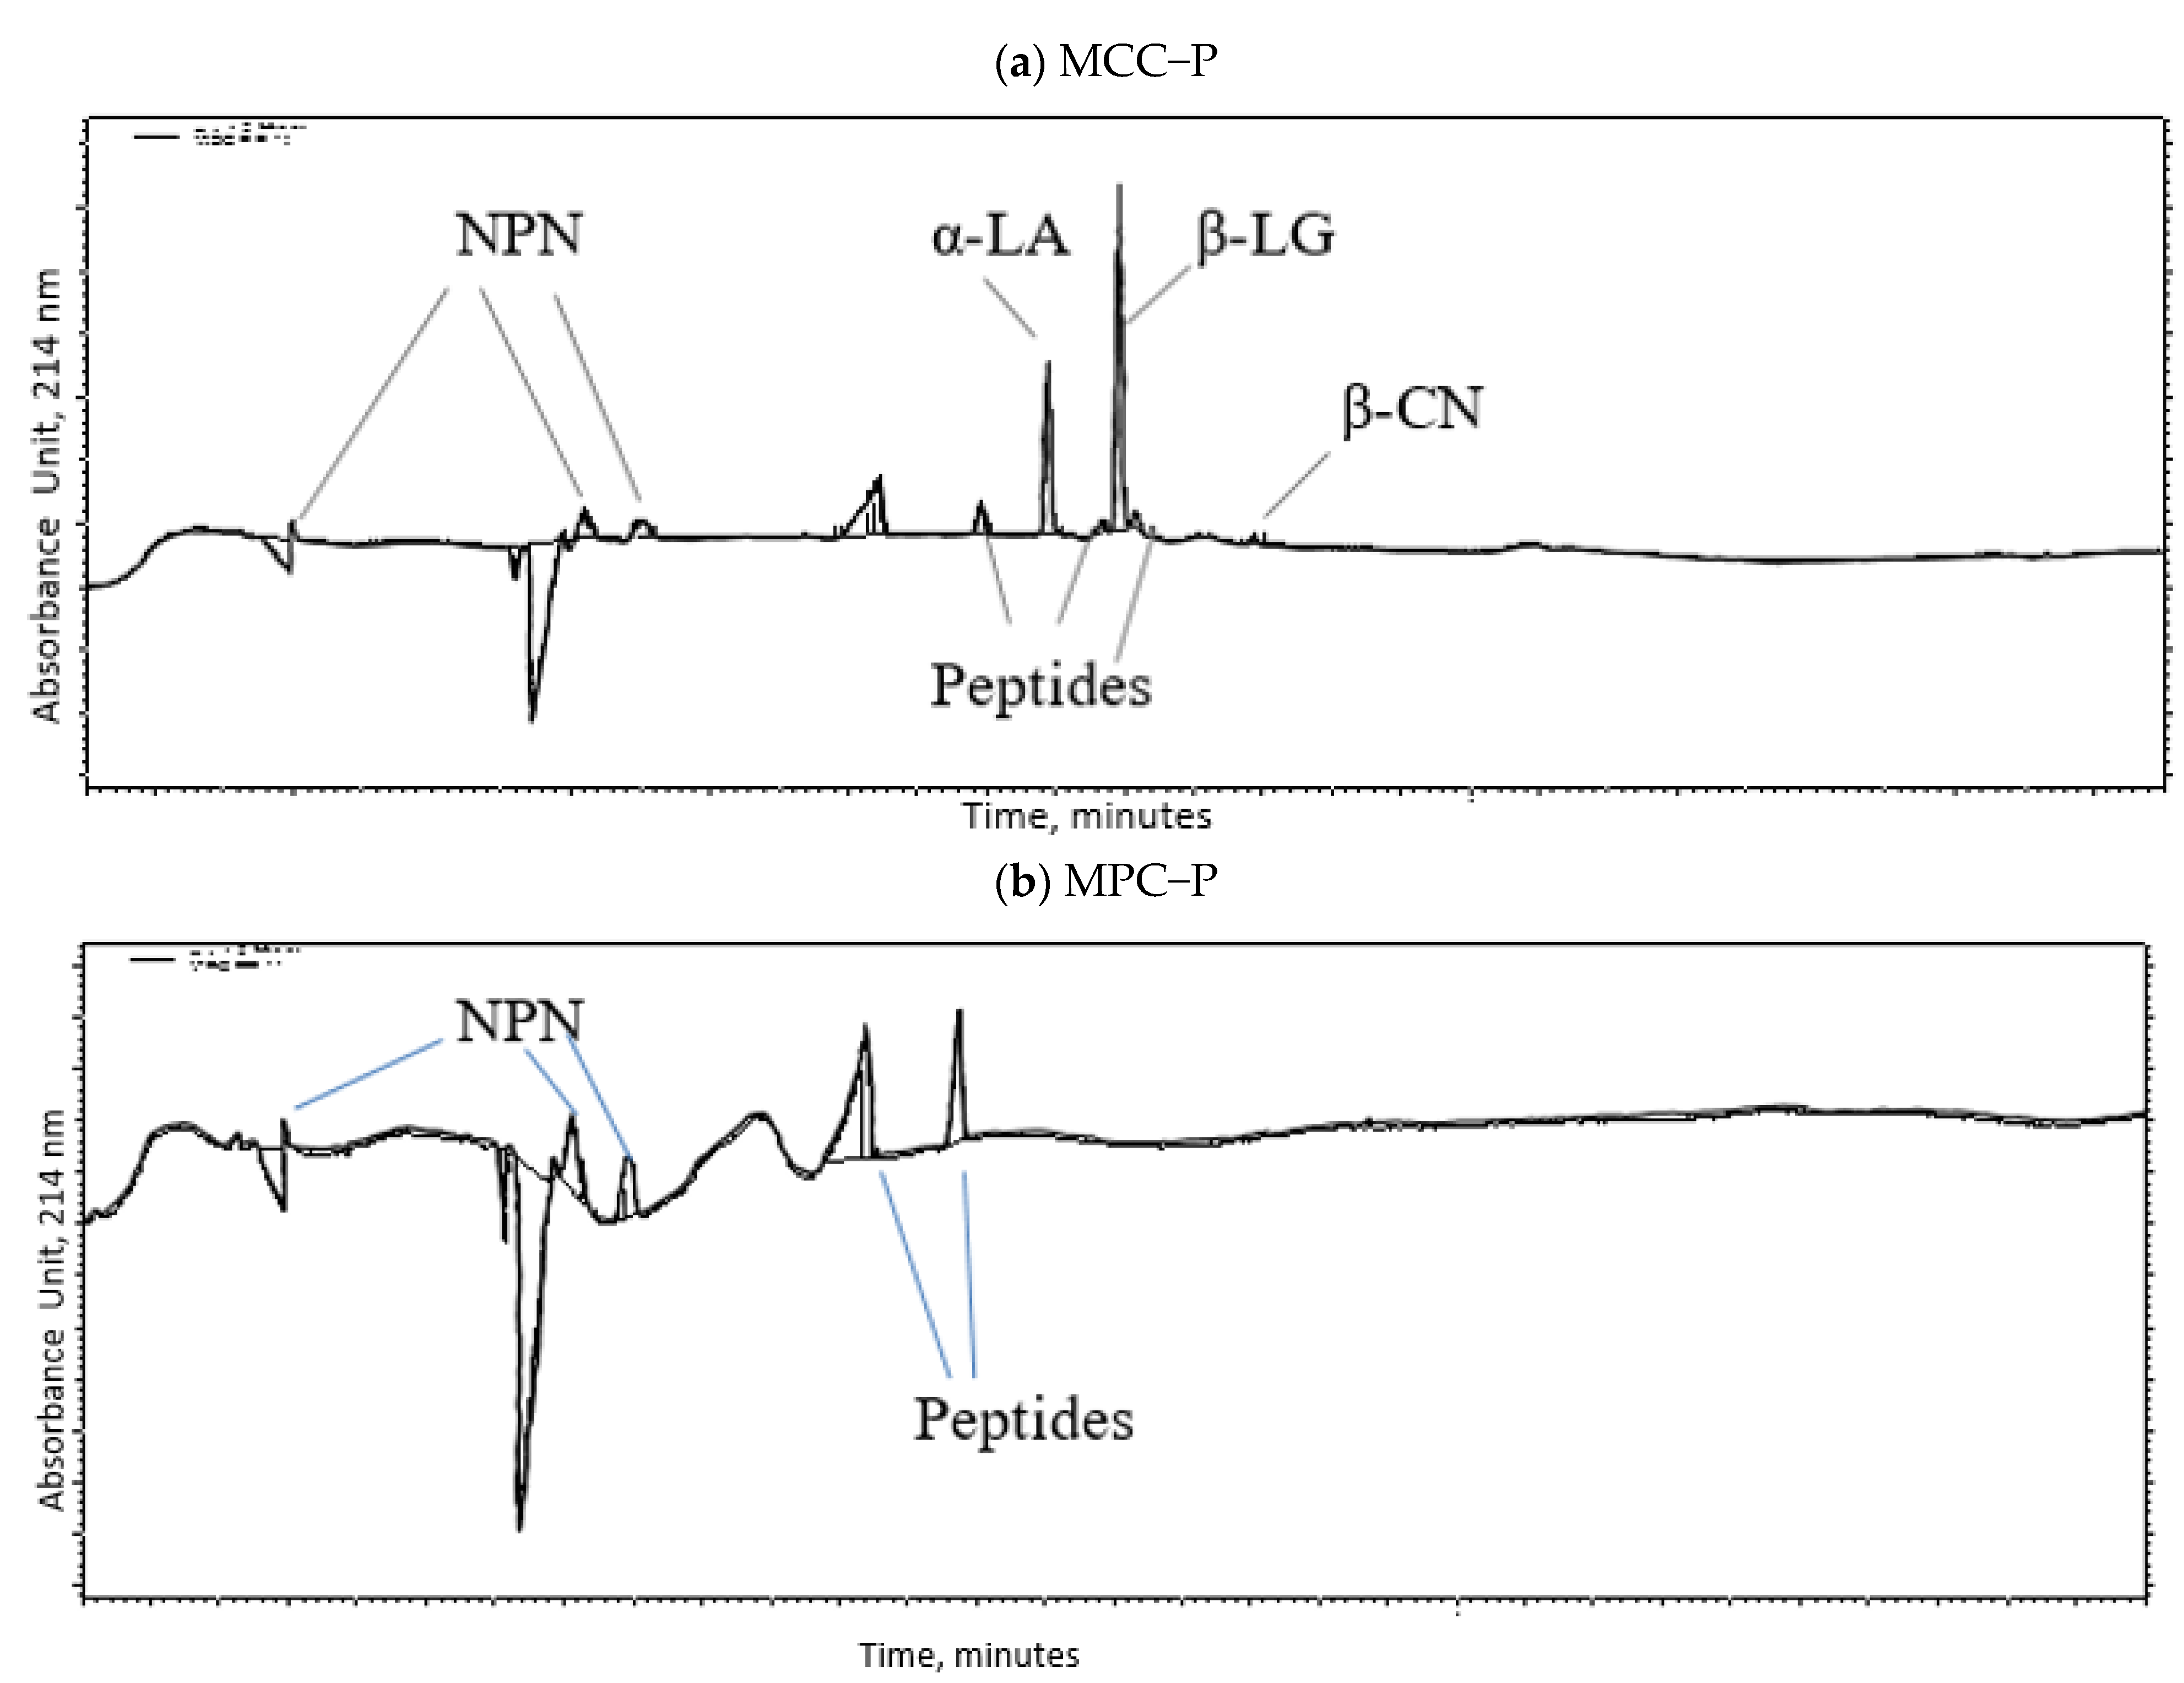
The CGE electrophoreograms obtained for the MFP and UFP are shown in Figure 5a,b, respectively. The various CN, whey protein and other protein fractions are identified in the electrophoreogram. The MFP electrophoreogram (Figure 5a) shows a small β-CN peak, α-LA and β-LG peaks, peptide fractions, and NPN (peptides) peaks. In UFP electrophoreogram (Figure 5b), no peaks for the α-LA, β-LG and CNs were detected, and all the peaks present were from peptide fractions and NPN (peptides) peaks.
The mean protein fractions as obtained using CGE for retentates are shown in Table 7 and for permeate in Table 8. There was a significant (p < 0.05) treatment effect on the casein and SP fractions, as well as their ratios. MFP had a significantly (p < 0.05) higher CN/TP and SP/TP but significantly (p < 0.05) lower NPN/TP content as compared to the UFP.
In MFP and UFP permeates, the high MW protein fractions were not present, indicating that permeates had protein fractions below 20 kDa. The MFP had some β-CN present and had a β-LG: α-LA ratio slightly lower than skim milk, which indicates SP was present in the MFP and the β-LG: α-LA ratio was 2.10, which is lower than the β-LG: α-LA ratio (2.42) found in SM.
The presence of β-CN in the MFP indicates that the temperature also plays a significant role, as β-CN fractions nature of being dynamic causes a partitioning problem. The polymeric membranes are generally operated at low temperatures at 4 °C [14,44], 10 °C [13,19] and 20 °C [5,6]; however, higher temperatures of 50 °C [9,11,12,13,19,20] have been used. At temperatures below 10 °C, β-CN dissociates and increases serum casein. Hence, the 22 °C temperature was selected based on ideal conditions used for the processing of milk in the dairy plant operations. During MF at lower temperatures (10 °C and below), the β-CN dissociates from the CN micelles and passes into permeate [44]. Other researchers have reported significant amount αS2-CN in the MFP using HPLC [19] while others have reported β-CN when MF is carried out at low temperatures using SDS-PAGE [44].
The UFP Kjeldhal analysis showed 0.02% CN but no casein was detected in CGE analysis; whereas in the MFP Kjeldhal analysis showed 0.03% CN and β-CN was detected in CGE analysis (only one electrophoreogram shown in Figure 3). This may be because UFP had CN below the detection limit of CGE or experimental error in the Kjeldhal analysis. The retentates and permeates have different buffering capacities based on the composition and concentration of constituents. The higher concentrations of dry matter, due to membrane filtration or evaporation, result in a higher measured buffering capacity [45]. Measurement of SP or NCN in retentates is a problem [10,22]. The modified method of NCN extraction for retentates, suggested that if proper pH adjustment is made when extracting NCN, it will provide more accurate results [22]. Because of the retentate buffering action, the required pH of 4.6 is never reached.

5.3. Comparison of CGE and Kjeldhal Results

In skim milk and retentates, comparison of CGE results with Kjeldhal results indicates that CGE overestimates the CN/TP ratio and underestimates the SP/TP results. This may be because of method differences, because in CGE spectroscopic detection at 214 nm is utilized. However, the advantage of CGE is that it gives additional information on the partitioning of different fractions, which is useful in specialized applications, such as α-LA and β-CN production, and in ascertaining production efficiency. For NCN analysis, even though the modified method [22] was used, we still observed a small difference between Kjeldhal and CGE analysis.

5.4. The Error in the NPN

It should also be noted that Kjeldhal analysis gives an error in the NCN and NPN estimations in retentates and permeates if the pH during extraction is not adjusted due to a different matrix than milk. The NPN content of both MFR and UFR measured using CGE was higher than that measured by Kjeldhal analysis. The NPN is composed of urea and other peptide fractions, specifically proteose peptone. All the nitrogen soluble in 12% TCA is referred to as NPN, and it is 5–6% of total milk nitrogen and very heterogeneous [41]. Low MW peptides form part of NPN and may or may not be precipitated by 12% TCA [40]. Most of the low MW peptides are expected to pass through both UF and MF [40,41]. These low MW fractions may cause variation in NCN and NPN content, as it is not clear how they are partitioned during extraction of NCN and NPN filtrate in wet chemistry methods. However, in CGE we could see peaks below 10 kDa MW, signaling more NPN in retentates. Hence, a detailed study considering various fractions is necessary for modifying NPN extraction. Due to an increase in the production of ingredients from membrane separation processes, it is prudent to have a different protocol for NCN and NPN protein estimation by Kjeldhal analysis.
Based on the results, to achieve targeted 80% CP/TS ratio, we recommend an increase DF in UF from 40% to 50% added in the later stages (after 105 min of UF operation, Figure 3). In our previous study we could achieve the desired 80% using 50% DF under similar conditions [8]. In the MF operation we recommend stopping and decrease of DF by 16% in the last stage to achieve the targeted 80% CP/TS ratio.

6. Conclusions

The MF and UF process can be used to manufacture MFR and UFR with similar CP/TS ratio. The selective separation of skim milk components causes significant changes in the protein ratios of the retentates and permeates of UF and MF. However, besides membrane selectivity, other variables also affect membrane performance, including processing parameters (flux rate and TMP), physical manipulation of parameters like DF and the temperature of filtration. Proper selection of the membrane element and processing conditions will allow for the removal or concentration of the targeted constituents, resulting in the desired crude protein/TS ratio.
The CGE analysis confirmed that α-LA is preferentially removed during MF process. The CGE can be used to effectively assess the performance of the membrane process where individual protein fractions, both in the retentate and permeate, can be measured, which is an advantage as compared with the Kjeldhal analysis, which measures crude fractions.

Supplementary Materials

The following are available online at https://0-www-mdpi-com.brum.beds.ac.uk/article/10.3390/dairy2030029/s1. The supplementary material for this article is attached separately. Table S1: Mean squares and P-values (in parentheses) of the retentate and permeate produced during microfiltration and ultrafiltration of skim milk using polymeric spiral-wound membranes, Table S2: Mean squares and P-values (in parentheses) of the retentate (MFR1 and UFR2) protein content and various protein ratios produced during microfiltration and ultrafiltration of skim milk using polymeric spiral-wound membranes, Table S3: Mean squares and P-values (in parentheses) of the permeate (MFP1 and UFP2) protein content and various protein ratios produced during a microfiltration and ultrafiltration of milk using polymeric spiral-wound membrane, Table S4: Mean squares and P-values (in parentheses) of percent removal of SP1, ash, calcium and lactose content during microfiltration and ultrafiltration of skim milk using polymeric spiral-wound membranes, Table S5: Mean squares and P-values (in parentheses) of the individual protein fractions observed in capillary gel electrophoresis of retentate (MFR1 and UFR2) produced during microfiltration and ultrafiltration of skim milk using polymeric spiral-wound membranes, Table S6: Mean squares and P-values (in parentheses) of the individual protein fractions observed in capillary gel electrophoresis of permeate (MFP1 and UFP2) produced during microfiltration and ultrafiltration of skim milk using polymeric spiral-wound membranes.

Author Contributions

Conceptualization, P.S., C.M. and L.E.M.; Plant trial, P.S. and C.M.; Analysis, P.S.; Data acquisition, P.S. and C.M.; Original draft preparation, P.S.; Review and editing, P.S., C.M. and L.E.M.; Funding application, L.E.M. All authors have read and agreed to the published version of the manuscript.

Funding

This research was funded by Dairy Research Institute (Rosemont, IL, USA), grant number 21101 and the APC was funded by Midwest Dairy Foods Research Center (St. Paul, MN, USA).

Institutional Review Board Statement

Not applicable.

Informed Consent Statement

Not applicable.

Data Availability Statement

Not applicable.

Acknowledgments

We thank Dairy Research Institute (Rosemont, IL, USA) and Midwest Dairy Foods Research Center (St. Paul, MN, USA) for funding this project.

Conflicts of Interest

The authors declare no conflict of interest.

References

  1. Carter, B.; Cheng, N.; Kapoor, R.; Meletharayil, G.; Drake, M. Invited review: Microfiltration-derived casein and whey proteins from milk. J. Dairy Sci. 2021, 104, 2465–2479. [Google Scholar] [CrossRef]
  2. Luo, X.; Ramchandran, L.; Vasiljevic, T. Lower ultrafiltration temperature improves membrane performance and emulsifying properties of milk protein concentrates. Dairy Sci. Technol. 2015, 95, 15–31. [Google Scholar] [CrossRef] [Green Version]
  3. Gavazzi-April, C.; Benoit, S.; Doyen, A.; Britten, M.; Pouliot, Y. Preparation of milk protein concentrates by ultrafiltration and continuous diafiltration: Effect of process design on overall efficiency. J. Dairy Sci. 2018, 101, 9670–9679. [Google Scholar] [CrossRef] [PubMed] [Green Version]
  4. Walstra, P.; Wouters, J.T.M.; Geurts, T.J. Dairy Science and Technology, 2nd ed.; Taylor & Francis: Abingdon, UK; CRC Press: Boca Raton, FL, USA, 2006. [Google Scholar]
  5. Metzger, L.E.; Marella, C.; Salunke, P. Micellar Casein Concentrate—Performance of Spiral Wound Process and Characterization of MCC. J. Dairy Sci. 2012, 95 (Suppl. 2), 232. [Google Scholar]
  6. Marella, C.; Muthukumarappan, K.; Metzger, L.E. Evaluation of commercially available, wide-pore ultrafiltration membranes for production of alpha-lactalbumin-enriched whey protein concentrate. J. Dairy Sci. 2011, 94, 1165–1175. [Google Scholar] [CrossRef] [PubMed]
  7. Marella, C.; Muthukumarappan, K.; Metzger, L.E. Application of Membrane Separation Technology for Developing Novel Dairy Food Ingredients. J. Food Process Technol. 2013, 4, 269. [Google Scholar]
  8. Marella, C.; Salunke, P.; Biswas, A.C.; Kommineni, A.; Metzger, L.E. Manufacture of modified milk protein concentrate utilizing injection of carbon dioxide. J. Dairy Sci. 2015, 98, 3577–3589. [Google Scholar] [CrossRef] [PubMed] [Green Version]
  9. Beckman, S.L.; Zulewska, J.; Newbold, M.; Barbano, D.M. Production efficiency of micellar casein concentrate using polymeric spiral-wound microfiltration membranes. J. Dairy Sci. 2010, 93, 4506–4517. [Google Scholar] [CrossRef] [PubMed] [Green Version]
  10. Hurt, E.; Zulewska, J.; Newbold, M.; Barbano, D.M. Micellar casein concentrate production with a 3×, 3-stage, uniform transmembrane pressure ceramic membrane process at 50 °C. J. Dairy Sci. 2010, 93, 5588–5600. [Google Scholar] [CrossRef]
  11. Beckman, S.L.; Barbano, D.M. Effect of microfiltration concentration factor on serum protein removal from skim milk using spiral-wound polymeric membranes. J. Dairy Sci. 2013, 96, 6199–6212. [Google Scholar] [CrossRef]
  12. Zulewska, J.; Newbold, M.; Barbano, D.M. Efficiency of serum protein removal from skim milk with ceramic and polymeric membranes at 50 °C. J. Dairy Sci. 2009, 92, 1361–1377. [Google Scholar] [CrossRef] [PubMed]
  13. Karasu, K.; Glennon, N.; Lawrence, N.D.; Stevens, G.W.; O’Connor, A.J.; Barber, A.R.; Yoshikawa, S.; Kentish, S.E. A comparison between ceramic and polymeric membrane systems for casein concentrate manufacture. Int. J. Dairy Technol. 2010, 63, 284–289. [Google Scholar] [CrossRef]
  14. van Hekken, D.L.; Holsinger, V.H. Use of cold microfiltration to produce unique b-casein enriched milk gels. Lait 2000, 80, 69–76. [Google Scholar] [CrossRef]
  15. Barbano, D.M.; Sciancalepore, V.; Rudan, M.A. Characterization of Milk Proteins in Ultrafiltration Permeate. J. Dairy Sci. 1988, 71, 2655–2657. [Google Scholar] [CrossRef]
  16. Hurt, E.; Barbano, D.M. Processing factors that influence casein and serum protein separation by microfiltration. J. Dairy Sci. 2010, 93, 4928–4941. [Google Scholar] [CrossRef]
  17. Anema, S.G. The use of “lab-on-a-chip” microfluidic SDS electrophoresis technology for the separation and quantification of milk proteins. Int. Dairy J. 2009, 19, 198–204. [Google Scholar] [CrossRef]
  18. Salunke, P.; Marella, C.; Metzger, L.E. Use of capillary gel electrophoresis for quantification of individual milk proteins in ultra- and microfiltration retentate. J. Dairy Sci. 2011, 94 (Suppl. 1), 58. [Google Scholar]
  19. Lawrence, N.D.; Kentish, S.E.; O’Connor, A.J.; Barber, A.R.; Stevens, G.W. Microfiltration of skim milk using polymeric membranes for casein concentrate manufacture. Sep. Purif. Technol. 2008, 60, 237–244. [Google Scholar] [CrossRef]
  20. Zulewska, J.; Barbano, D.M. Influence of casein on flux and passage of serum proteins during microfiltration using polymeric spiral-wound membranes at 50 °C. J. Dairy Sci. 2013, 96, 2048–2060. [Google Scholar] [CrossRef] [PubMed]
  21. Hooi, R.; Barbano, D.M.; Bradley, R.L.; Budde, D.; Bulthaus, M.; Chettiar, M.; Lynch, J.; Reddy, R. (E. A. Arnold, Tech. Comm.) Chapter 15 Chemical and Physical Methods. Standard Methods for the Examination of Dairy Products, 17th ed.; Wehr, H.M., Frank, J.F., Eds.; American Public Health Association: Washington, DC, USA, 2004; pp. 480–510. [Google Scholar]
  22. Zhang, H.; Metzger, L.E. Non-casein nitrogen analysis of ultrafiltration and microfiltration retentate. J. Dairy Sci. 2011, 94, 2118–2125. [Google Scholar] [CrossRef] [PubMed]
  23. Amamcharla, J.K.; Metzger, L.E. Development of a rapid method for the measurement of lactose in milk using a blood glucose biosensor. J. Dairy Sci. 2011, 94, 4800–4809. [Google Scholar] [CrossRef] [PubMed]
  24. Metzger, L.E.; Barbano, D.M.; Rudan, M.A.; Kindstedt, P.S. Effect of milk pre-acidification on low fat Mozzarella cheese. I. Composition and yield. J. Dairy Sci. 2000, 83, 648–658. [Google Scholar] [CrossRef]
  25. Creamer, L.K.; Richardson, T. Anomalous behavior of bovine αs1- and β-caseins on gel electrophoresis in sodium dodecyl sulfate buffers. Arch. Biochem. Biophys. 1984, 234, 476–486. [Google Scholar] [CrossRef]
  26. Miralles, B.; Bartolomé, B.; Amigo, L.; Ramos, M. Comparison of Three Methods to Determine the Whey Protein to Total Protein Ratio in Milk. J. Dairy Sci. 2000, 83, 2759–2765. [Google Scholar] [CrossRef]
  27. Miralles, B.; Ramos, M.; Amigo, L. Influence of Proteolysis of Milk on the Whey Protein to Total Protein Ratio as Determined by Capillary Electrophoresis. J. Dairy Sci. 2003, 86, 2813–2817. [Google Scholar] [CrossRef] [Green Version]
  28. Salunke, P.; Amamcharla, J.; Metzger, L.E. Monitoring changes in the non-casein nitrogen fraction of raw milk during storage using casein/fat standardizer (CFS). J. Dairy Sci. 2010, 93 (Suppl. 1), 75. [Google Scholar]
  29. Lynch, J.M.; Barbano, D.M.; Fleming, J.R. Indirect and direct determination of the casein content of milk by Kjeldahl nitrogen analysis: Collaborative study. J. AOAC Int. 1998, 81, 763–774. [Google Scholar] [CrossRef] [Green Version]
  30. Lawrence, N.; Kentish, S.; O’Connor, A.; Stevens, G.; Barber, A. Microfiltration of skim milk for casein concentrate manufacture. Desalination 2006, 200, 305–306. [Google Scholar] [CrossRef]
  31. Pouliot, M.; Pouliot, Y.; Britten, M. On the conventional cross-flow microfiltration of skim milk for the production of native phosphocasinate. Int. Dairy J. 1996, 6, 105–111. [Google Scholar] [CrossRef]
  32. Mistry, V.V.; Hassan, H.N. Delactosed high protein powder. 1. Manufacture and composition. J. Dairy Sci. 1991, 74, 1163–1169. [Google Scholar] [CrossRef]
  33. Arunkumar, A.; Etzel, M.R. Milk Protein Concentration Using Negatively Charged Ultrafiltration Membranes. Foods 2018, 7, 134. [Google Scholar] [CrossRef] [PubMed] [Green Version]
  34. Pierre, A.; Fauquant, J.; Le Graet, Y.; Piot, M.; Maubois, J.L. Native micellar casein separation through cross flow membrane microfiltration. Préparation de phosphocaséinate natif par microfiltration sur membrane. Le Lait 1992, 72, 461–474. [Google Scholar] [CrossRef] [Green Version]
  35. Nelson, B.K.; Barbano, D.M. A microfiltration process to maximize removal of serum proteins from skim milk before cheesemaking. J. Dairy Sci. 2005, 88, 1891–1900. [Google Scholar] [CrossRef] [Green Version]
  36. Bastian, E.D.; Collinge, S.K.; Ernstrom, C.A. Ultrafiltration: Partitioning of milk constituents into permeate and retentate. J. Dairy Sci. 1991, 74, 2423–2434. [Google Scholar] [CrossRef]
  37. St-Gelais, D.; Hache, S.; Groslouis, M. Combined effects of temperature, acidification, and diafiltration on composition of skim milk retentate and permeate. J. Dairy Sci. 1992, 75, 1167–1172. [Google Scholar] [CrossRef]
  38. Adams, M.C.; Hurt, E.E.; Barbano, D.M. Effect of ceramic membrane channel geometry and uniform transmembrane pressure on limiting flux and serum protein removal during skim milk microfiltration. J. Dairy Sci. 2015, 98, 7527–7543. [Google Scholar] [CrossRef] [Green Version]
  39. Crowley, S.V.; Burlot, E.; Silva, J.V.C.; McCarthy, N.A.; Wijayanti, H.B.; Fenelon, M.A.; Kelly, A.L.; O’Mahony, J.A. Rehydration behaviour of spray-dried micellar casein concentrates produced using microfiltration of skim milk at cold or warm temperatures. Int. Dairy J. 2018, 81, 72–79. [Google Scholar] [CrossRef]
  40. Walstra, P.; Jenness, R. Dairy Chemistry and Physics; Wiley-Interscience Publication: New York, NY, USA; John Wiley & Sons, Inc.: New York, NY, USA, 1984; 467p. [Google Scholar]
  41. Fox, P.F.; McSweeney, P.L.H. Dairy Chemistry and Biochemistry; Blackie Academic & Professional (An Imprint of Chapman & Hall): London, UK, 1998; p. 478. [Google Scholar]
  42. Farrell, H.M., Jr.; Jimenez Flores, R.; Bleck, G.T.; Brown, E.M.; Butler, J.E.; Creamer, L.K.; Hicks, C.L.; Hollar, C.M.; Ng-Kwai-Hang, K.F.; Swaisgood, H.E. Nomenclature of the proteins of cows’ milk–Sixth revision. J. Dairy Sci. 2004, 87, 1641–1674. [Google Scholar] [CrossRef] [Green Version]
  43. Eigel, W.N.; Hofmann, C.J.; Chibber, B.A.K.; Tomich, J.M.; Keenan, T.W.; Metrtz, E.T. Plasmin-mediated proteolysis of casein in bovine milk. Proc. Natl. Acad. Sci. USA 1979, 76, 2244–2248. [Google Scholar] [CrossRef] [PubMed] [Green Version]
  44. Govindasamy-Lucey, S.; Jaeggi, J.J.; Johnson, M.E.; Wang, T.; Lucey, J.A. Use of cold microfiltration retentates produced with polymeric membranes for standardization of milks for manufacture of pizza cheese. J. Dairy Sci. 2007, 90, 4552–4568. [Google Scholar] [CrossRef] [PubMed] [Green Version]
  45. Pombo, A.F.W.; Boettger, D.; Loesche, K. Buffer capacity of microfiltered skim milk concentrates. Chem. Ingenieur Technik. 2012, 84, 465–474. [Google Scholar]
Figure 1. Pilot MF/UF unit set up.
Dairy 02 00029 g001
Figure 2. Average flux rate of MCC and MPC runs (n = 3). Bars depict standard error of mean.
Dairy 02 00029 g002
Figure 3. Volume reduction (VR in Liters) on feed basis during MCC and MPC run (n = 3). Bars depict standard error of mean.
Dairy 02 00029 g003
Figure 4. Capillary gel electrophoreogram of (a) PSM = pasteurized skim milk; (b) MCC-R = micellar casein concentrate retentate; (c) MPC-R = milk protein concentrate retentate; NPN = non protein nitrogen.
Dairy 02 00029 g004
Figure 5. Capillary gel electrophoreogram of (a) MCC−P = micellar casein concentrate permeate; (b) MPC−P = milk protein concentrate permeate; NPN = non protein nitrogen.
Dairy 02 00029 g005
Table 1. Mean (n = 3) composition (% by weight) of pasteurized skim milk used in each replicate during microfiltration and ultrafiltration polymeric spiral-wound membranes.
TSFatLactoseAshCaCPNCNNPNTPCNSPCN/CPSP/CPNPN/CPCN/TPSP/TPNPN/TP
PSM9.190.164.300.740.1103.280.740.193.092.550.5577.5316.645.8382.3317.676.19
SD0.140.020.070.000.000.020.000.000.020.020.000.070.050.120.030.030.13
PSM = pasteurized skim milk; TS = Total solids; CP = total nitrogen × 6.38; NCN = non casein nitrogen × 6.38; NPN = non protein nitrogen × 6.38; TP = true protein (CP − NPN); casein (CN) = CP − NCN; serum proteins (SP) = TP − casein.
Table 2. Mean (n = 3) retentate and permeate composition (% by weight) produced during microfiltration and ultrafiltration of skim milk using polymeric spiral-wound membranes.
TreatmentRetentate, % Permeate, %
TSFatLactoseAshCaCPCP/TSTSFatLactoseAshCaCPCP/TS
MF 114.63 b0.44 a0.83 b1.15 b0.328 b11.95 b81.71 a3.28 b0.03 a2.33 b0.29 b0.016 b0.32 a9.65 a
SD0.410.120.020.020.010.340.260.050.020.130.030.000.020.12
UF 217.56 a0.46 a1.85 a1.30 a0.346 a13.56 a77.18 b4.20 a0.03 a3.21 a0.34 a0.019 a0.15 b3.51 b
SD0.510.090.110.020.020.530.250.010.020.050.020.000.010.09
a,b Means within same column not sharing common superscript are significantly different (p < 0.05). TS = Total solids; CP = total nitrogen × 6.38; SD = standard deviation. 1 MF = microfiltration; 2 UF = ultrafiltration.
Table 3. Mean (n = 3) retentate (MFR 1 and UFR 2) protein content and various protein ratios (% by weight) produced during microfiltration and ultrafiltration of skim milk using polymeric spiral-wound membranes.
TreatmentNCNNPNTPCNSPCN/CPCN/TPSP/CPSP/TPNPN/CPNPN/TP
MFR0.94 b0.07 b11.89 b11.01 a0.88 b92.14 a92.62 a7.34 b7.38 b0.52 b0.53 b
SD0.080.000.340.280.080.520.560.560.560.040.04
UFR2.44 a0.11 a13.44 a11.11 a2.33 a81.99 b82.68 b17.18 a17.33 a0.83 a0.84 a
SD0.060.000.530.460.060.240.240.240.240.010.01
a,b Means within same column not sharing common superscript are significantly different (p < 0.05). CP = total nitrogen × 6.38; NCN = non-casein nitrogen × 6.38; NPN = non-protein nitrogen × 6.38; TP = true protein (CP − NPN); casein (CN) = CP − NCN; serum proteins (SP) = TP − casein; SD = standard deviation. 1 MFR= micellar casein concentrate retentate; 2 UFR = milk protein concentrate retentate.
Table 4. Mean (n = 3) permeate (MFP 1 and UFP 2) protein content and various protein ratios (% by weight) produced during a microfiltration and ultrafiltration of milk using polymeric spiral-wound membrane.
TreatmentNCNNPNTPCNSPCN/CPCN/TPSP/CPSP/TPNPN/CPNPN/TP
MFP0.29 a0.10 b0.22 a0.03 a0.19 a7.73 a11.35 b60.08 a88.65 a32.20 b47.6 b
SD0.020.000.010.000.023.262.012.392.014.664.09
UFP0.13 b0.13 a0.02 b0.02 a0.02 b10.68 a84.06 a1.98 b15.94 b87.34 a942.4 a
SD0.000.000.010.010.001.592.512.492.511.445.06
a,b Means within same column not sharing common superscript are significantly different (p < 0.05). CP = total nitrogen × 6.38; NCN = non-casein nitrogen × 6.38; NPN = non-protein nitrogen × 6.38; TP = true protein (CP − NPN); casein (CN) = CP − NCN; serum proteins (SP) = TP − casein; SD = standard deviation. 1 MFP = micellar casein concentrate permeate; 2 UFP = milk protein concentrate permeate.
Table 5. Mean (n = 3) percent removal of SP 1, ash, calcium and lactose content during microfiltration and ultrafiltration of skim milk using polymeric spiral-wound membranes.
TreatmentSPAshCalciumLactose
MF 266.14 a68.46 a40.64 a95.99 a
SD1.030.620.311.12
UF 30.73 b64.71 b37.27 b89.58 b
SD0.210.530.450.93
a,b Means within same column not sharing common superscript are significantly different (p < 0.05). 1 SP = Serum proteins = TP − casein; SD = standard deviation. 2 MF = microfiltration. 3 UF = ultrafiltration.
Table 6. Mean (n = 3) protein fractions observed in capillary gel electrophoresis of pasteurized skim milk used in each replicate during microfiltration and ultrafiltration polymeric spiral-wound membranes.
Casein 1Whey Proteins 2NPN 4 and Peptide% of All TP 5
β-CNαS1-CNαS2-CNκ-CNγ-CNα-LAβ-LGOther SP 3CNSPNPN
PSM34.2332.598.255.902.873.167.631.503.8783.8412.293.87
SD0.400.450.380.220.080.260.570.490.460.811.180.46
1 Each fraction calculated as percentage of total CN area. 2 Each fraction calculated as percentage of total SP area. 3 Others SP = peptide peaks (10–20 kD) other than α-LA and β-LG. 4 NPN = Non protein nitrogen. 5 TP = Total protein peak areas. SD = standard deviation.
Table 7. Mean (n = 3) of individual protein fractions observed in capillary gel electrophoresis of retentate (MFR 1 and UFR 2) produced during microfiltration and ultrafiltration of skim milk using polymeric spiral-wound membranes.
Treatmentβ-CNαS1-CNαS2-CNκ-CNγ-CNα-LAβ-LGOther SP 3NPN 4CNSPNPN
MFR36.78 a35.76 a9.59 a6.40 a3.72 a1.09 b3.89 b0.95 b2.03 a92.02 a5.95 b2.03 a
SD0.500.330.000.190.190.120.310.130.380.520.560.01
UFR33.71 b32.93 b8.33 b6.17 a3.22 b3.40 a8.73 a1.38 a1.96 a84.58 b13.47 a1.96 a
SD0.191.260.580.840.000.770.380.240.000.240.240.01
a,b Means within same column not sharing common superscript are significantly different (p < 0.05). 1 MFR = micellar casein concentrate retentate. 2 UFR = milk protein concentrate retentate. 3 Other SP = peptide peaks (10–20 kD) other than α-LA and β-LG. 4 NPN = Non protein nitrogen. SD = standard deviation.
Table 8. Mean (n = 3) protein fractions observed in capillary gel electrophoresis of permeate (MFP 1 and UFP 2) produced during microfiltration and ultrafiltration of skim milk using polymeric spiral-wound membranes.
TreatmentCaseinsWhey ProteinsNPN 4CN/TP 5WP/TPNPN/TP
β-CNαS1-CNαS2-CNκ-CNγ-CNα-LAβ-LGOther SP 3
MFP1.17 a0.000.000.000.0023.79 a50.03 a10.44 b14.58 b8.72 a76.70 a14.58 b
SD0.050.000.000.000.000.510.332.401.532.083.151.53
UFP0.0 b0.000.000.000.000.00 b0.00 b23.92 a76.08 a0.00 b23.92 b76.08 a
SD0.000.000.000.000.000.000.004.414.410.004.414.41
a,b Means within same column not sharing common superscript are significantly different (p < 0.05). 1 MFP = micellar casein concentrate permeate. 2 UFP = milk protein concentrate permeate. 3 Other SP = peptide peaks (10–20 kD) other than α-LA and β-LG. 4 NPN = Non protein nitrogen. 5 TP = Total protein peak areas. SD = standard deviation.
Publisher’s Note: MDPI stays neutral with regard to jurisdictional claims in published maps and institutional affiliations.

