Article

Investigation on the Impact of Degree of Hybridisation for a Fuel Cell Supercapacitor Hybrid Bus with a Fuel Cell Variation Strategy

Dept. of Mechanical Engineering, University College London, Torrington Place, London WC1E 7JE, UK
*
Author to whom correspondence should be addressed.
Submission received: 19 November 2019 / Revised: 12 December 2019 / Accepted: 17 December 2019 / Published: 19 December 2019
(This article belongs to the Special Issue Future Powertrain Technologies)

Abstract

:
This paper presents the development of a control strategy for a fuel cell and supercapacitor hybrid power system for application in a city driving bus. This aims to utilise a stable fuel cell power output during normal operation whilst allowing variations to the power output based on the supercapacitor state-of-charge. This provides flexibility to the operation of the system, protection against over-charge and under-charge of the supercapacitor and gives flexibility to the sizing of the system components. The proposed control strategy has been evaluated using validated Simulink models against real-world operating data collected from a double-decker bus operating in London. It was demonstrated that the control strategy was capable of meeting the operating power demands of the bus and that a wide range of degrees of hybridisation are viable for achieving this. Comparison between the degree of hybridisation proposed in this study and those in operational fuel cell (FC) hybrid buses was carried out. It was found that the FC size requirement and FC variation can be significantly reduced through the use of the degree of hybridisation identified in this study.

1. Introduction

The London bus network is the largest road transportation network in the UK and is an essential part of the public transportation network [1]. This, however, results in significant contributions to both Greenhouse Gas (GHG) and local pollutant emissions [2,3,4], with strategies such as the ultra-low emission zone implemented as a means of reducing these emissions through deployment of hybrid and zero emissions technologies [5]. One of the more promising potential zero emissions solutions for bus applications is the proton exchange membrane (PEM) fuel cell technology. The PEM fuel cell (which will be referred to as FC in this paper) uses hydrogen as its fuel and produces electricity and water as a waste product through an electrochemical process [6]. Hybridisation of FCs with some form of energy storage is a promising solution to solving the problems of over sizing the FC stack and the FC’s poor transient response [6]. Much work has been carried out in the field of PEM FC hybrids for vehicular applications, where hybridisation with battery and/or supercapacitor (SC) technologies has been considered. This covers FC/battery [7,8,9,10], FC/SC, and FC/battery/SC hybrids [11,12,13,14], with some examples given. The literature review that follows focuses on FC/SC hybrids as these are most relevant to the work presented here.
In the work of [15] a comparison between fuel cell hybrid configurations and Energy Storage System (ESS) technologies is presented for use in a vehicle. Of the available configurations it was found that connecting the FC and SC via DC/DC converters provides the best solution in terms of reducing the stress on the fuel cell and achieving a high hydrogen economy because of the optimal fuel cell operation. A number of examples of this configuration have been presented in the literature, such as [16,17,18,19,20,21,22,23,24]. A control strategy based on reducing the transient changes on the FC load has been developed and experimentally tested in [16]. It was shown that the developed system avoids fuel starvation of the FC whilst using the SC to meet transient power changes. In the work of [17] a control strategy based on reducing the transient response of the FC is considered. This was tested against the ECE15 EU drive cycle and performed acceptably. An energy management strategy utilising short-term future energy demand prediction was developed and tested through both simulation and experimentation in [18]. It was found that this strategy offers improved performance, owing partly to the better management of the SC for regenerative braking. Components sizing and development of a control strategy based on Pontryagin’s minimum principle has been developed with cost functions of hydrogen consumption, SC supercapacitor state-of-charge (SoC) and fuel cell durability in [19]. The control strategy maintained a fairly stable FC output but did exhibit a large range of FC outputs. An equivalent consumption minimisation strategy (ECMS) is employed to assess the sizing of system components against different driving cycles in [20]. The results suggest a significant variation to the FC output is beneficial in terms of the hydrogen consumption. In the work of [21] the energy management is achieved by using only the SC for transient responses and only the FC for stable load conditions. This however necessitates large transient changes to the FC output. In [22], a control system aimed at providing voltage regulation on the busbar, tracking of the SC reference current and asymptotic stability of the closed-loop system was developed. In the work of [23], the control strategy focused on a differential flatness control that offers a simple and effective means of reducing the transient power demand changes on the FC. In the work of [24], an interleaving technique was successfully used to improve the voltage and current control in the FC/SC hybrid system. This focussed primarily on the short-term system performance. Along with work of [25,26] that each proposed control strategies to mitigate the stress applied on the FC from a step response to the output power demand. In real world application, step response is rarely required for a vehicle application while frequent variation is often required. In the work of [27,28,29] representative duty cycles such as New European Drive Cycle (NEDC) was used to evaluate their proposed control strategies to control the FC output power. The work in the literature highlights that there are numerous methods of controlling the balance of power in a FC/SC hybrid system. Most of the proposed designs have however focussed on the short-term operation of the system and/or have also resulted in significant variations in the FC power output. The aim of the work presented here is to limit the transient response of the FC power output and to assess the possible sizing solutions for a FC/SC hybrid power plant against real-world load profiles. This approach additionally allows for the assessment of the potential for downsizing the FC stack.
The work detailed in this paper is a continuation of the research presented in [30,31,32] and further considers the evaluation of the degree of hybridisation through improvement of the control strategy. In the previous work, a FC/SC hybrid propulsion system had been developed, constructed and simulated. The FC was used as a fixed output power source to eliminate the dynamic stress applied to the FC. The SC was used to supplement the FC output power and meet the dynamic power demands. A stabilised FC control strategy was designed and demonstrated to be capable of maintaining the FC output constant while enabling the propulsion system to meet the dynamic load demands of a bus. A strategy to identify the FC output power and required SC size was proposed and shown to perform as expected, although a number of limitations of the control strategy were highlighted. These are mainly the required prior knowledge of the required FC output, the lack of flexibility and protection against over and under charge.
The limitations lead to another question. Would it be best practice to maintain the FC and boost converter power output at a predefined and constant setting throughout the entire journey? Hence, this research aims to:
  • Investigate a strategy to facilitate variation of the FC output control operation to eliminate or mitigate the identified limitations.
  • Investigate the impact of the degree of hybridisation for a FC/SC hybrid bus with the proposed control strategy.
Within this paper the outline and development of the updated control strategy is detailed. The performance of the control strategy is compared against the stabilised control strategy previously employed against real-world performance data collected from a city driving bus. Finally, an assessment of the degree of hybridisation is carried out for variations to the control strategy parameters. The novel contributions of this paper are as follows. The development of the control strategy to include protection offers novelty in its application to real-world data and the impact this has on the sizing of the system components. This highlights the viability of using SCs as the energy storage medium even for long drive cycles and for significant downsizing of the FC used. Further to this the wide range of possible sizing solutions shows the flexibility available to the designer.

2. Data Collection

Operational performance data collected from an ADL Enviro 400H diesel hybrid bus (Alexander Dennis, Larbert, UK) operating in London was used as the basis to test and compare the control strategies. This comprised of data for a whole day of operation of the bus whilst in operation on the 388-bus route, comprising roughly 18 hour of operation, as shown in Figure 1. For the purposes of this study the data collected was used to provide power profiles of the traction motor power demand upon which the control strategies could be tested. For this the data collected regarding the motor input power were used directly as the power profile and were based on the assumption that the traction motor used on the Enviro 400H would be kept the same with the proposed FC/SC hybrid system. The power profiles used to compare and assess the control strategies implemented are detailed in Table 1. The purpose of these driving cycles was to test the system under a variety of operating conditions which provide high power, low power and long duration performance requirements.

3. FC/SC Operation Strategy

The FC/SC hybrid configuration is shown in Figure 2. The originally proposed FC/SC operation strategy is to keep the FC at a constant pre-defined output power while using the SC to cover any transient power demand, as detailed in [32]. In this system the balance of power between the FC, SC and load is controlled on the common busbar linking these components. This method has been validated and tested in [31,32] and was shown to perform well under transient conditions whilst maintaining a stable busbar voltage (630 V in this case). Since the voltage is maintained at a constant value, the power balance is directly controlled by controlling the magnitude of the current and can simply be written as:
I l o a d = I f c _ o u t + I S C _ o u t
where each of the current values are defined on the 630 V busbar and Iload is the current to/from the load, Ifc_out is the current from the FC and Isc_out is the current to/from the SC. The balance of power provided by Equation (1) remains the default control for the proposed control strategy detailed in this paper. The output power of the FC and boost converter (Pfc_out) is defined as 110% of the average power requirement of the bus duty cycle (Pload) with the additional 10% included to account for the losses in the SC buck/boost converter and is maintained at a constant value. The SC was sized by considering the cumulative energy change over the course of the drive cycle, with a 20% margin over the magnitude of cumulative energy change chosen as the SC size, further details of this can be found in [32]. This strategy has been proven capable of providing a reasonable estimation of the required degree of hybridisation for a certain duty cycle. A more detailed description of the system can be found in [32]. However, the strategy has been proven to lack the flexibility required to work effectively across a range of different load profiles and offers no protection against under charge and overcharge of the SC module. To address this, a simple overcharge and undercharge protection strategy is introduced which aims to both provide protection to the energy system and provide greater operational flexibility. Whilst the protection of the system is an important consideration it is also worth considering how the presence of such a protection system will impact upon the sizing of system components.

3.1. Overcharge Protection Design

To prevent the SC overcharging, a higher threshold value (HTV) was assigned. The HTV is the threshold of the SC SoC, which when exceeded, the value of Ifc_out begins to ramp down as a means of preventing the SC from overcharging. The intent is to calculate a new Ifc_out reference (and thus a new Pfc_out) based on the SoC of the SC. The calculation for overcharge protection was carried out using the equation:
I f c _ o u t _ n e w = ( 100 S o C 100 H T V ) × I f c _ o u t
The change in Ifc_out decreases linearly with the SC SoC, such that when SC SoC reaches 100%, the value of Ifc_out is 0 A. The value of HTV of the overcharge protection was selected to be 90% SoC. Hence if the SC SoC exceeds 90% the value of Ifc_out will decrease, reducing the charging rate of the SC during charge operation and also increasing the discharge rate during discharge operation. Limiting power transients on the FC has also been proved to be very important in [33,34,35]. Hence a rate limiter was added to control the rate of change requirement applied on the FC. It takes at least 30 s at a constant rate to increase from no load power (0 kW) to full load power (85 kW) and with the same rate of change limit when power output needs to be decreased.

3.2. Undercharge Protection Design

To prevent the SC from becoming fully discharged, a lower threshold value (LTV) was assigned. In this case, the value of Ifc_out will ramp up if the SC SoC falls below the LTV and acts as a means of protecting against the SC SoC becoming depleted. The calculation for undercharge protection was carried out using the equation:
I f c _ o u t _ n e w = I f c _ o u t + ( I f c m a x I f c o u t ) × ( L T V S o C ) L T V L L
where Ifc_max is the maximum output current of the FC and boost converter can provide and is set as 120 A, amounting to a maximum power output of 76 kW (85 kW at the FC). For the initial tests, the value of the LTV is set at 60%. Additionally, a lower limit (LL) is introduced and acts as the value of the SC SoC at which Ifc_max is reached and assigned as 30%. An increased Ifc_out will charge the SC at a higher rate during charge operation and also reduce the power demand placed on the SC during discharge operation. The new Ifc_out will be increased by an amount determined by the SC SoC until Ifc_out reaches the maximum value of 120 A. A rate limiter has also been added to ensure the change in FC output is gradual.

3.3. Control Strategy Overview

The overall control strategy implemented for the hybrid system is based on a defined value of Ifc_out and the SoC of the SC. This can be summarised as follows,
{ I f c _ o u t _ n e w = I f c _ o u t + ( I f c _ m a x I f c _ o u t ) × ( L T V S o C ) L T V L L L L < S o C < L T V I f c _ o u t _ n e w = I f c _ o u t L T V < S O C < H T V I f c _ o u t _ n e w = ( 1 S O C 1 H T V ) × I f c _ o u t H T V < S O C
The basis of the strategy is to control the value of Ifc_out based on the SOC of the SC. Under normal operation the value of Ifc_out is taken as the user defined value. If the SOC is less than the LTV then Ifc_out is increased to prevent the SC from becoming depleted. The increase in Ifc_out is limited in accordance with the maximum output of the fuel cell. If the SoC is greater than the HTV, then Ifc_out decreases to prevent the SC overcharging. This will be referred to as the FC variation strategy, with the Simulink model of the hybrid system and control strategy shown in Figure 3.

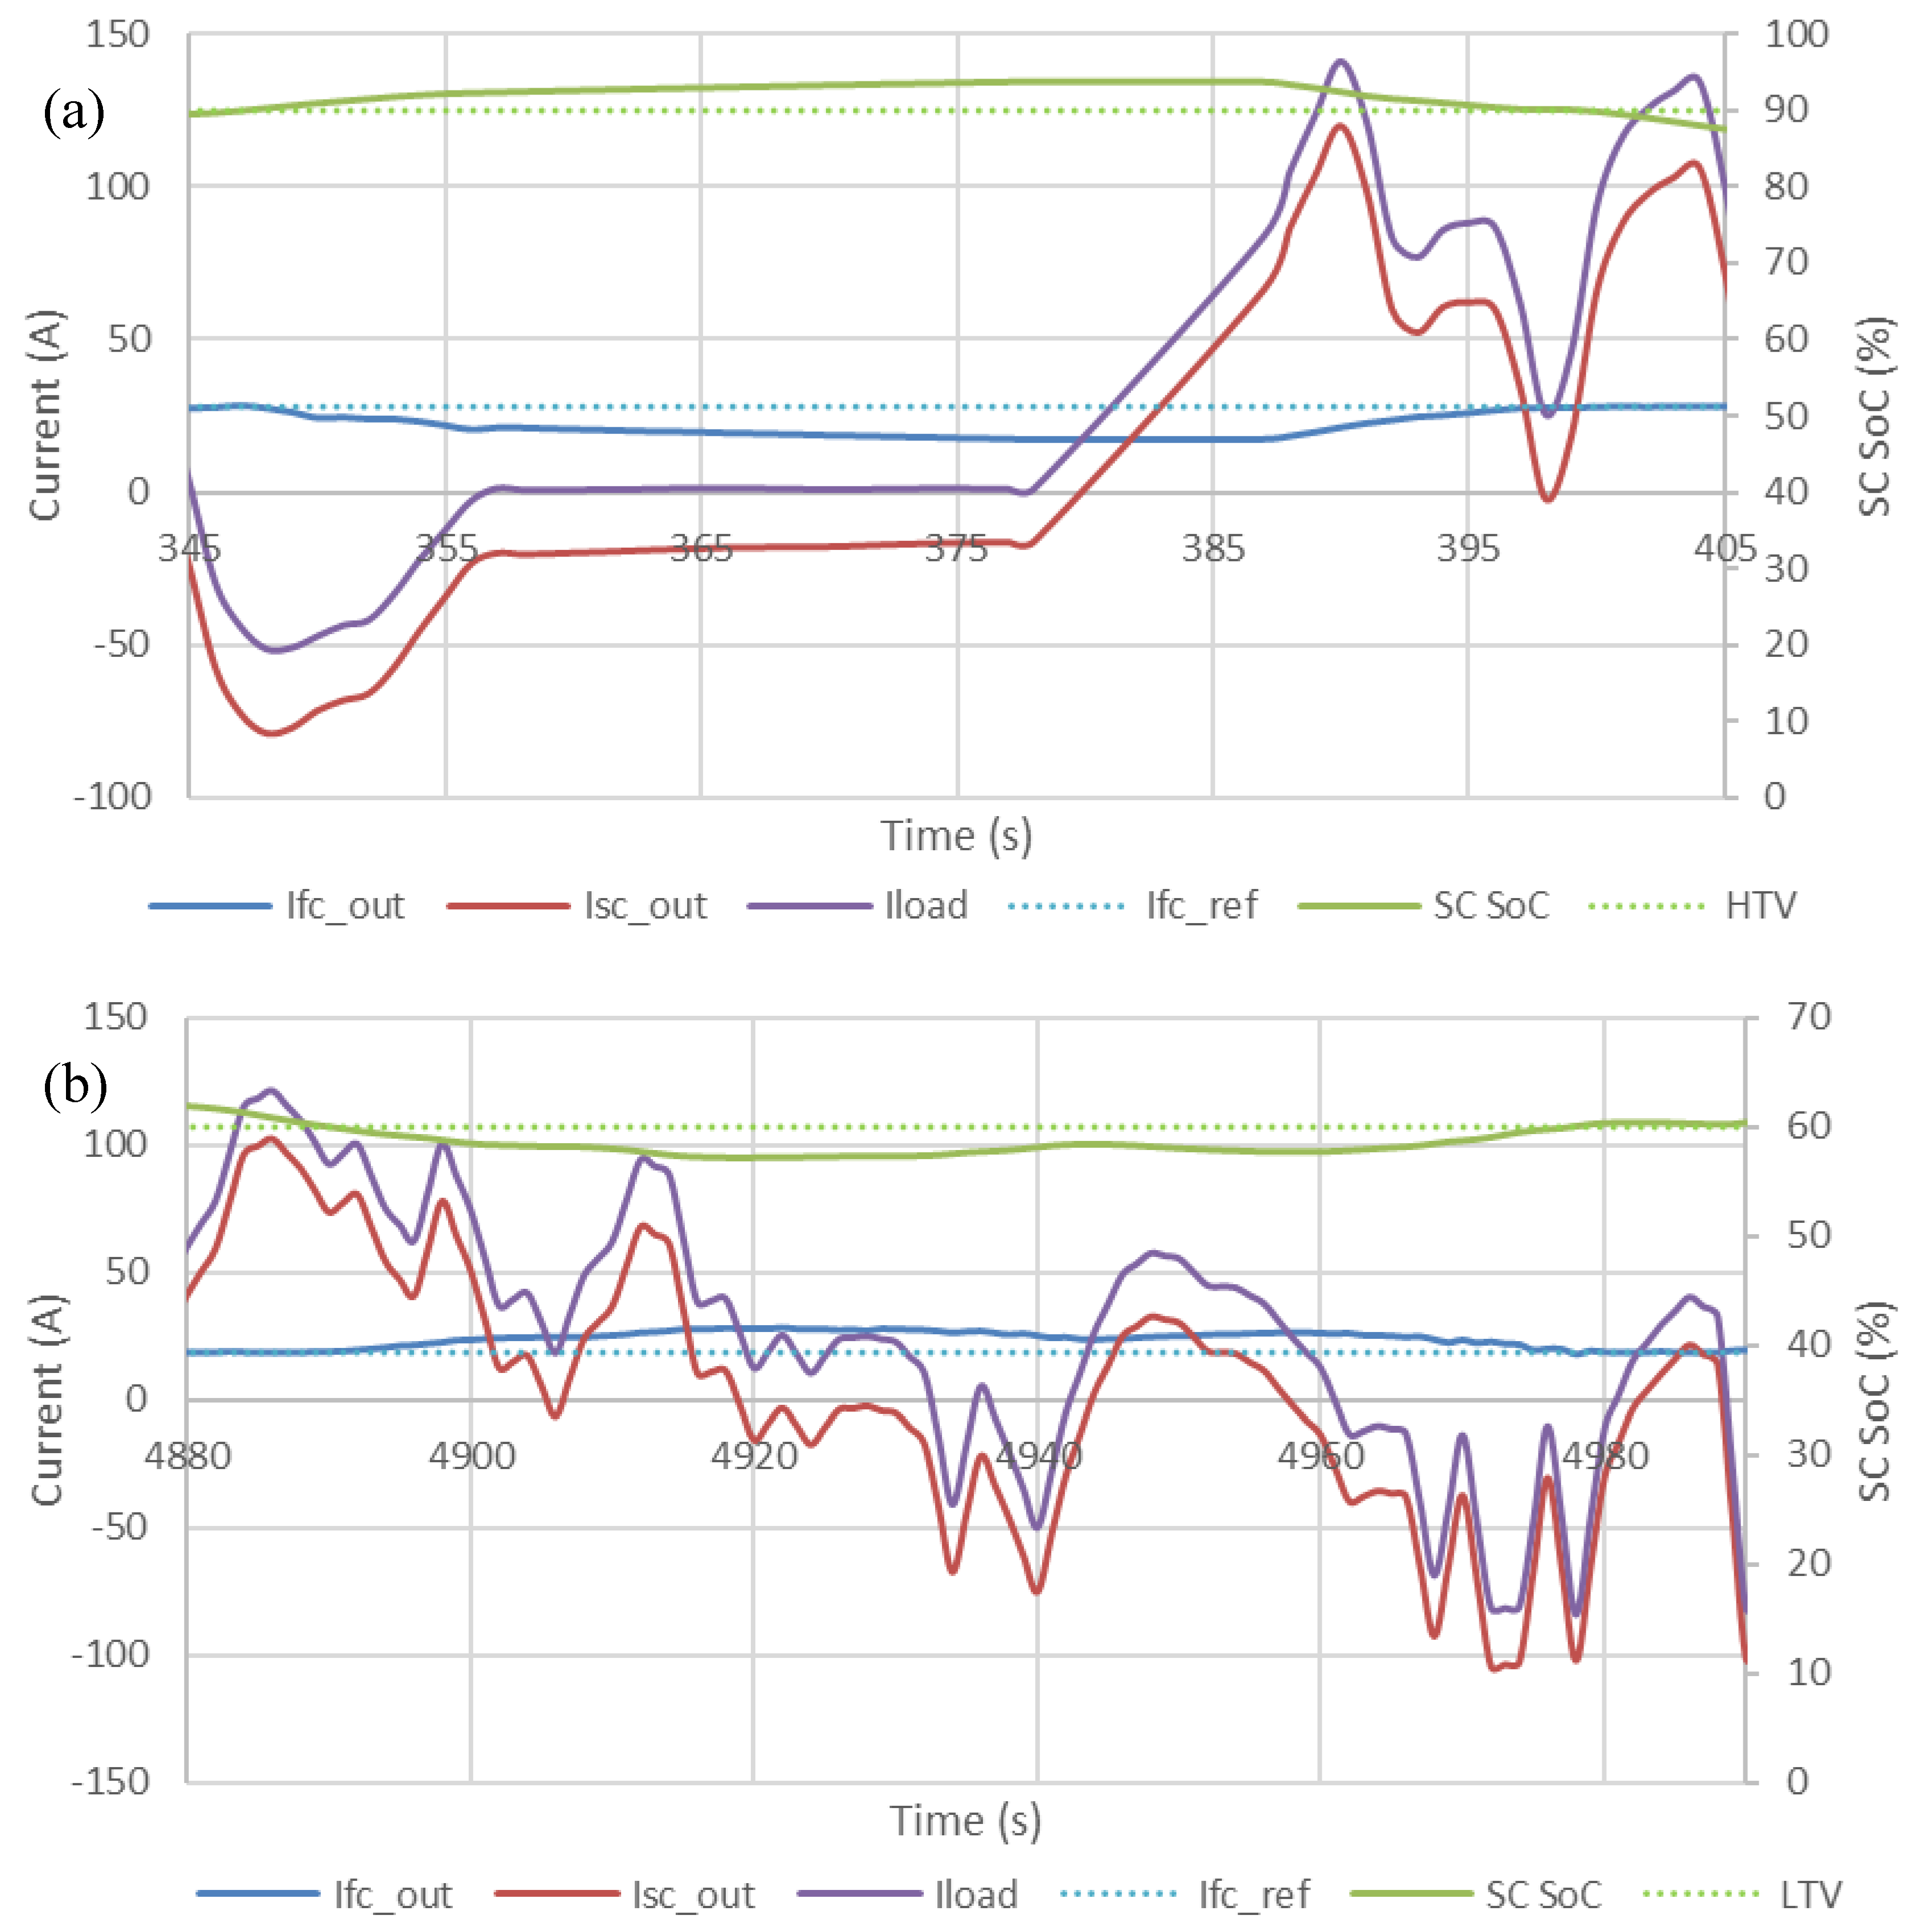
4. Performance with FC Variation Strategy

The degree of hybridisation is identified for each of the profiles detailed in Table 2, where the SC size is defined by calculating the required cumulative energy from the SC based on the duty cycle. The FC variation strategy is applied to the power profiles detailed in Table 2 and compared with the performance of the constant FC output strategy. It should be noted that the FC rated power for each of the simulations is 85 kW, however the results of the simulations determines the minimum size of FC that would be required based on the maximum output observed for each simulation.
For power profile 1 (Figure 4a), the initial FC and boost converter output power was determined to be 17.63 kW and the SC was sized at 2.08 kWh. These settings matched those used for the tests carried out previously without the FC variation strategy. The final SoC at the end of the driving cycle was reasonably close to the initial SoC when using the FC variation strategy at the same degree of hybridisation as that of the base line comparison tests without the FC variation strategy. It should also be noted that the FC and boost converter output reference was reduced a number of times between 100 s and 500 s when the SoC attained 90%. Additionally, the FC and boost converter output reference was increased multiple times to prevent undercharge triggered at the 60% threshold, particularly between 1200 s and 1380 s. The peak FC and boost converter output power is 31.52 kW for this 32-min journey. This requires a FC power output of 35 kW when a 90% average boost converter efficiency is considered. Hence the required degree of hybridisation for profile 1 (high power journey with the highest average power) would be 35 kW FC/2.08 kWh SC.
For profile 2, the bus journey with the lowest average power (Figure 4b), the initial FC and boost converter output power was set as 6.22 kW and the SC was sized at 1.41 kWh. In this scenario, the SoC of the SC at the end of the test was higher, with the FC variation strategy in operation. The FC and boost converter output was regulated depending on the SoC of the SC, with two occasions when the undercharge protection was engaged. The peak FC and boost converter output power is 26.2 kW which equates to a required FC maximum output power of 29.1 kW assuming a 90% boost converter efficiency. Hence the required degree of hybridisation for this low power journey would be 29.1 kW FC/1.41 kWh SC.
The driving cycle comprising three completed bus journeys, profile 3 (Figure 4c), used the initial FC and boost converter output power setting of 11.77 kW and a 3.97 kWh SC. As expected, the variations in SoC are identical for both the models with and without the FC variation strategy until the SoC drops to the lower threshold value. Once beyond the FC variation trigger point, the SoC was sustained at an overall higher level as would now be expected. The FC and boost converter output power setting clearly increased during the second part of this bus journey where higher power operations occurred. This results in a significant increase in the SoC of the SC at the end of the journey for the FC variation strategy. The peak power output of the FC and boost converter output power in this driving cycle is 28.7 kW which requires a FC capable of delivering up to 31.9 kW rated output power. Hence the required degree of hybridisation for this longer driving cycle is 31.9 kW FC/3.97 kWh SC. It can be seen that the calculated degrees of hybridisation for all three driving cycles functioned as expected with the inclusion of the FC variation strategy.
The strategy to identify the degree of hybridisation was validated against a number of driving cycles with the inclusion of the FC variation strategy. The model will be used to identify the required degree of hybridisation for the entire day of route 388. The average power of the entire day (without driver breaks) has been measured at 9.45 kW based on the operation power measurements. That gives the required initial FC and boost converter output power base reference as 10.39 kW. Based on the load average and FC initial power output setting, the minimum capacity for the SC was determined to be 505 F, which equates to a maximum 16.2 kWh of stored energy. The model has been tested with the entire day’s power profile (profile 4). The FC and boost converter output power and the SoC variation have been plotted in Figure 5.
It is evident that the SC was generally at low SoC having delivered large amounts of energy initially to propel the bus during the morning portion of the driving cycle and largely absorbed excess energy during the afternoon and evening portions of the driving cycle. As a result, the FC and boost converter output was increased significantly by the FC variation strategy in the morning operations and then decreased on two occasions in the afternoon and evening operations. This is because morning (rush hour) driving requires a lot of starts which are high load events and rarely will the bus attain appreciable speeds which would also compromise regenerative energy capture. It was found the average charge efficiency of the SC throughout the entire day was 82.7%, while the discharge efficiency was 90.3%. The SoC was maintained within the prescribed operational range. The proposed degree of hybridisation proved capable of delivering effective bus operation for the entire day. Since the highest power of the FC and boost converter output is 24.2 kW, this equates to a required FC power of 26.9 kW with a 90% average boost converter efficiency. Therefore, the degree of hybridisation on route 388 bus for the operating day can be identified to be 26.9 kW FC/16.2 kWh SC.
The variable FC output control strategy showed to limit the variation of the SC SoC and thus allow the system to provide for the long-term transient power demands of the bus without either depleting of over-charging the SC. It has been seen that the FC variation strategy results in significantly less variation in the SC SoC during operation, this leads to the situation where the calculated SC size can potentially be reduced by utilising the FC variation strategy. This also allows for a greater flexibility in the degree of hybridisation of the system and will now be explored.
The response of the system during over- and under-charge is highlighted in Figure 6. The over-charge and under-charge protection response is taken from profiles 1 and 3 respectively. It can be seen in Figure 6(a) that the SC SoC rises above the HTV (90%) at 346 s as a result of a regenerative braking event. This causes the value of Ifc_out to decrease. This is followed by a period with no load power requirements. During this period the FC continues to charge the SC but at a decreasing rate. At 376 s an acceleration event occurs, resulting in the SC discharging before SC SoC falls below the HTV at 396 s. During the period of over-charge protection the SC is still able to meet all of the transient demands whilst the FC output is able to slowly ramp down. Similarly, for under-charge protection (Figure 6(b)), a period of relatively high-power demand occurs at around 4885 s. This causes the SC SoC to fall below the LTV. At this point the FC output begins to ramp up, and limits the rate of discharge SC. A regenerative braking event starting at 4962 s acts to recharge the SC with the FC output ramping down as a result. The SC SoC rises above the LTV at 4978 s and coincides with the FC output returning to the reference value. Again the SC is able to meet the transient load demands whilst the FC is able to ramp slowly.

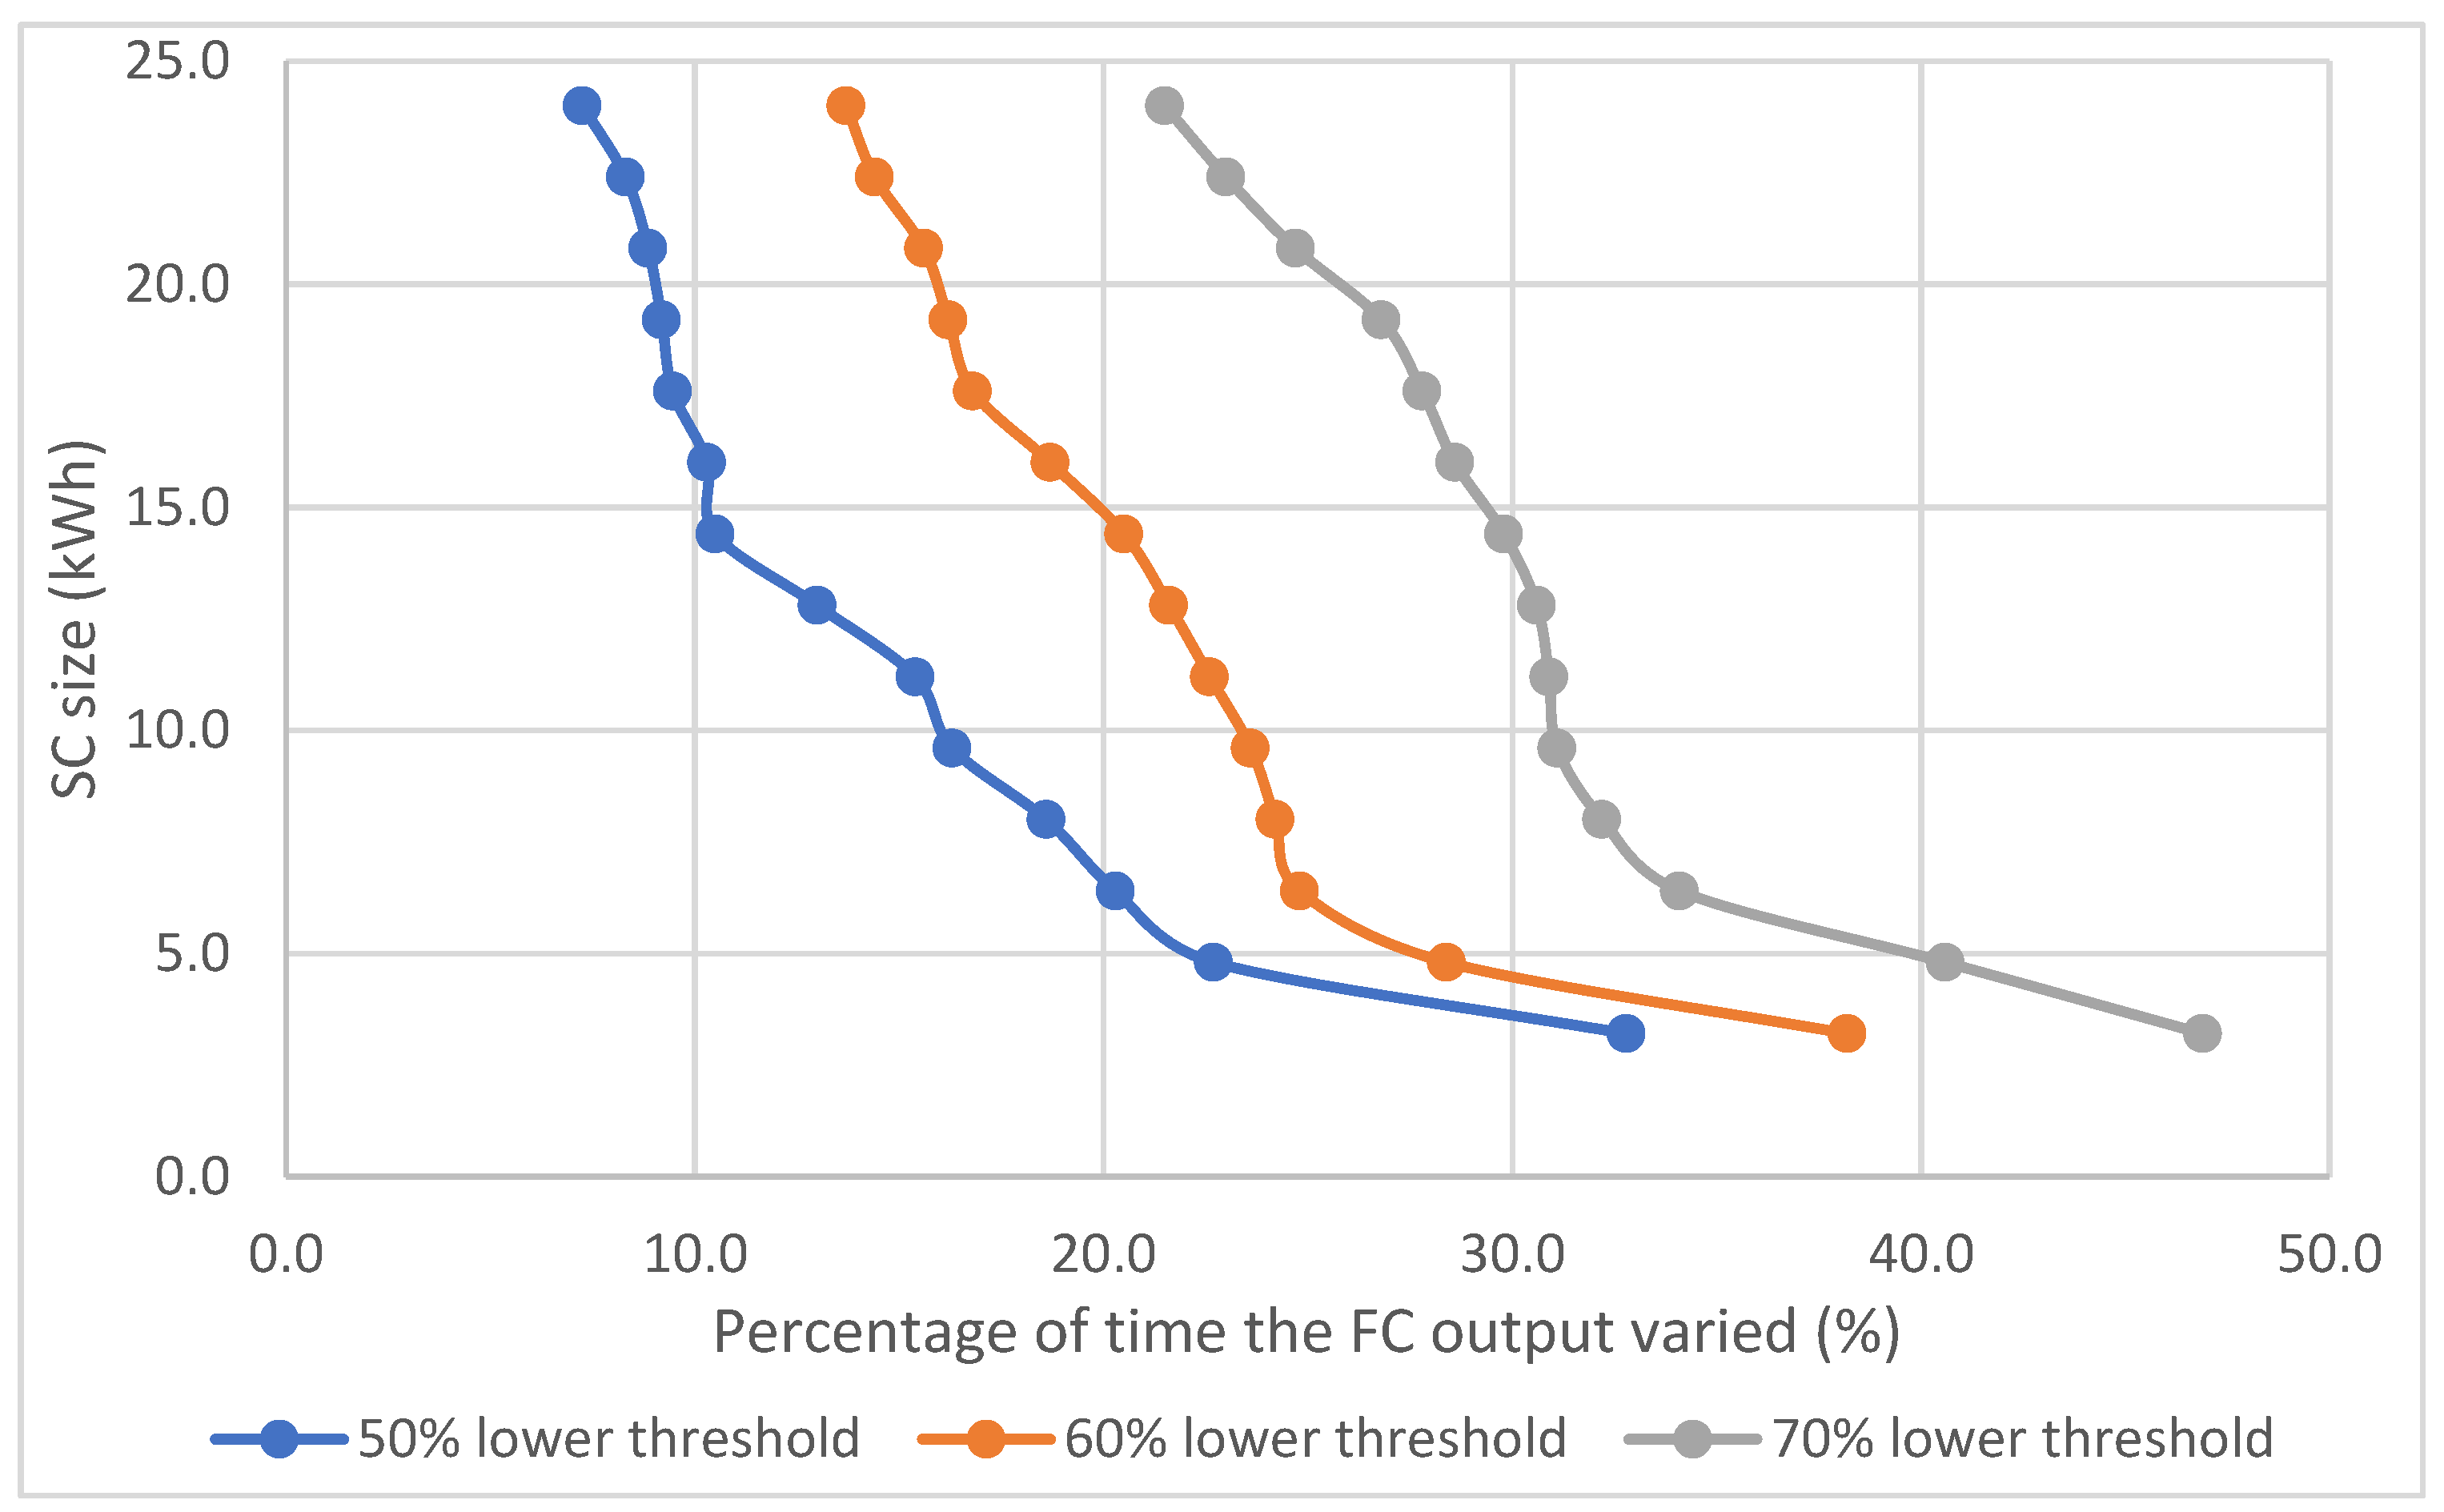
5. Degree of Hybridisation Investigation

This section aims to investigate the impact on the degree of hybridisation of the FC variation strategy and the impact that changes to the SC sizing and control strategy parameters has on this. The tests are all carried out on profile 4, the whole day operating profile on route 388, with an initial FC and boost converter output base reference (10.39 kW) utilised for the tests. The SC size utilised for the previous test for the full day driving cycle was a 505 F SC (16.2 kWh) with a 60% lower threshold undercharge protection. The same tests have been carried out with different SC sizes to investigate the impact of degree of hybridisation applied on the same driving cycle. The SC size has been decreased while running the same duty cycle simulation. The required FC power has also been determined by using the highest required power from the FC. The tests have also been run for different values of the LTV, with values of 50%, 60%, and 70% utilised to determine the impact of this on the performance of the system and resulting degree of hybridisation. Hence a degree of hybridisation ratio between the required FC size and SC size can be obtained. The obtained results have been plotted in Figure 7.
It can be seen that reducing the SC size results in an increase in the FC power required, since a smaller SC will experience quicker variations to the SoC. It was also found that further reducing the SC size beyond 3.2 kWh will cause the system to fail for this particular profile. The failure was caused by the SC SoC dropping to quickly for the FC to be able to respond sufficiently and is a result of the SC being too small to effectively act as a damper for the transient power demands of the power profile. It is clear from Figure 6 that the SC size can be reduced significantly but that this comes at the cost of a larger required FC power. Variations to the value of the LTV had a significant impact on the viable values of the degree of hybridisation of the system. It can be seen that reducing the LTV to 50% would increase the required size of both the FC and SC, whereas increasing the LTV to 70% would reduce the required size of both the FC and the SC. It has been found there is a trade-off relationship between the SC size reduction and FC size increase.
Although it has been shown that the system having the lowest required FC and SC size occurs for a lowest threshold setting at 70%, this results in more frequent adjustments to the FC output. Utilising a high value of LTV results in a change in the dynamic of the system, where the SC is acting to meet the transient demands but the change in fuel cell output varies more readily to adapt to the power profile. In the cases with the smallest SC size, this variation occurs more frequently and rapidly because of the increase in the rate of change of the SC SoC. This increase in variation comes at the cost of using the FC over a wider dynamic power band. To investigate the FC variation frequency, the percentage of time the FC output varied from the initially defined value of Ifc_out has been calculated. The results are plotted with different lower thresholds as shown in Figure 8.
It can be seen from Figure 8 that the 70% lower threshold was subject to the most FC variation for a given SC size, where the FC varied its output for nearly 47% of the day for the worst-case scenario. The variation includes the FC and boost converter output being increased to prevent SoC depletion or being decreased to prevent overcharge. It was found that the average power of the FC and boost converter output for each case is nearly the same with less than 1% variation in results. Since the net power profile of the load are the same for each of the degrees of hybridisation, varying the SC size and LTV will not affect the energy delivery to or from the SC. The minor difference is caused by the charge/ discharge efficiency and differing values of the final SC SoC. The same average FC output power also means the total energy delivered by the FC is always the same.
It can be seen that the degree of hybridisation can be optimised with respect to a number of parameters. However, there is always a trade-off relationship for the parameter that is being controlled. There will be a number of factors involved and is about finding the “best balance” amongst those factors.
All the degrees of hybridisation in Figure 7 have been shown to be capable of suitably delivering the service for a complete operating day of route 388. The three hybrid option results in minimum variation, minimum FC size and minimum SC size have been highlighted. One of these parameters can be maximised for each case, but this would also consequently change the other parameters. It can be seen selecting the degree of hybridisation is not simply finding a “best” number. The factors would depend on the requirements of the bus designer.
Finally, the degrees of hybridisation proposed for route 388 in this research were compared with other operating FC buses. All the operating buses used for comparison have been in passenger service in commercial use for a relatively long period of time and represent the majority of commercially available FC buses. Information for the operating buses in terms of FC power and energy storage system size was obtained from a number of literatures sources [36,37,38,39,40,41,42,43,44,45,46,47,48,49,50,51,52,53,54,55,56,57]. The comparison is plotted in Figure 9. The three options controlled in terms of minimum FC size, SC size and FC variation have been plotted in the FC/SC ratio plot.
From the FC point of view, it can be seen that the FC size proposed in this research is significantly smaller when compared with those for most existing FC buses. However, there is an important point that needs to be addressed for the FC size comparison. The required FC size used in the proposed degree of hybridisation are the operating power which defines the minimum rated power required from the FC. This is not necessarily the same as the rated power of the FC. Additionally, the degrees of hybridisation proposed in this research were mainly based on the driving cycle of one operating day. The driving cycle is subject to change based on a variety of factors such as season, weather and other events. Although the proposed FC variation strategy will provide some flexibility for the model to be operated under different driving cycles, the required FC size could be increased to be prepared for possible worst-case scenarios. As a result, the degrees identified in this research are more likely to be appropriate for route 388 on that day instead of for route 388 generally. Further information regarding the operating load profile on different days are needed to make an assessment of whether the operating profile collected is representative of normal operation.
From the energy storage point of view, the energy storage size proposed in this research varies over a wider range compared with those installed in existing buses. Most existing FC hybrid bus models utilise Li-ion batteries as the energy storage technology, with the exception of the WrightBus FC bus (Wrightbus, Ballymena, UK) used on the RV1 Bus route in London. The capacities of the battery used in the existing FC buses are generally larger than proposed in this research. The reason for this is the lower power density of the Li-ion batteries [58]. More batteries need to be integrated to provide for the high transient power outputs required. The SC used on the WrightBus (0.5 kWh) is significantly smaller than the proposed SC capacity in the degree of hybridisation for route 388. There are three reasons for this. First, route RV1 is a relatively flat route which was specifically selected for the FC bus demonstration. As a result, the power variations in the route RV1 in terms of magnitude and frequency are expected to be significantly smaller than for the same bus on route 388. Second, RV1 is a single decker bus while the route 388 bus is a double decker bus. This would further reduce the power demand for RV1 compared to the route 388 bus selected for this research. Third, the FC on RV1 is significantly more powerful than the FC proposed for route 388. As shown earlier this has the potential to reduce the size of the required energy storage system.

6. Conclusions

This research evaluated and investigated the control strategy for a FC/SC hybrid power system for city bus applications. This is built on a previously proposed stabilised FC output control strategy and degree of hybridisation identification strategy. Based on the limitations identified with the stabilised operating strategy, a FC variation strategy was applied that offers the facility to adjust the FC and boost converter output reference through monitoring the SC SoC. It was found that the model with the inclusion of the FC variation strategy can not only eliminate the limitations for the initial proposed operation strategy, but also bring potential benefits of further optimising the identified degree of hybridisation. A power profile of a complete day of bus operation was used to test the control strategy and explore the viable range of FC and SC sizing. It was found that the system operated as expected in terms of managing the balance of power and SC SoC throughout the bus journey. It can be concluded that the degree of hybridisation identification strategy can be used to assign an appropriate degree for any FC/SC hybrid bus system and the inclusion of the FC variation strategy is an important feature to add flexibility to power system of the bus.
It was found that there are a wide range of degrees of hybridisation that can fulfil the operating performance requirements. It was found that reducing the size of the SC resulted in the need for a larger required FC power to compensate for the increased rate of change of the SC SoC. Additionally, increasing the value of the LTV resulted in a reduction in both the FC and SC size requirements. However, a greater value of the LTV significantly increased the frequency and magnitude of the variation to the FC power output. It has been found that all of the parameters in the degree of hybridisation are interlinked. As a result, the selection of the degree of hybridisation would be dependent on the requirements of the bus designer. Three controlled degrees of hybridisation namely minimum FC size, minimum SC size and minimum FC variation have been proposed for the route 388. The proposed degrees of hybridisation have been compared with degrees of hybridisation of existing FC buses. It has been found that the FC can be significantly downsized from those used in commercial FC buses.
This research further improved the degree of hybridisation identification strategy by implementing a FC variation strategy. Although the degrees of hybridisation proposed in this research are more designed for the specific profile, the most important contribution of this research is the strategy to identify and explore the feasible degree of hybridisation options. The degree of hybridisation identification method can be applied on any other route.

Author Contributions

For research articles with several authors, a short paragraph specifying their individual contributions must be provided. The following statements should be used “conceptualization, W.W. and J.S.P.; methodology, W.W. and J.S.P.; software, W.W. and J.S.P.; validation, W.W. and J.S.P.; formal analysis, W.W. and J.S.P.; investigation, W.W. and J.S.P.; resources, W.W. and J.S.P.; data curation, W.W. and J.S.P.; writing—original draft preparation, W.W. and J.S.P.; writing—review and editing, W.W. and J.S.P.; visualization, W.W. and J.S.P.; supervision, R.B.; project administration, R.B.; funding acquisition, R.W.G.B.”, please turn to the CRediT taxonomy for the term explanation. Authorship must be limited to those who have contributed substantially to the work reported. All authors have read and agreed to the published version of the manuscript.

Funding

This research was funded by the EPSRC, grant number EP/K021192/1 as part of the HyFCaP project.

Acknowledgments

The authors would like to thank Konrad Yearwood for reviewing this work.

Conflicts of Interest

The authors declare no conflict of interest.

Abbreviations

HTVHigher threshold value of the supercapacitor SoC (%)
Ifc_inCurrent output from the Fuel Cell (A)
Ifc_outCurrent output from the boost converter on the common busbar (A)
Ifc_maxMaximum current limit of the fuel cell and boost converter (A)
Ifc_refReference value for the boost converter current output on the common busbar (A)
IloadCurrent to/from the traction motor (A)
ISC_inCurrent to/from the Supercapacitor (A)
ISC_outCurrent to/from the Buck/Boost converter on the common busbar (A)
LLLower limit of the supercapacitor State-of-charge (%)
LTVLower threshold value of the supercapacitor SoC (%)
HTVHigher threshold value of the supercapacitor SoC (%)
Pfc_outPower output from the boost converter on the common busbar (W)
PloadPower to/from the traction motor load (W)
Psc_outPower to/from the buck/boost converter on the common busbar (W)
SoCSupercapacitor state-of-charge (%)
Vfc_inVoltage across the Fuel Cell (V)
Vfc_outVoltage across the Boost converter on the busbar (V)
VloadVoltage across the traction motor controller on the busbar (V)
VSC_inVoltage across the supercapacitor (V)
VSC_outVoltage across the Buck/Boost converter on the busbar (V)

References

  1. London Assembly. London Bus Network Statistics TfL Surface Transport Buses Directorate 2016. Available online: https://www.london.gov.uk/sites/default/files/bus_network_report_final.pdf (accessed on 20 July 2019).
  2. TfL. Health, Safety and Environment Report 2014/15; Transport for London: London, UK, 2015.
  3. Anderson, D. Transport Statistics Great Britain 2015; Department for Transport: London, UK, 2015.
  4. Datastore, L. Average Air Quality in London; King’s College London: London, UK, 2019. [Google Scholar]
  5. Carrol, S. Green Fleet Technology Study for Public Transport; CENEX: Leicestershire, UK, 2015. [Google Scholar]
  6. Hoffmann, P. Tomorrow’s Energy: Hydrogen, Fuel Cells and the Prospects for a Cleaner Planet; MIT Press: Cambridge, MA, USA, 2012. [Google Scholar]
  7. Napoli, G.; Micari, S.; Dispenza, G.; Di Novo, S.; Antonucci, V.; Andaloro, L. Development of a fuel cell hybrid electric powertrain : A real case study on a Minibus application. Int. J. Hydrog. Energy 2017, 42, 28034–28047. [Google Scholar] [CrossRef]
  8. Li, J.; Hu, Z.; Xu, L.; Ouyang, M.; Fang, C.; Hu, J.; Cheng, S.; Po, H.; Zhang, W.; Jiang, H. Fuel cell system degradation analysis of a Chinese plug-in hybrid fuel cell city bus. Int. J. Hydrog. Energy 2016, 41, 15295–15310. [Google Scholar] [CrossRef]
  9. Fares, D.; Chedid, R.; Panik, F.; Karaki, S.; Jabr, R. Dynamic programming technique for optimizing fuel cell hybrid vehicles. Int. J. Hydrog. Energy 2015, 40, 7777–7790. [Google Scholar] [CrossRef]
  10. Melo, P.; Ribau, J.; Silva, C. Urban Bus Fleet Conversion to Hybrid Fuel Cell Optimal Powertrains. Procedia-Soc. Behav. Sci. 2014, 111, 692–701. [Google Scholar] [CrossRef] [Green Version]
  11. Marzougui, H.; Amari, M.; Kadri, A.; Bacha, F.; Ghouili, J. Energy management of fuel cell/battery/ultracapacitor in electrical hybrid vehicle. Int. J. Hydrog. Energy 2017, 42, 8857–8869. [Google Scholar] [CrossRef]
  12. Hames, Y.; Kaya, K.; Baltacioglu, E.; Turksoy, A. Analysis of the control strategies for fuel saving in the hydrogen fuel cell vehicles. Int. J. Hydrog. Energy 2018, 43, 10810–10821. [Google Scholar] [CrossRef]
  13. Torreglosa, J.; Garcia, P.; Fernandez, L.; Jurado, F. Predictive Control for the Energy Management of a Fuel Cell-Battery-Supercapacitor Tramway. IEEE Trans. Ind. Inform. 2013, 10. [Google Scholar] [CrossRef]
  14. Garcia, P.; Torreglosa, J.P.; Fernandez, L.M.; Jurado, F. Control strategies for high-power electric vehicles powered by hydrogen fuel cell, battery and supercapacitor. Expert Syst. Appl. 2013, 40, 4791–4804. [Google Scholar] [CrossRef]
  15. Zhao, H.; Burke, A.F. Fuel cell powered vehicles using supercapacitors-device characteristics, control strategies, and simulation results. Fuel Cells 2010, 10, 879–896. [Google Scholar] [CrossRef] [Green Version]
  16. Thounthong, P.; Raël, S.; Davat, B. Control strategy of fuel cell/supercapacitors hybrid power sources for electric vehicle. J. Power Sources 2006, 158, 806–814. [Google Scholar] [CrossRef]
  17. Behdani, A.; Naseh, M.R. Power management and nonlinear control of a fuel cell e supercapacitor hybrid automotive vehicle with working condition algorithm. Int. J. Hydrog. Energy 2017, 42, 24347–24357. [Google Scholar] [CrossRef]
  18. Roda, V.; Nigro, N.M.; Carignano, M.G.; Costa-Castell, R.; Junco, S.; Feroldi, D. Energy management strategy for fuel cell-supercapacitor hybrid vehicles based on prediction of energy demand. J. Power Sources 2017, 360. [Google Scholar] [CrossRef] [Green Version]
  19. Li, T.; Liu, H.; Zhao, D.; Wang, L. Design and analysis of a fuel cell supercapacitor hybrid construction vehicle. Int. J. Hydrog. Energy 2016, 41, 12307–12319. [Google Scholar] [CrossRef]
  20. Feroldi, D.; Carignano, M. Sizing for fuel cell/supercapacitor hybrid vehicles based on stochastic driving cycles. Appl. Energy 2016, 183, 645–658. [Google Scholar] [CrossRef]
  21. Allaoua, B.; Asnoune, K.; Mebarki, B. Energy management of PEM fuel cell/supercapacitor hybrid power sources for an electric vehicle. Int. J. Hydrog. Energy 2017, 42, 21158–21166. [Google Scholar] [CrossRef]
  22. El Fadil, H.; Giri, F.; Guerrero, J.M.; Member, S. Modeling and Nonlinear Control of a Fuel Cell/Supercapacitor Hybrid Energy Storage System for Electric Vehicles. IEEE Trans. Veh. Technol. 2014, 63, 3011–3018. [Google Scholar] [CrossRef] [Green Version]
  23. Thounthong, P.; Pierfederici, S.; Martin, J.; Hinaje, M.; Davat, B. Modeling and Control of Fuel Cell/Supercapacitor Hybrid Source Based on Differential Flatness Control. IEEE Trans. Veh. Technol. 2010, 59, 2700–2710. [Google Scholar] [CrossRef]
  24. Benyahia, N.; Denoun, H.; Zaouia, M.; Rekioua, T.; Benamrouche, N. Power system simulation of fuel cell and supercapacitor based electric vehicle using an interleaving technique. Int. J. Hydrog. Energy 2015, 40, 15806–15814. [Google Scholar] [CrossRef]
  25. Ziaeinejad, S.; Sangsefidi, Y.; Mehrizi-Sani, A. Fuel Cell-Based Auxiliary Power Unit: EMS, Sizing, and Current Estimator-Based Controller. IEEE Trans. Veh. Technol. 2016, 65, 4826–4835. [Google Scholar] [CrossRef]
  26. Geng, Z.; Hong, T.; Qi, K.; Ambrosio, J.; Gu, D. Modular regenerative emulation system for DC-DC converters in hybrid fuel cell vehicle applications. IEEE Trans. Veh. Technol. 2018, 67, 9233–9240. [Google Scholar] [CrossRef]
  27. Snoussi, J.; Elghali, S.B.; Benbouzid, M.; Mimouni, M.F. Optimal sizing of energy storage systems using frequency-separation-based energy management for fuel cell hybrid electric vehicles. IEEE Trans. Veh. Technol. 2018, 67, 9337–9346. [Google Scholar] [CrossRef]
  28. Odeim, F.; Roes, J.; Heinzel, A. Power Management Optimization of a Fuel Cell/Battery/Supercapacitor Hybrid System for Transit Bus Applications. IEEE Trans. Veh. Technol. 2016, 65, 5783–5788. [Google Scholar] [CrossRef]
  29. Depature, C.; Lhomme, W.; Sicard, P.; Bouscayrol, A.; Boulon, L. Real-Time Backstepping Control for Fuel Cell Vehicle Using Supercapacitors. IEEE Trans. Veh. Technol. 2018, 67, 306–314. [Google Scholar] [CrossRef]
  30. Wu, W.; Partridge, J.S.; Bucknall, R.W.G. Stabilised control strategy for PEM fuel cell and supercapacitor propulsion system for a city bus. Int. J. Hydrog. Energy 2018. [Google Scholar] [CrossRef]
  31. Wu, W.; Partridge, J.S.; Bucknall, R.W.G. Simulation of a stabilised control strategy for PEM fuel cell and supercapacitor hybrid propulsion system for a city bus. Int. J. Hydrog. Energy 2018, 3. [Google Scholar] [CrossRef]
  32. Wu, W.; Partridge, J.; Bucknall, R. Development and Evaluation of a Degree of Hybridisation Identification Strategy for a Fuel Cell Supercapacitor Hybrid Bus. Energies 2019, 12, 142. [Google Scholar] [CrossRef] [Green Version]
  33. O’Hayre, R.; Cha, S.-W.; Colella, W.; Prinz, F.B. Fuel Cell Fundamentals; John Wiley & Sons: Hoboken, NJ, USA, 2016. [Google Scholar]
  34. Xie, C.; Xu, X.; Bujilo, P.; Shen, D.; Zhao, H.; Quan, S. Fuel cell and lithium iron phosphate battery hybrid powertrain with an ultracapacitor bank using direct parallel structure. J. Power Sources 2015, 279, 487. [Google Scholar] [CrossRef]
  35. Barbir, F. PEM Fuel Cells Theory and Practice; Elsevier Academic Press: Cambridge, MA, USA, 2005. [Google Scholar]
  36. HyFLEET:Cute. The HyFLEET: CUTE Project Partners: Uniting for Progress; Clean Urban Transport for Europe: Ulm, Germany, 2009; pp. 1–52. [Google Scholar]
  37. Tyler, T.; Core, R.D. Present at the Fuel Cell Bus Workshop 2011, San Francisco, CA, USA, 24 February 2011.
  38. Hua, T.; Ahluwalia, R.; Eudy, L.; Singer, G.; Jermer, B.; Asselin-Miller, N.; Wessel, S.; Patterson, T.; Marcinkoski, J. Status of hydrogen fuel cell electric buses worldwide. J. Power Sources 2014, 269, 975–993. [Google Scholar] [CrossRef] [Green Version]
  39. Binder, M.; Faltenbacher, M.; Kentzler, M.; Schuckert, M. CUTE—Deliverable No. 8: Final Report; Clean Urban Transport for Europe: Ulm, Germany, 2006; pp. 1–85. [Google Scholar]
  40. London Fuel Cell Bus Trial 2007. Available online: https://www.yumpu.com/en/document/view/27649118/london-hyfleetcute-experience-international-fuel-cell-bus (accessed on 20 July 2019).
  41. Trihybus, T. TriHyBus and Triple Hybrid. 2010, pp. 1–24. Available online: www.h2fc-fair.com (accessed on 23 July 2019).
  42. Doucek, A.; Janík, L. TriHyBus: The First Fuel Cells Hydrogen Bus in New EU Countries. ESC Trans. 2011, 32, 49–53. [Google Scholar] [CrossRef]
  43. Eudy, L.; Post, M. Fuel Cell Buses in U.S. Transit Fleets : Current Status 2014; National Renewable Energy Laboratory: Golden, CO, USA, 2014.
  44. Eudy, L.; Renewable, N.; Chandler, K. National Fuel Cell Bus Program : Proterra Fuel Cell Hybrid Bus Report, Columbia Demonstration; United States. Federal Transit Administration: Washington, DC, USA, 2011.
  45. Mohrdieck, C. Next Generation Fuel Cell Technology for Passenger Cars and Buses. In Proceedings of the 24th Electric Vehicle Symposium, Stravanger, Norway, 13–16 May 2009; pp. 209–213. [Google Scholar]
  46. Eudy, L.; Chandler, K. SunLine Transit Agency Advanced Technology Fuel Cell Bus Evaluation: Fourth Results Report; National Renewable Energy Laboratory: Golden, CO, USA, 2013.
  47. Pistoria, G. Lithium-Ion Batteries, 1st ed.; Elsevier: Amsterdam, The Netherlands, 2014; ISBN 9780444595133. [Google Scholar]
  48. Slavík, J. Electric Buses in Urban Transport—The Situation and Development Trends. J. Traffic Transp. Eng. 2014, 2, 45–58. [Google Scholar]
  49. Lipman, T.E.; Gray-Stewart, A.L.; Lidicker, J. Driver Response to Hydrogen Fuel Cell Buses in a Real-World Setting. Transp. Res. Rec. 2015, 2502, 48–52. [Google Scholar] [CrossRef]
  50. Eudy, L.; Post, M. Zero Emission Bay Area (ZEBA) Fuel Cell Bus Demonstration Results : Fourth Report; NREL: Golden, CO, USA, 2015.
  51. Zaetta, R.; Madden, B. Hydrogen Fuel Cell Bus Technology State of the Art Review. 2011. Available online: http://s3.amazonaws.com/zanran_storage/nexthylights.eu/ContentPages/2481166193.pdf (accessed on 20 July 2019).
  52. Presentation of Emerging Conclusions Detailed Project’s Presentation 2014. Available online: https://www.eltis.org/sites/default/files/case-studies/documents/chic_emerging_conclusions_update_december_2014_fv.pdf (accessed on 20 July 2019).
  53. Ally, J.; Pryor, T.; Pigneri, A. The role of hydrogen in Australia’s transport energy mix. Int. J. Hydrog. Energy 2015, 40, 4426–4441. [Google Scholar] [CrossRef] [Green Version]
  54. Chandler, K.; Eudy, L. Cover Photo Credit; NREL: Golden, CO, USA, 2010.
  55. Costa, C. AC Transit Demos Three Prototype Fuel Cell Buses; NREL: Golden, CO, USA, 2006.
  56. Eudy, L.; Post, M. American Fuel Cell Bus Project Evaluation: Second Report; NREL: Golden, CO, USA, 2015.
  57. Collaborative, I.F. All Active Demonstrations. 2014. Available online: http://www.gofuelcellbus.com/index.php/project/cologne-apts (accessed on 8 June 2018).
  58. Lu, K. Materials and Energy Conversion, Harvesting and Storage; John Wiley & Sons: Hoboken, NJ, USA, 2014. [Google Scholar]
Figure 1. Profile of the real-world bus performance data of an Enviro 400H bus on the 388-bus route. (a) Bus speed, (b) traction motor power.
Vehicles 02 00001 g001
Figure 2. Schematic of the FC/supercapacitor (SC) hybrid system.
Vehicles 02 00001 g002
Figure 3. Simulink model of the proposed configuration and control structure.
Vehicles 02 00001 g003
Figure 4. Boost converter output power and supercapacitor state-of-charge (SoC) variation of different bus journeys with and without FC variation strategy for (a) journey with highest average power, (b) journey with lowest average power and (c) first three journeys of the day.
Vehicles 02 00001 g004
Figure 5. Boost converter output power and SoC variation of the entire operation day of route 388.
Vehicles 02 00001 g005
Figure 6. System response of the current to over- and under-charge protection. (a) Shows the over-charge protection during profile 1 and (b) shows the under-charge protection during profile 3.
Vehicles 02 00001 g006
Figure 7. The required FC power and SC size for the full day driving cycle with different lower thresholds.
Vehicles 02 00001 g007
Figure 8. Percentage of time the FC output varied against SC size.
Vehicles 02 00001 g008
Figure 9. Ratio comparison between route 388 degrees of hybridisation and existing FC buses.
Vehicles 02 00001 g009
Table 1. The route data used to assess the fuel cell (FC) variation control strategy.
Profile No.Average PowerDurationNotes
116.03 kW1860 sHighest power route
25.65 kW3000 sLowest power route
310.70 kW6400 sFirst three routes
49.45 kW69,100 sWhole day
Table 2. Table detailing the parameters used for each of the load profiles.
Profile No.Ifc_outPfc_outSCHTVLTV
128.0 A17.63 kW65 F (2.08 kWh)90%60%
29.9 A6.22 kW44 F (1.41 kWh)90%60%
318.7 A11.77 kW124 F (3.97 (kWh)90%60%
416.5 A10.39 kW506 F (16.2 kWh)90%60%

