Article

Simulative Assessment of Novel Parallel-Hybrid-Electric Powertrains: Consideration of Transmission System Power Losses

by
Jean-Eric Schleiffer
1,*,
Wilco van Harselaar
2,
Ye Shen
1 and
Stephan Rinderknecht
1
1
Department of Mechanical Engineering, Institute for Mechatronic Systems in Mechanical Engineering, Technische Universität Darmstadt, 64287 Darmstadt, Germany
2
Mercedes-Benz AG, Mercedesstraße 120, 70372 Stuttgart, Germany
*
Author to whom correspondence should be addressed.
Submission received: 19 December 2019 / Revised: 21 February 2020 / Accepted: 28 February 2020 / Published: 3 March 2020

Abstract

:
Transmission system power losses influence the efficiency of hybrid powertrains. Well-established parallel-hybrid-electric powertrains employ conventional transmissions that can be treated as single-input-single-output (SISO) systems. Novel parallel-hybrid-electric powertrains, which are not based on conventional transmissions, can increase the systems potential but increase the complexity as the transmission becomes a multiple-input-multiple-output (MIMO) system. For these MIMO-transmission systems, the losses can strongly depend on the selected transmission mode and on the input torques of the power sources. This paper presents a method to automatically model the power losses of such MIMO-transmission systems. This method consists of a mathematical analysis and a design analysis, and obtains the transmission power losses as a function of the selected transmission mode, the rotational speed of the wheels, and the torques of the power sources. The model includes gear meshing losses, gear churning losses, and bearing losses. Furthermore, an extended control strategy is proposed to ensure local optimality including the consideration of the multidimensional transmission power loss characteristics. A case study is presented to demonstrate the developed methods, and shows that the inclusion of the transmission losses in the powertrain model and control strategy can be considered relevant for the simulative assessment of novel parallel-hybrid-electric powertrains.

Graphical Abstract

1. Introduction

Hybrid-electric powertrains enable the combination of local emission-free driving in pure electric mode and long-distance drives using highly available liquid fuels. The design of a hybrid-electric powertrain is a problem with a very large design space, especially when the powertrain topology and the (optimal) control of the whole powertrain is taken into account [1]. Even when limiting to parallel-hybrid-electric powertrains, assessing the efficiency of these systems on a driving cycle is challenging. For such assessment, the transmission mode selection and the distribution of the wheel power request between the power sources must be controlled over the driving cycle. Furthermore, the efficiency is influenced by the transmission system power losses.
Well-established parallel-hybrid-electric powertrains are based on conventional powertrains and can be classified as P1-, P2-, P3-, or P4-hybrids [2]. In these powertrains, (sub-) transmissions can be treated as single-input-single-output (SISO) systems. Novel parallel-hybrid-electric powertrain topologies, which are not based on conventional transmissions, offer multiple distinct power flow options through the transmission. These options can increase the systems potential, but also increase the complexity as the transmission has to be treated as a multiple-input-multiple-output (MIMO) system. As opposed to SISO-transmissions, for these MIMO-transmission systems the transmission losses can be strongly dependent on the selected transmission mode and on the individual input torques of the power sources.
The dependency of the transmission system losses on the control strategy increases both the difficulty and the relevance to consider the transmission system losses for powertrain design optimization, e.g., in [3] it is shown that more available transmission ratios for the electric machine (EM) of a parallel-hybrid-electric powertrain can increase the overall efficiency of such a system. However, the potentially increasing transmission losses should be considered to validate such powertrain optimization results.
In literature related to the design or control optimization of parallel hybrid powertrains, transmission losses are often neglected or considered only for SISO-transmissions. In [4], the transmission efficiency is modeled as a function of the input speed for a P2 hybrid, to account for the increase in friction losses at higher input speeds. In [5], a series-parallel hybrid powertrain is optimized including the consideration of the transmission power losses. The transmission losses are modeled by scaling exemplary transmission efficiency maps for the transmission losses caused by power supplied from the internal combustion engine (ICE) and the EM individually. In [6], a parametric SISO-transmission power loss model is used in the context of a systematic variation of powertrain parameters for the comparison of different hybrid powertrain topologies. For modified sets of gear ratios and numbers of gear ratios, measured data sets are adapted based on empirically determined loss gradients. In that work, one example with a MIMO-transmission system is considered, for which the transmission losses are modeled as a constant efficiency. In [7], challenges of implementing transmission power loss models for MIMO-transmission systems in a simulation environment are addressed.
This paper presents a method to automatically model the power losses of MIMO-transmission systems for novel parallel-hybrid-electric powertrains. The presented method consists of a mathematical analysis and a design analysis, to obtain the transmission power losses as a function of the selected transmission mode, the rotational speed of the wheels of the vehicle and the torque of the power sources of parallel-hybrid-electric powertrains. The transmission loss model includes gear meshing losses, gear churning losses, and bearing losses. To enable the modeling of these losses, a 3D design of the transmission system is required. Therefore, an optimization-based approach to obtain an initial 3D design of the transmission is explained, although this is not the main focus of this work. Using the presented modeling method, the influence of the transmission losses on the procedure of the simulative assessment of novel parallel-hybrid-electric powertrains is explained. Therefore, an extended operating strategy is proposed to ensure local optimality including the consideration of the multidimensional transmission power loss characteristics. Furthermore, a case study is performed to demonstrate and evaluate the proposed method.
The remainder of this paper is organized as follows. In Section 2, a novel parallel hybrid powertrain is introduced, including the explanation of an optimization-based method to obtain an initial 3D design of the transmission. The proposed method to model the transmission system power losses is presented in Section 3. The implementation of the resulting characteristic power loss maps in the simulation environment and the control strategy is explained in Section 4. In Section 5, a case study is presented to evaluate the losses model and the influence of providing the losses model to the control strategy. This paper ends with a conclusion in Section 6.

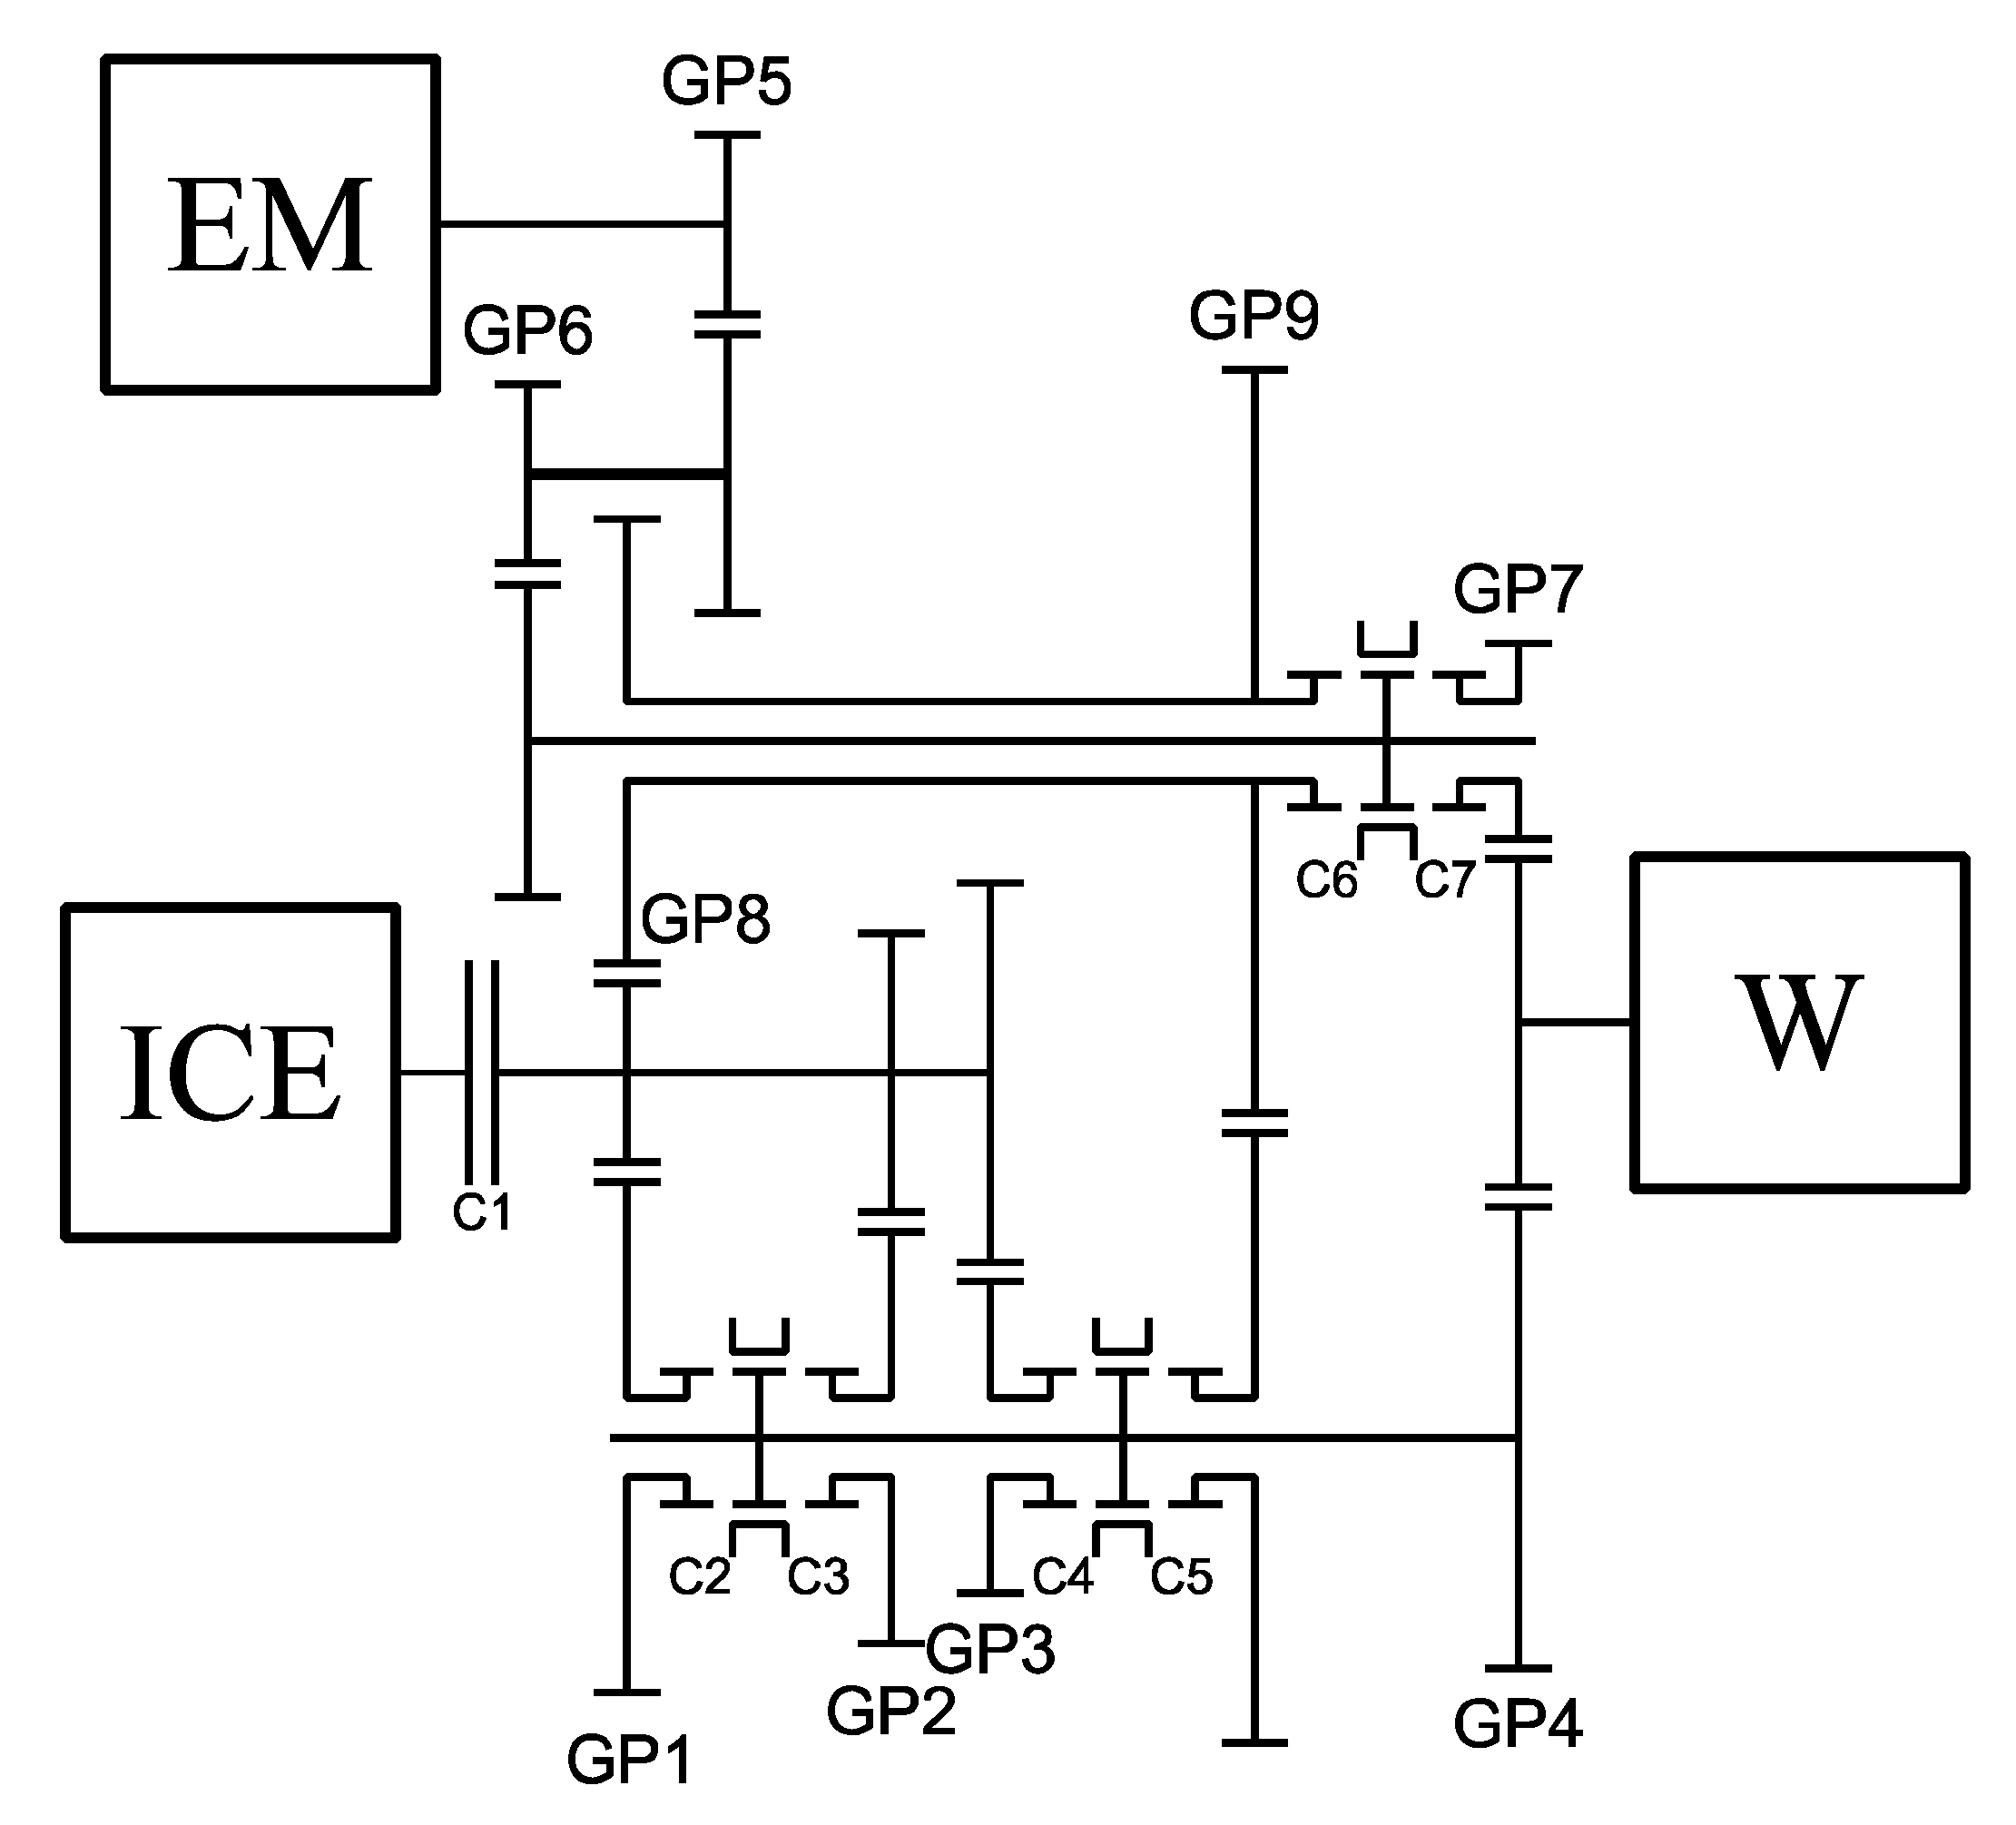
2. Novel Parallel-Hybrid-Electric Powertrain Topology

To clarify the challenges that are introduced by a novel parallel-hybrid-electric powertrain with a MIMO-transmission system, here such a system is presented. The presented system will also be used in the case study in Section 5 of this work, and is based on [8]. The system promises to combine the advantages of a P2 topology with those of a P3 topology, therefore in this paper we refer to this topology as “P2/P3”. The stick diagram of the considered system is shown in Figure 1.
The solitary electric machine EM1 can be connected to the output shaft (W) by a ratio that is used for EM traction and for taking over transmission system functionalities such as the traction force support during shift procedures of the ICE (P3 setting). By means of a shiftable dog clutch, the EM can also be connected to the input shaft of the ICE via gear pair GP8, e.g., to enable charging during standstill (P2 setting). Additionally, this connection is used to generate additional ratios for the EM, which can offer advantages especially in hybrid operation of the powertrain. These EM ratios can also be used in purely electric operation. However, challenges may arise with regard to drivability, since the associated clutch positions cannot be engaged or disengaged without torque interruptions on the output during a purely electrical operating phase. Furthermore, GP8 is used to realize the ICE reverse gear ratio.
In contrast to conventional SISO-transmissions, in this P2/P3 topology multiple power flow options are possible. Instead of the typical set of transmission ratios from the transmission input to the transmission output (represented by the wheels (W)), in MIMO-transmission systems only so-called transmission modes describe the state of the system sufficiently. These are sets of combinations of ratios from the different power sources to the wheels or to each other. Power flows from the power sources to the wheels, from the wheels to the power sources, from one power source to the other or even combinations thereof are possible. The P2/P3 topology presented in Figure 1 allows for 18 different transmission modes. Table 1 lists all transmission modes with their respective mode types and clutch positions. Additionally, the corresponding gear declarations of the power sources are given.
Table 1 shows that this topology allows for five different power flow options for pure electric operation, each with different overall ratios. In addition to the direct path in mode 8 in the P3 setting, further options are given by using the transmission part of the ICE as P2 setting by closing clutch C6. The corresponding ratios can be adjusted via the ratio of GP8. The overall ratio of the ICE reverse (mode 4) is, however, also dependent on the ratio of GP8, which is an example of the dependencies in the system that make the 3D design a challenging problem.

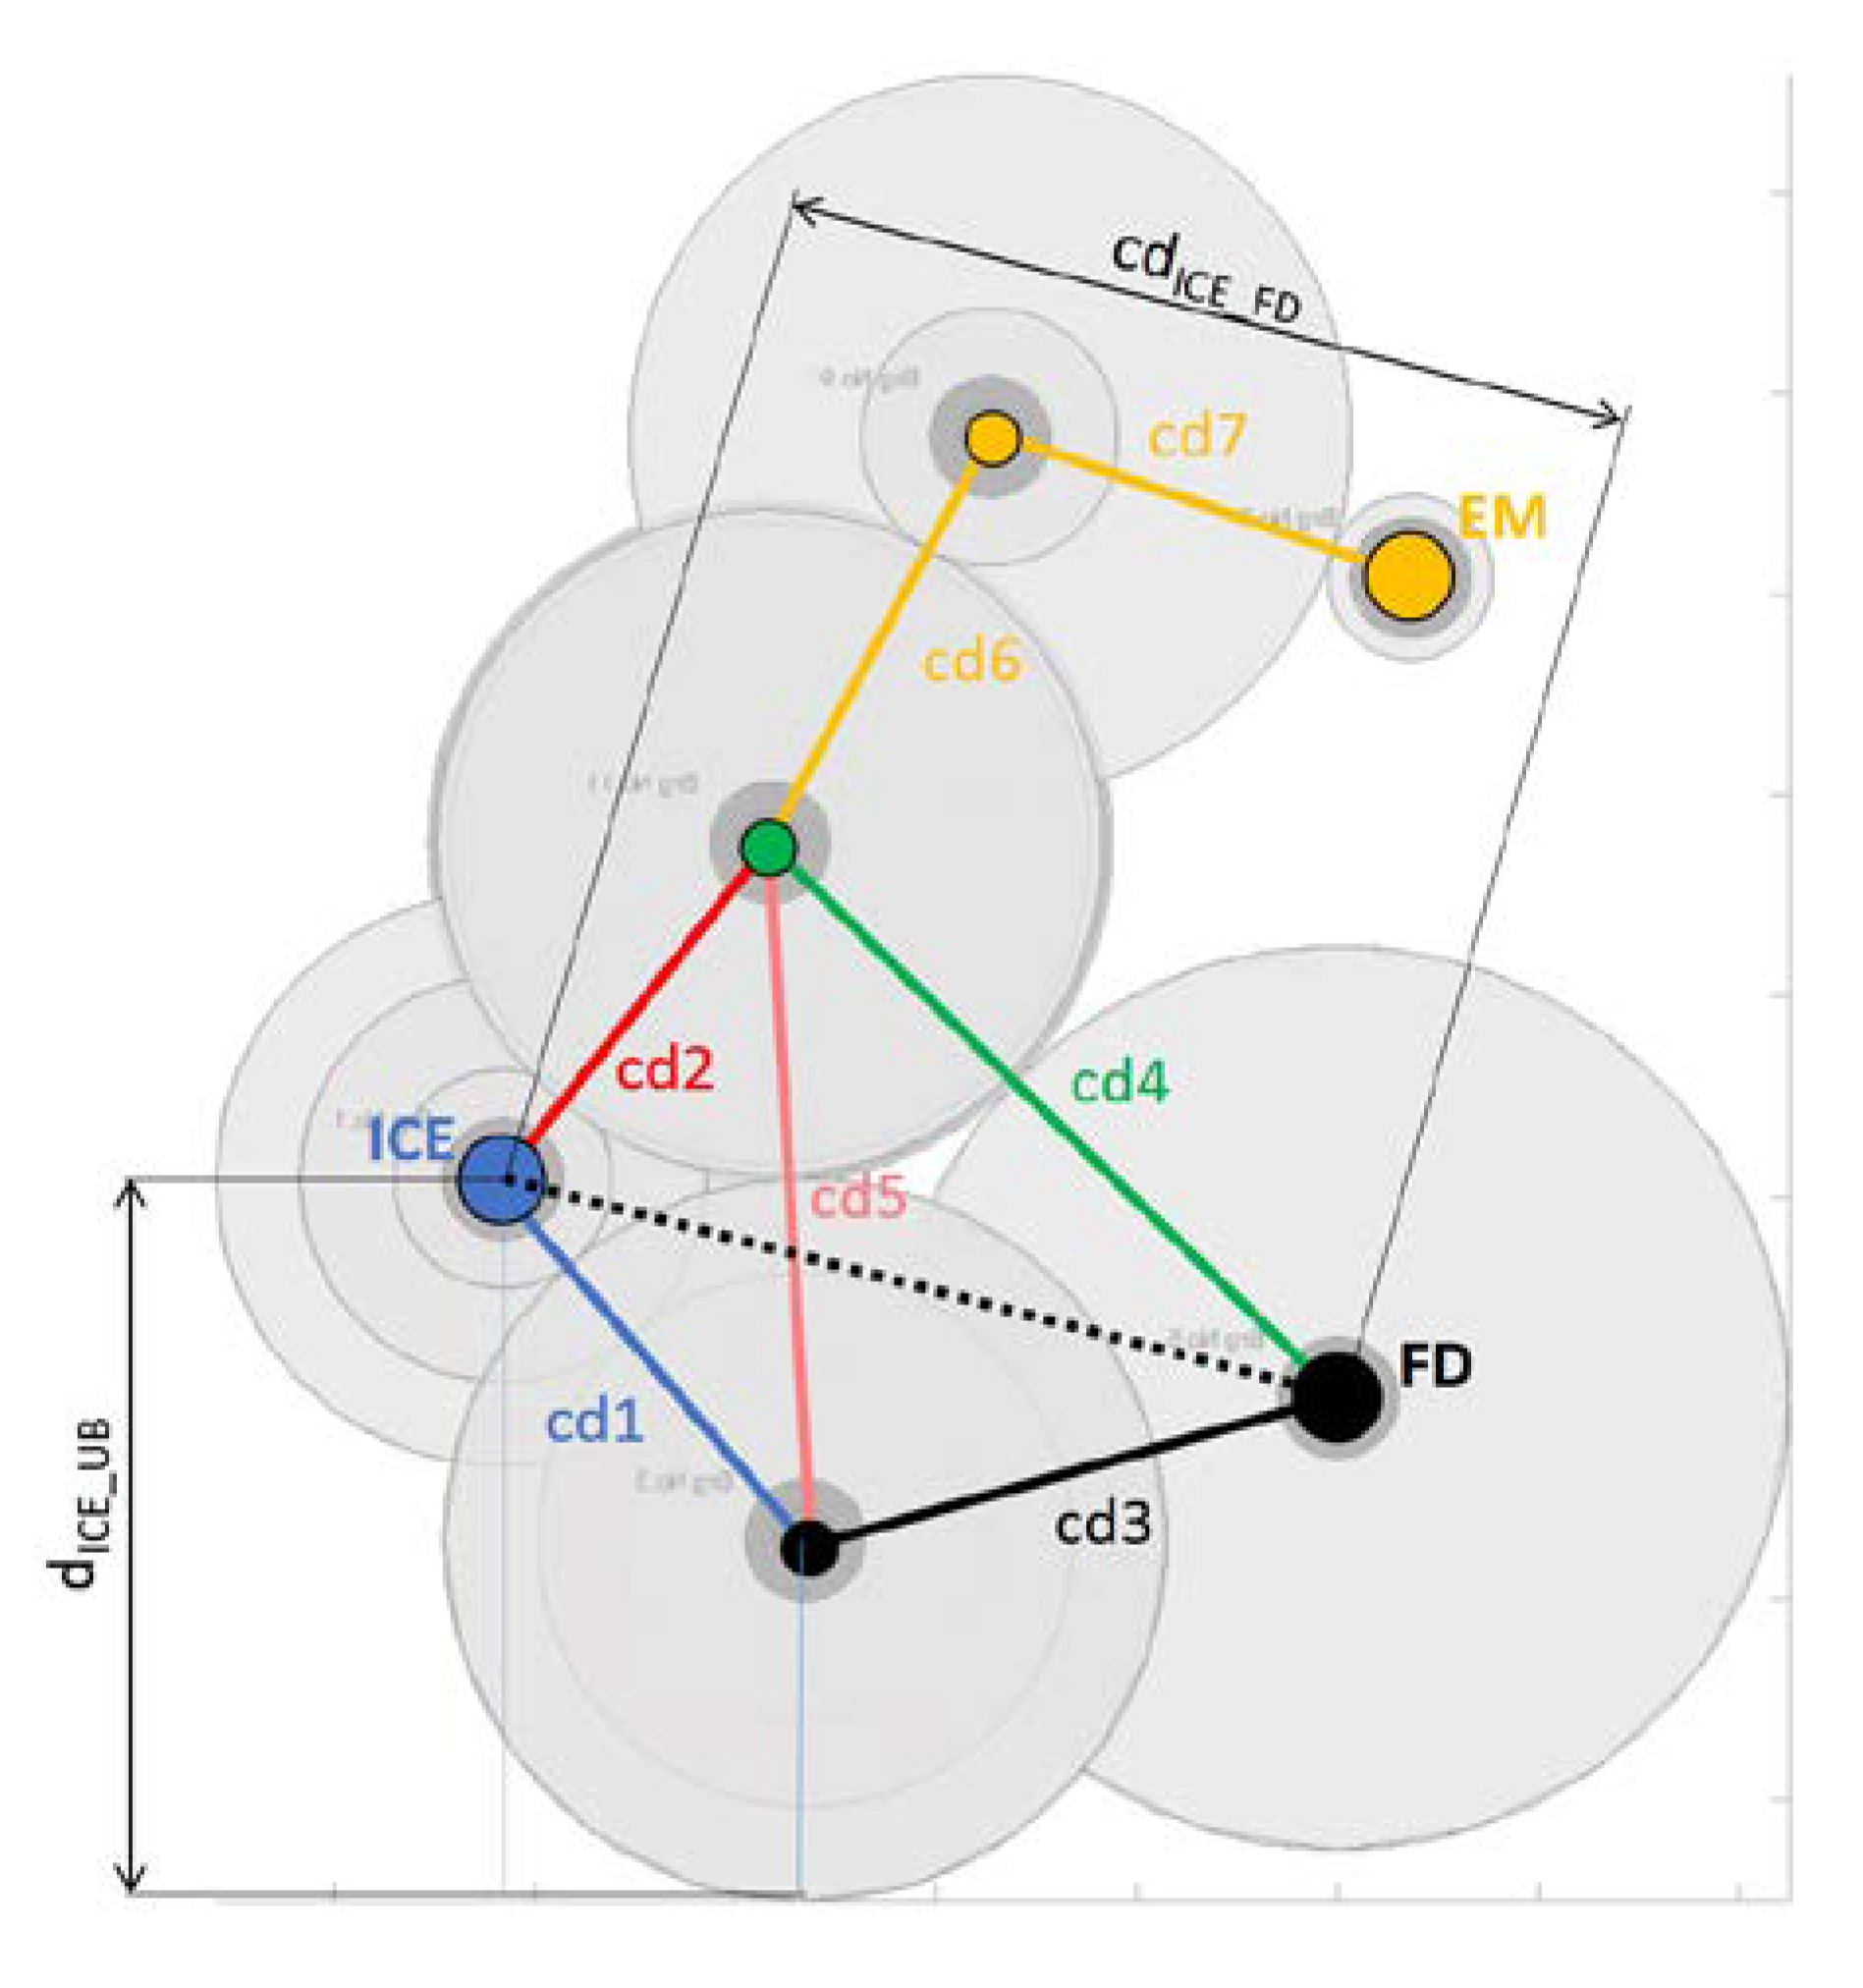
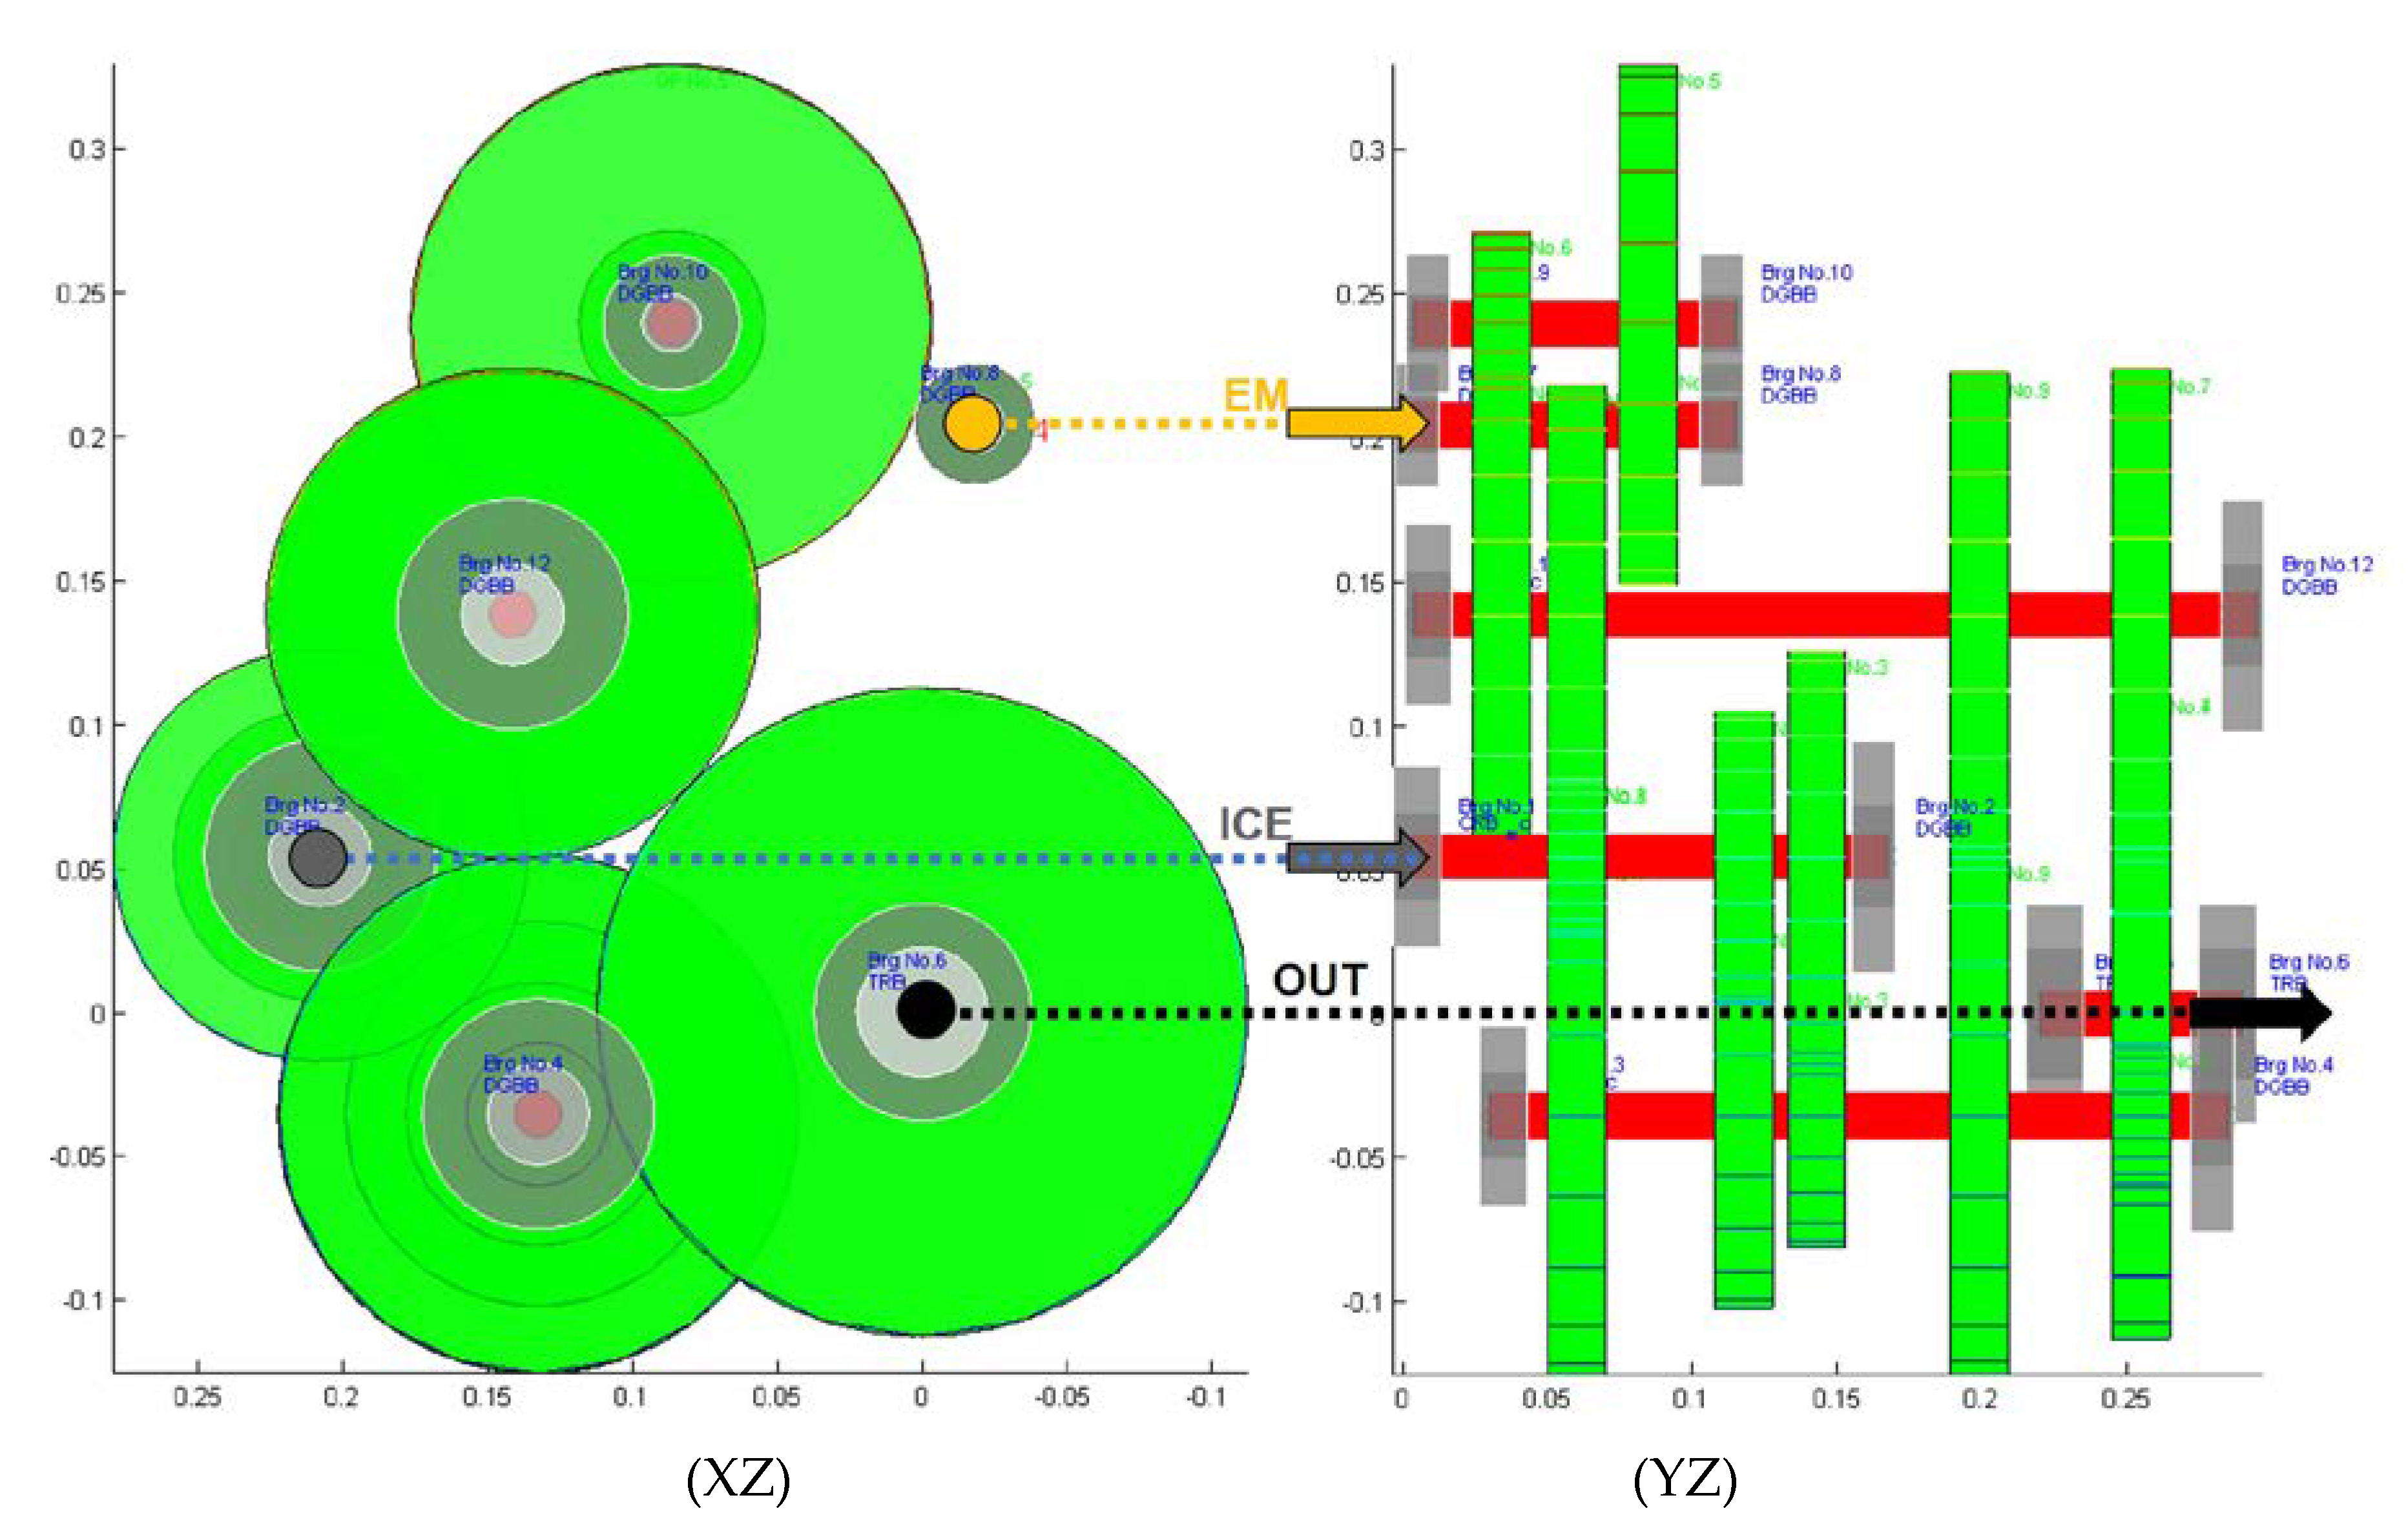
Optimization-Based Initial Draft of a 3D Design for Powertrain Topologies

In order to be able to evaluate concepts in a comparative manner, especially with regard to transmission systems power losses, the information of the stick diagram is not sufficient. For the purpose of a benchmark assessment of topologies, the concepts must be evaluated on the basis of specific installation space situation of an application case.
Design boundaries influence the possibility of realizing specific desired ratios in gear chains. The desired ratios can be obtained, for example, by a first iteration of an optimization process using the pure stick-diagram information. At this point, deviations in the assessment of a specific system can already be expected. However, losses caused by bearings, as well as churning of gears in lubricating oil, cannot be considered without information about a three-dimensional arrangement of the transmission system. Considering that these losses account for a significant proportion of the total transmission losses [9,10], a 3D design of the transmission is required to enable accurate modeling of its power losses.
Here, an optimization-based approach is presented to find the gear diameters that minimize the deviation from a set of given objective transmission ratios while satisfying geometric boundaries. The core of the geometric evaluation are the center distances. The center distance between the ICE crankshaft and final drive (FD) is predefined. Additionally, a maximum distance between the ICE and the lowest part of the transmission is defined. With this last boundary a sufficient ground clearance can be assured. As displayed in Figure 2, the center distances are dependent on multiple gear pairs of which the gear diameters have to be optimized.
The two shafts that mesh with the FD, must also mesh with each other via GP9. Furthermore, these two shafts both mesh with the shaft that is aligned with the ICE crankshaft. Considering all required meshing gear pairs between the different shafts, the permissible solution space for the 3D design is severely restricted. The gear diameters of meshing gear pairs determine the center distances between the associated shafts. The center distance between the ICE and FD, c d I C E _ F D , is fixed as a boundary, but is not directly defined by any of the gear pairs. To determine c d I C E _ F D the law of cosines is employed:
c d ICE _ FD = c d 1 2 + c d 3 2 2 c d 1 c d 3 cos ( γ 15 + γ 35 ) ,
with γ 15 as the angle between c d 1 and c d 5 :
γ 15 = a c o s ( c d 1 2 + c d 5 2 c d 2 2 2 c d 1 c d 5 ) ,
γ 35 as the angle between c d 3 and c d 5 :  
γ 35 = a c o s ( c d 3 2 + c d 5 2 c d 4 2 2 c d 3 c d 5 ) ,
and all center distances as defined in Figure 2.
In summary, the inputs to this approach are the minimum and maximum diameters of each gear, requirements for values of center distances, specific shaft locations, identities of specific center distances, as well as a set of target ratios. Within the optimization function, clearance analyses between gears and shafts, as well as gears located in the same gear plane are also performed.
After an initial analysis, an additional intermediate stage for the EM in comparison to the patent application from [8] was introduced. Therefore, the distance and relative position between EM and ICE in the XZ-plane can be varied by pivoting the EM input in relation to the added intermediate shaft and pivoting the added intermediate shaft in relation to the shaft it meshes with via GP6. Therefore, no boundary is included to fix the center distance of the EM.
Figure 3 shows an exemplary set of determined gear diameters and the corresponding geometric arrangement for a ratio parameter set of the gearset of the novel parallel-hybrid-electric powertrain topology.
Initially, neither a specific design for gear parameters (e.g., tooth numbers, helix angles, tooth module, and tooth widths), nor a verification of load capacities of the gearing is included. This should be the subject of advanced work and be based on the systematically generated information, which can be determined with the help of the automated modeling method described below.
The vision behind the described approach is to extend it to a more general, more formal geometric description of complex transmission systems in order to be able to integrate an automated design within an optimization process of powertrains under the consideration of MIMO-transmission systems power losses.

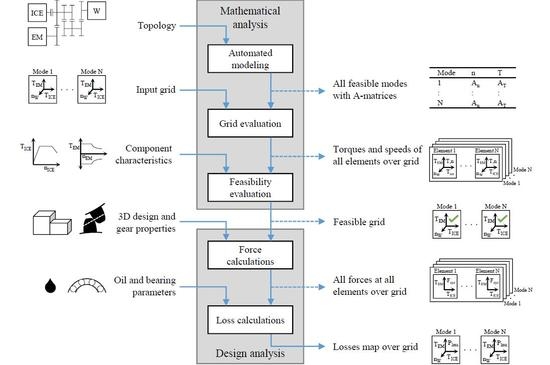
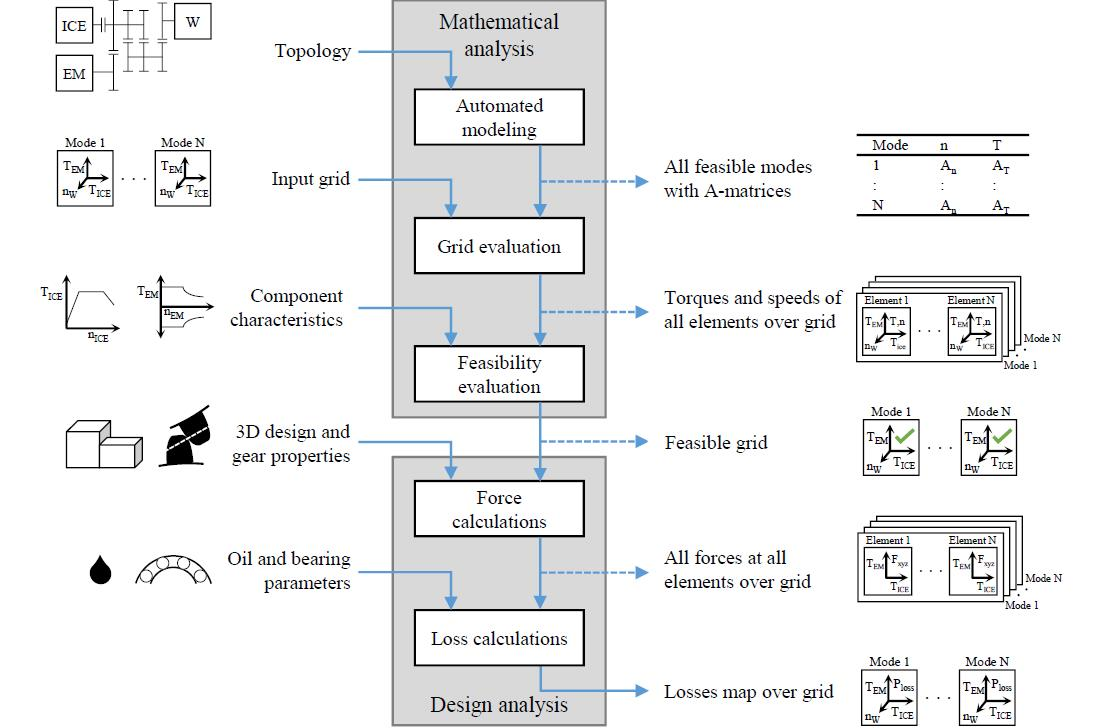
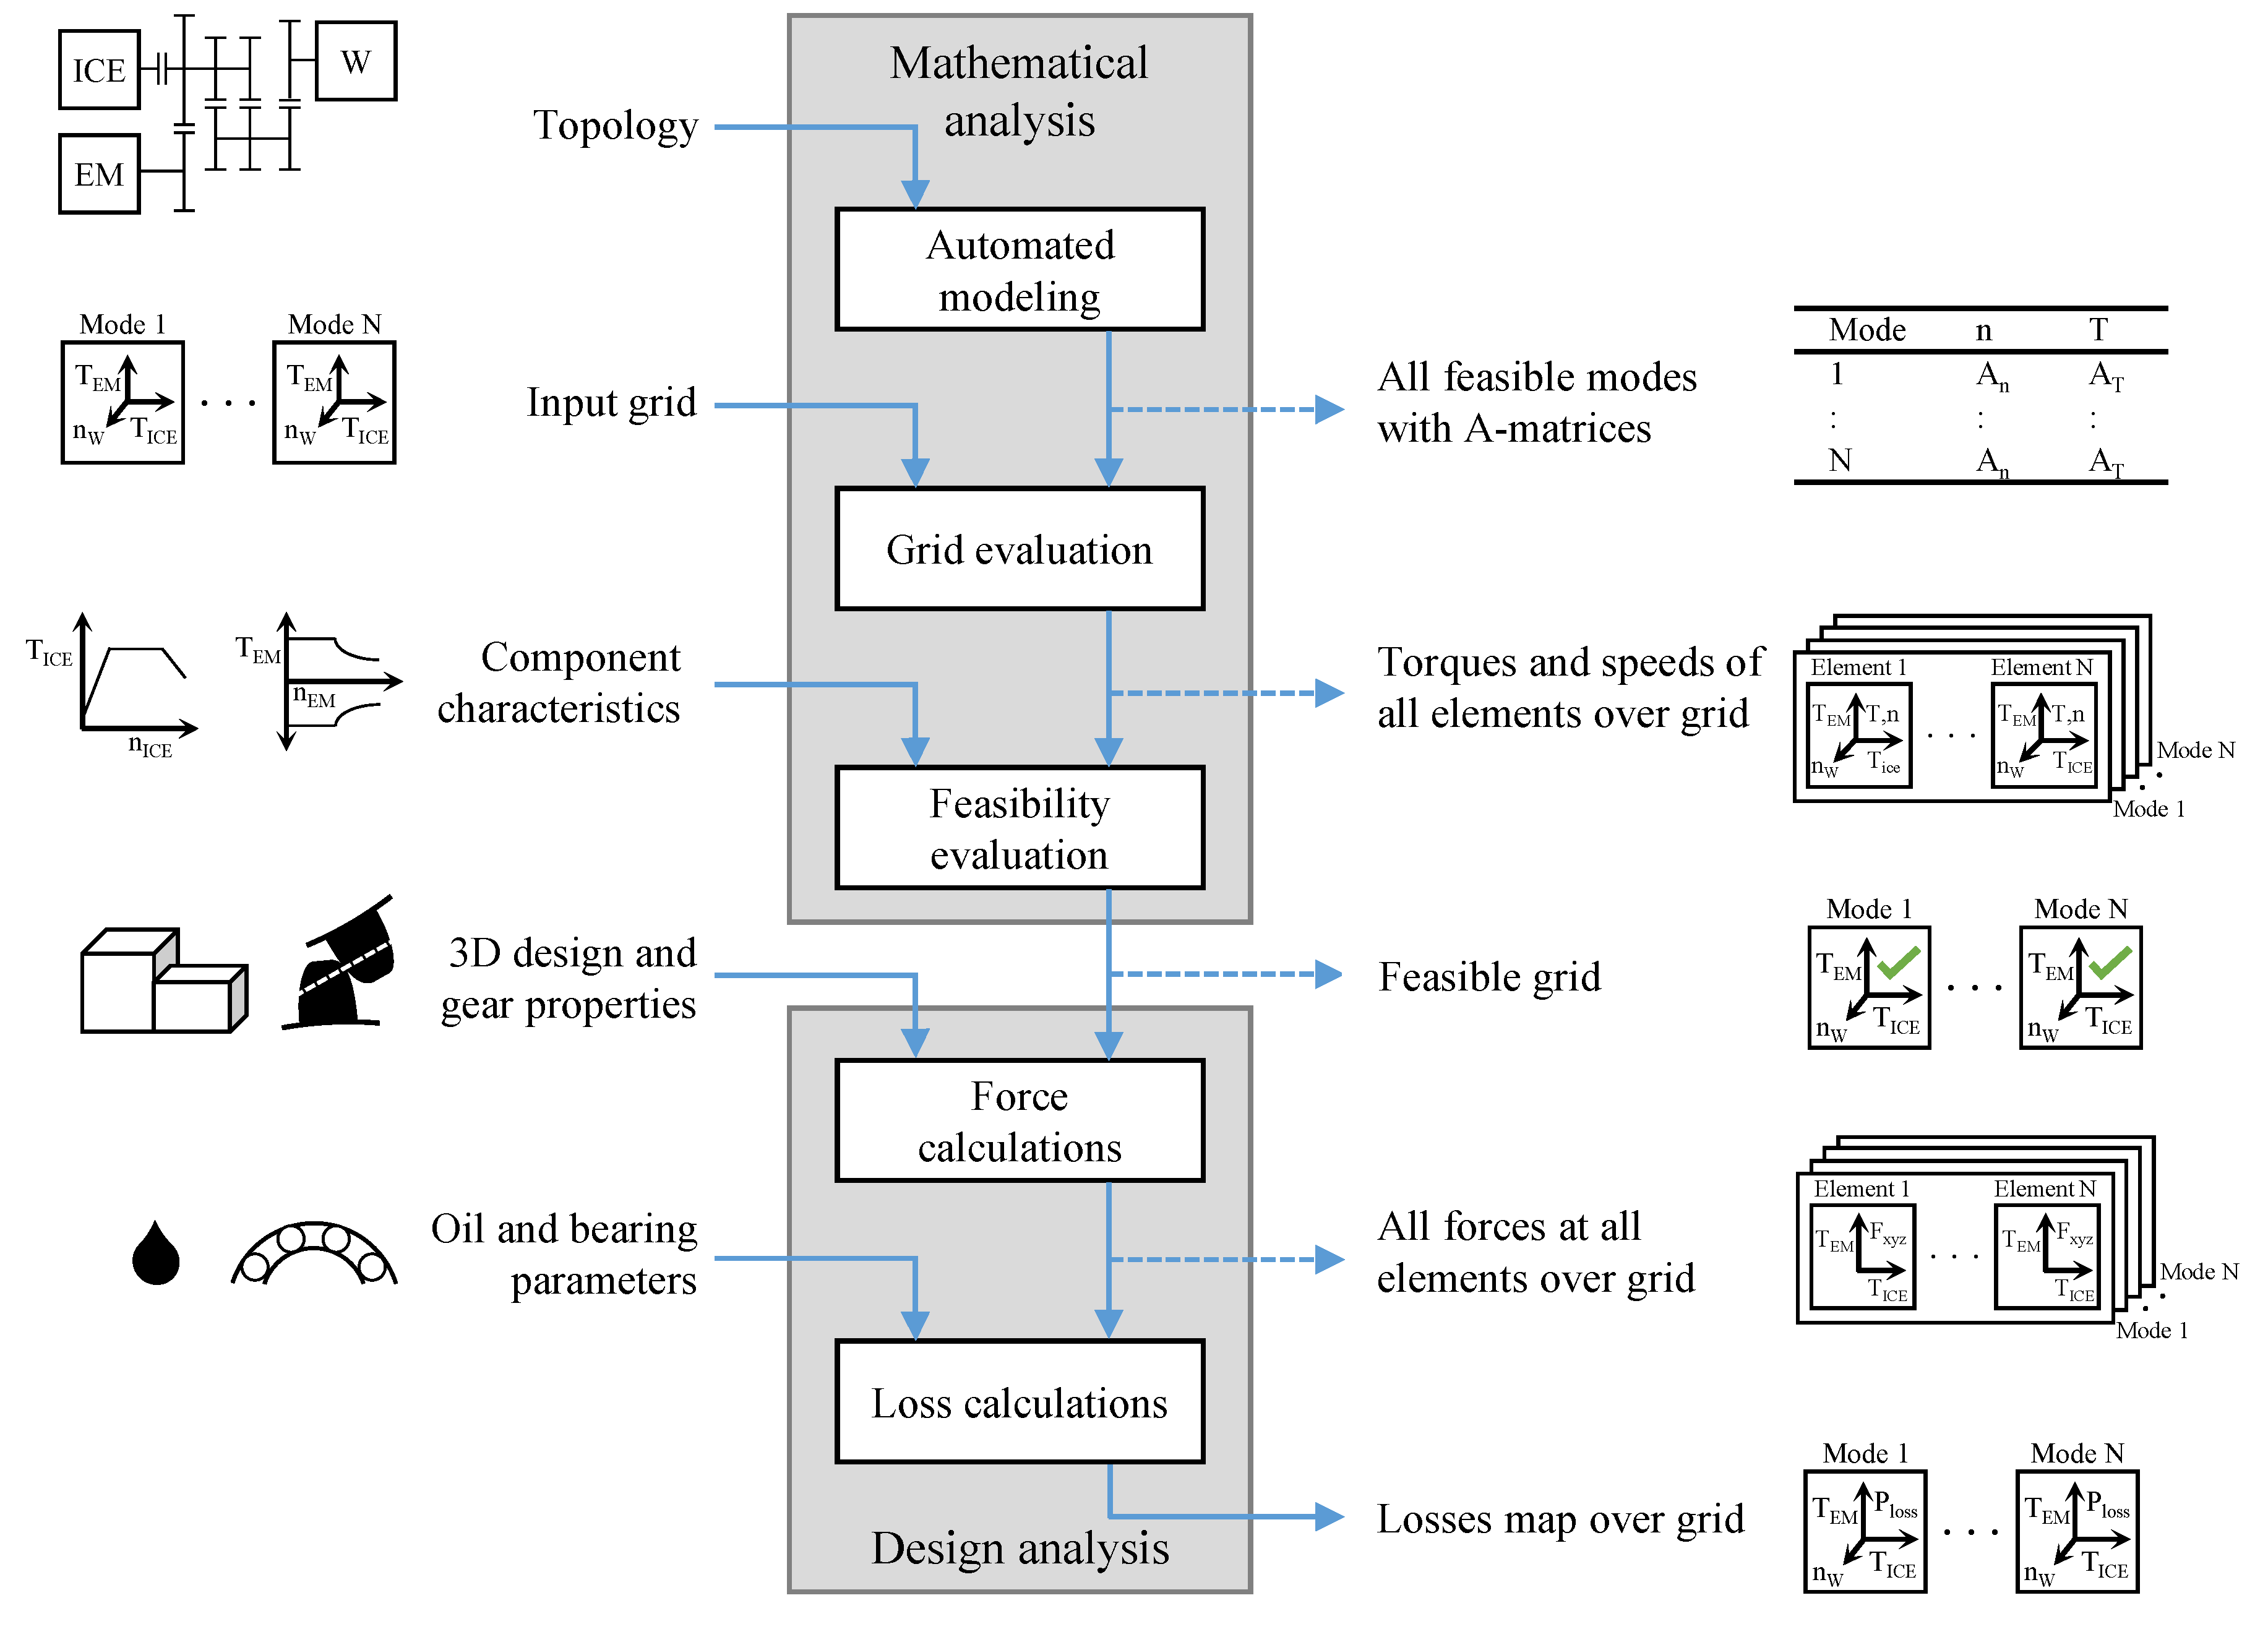
3. MIMO-Transmission Systems Power Loss Estimation Method for Novel Parallel-Hybrid-Electric Powertrains

To enable the estimation of the power losses for novel MIMO-transmission systems as introduced before, we propose a method that consists of two main steps: The mathematical analysis step and the design analysis step. In the mathematical analysis, the torques and rotational speeds of all elements of the transmission are determined in a systematic way. In the second step, these torques and speeds are used to estimate all individual power losses, which are summed up to obtain the total power losses in a map over a defined input grid. An overview of the proposed method is shown in Figure 4, below all sub-steps are explained in detail.
Figure 4 shows that the mathematical and design analyses consist of three and two sub-steps, respectively. Each sub-step needs additional input, which means that the required level of detail of the powertrain design increases along the process.
For example, at the connection from mathematical analysis to design analysis, additional information about the 3D arrangement of the components is required, which is not yet required for the mathematical correlations of the speeds and torques of the elements of the transmission system.

3.1. Mathematical Analysis of General Hybrid-Electric Powertrain Topologies

To enable the estimation of the power losses of hybrid-electric transmission systems, the torques and speeds of all components of the transmission must be known. Here, a systematic method to determine the torques and speeds of all transmission elements is presented.

3.1.1. Automated Modeling

The input for the proposed method is a powertrain topology defined by the presence of components and mechanical connections between these components. A topology can be visually represented by a stick diagram, as in Figure 1. The first step of the mathematical analysis is to obtain all feasible and nonredundant transmission modes of the powertrain. This is done by constructing linear sets of kinematic and kinetic equations for all clutch combinations. The sets of equations are defined and handled using A n and A T matrices to satisfy:
A n n = 0
  A T T = 0  
where n and T are the vectors containing the rotational speeds and torques, respectively, of all elements of the powertrain. Matrices A n and A T are complemented with equations, i.e., extra rows, to exclude nonfunctional control decision variables. The resulting sets of equations are then used to identify mechanical connections and determine the number of kinematic and kinetic control decision variables. For infeasible modes the only solution for Equation (4) is n = 0 . This property is used to identify and exclude infeasible modes. The remaining transmission modes are classified, after which redundant modes are identified and excluded. The result is the set of feasible and nonredundant transmission modes of the topology. This method for the automated modeling of arbitrary hybrid and electric powertrains is explained in detail in [11]. For all the resulting modes the kinematic and kinetic relations of all elements are defined by the A n and A T matrices, which are used in the grid and feasibility evaluations.

3.1.2. Grid Evaluation

To enable the consideration of transmission losses in the simulative assessment of powertrains, the transmission losses will be determined over a discrete grid that defines the kinematic and kinetic degrees of freedom of the system. In the grid evaluation sub-step, the rotational speeds and ideal torques of all elements are determined over the defined grid. From this point onwards the presented method is limited to powertrain topologies with one ICE, one EM, and which only enable fixed gear transmission modes. However, this method can be extended to enable the simulative assessment with consideration of transmission losses of topologies with more power sources and which enable EVT modes. This extension would make the types of the degrees of freedom mode dependent, and would increase the number of dimensions of the input grid and the resulting power loss maps.
The grid is an input to the proposed method and contains four dimensions: The torque of the ICE, the torque of the EM, the rotational speed of the wheels, and the transmission mode. These quantities define the kinematics and kinetics of the complete system, given that only fixed gear transmission modes are enabled. To determine the rotational speeds of all elements, a row can be added to A n to define n W , after which the rotational speeds are found by solving:
n = A n [ 0 n W ] T
with A the pseudo inverse of A . A more efficient method is to determine the vector with the transmission ratios from the wheels to all other elements:
i W = n n W
as defined in [11]. Using vector i W the rotational speeds of all elements can be determined with one operation per mode, i.e., for the complete grid in all other dimensions than the mode.
To determine the torques of all elements as a function of the transmission mode, the ICE torque, and the EM torque, the A T matrix of the mode is reduced by the columns that correspond to the ICE and EM elements to obtain A T , red ICE , EM . The two columns that A T is reduced by form the new matrix A T , ICE , EM . Vector T is reduced by T ICE and T EM to obtain T red ICE , EM , of which the values are found by solving:
T red ICE , EM = A T , red ICE , EM A T , ICE , EM [ T ICE T EM ] T .
Note that the found torque values are ideal torques that are not subject to the occurring transmission losses in the system. These ideal torques will be used to determine the transmission losses. Using torques that are corrected for transmission losses to determine these losses would require a computationally demanding iterative process, which is not implemented in the presented work.

3.1.3. Feasibility Evaluation

The four-dimensional input grid over which the losses are determined contains a significant amount of grid points that are infeasible for the power sources. To prevent the transmission losses being calculated for these infeasible points, the feasibility of every grid point is determined using the rotational speeds and torques determined in the previous sub-step. For this feasibility evaluation, the maximum speed and torque data of the power sources is required as an additional input, as displayed in Figure 4. Note that the feasibility evaluation is not mandatory for the presented method, but that it does reduce the computational effort of the transmission power losses calculation presented in the next section.

3.2. Design Analysis: Transmission Power Loss Calculation

The results of the mathematical analysis are inputs to the design analysis, which is presented in this section. The result of the design analysis are the transmission losses over the previously defined grid.

3.2.1. Force Calculations

As displayed in Figure 4, the first step of the design analysis are the force calculations. How the resulting forces are used to determine the power losses of the transmission systems is explained in the next paragraph. In addition to the results of the mathematical analysis, a 3D design of the transmission and the gear properties are required inputs. First, over each grid point for each gear pair, the ideal torques on each gear are resolved into the gear tangential force F T , radial force F R and axial force FA:
F T = T r g
  F R = F T tan ( α ) cos ( β )  
  F A = F T tan ( β )
with ideal torque T   , gear radius r g , pressure angle α , and gear helical angle β . Subsequently, for each gear the three gear forces F T , F R , and F A are converted to the coordinate system of the 3D design to obtain the forces in radial x-direction, radial y-direction, and axial z-direction. For each gear, also the moments of these forces with respect to the origin of the shaft are determined. For each shaft, the forces and moments of all gears on that shaft are summed and concatenated to a column vector:
v g = [ Σ F g , x Σ F g , y Σ F g , z Σ M g , x Σ M g , y Σ M g , z ] T
with forces F , moments M , subscript g for gears, and subscripts x , y , and z for the directions in the coordinate system of the 3D design. In the used modeling method, each shaft has two bearings. Both bearings can have radial loads, in the case of bearing b 1 these are denoted F b 1 , x and F b 1 , y , respectively. Yet, only one bearing per shaft can have an axial load, so one of the two forces F b 1 , z and F b 2 , z is always zero. At this point, which of the two bearings can have an axial load is still flexible. Per shaft, a vector is defined with the three forces of both bearings:
v b = [ F b 1 , x F b 1 , y F b 1 , z F b 2 , x F b 2 , y F b 2 , z ] T .
Finding the values of these forces enables the determination of bearing losses. To find these values, the bearing coefficient matrix C b is constructed:
C b = [ 1 0 0 1 0 0 0 1 0 0 1 0 0 0 1 0 0 1 0 l b 1 0 0 l b 2 0 l b 1 0 0 l b 2 0 0 0 0 B b 1 0 0 B b 2 ]
with l b 1 and l b 2 the axial distances of the bearings to the origin of the shaft, and B b 1 and B b 2 Boolean variables that define if an axial load can be supported. As C b is used in matrix multiplication C b v b , the left half of C b corresponds to the first bearing and the right half to the second. The first three rows of C b define force equations in x-, y-, and z-direction. Rows 4 and 5 of C b define moment equations in x- and y-direction, respectively. As the z-direction is the axial direction, the summed moment of all gears in this direction is zero. This property is used to define F b 1 , z or F b 2 , z to zero by B b 1 or B b 2 being numerical one, respectively. To obtain the bearing forces, the following equation is solved for v b per shaft and per grid point:
C b v b + v g = 0

3.2.2. Loss Calculations

Transmission losses consist of load dependent losses and load independent losses, originating from gears, bearings, seals, synchronizers, clutches, and auxiliaries [12]. In this work, load dependent gear meshing losses P loss , g , P , load independent gear churning losses P loss , g , 0 , load dependent bearing losses P loss , b , P , and load independent bearing losses P loss , b , 0 are taken into account with the aid of simplified loss models. Thereby, the total transmission losses become:
P loss = P loss , g , P + P loss , g , 0 + P loss , b , P + P loss , b , 0
The losses that are taken into account here dominate the total transmission losses, resulting in a first estimation of the characteristics of the total transmission losses [9,10].
The individual gear losses are determined according to the relevant ISO standard [13]. The gear input speeds and bearing speeds result directly from the mathematical analysis. Forces F T , F R , and F A are the outcomes of the force calculations as explained in the previous section. The gear radii and immersion depths are defined by the 3D design. Gear properties as the module, helical angle, pressure angle, tooth width, and flank roughness are parameters that must be provided or assumed. Additional inputs required for the loss calculations are the oil viscosity and several bearing parameters. The used bearing losses model bases on [14] and relies on many empirical parameters, which can be obtained by selecting a bearing type and series for each bearing. For this purpose, catalogue data for deep groove ball bearings (DGBB), cylindrical roller bearings (CRB), and tapered roller bearings (TRB) are used from [14].
The individual gear meshing losses, gear churning losses, and bearing losses are determined over the whole grid, and summed up to obtain the estimated total transmission losses over ICE torque, EM torque, rotational speed of the wheels, and selected transmission mode.

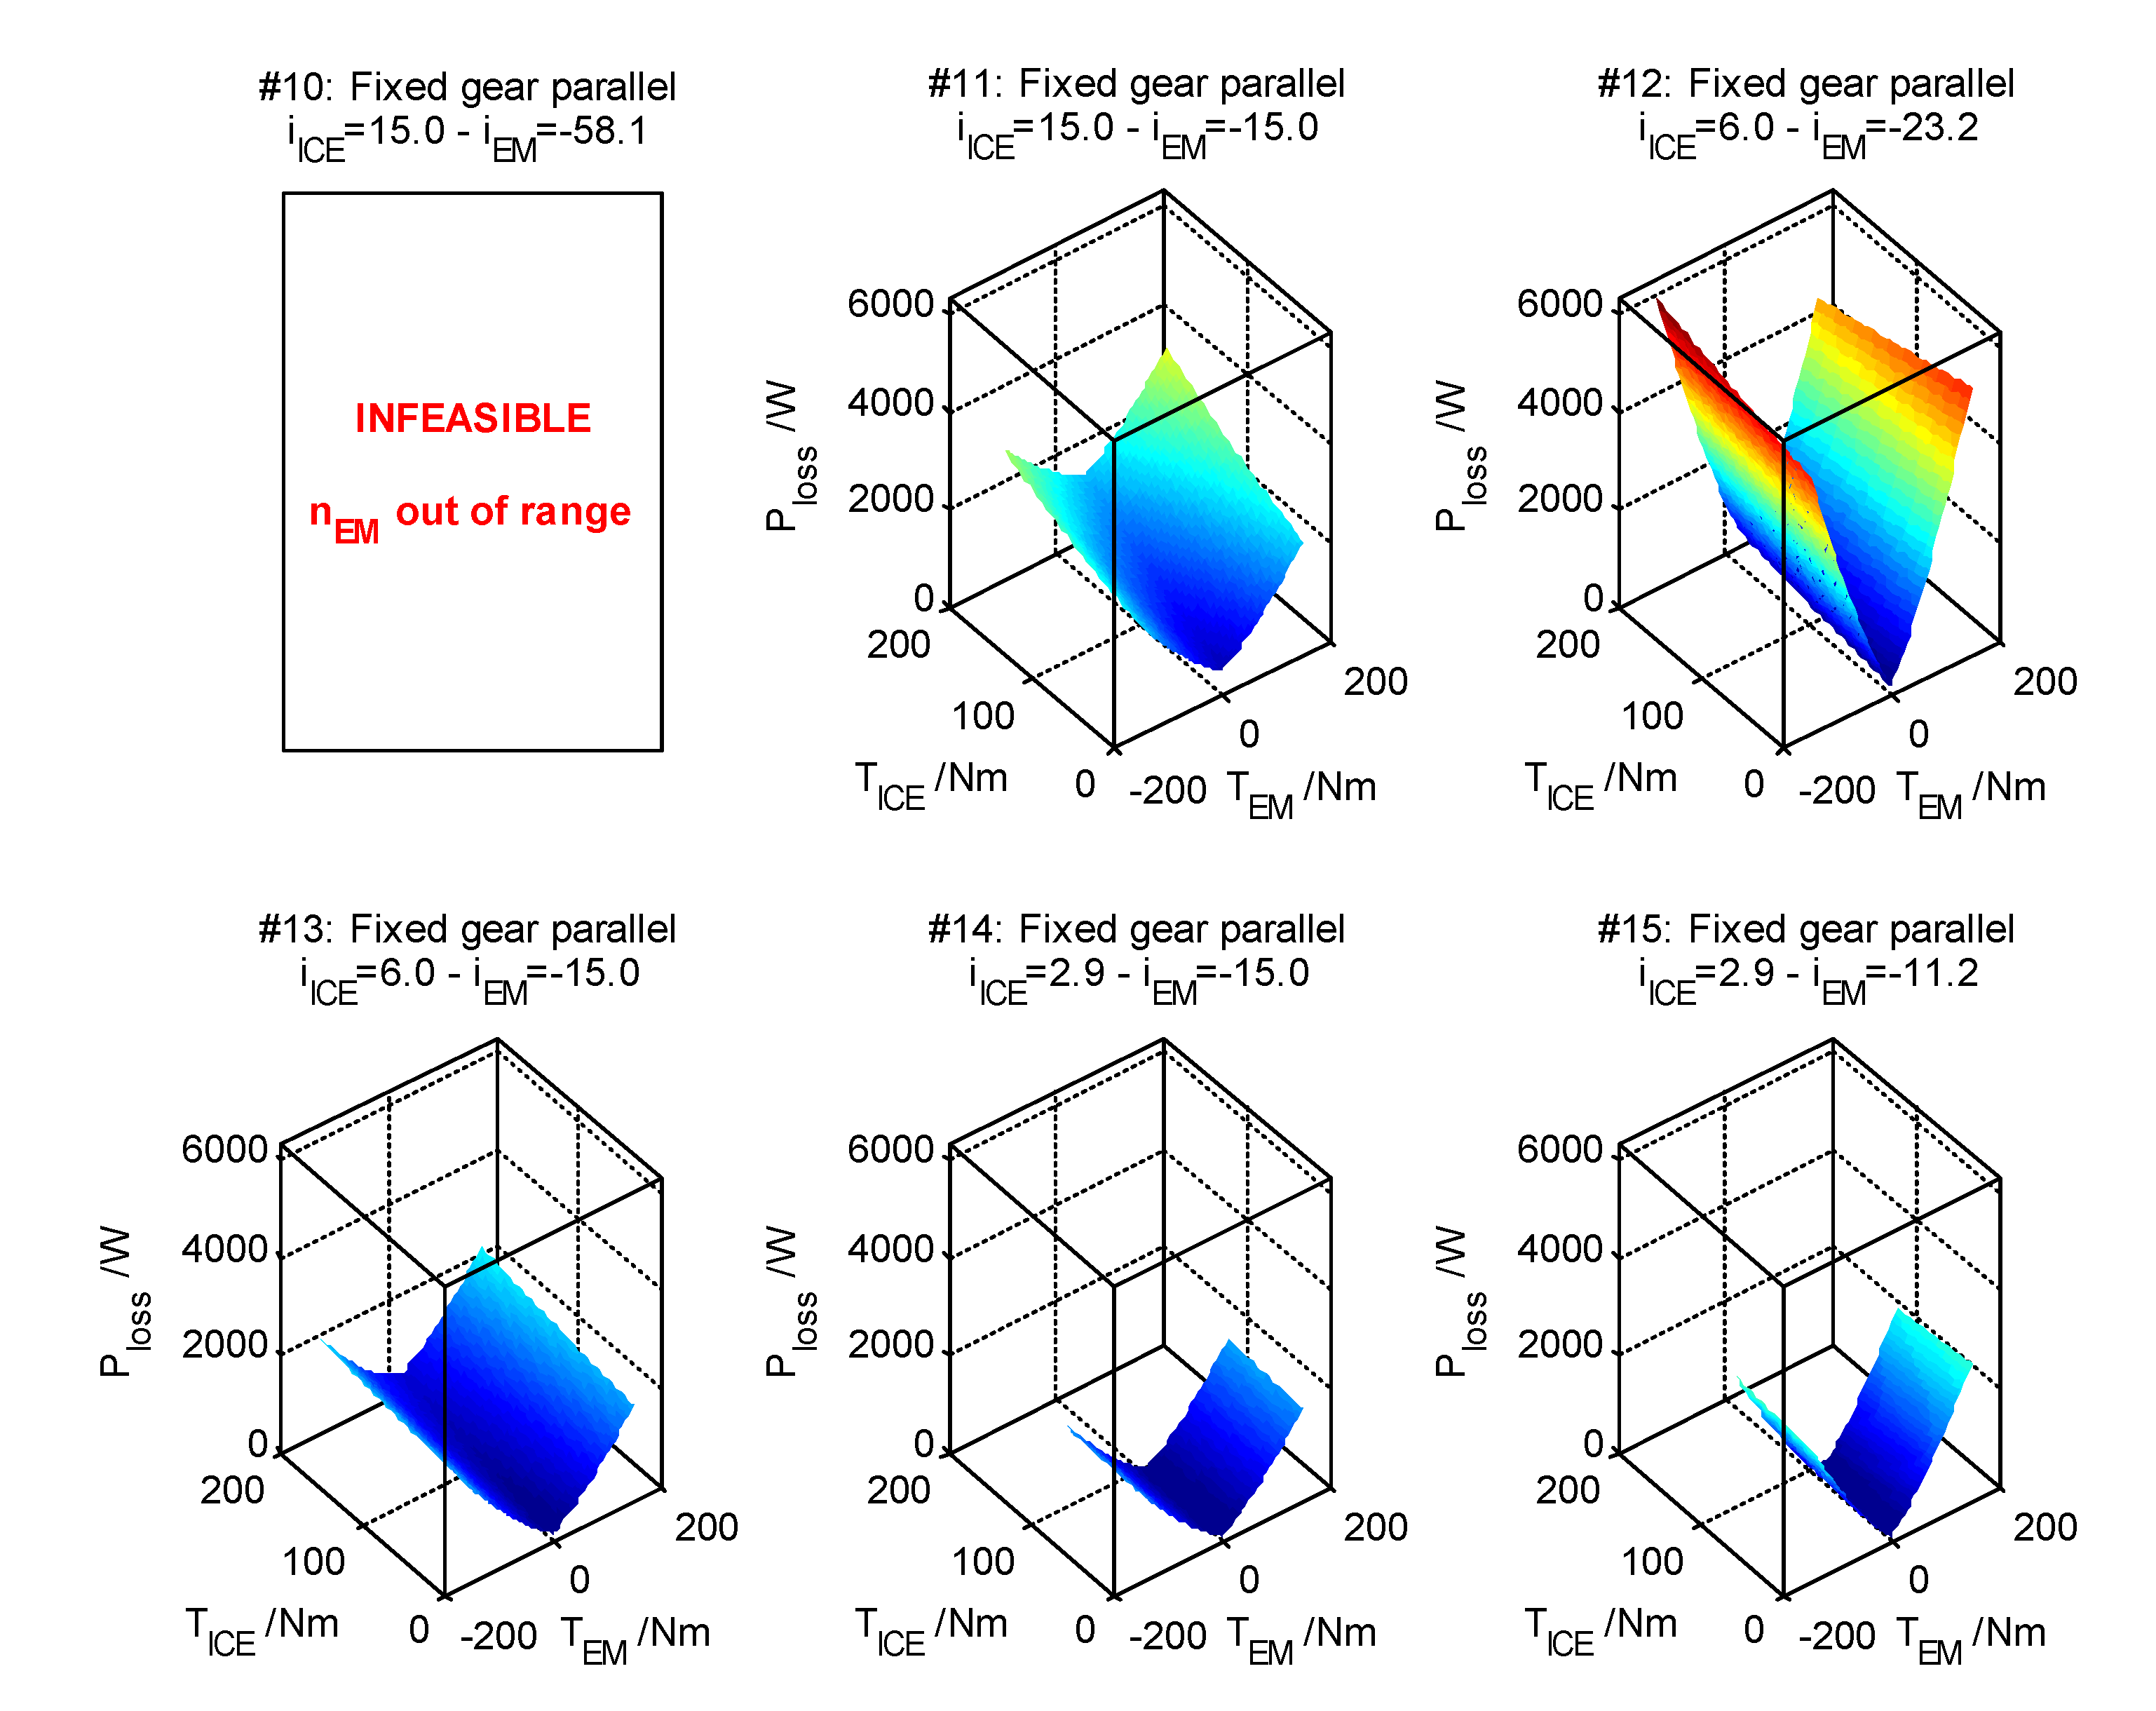
3.3. Resulting Multidimensional Transmission System Power Loss Maps

As shown in Figure 4, the result of the transmission systems power loss estimation framework is a multidimensional characteristic map of the power losses. To enable the visualization of the determined power losses of a specific parameter set of the P2/P3, which are dependent on four input variables, two inputs are fixed for each power loss map in Figure 5. For a given wheel speed, three-dimensional maps of the transmission systems power losses are displayed for each mode as a function of the torque of the two power sources. As the developed method includes a feasibility evaluation, no loss values are depicted for infeasible combinations of the input variables.

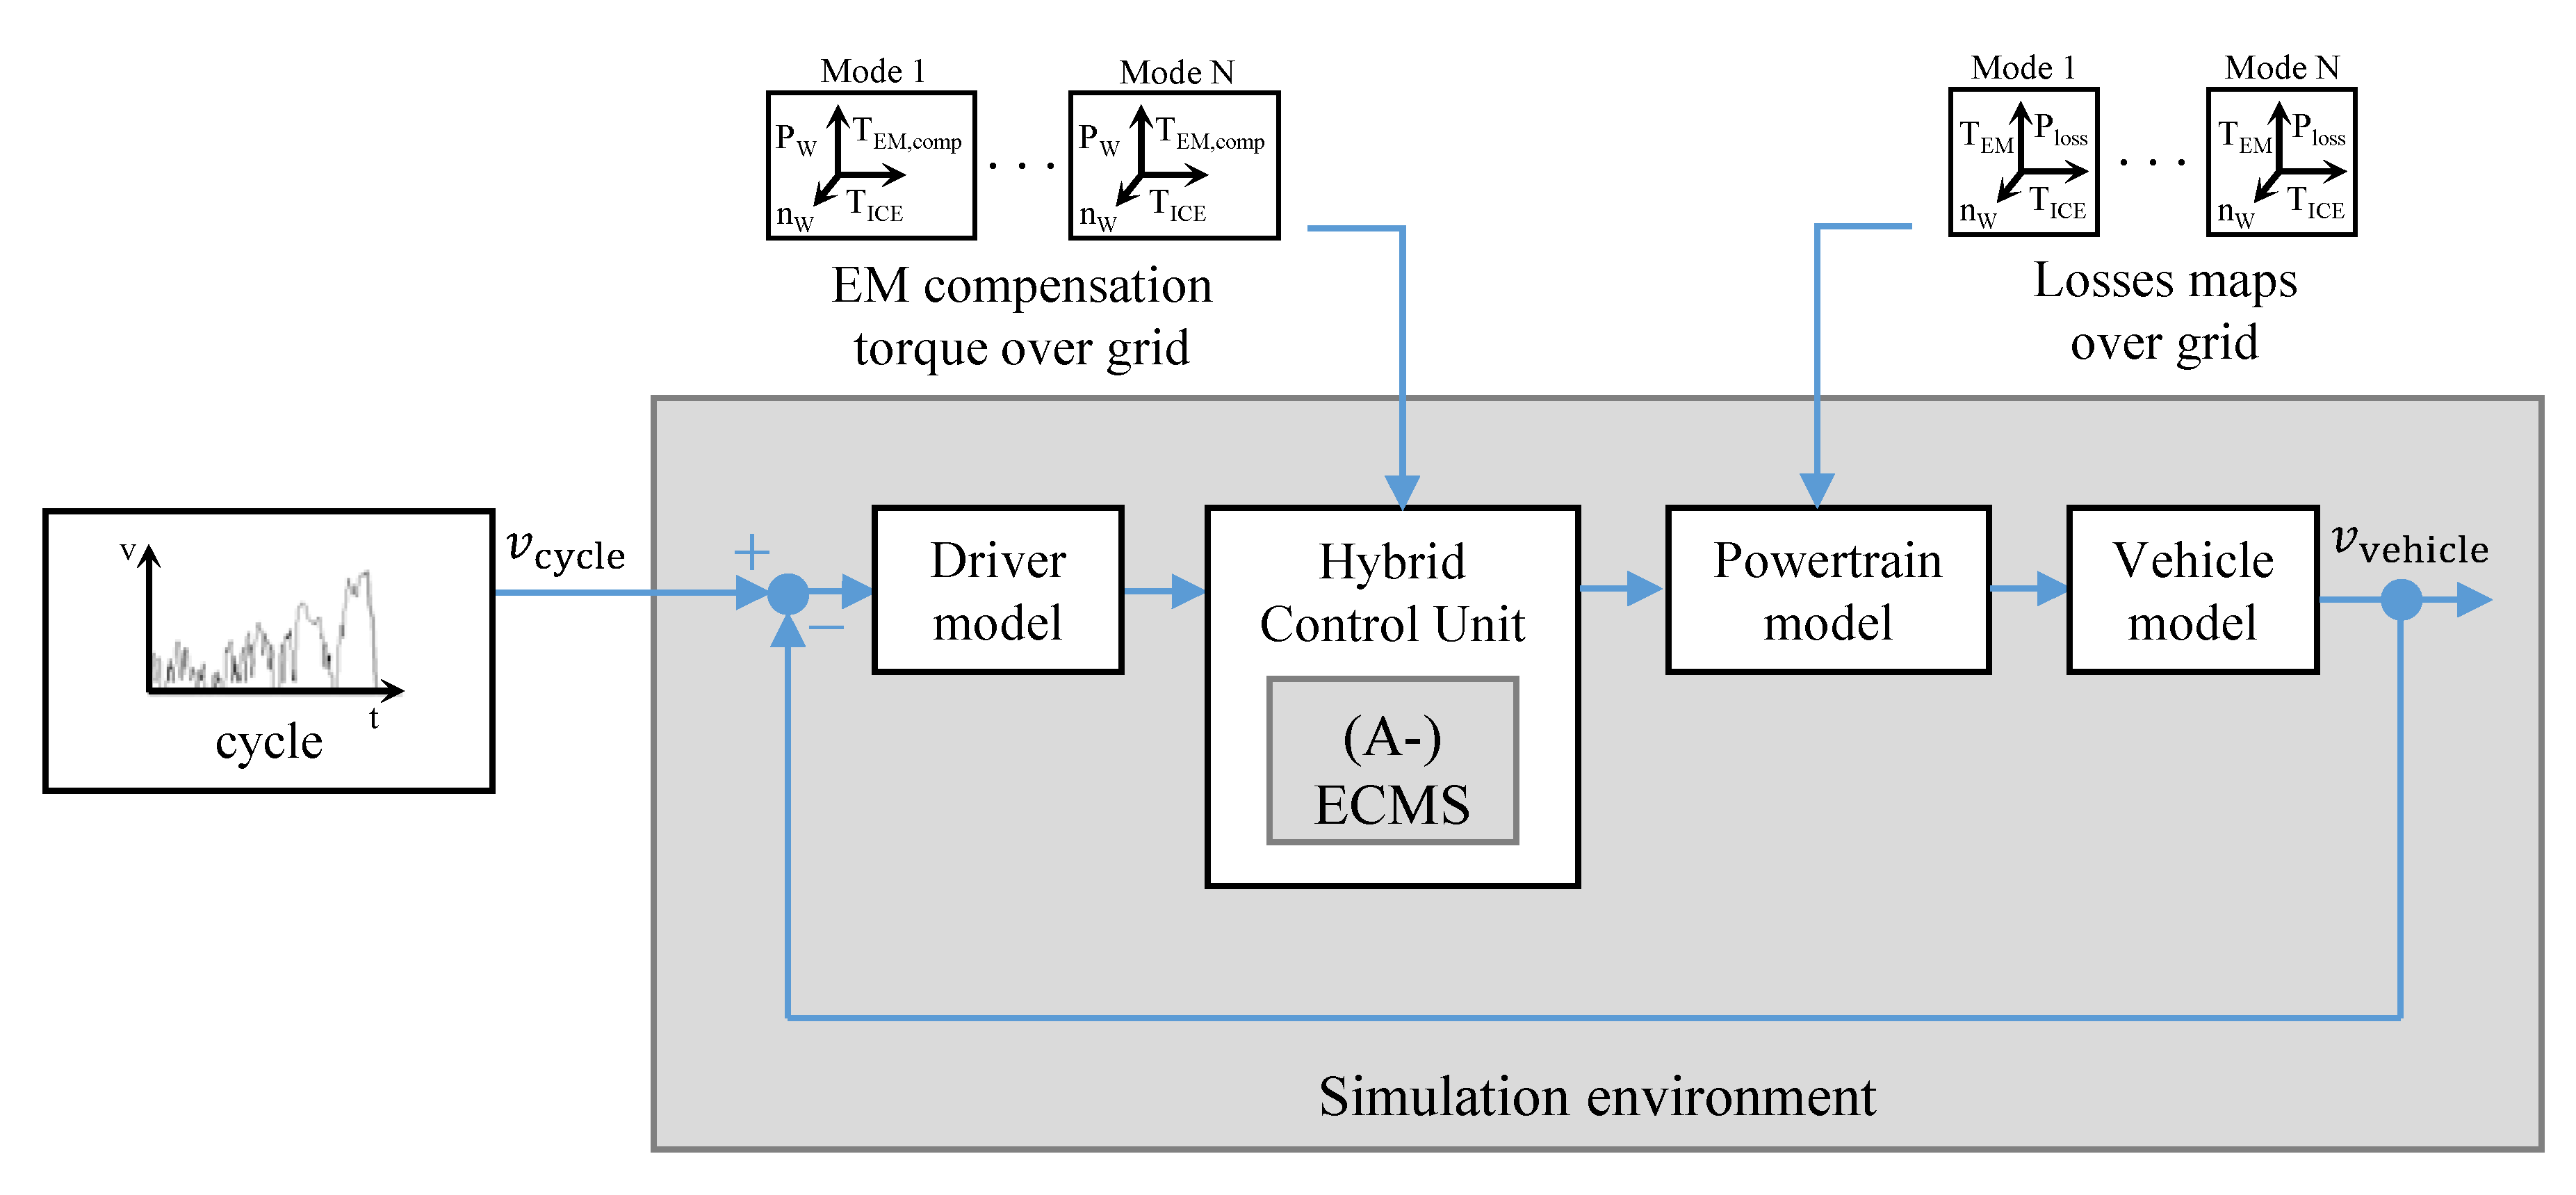
4. Simulative Assessment of Parallel-Hybrid-Electric Powertrains

The environment for the simulative assessment is based on a forward-facing simulation model of the longitudinal dynamics of a parameterizable vehicle. This modeling approach is based on the actual signal flow of propulsion requests in a real vehicle: A driving cycle to be investigated provides a target vehicle speed, which is transformed into a torque request at the wheels using a driver model. The driver model consists of a PI-controller combined with a (disturbance) feedforward control to address the nonlinearities of the driving resistances. Based on the level of detail of sub-models in the powertrain model, this modeling technique is able to achieve more precise results in energy consumption assessments compared to backward-facing simulation models. This holds in particular when considering dynamic driving cycles [15].
In order to enable comparability of different powertrain topologies, their best possible parameter settings should be determined at first. Therefore, the simulative assessment is embedded in a higher-level parameter optimization environment. However, the suitability of a parameterization can only be assessed if its potential is exploited to the full. For that reason, an efficiency-oriented operating strategy is deployed to control the mode selection and torque split between the power sources over the driving cycle. To enable disambiguous efficiency comparison of variants, the charge sustaining (CS) fuel consumption per distance f c d in standardized driving cycles is assessed by bounding the final battery state of charge (SOC). For this purpose, a local optimal control strategy based on an equivalent consumption minimization strategy (ECMS) approach [16] is applied.

4.1. Operating Strategy

The idea of the operating strategy approach is to minimize an equivalent total fuel mass flow m ˙ equi in each time step. This weighs the two available sources of energy against each other. In this way, an attempt is made to achieve that specific advantages of the power sources are used.
The equivalent fuel mass flow m ˙ equi for the examined parallel-hybrid-electric powertrains consists of the fuel mass flow m ˙ fuel of the ICE as a product of the brake-specific fuel consumption b s f c and the ICE output power P ICE plus a weighted total battery power P Batt   , which supplies the EMs. The units of the weighted powers of the power sources are related to each other by means of the lower heating value L H V fuel of the fuel used by the ICE. The value of m ˙ equi is calculated for each value of a control variable u , in general representing all possible distributions of the wheel power request between the different power sources of hybrid powertrains, in each time step. The battery power is weighted using an equivalence cost factor s 0 , which is set iteratively to achieve the final SOC being within a threshold value from the set boundary. Thereby, near SOC neutral solutions are found for each cycle.
ECMS applications enable to achieve only minor disadvantages in powertrain cycle efficiency estimation in contrast to computation-intensive global optimal control strategy approaches [17]. With the use of an online adaption of the equivalence factor [18], this strategy can even be used for online implementation and is then often referred to as A-ECMS [19].
To minimize the time that is required to find a value of s 0 that satisfies the final SOC threshold Δ S O C ( t e n d ) for a given cycle, one of these adaption proposals is used for the simulative assessment. A feedback of the S O C with a small amplification factor k p is introduced. The quality functional to be minimized in each time step is given in Equation (17):
m ˙ equi ( u , t ) = b s f c P ICE ( u ) + [ s 0 + k p Δ S O C ( t ) ] 1 L H V fuel P Batt ( u ) .
For fixed gear transmission modes, a torque split t s is suitable as a control variable for determining the distribution of the wheel power request P W between the power sources. The implementation also takes an optimization-based selection of the transmission mode m into account by evaluating Equation (17) not only for each torque split t s but for each possible torque split t s in each (feasible) transmission mode m . Thus, the vector of candidates of the control variable u becomes a matrix of control variable candidate sets u  
u = [ u 1 , 1 u 1 , m u t s , 1 u t s , m ]
with control variable u , subscript t s for the torque split, and subscript m for the mode.

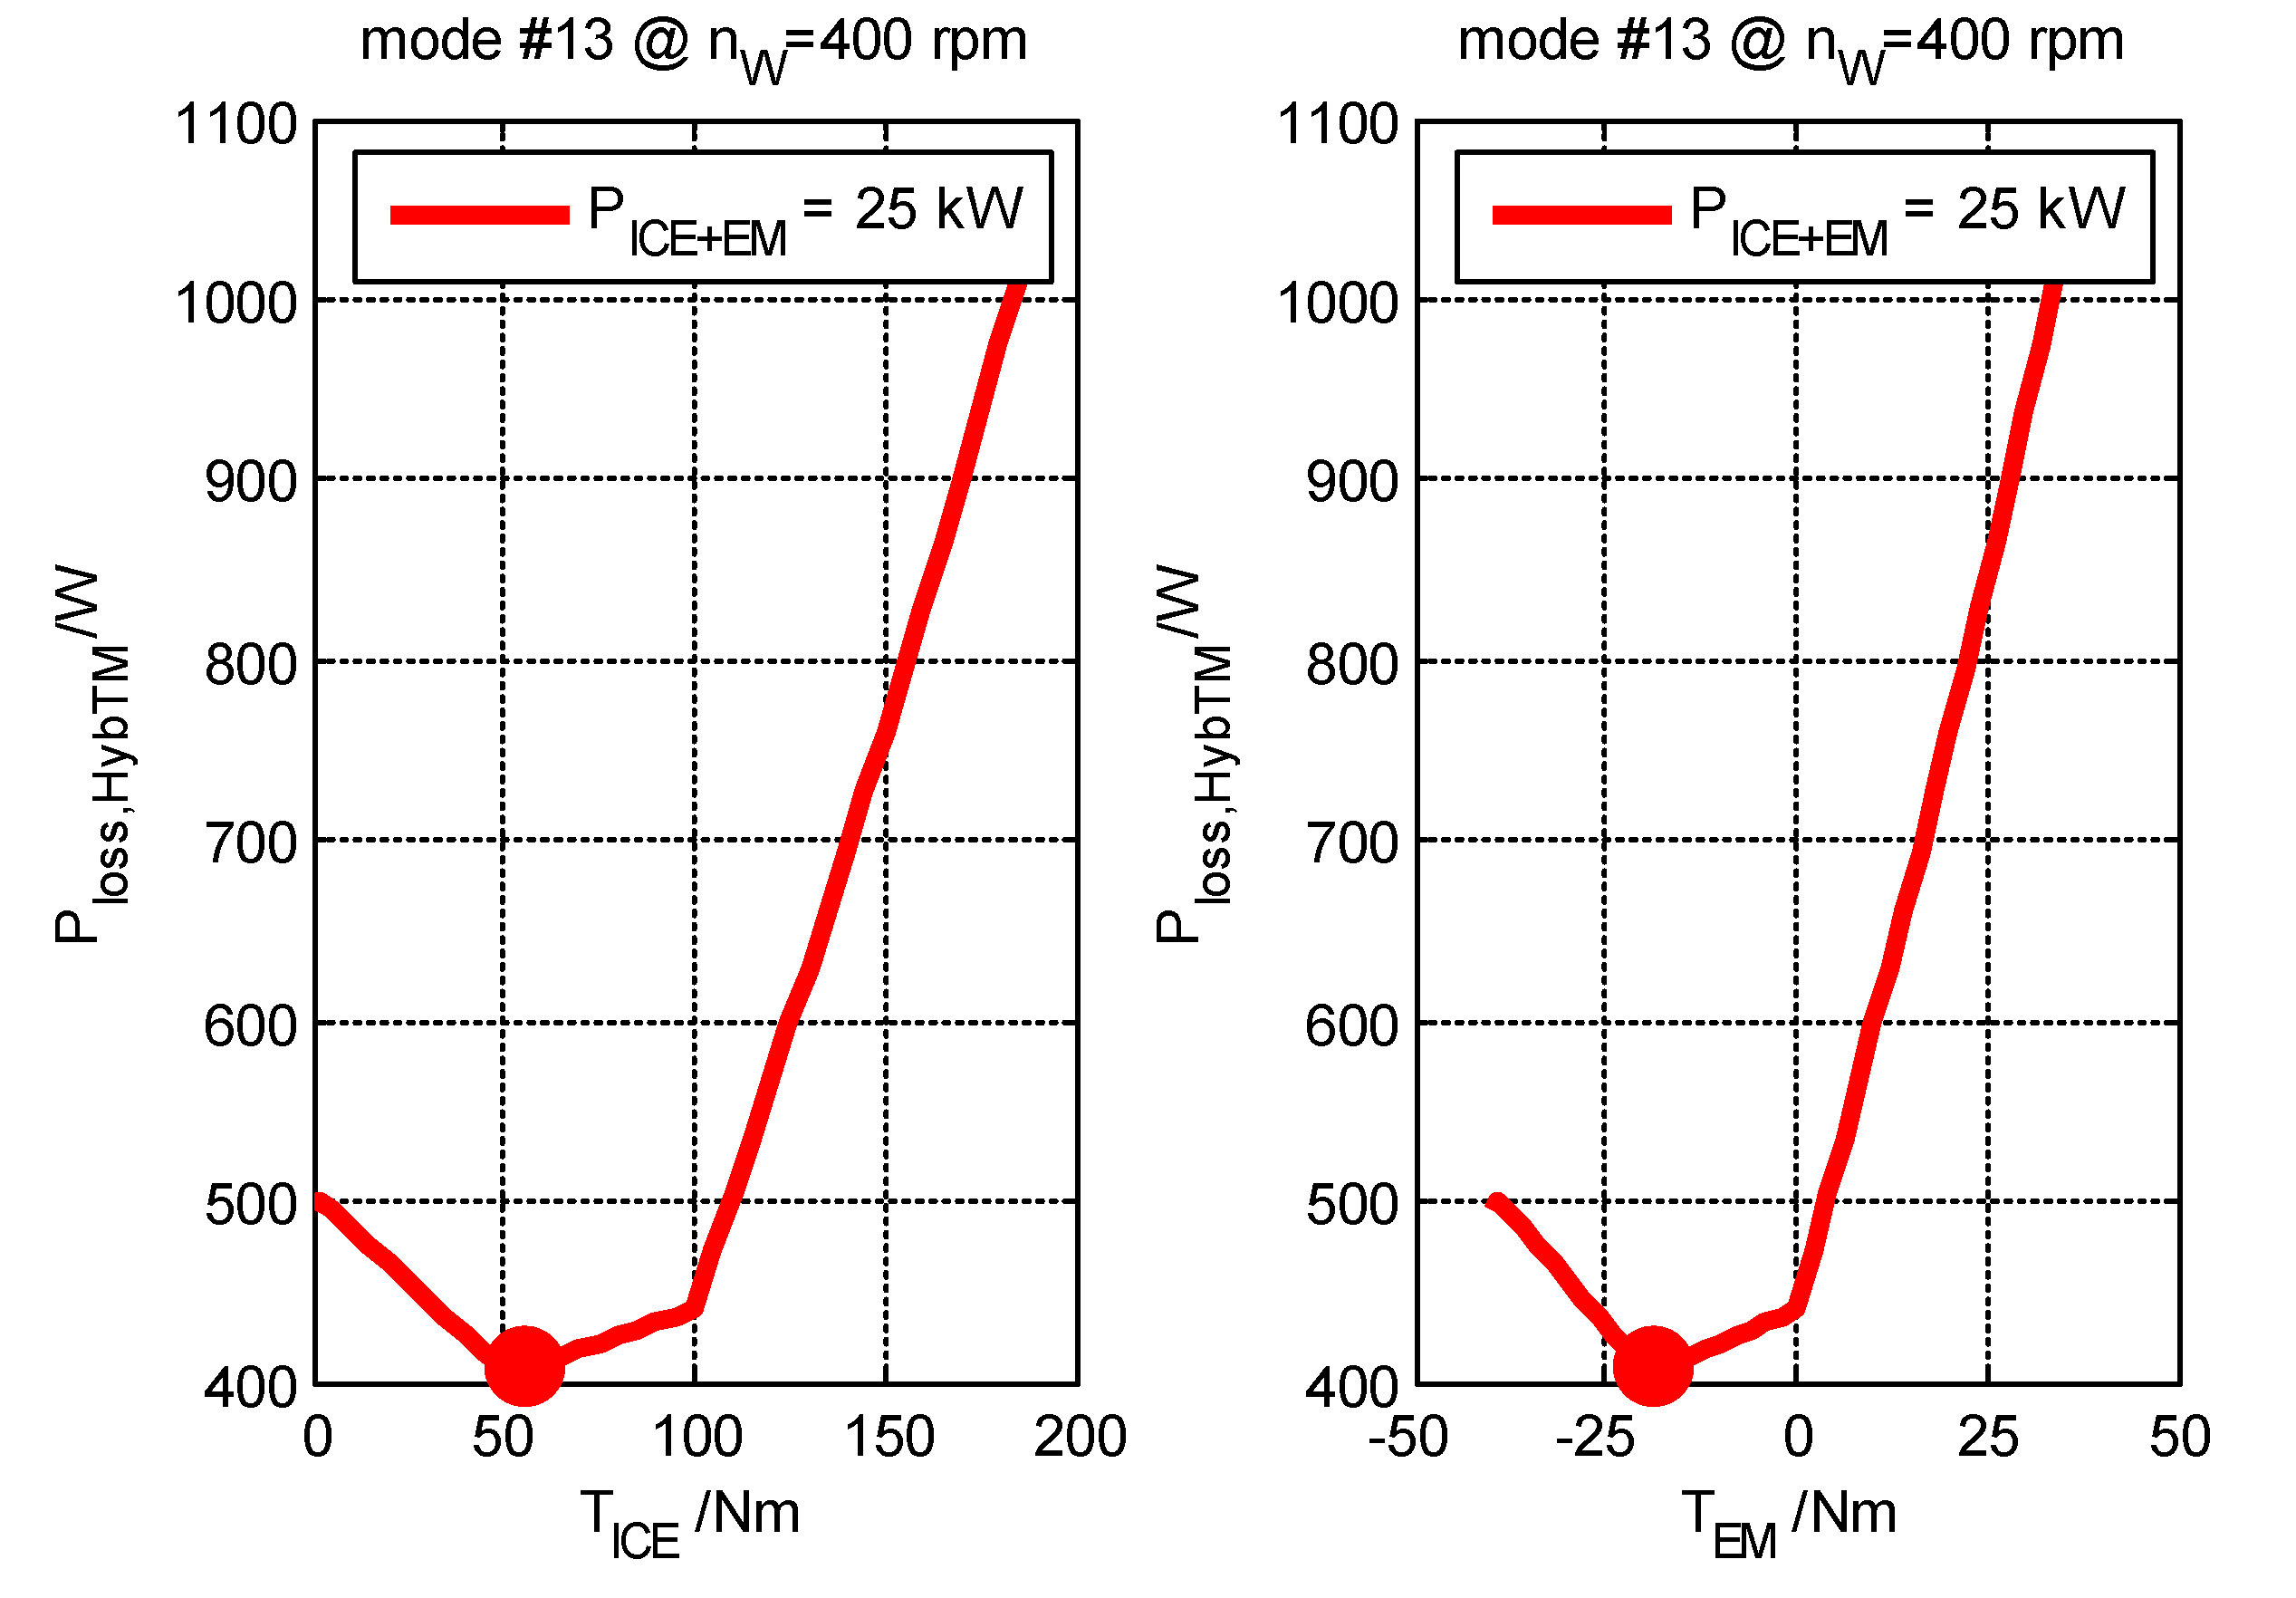
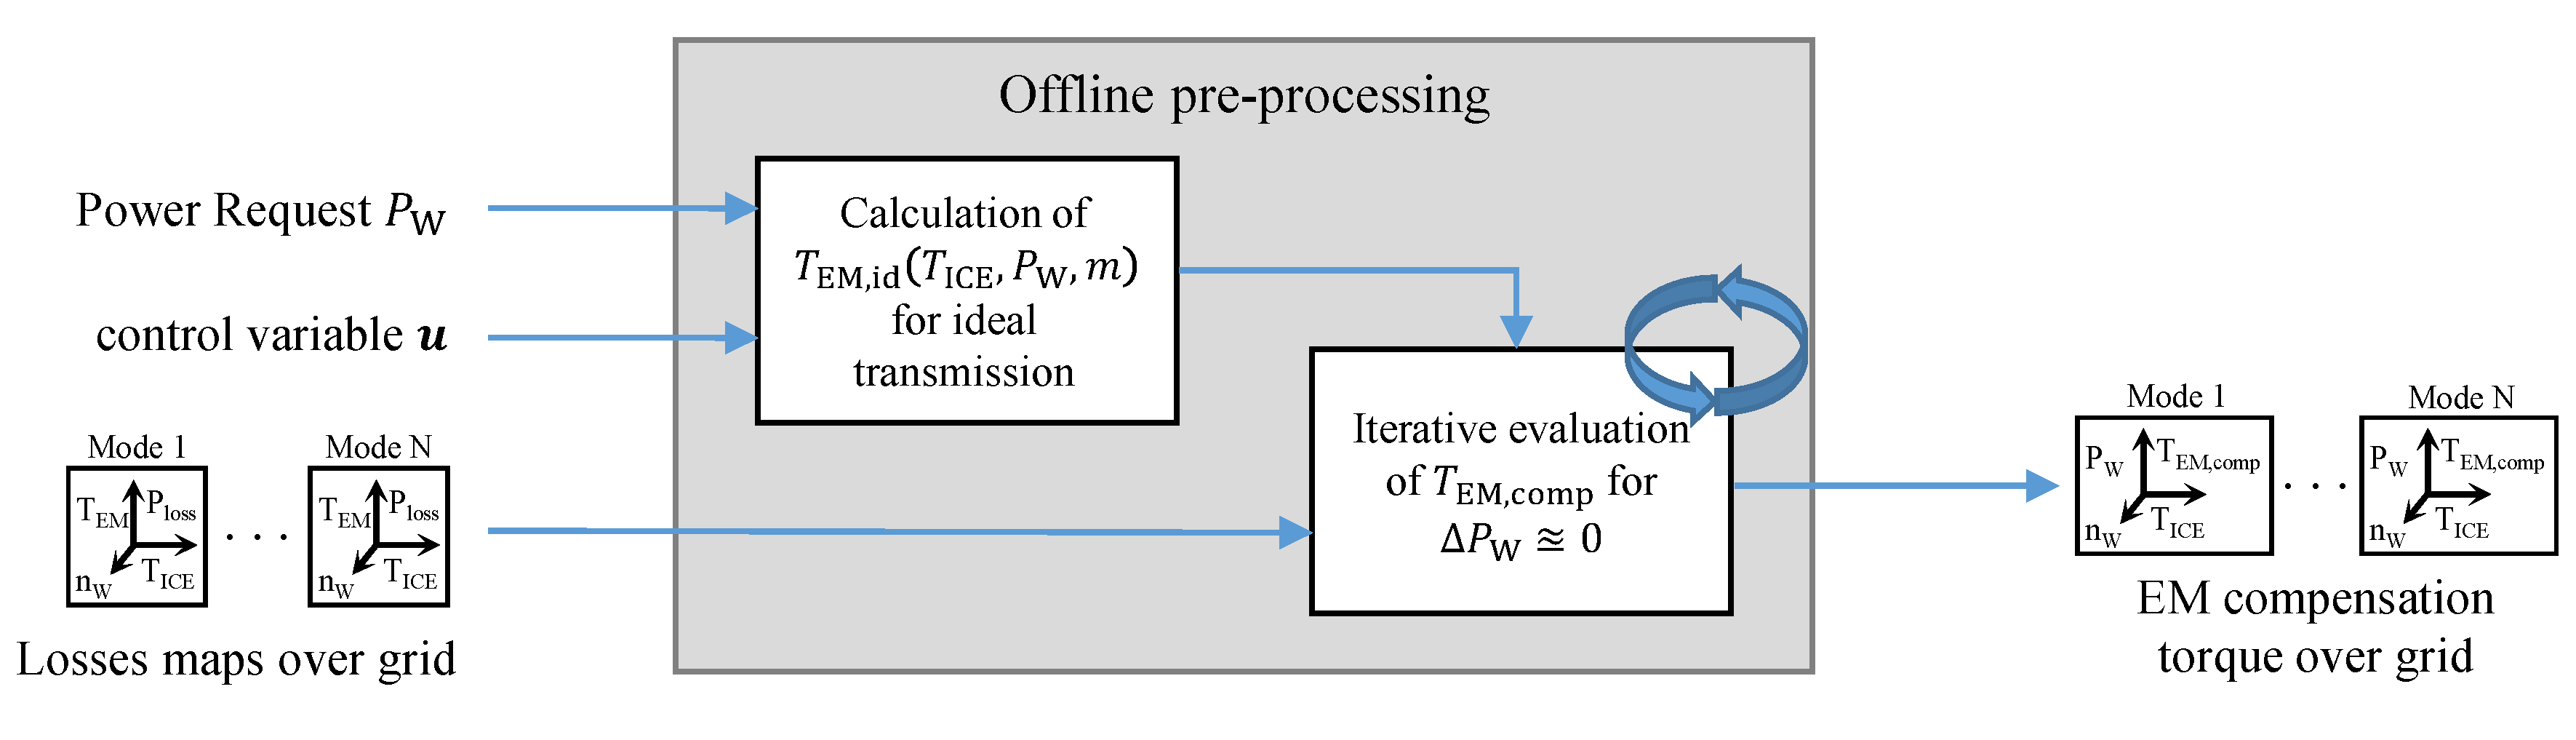
4.2. Consideration of Multidimensional Transmission Power Losses in the Operating Strategy

Beyond the state of the art, the implemented variant of the control strategy approach considers the multidimensional power loss characteristics P loss , HybTM ( T ICE ,   T EM ,   m ,   n out ) of novel parallel-hybrid-electric powertrain transmission systems. The dependency of transmission losses on the control variable creates additional challenges for the forward-facing simulation environment. Figure 6 shows the transmission system power losses as a function of the torque split for the P2/P3 topology (see Figure 1) in fixed gear parallel mode #13 at an exemplary wheel speed of n W = 400   rpm and a total input power of Σ P ICE + EM = 25 kW . It is shown that for this mode and the corresponding operating condition a torque coordination with minimal transmission losses exists, which can generate the greatest benefit at the wheel.
One challenge for the consideration of transmission systems power losses in the control optimization is that the provided power of both power sources induces transmission losses, whereas the contribution of each power source to the total transmission losses cannot be directly determined in the considered MIMO-transmission systems. Another challenge is the dependency of the transmission losses on the selected mode and torque split. This means that distinct control inputs lead to distinct transmission losses albeit equal summed input power from ICE and EM. This is a challenge because to find a legit local minimum of the quality-functional (17) of the control strategy, the evaluated sets of control variable candidates must provide equal output power at the wheels.
Concerning the allocation of the transmission losses to the power sources, various possibilities exist. In [20], a procedure was proposed that makes effort to divide the total losses into path individual losses. Depending on the type of losses, either a direct allocation to the respective power sources or an output power-share-weighted allocation takes place. The more a power source is involved in the total propulsion of the vehicle, the more the transmission systems power losses that cannot be directly assigned are associated to it. In [21], an output power-share based allocation of the transmission losses without an additional compensation of the compensation induced change in transmission losses is proposed as well. However, when the ICE and EM torques are increased according to such an allocation to compensate for the transmission losses, the actual losses might change. Especially for novel parallel-hybrid-electric powertrains, the losses can be highly dependent on the control inputs. This means that an iterative process would be required to find the (optimal) control inputs that more accurately correspond to the required output power at the wheels.
The effect of a deviation between required output power and actual output power might not get directly visual in the simulative assessment of powertrain concepts. In the forward-facing simulation environment, the driver model reacts to the resulting difference between the objective speed trajectory and the actual speed. In the event of undercompensated transmission power losses, a wheel torque deficit will be compensated over time by an increased driver request. However, the optimality of the control candidate selection of the operating strategy in each time step, and therefore the simulative assessment of a powertrain topology variant, must be questioned in this case. Therefore, we propose an accurate MIMO-transmission system power loss compensation method based on the determined multidimensional characteristic power loss maps.
The first step of the compensation method is an offline pre-processing. A compensation torque map of the minimum required compensation torque to be provided by the EM, T EM , comp , is calculated offline in advance. Starting with the required EM torque T EM , id for an ideal transmission system with no power losses, for each combination of mode and wheel speed n W , the compensation torque T EM , comp is determined iteratively as a function of each valid value of T ICE ( u ) of the control variable u and the required total output power P W . This process is visualized in Figure 7.
This results in an accurate compensation of the transmission systems power losses at each grid point. An exception to this procedure are ICE only modes, respectively ICE only operating points in the control variable candidate sets, for which an additionally required ICE torque T ICE , comp is determined based on T EM , comp .
To enable the consideration of transmission systems power losses in the simulative assessment, the additionally generated information is fed into the simulation environment in two different sub models. First, the power loss characteristics must be considered in the powertrain model. In addition, the operating strategy as part of the hybrid control unit (HCU) needs to have information about the required additional power loss compensation torque for the correct selection of a candidate set of the control variable u to minimize the quality functional (17) in each time step. The extended simulation environment is schematically visualized in Figure 8.

5. Case Study

To demonstrate the developed transmission power losses modeling method, a case study is conducted. In this case study, the influence of transmission systems power losses on the simulative assessment of the energy consumption of novel parallel-hybrid-electric powertrains is evaluated. The case study is performed using the P2/P3 topology as presented in Figure 1, with the initial 3D design draft as shown in Figure 3 and the therefrom resulting set of gear ratios. The simulation environment and the local optimal control strategy presented in the previous section are used.

5.1. Boundary Conditions and Assumptions

The absolute values of the evaluation strongly depend on the vehicle parameters, the cycle, and the underlying component characteristics of the power sources. The used vehicle parameters comply with a vehicle from the M-segment, and are listed in Table 2.
For the ICE, a characteristic map of a high-efficient turbo gasoline engine with a maximum output power of P ^ ICE = 100   kW and a best point of brake specific fuel consumption of b s f c best = 230 g kWh is used. For the electric drive (EM + Power Electronics), an EM characteristic with an efficiency maximum of η ^ EM + PE = 94 % and a peak output power of P ^ EM = 150   kW is used. The battery is modeled with a constant efficiency of η batt = 97 % .
The P2/P3 topology enables 18 distinct transmission modes, as listed in Table 1. In this case study, all modes with the ICE and EM in forward gear can be selected by the control strategy, but to incorporate the transmission system power losses only the characteristic power loss maps of the six hybrid modes with the ICE and EM in forward gear (modes #10 to #15) are used. For electric driving with the EM connected in P2 setting (modes #5, #7, and #9), the transmission losses are identical to the losses in the corresponding hybrid modes (#10, #12, and #15, respectively) with T ICE = 0 . For electric driving with the EM connected in P3 setting (mode #8), the losses cannot be represented exactly by the loss characteristics of mode #11, #13, or #14. This deviation arises from increased speed dependent losses. However, using mode #14 with T ICE = 0 , the resulting transmission losses are nearly identical to the losses of mode #8. In modes #11 and #13 with T ICE = 0 , the transmission losses are noticeably higher due to the higher revolution speeds of ICE input shaft and ICE gearwheels. Therefore, the power loss map of mode #14 is used to model the transmission losses of mode #8 instead of implementing an additional power loss map.

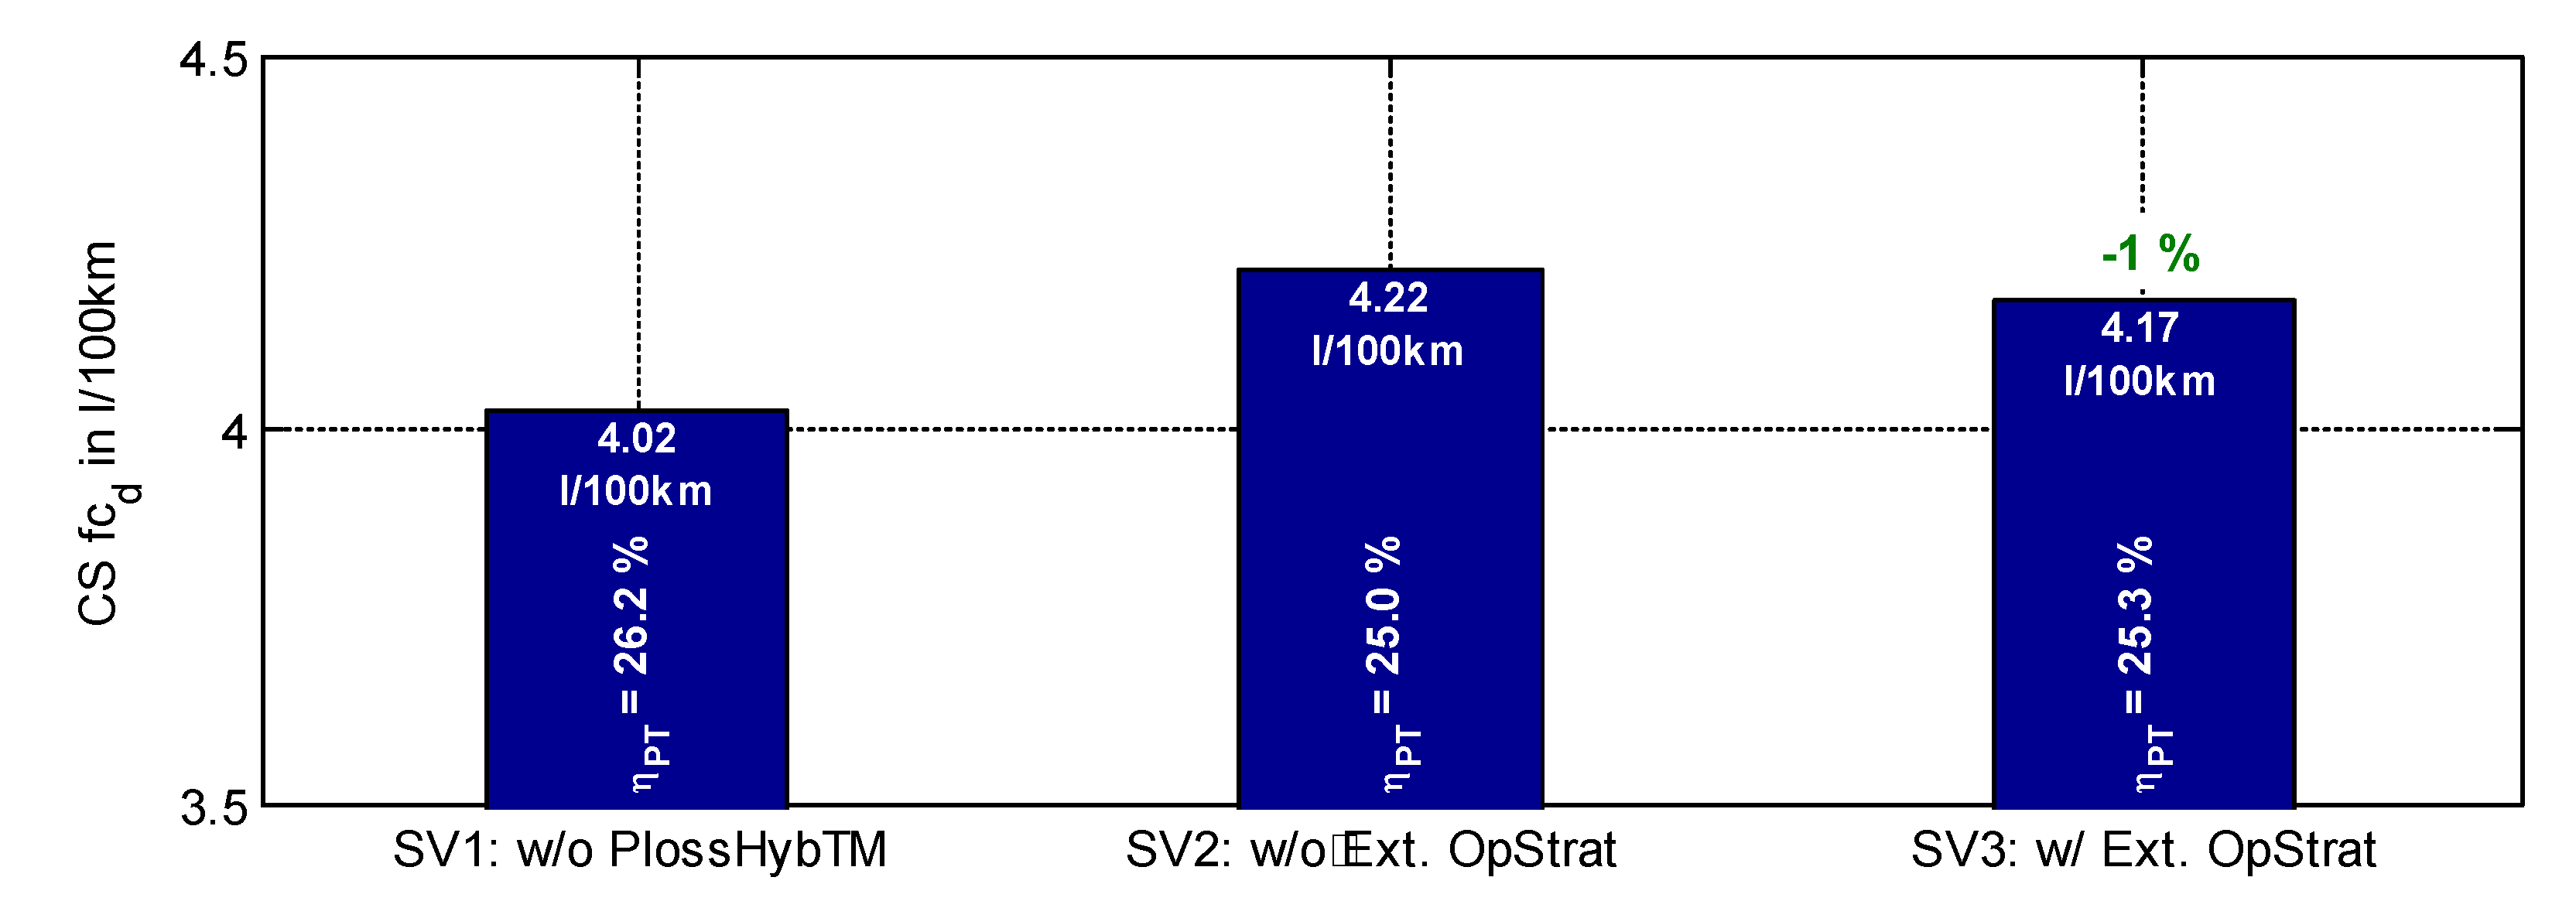
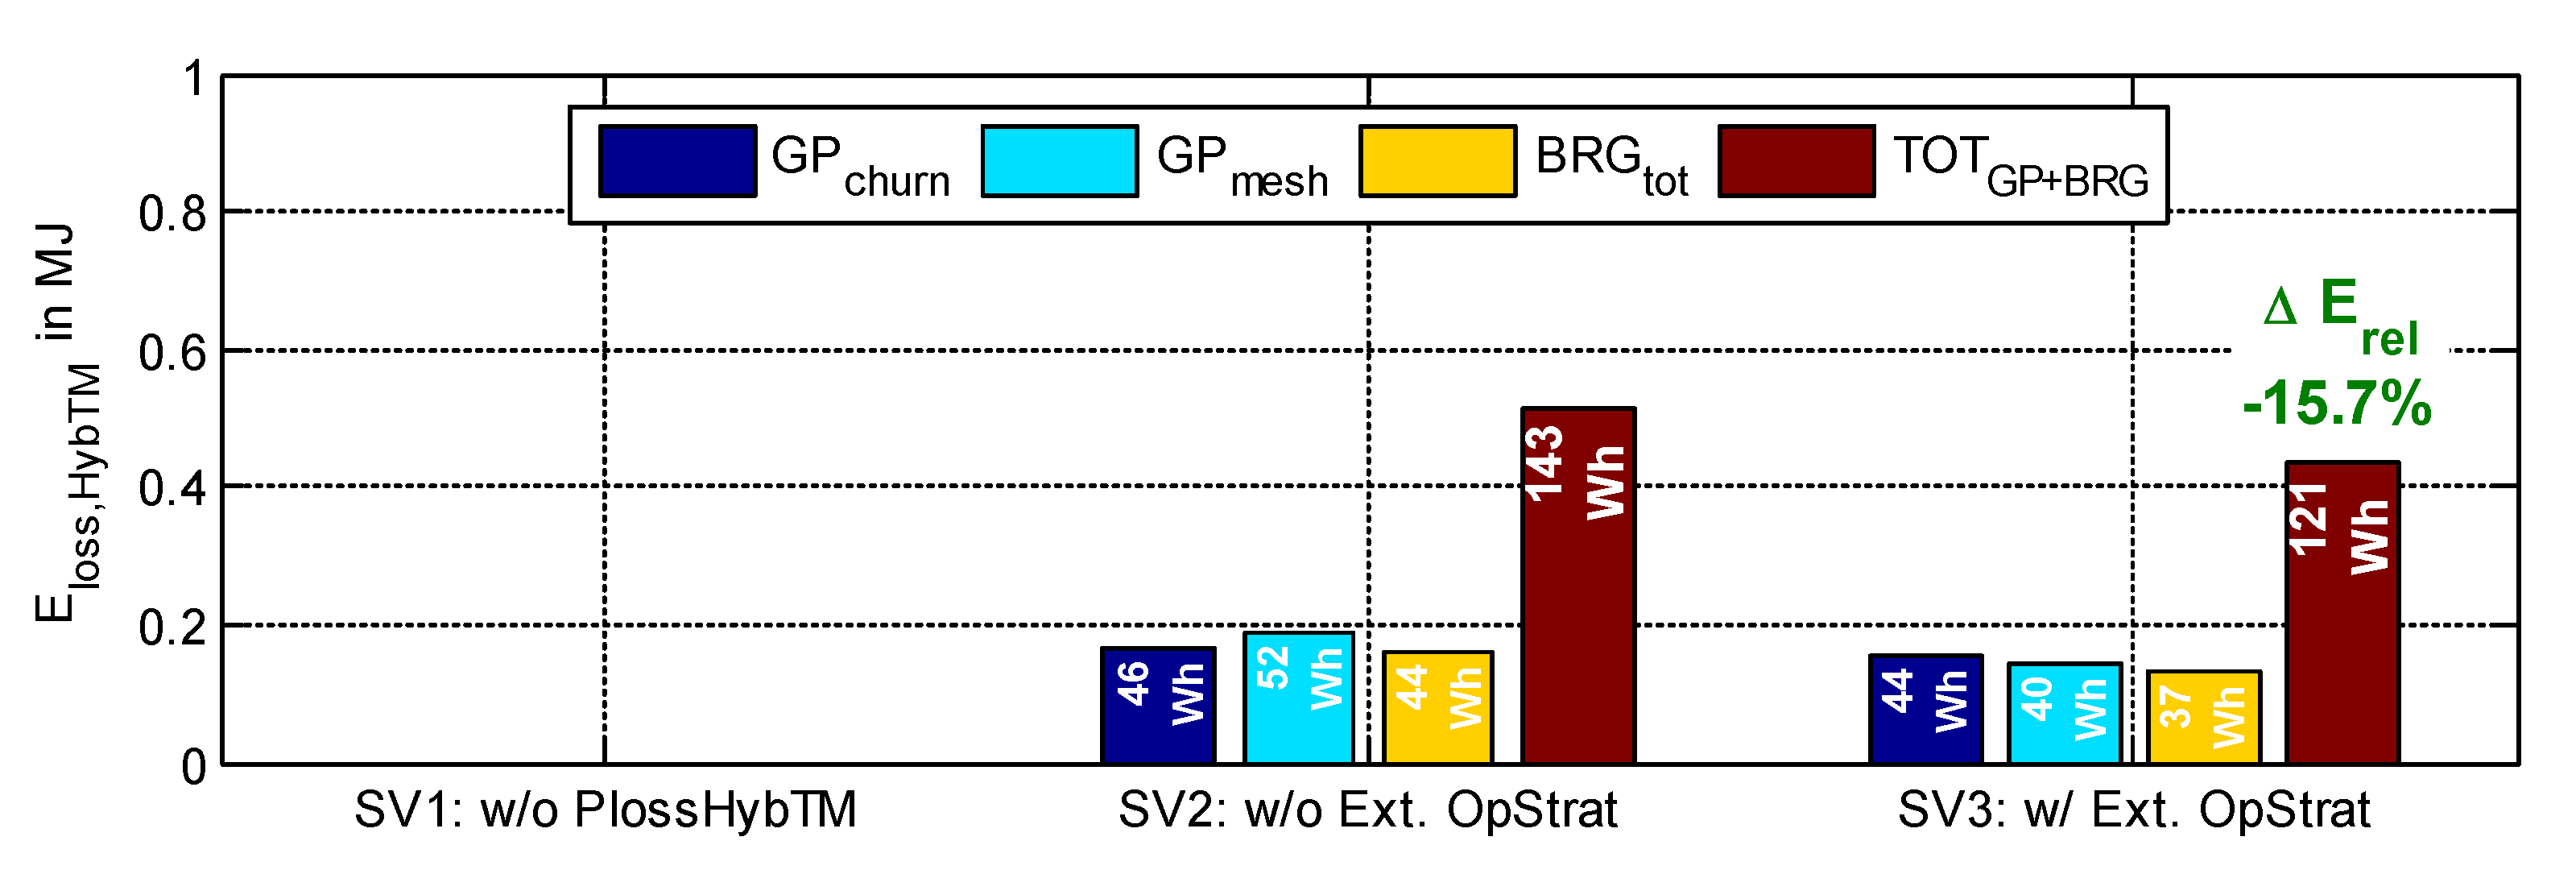
5.2. Results of the Simulative Assessment

In the following, three different simulation variants for the simulative assessment of the P2/P3 MIMO-transmission system as shown in Figure 3 are evaluated. In the first simulation variant, SV1, transmission losses are not included in the powertrain model. In the second variant, SV2, the transmission losses are modeled using the modeling method presented in Section 3, the transmission losses are however not considered by the operating strategy. In the third variant, SV3, the transmission losses are included in the powertrain model and the extended operating strategy is used, which considers the transmission losses. Table 3 provides an overview of the three simulation variants. For all three variants, the CS fuel consumption per distance f c d and the occurring transmission system energy losses in the worldwide harmonized light vehicles test cycle (WLTC) are discussed. In addition, the effects of the extended operating strategy on the time shares of different transmission modes in the total cycle time are shown.
Figure 9 shows the CS fuel consumption per distance, f c d , for the three variants. This figure also shows the average total powertrain efficiency:
  η PT = E W E fuel  
with E W as the total energy used at the wheels and E fuel as the total energy extracted from the fuel tank.
Due to the disregard of transmission systems power losses, the CS fuel consumption in the WLTC is the lowest for SV1. The estimated CS consumption increases by 0.2 l 100 km ( ~ 5 % ) for variant SV2, which considers the transmission losses in the powertrain model but is blind for these losses on the control system. Although the same loss model of the transmission system is implemented in the powertrain model, the CS fuel consumption can be reduced by 1% ( ~ 0.05 l 100 km ) through the extended operating strategy of SV3—only by improved control.
Figure 10 shows the total transmission losses occurring in cycle operation in WLTC, as well as the distribution of the losses to the respective loss types of the transmission power loss model. This illustrates that a major contribution to the reduction in CS consumption of the extended operating strategy results from a reduction of the overall transmission losses ( ~ 16 % ). The extended operating strategy achieves the greatest advantage in the area of gear meshing losses, representing approximately 55 % of the overall reduction of transmission losses.
The significant reduction of meshing losses can be explained by the comparison of the time shares of transmission modes, as displayed in Figure 11. This figure shows the time shares over the WLTC for SV2 and SV3. The extended operating strategy reduces the use of modes #12 and #15, both with P2 setting of the EM. Instead, the use of modes #13 and #14, with the EM connected via the P3 setting, is increased. The extended operating strategy is able to evaluate the advantage of the additional EM ratios in the P2 modes resulting from the connection of the EM to the sub-transmission of the ICE compared to the additional transmission losses in these transmission modes. Due to the knowledge of the transmission losses, this decision is often in favor of the direct connection in P3 modes.
Furthermore, approximately 6% less electric driving is observed with the extended operating strategy in SV3, compared to SV2. This can be explained by the fact that less electrical energy is generated by load point shifting, since the knowledge of the transmission loss characteristics makes the generation and expenditure of electrical energy less favorable. Thereby, the reduction of load point shifting contributes to the reduction of fuel consumption by the extended operating strategy.
As shown in Figure 9, omitting the transmission losses in the powertrain model leads to a deviation of 3% to 4%, and the extended operating strategy reduces the CS fuel consumption by 1%. These dependencies can be considered as relevant for the assessment of novel parallel-hybrid-electric powertrains, especially in the context of the optimization of transmission parameters, component sizes, and powertrain topology. The relevance of the extended operating strategy is further implied by its influence on the mode selection as shown in Figure 11 and its influence on the extent of load point shifting.

6. Conclusions

A method for the automated estimation of transmission system power losses for novel parallel-hybrid-electric powertrains is presented. This method consists of a mathematical analysis and a design analysis, and enables the generation of multidimensional power loss maps to represent complex interactions of multiple power sources in hybrid-electric powertrains. These loss maps provide an insight into the loss behavior of specific designs, and enable the implementation in higher-level development environments.
The resulting characteristic loss maps are implemented in a forward-facing simulation environment. An extension of a state-of-the-art operating strategy is proposed, to enable the control strategy to account for the multidimensional transmission power losses. The extended control strategy includes an offline preprocessing and enables the evaluation of control set candidates that result in equal output torques, even if the powertrain model includes control variable dependent transmission losses. Evaluating control set candidates with equal output torque is required to ensure local optimality.
A case study on a novel parallel-hybrid-electric powertrain, with a MIMO-transmission system is presented to demonstrate the developed method, and evaluate the influence of the extended operating strategy. Based on the results of this case study, the inclusion of the transmission losses in the powertrain model and the consideration of the transmission losses by the control strategy can be considered relevant. By improving the simulative assessment, the methods presented in this work enable more accurate optimization of hybrid powertrains.

Author Contributions

Conceptualization, J.-E.S. and W.v.H.; methodology, J.-E.S., W.v.H., Y.S., and S.R.; software, J.-E.S., W.v.H., and Y.S.; validation, J.-E.S. and W.v.H.; formal analysis, J.-E.S., W.v.H., and S.R.; investigation, J.-E.S. and W.v.H.; resources, S.R.; data curation, J.-E.S.; writing—original draft preparation, J.-E.S. and W.v.H.; writing—review and editing, J.-E.S. and W.v.H.; visualization, J.-E.S., W.v.H., and Y.S.; supervision, S.R.; project administration, J.-E.S. All authors have read and agree to the published version of the manuscript.

Funding

This research received no external funding.

Conflicts of Interest

The authors declare no conflict of interest.

References

  1. Silvas, E.; Hofman, T.; Murgovski, N.; Etman, L.F.P.; Steinbuch, M. Review of Optimization Strategies for System-Level Design in Hybrid Electric Vehicles. IEEE Trans. Veh. Technol. 2017, 66, 57–70. [Google Scholar] [CrossRef] [Green Version]
  2. Hofmann, P. Hybridfahrzeuge: Ein Alternatives Antriebssystem für die Zukunft, 2nd ed.; Springer: Wien, Austria, 2014. [Google Scholar]
  3. Schleiffer, J.-E.; Lange, A.; Rinderknecht, S.; Kücükay, F. BEREIT: Optimization of Parallel Hybrid Electric Vehicle (HEV) Fleets. CTI MAG 2015, 2015, 25–28. [Google Scholar]
  4. Nüesch, T.; Cerofolini, A.; Mancini, G.; Cavina, N.; Onder, C.; Guzzella, L. Equivalent Consumption Minimization Strategy for the Control of Real Driving NOx Emissions of a Diesel Hybrid Electric Vehicle. Energies 2014, 7, 3148–3178. [Google Scholar] [CrossRef] [Green Version]
  5. Meier, T. Multikriterielle Optimierung hybrider Antriebsstränge Mittels Statistischer Versuchsplanung. Ph.D. Thesis, TU Darmstadt, Darmstadt, Germany, 2014. [Google Scholar]
  6. Danzer, C. Systematische Synthese, Variation, Simulation und Bewertung von Mehrgang- und Mehrantrieb-Systemen Rein Elektrischer und Hybrider Fahrzeugantriebsstränge. Ph.D. Thesis, TU Chemnitz, Chemnitz, Germany, 2016. [Google Scholar]
  7. Seidel, T.; Lange, A.; Küçükay, F. DHT concepts based on DCT design. In Drivetrain for Vehicles 2017; VDI: Bonn, Germany, 2017; Volume 2313. [Google Scholar]
  8. Brouwer, M.; Schleiffer, J.-E. Hybrid Drive Device for a Motor Vehicle. DE102016002863A1, 30 November 2016. [Google Scholar]
  9. Changenet, C.; Oviedo-Marlot, X.; Velex, P. Power Loss Predictions in Geared Transmissions Using Thermal Networks-Applications to a Six-Speed Manual Gearbox. J. Mech. Des. 2005, 128, 618–625. [Google Scholar] [CrossRef]
  10. Shen, Y.; Rinderknecht, S. A method on modelling and analyzing the power losses in vehicle transmission. Forsch. Ing. 2018, 82, 261–270. [Google Scholar] [CrossRef]
  11. Van Harselaar, W.; Hofman, T.; Brouwer, M. Automated Dynamic Modeling of Arbitrary Hybrid and Electric Drivetrain Topologies. IEEE Trans. Veh. Technol. 2018, 67, 6921–6934. [Google Scholar] [CrossRef]
  12. Naunheimer, H.; Fietkau, P.; Lechner, G. Automotive Transmissions: Fundamentals, Selection, Design, and Application, 2nd ed.; Springer: Heidelberg, Germany; New York, NY, USA, 2011. [Google Scholar]
  13. ISO/TR 14179-2:2001. Gears—Thermal capacity—Part 2: Thermal Load-Carrying Capacity; ISO: Geneva, Switzerland, 2001. [Google Scholar]
  14. SKF. Bearing Friction, Power Loss and Starting Torque. Available online: https://www.skf.com/binary/21-299767/0901d1968065e9e7-The-SKF-model-for-calculating-the-frictional-movement_tcm_12-299767.pdf (accessed on 2 March 2020).
  15. Winke, F.; Bargende, M. Dynamic Simulation of Urban Hybrid Electric Vehicles. MTZ Worldw. 2013, 74, 56–63. [Google Scholar] [CrossRef]
  16. Paganelli, G.; Delprat, S.; Guerra, T.M.; Rimaux, J.; Santin, J.J. Equivalent consumption minimization strategy for parallel hybrid powertrains. In Proceedings of the Vehicular Technology Conference, IEEE 55th Vehicular Technology Conference, VTC Spring 2002, Birmingham, AL, USA, 6–9 May 2002; Volume 4, pp. 2076–2081. [Google Scholar]
  17. Serrao, L.; Onori, S.; Rizzoni, G. A Comparative Analysis of Energy Management Strategies for Hybrid Electric Vehicles. J. Dyn. Sys. Meas. Control 2011, 133, 031012. [Google Scholar] [CrossRef] [Green Version]
  18. Koot, M.; Kessels, J.T.B.A.; de Jager, B.; Heemels, W.P.M.H.; van den Bosch, P.P.J.; Steinbuch, M. Energy Management Strategies for Vehicular Electric Power Systems. IEEE Trans. Veh. Technol. 2005, 54, 771–782. [Google Scholar] [CrossRef]
  19. Musardo, C.; Rizzoni, G.; Staccia, B. A-ECMS: An Adaptive Algorithm for Hybrid Electric Vehicle Energy Management. In Proceedings of the 44th IEEE Conference on Decision and Control, European Control Conference 2005, Seville, Spain, 12–15 December 2005; pp. 1816–1823. [Google Scholar]
  20. Alles, J. Erweiterung von Modell und Betriebsstrategie zur simulativen Bewertung von Parallelhybrid-fahrzeug Varianten. Master’s Thesis, TU Darmstadt, Darmstadt, Germany, 2016. [Google Scholar]
  21. Lange, A. Optimierung modularer Elektro- und Hybridantriebe. Ph.D. Thesis, TU Braunschweig, Braunschweig, Germany, 2018. [Google Scholar]
Figure 1. Stick diagram of the novel parallel-hybrid-electric powertrain topology “P2/P3” based on [8].
Vehicles 02 00010 g001
Figure 2. Rough skeleton of the gearset of the novel parallel-hybrid-electric powertrain topology from Figure 1.
Vehicles 02 00010 g002
Figure 3. Exemplary set of determined gear diameters and the corresponding geometric arrangement of the novel P2/P3 parallel-hybrid-electric powertrain topology.
Vehicles 02 00010 g003
Figure 4. Framework of the methodological approach of power loss estimation for novel parallel-hybrid-electric powertrains.
Vehicles 02 00010 g004
Figure 5. Exemplary transmission power losses of the P2/P3 MIMO-transmission system for transmission modes #10–#15 @ n W = 400   rpm and T oil = 85   ° C   .
Vehicles 02 00010 g005
Figure 6. Transmission power losses as a function of the torque split for the P2/P3 MIMO-transmission system in transmission mode #13 at exemplary wheel speed n W = 400   rpm , T oil = 85   ° C   , and total input power of the power sources Σ P ICE + EM = 25 kW   .
Vehicles 02 00010 g006
Figure 7. Offline pre-processing approach for the determination of a transmission systems power loss compensation torque.
Vehicles 02 00010 g007
Figure 8. Extended simulation environment to account for transmission systems power losses in the simulative assessment.
Vehicles 02 00010 g008
Figure 9. Results for the charge sustaining fuel consumption per distance f c d and the mean powertrain efficiency η PT over cycle of the case study P2/P3 simulation variants for the WLTC.
Vehicles 02 00010 g009
Figure 10. Results for the transmission systems energy losses and share distribution of transmission systems energy losses of the case study P2/P3 simulation variants for the WLTC.
Vehicles 02 00010 g010
Figure 11. Time shares of transmission modes over the WLTC for simulation variants SV2 and SV3.
Vehicles 02 00010 g011
Table 1. Transmission modes with a clutch scheme of the novel P2/P3 parallel-hybrid-electric powertrain topology.
Transmission Mode #Mode TypeC1C2C3C4C5C6C7ICE GearEM Gear
1ICE only11000001-
2ICE only10100002-
3ICE only10010003-
4ICE only1000100R-
5EV0100010-P2–1
6EV0000110-R
7EV0010010-P2–2
8EV0000001-P3
9EV0001010-P2–3
10Fixed gear parallel11000101P2–1
11Fixed gear parallel11000011P3
12Fixed gear parallel10100102P2–2
13Fixed gear parallel10100012P3
14Fixed gear parallel10010013P3
15Fixed gear parallel10010103P2–3
16Fixed gear parallel1000110RR
17Fixed gear parallel1000101RP3
18Charge1000010--
Table 2. Vehicle simulation parameters.
ParameterValueUnit
Vehicle mass   m vehicle   1700kg
Air resistance coefficient   c W A   0.632
Dynamic wheel radius   r dyn   0.31m
Rolling resistance coefficient   f R   0.01-
Power demand for auxiliaries   P aux   800W
Table 3. Variants for the simulative assessment of the P2/P3 powertrain topology.
SV 1 : w / o   P l o s s , H y b T M   SV2: w/o Extended Operating StrategySV3: w/Extended Operating Strategy
Transmission Power Losses   P loss , HybTM = 0  
η HybTM = 1
  P loss , HybTM ( n W , T ICE , T EM , m )     P loss , HybTM ( n W , T ICE , T EM , m )  
Operating StrategyLocal optimal distribution of P W only on basis of
  η ICE & η EM  
Local optimal distribution of P W only on basis of   η ICE & η EM   Extended local optimal distribution under consideration of   P loss , HybTM ( n W , T ICE , T EM , m )  

