
Analysis of the Deviation Factors between the Actual and Test Fuel Economy


Department of Civil and Environmental Engineering, Chuo University, 1-13-27 Kasuga, Bunkyo-ku, Tokyo 112-8551, Japan
*
Author to whom correspondence should be addressed.
Vehicles 2021, 3(2), 162-170; https://0-doi-org.brum.beds.ac.uk/10.3390/vehicles3020010
Submission received: 26 March 2021
/
Revised: 19 April 2021
/
Accepted: 21 April 2021
/
Published: 22 April 2021
Abstract
:The Worldwide harmonized Light duty Test Procedure saw its light first as the United Nations Economic Commission for Europe Global Technical Regulation in 2017. However, it remains unclear how much the deviation is between the actual and test fuel economy. In this study, we analyzed the deviation between the actual and test (JC08 and WLTC) fuel economy and examined how well regional characteristics such as average travel speed and temperature could explain the deviation using 182–1035 drivers and 19–52 car models data in Japan. As a result, (1) more than a 30% discrepancy was observed between the actual and JC08 mode test fuel economy, and the higher the test fuel economy, the larger the deviation; (2) regarding WLTC mode fuel economy, the deviation is 19% and constant regardless of the test fuel economy; (3) average travel speed and temperature can explain approximately 8% of the discrepancy.
1. Introduction
The fuel economy of passenger cars is shown at the time of sale based on the fuel economy test. This is calculated from the relationship between the distance and fuel consumption based on the “test cycle” that defines the relationship between time and speed (acceleration) in the laboratory. Fuel economy tests are used for two primary purposes: (1) to monitor the compliance of automobile manufacturers with fuel economy and greenhouse gas emissions standards and (2) to inform consumers about the fuel economy of passenger cars and light trucks [1]. It has been noted that there is a considerable discrepancy between the actual and test fuel economy. This divergence can lead to errors in CO2 emissions reduction by policy interventions and can distort appropriate consumers’ purchase and use of cars.
The actual fuel economy varies greatly. Many factors bring about the divergence between the test fuel economy, such as drivers (hereafter, actual fuel economy), vehicle attributes (e.g., engine, accessories, hybrid system), driving environment (e.g., temperature, congestion level, pavements, vertical alignments), and driver’s behavior (e.g., acceleration, trip distance). It is practically impossible to collect actual fuel economy data in the laboratory.
Lim et al. (2018) [2] showed that the fuel economy is affected by the aging of the engine. Sano et al. (2010) [3] analyzed the gap between the actual and 10/15 test cycle mode fuel economy in Japan and clarified the potential of eco-driving of the on-road real fuel economy improvement. Lee et al. (2014) [4] analyzed the gap between the FTP75 driving cycle and the actual fuel economy. They showed that the differences in fuel economy ranged from 3.9% to 18.5%, and the key factors were engine friction loss, torque converter loss, and accessory loss. Zacharof and Fontaras (2016) [5] analyzed the NEDC-based type approval procedure that had mainly been used in Europe. The procedure resulted in shortfall values ranging between 25% and 35%. They also showed that increased electrical power load (e.g., A/C, steering assist), aerodynamic alterations (roof box, aerofoils), ambient conditions (temperature, wind, rain, and altitude), driving behavior (aggressive driving, driver training), vehicle condition (lubrication, tire condition), increased vehicle mass (passengers, additional equipment), and road conditions (road surface, traffic conditions) affected the in-use fuel consumption.
Fontaras et al. (2017) [6] reviewed the influence of different factors that affect fuel consumption. Factors such as driving behavior, vehicle configuration, and traffic conditions are reconfirmed as highly influential. Greene et al. (2017) [1] showed great variability in individuals’ fuel economy estimates relative to the official government estimates with a small bias relative to the sample average. For consumers, the primary limitation of government fuel economy estimates is imprecision for a given individual rather than bias relative to the average individual. There is evidence that shows that the shortfall between test cycle fuel economy estimates and in-use fuel economy estimates has been increasing since 2005. In addition, Jimenez et al. (2019) [7] showed that the gap was found both in hybrid vehicles and the biggest selling vehicles. Furthermore, the average deviation rate increased before 2015, but decreased following “Dieselgate”.
Recently, Pavlovic (2020) [8] showed that among all factors analyzed, the highest contribution in the fuel consumption gap’s variance comes from the average vehicle speed, followed by the road grade, and trip distance. In addition, the impact of driver factors is not negligible.
After significant efforts from many parties, the Worldwide harmonized Light duty Test Procedure (WLTP) saw its light as the UNECE Global Technical Regulation in 2017. WLTP aims to harmonize test procedures on an international level and set up an equal playing field in the global market. Besides EU countries, WLTP is the standard fuel economy and emission test also for India, South Korea, and Japan. The WLTP is divided into four sub-parts, each one with a different maximum speed:
- Urban (Low, up to 56.5 km/h);
- Suburban (Medium, up to 76.6 km/h);
- Rural (High, up to 97.4 km/h);
- Highway (Extra-high, up to 131.3 km/h).
In Japan, the “Extra-high” sub-part is not introduced, as average and max speeds are greatly different from EU countries. The average speed is 46.5 km/h in EU countries, but changes to 36.6 km/h excluding the “Extra-high” sub-part in Japan. Total distance also changes from 23.27 km to 15.01 km.
The Worldwide harmonized Light vehicles Test Cycles (WLTC) mode fuel economy is disclosed based on the average driving ratio of these modes. Pavlovic et al. (2018) [9] analyzed the procedural differences between the WLTP and the New European Driving Cycle (NEDC), which is the test-procedure that had been used in Europe. They found that the WLTP was likely to increase the type-approval CO2 emissions by approximately 25% in Europe.
However, as far as the author knows, there is no report in Asia regarding the relationship between WLTC and the actual fuel economy. In addition, in Japan, the JC08 mode has been used, but the extent to which it has been used has been reduced by WLTC. Furthermore, although temperature and travel speed affects fuel economy, it is unclear to what extent these regional factors affect the deviation.
In this paper, we analyze the divergence between the actual and JC08 modes that have been used in Japan and the WLTC mode fuel economy using the reported data of actual fuel economy of various car modes, regions, and drivers. In addition, we show how many regional characteristics (temperature and average travel speed) can explain the difference in fuel economy.
2. Materials and Methods
In Japan, the 10/15 mode fuel economy had been used since 1991 for passenger cars. However, it was pointed out that the 10/15 mode deviated from the actual driving condition; therefore, the JC08 mode fuel economy was introduced in April 2011. Since then, discussions on integration have progressed around the world, and the WLTC mode fuel economy has been set since 2017. Figure 1 shows the test cycle of JC08 and the WLTC. Compared with JC08, the WLTC has a longer cycle time and a complicated speed change.
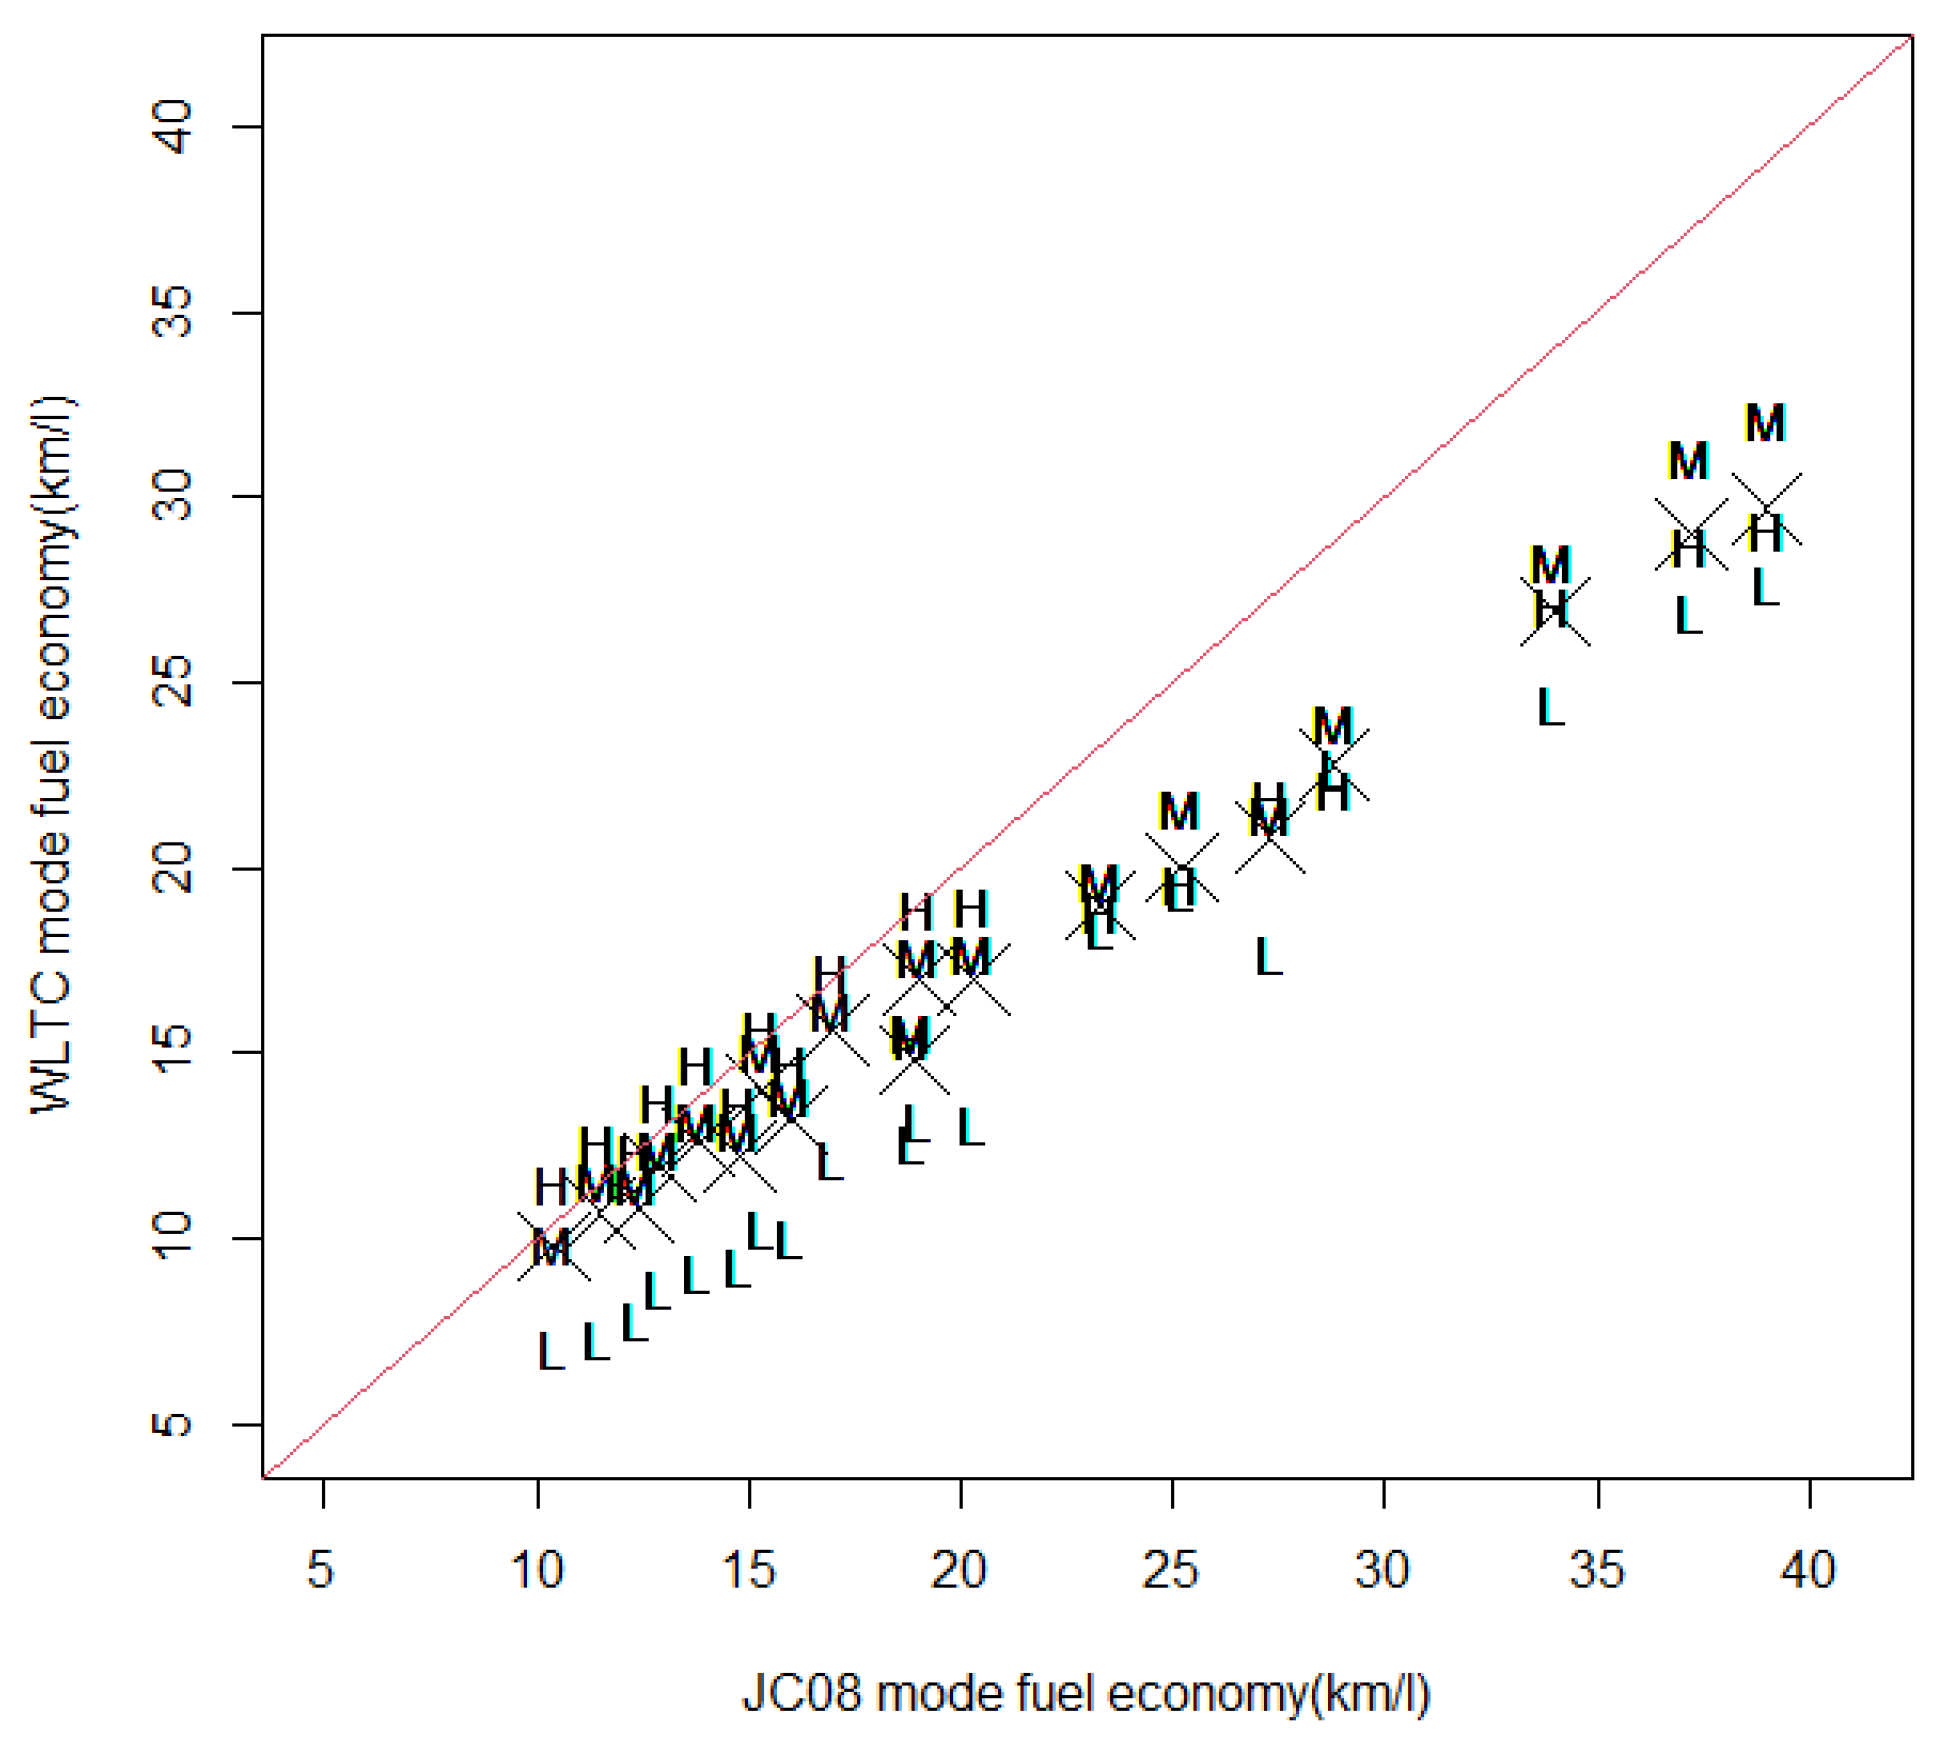
Figure 2 shows the relationship between the JC08 mode and the WLTC mode fuel economy. It can be seen that the WLTC mode fuel economy is lower than the JC08 mode. Regarding the three fuel economies of WLTC (urban, suburban, and rural), when the WLTC fuel economy is less than 20 km/L, the fuel economy improves in the order of urban < suburbs < rural, but when it exceeds 20 km/L, the order is changed: urban < rural < suburbs. Since hybrid vehicles use a lot of batteries, the fuel economy tends to deteriorate when driving in rural areas.
In this study, the fuel economy ratio (=actual fuel economy/test fuel economy) is used as an index of deviation. Using the logarithm of this fuel economy ratio as an explained variable and using a linear mixed-effects model that can consider both fixed effects and random effects, we analyze how regional characteristics such as temperature and travel speed can explain this divergence.
Here, : actual fuel economy (km/L) of driver i, car model j, prefecture k, and month t; : test fuel economy (km/L) of car model j; α: intercept; : car model (fixed effects): average travel speed and temperature in prefecture k and month t; : random effects of driver i; : error term. Random effect and error terms follow a normal distribution.
We estimate the following three regression models for JC08 and WLTC mode:
- Car model (fixed effect);
- Car model + regional characteristics (average temperature and average travel speed);
- Car model + regional characteristics + drivers (random effect).
The three data sources presented below were used for the analysis.
- (1)
- E-NENPI
E-NENPI is a system in which car users record the amount of refueling and mileage and manage the fuel consumption of their cars. Refueling data of tens of thousands of times a month can be obtained from more than 650,000 users nationwide. In this study, we used data from odd-numbered months in 2016. We obtained the car model, the month of refueling, the distance to refueling, the amount of refueling, and the user’s zip code of registered drivers in E-NENPI.
As these are self-reported data, we removed the data based on the following four criteria:
- No prefecture/zip code listed;
- No description of mileage or 0;
- Refueling amount exceeds 97-L;
- The mileage is 60 km or less.
The number of samples is shown in Table 1. As car models with WLTC fuel economy are limited in 2016, the number of samples of WLTC mode is smaller than that of JC08. The number of drivers of JC08 mode and WLTC mode is 1035 and 182, respectively.
Unfortunately, E-NENPI data contain neither temperature nor vehicle speed data of each trip. In order to grasp the seasonal variation and regional differences, we used the following average monthly temperature and average speed for the analysis:
- (2)
- Japan Meteorological Agency
Monthly average temperature data of the prefectural capital city of 47 prefectures in Japan.
- (3)
- NAVITIME (https://www.navitime.co.jp/ (accessed on 21 April 2021))
Average travel speed from the center of the postal code to the city hall where all data were obtained using the NAVITME website.
Descriptive statistics are shown in Table 2.
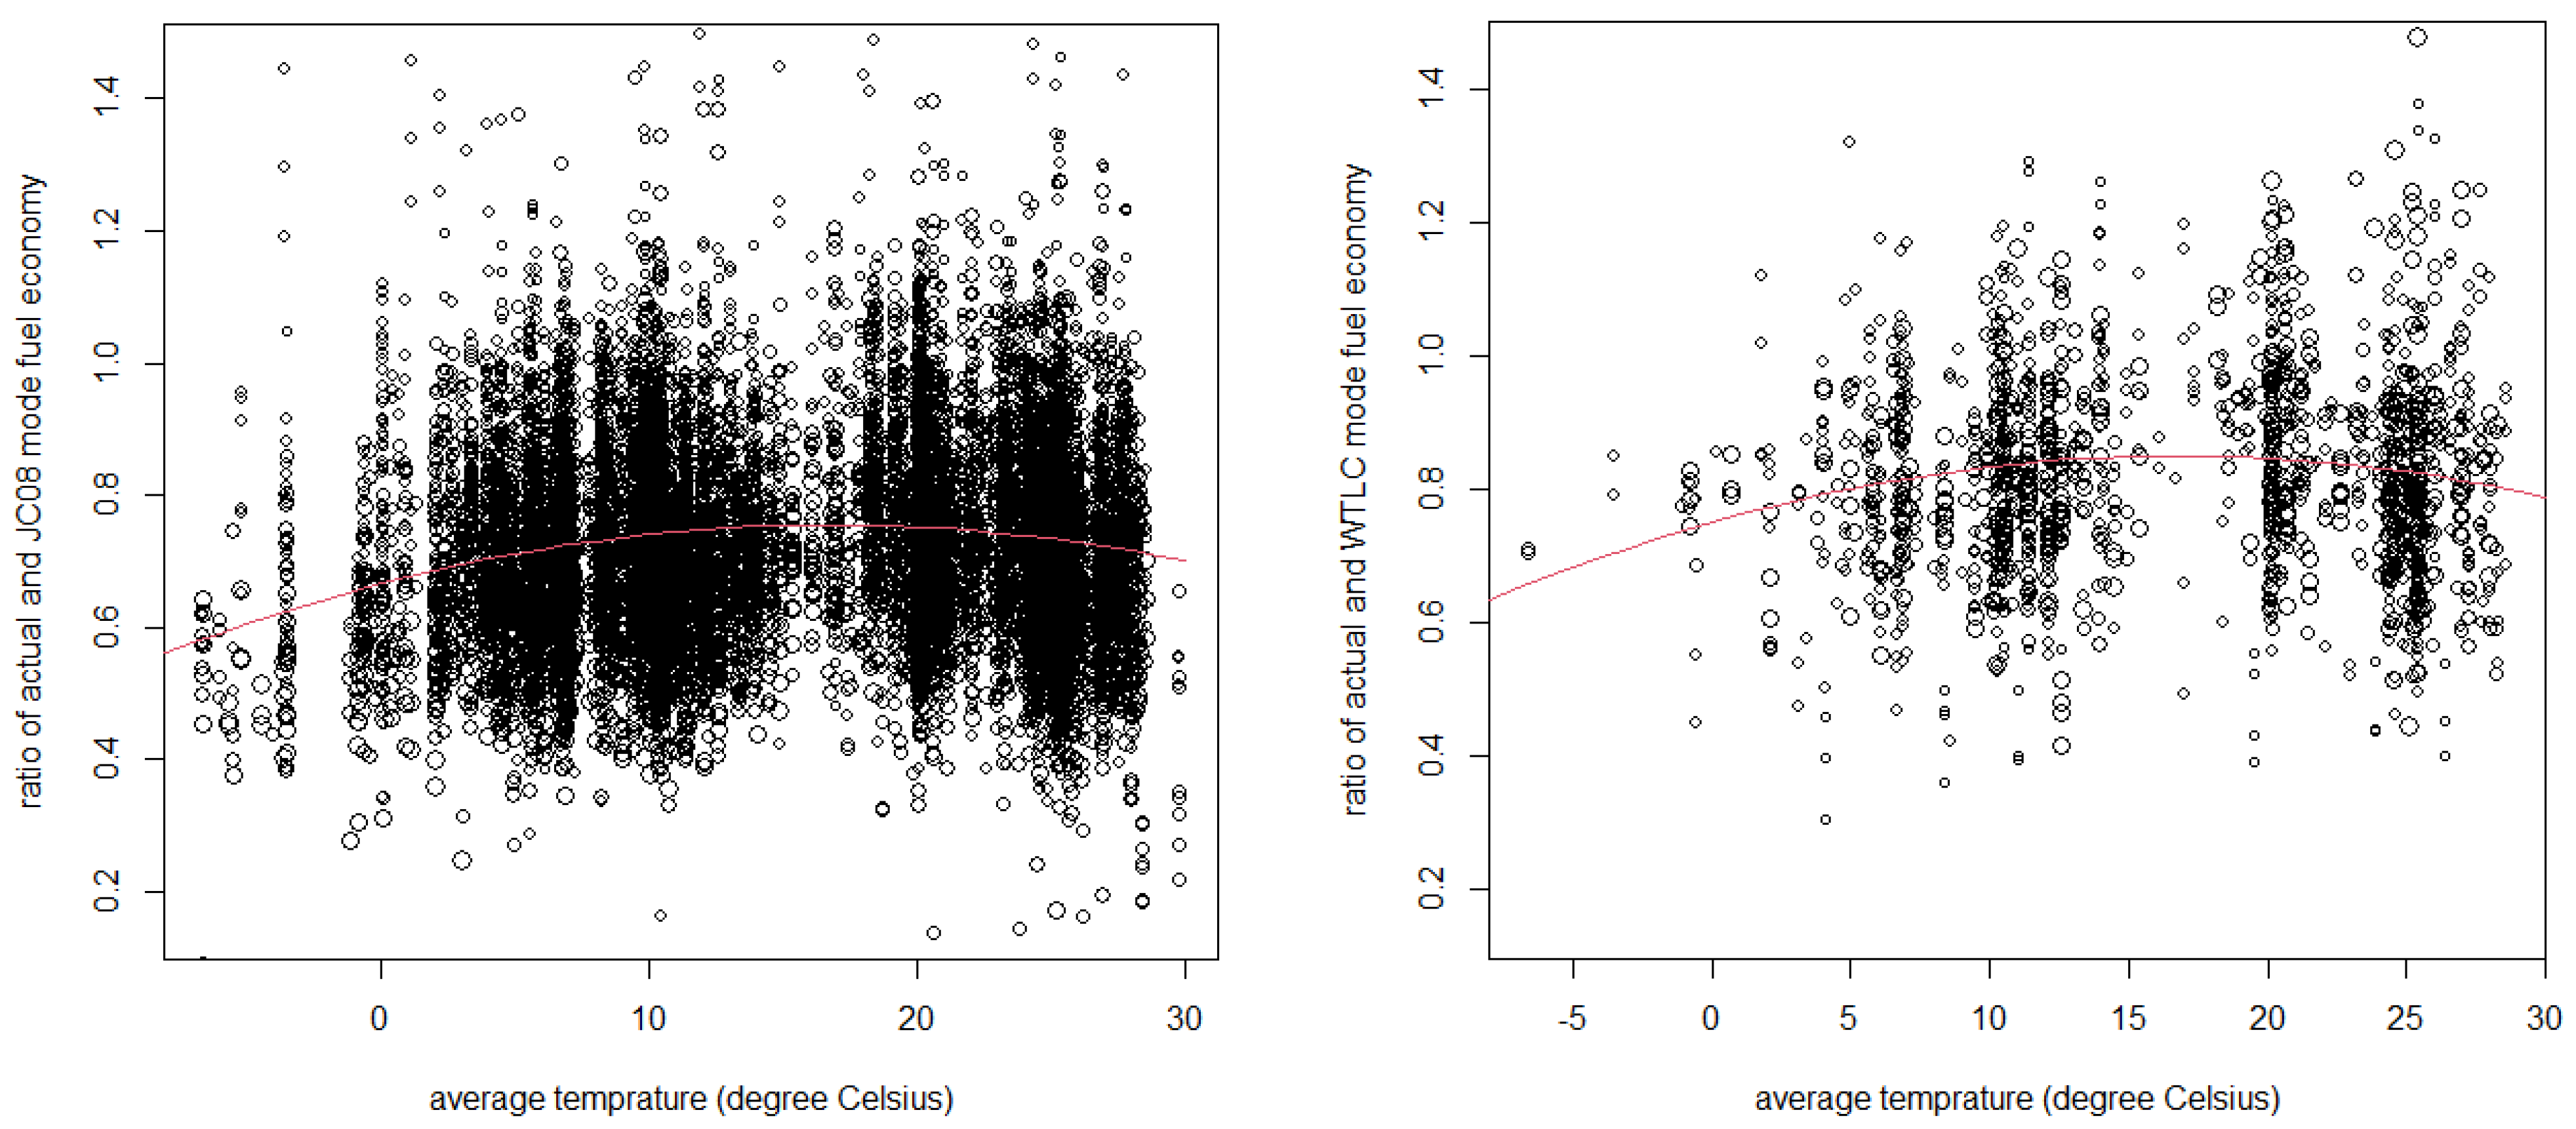
Figure 3 shows the relationship between the average temperature and the fuel economy ratio. The difference in fuel economy is smallest when the temperature is 16.5 degrees Celsius regardless of whether the JC08 or the WLTC mode is used as test fuel economy. This is because the higher the temperature, the larger the difference in fuel economy due to the use of air conditioning, and the lower the temperature, the larger the difference in fuel economy due to mechanical loss.
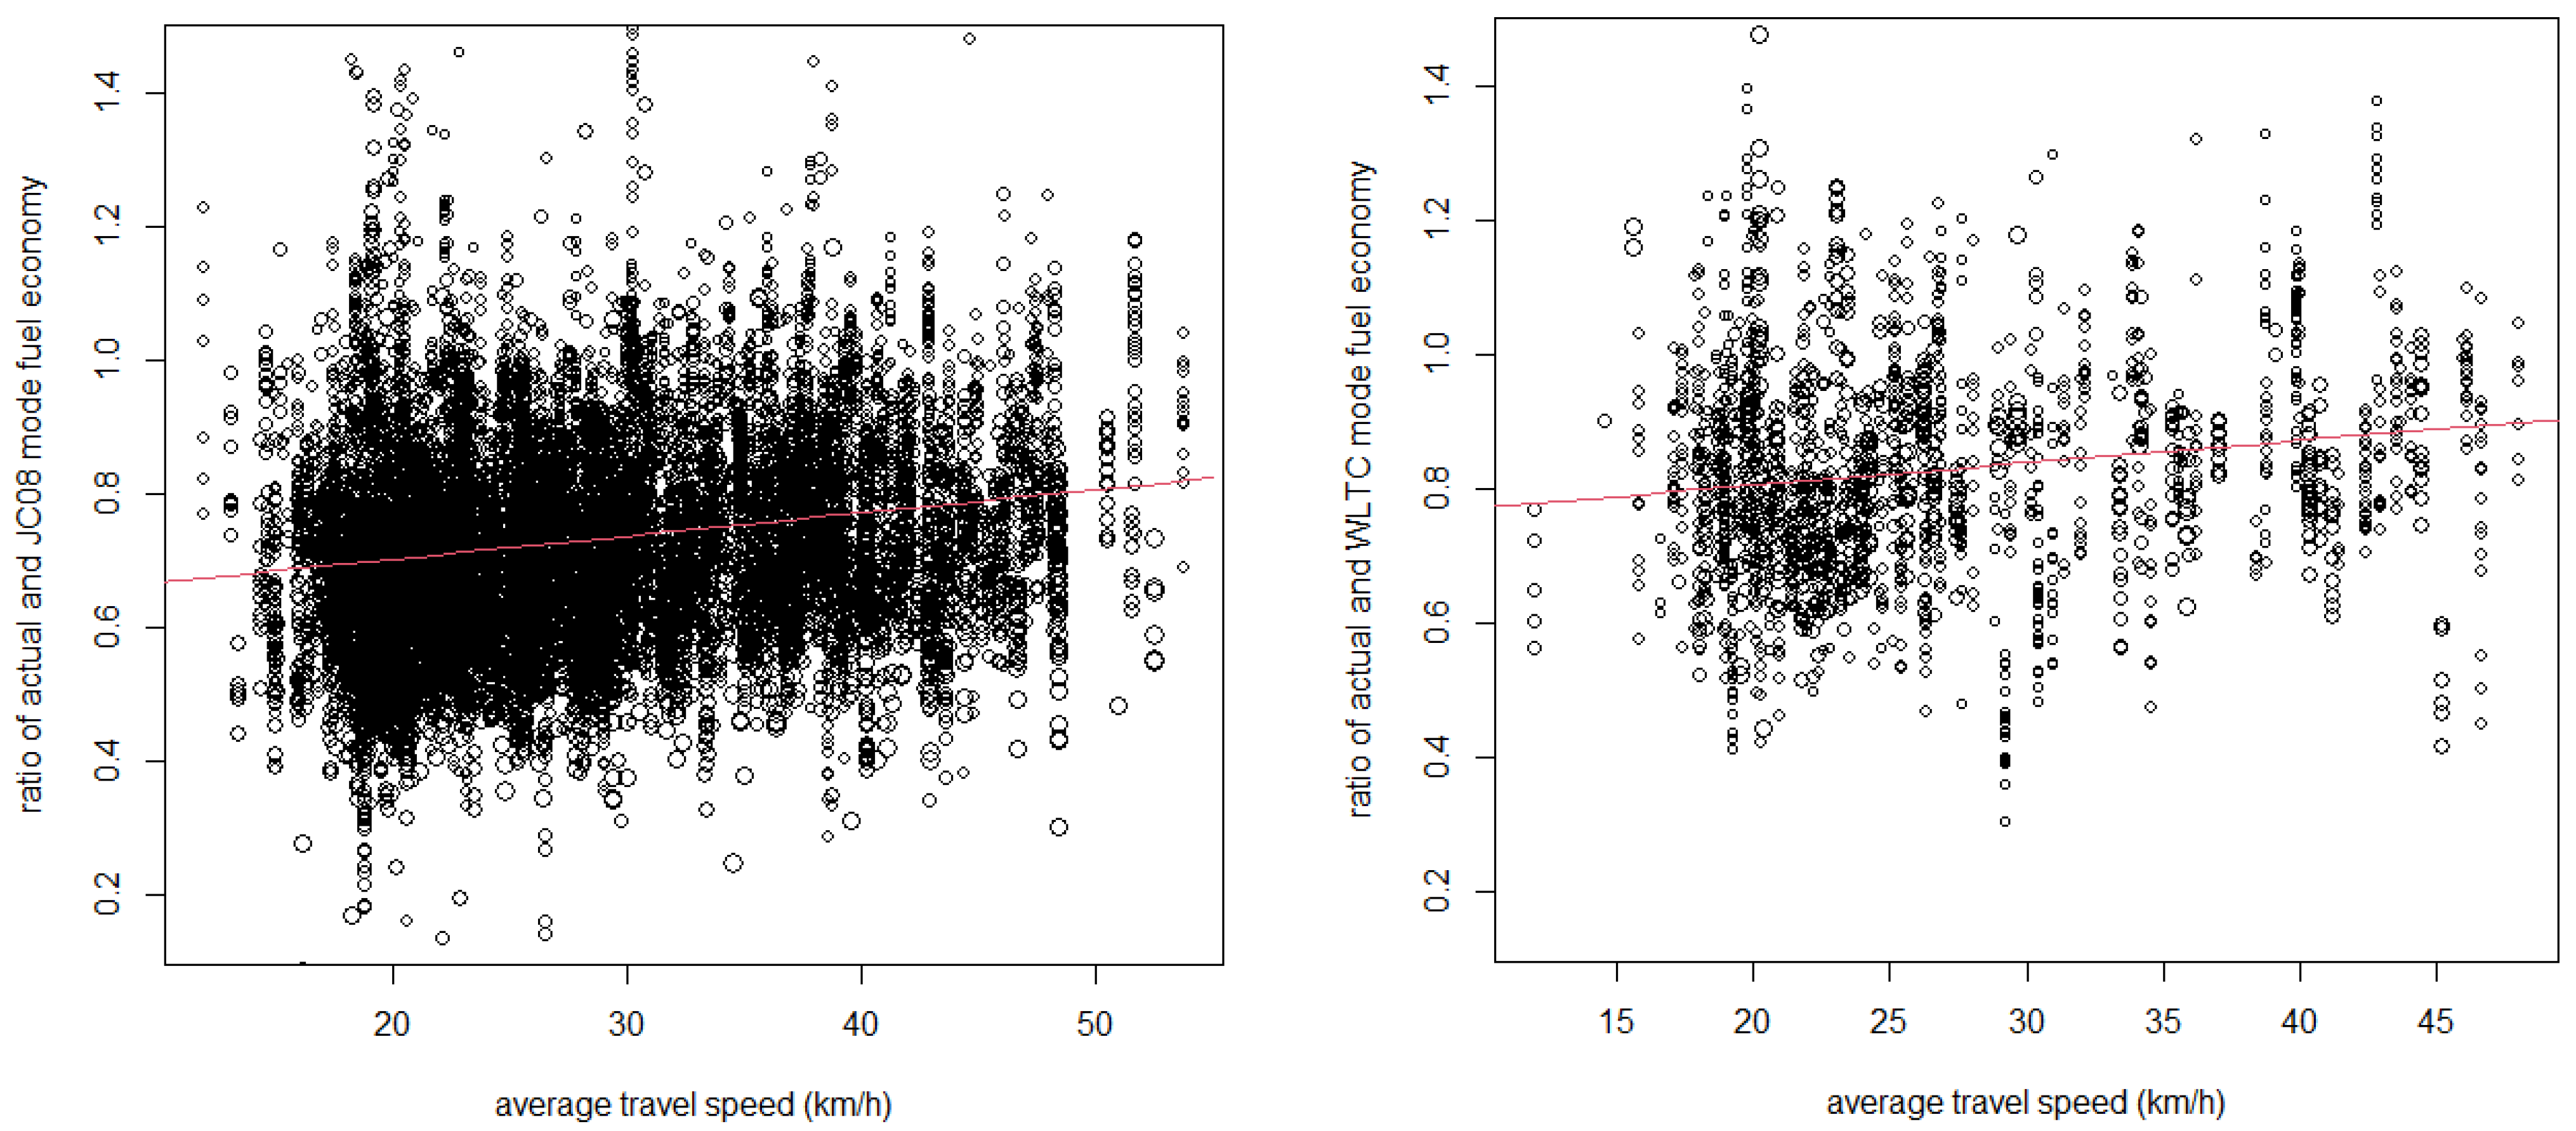
Figure 4 shows a scatter plot of the regional average travel speed and fuel economy ratio. The faster the average speed, the closer the fuel economy ratio is to 1 regardless of whether the JC08 or the WLTC mode is used as test fuel economy, but the variation is extremely large.
3. Results
3.1. Comparison of Actual and Test Fuel Economy
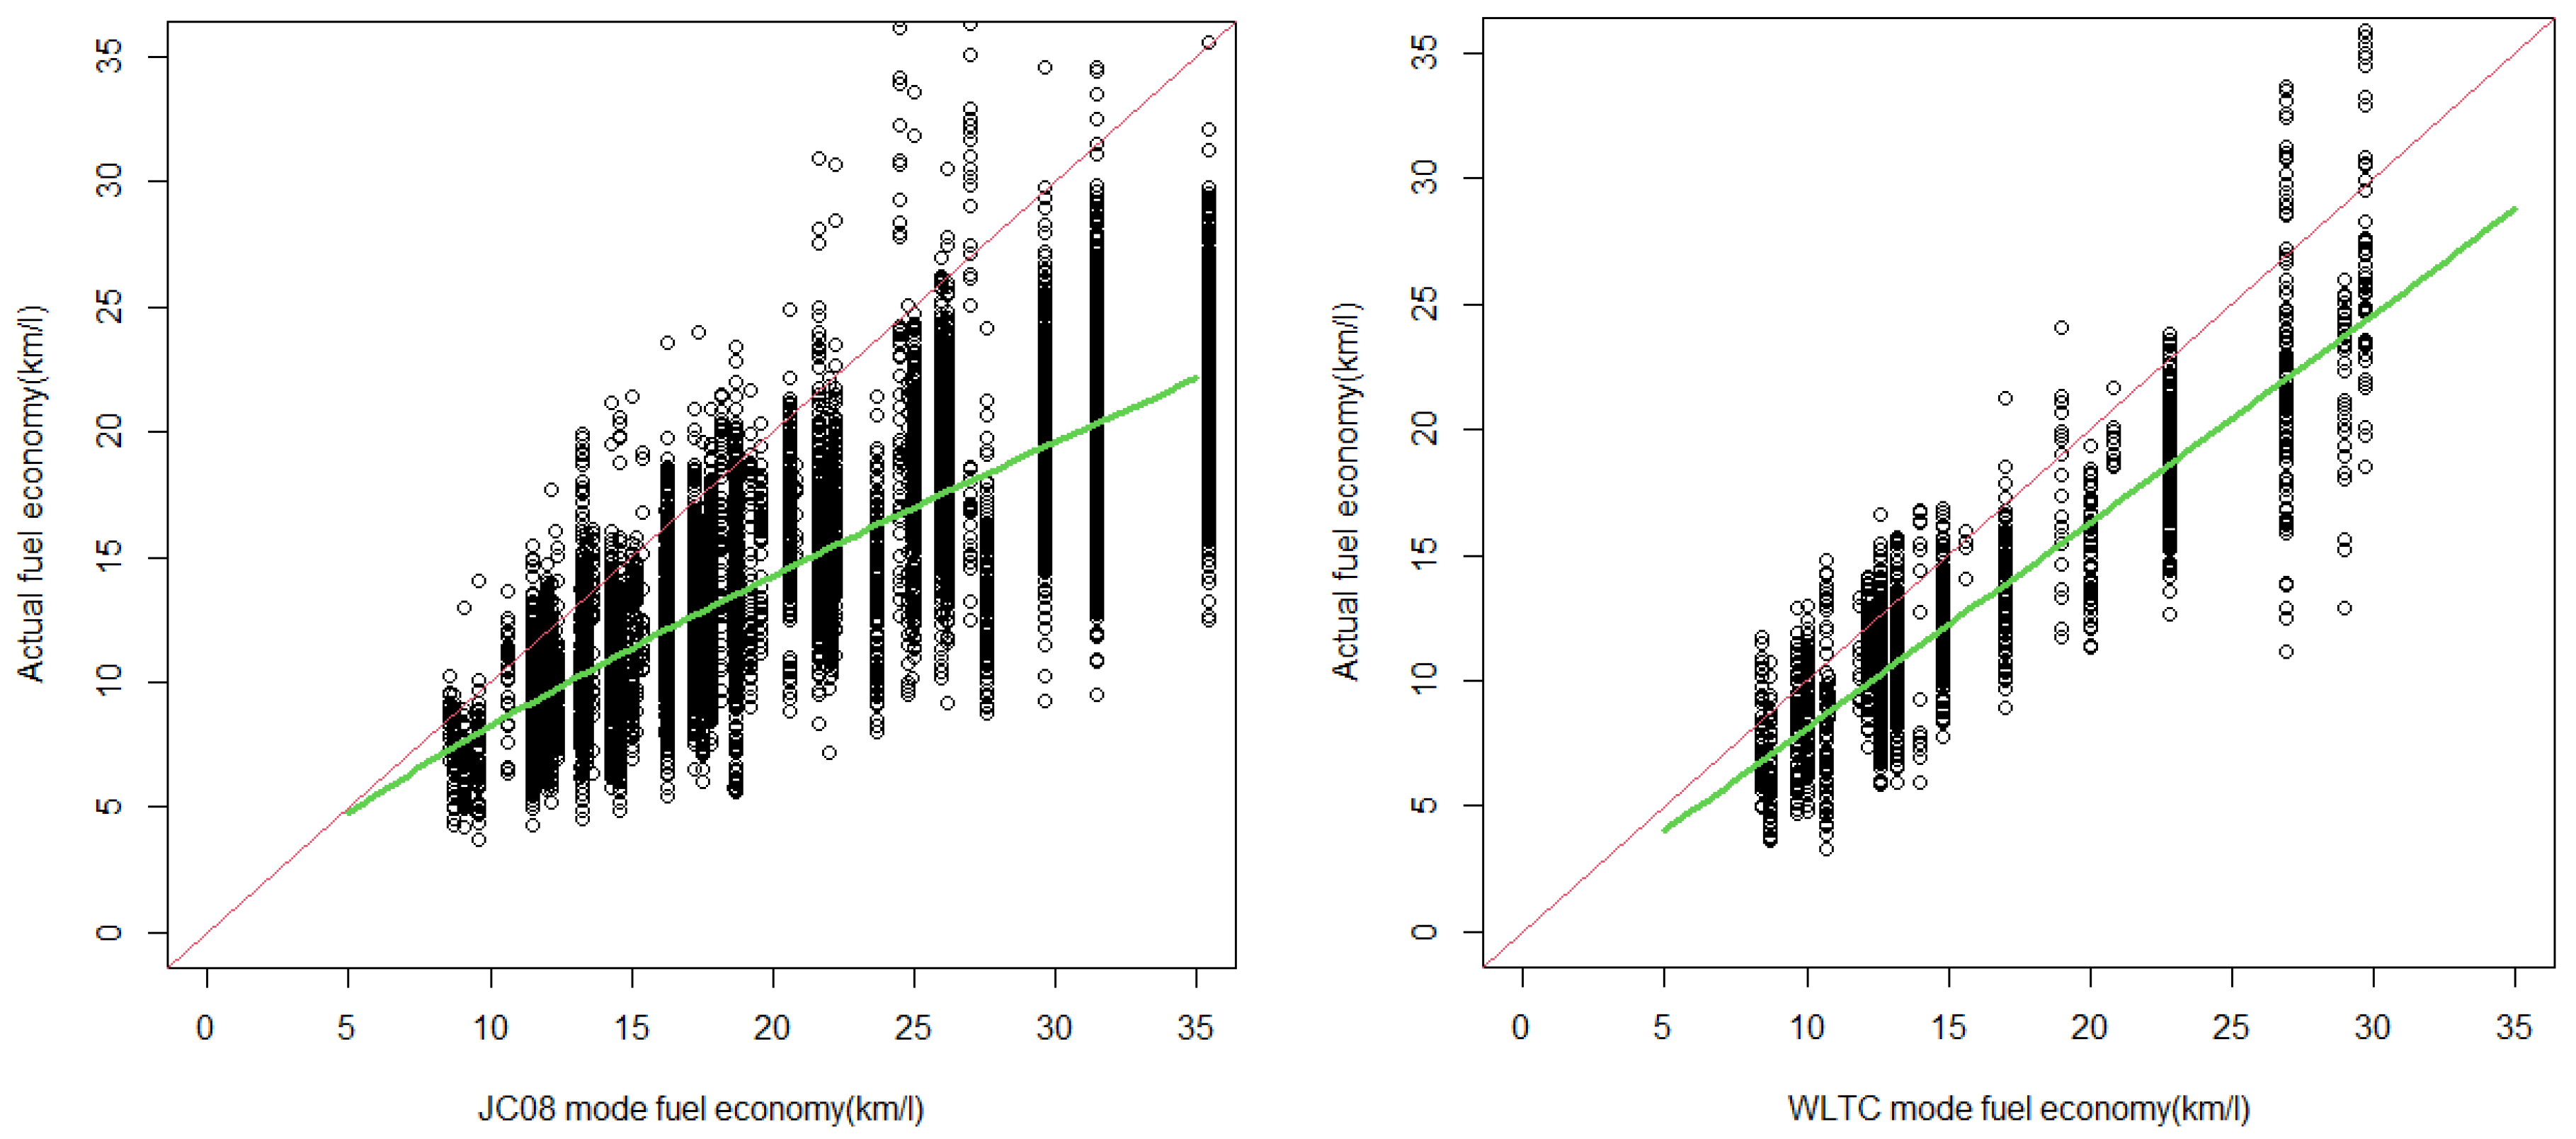
Figure 5 shows a scatter plot of the actual and test fuel economy of the JC08 and the WLTC mode, respectively. The estimation result of the logarithmic linear model is added by the green line. In both modes, most actual fuel economies show lower values than test fuel economies. Interestingly, as shown in the figure, the better the JC08 mode fuel economy, the larger the difference in fuel economy between the green line and the red line. However, the deviation is almost constant regardless of test fuel economy in the case of the WLTC mode. It is considered that the WLTC mode fuel economy is closer to the actual driving condition than JC08 mode fuel economy.
3.2. Impact of Average Temperature and Travel Speed on the Deviation
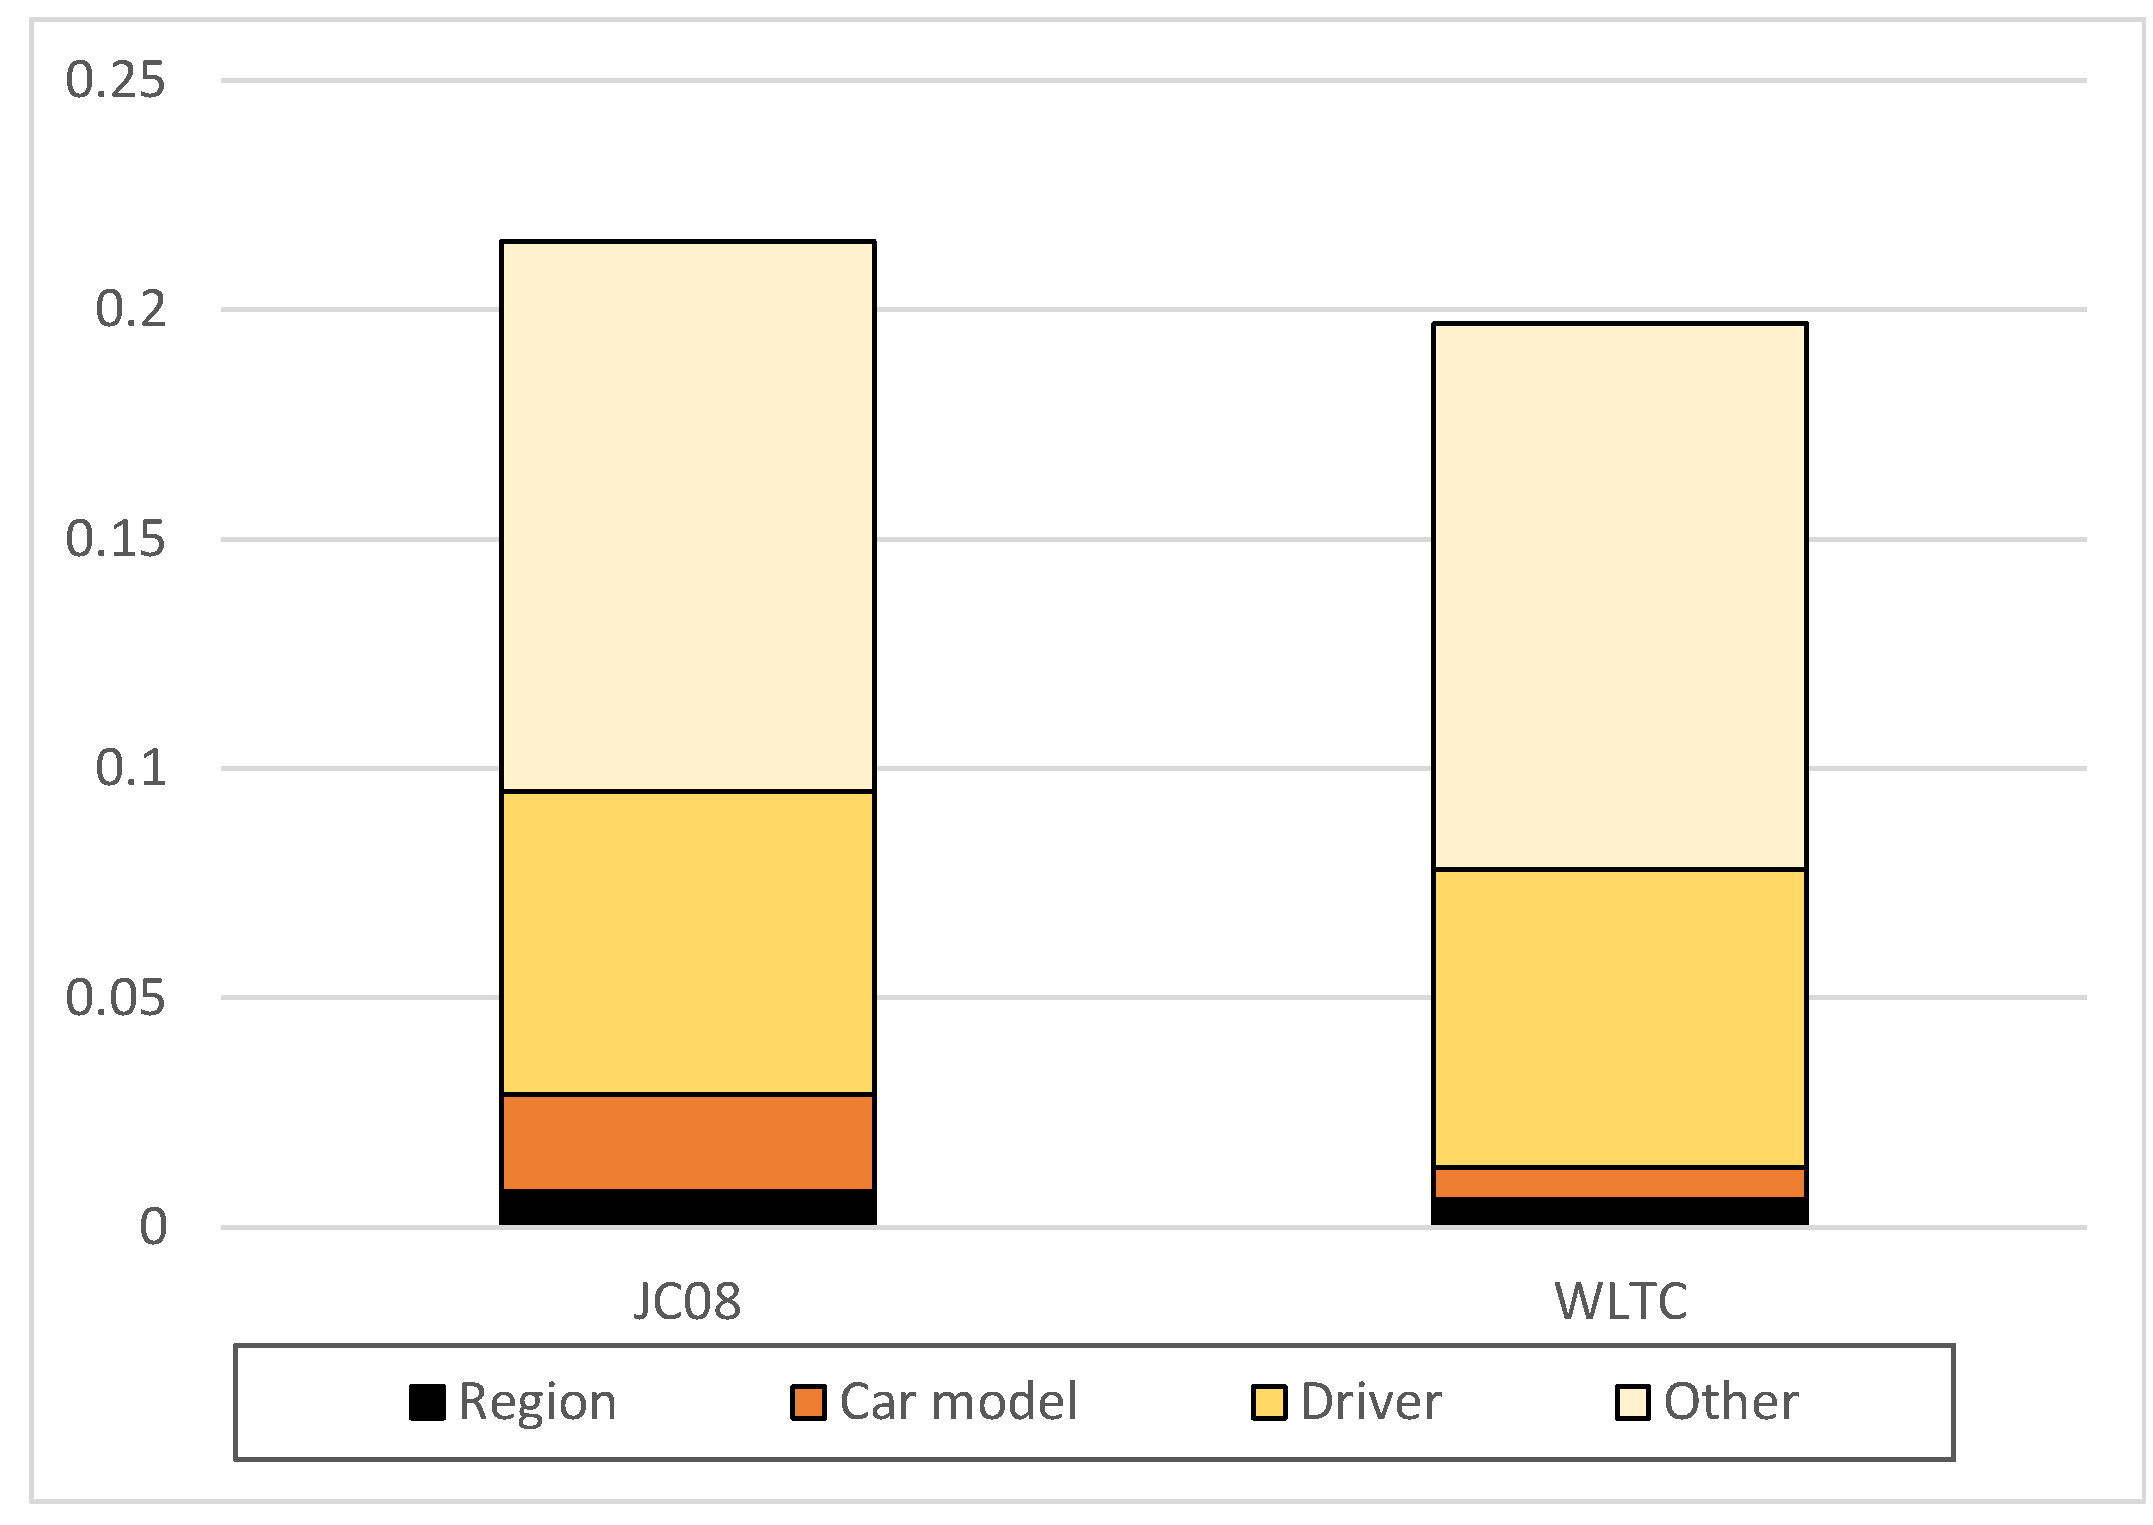
Table 3 shows the estimation results of the three regression models in JC08 mode and WLTC mode. Average temperature and average travel speed show statistical significance. Adjusted R-squared has improved when we added the regional factors and random effect of drivers. Figure 6 summarizes the results of the models. Other refers to the standard error of the residuals of the regression that could not be explained by the model using explanatory variables (car model, region, and drivers). The WLTC mode can explain the difference in fuel economy higher than JC08 mode models. In addition, the improvement of explanatory power by regional characteristics of average temperature and travel speed is about 8%.
4. Discussion
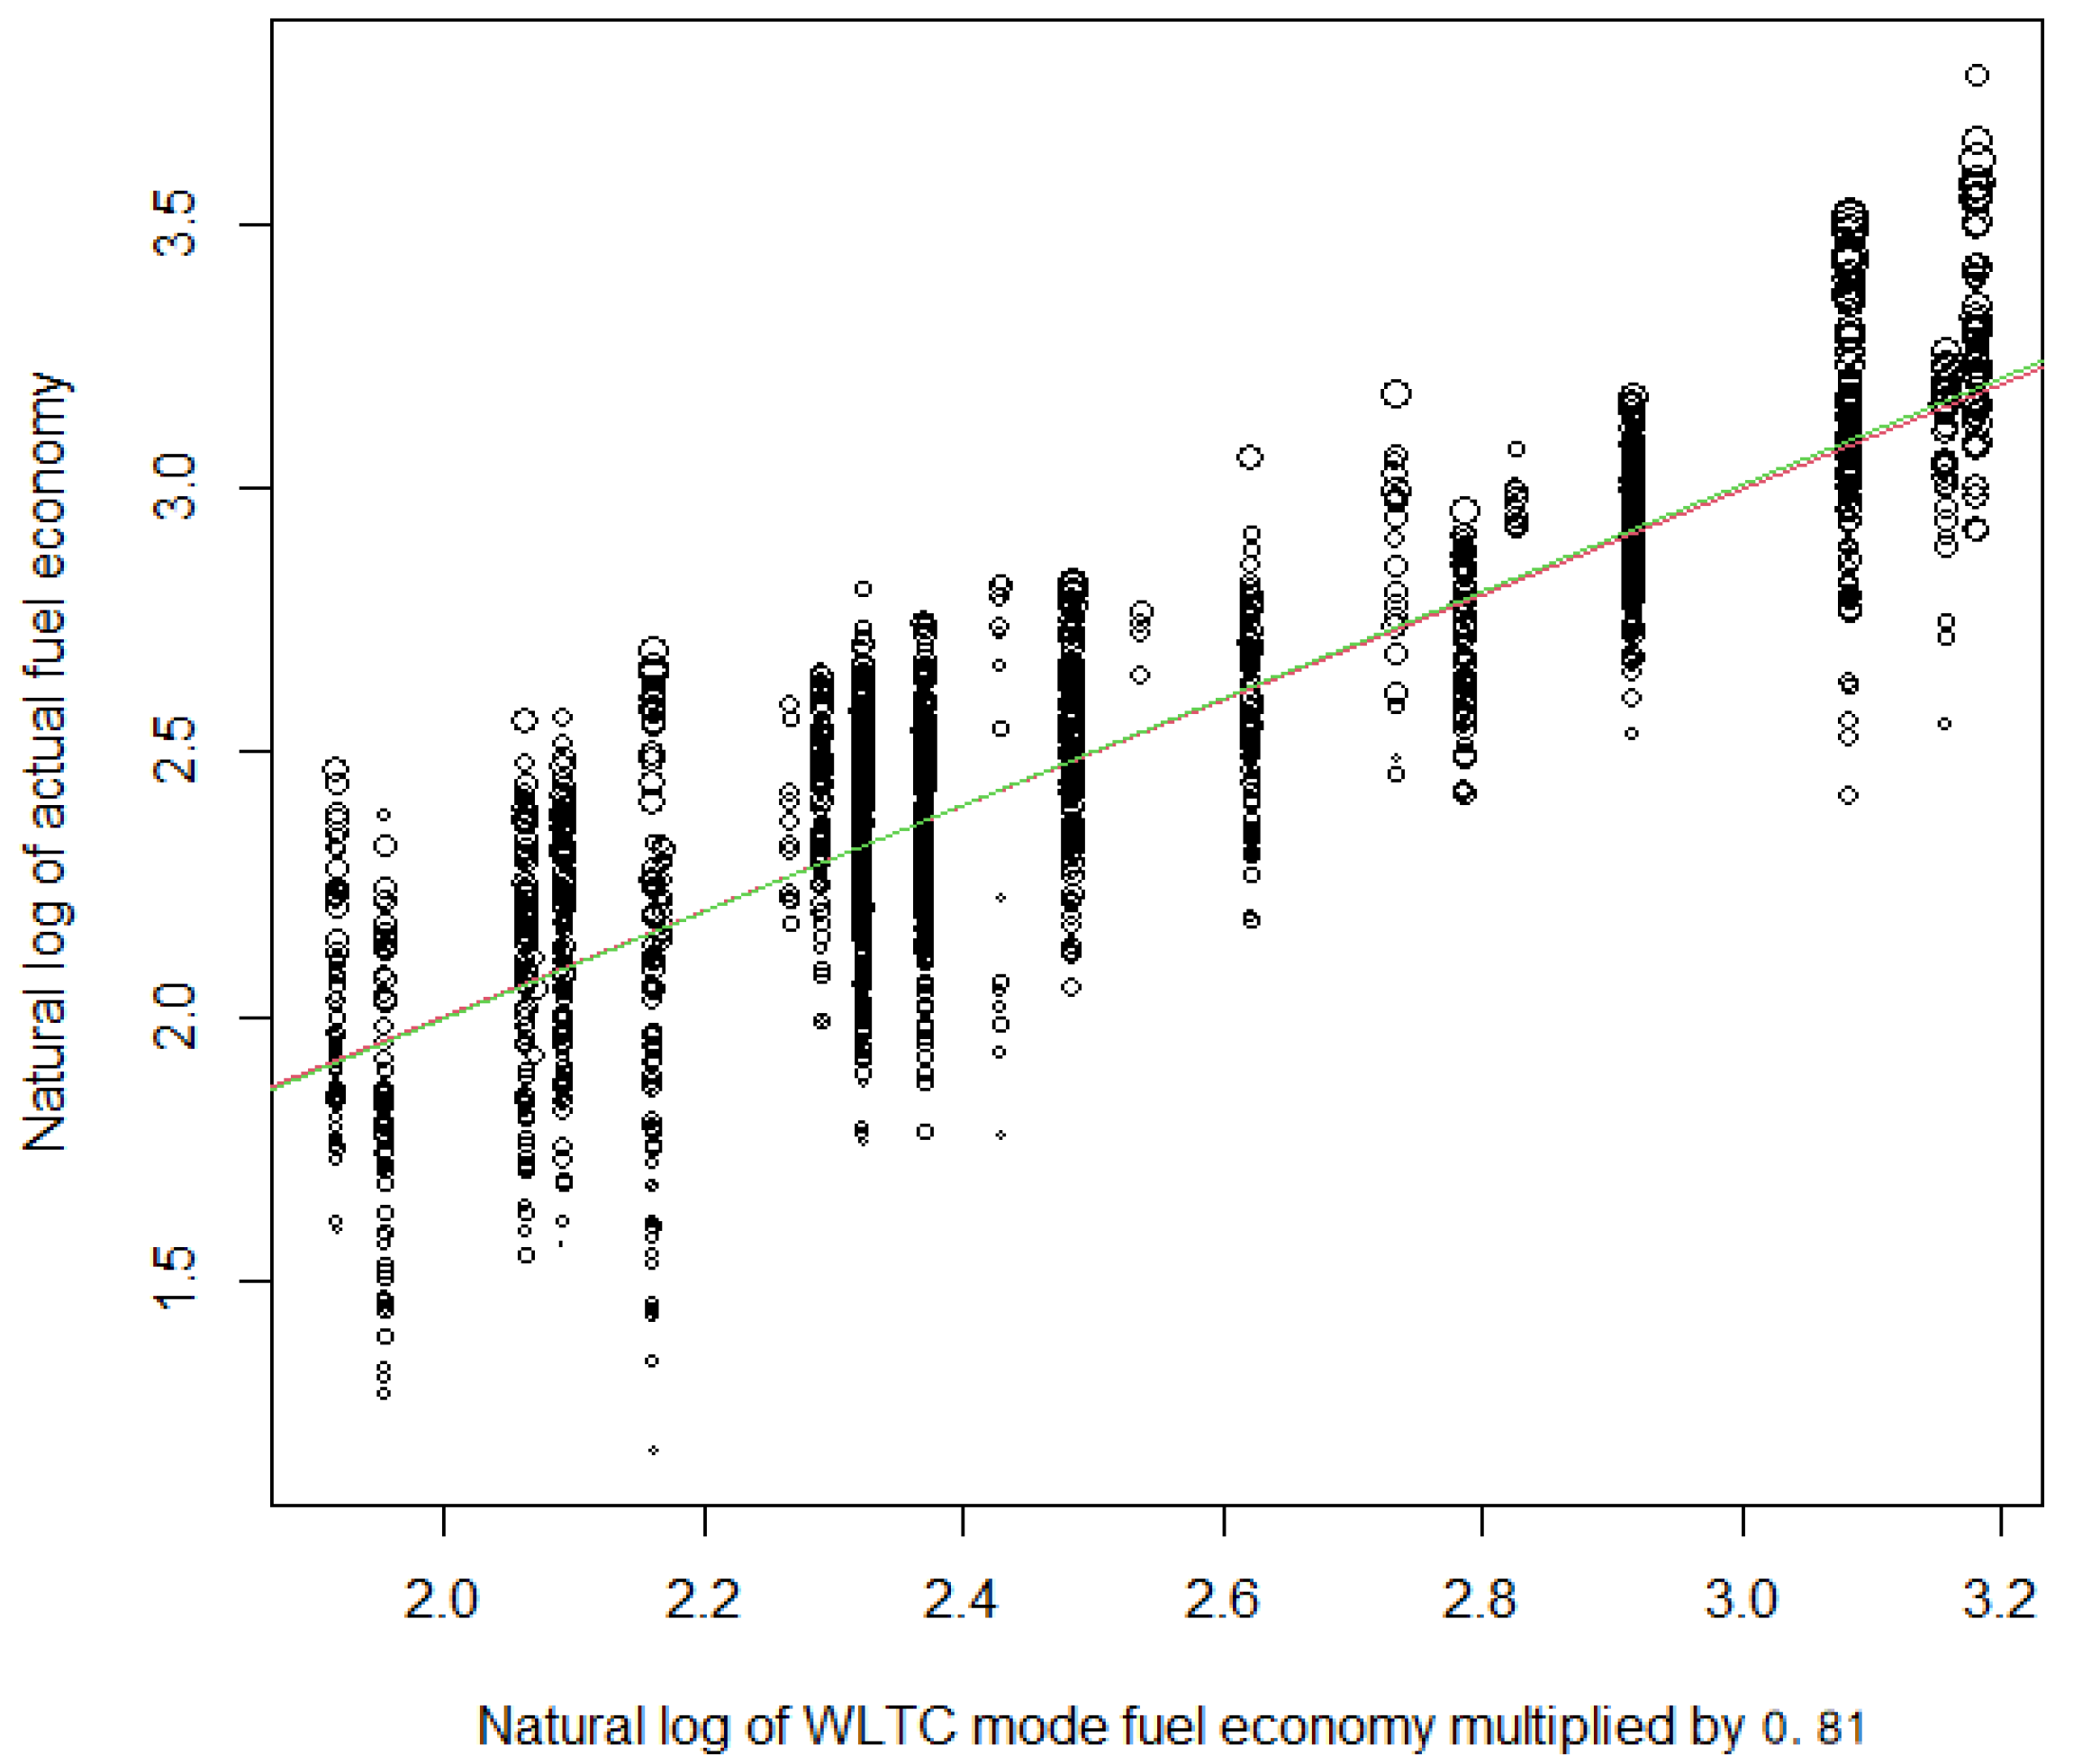
As shown in Figure 5, the WTLC mode fuel economy and actual fuel economy are in a proportional relationship. By simply multiplying the WLTC mode fuel economy by 0.81, the test fuel economy is close to the actual fuel economy (Figure 7). However, the deviation is still large. As shown in Figure 6, even though we consider the variety of car models and regional characteristics (average temperature and travel speed) as fixed effects and drivers as a random effect, the deviation can explain approximately 40%. More detailed information is needed to explain the remaining 60%.
For example, the longer the distance to refueling, the higher the actual fuel economy tends to be. In case of a longer trip length to refueling, it is highly assumed that the driver will mostly drive on highways. This will contribute to a higher fuel economy. However, it is not easy to consider trip distance to refueling into test fuel economy, as this distance is not determined in advance.
In addition, the date and time of driving, the number of passengers, and the weight of luggage, etc. may also have an effect. However, we could not obtain this information in this analysis. This is one of the future tasks.
5. Conclusions
In this paper, we analyzed the deviation between the actual and test (JC08 and WLTC mode) fuel economy as well as the impact of regional factors (average temperature and average travel speed) on the deviation using various car model owners’ reported fuel economy data at refueling. The findings of this paper are as follows:
- -
- JC08 mode fuel economy: The better the test fuel economy, the larger the deviation between the actual and test fuel economy.
- -
- WLTC mode fuel economy: The deviation is almost constant regardless of the test fuel economy, but there is still a deviation of about 19%.
- -
- The effect of deviation due to average travel speed and temperature is only 8%.
How to present test fuel economy by region or driver characteristics and the impact of other air pollutant emissions, including freight vehicles [10], should be explored in future studies.
Author Contributions
Conceptualization, M.T. and T.K.; Methodology, M.T.; Software, M.T.; Validation, M.T. and T.K.; Formal Analysis, M.T.; Investigation, M.T.; Resources, M.T.; Data Curation, M.T.; Writing—Original Draft Preparation, M.T.; Writing—Review and Editing, M.T. and T.K.; Visualization, M.T.; Supervision, M.T.; Project Administration, M.T. All authors have read and agreed to the published version of the manuscript.
Funding
This research received no external funding.
Institutional Review Board Statement
Not applicable.
Informed Consent Statement
Not applicable.
Data Availability Statement
Restrictions apply to the availability of these data. Data were obtained from EverySence Japan, Inc., Tokyo, Japan, and are available with the permission of EverySense Japan Inc.
Acknowledgments
The authors wish to thank the anonymous reviewers for their constructive comments and suggestions on an earlier version of this manuscript. The authors also thank Yo Miyagi at Kawasaki City Government for helping with data collection and analysis and Daisuke Sunaga at Chuo University for the useful comments.
Conflicts of Interest
The authors declare no conflict of interest.
References
- Greene, D.L.; Khattak, A.J.; Liu, J.; Wang, X.; Hopson, J.L.; Goeltz, R. What is the evidence concerning the gap between on-road and Environmental Protection Agency fuel economy ratings? Transp. Policy 2017, 53, 146–160. [Google Scholar] [CrossRef]
- Lim, J.; Lee, Y.; Kim, K.; Lee, J. Experimental analysis of calculation of fuel consumption rate by on-road mileage in a 2.0 L gasoline-fueled passenger vehicle. Appl. Sci. 2018, 8, 2390. [Google Scholar] [CrossRef] [Green Version]
- Sano, M.; Ohno, E.; Kotake, T. Analysis of the gap between on-road real fuel economy and certified fuel economy using the Data Collected by the Web. Trans. Soc. Automot. Eng. Jpn. 2010, 41, 745–750. (In Japanese) [Google Scholar]
- Lee, Y.K.; Park, J.I.; Lee, J.H. Analysis of the effect of cold start on fuel economy of gasoline automatic transmission vehicle. Int. J. Automot. Technol. 2014, 15, 709–714. [Google Scholar] [CrossRef]
- Zacharof, N.G.; Fontaras, G.; Ciuffo, B.; Tsiakmakis, S.; Anagnostopoulos, K.; Marotta, A.; Pavlovic, J.; Codrea, C.; Hodgson, I. Review of in use factors affecting the fuel consumption and CO2 emissions of passenger cars. JRC Sci. Policy Rep. 2016. [Google Scholar] [CrossRef]
- Fontaras, G.; Zacharof, N.; Ciuffo, B. Fuel consumption and CO2 emissions from passenger cars in Europe—Laboratory versus real-world emissions. Prog. Energy Combust Sci. 2017, 60, 97–131. [Google Scholar] [CrossRef]
- Jimenez, J.L.; Valido, J.; Molden, N. The drivers behind differences between official and actual vehicle efficiency and CO2 emissions. Transp. Res. Part D 2019, 67, 628–641. [Google Scholar] [CrossRef]
- Pavlovic, J.; Fontaras, G.; Ktistakis, M.; Anagnostopoulos, K.; Komnos, D.; Ciuffo, B.; Clairotte, M.; Valverde, V. Understanding the origins and variability of the fuel consumption gap: Lessons learned from laboratory tests and a real-driving campaign. Environ. Sci. Eur. 2020, 32, 53. [Google Scholar] [CrossRef] [Green Version]
- Pavlovic, J.; Ciuffo, B.; Fontaras, G.; Valverde Morales, V.; Marotta, A. How much difference in type-approval CO2 emissions from passenger cars in Europe can be expected from changing to the new test procedure (NEDC vs. WLTP)? Transp. Res. Part A Policy Pract. 2018, 111, 136–147. [Google Scholar] [CrossRef]
- Pathak, S.K.; Sood, V.; Singh, Y.; Channiwala, S.A. Real world vehicle emissions: Their correlation with driving parameters. Transp. Res. Part D Transp. Environ. 2016, 44, 157–176. [Google Scholar] [CrossRef]
Figure 1.
JC08 test cycle (left) and WLTC (right). X-axis is time (time) and Y-axis is speed (km/h). Source: https://www.mlit.go.jp/common/001184850.pdf (accessed on 21 April 2021); https://www.naltec.go.jp/publication/regulation/fkoifn0000000ljx-att/fkoifn00000060rh.pdf (accessed on 21 April 2021). (Access: 10APR2021).

Figure 2.
Comparison of JC08 and WLTC fuel economy. (L: urban, M: suburban, H: Rural, WLTC mode fuel economy is shown in X mark). Source: https://www.mlit.go.jp/jidosha/jidosha_mn10_000002.html (accessed on 21 April 2021). (Access: 10APR2021).
Figure 2.
Comparison of JC08 and WLTC fuel economy. (L: urban, M: suburban, H: Rural, WLTC mode fuel economy is shown in X mark). Source: https://www.mlit.go.jp/jidosha/jidosha_mn10_000002.html (accessed on 21 April 2021). (Access: 10APR2021).

Figure 3.
The relationship between the average temperature and the fuel economy ratio when using the JC08 mode (left) and the WLTC mode (right) as a test fuel economy.
Figure 3.
The relationship between the average temperature and the fuel economy ratio when using the JC08 mode (left) and the WLTC mode (right) as a test fuel economy.

Figure 4.
A scatter plot of the regional average travel speed and fuel economy ratio using the JC08 mode (left) and the WLTC mode (right) as a test fuel economy.
Figure 4.
A scatter plot of the regional average travel speed and fuel economy ratio using the JC08 mode (left) and the WLTC mode (right) as a test fuel economy.

Figure 5.
Scatterplot of actual and the JC08 mode (left) and the WLTC mode (right) fuel economy.

Figure 6.
Deviation factors decomposition of standard error of the regression. Note: Y-axis shows the standard error of the residuals.
Figure 6.
Deviation factors decomposition of standard error of the regression. Note: Y-axis shows the standard error of the residuals.

Figure 7.
Scatter plot when the WLTC mode fuel economy is multiplied by 0.81. (The size of the circle indicates the distance to refueling).
Figure 7.
Scatter plot when the WLTC mode fuel economy is multiplied by 0.81. (The size of the circle indicates the distance to refueling).


Table 1.
Number of samples, car models, postal codes, and drivers.
| Test Cycle Mode | Samples | Car Model | Postal Code | Drivers |
|---|---|---|---|---|
| JC08 | 12,169 | 52 | 579 | 1035 |
| WLTC | 1840 | 19 | 152 | 182 |
Table 2.
Descriptive Statistics.
| Min. | Mean | Max. | s.d. | |
|---|---|---|---|---|
| JC08 (km/L) | 8.6 | 21.27 | 35.4 | 7.5 |
| WLTC (km/L) | 9.8 | 16.84 | 29.7 | 5.6 |
| Urban (km/L) | 7.1 | 14.31 | 27.7 | 6.5 |
| Suburban (km/L) | 9.9 | 17.76 | 32.1 | 6.0 |
| Rural (km/L) | 11.5 | 17.81 | 29.1 | 4.8 |
| Actual (km/L) | 3.7 | 15.1 | 44.0 | 5.1 |
| Distance to refueling (km) | 77 | 467 | 1403 | 196 |
| Amount of refueling (liter) | 4.6 | 35.2 | 74.2 | 11.6 |
| Average temperature (°C) | −6.6 | 15.6 | 29.8 | 8.2 |
| Average travel speed (km/h) | 12 | 28.4 | 53.8 | 8.5 |
Table 3.
Estimation results of deviation between actual and the JC08 (top) and the WLTC (bottom) mode fuel economy.
Table 3.
Estimation results of deviation between actual and the JC08 (top) and the WLTC (bottom) mode fuel economy.
| JC08 | 1: Car Model | 2: +Regional Factors | 3: +Random Effect of Drivers | |||
|---|---|---|---|---|---|---|
| Fixed effect | Coef. | t-value | Coef. | t-value | Coef. | t-value |
| Intercept | −2.48 × 10⁻¹ | −30.94 | −5.46 × 10⁻¹ | −39.95 | −5.42 × 10⁻¹ | −18.84 |
| Average temperature | 1.67 × 10⁻² | 17.34 | 1.66 × 10⁻² | 24.31 | ||
| (Average temperature)2 | −5.14 × 10⁻⁴ | −16.55 | −4.89 × 10⁻⁴ | −22.50 | ||
| Average travel speed | 3.73 × 10⁻³ | 14.48 | 3.20 × 10⁻³ | 4.73 | ||
| Car model dummy | YES | |||||
| Random effect | Std. dev. | |||||
| Driver | 0.14 | |||||
| Number of samples | 12,169 | |||||
| Adj. R-squared | 0.27 | 0.33 | 0.74 | |||
| BIC | −4716 | −5461 | −11,814 | |||
| WLTC | 1: car model | 2: + regional factors | 3: + random effect of drivers | |||
| Fixed effect | Coef. | t-value | Coef. | t-value | Coef. | t-value |
| Intercept | −3.30 × 10⁻¹ | −14.86 | −6.25 × 10−0 | −16.68 | −5.50 × 10⁻¹ | −8.35 |
| Average temperature | 1.95 × 10⁻² | 6.94 | 2.05 × 10⁻² | 9.95 | ||
| (Average temperature)2 | −5.66 × 10⁻⁴ | −6.49 | −6.09 × 10⁻⁴ | −9.58 | ||
| Average travel speed | 4.54 × 10⁻³ | 6.47 | 4.16 × 10⁻³ | 2.35 | ||
| Car model dummy | YES | |||||
| Random effect | Std. dev. | |||||
| Driver | 0.14 | |||||
| Number of samples | 1840 | |||||
| Adj. R-squared | 0.09 | 0.14 | 0.63 | |||
| BIC | −581 | −658 | −1458 | |||
Publisher’s Note: MDPI stays neutral with regard to jurisdictional claims in published maps and institutional affiliations. |
© 2021 by the authors. Licensee MDPI, Basel, Switzerland. This article is an open access article distributed under the terms and conditions of the Creative Commons Attribution (CC BY) license (https://creativecommons.org/licenses/by/4.0/).
Share and Cite
MDPI and ACS Style
Tanishita, M.; Kobayashi, T. Analysis of the Deviation Factors between the Actual and Test Fuel Economy. Vehicles 2021, 3, 162-170. https://0-doi-org.brum.beds.ac.uk/10.3390/vehicles3020010
AMA Style
Tanishita M, Kobayashi T. Analysis of the Deviation Factors between the Actual and Test Fuel Economy. Vehicles. 2021; 3(2):162-170. https://0-doi-org.brum.beds.ac.uk/10.3390/vehicles3020010
Chicago/Turabian StyleTanishita, Masayoshi, and Takashi Kobayashi. 2021. "Analysis of the Deviation Factors between the Actual and Test Fuel Economy" Vehicles 3, no. 2: 162-170. https://0-doi-org.brum.beds.ac.uk/10.3390/vehicles3020010