
Macroscopic Traffic Simulation of Autonomous Vehicle Effects


Department of Automotive Technologies, Faculty of Transportation Engineering and Vehicle Engineering, Budapest University of Technology and Economics, Műegyetem rkp. 3, 1111 Budapest, Hungary
*
Author to whom correspondence should be addressed.
Vehicles 2021, 3(2), 187-196; https://0-doi-org.brum.beds.ac.uk/10.3390/vehicles3020012
Submission received: 4 April 2021
/
Revised: 20 April 2021
/
Accepted: 25 April 2021
/
Published: 29 April 2021
Abstract
:The increasing worldwide demand on urban road transportation systems requires more restrictive measures and policies to reduce congestion, time delay and pollution. Autonomous vehicle mobility services, both shared and private, are possibly a good step towards a better road transportation future. This article aims to study the expected impact of private autonomous vehicles on road traffic parameters from a macroscopic level. The proposed methodology focuses on finding the different effects of different combinations of autonomous vehicle penetration and Passenger Car Units (PCU) on the chosen road traffic model. Four parameters are studied: traveled daily kilometers, daily hours, total daily delay and average network speed. The analysis improves the four parameters differently by implementing autonomous vehicles. The parameter total delay has the most significant reduction. Finally, several mathematical models are developed for the percentage of improvement for each chosen parameter.
1. Introduction
Automated Vehicles (AV) will be a huge part of road transportation systems in the future. AVs will use and share infrastructure and interact with human users (human-driven vehicles and pedestrians) and other AVs at the same time. The introduction of the first electronic driver assist systems such as Electronic Stability Control (ESC) and Anti-Block System (ABS) focused on improving road transportation safety. Recently, the focus is to automate the whole driving experience starting from small automation (lane control and cruise control) to fully automated driven vehicles.
The shift from conventional vehicles to automated vehicles follows the six automation levels presented in the traffic stream (0, No Automation; 1, Hands on; 2, Hands off; 3, Eyes off; 4, Mind off; 5, Steering wheel optional) [1,2]. It also depends on the penetration rate of AVs of the total traffic. AVs will partially reduce or even eliminate human factors from traffic flow, reducing gap for lane changing, headway, reaction time using 360-degree sensors and cameras expected to increase road capacity, leading to lower congestion [3]. Communications and the exchange of information between AVs and the infrastructure, the Cooperative Intelligent Transportation System (C-ITS), is valuable to identify the traffic states on urban roads [4,5]. Moreover, it provides more information for intersection control, applying the best actions to improve traffic operations [6].
In this paper, macroscopic traffic flow simulation models are developed to assess the effect of autonomous vehicles on several traffic parameters for a better understanding of the expected AV implementation impact on a larger scale. In the second part, mathematical models are developed to predict the impact of AVs on the different macroscopic traffic-related parameters. Referring to the massive amount of data provided in the used model (different road types, vehicle categories, road speeds, origin–destinations matrices, etc.), a Passenger Car Unit/AV penetration methodology is proposed and simulated using the Visum software [7].
2. Literature Review
Many studies on the future impact of AVs have been conducted, focusing on microscopic and macroscopic network analysis and simulations. Artmann et al. [8] made an impact assessment of the AV capacity of freeways using microscopic traffic flow simulation for several penetration rates. Their results show that AVs allow shorter headways between the vehicles, increasing the freeway network’s capacity by 30% and reducing traffic delays significantly for higher penetrations rates of AVs. In contrast, low penetrations did not yield noticeable capacity benefits. Hartmann et al. found that traffic consisting of 20% conventional vehicles, 60% Cooperative Adaptive Cruise Control (CACC) and 20% Adaptive Cruise Control (ACC) increased lane capacity from 2100 vehicles/hour for 100% conventional vehicles to 2900 vehicles/h [9]. Chen et al. studied highway traffic capacity for mixed traffic of conventional vehicles and AVs considering different AV penetration rates, microscopic characteristics of conventional vehicles and AVs and other lane policies (conventional vehicles exclusive and/or AV lanes or mixed lanes) [10]. The California PATH study showed that AVs in platoons could maintain a time gap as small as 0.6 s compared to 1.5 s for conventional vehicles, indicating a considerable increase in road capacity and congestion reduction [11,12].
Jerath and Brennan [13] found that the introduction of ACC vehicles into the traffic flow may create higher traffic flows and lower congestion rates. Several studies investigated microscopic driving behavior changes in AVs, using simulations such as acceleration and deceleration, flow stability and reaction times [14,15,16,17].
Cooperative Intelligent Transportation System (C-ITS) communication among vehicles (V2V), infrastructure (V2I and I2V) and central traffic system (C2I) is also a significant factor to consider in improving the operation of highly automated vehicles [18,19]. V2X communications proved that it could provide local traffic flow stability, significantly smoothen the shock waves of traffic flow and reduce emissions [20,21]. Elhenawy et al. studied AVs equipped with Cooperative Adaptive Cruise Control (CACC) systems at uncontrolled intersections. They showed a drop in vehicle travel time in the range of 49% and 89% for delay, relative to an all-way stop sign control [22]. Other studies on CACC showed that the implementation of full penetration CACC on the regional road network reduced total delay by 12% [23,24]. Other C-ITS systems, such as Green Light Optimal Speed Advisory (GLOSA) systems that help drivers pass traffic light controlled intersection in the remaining green time, showed improved traffic flow and reduced CO2 emissions [25,26]. Baz et al.’s study on intersection control and delay optimization for autonomous vehicles flow found the AV-to-AV communication model reduced the delay by 65% compared to a roundabout and 84% compared to a four-legged signalized intersection, and AV-to-conventional vehicles model improved them by 30% and 89%, respectively [27].
Private vehicle ownership has shown a rapid increase even with further limiting regulation, especially in large cities [28,29]. Despite that, the introduction of AVs also has the potential of reducing daily trips. A stated preference survey found that, when choosing between different private transport modes, 44% chose conventional private cars, 32% chose private AVs and 24% chose shared AVs [30,31]. Becker and Axhausen’s study showed that households with one or more cars would reduce the number of owned vehicles when AV services are available regardless of the cost for the novel service [32]. Another resolution to mitigate traffic congestion and reduce car ownership is the possibility of using AVs as a ridesharing service. Xu et al. introduced a mathematical framework for ride-sharing impacts on traffic congestion and how congestion affects ridesharing activities [33]. Ma et al. found that ridesharing under the origin–destination-based pricing strategy reduced the travel cost for travelers and the deliberate alternative routes, which can be applied to future AVs [34]. More studies have established the same point, i.e., that AVs reduce daily trips by reducing private car ownership and increasing shared AV trips, for both car-sharing and ridesharing [35,36,37,38].
3. Methodology and Model Building
The methodology adopted to estimate AVs’ impact on traffic parameters focuses on changing two AV characteristics. This paper discusses private transport. Two traffic parameters are investigated: the daily vehicle traveled kilometers and the everyday vehicle traveled hours. The two parameters are evaluated for different private transport modes. Transportation modes involve three passenger cars classes (cars, automated vehicles and taxis) and four heavy vehicle classes (light, medium, buses and coaches and heavy).
Two AV characteristic representations are input into the model to evaluate the impacts of traffic parameters. Firstly, AV penetration is the percentage of passenger cars class AV daily trips compared to the model’s total daily trips. Penetration values vary from a minimum of zero trips made by AVs. All cars are traditional passenger vehicles (0% penetration) to a maximum of all daily trips are performed by AVs (100% penetration), where the interval of the investigated domain is divided by 10%.
The second investigated AV characteristic is the value reduction of road saturation, represented by Passenger Car Unit (PCU) capacity modification factor in the Visum EFM model. PCU of different vehicles is required to convert a mixed traffic stream into a homogeneous equivalent, thereby expressing the mixed traffic flow in terms of an equivalent number of passenger cars [39]. PCU reflects how much impact a specific transport mode has on traffic variables compared to one regular passenger car. Modifying PCU values for the AV class is structured on the expected positive effect of connected AVs on roads capacity and saturation characteristics [40]. The saturation reduction is mainly achieved by lower following distance and headway between vehicles and other factors such as:
- Level of automation
- V2V and V2I communications
- A lower level of following distance and headway
- Shorter required gap for lane changing
- Shorter braking reaction time
- Sensors and 360-degree cameras
- Shorter walking time
- Shorter parking time
PCU values for the AV class are considered to be 0.50–0.90 with 0.05 increments and PCU 0.98. The selected values are chosen to cover the expected range of AV effect, which improves road capacity and has a large dataset to develop statistical models for traffic parameters. Equilibrium assignment is selected to study how different penetration and PCU combinations affect the network, which distributes the demand according to Wardrop’s first principle [41]. The equilibrium assignment calculates the primary vehicle volumes on each link by dividing the demand consistently over a set number of iterations. The system then searches for alternative routes with lower impedance, where vehicles will be shifted to newfound links to improve network operability. The procedure terminates if a balanced state has been reached, which means no more vehicles are to be shifted between routes [42].
The calculation process for the selected traffic parameters of the model is evaluated by running multiple static equilibrium assignment problems for different scenarios. Each assignment aims to choose the best route for each trip with the lowest travel cost. The scenarios vary by keeping the AV penetration values external and changing PCU values of the AV class with each simulation run. After that, the penetration is changed to the next value and run for each PCU value. These steps are repeated until all penetration and PCU values are covered with 100 scenarios, ensuring analysis for a more extensive range.
4. Case Study
Budapest is the capital of Hungary, having most of the road terminal stations, where all major highways and railways terminate. The road network is primarily made up of rings roads and avenues spreading out from the city center. Budapest’s road network is 4500 km long, and the roads are divided into four road categories: highway, primary main road, secondary main road and local roads. Budapest’s public transport consists of four metro lines, 260 bus routes and 30 tram lines serving around five million trips per day [43].
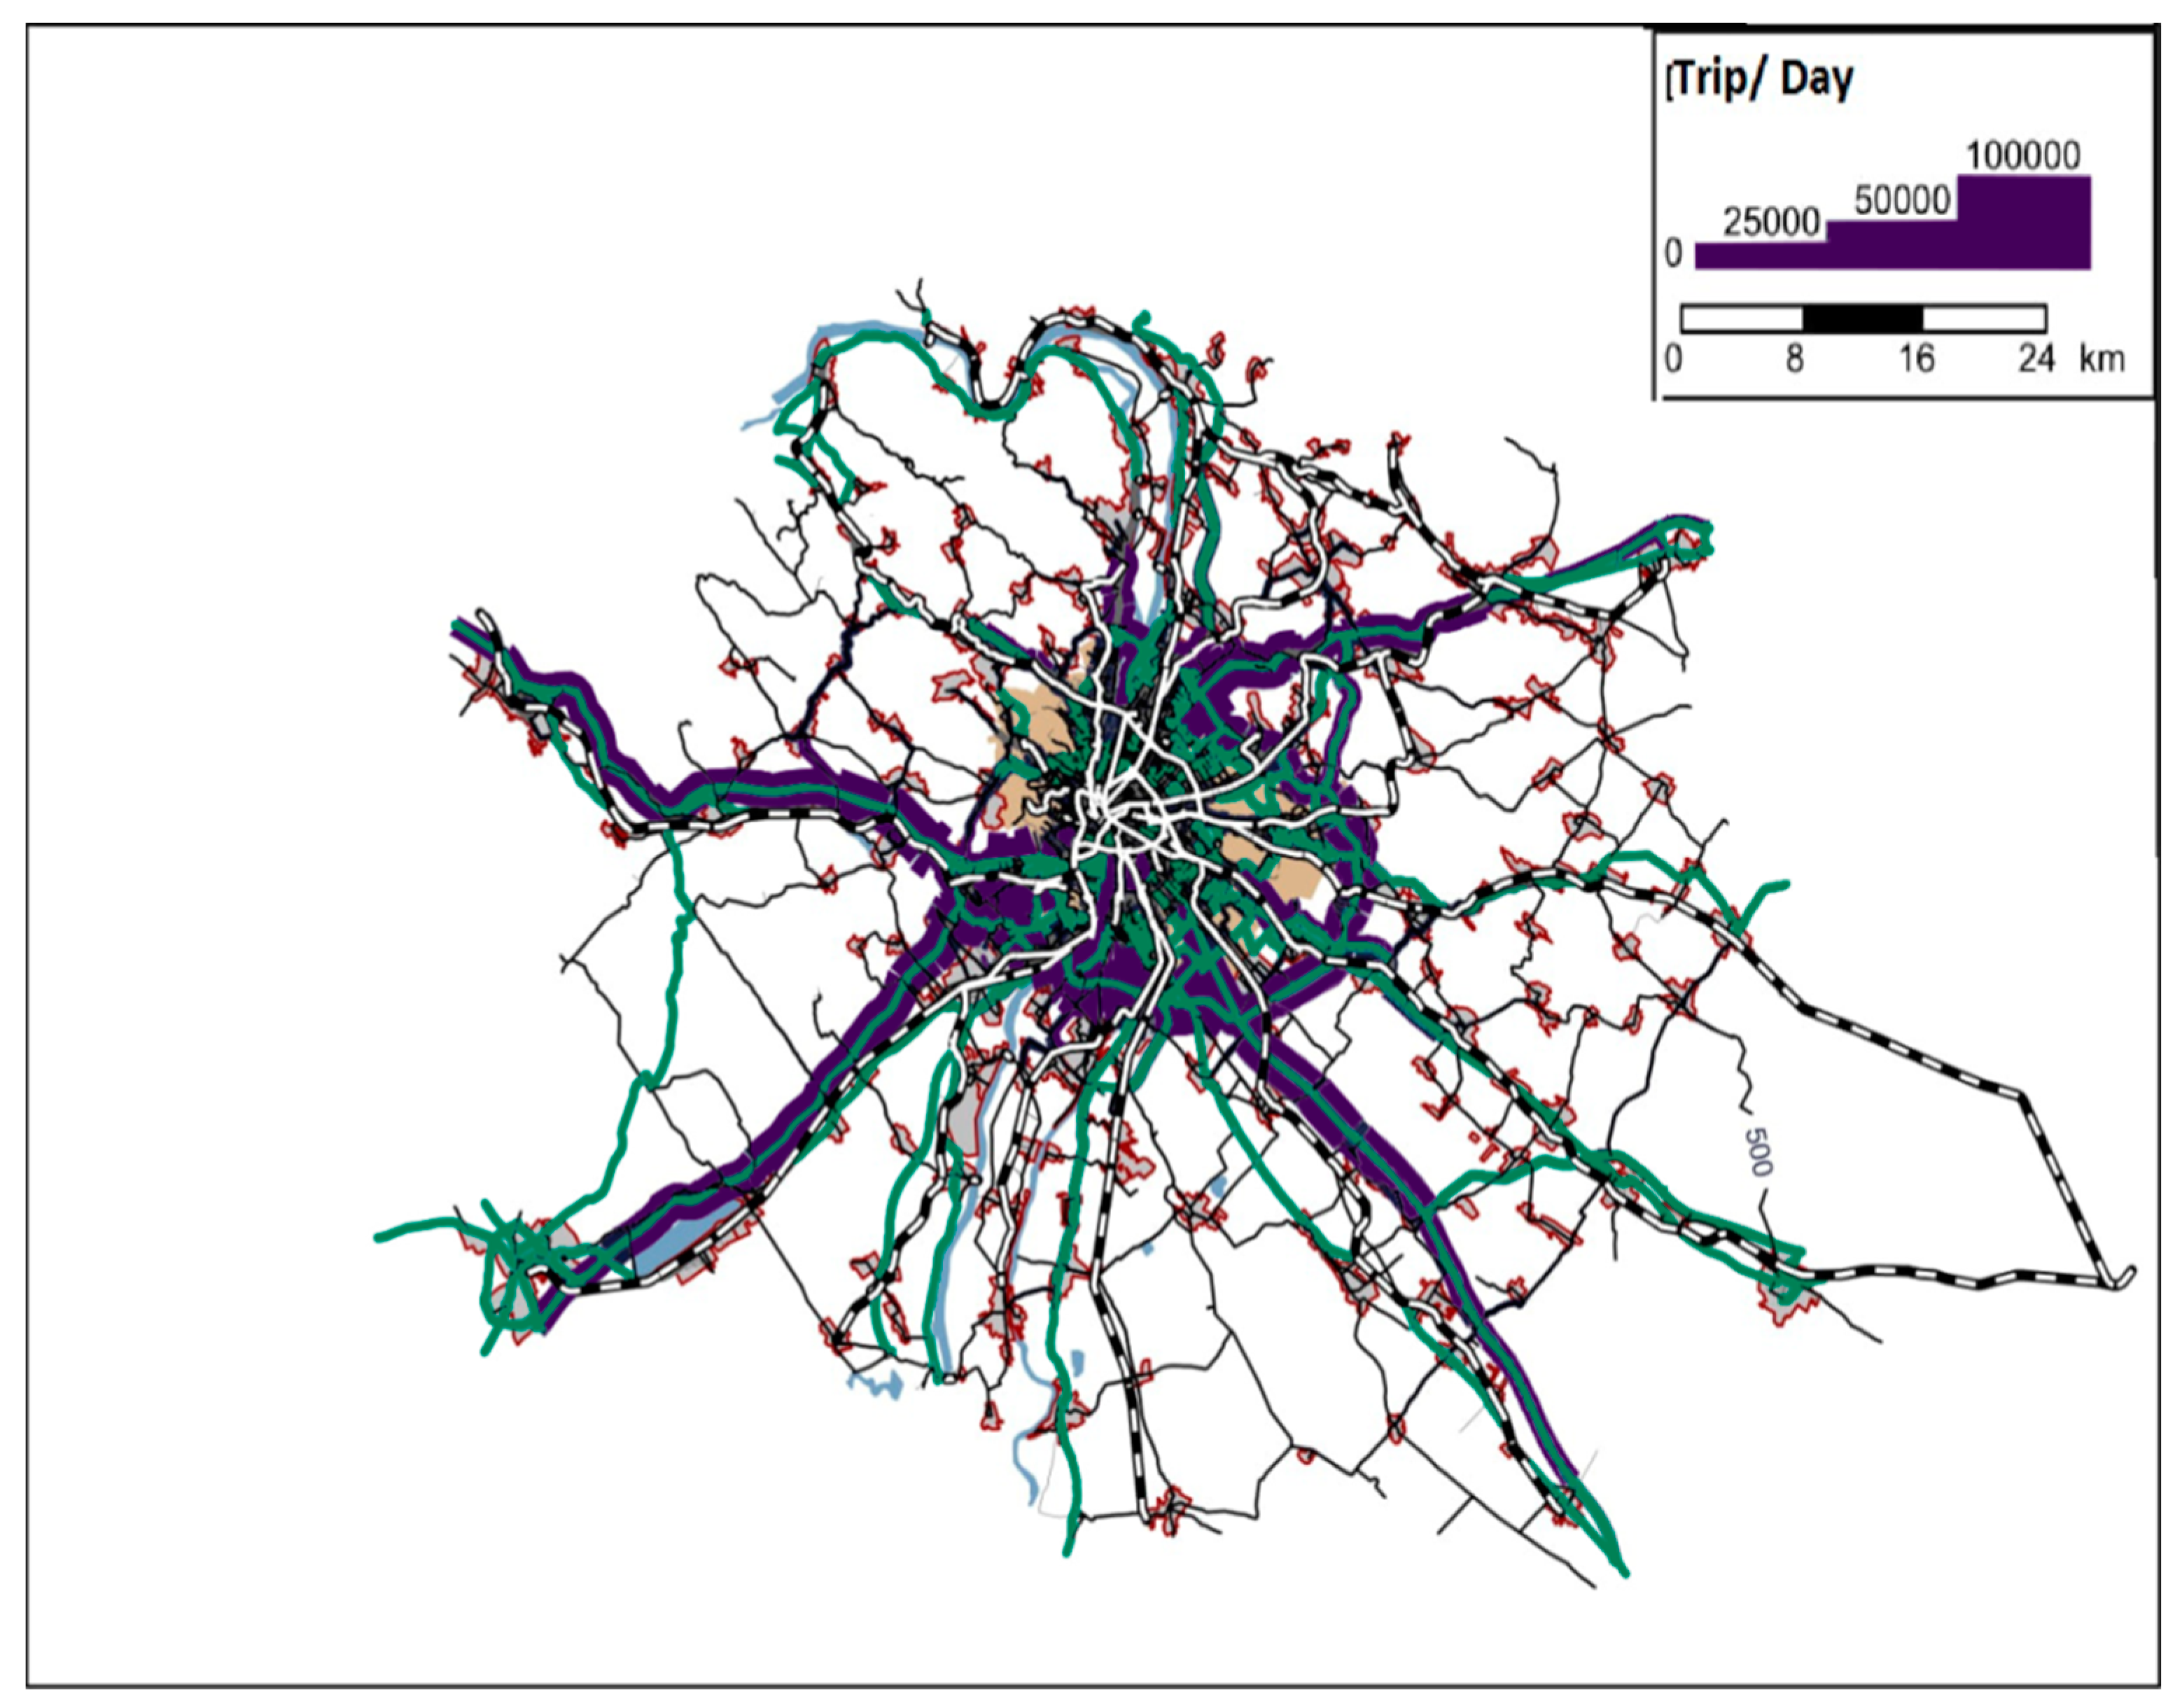
The Unified Traffic Model of Budapest (EFM) is chosen for the study, which was created and is maintained by the Transport Corporation of Budapest and is developed using PTV Visum software. The model uses real-life collected traffic data of Budapest. The model’s transportation data includes private and public datasets, such as daily traffic volume, origin–destination matrices, public transport modes and routes. The model also consists of all road characteristics and allowable mode to use different roads. The model is illustrated in Figure 1.
5. Results and Discussion
The simulation outputs and analysis focus on four traffic parameters: the daily vehicle traveled kilometers, the daily vehicle traveled hours, total delay for the whole network and mean velocity for passenger cars class for the entire network. The four parameters are classified into two classes for the analysis: Passenger Vehicle Class (PC) and Heavy Vehicle Class (HV).
The results are compared as a reduction percentage from the original simulation or base scenario. The base scenario is the model without any assumed AVs implemented in the model (AV penetration equals zero). Table 1 shows the traveled kilometers and traveled hours (in thousands) for each vehicle type at the base scenario and shows total daily delay and mean network speed. Table 1 also shows the PCU for each travel vehicle type used for the simulation.
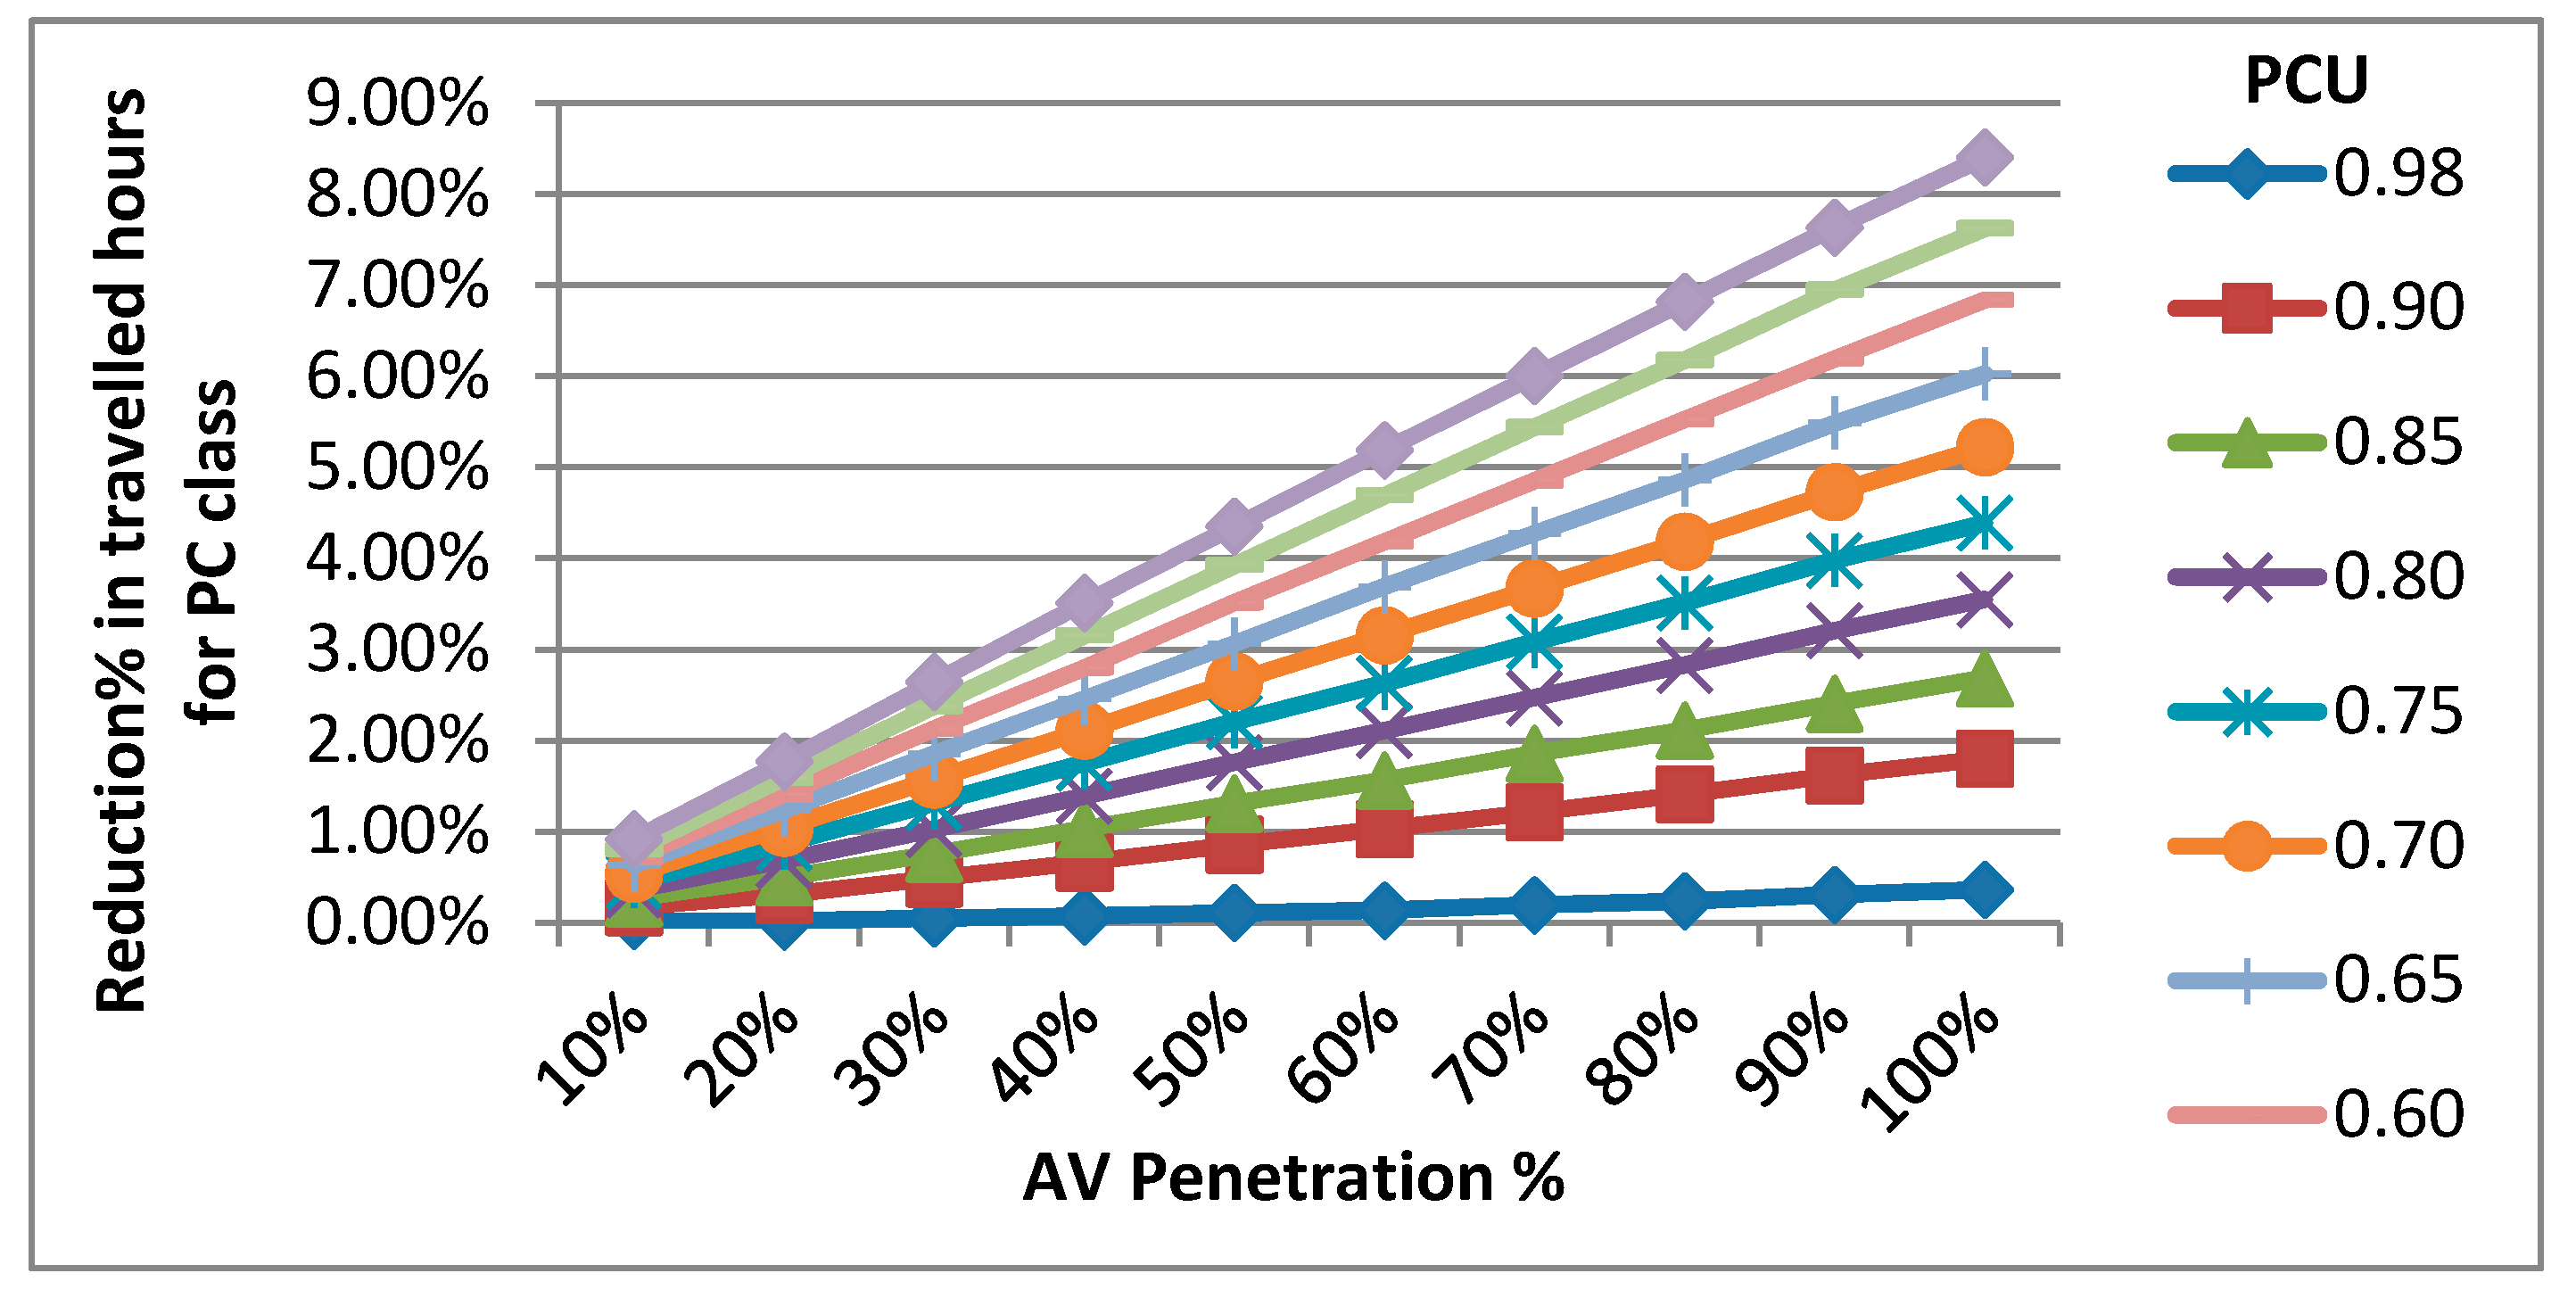
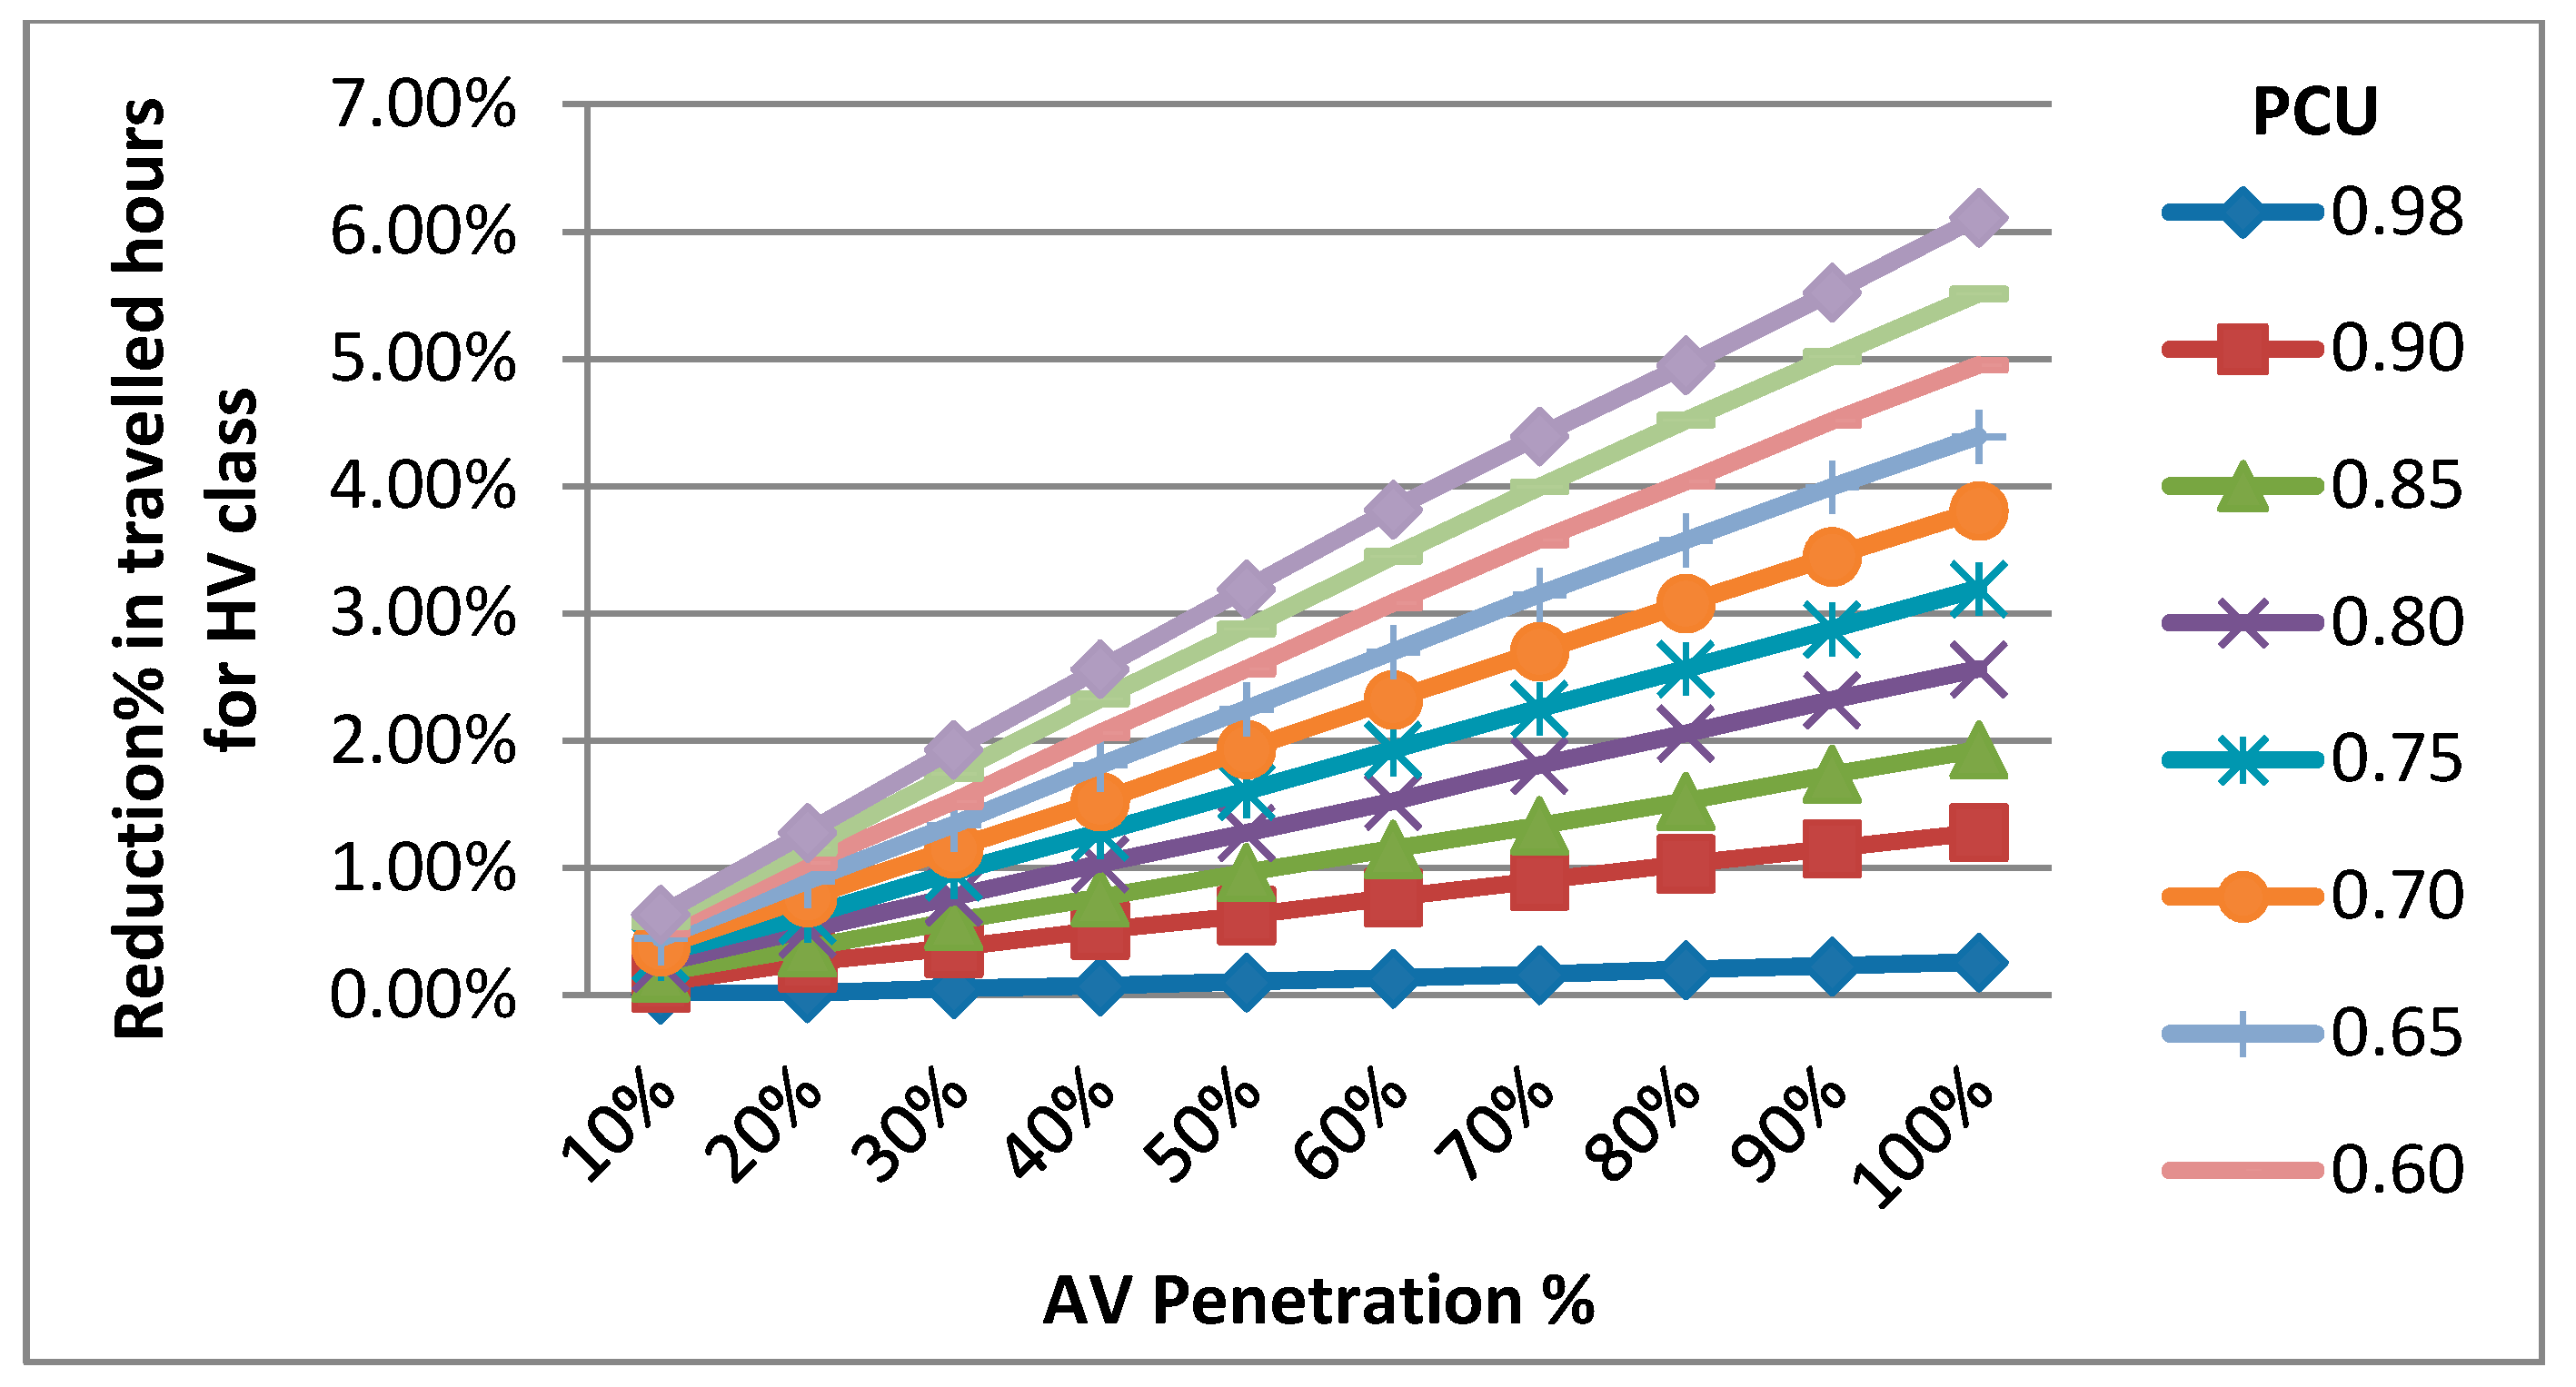
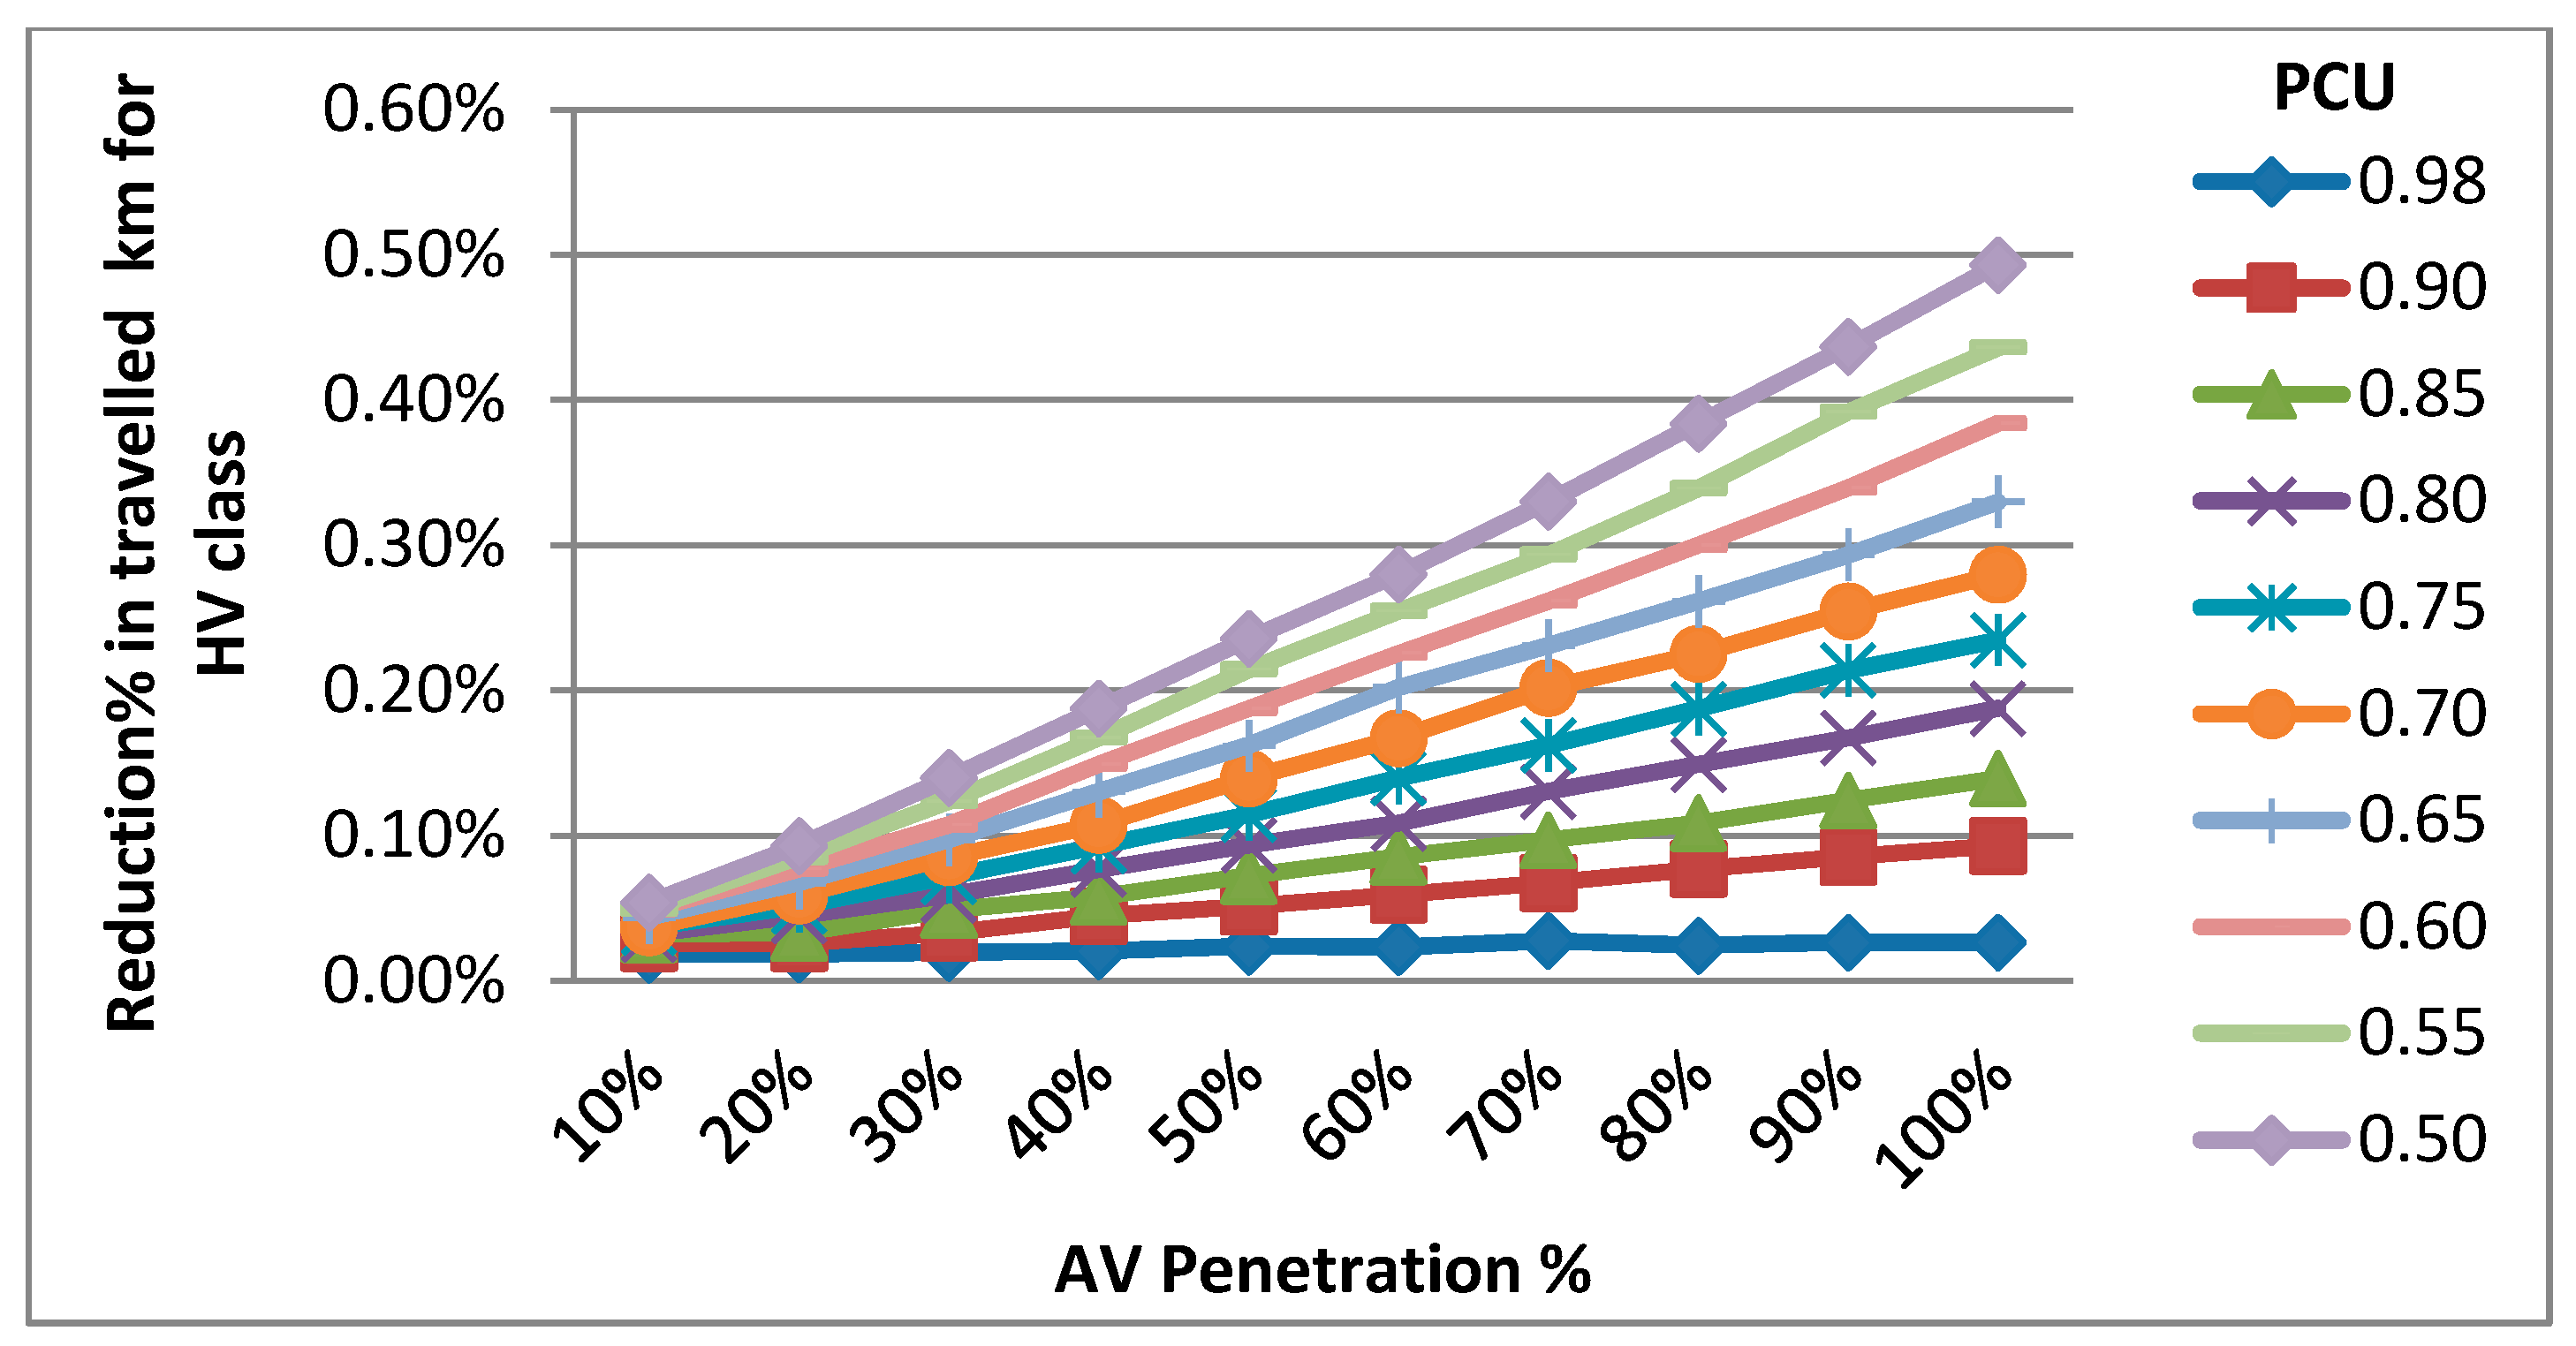
The proposed methodology of the employment of connected AVs in the network at different PCU and penetration for the same number of daily trips reduces daily traveled hours and daily traveled kilometers for the passenger car class. The outputs vary from small reductions at lower PCU and penetration values (111 saved traveled hours and 926.5 saved traveled kilometers at 0.98 PCU and 10% AV penetration) to much larger reductions at higher PCU and penetration values (537,000 saved traveled hours and 530,186 saved traveled kilometers at 0.50 PCU and 100% AV penetration). The second class investigated is a heavy vehicle with four different categories. It is found that there is a marginally small improvement in the network traffic parameters even though no modifications are added for any heavy vehicle parameter in any simulations. This shows that AV spread in the network improves the network operation for all traffic flow and all vehicle classes (40 saved traveled hours and 2855 saved traveled kilometers at 0.98 PCU and 10% AV penetration) Much larger reductions are witnessed at higher PCU and penetration values (176,650 saved traveled hours and 778,420 saved traveled kilometers at 0.50 PCU and 100% AV penetration). Figure 2, Figure 3, Figure 4 and Figure 5 give a better illustration of the improvement of the network operations by presenting the reduction percentage of traveled hours and kilometers for both passenger car and heavy vehicle classes, respectively. Reduction in traveled hours varies from 0.02% to 8.41% for passenger cars and from 0.01% to 6.11% for heavy vehicles. Reduction in traveled kilometers varies from 0.03% to 1.61% and from 0.02% to 0.49% for passenger car and heavy vehicle classes, respectively.
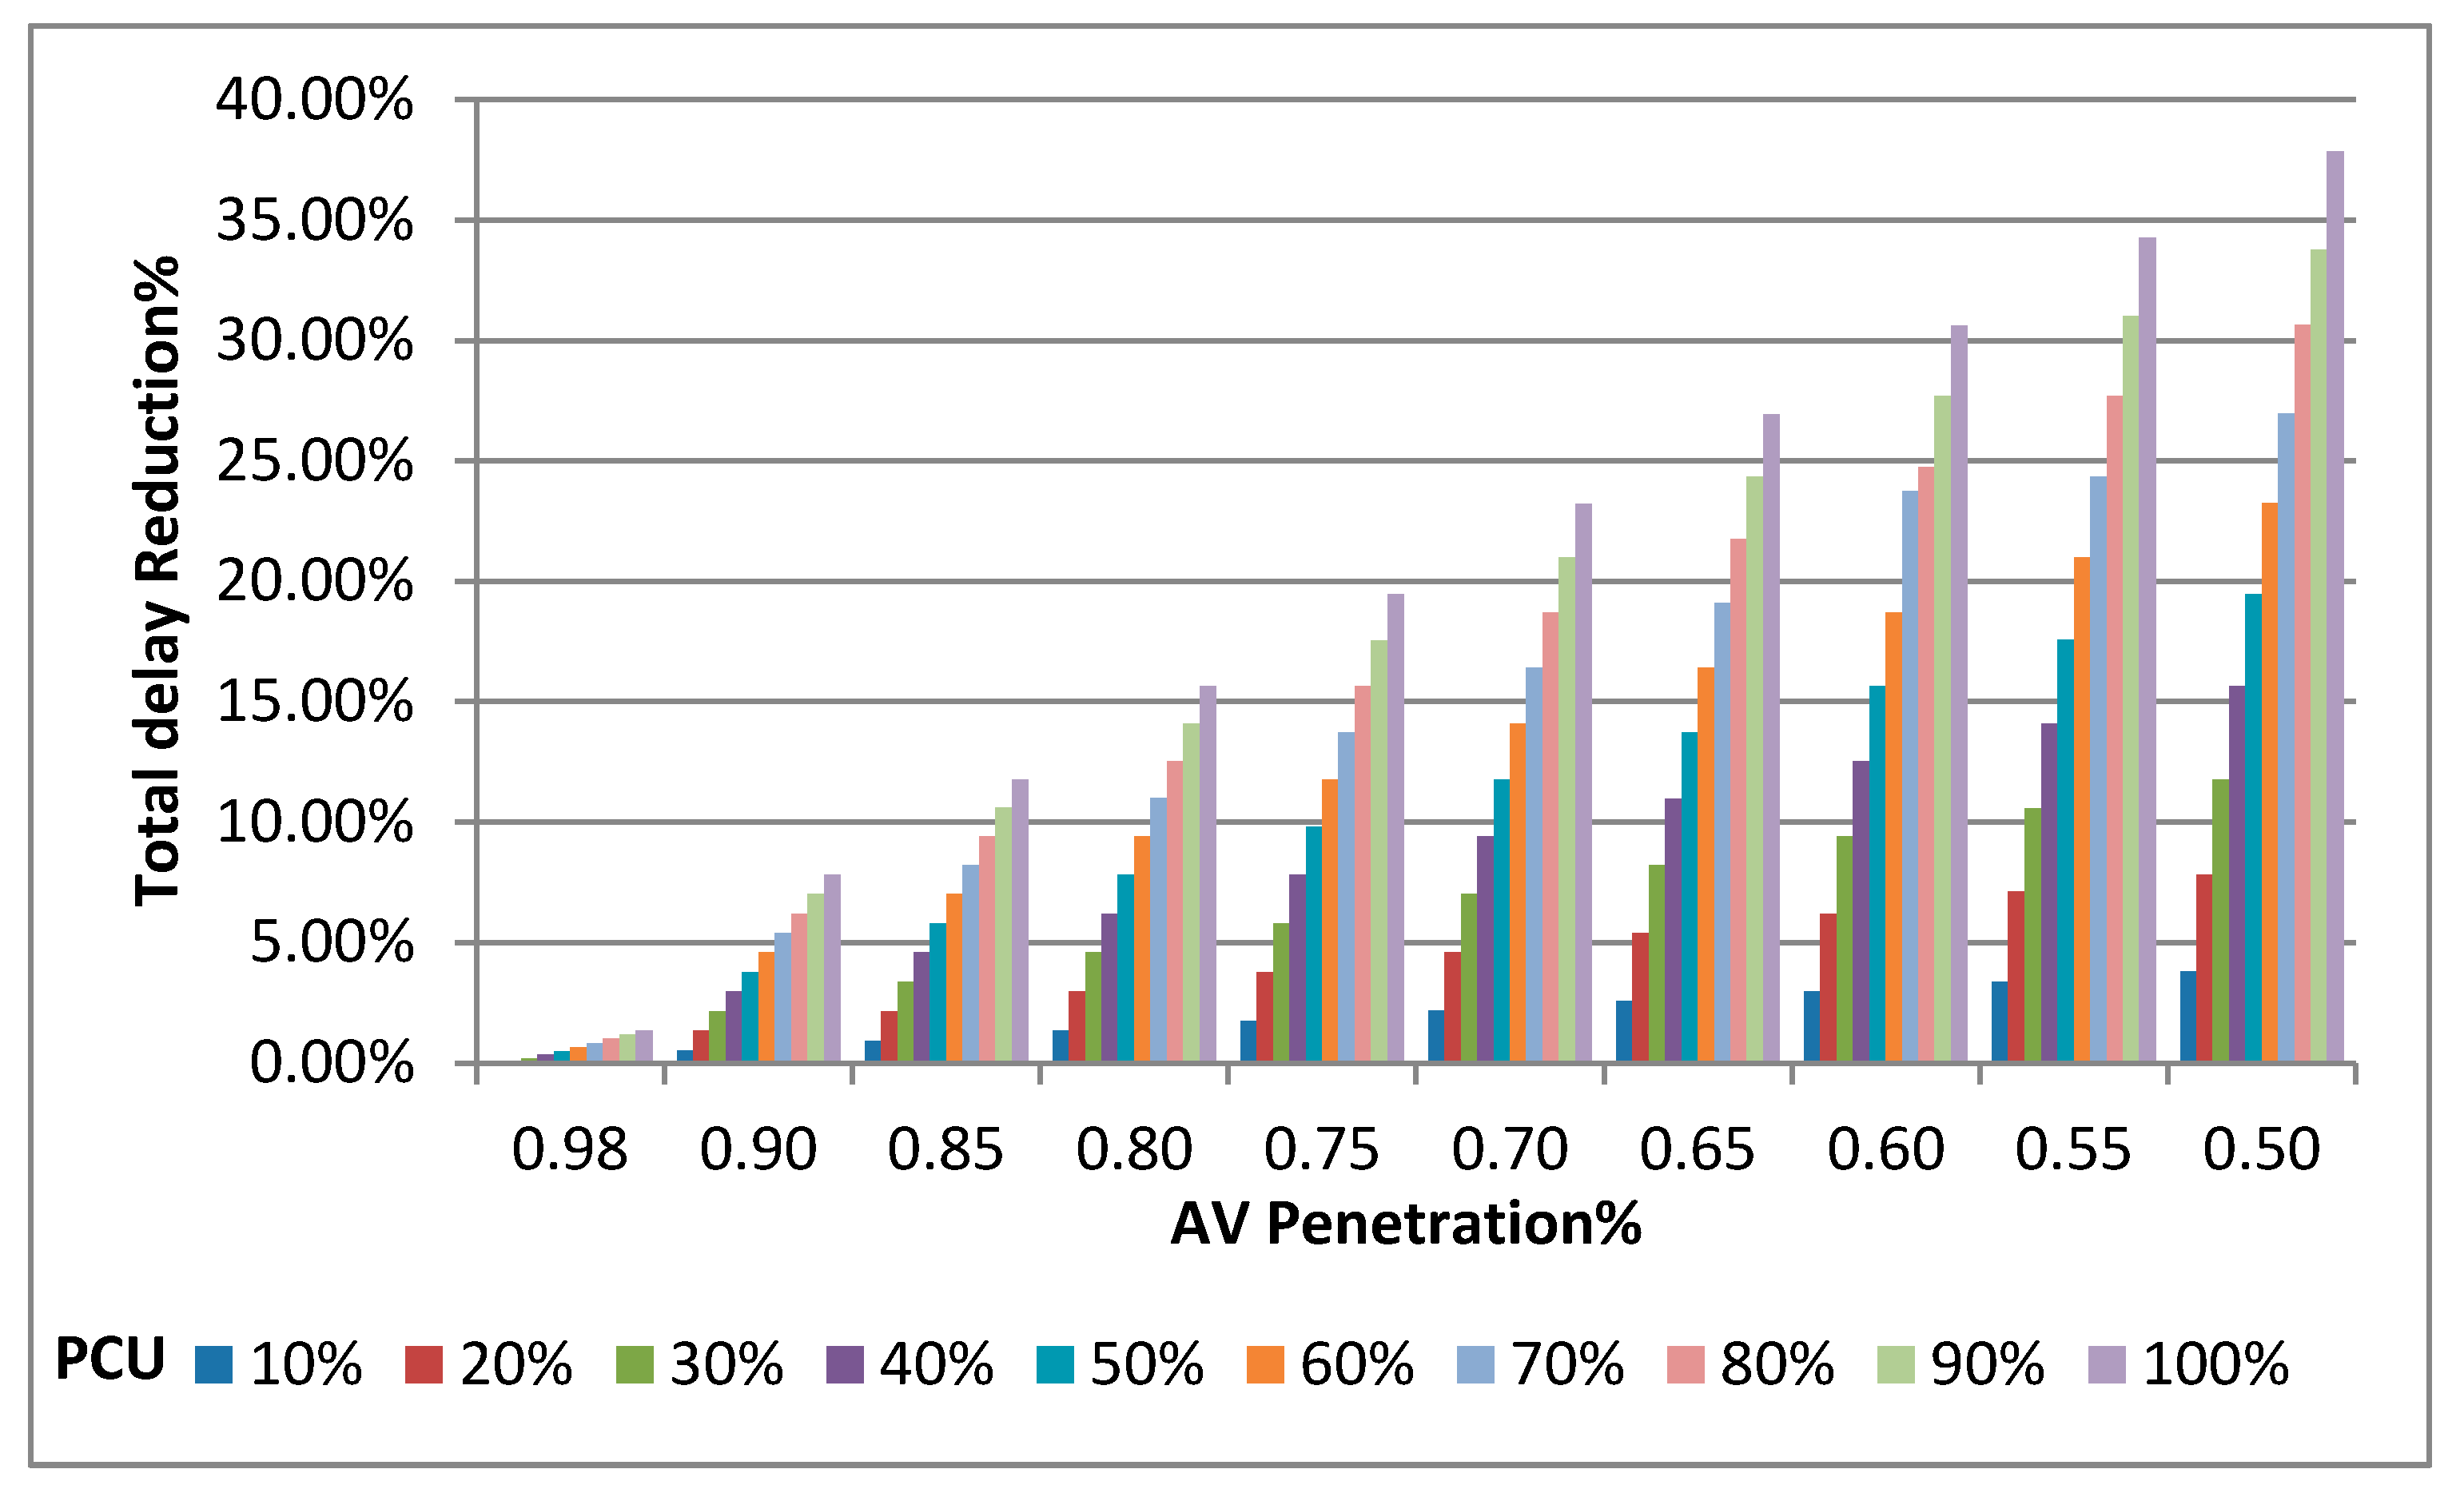
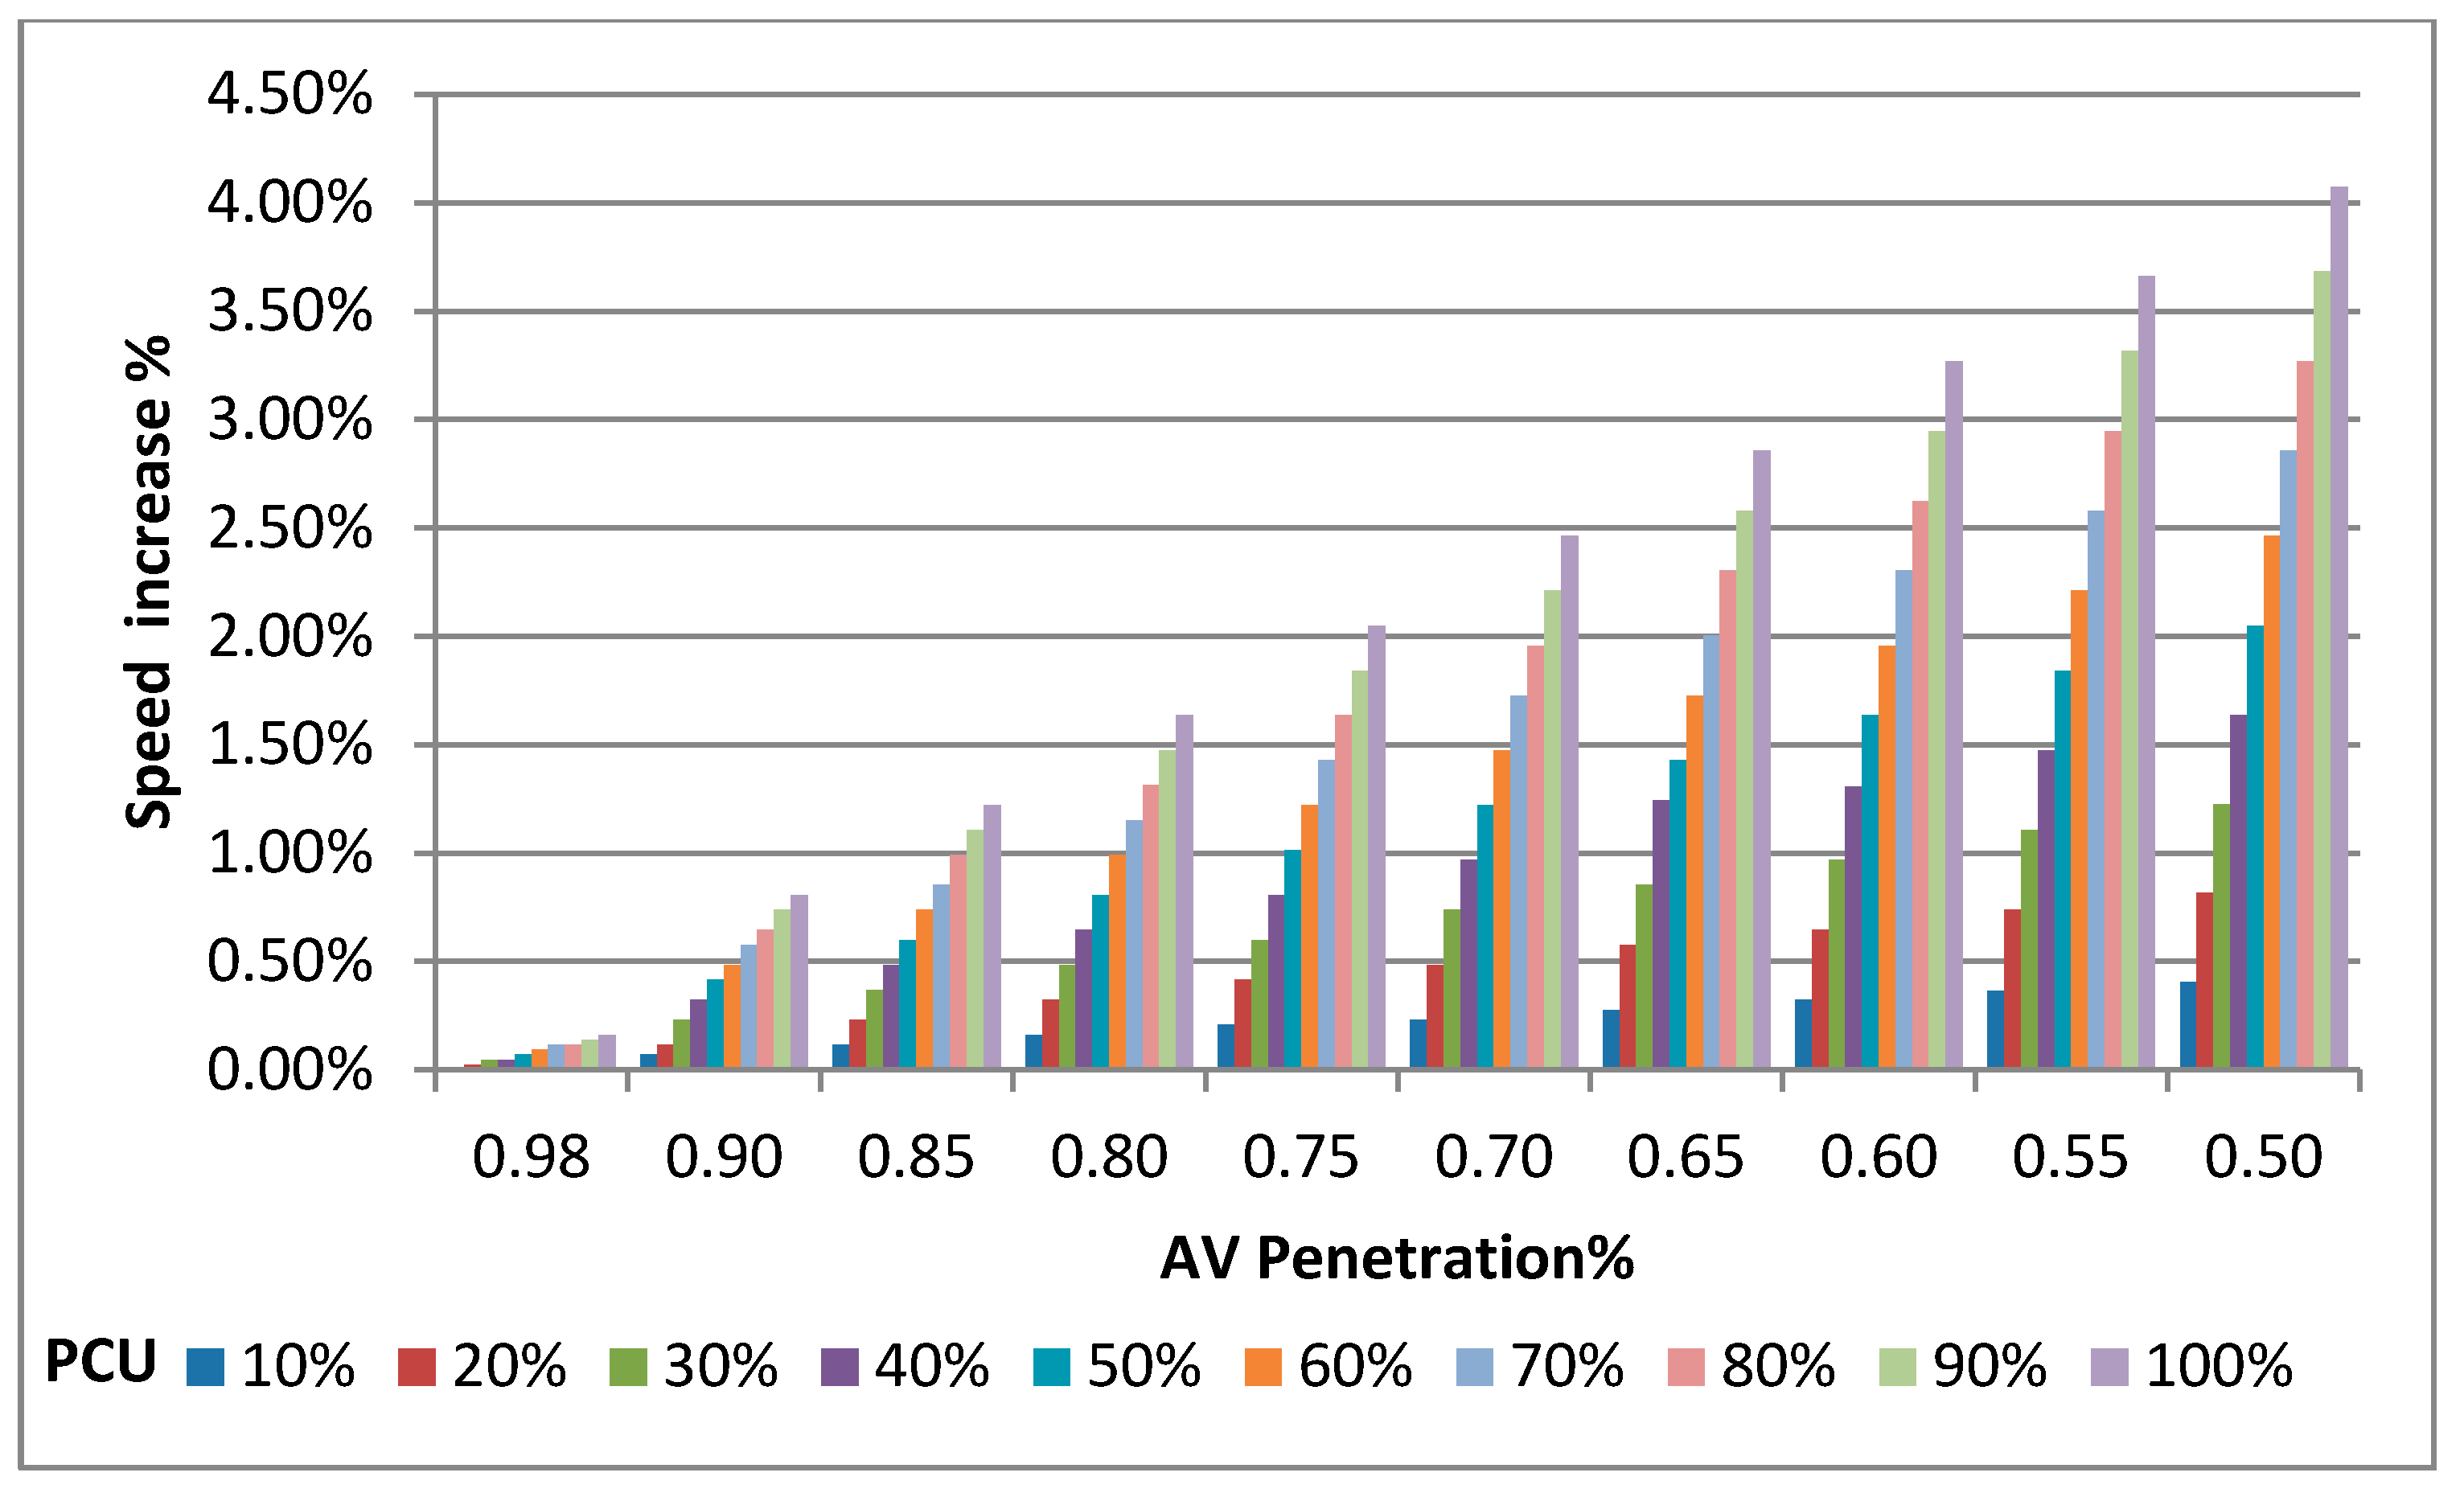
AV spread in the traffic flow also reduces total daily delay significantly of the whole network model, reaching a reduction of 62,881 h for 100% AV penetration and 0.5 PCU equal to 37.87% of base scenario delay. Implementation of AVs with different factors has also increases mean network speed by 4.08%, reaching 45.20 km/h compared to 43.43 km/h in the base scenario. The results for delay and speed are shown in Figure 6 and Figure 7, respectively.
The second part of the analysis is to develop different models for the four chosen traffic parameters in the study. Multilinear regression is used to develop the models. Penetration and PCU values are the independent variables, and traffic parameter improvements are the dependent variable. The six developed models are shown below, with the estimated R squared for each model. Table 2 shows p-values associated with each parameter estimation. All models indicate that PCU has a more significant impact on the impact percentage. AV penetration has a direct relationship, while PCU has an inverse relationship with the dependent variables.
where
- PC h% is the reduction percentage in daily traveled hour for passenger car class;
- PC km% is the reduction percentage in daily traveled kilometers for passenger car class; HV h% is the reduction percentage in daily traveled hour for heavy vehicle class;
- HV km% is the reduction percentage in daily traveled kilometers for heavy vehicle class;
- Delay% is the reduction percentage in total delay of the whole network;
- Speed% is the increase percentage in whole network speed; AV is the automated vehicle penetration percentage;
- and PCU is the assumed passenger car unit of automated vehicles.
6. Conclusions
This paper investigates the estimated expected change in traffic operations caused by the spread of AVs at different penetration levels in a network. The investigation focuses on finding the difference in traveled hours and traveled kilometers by assuming different PCU for AVs. The adopted changes in AVs parameter are explained by the automation level, resulting in smoother driving, communication between vehicles and infrastructures, etc.
The findings show improvement in the network operations for both investigated vehicle classes for the same daily trips. The gain increases with increasing AV penetration and lower assumed PCU for AVs. The simulation scenarios show a higher percentage of reduction for traveled daily hours than traveled kilometers, estimated as 8.41% and 1.61%, respectively, at higher PCU and AV penetration for the passenger car class. The improvement is caused by smarter trip distribution in the network, resulting in lower trip travel time, but more investigation needs to be performed in the future.
Another finding is that, even though the PCU is only changed for the conventional car category and penetration is only taken as part of the passenger car class, there is a slight improvement in heavy vehicle class operation. Heavy vehicle class emissions are estimated to be reduced by 6.11% for traveled hours and 0.49% for traveled kilometers. This shows that the spread of AVs will cause an improvement in the traffic network as a whole and not only for the AVs.
AVs significantly impacted the whole network’s total delay by a 37.87% reduction and increasing average speed by 4.08%. The final part of the article is to develop six models of the six traffic parameters. The models give the percentage of reduction or increase of each parameter for different PCU and AV penetration values.
Future research will focus on studying the impact of AVs on a traffic network in a more detailed way and finding a different effect on different road types and complex traffic operations. Future work will also focus on the impact of automated public transport and shared automated transport systems.
Author Contributions
M.O., conceptualization, formal analysis, writing and editing and methodology; and A.T., supervision, validation and review and editing. All authors have read and agreed to the published version of the manuscript.
Funding
This research received no external funding.
Institutional Review Board Statement
Not applicable.
Informed Consent Statement
Not applicable.
Data Availability Statement
Data are contained within the article.
Acknowledgments
The research reported in this paper and carried out at the Budapest University of Technology and Economics was supported by the National Research Development and Innovation Fund (TKP2020 Institution Excellence Subprogram, Grant No. BME-IE-MIFM) based on the charter of bolster issued by the National Research Development and Innovation Office under the auspices of the Ministry for Innovation and Technology; and by the ÚNKP-20-5 new national excellence program of the Ministry for Innovation and Technology from the source of the National Research, Development and Innovation Fund. The research reported in this paper was supported by the Hungarian Academy of Science (HAS) by providing the Janos BOLYAI Scholarship. Moreover, the authors are grateful for the support of New National Excellence Programme Bolyai+ scholarship. The research was supported by the Ministry of Innovation and Technology NRDI Office within the framework of the Autonomous Systems National Laboratory Program.
Conflicts of Interest
The authors declare no conflict of interest.
References
- Di, X.; Ma, R.; Liu, H.X.; Ban, X.J. A link-node reformulation of ridesharing user equilibrium with network design. Transp. Res. Part B Methodol. 2018, 112, 230–255. [Google Scholar] [CrossRef]
- Heinzelmann, B.; Indinger, T.; Adams, N.; Blanke, R. Taxonomy and definitions for terms related to driving automation systems for on-road motor vehicles. SAE Int. J. Commer. Veh. 2012, 5, 42–56. [Google Scholar] [CrossRef]
- Tilg, G.; Yang, K.; Menendez, M. Evaluating the effects of automated vehicle technology on the capacity of freeway weaving sections. Transp. Res. Part C Emerg. Technol. 2018, 96, 3–21. [Google Scholar] [CrossRef]
- Yang, K.; Menendez, M. A Convex Model for Queue Length Estimation in a Connected Vehicle Environment. In Proceedings of the Transportation Research Board 96th Annual Meeting, Washington DC, USA, 8–12 January 2017. [Google Scholar]
- Obaid, M.; Szalay, Z. A novel model representation framework for cooperative intelligent transport systems. Period. Polytech. Transp. Eng. 2019, 48, 39–44. [Google Scholar] [CrossRef] [Green Version]
- Yang, K.; Guler, S.I.; Menendez, M. Isolated intersection control for various levels of vehicle technology: Conventional, connected, and automated vehicles. Transp. Res. Part C Emerg. Technol. 2016, 72, 109–129. [Google Scholar] [CrossRef]
- Árpád, T.; Zsolt, S.; Gábor, U.; Bence, V. Modelling Urban Autonomous Transport System in Budapest. In Proceedings of the 8th international scientific conference CMDTUR 2018, Žilina, Slovakia, 4–5 October 2018. [Google Scholar]
- Hartmann, M.; Krause, S.; Hoffmann, S.; Motamedidehkordi, N.; Vortisch, P.; Busch, F. Impact of Automated Vehicles on Capacity of the German Freeway Network. In Proceedings of the ITS World Congress, Montreal, QC, Cananda, 29 October–2 November 2017. [Google Scholar]
- Vanderwerf, J.; Shladover, S.E.; Miller, M.A. Effects of Adaptive Cruise Control Systems on Highway Traffic Flow Capacity. Transp. Res. Rec. 2003, 1800, 78–84. [Google Scholar] [CrossRef]
- Chen, D.; Ahn, S.; Chitturi, M.; Noyce, D.A. Towards vehicle automation: Roadway capacity formulation for traffic mixed with regular and automated vehicles. Transp. Res. Part B Methodol. 2017, 100, 196–221. [Google Scholar] [CrossRef] [Green Version]
- Shladover, S.E.; Su, D.; Lu, X.-Y. Impacts of cooperative adaptive cruise control on freeway traffic flow. Transp. Res. Rec. 2012, 2324, 63–70. [Google Scholar] [CrossRef] [Green Version]
- Milanes, V.; Shladover, S.E.; Spring, J.; Nowakowski, C.; Kawazoe, H.; Nakamura, M. Cooperative adaptive cruise control in real traffic situations. IEEE Trans. Intell. Transp. Syst. 2013, 15, 296–305. [Google Scholar] [CrossRef] [Green Version]
- Jerath, K.; Brennan, S.N. Analytical prediction of self-organized traffic jams as a function of increasing ACC penetration. IEEE Trans. Intell. Transp. Syst. 2012, 13, 1782–1791. [Google Scholar] [CrossRef]
- Talebpour, A.; Mahmassani, H.S.; Bustamante, F.E. Modeling driver behavior in a connected environment: Integrated microscopic simulation of traffic and mobile wireless telecommunication systems. Transp. Res. Rec. 2016, 2560, 75–86. [Google Scholar] [CrossRef]
- Talebpour, A.; Mahmassani, H.S. Influence of connected and autonomous vehicles on traffic flow stability and throughput. Transp. Res. Part C Emerg. Technol. 2016, 71, 143–163. [Google Scholar] [CrossRef]
- Kesting, A.; Treiber, M. Influence of Reaction Times and Anticipation on the Stability of Vehicular Traffic Flow; IFAC: New York, NY, USA, 2006; Volume 6, ISBN 9783902661111. [Google Scholar]
- Szalay, Z. Next generation X-in-the-loop validation methodology for automated vehicle systems. IEEE Access 2021, 9, 35616–35632. [Google Scholar] [CrossRef]
- Obaid, M.; Szalay, Z.; Török, Á. Reconsidering the cybersecurity framework in the road transportation domain. Acta Polytech. Hung. 2020, 17, 57–83. [Google Scholar] [CrossRef]
- Rizopoulos, D.; Esztergár-Kiss, D. A method for the optimization of daily activity chains including electric vehicles. Energies 2020, 13, 906. [Google Scholar] [CrossRef] [Green Version]
- Jia, D.; Ngoduy, D. Enhanced cooperative car-following traffic model with the combination of V2V and V2I communication. Transp. Res. Part B Methodol. 2016, 90, 172–191. [Google Scholar] [CrossRef]
- Ferreira, M.; D’Orey, P.M. On the impact of virtual traffic lights on carbon emissions mitigation. IEEE Trans. Intell. Transp. Syst. 2011, 13, 284–295. [Google Scholar] [CrossRef]
- Elhenawy, M.; Elbery, A.A.; Hassan, A.A.; Rakha, H.A. An Intersection Game-Theory-Based Traffic Control Algorithm in a Connected Vehicle Environment. In Proceedings of the 2015 IEEE 18th International Conference on Intelligent Transportation Systems, Las Palmas de Gran Canaria, Spain, 15–18 September 2015; pp. 343–347. [Google Scholar] [CrossRef]
- Calvert, S.C.; Klunder, G.; Steendijk, J.L.L.; Snelder, M. The impact and potential of cooperative and automated driving for intelligent traffic signal corridors: A field-operational-test and simulation experiment. Case Stud. Transp. Policy 2020, 8, 901–919. [Google Scholar] [CrossRef]
- Alkharabsheh, A.; Moslem, S.; Oubahman, L.; Duleba, S. An integrated approach of multi-criteria decision-making and grey theory for evaluating urban public transportation systems. Sustainability 2021, 13, 2740. [Google Scholar] [CrossRef]
- Zöldy, M. Fuel properties of butanol—Hydrogenated vegetable oil blends as a diesel extender option for internal combustion engines. Period. Polytech. Chem. Eng. 2019, 64, 205–212. [Google Scholar] [CrossRef]
- Suzuki, H.; Marumo, Y. A New Approach to Green Light Optimal Speed Advisory (GLOSA) Systems for High-Density Traffic Flowe. In Proceedings of the 2018 21st International Conference on Intelligent Transportation Systems (ITSC), Maui, HI, USA, 4–7 November 2018; pp. 362–367. [Google Scholar] [CrossRef]
- Baz, A.; Yi, P.; Qurashi, A. Intersection control and delay optimization for autonomous vehicles flows only as well as mixed flows with ordinary vehicles. Vehicles 2020, 2, 523–541. [Google Scholar] [CrossRef]
- Le Vine, S.; Wu, C.; Polak, J. A nationwide study of factors associated with household car ownership in China. IATSS Res. 2018, 42, 128–137. [Google Scholar] [CrossRef]
- Zöldy, M.; Szalay, Z.; Tihanyi, V. Challenges in homologation process of vehicles with artificial intelligence. Transport 2020, 35, 435–446. [Google Scholar] [CrossRef]
- Haboucha, C.J.; Ishaq, R.; Shiftan, Y. User preferences regarding autonomous vehicles. Transp. Res. Part C Emerg. Technol. 2017, 78, 37–49. [Google Scholar] [CrossRef]
- Varga, B.; Szalai, M.; Fehér, A.; Aradi, S.; Tettamanti, T. Mixed-reality Automotive Testing with SENSORIS. Period. Polytech. Transp. Eng. 2020, 48, 357–362. [Google Scholar] [CrossRef]
- Kay, W.; Becker, F.; Axhausen, K.W. Predicting the use of automated vehicles [First results from the pilot survey]. In Proceedings of the Institute for Transport Planning and Systems, Ascona, Switzerland, 17–19 May 2017. [Google Scholar]
- Xu, H.; Pang, J.-S.; Ordóñez, F.; Dessouky, M. Complementarity models for traffic equilibrium with ridesharing. Transp. Res. Part B Methodol. 2015, 81, 161–182. [Google Scholar] [CrossRef]
- Ma, J.; Xu, M.; Meng, Q.; Cheng, L. Ridesharing user equilibrium problem under OD-based surge pricing strategy. Transp. Res. Part B Methodol. 2020, 134, 1–24. [Google Scholar] [CrossRef]
- Ortega, J.; Tóth, J.; Péter, T.; Moslem, S. An integrated model of park-and-ride facilities for sustainable urban mobility. Sustainability 2020, 12, 4631. [Google Scholar] [CrossRef]
- Menon, N.; Barbour, N.; Zhang, Y.; Pinjari, A.R.; Mannering, F. Shared autonomous vehicles and their potential impacts on household vehicle ownership: An exploratory empirical assessment. Int. J. Sustain. Transp. 2018, 13, 111–122. [Google Scholar] [CrossRef]
- Pettigrew, S.; Dana, L.M.; Norman, R. Clusters of potential autonomous vehicles users according to propensity to use individual versus shared vehicles. Transp. Policy 2019, 76, 13–20. [Google Scholar] [CrossRef]
- Stoiber, T.; Schubert, I.; Hoerler, R.; Burger, P. Will consumers prefer shared and pooled-use autonomous vehicles? A stated choice experiment with Swiss households. Transp. Res. Part D Transp. Environ. 2019, 71, 265–282. [Google Scholar] [CrossRef]
- Mehar, A.; Chandra, S.; Velmurugan, S. Passenger car units at different levels of service for capacity analysis of multilane interurban highways in india. J. Transp. Eng. 2014, 140, 81–88. [Google Scholar] [CrossRef]
- Friedrich, B. The Effect of Autonomous Vehicles on Traffic. In Autonomous Driving: Technical, Legal and Social Aspects; Maurer, M., Gerdes, J.C., Lenz, B., Winner, H., Eds.; Springer: Berlin/Heidelberg, Germany, 2016; pp. 317–334. [Google Scholar] [CrossRef] [Green Version]
- Wardrop, J.G. Some Theoretical Aspects of Road Traffic Research. Proc. Inst. Civil Eng. 1952, 1, 325–362. [Google Scholar] [CrossRef]
- Pia̧tkowski, B.; Maciejewski, M. Comparison of traffic assignment in visum and transport simulation in MATSim. Transp. Probl. 2013, 8, 113–120. [Google Scholar]
- BKK Budapesti Közlekedési Központ Zrt. Budapest Transport Development Strategy; BKK Budapesti Közlekedési Központ Zrt: Budapest, Hungary, 2014. [Google Scholar]
Figure 1.
Budapest city EFM model.

Figure 2.
Reduction percent in traveled hours for passenger car class.

Figure 3.
Reduction percent in traveled kilometers for passenger car class.

Figure 4.
Reduction percent in traveled hours for heavy vehicle class.

Figure 5.
Reduction percent in traveled kilometers for heavy vehicle class.

Figure 6.
Reduction percent in total delay for different AV penetration and PCU.

Figure 7.
Increase percentage in mean network’s speed for different AV penetration and PCU.


Table 1.
Traffic parameters of base scenario.
| Class | PC. | HV. | |||||
|---|---|---|---|---|---|---|---|
| Vehicle Type | Car | Taxi | Light | Medium | Buses and Coaches | Heavy | Total |
| Traveled km (hundred thousands) | 323.7 | 616 | 6069 | 581 | 6271 | 2865 | 48,771 |
| Traveled hours (thousands) | 624.4 | 14.42 | 115.41 | 8.71 | 123.96 | 40.85 | 927.71 |
| PCU | 1.0 | 1.0 | 1.0 | 1.4 | 1.8 | 2.5 | -------- |
| Total daily delay | 166,053 h | ||||||
| Mean network speed | 43.43 km/h | ||||||
Table 2.
p-values associated with each parameter of the six statistical models.
| PCU | AV | |
|---|---|---|
| PC h | 7.37 × 10⁻³³ | 2.73 × 10⁻³¹ |
| PC km | 2.28 × 10⁻³⁴ | 2.84 × 10⁻³³ |
| HV h | 9.15 × 10⁻³³ | 3.7 × 10⁻³¹ |
| HV km | 2.97 × 10⁻²⁹ | 6.3 × 10⁻²⁸ |
| Delay | 1.78 × 10⁻³² | 7.88 × 10⁻³¹ |
| Speed | 7.66 × 10⁻³² | 2.53 × 10⁻³⁰ |
Publisher’s Note: MDPI stays neutral with regard to jurisdictional claims in published maps and institutional affiliations. |
© 2021 by the authors. Licensee MDPI, Basel, Switzerland. This article is an open access article distributed under the terms and conditions of the Creative Commons Attribution (CC BY) license (https://creativecommons.org/licenses/by/4.0/).
Share and Cite
MDPI and ACS Style
Obaid, M.; Torok, A. Macroscopic Traffic Simulation of Autonomous Vehicle Effects. Vehicles 2021, 3, 187-196. https://0-doi-org.brum.beds.ac.uk/10.3390/vehicles3020012
AMA Style
Obaid M, Torok A. Macroscopic Traffic Simulation of Autonomous Vehicle Effects. Vehicles. 2021; 3(2):187-196. https://0-doi-org.brum.beds.ac.uk/10.3390/vehicles3020012
Chicago/Turabian StyleObaid, Mohammed, and Arpad Torok. 2021. "Macroscopic Traffic Simulation of Autonomous Vehicle Effects" Vehicles 3, no. 2: 187-196. https://0-doi-org.brum.beds.ac.uk/10.3390/vehicles3020012