
An Experimental Approach to Assessing the Roles of Magnesium, Calcium, and Carbonate Ratios in Marine Carbonates


Leibniz Center for Tropical Marine Research (ZMT), Fahrenheitstr. 6, 28359 Bremen, Germany
*
Author to whom correspondence should be addressed.
Oceans 2021, 2(1), 193-214; https://0-doi-org.brum.beds.ac.uk/10.3390/oceans2010012
Submission received: 30 August 2020
/
Revised: 18 February 2021
/
Accepted: 22 February 2021
/
Published: 3 March 2021
(This article belongs to the Special Issue The Future of Coral Reefs: Research Submitted to ICRS 2020, Bremen, Germany)
Abstract
:Marine biomineralization is a globally important biological and geochemical process. Understanding the mechanisms controlling the precipitation of calcium carbonate [CaCO3] within the calcifying fluid of marine organisms, such as corals, crustose coralline algae, and foraminifera, presents one of the most elusive, yet relevant areas of biomineralization research, due to the often-impenetrable ability to measure the process in situ. The precipitation of CaCO3 is assumed to be largely controlled by the saturation state [Ω] of the extracellular calcifying fluid. In this study, we mimicked the typical pH and Ω known for the calcifying fluid in corals, while varying the magnesium, calcium, and carbonate concentrations in six chemo-static growth experiments, thereby mimicking various dissolved inorganic carbon concentration mechanisms and ionic movement into the extracellular calcifying fluid. Reduced mineralization and varied CaCO3 morphologies highlight the inhibiting effect of magnesium regardless of pH and Ω and suggests the importance of strong magnesium removal or calcium concentration mechanisms. In respect to ocean acidification studies, this could allow an explanation for why specific marine calcifiers respond differently to lower saturation states.
1. Introduction
Calcium carbonate (CaCO3) is the most important biogenic mineral, in terms of quantity, global distribution, and diversity [1]. The production of CaCO3 provides a number of ecological goods and services, such as shoreline protection and habitat structures. For example, coral reefs are one of the most important living bioconstructions of CaCO3 [2] harboring one-quarter to one-third of all marine species [3], and thus serving to be socially and economically important [4]. Unfortunately, future projections show marine biomineralization will become severely impacted by ocean acidification (OA) due to the reduction of carbonate ion concentrations in the oceans [5,6].
Corals calcify extracellularly in a fluid that is separated from the seawater by at least two cell layers [7,8] and rely on a number of active and passive ionic exchanges. For example, calcium ions are actively transported into the extracellular calcifying fluid (ECF) by the epithelium cells of the coral polyp [9,10] while protons are removed [11], establishing favorable conditions for the precipitation of CaCO3 [12]. Similarly, carbon either diffuses into the ECF as carbon dioxide [CO2] or is actively transported into the ECF in the form of bicarbonate [13,14]. Some coral species can calcify in ocean water that is undersaturated with respect to aragonite [15], whereas other species cease to grow and vanish [16,17], which demonstrates a range of biological controls governing the mineralization process. Therefore, to understand which marine calcifiers will be affected by future reduction in ocean saturation states and to estimate its implications for the global carbon cycle, we need to explore a range of possible ECF scenarios.
The significance of biologically-induced and biologically-influenced mineralization is irrefutable. For example, the skeletal organic matrix [SOM] within corals is considered a major factor controlling the precipitation of CaCO3. A number of studies have reported that the SOM contains not only acid-rich proteins (e.g., sulphated proteoglycans), but also assemblages of adhesion and structural proteins, which together are thought to provide a template for aragonite precipitation [10,18,19,20]. Additionally, the dissolution and precipitation of CaCO3 in aqueous solution is largely dependent on abiotic factors relating to the saturation state (Ω) of the ECF [21,22], which is defined by the product of the dissolved ions forming the mineral divided by the stoichiometric solubility product, Ksp* (Equation (1)).
Ω = [Ca2+]*[CO32−]/Ksp*,
As expressed above, Ω is an extremely useful indicator of the equilibrium or disequilibrium of a solution with a mineral surface. When the ion product, [Ca2+]*[CO32−], equals the solubility product, Ksp*, the saturation state equals one and the system is in equilibrium. If the saturation state is below one because the ion product is lower than the solubility product, the solution is undersaturated and the mineral dissolves. A saturation state higher than one indicates supersaturation where the product of the ion concentrations is greater than the solubility product. In this case, it is thermodynamically viable that dissolved ions precipitate into a crystal structure [22]. The observation that the precipitation rate of CaCO3 increases with an increasing saturation state [21,23,24,25,26,27] has led to the development of empirical relationships (Equation (2)) that describe the calcification rate, G, as a function of the saturation state, where k is the reaction rate constant and n is the empirical reaction order.
G = k*[Ω − 1]n,
This equation has been applied to predict calcification rates in corals [28] and has successfully been used to simulate the dynamics of ion concentrations in the calcifying fluid of corals and coccolithophores [14,28,29,30]. However, Equation (2) appears to ignore the theoretical basis shown in Figure 1, which emphasizes how the product of varying calcium and carbonate ion concentrations can obtain the same Ω value. This is also supported by [31], which demonstrated how the rate of calcite precipitation differed due to the ratio of calcium to carbonate despite having the same oversaturated Ω. Although Ω is a good predictor of dissolution and precipitation of CaCO3, it does exclude the possibility that ion concentrations differ while obtaining the same Ω and could therefore account for observational variations among marine calcifiers.
Based on this rational, we decided to incubate coral skeleton fragments under six controlled abiotic chemo-static scenarios. By emulating previously measured ECF conditions, we kept all the solutions oversaturated in respect to Ωara = 10, pH 8.7, and maintained a typical tropical temperature of 25 °C. Experiment 1a recreated a magnesium [Mg] free condition (strong Mg removal activity) with a high Ca:CO3 ratio (e.g., no dissolved inorganic carbon (DIC) concentrating mechanism and a weak proton removal from the ECF), while experiment 1b recreated a Mg-free solution with a low Ca:CO3 ratio (e.g., mimicking a DIC concentrating mechanism resulting in DIC concentrations three times greater than ambient seawater and a strong proton removal from the ECF resulting in elevated total alkalinity (TA) four times greater than ambient seawater). Experiment 2a recreated a medium Mg scenario (representing concentrations half that of the modern seawater) with a high Ca:CO3 ratio, while experiment 2b recreated a medium Mg scenario with a low Ca:CO3 ratio. Experiment 3a recreated a high Mg scenario (equal to that of modern seawater, i.e., no active removal of ions from the ECF) with a high Ca:CO3 ratio, while experiment 3b recreated a high Mg scenario with a low Ca:CO3 ratio.
2. Materials and Methods
2.1. Preparation of the Seed Material
There are a range of methodological approaches used to study CaCO3 precipitation, previous studies have used powdered calcite 3–7 µm diameter as the seeding material [32], or Iceland spar [31], living specimens, e.g., [33,34], or synthetic crystals [35]. We used bioclastic fragments of Stylophora pistillata to add a potentially realistic coral aragonite crystal structure and investigate if active ion transport, as mediated by the coral calcifying tissue, suffices to drive coral calcification. The ion transporters of the tissue are simulated via the pumped fluids. Our experiment, therefore, aimed to mimic natural processes. However, the only biological component that was not included in the experiments were the organic molecules. This approach is also comparable to a recently published study that did include organic molecules in the incubations [36]. The seeding material for all experiments was obtained from aquarium grown Stylophora pistillata (Leibniz Center for Tropical Marine Research [ZMT], Bremen) and followed the methods of [36]. The coral skeleton fragments were cleaned for 48 h with hydrogen peroxide (H2O2 30%) to remove any soluble components and organic tissue. The coral skeleton fragments were then rinsed in Millipore® water, dried at 40 °C for 24 h, afterwards ground in a planetary ball mill (PM100, Retsch®) for 1 min, and dry sieved (1–200 µm). Individual bioclastic fragments were then hand-picked under a light microscope and selected based on uniform size and shape. These bioclasts are considered rough and represent a typical biogenic skeleton structure. The heterogenetic nature of coral skeletal structure adds a potentially realistic portrayal of the crystal surface adjustment to the ECF but also adds natural variability that occurs in all treatments. Afterwards, each bioclastic fragment was placed in an individual Eppendorf® Safe-Lock 0.5-mL microcentrifuge tube filled with ethanol and placed in an ultrasonic bath for 5 min to remove residual powder and again dried at 40 °C for 24 h. A by-product of this cleaning procedure could result in an increase of the micro-porosity of the bioclastic fragments, by the removal of organic material or breakage. Each fragment was weighed before and after the incubations on a Mettler Toledo® scale with a 1-µg precision (room humidity 30% and temperature 22 °C). As the size and weight of each bioclastic fragment was not perfectly uniform (0.364–1.449 g; Table A1), all bioclastic fragments were evenly distributed among treatments. The initial and end weights, and standardized daily weight increases can be found in the Appendix A (Table A1). To understand the difference in precipitation rate, a two-way factorial analysis of variance (ANOVA), least square (LS), and Tukey–Kramer honest significance difference (HSD) test of the standardized mean weight change between the six experimental scenarios were performed using the software JMP version 9.0. Microstructure formed during each experimental scenario was identified using a scanning electron microscope (Tescan Vega 3 XMU SEM, ZMT) back-scatter electron (BSE) images. Crystal structures of individual CaCO3 polymorphs (vaterite, calcite and aragonite) were analyzed under the Raman microscope at the Alfred Wegener Institute for Polar and Marine Research (AWI) in Bremerhaven, Germany, with the help of Dr. Gernot Nehrke. Due to the uneven surface of the incubated crystals, we did not perform a mapping of the whole crystal but focused on individual crystal structures to qualitatively identify the polymorphs with the Raman spectrum (Figure A1).
2.2. Experimental Setup
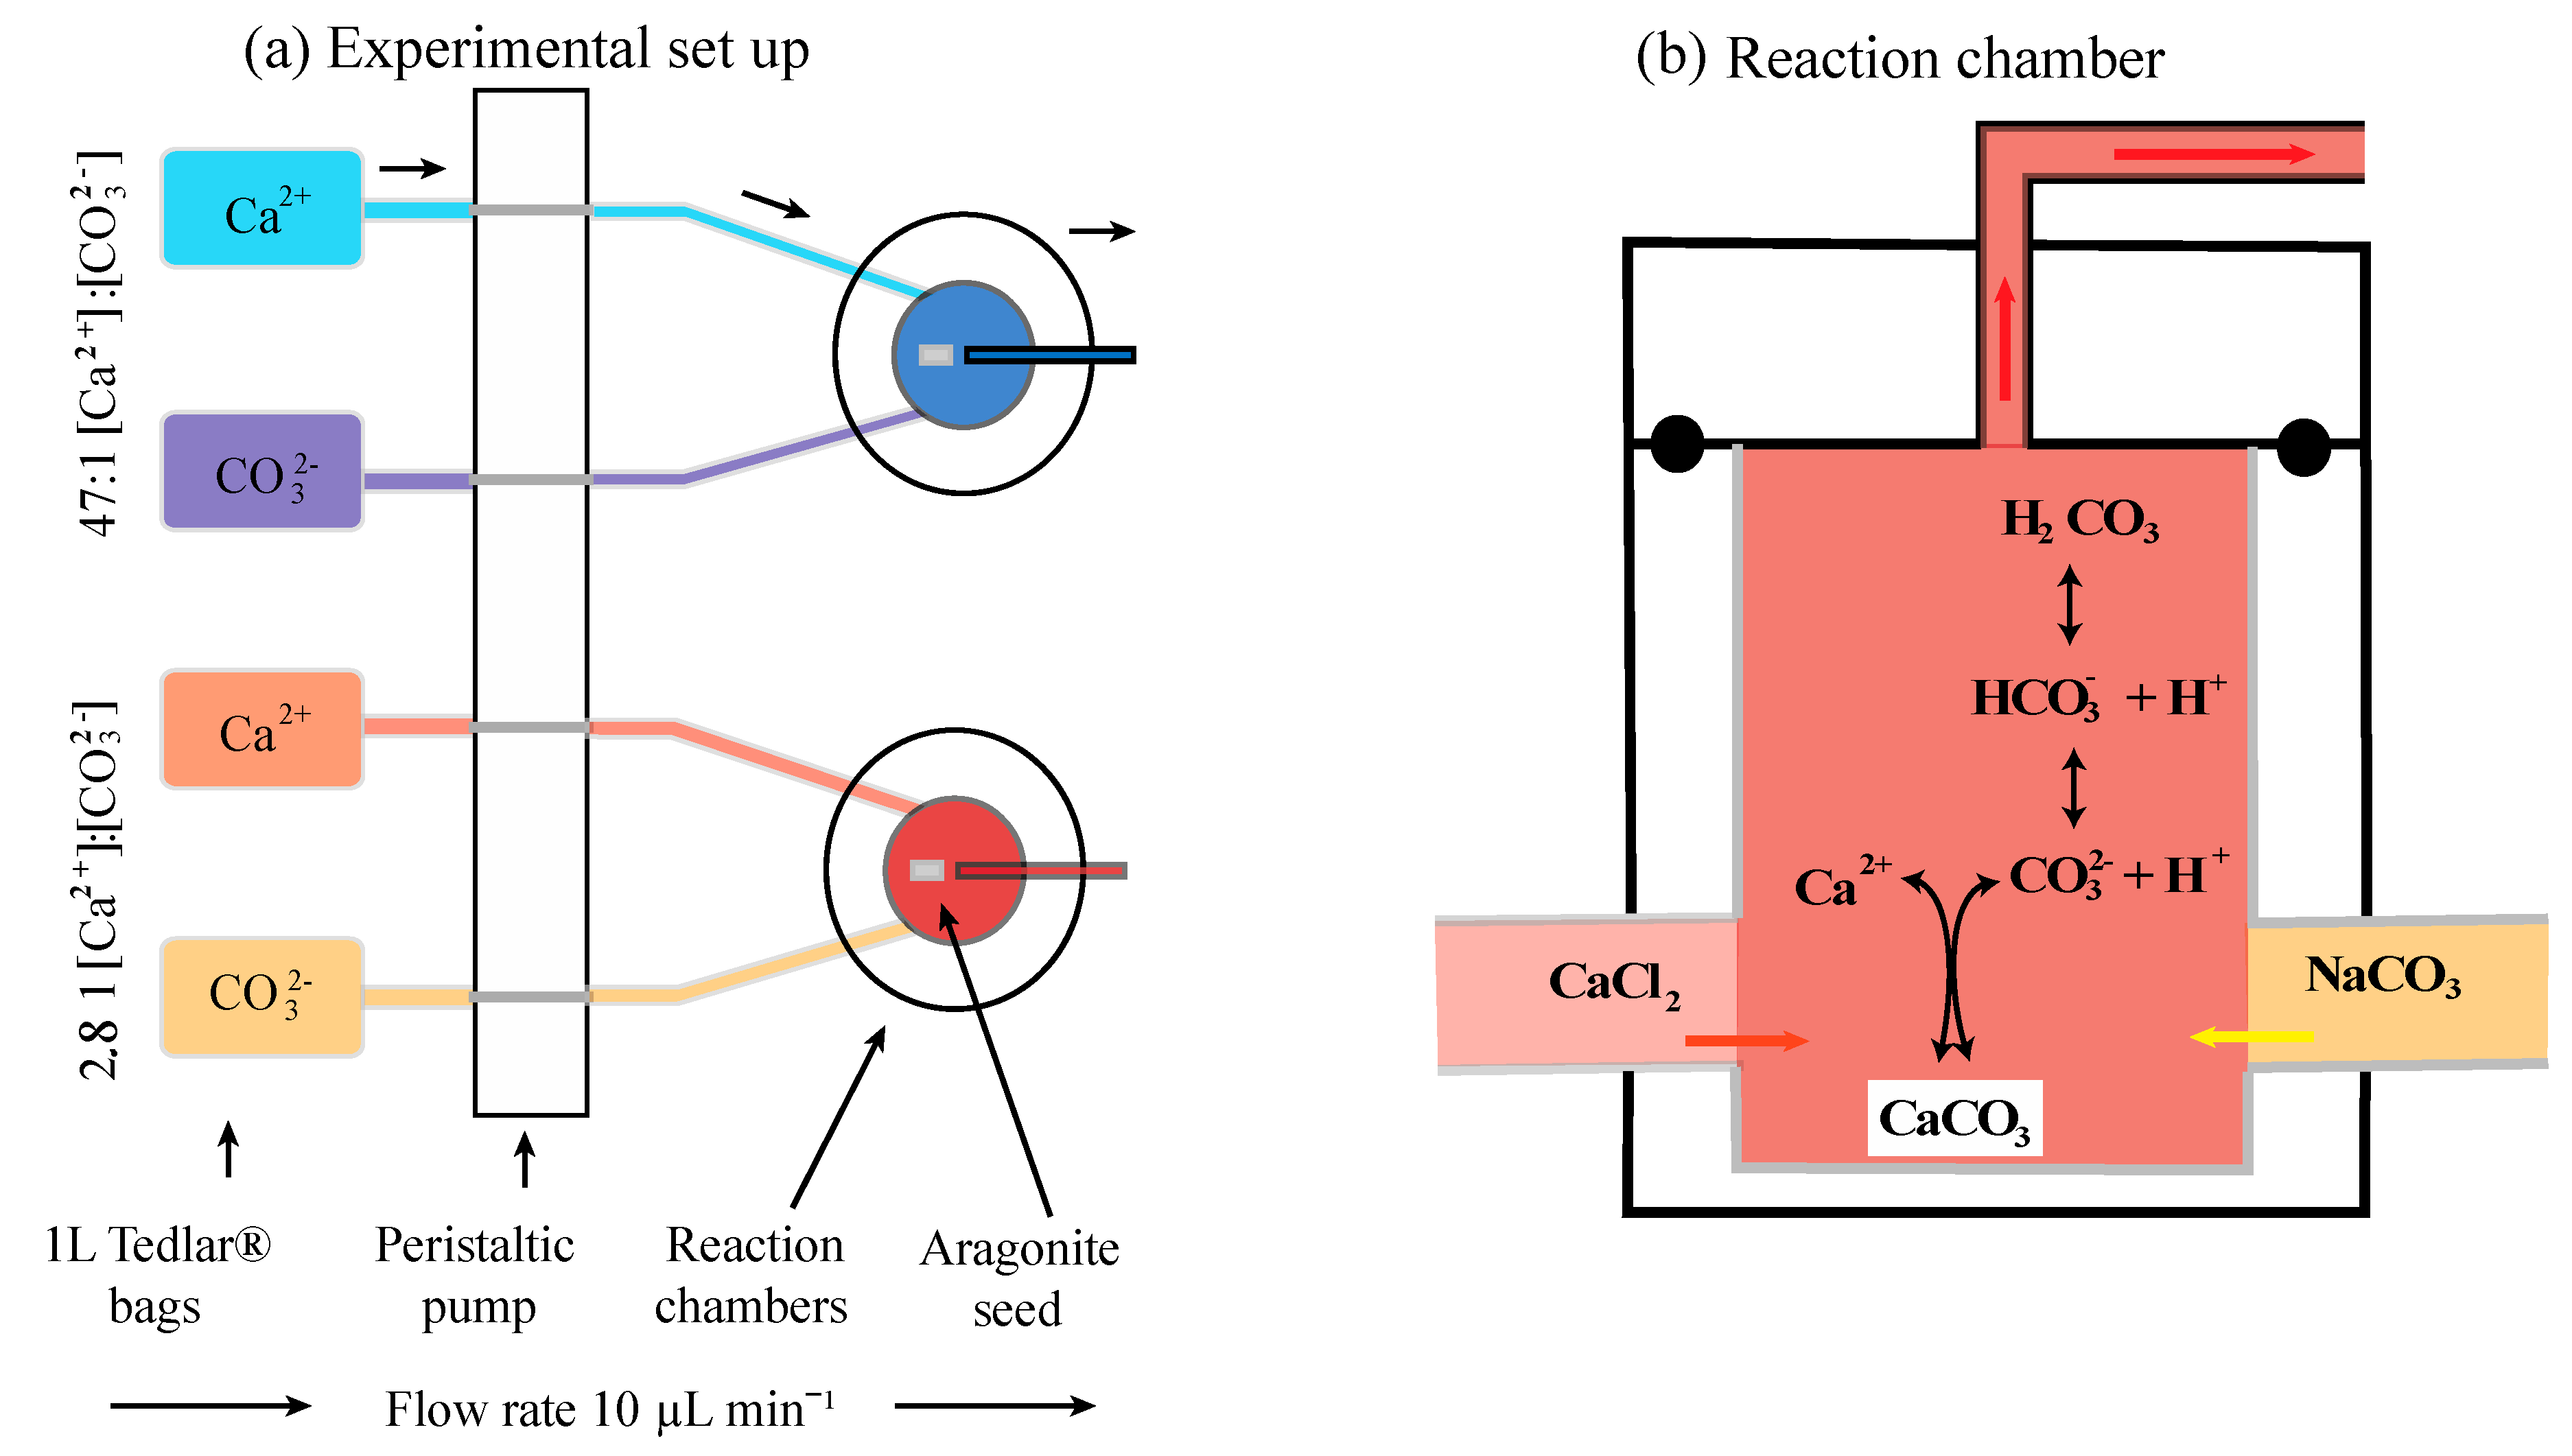
Ten custom-built incubation chambers made of Teflon [31,36] were used to conduct three cross-factor experiments with two Ca:CO3 scenarios (high and low) in parallel with three Mg concentrations (0 mM, 26.5 mM, and 53 mM) in series (Figure 2; Table 1). Each chamber was attached with Tygon and Marprene® tubing to two 1-L Tedlar® gas sampling bags filled with either a calcium chloride [CaCl2] or sodium bicarbonate [NaHCO3], the preparation of the stock solution is detailed below. Five replicates were run for each treatment. The volume of each incubation chambers was 0.25 mL. The initial flow rate of the solutions into the chambers was accelerated to quickly fill the incubation chambers and then reduced to a constant flow (10 μL min−1) via a 24-channel peristaltic pump (Ismatec®). The seed material was placed in each of the incubation chambers and the experiments were run between 32–70 days in a temperature-controlled Rumed® climate cabinet maintained at a constant 25 °C (±0.5 °C). The variation in experimental duration was due to unexpected health and safety issues of the authors not being allowed into the laboratory.
2.3. Preparation of Stock Solutions
All experiment stock solutions were prepared with Millipore® water, which was initially boiled to drive out dissolved CO2 and then kept in a constant N2 atmosphere to prevent CO2 in-gassing. For all stock solutions pH was measured with a WTW-Multi 3430 Set K pH senor and calibrated with the pH 4 and 10 buffers at 25 °C. Among all the experiments temperature, salinity, and pH remained constant at 25 °C, 36, and 8.7, respectively. The aragonite saturation state, Ωara in all incubations was 10, with a saturation index, SIara = log(Ωara), of 2.8, which should induce aragonite precipitation. These parameters represent conservative estimates of realistic scenarios for the coral ECF [11,37]. The aquatic properties chosen for the stock solutions in these experiments reflect the ECF parameters known for Galaxea fascicularis, but may not be representative for other coral species, e.g., [38,39]. The full details of the quantity of chemical compounds used for each experiment can be found in Table 2. Each chemical compound was weighed on a Mettler Toledo® scale with a 1µg precision (room humidity 30% and temperature 22 °C). Concentrations of CaCl2 and magnesium chloride [MgCl2] in the calcium stock solution and NaHCO3 in the carbonate stock solution were double the target concentrations for calcium and carbonate ions because the fluids enter the incubation chambers at a 1:1 ratio and dilute each other’s concentration by half (quantiles are given in Table 2A). After adding all the necessary chemical compounds to the stock solutions, they were transferred into 1-L Tedlar® gas sampling bags [36] and put into the climate cabinet at constant 25 °C (±0.5 °C). This study would improve greatly if microsensors were installed in the incubation chambers to monitor the real time chemistry. Unfortunately, our approach relies on the calculated parameters inside the chambers similar to the work of [31,36].
The calcium stock solutions were prepared by dissolving CaCl2 in 5-L of carbon-free Millipore® water. For the experiments containing magnesium, MgCl2 was added to the stock solution of CaCl2. The Mg concentrations were chosen to represent a strong ion removal mechanism (0 mM, control Mg treatment), a medium ion removal mechanism [26.5 mM, equivalent to half the concentration in present day seawater], and a weak ion removal mechanism (53 mM, equivalent to the concentration in present day seawater). The amount of sodium chloride [NaCl] was then adjusted to maintain a final salinity of 36. Neither carbon nor alkalinity was present in the CaCl2 stock solution (pH = 7), therefore maintaining a zero DIC and TA concentration.
The carbonate stock solutions were prepared by dissolving NaHCO3 in 5-L of carbon-free Millipore® water. Sodium hydroxide [NaOH] was added via titration to adjust TA and to reach a pH of 8.716. The pH of the carbonate stock solution was 8.716 because when it mixes with the CaCl2 solution (pH = 7) in the incubation chamber the pH will adjust to 8.700 because DIC and TA are known to mix conservatively [40]. DIC and TA were calculated for equilibrium carbonate chemistry in NaCl using the dissociation constants of [41].
Although the concentration of calcium in the ECF is known to vary, previous studies have recorded values between 9–15 mM from cold-water corals 9–12.3 mM with a mean of 9.9 mM; [42] and the tropical corals Pocillopora damicornis and Acropora youngei range between ca. 9–15 mM; [43]. The target value of 10.6 mM calcium, was chosen for the incubations with a high Ca:CO3 (47:1) stoichiometry because it represents conditions measured with microelectrodes in the ECF of Galaxea fascicularis 9–11 mM; [11]. Although the target value of 2.6 mM calcium is perhaps unrealistically low, it was chosen for the incubations with a low Ca:CO3 (2.8:1) stoichiometry to emulate a strong proton removal from the ECF (resulting in elevated TA four times greater than ambient seawater), as well as a DIC concentrating mechanism (three times greater DIC than ambient seawater) as proposed by a number of authors [28,44,45,46]. These Ca:CO3 stoichiometries were also chosen to maintain constant pH and Ωara between the treatments.
3. Results
3.1. Precipitation Rates
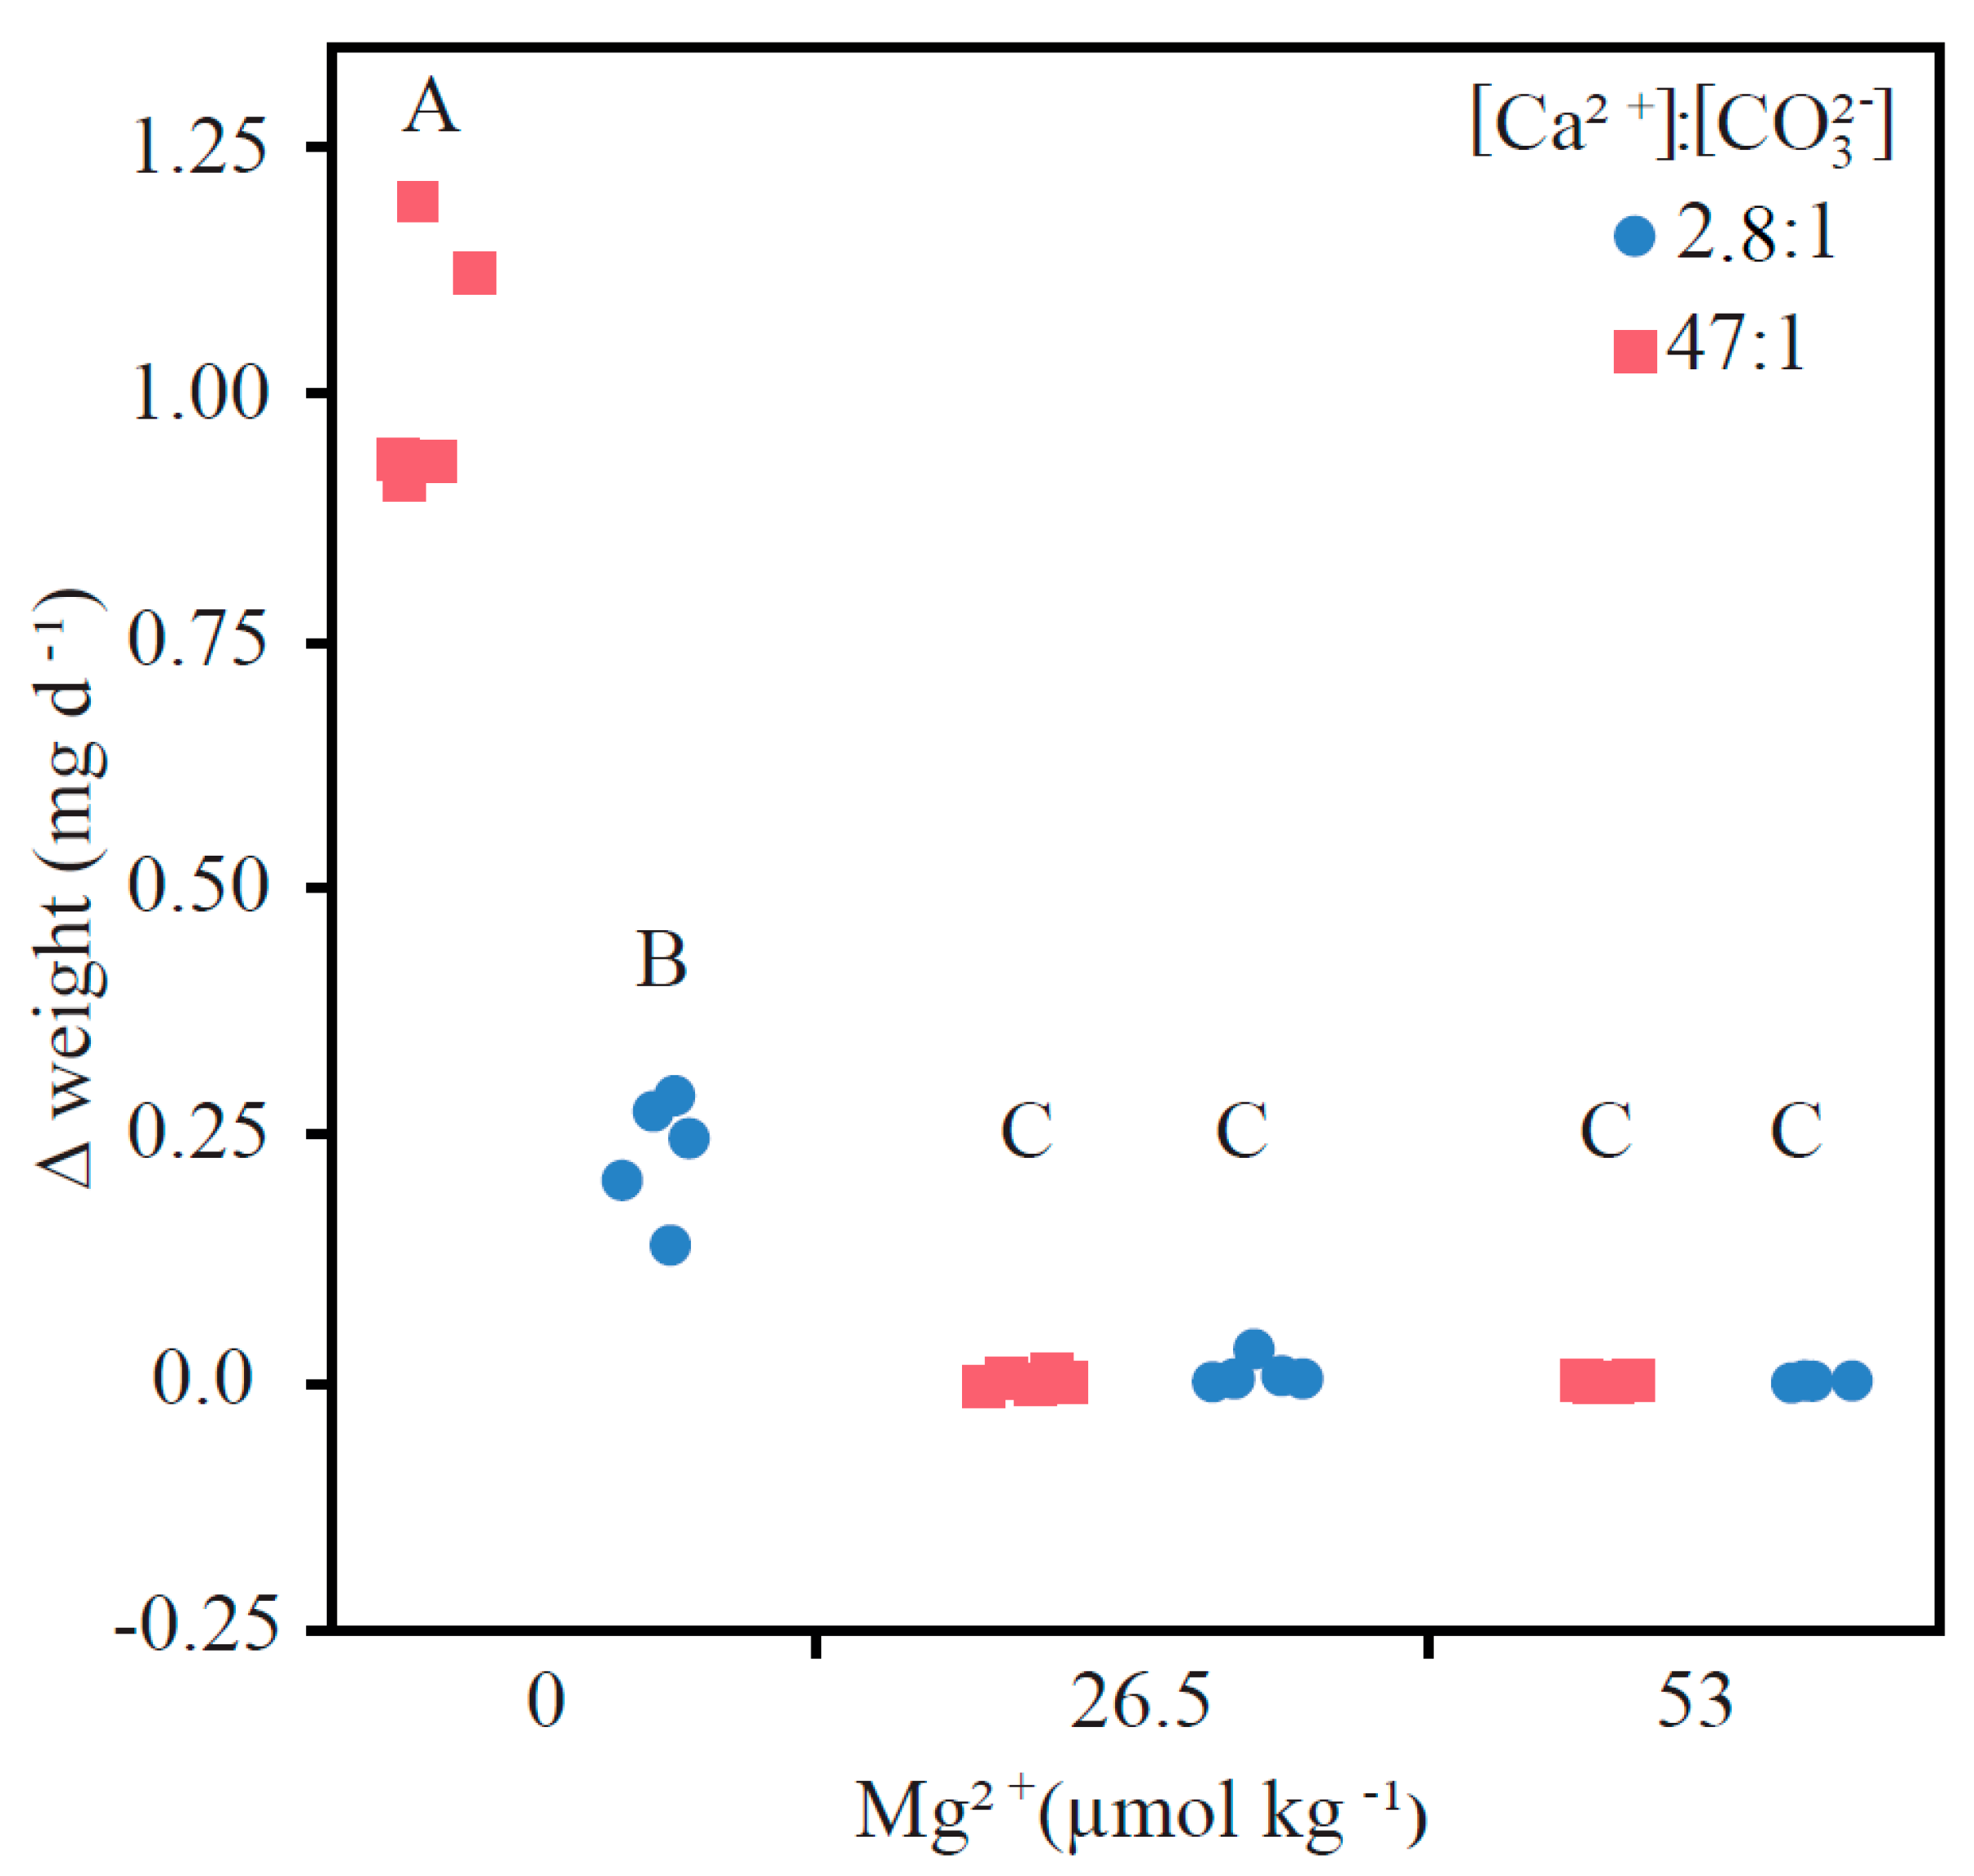
A highly significant interactive effect of Mg ion concentration and Ca:CO3 concentration was observed (Figure 3; Table 2; F[2,24] = 150.924, p < 0.001). When Mg was included into the aquatic solution, neither a significant weight change of the CaCO3 seed nor a difference between the two Ca:CO3 scenarios were observed (Table 2; Table A1). Conversely, both Mg-free Ca:CO3 scenarios had significant weight increases. The Mg-free 47:1 Ca:CO3 scenario had a calcification rate four times that of the Mg-free 2.8:1 Ca:CO3 scenario (Figure 3, points labelled A and B). The average weight increase (± SD) in the Mg−free 47:1 Ca:CO3 treatment was 1.017 (± 0.130] mg d−1 and 0.229 (± 0.061) mg d−1 in the Mg-free 2.8:1 Ca:CO3 treatment. The high amount of newly formed CaCO3 measured in the Mg-free 47:1 Ca:CO32− is partly explained by spontaneous nucleation, which was only observed in this scenario. Slight dissolution was observed under the intermediate (26.5 mM] and high (53 mM) Mg scenario with a 47:1 Ca:CO3 concentration (−0.001 mg d−1 ± 0.001 and −0.002 mg d−1 ± 0.003, respectively). The intermediate and high Mg scenario with a 2.8:1 Ca:CO3 concentration had no significant weight changes (0.000 mg d−1 ± 0.001 and 0.002 mg d−1 ± 0.007, respectively), the Ca:CO3 concentration had no effect on the growth rate when Mg ion concentration was equal to or half that found in the ambient ocean, indicating that in this situation Mg has a stronger inhibiting effect towards calcification than Ca:CO3 concentrations.
3.2. Mineralogy and Crystal Morphology
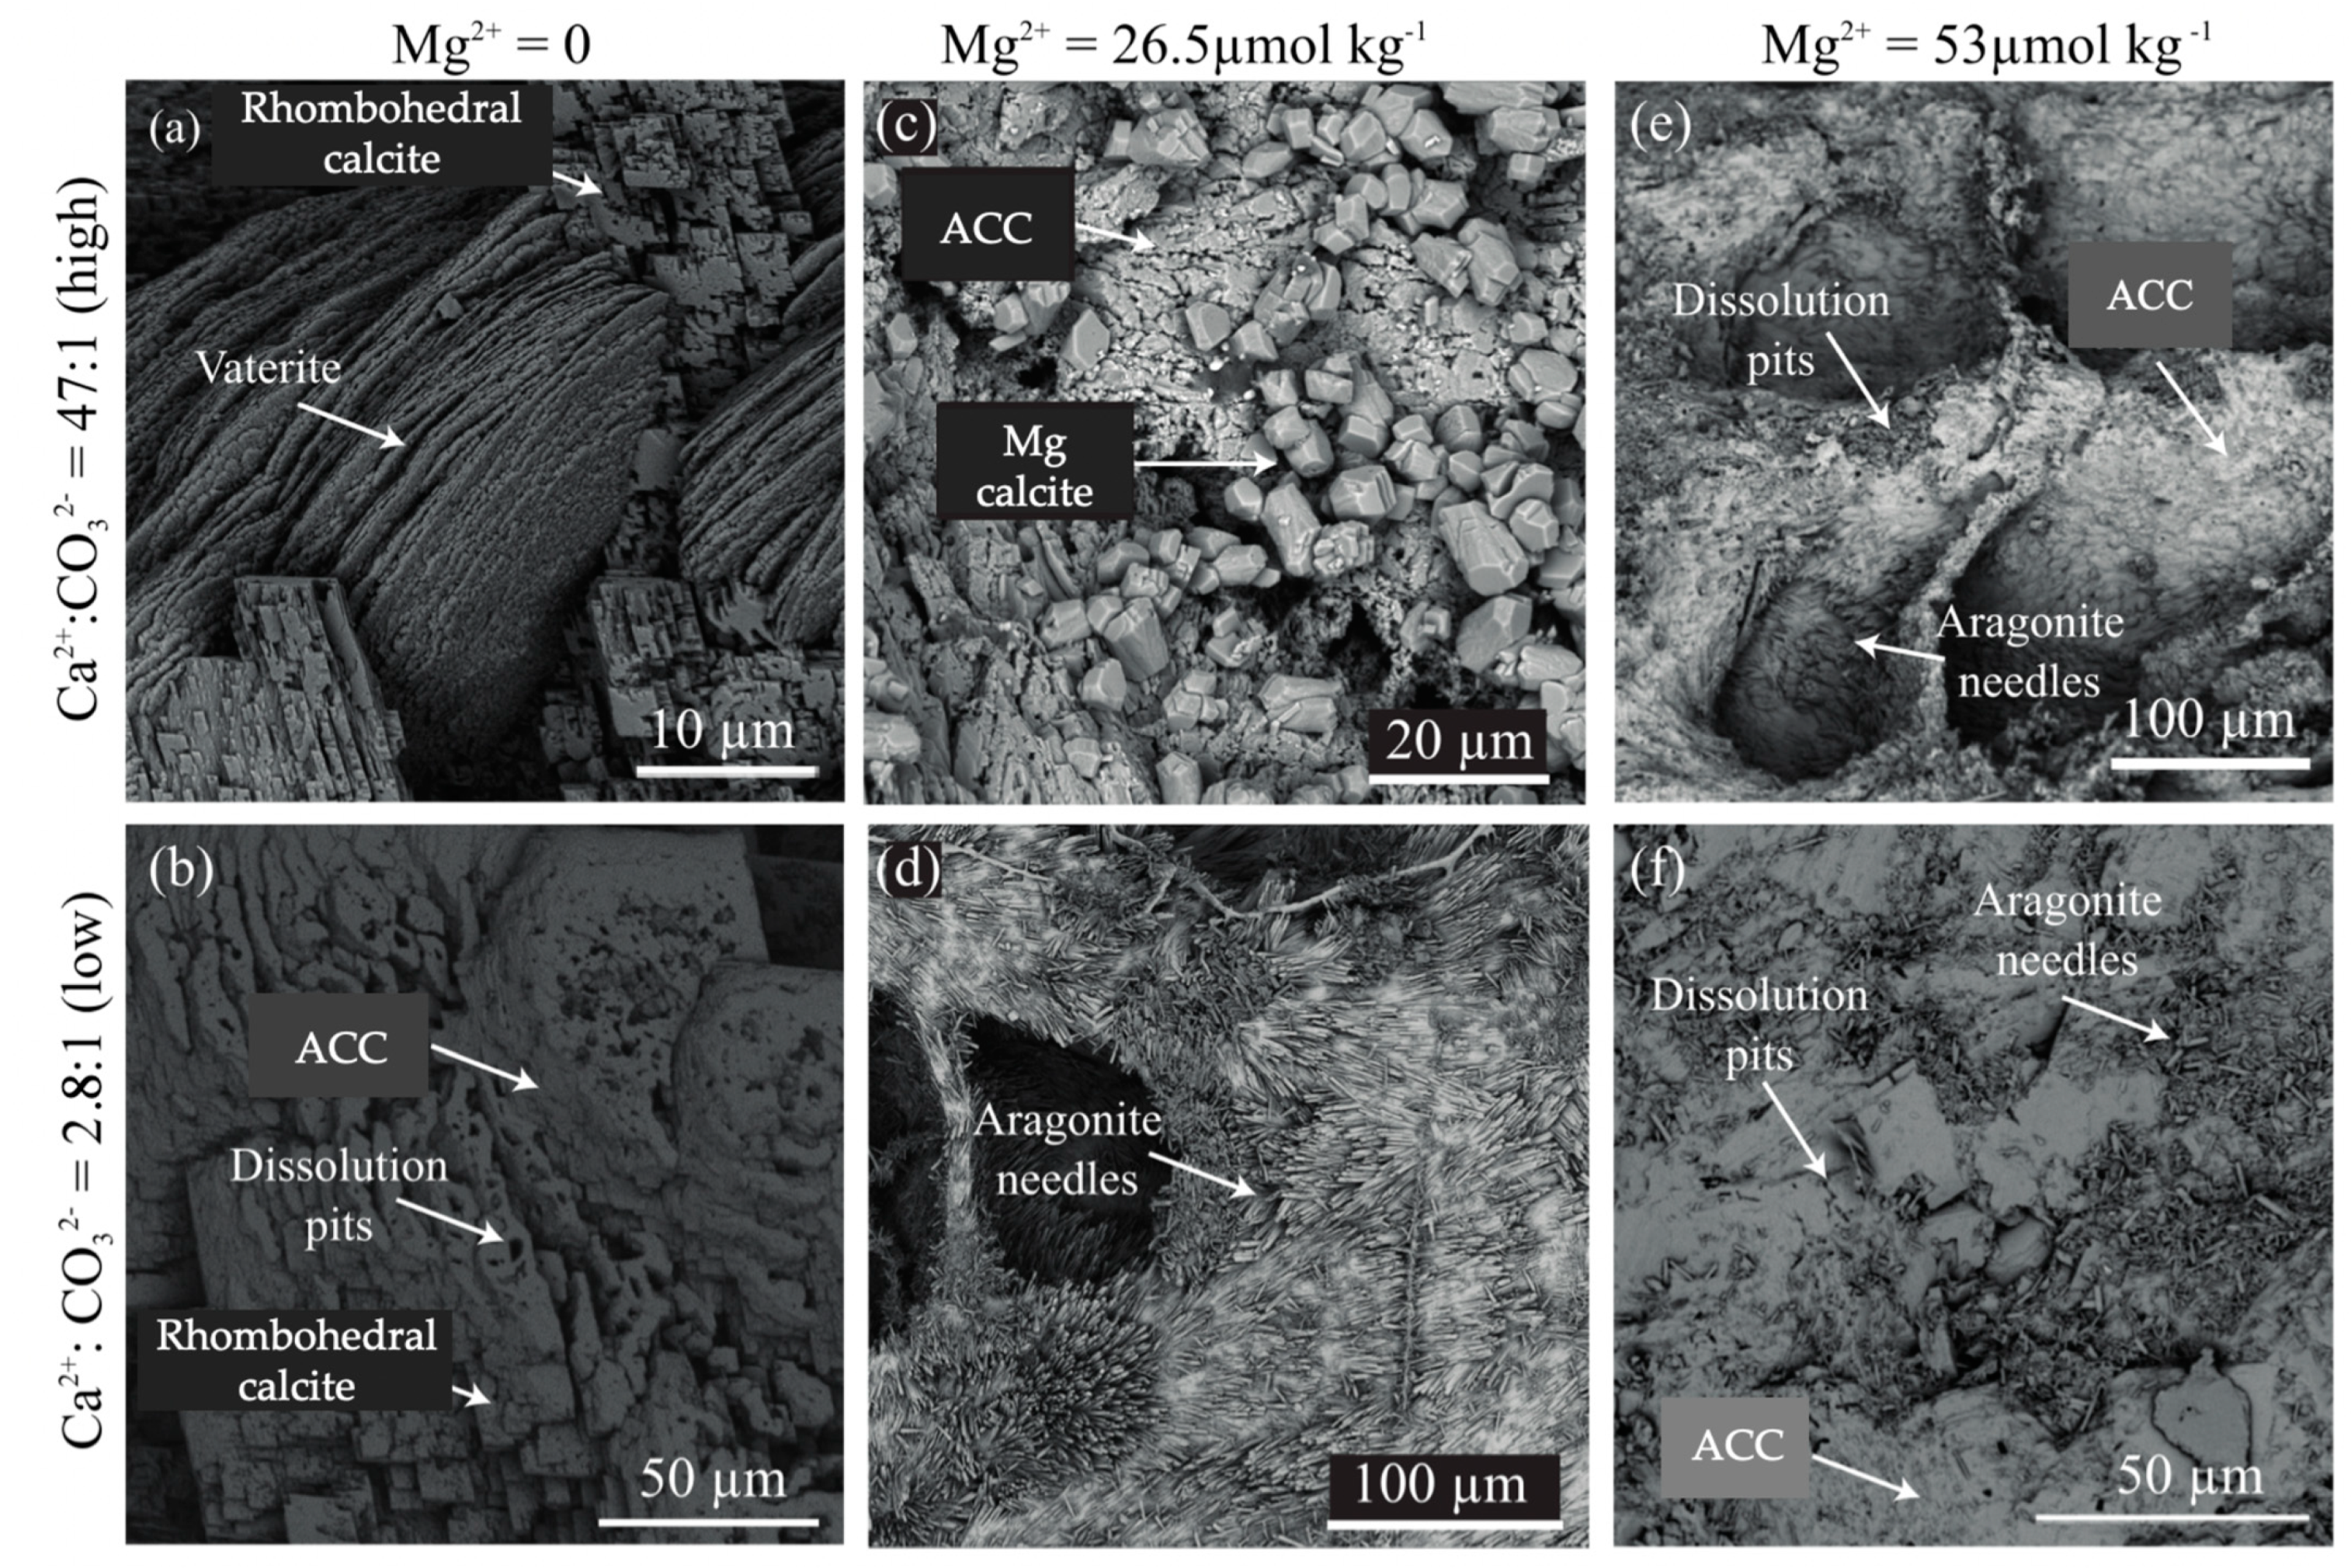
Back-scatter electron (BSE) images of the CaCO3 surfaces show distinct morphological differences between the six treatments. The Mg-free (control Mg treatment) 47:1 Ca:CO3 incubations formed homogeneous and heterogeneous nucleation in the form of crosshatched vaterite pre-spherical and laminated cubed calcite (Figure 4a). In the Mg-free 2.8:1 scenario, laminated cube calcite precipitated, along with amorphic calcium carbonate (ACC) or a stable prenucleation calcium carbonate cluster c.f. [47], and presumably unfinished calcite transforming from proto-vaterite precursors (Figure 4b). Despite the absence of a measurable weight increase from both the Mg addition scenarios with the 2.8:1 Ca:CO3, newly formed aragonite needles were visibly precipitated on top of the seeding material (Figure 4d,f). Well-defined and abundant acicular crystals were precipitated in random directions and from multiple centers of nucleation as well as from cemented CaCO3 (Figure 4f). In the scenario with high Mg concentration (equal to present day seawater, 53 mM) and at a 2.8:1 Ca:CO3, CaCO3, cements were also observed along with dissolution pits in a needle form (Figure 4f). In the scenario with lower Mg concentration (equal to half the present-day seawater, 26.5 mM) with a 47:1 Ca:CO3, both ACC and dissolution pits were observed, in addition to Mg-calcite (Figure 4c). Conversely, in the scenario with the high Mg concentration and 47:1 Ca:CO3, cements primarily formed along with dissolution pits, and low-relief aragonite needles within the seed material crevices (Figure 4e).
4. Discussion
This study compartmentalizes hypothetical abiotic conditions of the ECF, with the aim to gain a broader understanding of the chemical mechanisms relating to biomineralization among tropical marine calcifiers. We show that despite the same ion product of Ca and CO3, calcification rates vary with different Ca:CO3 ratios and Mg concentrations. In agreement with [31,36], this study emphasizes the importance of considering the ratio of Ca:CO3 when estimating the Ωara within the ECF of marine calcifiers as exemplified in Figure 1. It is worth noting that in these experiments calcite and vaterite were also precipitated. The calculated Ωara in all experiments was 10, Ωcalcite was 15.15. Even though Ωvaterite has been reported to be lower than Ωara and Ωcalcite it is not possible to calculate Ωvaterite because this requires knowledge of the solubility product [49,50]. Our results show that high calcification rates, are not possible when the Mg concentration is equal to or half that of present-day oceanic concentrations, unless it is counterbalanced by a number of additional factors such as Ca:CO3 stoichiometry, temperature, Ωara, proton pumping, or organic molecules. This study infers that the specific conditions required for CaCO3 precipitation among marine calcifiers is positively amplified by the organism. It is difficult to fully understand the process that controls biomineralization without further in situ ionic measurements from the ECF or more in vitro experiments.
4.1. Comparing Low and High Ca:CO3 Scenarios
Generalized CaCO3 precipitation models, as described by [23,28], present disagreement regarding the values for the coefficients n and k [24,25,51], which overestimate the calcification flux at low carbonate concentrations, e.g., when the ECF becomes DIC limited. It is well documented that biomineralization requires elevated Ω and in doing so implies DIC concentrating mechanisms [28,44,45,46]. However, direct DIC measurements from the ECF within tropical corals indicate concentrations similar to that of ambient seawater [37], which may result from high DIC consumption during calcification. As seen in previous studies, calcification among tropical corals can be maintained by elevating the Ca ions in the ECF to compensate decreasing seawater pH [43], while decreasing the strontium:calcium [Sr:Ca] and borate [B(OH)4:CO32−] ratios [52]. When comparing the low Ca:CO3 (mimicking strong proton removal from the ECF resulting in elevated TA four times greater than ambient seawater, and a DIC concentrating mechanism resulting in DIC three times greater than ambient seawater) with the high Ca:CO3 scenario [ambient seawater DIC and TA] at elevated pH = 8.7 and Ωara = 10 and 0 Mg [control Mg treatment], calcite precipitation rates were three times greater in the ambient seawater treatment than in the DIC concentrating mechanism treatment (Figure 3). This implies that ambient DIC is sufficient to induce calcification provided that homeostasis is maintained in the ECF and the DIC withdrawal from calcification is balanced by ionic flow rates in and out of the ECF [44,45,46].
4.2. The Connection between Mg and Calcification
Marine carbonate-producing organisms exert strong biogenic control to promote calcification within their ECF. This biogenic control is evident by the various mineralogy types and microstructures found among marine carbonate-producing organisms [53]. Calcite is preferentially precipitated as a function of lower temperatures and/or Mg:Ca ratios [54], in addition to the preferential substitution of Ca for Mg, e.g., high-Mg calcite [25]. For example, previous studies have shown coralline algae [33], scleractinian corals [34], and juvenile scleractinian coral [55] can produce calcite when the Mg:Ca ratio of seawater is <2 (e.g., Cretaceous calcitic seas) but at a slower rate. A recent study also found the presence of Mg ions to inhibit not only calcite nucleation during crystal formation but also aragonite [56]. Similarly, it has been shown that strontium also inhibits precipitation rates as a direct correlation with the aqueous calcium activity, thus preventing the attachment of calcium ions to the reactive sites [57,58]. Aragonite microstructure has also been shown to vary as a function of calcification rate, from rapidly formed granular centers of calcification to slower formed fibrous needles [59,60] as determined by the fractionation of δ18O and δ13C isotopes [61,62] and Mg:Ca ratios [59,60,63].
4.3. Polynucleation and Spontaneous Nucleation
The ratio of calcium to carbonate clearly matters within the ECF, as it has been shown to describe the rate and morphology of CaCO3 (Figure 3 and Figure 4). Precipitation pathways can be either direct or sequential depending on the free energy available on the surface as determined by pre-nucleation clusters (PNC), growth, and transformation [64,65,66,67]. Polynucleation occurred in all scenarios in this study, which led to a complex situation increasing the number of active sites on the surface layer, and therefore a stronger dependence on supersaturation than solely the layer-by-layer mineralization process [31]. Further complications arise because the rate-determining step may change with time as the number of defects and the relative dimensions of the crystal faces become modified during precipitation. Therefore, there are often deviations from the idealized kinetic models, as there may be a number of mechanisms operating in concert [66,67,68]. It is interesting to note that spontaneous nucleation appeared in the experiment with high excess of calcium ions relative to carbonate ions (i.e., the ambient DIC and TA seawater treatment) but not in the low Ca:CO3 treatment (i.e., the DIC concentrating mechanism scenario), however previous studies have shown that PNC usually form in a low Ca:CO3 solution, equivalent to the binding of ions during crystal formation [47]. This may be due to metastable conditions under which precipitation of the mineral is delayed despite the solution being oversaturated in respect to Ωara [67].
The higher calcification rates in the Mg-free and 47:1 Ca:CO3 scenario were obtained primarily due to spontaneous nucleation within the incubation chamber leading to much higher precipitation and thus greater reactive surface area. Previous calcite precipitation experiments in supersaturated (Ωcalcite 5, 16; pH = 10; T = 20 °C) conditions did not produce spontaneous nucleation and showed an optimum precipitation rate when Ca:CO3 = 1:1 [31]. However, there are differences between this study and [31], one of which is the use of NaHCO3 to prepare the carbonate solution in this study instead of K2CO3. This together with a temperature difference of 5 °C can potentially explain the variation between our observations and [31].
4.4. CaCO3 Polymorphs
In the SEM images (Figure 4), the Mg-free high Ca:CO3 scenario we see ACC, metastable inter-crosshatched vaterite pre-spheres, and rhombohedral calcite blocks. The sequential dissolution and re-precipitation mechanism can be explained via the kinetic rate, which is primarily controlled by the surface area of the crystal [69]. The mixture of vaterite and calcite suggests that calcite mineralization is the rate-determining step. The substitution of Mg into the ACC will however precipitate directly into calcite without the intermediate vaterite phase [70,71] as seen in the 2.5 Mg high Ca:CO3 scenario (Figure 4c]. Under the present-day Mg:Ca ratio, aragonite dominates the kinetics of nucleation due to the calcite nucleation barrier being greater than metastable aragonite [72], which explains the lack of calcite in the high-Mg scenario. However, nucleation and precipitation in both the high-Mg scenarios where close to zero, implying that the aragonite seeding material was in equilibrium with the solution as shown by the dominance of ACC (Figure 4d–f) and dissolution pits in the shape of aragonite needles (Figure 4f).
The Ca:CO3 ratio as well as the Mg concentration affected the CaCO3 polymorph precipitated from the oversaturated solutions (Figure 4). In the Mg-free incubations, we obtained crosshatched vaterite and layered rhombohedral calcite in the high Ca:CO3 scenario (Figure 4a] and an intermediate form of ACC together with rhombohedral calcite in the low Ca:CO3 scenario (Figure 4b). In the incubations with 26.5 mM Mg, we obtained an unconnected Mg-calcite in the high Ca:CO3 scenario (Figure 4c) and aragonite needles in the low Ca:CO3 scenario (Figure 4d). With a 53 mM Mg concentration, representing normal seawater conditions, very little new material precipitated, most of which were ACC with sparse low relief aragonite needles (Figure 4e) or unconnected aragonite needles with dissolution pits in the form of needles (Figure 4f). Varying the Ca:CO3, while keeping the Mg concentration fixed, changes the Mg:Ca ratio, which may have driven the differences in polymorphs shown in Figure 4c,d. Overall, the variety of polymorphs precipitated at a pH of 8.7 and an Ωara of 10 demonstrates that Ω alone does not control the precipitation process, as also suggested by [73]. Therefore, caution should be applied when inferring saturation state from the crystal morphology [60], particularly if other factors, e.g., Mg concentrations, temperature, or DIC, are not known.
Even though this study removes the organic aspect of biomineralization, organic molecules have been shown to act as a template to facilitate or induce crystallization [20,74,75,76,77] due to their strong binding potential with calcium ions [78,79]. The source of the organics is likely a combination of polyp-derived SOM and seawater-derived SOM as demonstrated from a comparison of coral skeletons and abiotic aragonite [80]. However, the presence of SOM or coral mucus in oversaturated solutions has also been shown to inhibit the nucleation of CaCO3 [81] or pose no effect towards the rate of calcification [31]. Rather, organic molecules appear to influence the CaCO3 polymorph that precipitates from an oversaturated solution [31,77,82]. This suggests that organic molecules have a greater influence on the processes at the crystal surface that leads to the formation of a crystal structure, but not the kinetic processes, which transports the ions to the crystal surface.
An interesting observation from this study is that the aragonite needles precipitated in synthetic seawater (observed in the 26.5 mM Mg with a 2.8:1 Ca:CO3 treatment] with no added biomolecules have a similar morphological appearance to synthetic aragonite experiments made from natural seawater, presumably with some residual organic carbon [60]. This could suggest that coral aragonite crystals may precipitate abiogenically after being initially nucleated, since abiotic systems that lack biomolecule templates altogether show similar morphologies.
4.5. Implications for Coral Reef Calcifiers
The concentrations of Mg or PO4, which actively influence crystallization [21,23,24,67,83], are not well known for the ECF among marine organisms. Several studies assume the Mg concentrations in the ECF to be the same as in seawater and thus imply very high Ωara (>20) in order to explain the high precipitation rates as observed in corals [11,23,24,70,71,72,73,74,75,76,77,78,79,81,84]. Pioneer studies, which utilized various techniques, are largely in agreement with the range of Ωara in the ECF. For example, based on microsensor measurements, Ωara ranges from 11–25.5 [11,12,38,46], with the exception of 3.2 in the dark [11], 11–12.3 from Raman spectra [43,85], 11–25 inferred from δ11B isotopes [44,86], 11.1–17.3 predicted by X-ray diffraction-based crystallographic estimates [87], and previously reviewed by [38] to range between 10.16–38.31. While, previous studies have reported the pH in the ECF to be 0.5–0.2 units higher than ambient seawater [46] and that homoeostasis can be maintained within the ECF regardless of varying external seawater pH [88]. Thus, implying a wide range of plausible Ca:CO3 and Ca:Mg ratios within the ECF which enable CaCO3 precipitation.
Measured Mg:Ca ratios from coral skeletons are between 1.5–5.5 mmol/mol [89,90,91,92] and from inorganic aragonite has between ~8.5–10 mmol/mol [59], while inorganic calcite has between 30–140 mmol/mol [93], demonstrating the importance of a Mg removal mechanism to facilitate the rate and morphology of calcification. Our results show that high calcification rates observed in corals are not possible when the Mg ion concentration in the ECF is equal to or half that of present day oceanic concentrations (Mg:Ca > 2.5). The high calcification rates observed in this study suggest a mechanism for active removal of inhibiting ions such as Mg from the coral ECF or a Ca concentration mechanism as suggested previously [43]. These points stress the well held belief that biomineralization is a highly complex and biologically mediated process, orchestrated by the secretion of organic molecules [94] and active ion transport [29].
Heterogeneous nucleation is largely inferred by the presence of biomolecules such as acid-rich proteins (e.g., sulphated proteoglycans) and various adhesion and structural proteins [10,18,19] are considered vital for the promotion and functioning of CaCO3 structures. Additionally, the presence of SOM is known to influence the CaCO3 crystal polymorph precipitated from over saturated solutions [82]. Recent experiments [36] confirmed an inhibiting role of coral organic molecules towards rate but not form of CaCO3 [81]. For instance, the role of an ACC precursor phase is likely initiated by a series of controlled biomineralization mechanisms [95,96], particularly for polymorphic calcifying marine organisms. Heterogeneous nucleation has been observed in a range of marine calcifiers such as barnacles [97], echinoderms [95,98], coralline algae [99], foraminifera [100], and corals [43,96].
5. Conclusions
To understand the nuances of how coral reef calcifiers can adapt to global change, such as ocean acidification, we need to better understand the ionic composition at the site of calcification. Unfortunately, in the short-term tropical calcifying organisms show little acclimatization potential to ocean acidification [101] particularly when coupled with thermal stress [102], but there are few examples of resistance by altering the ionic concentrations in the ECF, for example Ca [43]. Additionally, this study considered the influence of various Ca:CO3 stoichiometry and Mg concentrations on the precipitation rates and morphology of CaCO3 in a homeostatic experiment. Although there is still a need to conduct more experiments covering a range of other possible scenarios, we believe that our findings are highly relevant within the field of coral reef research for the following reasons:
- Varying concentrations of calcium and carbonate ions at fixed Ωara demonstrates the underlining principal that calcium and carbonate ion concentrations can obtain the same Ωara value at different Ca:CO3 stoichiometry and questions the generalized applicability of the empirical equation that prescribes the calcification rate as a function of Ωara alone.
- As shown, calcifying fluid stoichiometry alters the precipitation rate and morphology of CaCO3 at a constant Ω and pH. Therefore, our findings suggest caution should be applied when inferring saturation state from the crystal morphology, particularly if other factors e.g., Mg, temperature, or DIC are not known.
- When comparing a strong proton removal scenario and a DIC concentrating mechanism to a scenario with ambient seawater pH and DIC conditions, calcite precipitation rates were three times greater in the ambient seawater conditions. Implying ambient seawater pH and DIC within the calcifying fluid is sufficient to induce calcification provided homeostasis is maintained.
- Mg exerts a stronger effect on the instability of CaCO3 than Ca:CO3 stoichiometry, in which Mg incorporation locally disturbs the coordination environment in the aragonite structure [87,103]. These differences emphasize the importance of Mg removal from the calcifying fluid. Future studies are recommended to additionally monitor the Mg concentration in the calcifying fluid along with the carbon chemistry.
Author Contributions
C.E.R. and S.H., contributed equally to all aspects of this study from the conceptualization, methodology, validation, analysis, drafting, writing, and editing, visualization, project administration, and funding acquisition of this study. All authors have read and agreed to the published version of the manuscript.
Funding
This project was funded by the Leibniz Center for Tropical Marine Research [ZMT, Bremen] who is supported by the Ministerium für Kultur und Wissenschaft des Landes Nordrhein-Westfalen, the Regierende Bürgermeister von Berlin-inkl. Wissenschaft und Forschung, and the Bundesministerium für Bildung und Forschung.
Acknowledgments
Special thanks to Matthias Birkicht for analytical support and Gernot Nehrke for use of the CRM to identify the crystal polymorphs. We greatly appreciate the constructive comments from the three anonymous reviewers.
Conflicts of Interest
The authors declare no conflict of interest. The funders had no role in the design of the study; in the collection, analyses, or interpretation of data; in the writing of the manuscript, or in the decision to publish the results.
Appendix A

Table A1.
Initial and final seed weights, including the duration of the experiment and the standardized weight change. Experimental identification corresponds to the aqueous conditions detailed in Table 1. The seed weight values are listed in grams, the experimental identification code is listed as Exp., the individual CaCO3 bioclast identification is listed under Seed, the initial weight and end weight of the seed material correspond to column t0 and te, the number of days in the experimental conditions is in column D (variation in experimental duration was due to unexpected health and safety issues), and the standardized weight change per day (g d−1) is in column DΔ.
| Exp. | Seed | t0 | te | D | DΔ |
|---|---|---|---|---|---|
| 1a | 1Mg-Free | 0.480 | 30.290 | 32 | 0.932 |
| 1a | 2Mg-Free | 0.657 | 36.500 | 32 | 1.120 |
| 1a | 3Mg-Free | 0.883 | 30.620 | 32 | 0.929 |
| 1a | 4Mg-Free | 1.057 | 30.220 | 32 | 0.911 |
| 1a | 5Mg-Free | 1.202 | 39.370 | 32 | 1.193 |
| 1b | 6Mg-Free | 0.591 | 9.320 | 32 | 0.273 |
| 1b | 7Mg-Free | 0.862 | 5.260 | 32 | 0.137 |
| 1b | 8Mg-Free | 0.983 | 7.480 | 32 | 0.203 |
| 1b | 9Mg-Free | 1.064 | 10.300 | 32 | 0.289 |
| 1b | 10Mg-Free | 1.218 | 9.070 | 32 | 0.245 |
| 2a | 1Mg | 0.212 | 0.310 | 70 | 0.001 |
| 2a | 2Mg | 0.715 | 0.570 | 70 | −0.002 |
| 2a | 3Mg | 0.777 | 0.649 | 70 | −0.002 |
| 2a | 4Mg | 0.924 | 0.718 | 70 | −0.003 |
| 2a | 5Mg | 1.013 | 1.006 | 70 | 0.000 |
| 2b | 6Mg | 0.423 | 0.322 | 70 | −0.001 |
| 2b | 7Mg | 0.766 | 13.003 | 70 | 0.175 |
| 2b | 8Mg | 0.818 | 0.793 | 70 | 0.000 |
| 2b | 9Mg | 0.972 | 0.944 | 70 | 0.000 |
| 2b | 10Mg | 1.336 | 1.381 | 70 | 0.001 |
| 3a | 1Mg + | 0.364 | 0.360 | 38 | 0.000 |
| 3a | 2Mg + | 0.816 | 0.643 | 38 | −0.005 |
| 3a | 3Mg + | 0.947 | 0.902 | 38 | −0.001 |
| 3a | 4Mg + | 1.150 | 1.146 | 38 | 0.000 |
| 3a | 5Mg + | 1.274 | 1.212 | 38 | −0.002 |
| 3b | 6Mg + | 0.668 | 0.534 | 38 | −0.004 |
| 3b | 7Mg + | 0.918 | 0.922 | 38 | 0.000 |
| 3b | 8Mg + | 1.069 | 1.064 | 38 | 0.000 |
| 3b | 9Mg + | 1.220 | 1.237 | 38 | 0.000 |
| 3b | 10Mg + | 1.449 | 1.485 | 38 | 0.001 |
Table A2.
The quantity of compounds (mg/5 L) added to the stock solution to obtain the experimental parameters outlined in Table 1.
Table A2.
The quantity of compounds (mg/5 L) added to the stock solution to obtain the experimental parameters outlined in Table 1.
| Exp. | Calcium Stock (mg/5 L) | Carbonate Stock (mg/5 L) | |||
|---|---|---|---|---|---|
| CaCl2 | MgCl2 | NaCl | NaHCO3 | NaCl | |
| 1a | 15.583 | 0.000 | 164.416 | 1.493 | 178.507 |
| 1b | 3.809 | 0.000 | 176.191 | 6.107 | 173.893 |
| 2a | 15.583 | 53.874 | 110.542 | 1.493 | 178.507 |
| 2b | 3.809 | 53.874 | 122.316 | 6.107 | 173.893 |
| 3a | 15.583 | 107.749 | 56.667 | 1.493 | 178.507 |
| 3b | 3.809 | 107.749 | 68.442 | 6.107 | 173.893 |
Figure A1.
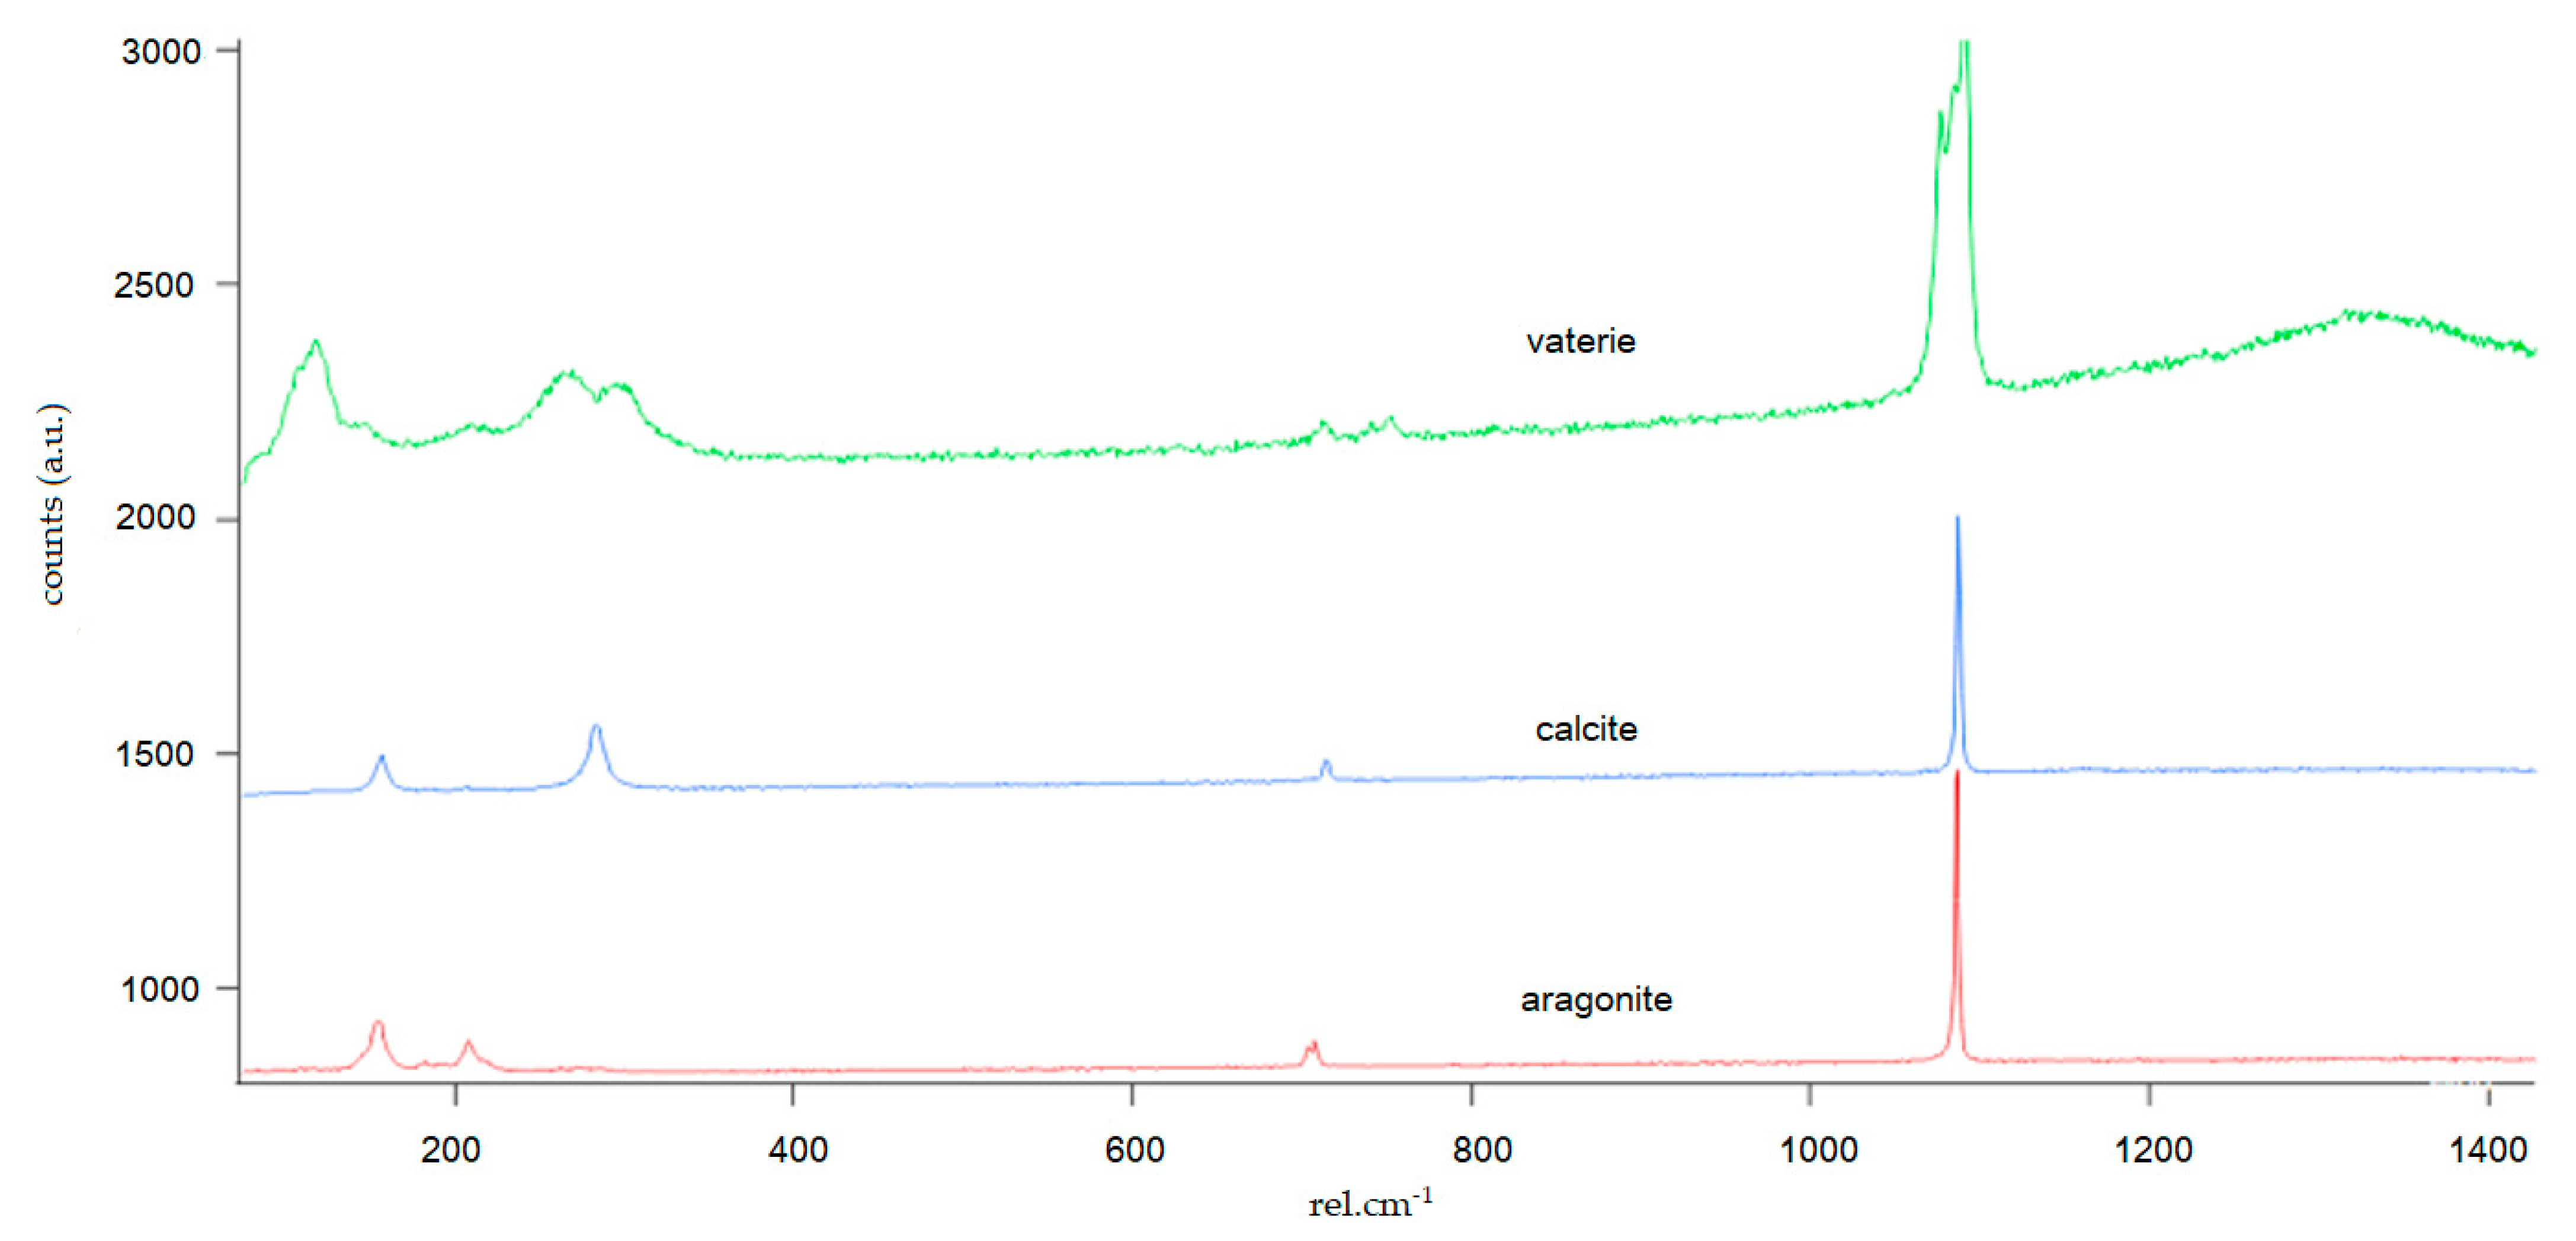
CaCO3 polymorphs (aragonite, calcite, and vaterite) were identified via Raman spectroscopy, which were first morphologically identified by SEM on the incubated crystals. These Raman spectra were used to qualitatively identify the crystal structures found on the seeding crystals after incubation.
Figure A1.
CaCO3 polymorphs (aragonite, calcite, and vaterite) were identified via Raman spectroscopy, which were first morphologically identified by SEM on the incubated crystals. These Raman spectra were used to qualitatively identify the crystal structures found on the seeding crystals after incubation.
- Script A1. Below are the calculations used to modify the artificial seawater for the six experiments.
# script for calculating salts and acids to set up solutions for experiment
import numpy as np
import scipy.optimize as opt
#************************************************************************************************************
# some functions
def KstarW(tempK,salt): #after Millero_1995 p.670 Eq.63 and OA best practices guide
a0 = −1.384726e4
a1 = 1.489652e2
a2 = −2.36521e1
b0 = 1.1867e2
b1 = −5.977
b2 = 1.0495
g = −1.615e−2
lnKWT = a0/tempK + a1 + a2*np.log(tempK)
fT = b0/tempK + b1 + b2*np.log(tempK)
kstarw = np.exp(lnKWT + fT*(salt**0.5) + g*salt)
return kstarw
def Kstar1(tempK,salt): #after OA best practices guide
kstar1 = 10**(−3633.86/tempK + 61.2172−9.67770*np.log(tempK) + 0.011555*salt−0.0001152*salt**2.)
return kstar1
def Kstar2(tempK,salt): #after OA best practices guide
kstar2 = 10**(−471.78/tempK−25.9290 + 3.16967*np.log(tempK) + 0.01781*salt−0.0001122*salt**2.)
return kstar2
def Ksp_ara(tempK,salt):
ksp_ara = −171.945−0.077993*tempK + 2903.293/tempK + 71.595*np.log10(tempK) + (−0.068393 +0.0017276*tempK + 88.135/tempK)*salt**0.5−0.10018*salt + 0.0059415*salt**1.5 #mol2 kg−2
return 10.0**ksp_ara
def Kstar0(tempK,salt): # after Weiss, R. F., Marine Chemistry 2:203−215, 1974. (taken from CO2sys)
TempK100 = tempK/100.0;
lnK0 = −60.2409 + 93.4517/TempK100 + 23.3585 * np.log(TempK100) + salt *(0.023517 - 0.023656 * TempK100 + 0.0047036 * TempK100 **2.)
K0 = np.exp(lnK0) # this is in mol/kg-SW/atm
return K0
def Ksp_cal(tempK,salt):
ksp_cal = −171.9065−0.077993*tempK + 2839.319/tempK + 71.595*np.log10(tempK) + (−0.77712 +0.0028426*tempK + 178.34/tempK)*salt**0.5−0.07711*salt + 0.0041249*salt**1.5 #mol2 kg−2
return 10.0**ksp_cal
#************************************************************************************************************
# molar masses
m_Na = 22.98977 # [g/mol]
m_Ca = 40.078 # [g/mol]
m_Mg = 24.3050 # [g/mol]
m_Cl = 35.4527 # [g/mol]
m_C = 12.0107 # [g/mol]
m_O = 15.9994 # [g/mol]
m_H = 1.00794
m_H2O= 2*m_H + m_O
m_CaCl2 = m_Ca + 2.0*m_Cl + 2.0*m_H2O # [g/mol]
m_MgCl2 = 203.30 # [g/mol]
m_NaCl = m_Na + m_Cl # [g/mol]
m_Na2CO3 = 2.0*m_Na + m_C + 3.0*m_O # [g/mol]
m_NaHCO3 = m_Na + m_H + m_C + 3*m_O
#************************************************************************************************************
# constant forcing and salt matrix
Temperature = 25.0 # Celsius
Salinity = 36.0 # we use g per kg
TK = 273.15 + Temperature
Sal = Salinity
K0F = Kstar0(TK,Sal)
K1F = Kstar1(TK,Sal)
K2F = Kstar2(TK,Sal)
KWF = KstarW(TK,Sal)
Ksp = Ksp_ara(TK,Sal)
Kspcal = Ksp_cal(TK,Sal)
#************************************************************************************************************
#!!!!!!!!!!!!!!!!!!!!!!!!!!!!!!!!!!!!!!!!!!!!!!!!!!!!!!!!!!!!!!!!!!!!!!!!!!!!!!!!!!!!!!!!!!!!!!!!!!!!!!!!!!!!
# input variables:
# target values (in the experiment):
pH_chamber = 8.7
Omega_chamber = 10.0
Mg_chamber = 53.0e−3/1.0 # mol kg−1
#Ca_chamber = 10.60e−3 # mol kg−1
# or
Stoichiometry = 1.0/1.0 # mol Ca : mol CO3
Ca_chamber = np.sqrt(Omega_chamber*Ksp*Stoichiometry)
H_chamber = 10.0**(-pH_chamber)
#!!!!!!!!!!!!!!!!!!!!!!!!!!!!!!!!!!!!!!!!!!!!!!!!!!!!!!!!!!!!!!!!!!!!!!!!!!!!!!!!!!!!!!!!!!!!!!!!!!!!!!!!!!!!
#-------------------------------------------------------------------------
# calculated values
# for the calculation of calcium and carbonate ions, I use two equations:
# Stoichiometry = Calcium/CO3
# Omega = Calcium*CO3/Ksp
# # now I solve for CO3
# CO3 = Calcium/Stoichiometry
# CO3 = Omega*Ksp/Calcium
# Calcium/Stoichiometry = Omega*Ksp/Calcium # *Calcium *Stoichiometry
# Calcium**2 = Omega*Ksp*Stoichiometry
#-------------------------------------------------------------------------
# once I know Calcium the rest is as follows
# (Chamber values)
CO3_chamber = Omega_chamber*Ksp/Ca_chamber # mol kg−1
DIC_chamber = CO3_chamber*(K1F*H_chamber + H_chamber*H_chamber + K1F*K2F)/(K1F*K2F)
CAlk_chamber = DIC_chamber*K1F*(H_chamber + 2.0*K2F)/(H_chamber*H_chamber + K1F*H_chamber + K1F*K2F)
OH_chamber = KWF/H_chamber
TA_chamber = CAlk_chamber + OH_chamber - H_chamber
Omegacal = Ca_chamber*CO3_chamber/Kspcal
print ‘Omega calcite = ‘, Omegacal
#************************************************************************************************************
# output
# (Chamber values)
print ‘ ‘
print ‘expected values:’
print ‘Ca =‘, Ca_chamber*1e3, ‘e−3 mol kg-1’
print ‘Mg =‘, Mg_chamber*1e3, ‘e-3 mol kg-1’
print ‘CO3 =‘, CO3_chamber*1e6, ‘e-6 mol kg-1’
print ‘pH =‘, pH_chamber
print ‘DIC =‘, DIC_chamber*1e6, ‘e-6 mol kg-1’
print ‘TA =‘, TA_chamber*1e6, ‘e-6 mol kg-1’
print ‘Omega =‘, Omega_chamber
print ‘stoichiometry =‘, Ca_chamber/CO3_chamber,’: 1’, ‘(mol Ca : mol CO3)’
print ‘Cai paper: Omega=‘, 10.6e−3*600.0e−6/Ksp
#************************************************************************************************************
# (Bag values)
print ‘ ‘
print ‘the amounts of salts needed are:’
g_CaCl2 = Ca_chamber*m_CaCl2*2.0 # times two because the concentrations will be diluted in the chamber
g_MgCl2 = Mg_chamber*m_MgCl2*2.0 # times two because the concentrations will be diluted in the chamber
print g_CaCl2*5.0, ‘g CaCl2 per 5 Liters’
print g_MgCl2*5.0, ‘g MgCl2 per 5 Liters’
# (Bag values)
g_NaHCO3 = DIC_chamber*m_NaHCO3*2.0# times two because the concentrations will be diluted in the chamber
print g_NaHCO3*5.0, ‘g NaHCO3 per 5 Liters’
print ‘and to adjust salinity in the solutions we need:’
g_NaCl_1 = Salinity-g_CaCl2-g_MgCl2 # since Salinity is defined as g/kg
print g_NaCl_1*5.0, ‘g NaCl per 5 Liters in the CaCl2 bag:’
g_NaCl_2 = Salinity-g_NaHCO3 # since Salinity is defined as g/kg
print g_NaCl_2*5.0, ‘g NaCl per 5 Liters in the NaHCO3 bag:’
print ‘remark:’
print ‘(Although I believe that the amount of carbonate might be overestimated and that measured Salinity might actually be lower. However, we can test this with a calibrated salinity electrode.)’
#************************************************************************************************************
print ‘ ‘
print ‘ ‘
print ‘and the pH of the solutions will be:’
C0 = DIC_chamber*2.0
print ‘DIC = ‘, C0
pKW = -np.log10(KWF)
pKS1 = -np.log10(K1F)
pKS2 = -np.log10(K2F)
pKB1 = pKW-pKS1
pKB2 = pKW-pKS2
print ‘pKS1=‘, pKS1, ‘pKS2=‘, pKS2
#pH_NaHCO3 = 0.5*(pKS1-np.log10(C0))
pH_NaHCO3 = pKW−0.5*(pKB1-np.log10(C0)) # this does not work because the approximation that the acid is only a 1 proton acid is too crude.
#pH_NaHCO3 = 0.5*(pKS1 + pKS2) # for an amphoter
print ‘approximated pH for NaHCO3=‘, pH_NaHCO3
#************************************************************************************************************
# now calculate the real pH
# molarity of base or acid to add
mol_base = 0.04 # mol L−1
mol_acid = 10.172/1000.0 # mol L−1
K0 = K0F
K1 = K1F
K2 = K2F
KW = KWF
# the function of the H+ concentration is an equation of fourth order and has to be solved numerically
# I use fmin to solve it:
# (Bag values)
DIC_CO3 = DIC_chamber*2.0
# the equation differs if you use NaHCO3 because the charge balance is slightly different:
def H_func_NaHCO3(H):
val = (KW/H + H*DIC_CO3/(H*H/(K2*K1) + H/K2 + 1.0)/K2 + 2.0*DIC_CO3/(H*H/(K2*K1) + H/K2 + 1.0)-H-DIC_CO3)**2.0
#print val
return val
# take a good guess from the approximation
H_init = 10**(-pH_NaHCO3)
H_opt = opt.fmin(H_func_NaHCO3, H_init, xtol = 0.1, ftol = 0.000001, maxiter = None, maxfun = None, full_output = 0, disp = 1, retall = 0, callback = None)
print ‘print H for NaHCO3:’
print ‘H for NaHCO3 = ‘, H_opt
pH_NaHCO3_opt = -np.log10(H_opt)
print ‘print pH for NaHCO3:’
print ‘the resulting pH of the NaHCO3 solution is’, pH_NaHCO3_opt
#************************************************************************************************************
# we will not adjust the pH of the CaCl2 bag !!!
# the milliQ is cooked and has a pH of 7
# adding CaCl2 does not add alkalinity, it might have a small effect on the pH due to CaOH and CaOH2
# we assume TA_Ca = 0.0; DIC_Ca = 0.0; and pH_Ca = 7.0
# (Bag values) Calcium Bag:
DIC_Ca = 0.0
TA_Ca =0.0
#************************************************************************************************************
# now I have to calculate the required TA of the CO3 bag, which is double the TA in the chamber
TA_CO3 = TA_chamber*2.0
DIC_CO3 = DIC_chamber*2.0
print ‘TA CO3=‘, TA_CO3*1e6
print ‘DIC CO3=‘, DIC_CO3*1e6
# from this I have to derive the required pH of the solution
diff_TA = TA_CO3-DIC_CO3 # this is the amount of alkalinity that has to be added via NaOH
# so, basically, I have the amount of NaOH that has to be added (at least in theory)
print ‘diff TA =‘, diff_TA*1e6
# (Bag values) Carbonate Bag:
#H_CO3 = 10.0**(-pH_target)
#OH_CO3 = KWF/H_CO3
#CAlk_CO3 = DIC_CO3*K1F*(H_CO3 + 2.0*K2F)/(H_CO3*H_CO3 + K1F*H_CO3 + K1F*K2F)
#TA_CO3 = CAlk_CO3 + OH_CO3 - H_CO3
#0 = DIC_CO3*K1F*(H_CO3 + 2.0*K2F)/(H_CO3*H_CO3 + K1F*H_CO3 + K1F*K2F) + KWF/H_CO3 - H_CO3 - TA_CO3
# the equation differs if you use NaHCO3 because the charge balance is slightly different:
def H_func_CO3bag(H):
val = (TA_CO3 - (DIC_CO3*K1F*(H + 2.0*K2F)/(H*H + K1F*H + K1F*K2F) + KWF/H - H))**2.0
#print val
return val
# take a good guess from the approximation
H_init = 10**(-pH_chamber)
H_opt = opt.fmin(H_func_CO3bag, H_init, xtol = 1e−12, ftol = 1e−12, maxiter=None, maxfun=None, full_output=0, disp=1, retall=0, callback=None)
print ‘print target H for the NaHCO3 bag:’
print ‘H for NaHCO3=‘, H_opt
pH_CO3_opt=-np.log10(H_opt)
print ‘print target pH for the NaHCO3 bag:’
print ‘the resulting pH of the NaHCO3 solution is’, pH_CO3_opt
# test if this pH results the correct TA
CAlk_opt = DIC_CO3*K1F*(H_opt + 2.0*K2F)/(H_opt*H_opt + K1F*H_opt + K1F*K2F)
OH_opt = KWF/H_opt
TA_opt = CAlk_opt + OH_opt - H_opt
print ‘TA CO3’, TA_CO3*1e6, ‘minus TA opt’, TA_opt*1e6, ‘=‘, (TA_CO3-TA_opt)*1e6
#************************************************************************************************************
# now titrate the NaHCO3 bag to the target pH
# and the same for the other solution
# (Bag values)
pH_start = 7.968 #pH_NaHCO3_opt
pH_target= pH_CO3_opt
#amount of acid needed (first calculated without buffering capacity)
mol_NaOH=10.0**(-pH_start)−10.0**(-pH_target)
# I have to calculate the amount of protons that are consumed also by the buffering system of the carbonate chemistry, and this on top of the pH change without the buffering capacity.
H_start=10.0**(-pH_start)
H_end=10.0**(-pH_target)
OH_start=KWF/H_start
OH_end=KWF/H_end
CO3_start=DIC_CO3*K1F*K2F/(K1F*H_start + H_start*H_start + K1F*K2F)
HCO3_start=DIC_CO3*K1F*H_start/(K1F*H_start + H_start*H_start + K1F*K2F)
H2CO3_start=DIC_CO3-HCO3_start-CO3_start
CO3_end=DIC_CO3*K1F*K2F/(K1F*H_end + H_end*H_end + K1F*K2F)
HCO3_end=DIC_CO3*K1F*H_end/(K1F*H_end + H_end*H_end + K1F*K2F)
H2CO3_end=DIC_CO3-HCO3_end-CO3_end
print ‘CO3 from:’, CO3_start*1e6, ‘to’, CO3_end*1e6, ‘\mu mol’
print ‘HCO3 from:’, HCO3_start*1e6, ‘to’, HCO3_end*1e6, ‘\mu mol’
print ‘H2CO3 from:’, H2CO3_start*1e6, ‘to’, H2CO3_end*1e6, ‘\mu mol’
H_diff=(2*H2CO3_start+HCO3_start+H_start-OH_start)-(2*H2CO3_end+HCO3_end+H_end-OH_end)
print ‘mol NaOH needed to adjust pH_NaHCO3 from’, pH_start, ‘to’, pH_target, ‘is:’, H_diff, ‘compared to:’, mol_NaOH, ‘without considering the buffer capacity’
print ‘at a molarity of ‘, mol_base, ‘this requires ‘, H_diff/mol_base*1e3*5.0, ‘ml of base for 5 L solution’
#************************************************************************************************************
# added for review:
# calculate Omega calcite for comparison
Omegacal=Ca_chamber*CO3_chamber/Kspcal
print ‘Omega calcite=‘, Omegacal
Omegaara=Ca_chamber*CO3_chamber/Ksp
print ‘Omega aragonite=‘, Omegaara
References
- Lowenstam, H.A.; Weiner, S. On Biomineralization; Oxford University Press: New York, NY, USA, 1989; p. 336. [Google Scholar]
- Spalding, M.D.; Ravilious, C.; Green, E.P. World Atlas of Coral Reefs; University of California Press: Berkeley, CA, USA, 2001; p. 424. [Google Scholar]
- Knowlton, N.; Brainard, R.E.; Fisher, R.; Moews, M.; Plaisance, L.; Caley, M.J. Coral Reef Biodiversity. In Life in the World’s Oceans: Diversity, Distribution, and Abundance; Wiley online Books; McIntyre, A.D., Ed.; Blackwell Publishing Ltd.: Hoboken, NJ, USA, 2010; pp. 65–78. [Google Scholar]
- Nystrom, M.; Folke, C.; Moberg, F. Coral reef disturbance and resilience in a human-dominated environment. Trends Ecol. Evol. 2000, 15, 413–417. [Google Scholar] [CrossRef]
- Teng, H.H.; Dove, P.M.; Orme, C.A.; de Yoreo, J.J. Thermodynamics of calcite growth: Baseline for understanding biomineral formation. Science 1998, 282, 724–727. [Google Scholar] [CrossRef] [PubMed]
- Hoegh-Guldberg, O.; Mumby, P.J.; Hooten, A.J.; Steneck, R.S.; Greenfield, P.; Gomez, E.; Harvell, C.D.; Sale, P.F.; Edwards, A.J.; Caldeira, K.; et al. Coral Reefs Under Rapid Climate Change and Ocean Acidification. Science 2007, 318, 1737–1742. [Google Scholar] [CrossRef] [PubMed] [Green Version]
- Allemand, D.; Ferrierpages, C.; Furla, P.; Houlbreque, F.; Puverel, S.; Reynaud, S.; Tambutté, E.; Tambutté, S.; Zoccola, D. Biomineralisation in reef-building corals: From molecular mechanisms to environmental control. Comptes Rendus Palevol. 2004, 3, 453–467. [Google Scholar] [CrossRef]
- Tambutté, S.; Holcomb, M.; Ferrier-Pagés, C.; Reynaud, S.; Tambutté, É.; Zoccola, D.; Allemand, D. Coral biomineralization: From the gene to the environment. J. Exp. Mar. Bio Ecol. 2011, 408, 58–78. [Google Scholar] [CrossRef]
- Al-Horani, F.A.; Ferdelman, T.; Al-Moghrabi, S.M.; De Beer, D. Spatial distribution of calcification and photosynthesis in the scleractinian coral Galaxea fascicularis. Coral. Reefs. 2005, 24, 173–180. [Google Scholar] [CrossRef]
- Tambutté, E.; Allemand, D.; Zoccola, D.; Meibom, A.; Lotto, S.; Caminiti, N.; Segonds, N. Observations of the tissue-skeleton interface in the scleractinian coral Stylophora pistillata. Coral. Reefs. 2007, 26, 517–529. [Google Scholar]
- Al-Horani, F.A.; Al-Moghrabi, S.M.; De Beer, D. The mechanism of calcification and its relation to photosynthesis in the scleractinian coral Galaxea fascicularis. Mar. Biol. 2003, 142, 419–426. [Google Scholar] [CrossRef]
- Ries, J.B. A physicochemical framework for interpreting the biological calcification response to CO2 induced ocean acidification. Geochim. Cosmochim. Acta. 2011, 75, 4053–4064. [Google Scholar] [CrossRef]
- Furla, P.; Allemand, D.; Orsenigo, M.N. Involvement of H+ -ATPase and carbonic anhydrase in inorganic carbon uptake for endosymbiont photosynthesis. Am. J. Physiol. Regul. Integr. Comp. Physiol. 2000, 278, R870–R881. [Google Scholar] [CrossRef] [PubMed] [Green Version]
- Hohn, S.; Merico, A. Modelling coral polyp calcification in relation to ocean acidification. Biogeosciences 2012, 9, 4441–4454. [Google Scholar] [CrossRef] [Green Version]
- Venn, A.A.; Tambutté, E.; Holcomb, M.; Laurent, J.; Allemand, D.; Tambutté, S. Impact of seawater acidification on pH at the tissue–skeleton interface and calcification in reef corals. Proc. Natl. Acad. Sci. USA 2013, 110, 1634–1639. [Google Scholar] [CrossRef] [Green Version]
- Fabricius, K.E.; De’ath, G.; Noonan, S.; Uthicke, S. Ecological effects of ocean acidification and habitat complexity on reef-associated macroinvertebrate communities. Proc. R. Soc. B Biol. Sci. 2014, 81, 2013479. [Google Scholar] [CrossRef] [Green Version]
- Fabricius, K.E.; Langdon, C.; Uthicke, S.; Humphrey, C.; Noonan, S.; De ’ath, G.; Okazaki, R.; Muehllehner, N.; Glas, M.S.; Lough, J.M. Losers and winners in coral reefs acclimatized to elevated carbon dioxide concentrations. Nat. Clim. Chang. 2011, 1, 165–169. [Google Scholar] [CrossRef]
- Muscatine, L.; Tambutte, E.; Allemand, D. Morphology of coral desmocytes, cells that anchor the calicoblastic epithelium to the skeleton. Coral Reefs. 1997, 16, 205–213. [Google Scholar] [CrossRef]
- Mass, T.; Drake, J.L.; Peters, E.C.; Jiang, W.; Falkowski, P.G. Immunolocalization of skeletal matrix proteins in tissue and mineral of the coral Stylophora pistillata. Proc. Natl. Acad. Sci. USA 2014, 111, 12728–12733. [Google Scholar] [CrossRef] [Green Version]
- Cuif, J.-P.; Dauphin, Y. The Environment Recording Unit in coral skeletons—a synthesis of structural and chemical evidences for a biochemically driven, stepping-growth process in fibres. Biogeosciences 2005, 2, 61–73. [Google Scholar] [CrossRef] [Green Version]
- Lippmann, F. Sedimentary Carbonate Minerals; Springer: Berlin/Heidelberg, Germany, 1973; p. 228. [Google Scholar]
- Lasaga, A.C. Kinetic Theory in the Earth Sciences; Princeton University Press: Princeton, NJ, USA, 2014; p. 822. [Google Scholar]
- Burton, E.A.; Walter, L.M. Relative precipitation rates of aragonite and Mg calcite from seawater: Temperature or carbonate ion control? Geology 1987, 15, 111–114. [Google Scholar] [CrossRef]
- Burton, E.A.; Walter, L.M. The role of pH in phosphate inhibition of calcite and aragonite precipitation rates in seawater. Geochim. Cosmochim. Acta 1990, 54, 797–808. [Google Scholar] [CrossRef]
- Zuddas, P.; Mucci, A. Kinetics of calcite precipitation from seawater: I. A classical chemical kinetics description for strong electrolyte solutions. Geochim. Cosmochim. Acta 1994, 58, 4353–4362. [Google Scholar] [CrossRef]
- Reddy, M.M.; Nancollas, G.H. The crystallization of calcium carbonate. IV. The effect of magnesium, strontium and sulfate ions. J. Cryst. Growth 1976, 35, 33–38. [Google Scholar] [CrossRef]
- Gattuso, J.P.; Frankignoulle, M.; Bourge, I.; Romaine, S.; Buddemeier, R.W. Effect of calcium carbonate saturation of seawater on coral calcification. Glob. Planet Chang. 1998, 18, 37–46. [Google Scholar] [CrossRef]
- McCulloch, M.; Falter, J.; Trotter, J.; Montagna, P. Coral resilience to ocean acidification and global warming through pH up-regulation. Nat. Clim. Chang. 2012, 2, 623–627. [Google Scholar] [CrossRef]
- Hohn, S.; Merico, A. Quantifying the relative importance of transcellular and paracellular ion transports to coral polyp calcification. Front Earth Sci. 2015, 2, 1–11. [Google Scholar] [CrossRef]
- Holtz, L.M.; Wolf-Gladrow, D.; Thoms, S. Simulating the effects of light intensity and carbonate system composition on particulate organic and inorganic carbon production in Emiliania huxleyi. J. Theor. Biol. 2015, 372, 192–204. [Google Scholar] [CrossRef] [Green Version]
- Nehrke, G.; Reichart, G.J.; Van Cappellen, P.; Meile, C.; Bijma, J. Dependence of calcite growth rate and Sr partitioning on solution stoichiometry: Non-Kossel crystal growth. Geochim. Cosmochim. Acta 2007, 71, 2240–2249. [Google Scholar] [CrossRef] [Green Version]
- Hartley, G.; Mucci, A. The influence of PCO2 on the partitioning of magnesium in calcite overgrowth precipitated from artificial seawater at 25° and 1 atm total pressure. Geochim. Cosmochim. Acta 1996, 60, 315–324. [Google Scholar] [CrossRef]
- Ries, J.B. Aragonitic Algae in Calcite Seas: Effect of Seawater Mg/Ca Ratio on Algal Sediment Production. J. Sediment Res. 2006, 76, 515–523. [Google Scholar] [CrossRef]
- Ries, J.B.; Stanley, S.M.; Hardie, L.A. Scleractinian corals produce calcite, and grow more slowly, in artificial Cretaceous seawater. Geology 2006, 34, 525–528. [Google Scholar] [CrossRef]
- Kim, Y.-Y.; Ganesan, K.; Yang, P.; Kulak, A.N.; Borukhin, S.; Pechook, S.; Ribeiro, L.; Kröger, R.; Eichhorn, S.J.; Armes, S.P.; et al. An artificial biomineral formed by incorporation of copolymer micelles in calcite crystals. Nat. Mater. 2011, 10, 890–896. [Google Scholar] [CrossRef] [PubMed]
- Hohn, S.; Reymond, C.E. Coral calcification, mucus, and the origin of skeletal organic molecules. Coral Reefs. 2019, 38, 973–984. [Google Scholar] [CrossRef]
- Cai, W.-J.; Ma, Y.; Hopkinson, B.M.; Grottoli, A.G.; Warner, M.E.; Ding, Q.; Hu, X.; Yuan, X.; Schoepf, V.; Xu, H.; et al. Microelectrode characterization of coral daytime interior pH and carbonate chemistry. Nat. Commun. 2016, 4, 11144. [Google Scholar] [CrossRef] [Green Version]
- Raybaud, V.; Tambutté, S.; Ferrier-Pagès, C.; Reynaud, S.; Venn, A.A.; Tambutté, É.; Nival, P.; Allemand, D. Computing the carbonate chemistry of the coral calcifying medium and its response to ocean acidification. J. Theor. Biol. 2017, 424, 26–36. [Google Scholar] [CrossRef] [PubMed] [Green Version]
- Sevilgen, D.S.; Venn, A.A.; Hu, M.Y.; Tambutté, E.; de Beer, D.; Planas-Bielsa, V.; Tambutté, S. Full in vivo characterization of carbonate chemistry at the site of calcification in corals. Sci. Adv. 2019, 5, 7447. [Google Scholar] [CrossRef] [PubMed] [Green Version]
- Wolf-Gladrow, D.A.; Zeebe, R.E.; Klaas, C.; Körtzinger, A.; Dickson, A.G. Total alkalinity: The explicit conservative expression and its application to biogeochemical processes. Mar. Chem. 2007, 106, 287–300. [Google Scholar] [CrossRef] [Green Version]
- Millero, F.; Huang, F.; Graham, T.; Pierrot, D. The dissociation of carbonic acid in NaCl solutions as a function of concentration and temperature. Geochim. Cosmochim. Acta 2007, 71, 46–55. [Google Scholar] [CrossRef]
- Schleinkofer, N.; Raddatz, J.; Freiwald, A.; David Evans, D.; Beuck, L.; Rüggeberg, A.; Liebetrau, V. Environmental and biological controls on Na/Ca ratios in scleractinian cold-water corals. Biogeosciences 2019, 16, 3565–3582. [Google Scholar] [CrossRef] [Green Version]
- DeCarlo, T.M.; Comeau, S.; Cornwall, C.E.; McCulloch, M.T. Coral resistance to ocean acidification linked to increased calcium at the site of calcification. Proc. R. Soc. B Biol. Sci. 2018, 285, 1878. [Google Scholar] [CrossRef] [PubMed] [Green Version]
- Allison, N.; Cohen, I.; Finch, A.A.; Erez, J.; Tudhope, A.W. Corals concentrate dissolved inorganic carbon to facilitate calcification. Nat. Commun. 2014, 5, 5741. [Google Scholar] [CrossRef] [PubMed] [Green Version]
- de Nooijer, L.J.; Spero, H.J.; Erez, J.; Bijma, J.; Reichart, G.J. Biomineralization in perforate Foraminifera. Earth Sci. Rev. 2014, 135, 48–58. [Google Scholar] [CrossRef] [Green Version]
- Venn, A.A.; Tambutté, E.; Holcomb, M.; Allemand, D.; Tambutté, S. Live tissue imaging shows reef corals elevate pH under their calcifying tissue relative to seawater. PLoS ONE 2011, 6, e20013.65. [Google Scholar] [CrossRef] [Green Version]
- Gebauer, D.; Völkel, A.; Cölfen, H. Stable prenucleation calcium carbonate clusters. Science 2009, 322, 1819–1822. [Google Scholar] [CrossRef] [PubMed] [Green Version]
- Ihli, J.; Clark, J.N.; Kanwal, N.; Kim, Y.-Y.; Holden, M.A.; Harder, R.J.; Tang, C.C.; Ashbrook, S.E.; Robinson, I.K.; Meldrum, F.C. Visualization of the effect of additives on the nanostructures of individual bio-inspired calcite crystals. Chem. Sci. 2019, 10, 1176–1185. [Google Scholar] [CrossRef] [Green Version]
- Plummer, L.N.; Busenberg, E. The solubilities of calcite, aragonite and vaterite in CO2-H2O solutions between 0 and 90 °C, and an evaluation of the aqueous model for the system CaCO3-CO2-H2O. Geochim. Cosmochim. Acta 1982, 46, 1011–1040. [Google Scholar] [CrossRef]
- De Visscher, A.; Vanderdeelen, J. Estimation of the Solubility Constant of Calcite, Aragonite, and Vaterite at 25°C Based on Primary Data Using the Pitzer Ion Interaction Approach. Monatshefte fur Chemie 2003, 134, 769–775. [Google Scholar] [CrossRef]
- Zhong, S.; Mucci, A. Calcite precipitation in seawater using a constant addition technique: A new overall reaction kinetic expression. Geochim. Cosmochim. Acta 1993, 57, 1409–1417. [Google Scholar]
- Allison, N.; Finch, A.A. δ11B, Sr, Mg and B in a modern Porites coral: The relationship between calcification site pH and skeletal chemistry. Geochim. Cosmochim. Acta 2010, 74, 1790–1800. [Google Scholar] [CrossRef]
- Opdyke, B.N.; Wilkinson, B.H. Paleolatitude distribution of Phanerozoic marine ooids and cements. Palaeogeogr Palaeoclim Palaeoecol 1990, 78, 135–148. [Google Scholar] [CrossRef] [Green Version]
- Morse, J.W.; Wang, Q.; Tsio, M.Y. Influences of temperature and Mg: Ca ratio on CaCO3 precipitates from seawater. Geology 1997, 25, 85–87. [Google Scholar] [CrossRef]
- Higuchi, T.; Fujimura, H.; Yuyama, I.; Harii, S.; Agostini, S.; Oomori, T. Biotic control of skeletal growth by scleractinian corals in aragonite–calcite seas. PLoS ONE 2014, 9, e91021. [Google Scholar] [CrossRef] [Green Version]
- Boon, M.; Rickard, W.D.; Rohl, A.L.; Jones, F. Stabilization of Aragonite: Role of Mg2+ and Other Impurity Ions. Cryst. Growth Des. 2020, 20, 5006–5017. [Google Scholar] [CrossRef]
- Bracco, J.N.; Grantham, M.C.; Stack, A.G. Calcite Growth Rates as a Function of Aqueous Calcium-to-Carbonate Ratio, Saturation Index, and Inhibitor Concentration: Insight into the Mechanism of Reaction and Poisoning by Strontium. Cryst. Growth Des. 2012, 12, 3540–3548. [Google Scholar] [CrossRef]
- Gebrehiwet, T.A.; Redden, G.D.; Fujita, Y.; Beig, M.S.; Smith, R.W. The Effect of the CO32− to Ca2+ Ion activity ratio on calcite precipitation kinetics and Sr2+ partitioning. Geochem. Trans. 2012, 13, 1–11. [Google Scholar] [CrossRef]
- Gaetani, G.A.; Cohen, A.L. Element partitioning during precipitation of aragonite from seawater: A framework for understanding paleoproxies. Geochim. Cosmochim. Acta 2006, 70, 4617–4634. [Google Scholar] [CrossRef]
- Holcomb, M.; Cohen, A.L.; Gabitov, R.; Hutter, J. Compositional and morphological features of aragonite precipitated experimentally from seawater and biogenically by corals. Geochim. Cosmochim. Acta 2009, 73, 166–179. [Google Scholar] [CrossRef]
- Adkins, J.F.; Boyle, E.A.; Curry, W.B.; Lutringer, A. Stable isotopes in deep-sea corals and a new mechanism for “vital effects”. Geochim. Cosmochim. Acta 2003, 67, 1129–1143. [Google Scholar] [CrossRef] [Green Version]
- Rollion-Bard, C.; Chaussidon, M.; France-Lanord, C. pH control on oxygen isotopic composition of symbiotic corals. Earth Planet Sci. Lett. 2003, 215, 275–288. [Google Scholar] [CrossRef]
- Watson, E.B. A conceptual model for near-surface kinetic controls on the trace- element and stable isotope composition of abiogenic calcite crystals. Geochim. Cosmochim. Acta 2004, 68, 1473–1488. [Google Scholar] [CrossRef]
- Boistelle, R.; Astier, J.P. Crystallization mechanisms in solution. J. Cryst. Growth. 1988, 90, 14–30. [Google Scholar] [CrossRef]
- Davey, R.J.; Schroeder, S.L.M.; Ter Horst, J.H. Nucleation of organic crystals—A molecular perspective. Angew Chemie Int. Ed. 2013, 52, 2167–2179. [Google Scholar] [CrossRef]
- Mann, S. Biomineralization: Principles and Concepts in Bioinorganic Materials Chemistry; Oxford University Press: Oxford, UK, 2001; p. 210. [Google Scholar]
- Gebauer, D.; Kellermeier, M.; Gale, J.D.; Bergström, L.; Cölfen, H. Pre-nucleation clusters as solute precursors in crystallisation. Chem. Soc. Rev. 2014, 43, 2348–2371. [Google Scholar] [CrossRef] [Green Version]
- Bonucci, E. Role of collagen fibrils in calcification. In Calcification in Biological Systems; Bonucci, E., Ed.; CRC Press: Boca Raton, FL, USA, 1992; pp. 19–39. [Google Scholar]
- Rodriguez-Blanco, J.D.; Shaw, S.; Benning, L.G. The kinetics and mechanisms of amorphous calcium carbonate [ACC] crystallization to calcite, viavaterite. Nanoscale 2011, 3, 265–271. [Google Scholar] [CrossRef] [PubMed]
- Wray, J.; Daniels, F. Precipitation of calcite and aragonite. J. Am. Chem. Soc. 1957, 79, 2031–2034. [Google Scholar] [CrossRef]
- Ogino, T.; Suzuki, T.; Sawada, K. The formation and transformation mechanism of calcium carbonate in water. Geochemica Cosmochem Acta. 1987, 51, 2757–2767. [Google Scholar] [CrossRef]
- Sun, W.; Jayaraman, S.; Chen, W.; Persson, K.A.; Ceder, G. Nucleation of metastable aragonite CaCO3 in seawater. Proc Natl. Acad. Sci. USA 2015, 112, 3199–3204. [Google Scholar] [CrossRef] [Green Version]
- Cyronak, T.; Schulz, K.G.; Jokiel, P.L. The Omega myth: What really drives lower calcification rates in an acidifying ocean. ICES J. Mar. Sci. 2016, 73, 558–562. [Google Scholar] [CrossRef] [Green Version]
- Allemand, D.; Tambutte, E.; Girard, J.; Jaubert, J.; Tambutté, E.; Girard, J.; Jaubert, J. Organic matrix synthesis in the scleractinian coral Stylophora pistillata: Role in biomineralization and poten- tial target of the organotin tributyltin. J. Exp. Biol. 1998, 201, 2001–2009. [Google Scholar] [PubMed]
- Watanabe, T.; Fukuda, I.; China, K.; Isa, Y. Molecular analyses of protein components of the organic matrix in the exoskeleton of two scleractinian coral species. Comp. Biochem. Physiol. B Biochem. Mol. Biol. 2003, 136, 767–774. [Google Scholar] [CrossRef]
- Helman, Y.; Natale, F.; Sherrell, R.M.; LaVigne, M.; Starovoytov, V.; Gorbunov, M.Y.; Falkowski, P.G. Extracellular matrix production and calcium carbonate precipitation by coral cells in vitro. Proc. Natl. Acad. Sci. USA 2008, 105, 54–58. [Google Scholar] [CrossRef] [PubMed] [Green Version]
- Mass, T.; Drake, J.L.; Haramaty, L.; Kim, J.D.; Zelzion, E.; Bhattacharya, D.; Falkowski, P.G. Cloning and characterization of four novel coral acid-rich proteins that precipitate carbonates in vitro. Curr. Biol. 2003, 23, 1126–1131. [Google Scholar] [CrossRef] [Green Version]
- Kretsinger, R.H. Calcium-Binding Proteins. Ann. Rev. Biochem. 1976, 45, 239–266. [Google Scholar] [CrossRef] [PubMed]
- Carafoli, E. Intracellular Calcium Homeostasis. Ann. Rev. Biochem. 1987, 56, 395–433. [Google Scholar] [CrossRef]
- DeCarlo, T.M.; Ren, H.; Farfan, G.A. The Origin and Role of Organic Matrix in Coral Calcification: Insights from Comparing Coral Skeleton and Abiogenic Aragonite. Front Mar. Sci. 2018, 5, 170. [Google Scholar] [CrossRef] [Green Version]
- Marin, F.; Smith, M.; Isa, Y.; Muyzer, G.; Westbroek, P. Skeletal matrices, muci, and the origin of invertebrate calcification. Proc. Natl. Acad. Sci. USA 1996, 93, 1554–1559. [Google Scholar] [CrossRef] [Green Version]
- Westbroek, P.; Marin, F. A marriage of bone and nacre. Nature 1998, 392, 861–862. [Google Scholar] [CrossRef] [PubMed]
- Kawano, J.; Sakuma, H.; Nagai, T. Incorporation of Mg2+ in surface Ca2+ sites of aragonite: An ab initio study. Prog. Earth Planet Sci. 2015, 2, 7. [Google Scholar] [CrossRef]
- Cohen, A.L.; McConnaughey, T.A. Geochemical Perspectives on Coral Mineralization. Rev. Mineral. Geochem. 1990, 4, 151–187. [Google Scholar]
- DeCarlo, T.M.; D’Olivo, J.P.; Foster, T.; Holcomb, M.; Becker, T.; McCulloch, M.T. Coral calcifying fluid aragonite saturation states derived from Raman spectroscopy. Biogeosciences 2017, 14, 5253–5269. [Google Scholar] [CrossRef] [Green Version]
- McCulloch, M.; Trotter, J.; Montagna, P.; Falter, J.; Dunbar, R.; Freiwald, A.; Försterra, G.; López Correa, M.; Maier, C.; Rüggeberg, A.; et al. Resilience of cold-water scleractinian corals to ocean acidification: Boron isotopic systematics of pH and saturation state up-regulation. Geochim. Cosmochim. Acta. 2012, 87, 21–34. [Google Scholar] [CrossRef]
- Farfan, G.A.; Cordes, E.E.; Waller, R.G.; DeCarlo, T.M.; Hansel, C.M. Mineralogy of Deep-Sea Coral Aragonites as a Function of Aragonite Saturation State. Front. Mar. Sci. 2018, 5, 473. [Google Scholar] [CrossRef] [Green Version]
- Georgiou, L.; Falter, J.; Trotter, J.; Kline, D.I.; Holcomb, M.; Dove, S.G.; Hoegh-Guldberg, O.; Mcculloch, M. pH homeostasis during coral calcification in a free ocean CO2 enrichment [FOCE] experiment, Heron Island reef flat, Great Barrier Reef. Proc. Natl. Acad. Sci. USA 2015, 112, 13219–13224. [Google Scholar] [CrossRef] [Green Version]
- Mitsuguchi, T.; Matsumoto, E.; Abe, O.; Uchida, T.; Isdale, P.J. Mg/Ca Thermometry in Coral Skeletons. Science. 1996, 274, 961–963. [Google Scholar] [CrossRef] [PubMed]
- Gaetani, G.A.; Cohen, A.L.; Wang, Z.; Crusius, J. A biomineralization approach to developing climate proxies. Geochim. Cosmochim. Acta 2011, 75, 1920–1932. [Google Scholar] [CrossRef]
- Wei, G.; Sun, M.; Li, X.; Nie, B. Mg/Ca, Sr/Ca and U/Ca ratios of a porites coral from Sanya Bay, Hainan Island, South China Sea and their relationships to sea surface temperature. Palaeogeogr Palaeoclimatol Palaeoecol. 2000, 162, 59–74. [Google Scholar] [CrossRef]
- Marchitto, T.M.; Bryan, S.P.; Doss, W.; McCulloch, M.T.; Montagna, P. A simple biomineralization model to explain Li, Mg, and Sr incorporation into aragonitic foraminifera and corals. Earth Planet Sci. Lett. 2018, 481, 20–29. [Google Scholar] [CrossRef] [Green Version]
- De Choudens-Sánchez, V.; González, L.A. Calcite and aragonite precipitation under controlled instantaneous supersaturation: Elucidating the role of CaCO3 saturation state and Mg/Ca ratio on calcium carbonate polymorphism. J. Sediment. Res. 2009, 79, 363–376. [Google Scholar] [CrossRef]
- Falini, G.; Fermani, S.; Goffredo, S. Seminars in Cell & Developmental Biology Coral biomineralization: A focus on intra-skeletal organic matrix and calcification. Semin. Cell Dev. Biol. 2015, 46, 17–26. [Google Scholar] [PubMed]
- Politi, Y.; Arad, T.; Klein, E.; Weiner, S.; Addadi, L. Sea urchin spine calcite forms via a transient amorphous calcium carbonate phase. Science 2004, 306, 1161–1164. [Google Scholar] [CrossRef]
- Mass, T.; Giuffre, A.J.; Sun, C.-Y.; Stifler, C.A.; Frazier, M.J.; Neder, M.; Tamura, N.; Stan, C.V.; Marcus, M.A.; Gilbert, P.U.P.A. Amorphous calcium carbonate particles form coral skeletons. Proc. Natl. Acad. Sci. USA 2017, 114, E7670–E7678. [Google Scholar] [CrossRef] [Green Version]
- Checa, A.G.; Macías-Sánchez, E.; Rodríguez-Navarro, A.B.; Sánchez-Navas, A.; Lagos, N.A. Origin of the biphase nature and surface roughness of biogenic calcite secreted by the giant barnacle Austromegabalanus psittacus. Sci. Rep. 2020, 10, 16784. [Google Scholar] [CrossRef]
- Politi, Y.; Metzler, R.A.; Abrecht, M.; Gilbert, B.; Wilt, F.H.; Sagi, I.; Addadi, L.; Weiner, S.; Gilbert, P.U.P.A. Transformation mechanism of amorphous calcium carbonate into calcite in sea urchin larval spicule. Proc. Natl. Acad. Sci. USA 2008, 105, 17362–17366. [Google Scholar] [CrossRef] [PubMed] [Green Version]
- Nash, M.C.; Diaz-Pulido, G.; Harvey, A.S.; Adey, W. Coralline algal calcification: A morphological and process-based understanding. PLoS ONE 2019, 14, e0221396. [Google Scholar] [CrossRef] [Green Version]
- Jacob, D.E.; Wirth, R.; Agbaje, O.B.A.; Branson, O.; Eggins, S.M. Planktic foraminifera form their shells via metastable carbonate phases. Nat. Commun. 2017, 8, 1265. [Google Scholar] [CrossRef] [PubMed] [Green Version]
- Comeau, S.; Cornwall, C.E.; DeCarlo, T.M.; Doo, S.S.; Carpenter, R.C.; McCulloch, M.T. Resistance to ocean acidification in coral reef taxa is not gained by acclimatization. Nat. Clim. Chang. 2019, 9, 477–483. [Google Scholar] [CrossRef] [Green Version]
- Guillermic, M.; Cameron, L.P.; De Corte, I.; Misra, S.; Bijma, J.; De Beer, D.; Reymond, C.E.; Westphal, H.; Ries, J.B.; Robert, A.; et al. Thermal stress reduces pocilloporid coral resilience to ocean acidification by impairing control over calcifying fluid chemistry. Sci. Adv. 2021, 7, eaba9958. [Google Scholar] [CrossRef]
- Soldati, A.L.; Jacob, D.; Glatzel, P.; Swarbrick, J.C.; Geck, J. Element substitution by living organisms: The case of manganese in mollusc shell aragonite. Sci. Rep. 2016, 6, 22514. [Google Scholar] [CrossRef] [PubMed] [Green Version]
Figure 1.
Varying concentrations of calcium and carbonate ions [Ca2+:CO32−] at fixed Ωara of 25, 15, and 5. This demonstrates the underlining principle that calcium and carbonate ion concentrations can obtain the same Ωara value at different Ca:CO3 ratios, therefore questioning the empirical equation that prescribes the calcification rate as a function of Ωara alone.
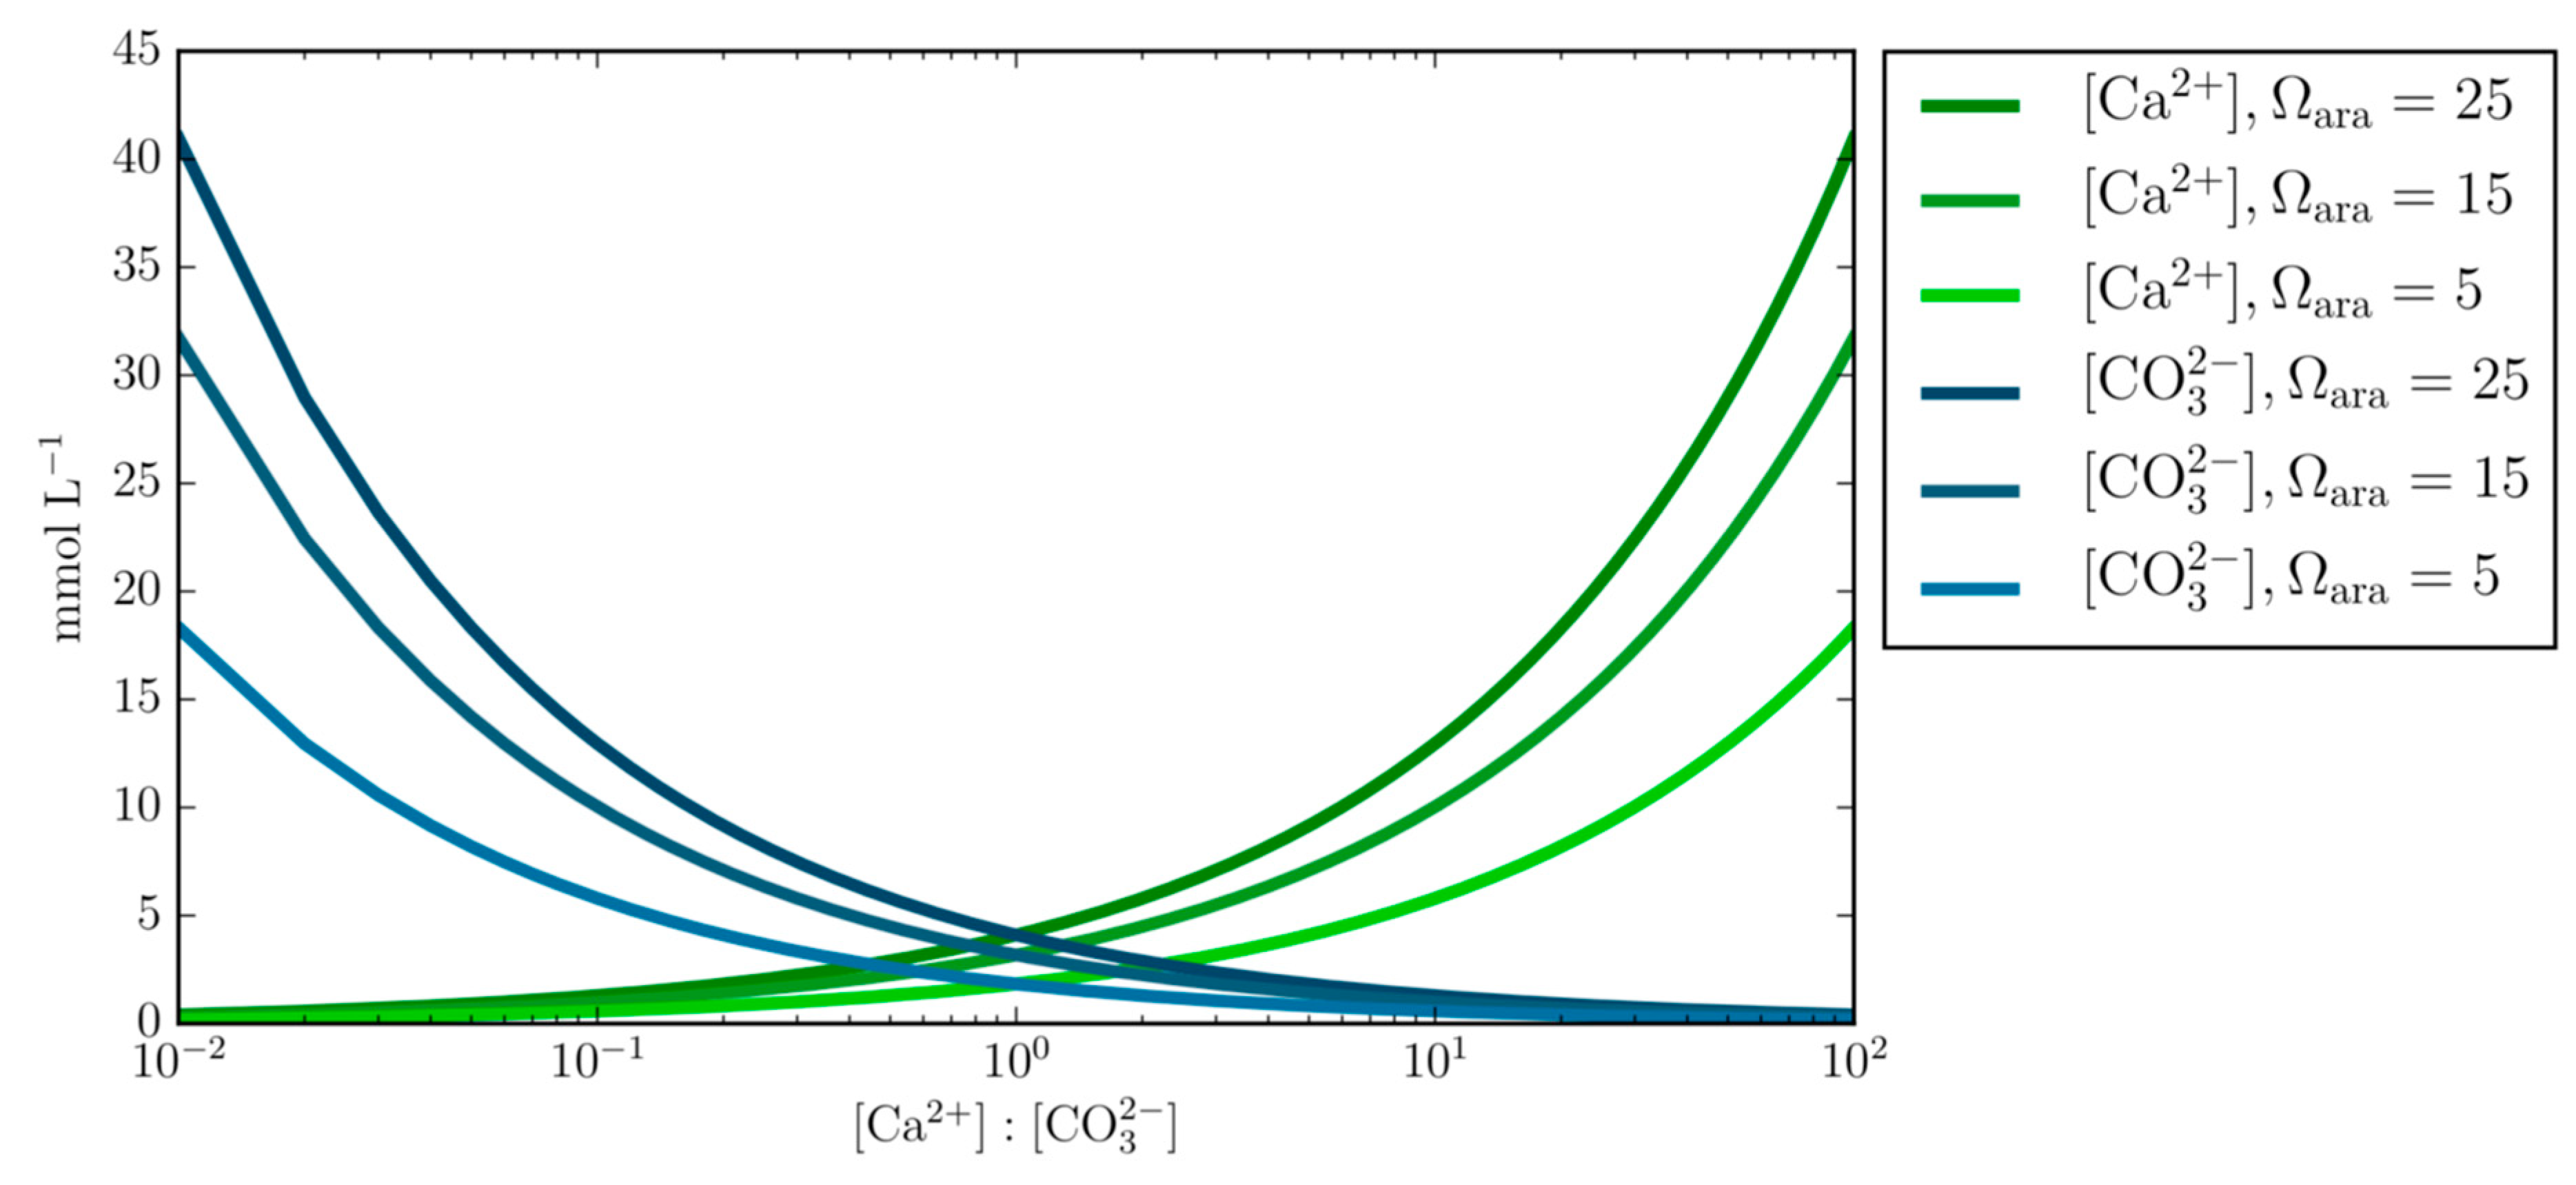
Figure 2.
Schematic design of the experimental conditions showing (a) the separate stock solutions of Ca and CO3 passing through the peristaltic pump and mixing in the reaction chambers, and (b) the physicochemical conversions of CaCO3, bicarbonate [HCO3−] and CO3 occurring during mineral precipitation and dissolution phases. Each of the six experimental scenarios is outlined in Table 1.

Figure 3.
Scatter plot showing the standardized total weight change per day [mg d−1] of each experimental scenario. The data shows a clear inhibiting effect of Mg and 2.8:1 Ca:CO3 stoichiometry towards inorganic mineralization. Treatments not connected by the same alphabetical symbol (A, B, or C) are significantly different as shown in Table 2; F[2,24] = 150.924, p < 0.001.

Figure 4.
Representative SEM images of the precipitated CaCO3 from each experimental scenario. This shows the influence of Ca:CO3 stoichiometry, as well as the Mg concentration on the CaCO3 morphology. The Mg-free incubations with a 47:1 Ca:CO3 (a) resulted in crosshatched vaterite and layered rhombohedral calcite. Mg-free incubations (control Mg treamtent) with a 2.8:1 Ca:CO3 stoichiometry (b) resulted in an intermediate form of ACC together with rhombohedral calcite and some signs of dissolution. Where the Mg concentration was half that of the modern seawater values (26.5 mM) and with a 47:1 Ca:CO3 stoichiometry (c) resulted in a Mg-calcite structure c.f. [48]. Mg concentration of 26.5 mM with a 2.8:1 Ca:CO3 stoichiometry (d) resulted in the formation of aragonite needles. In the scenario where the Mg concentration was 53 mM (equivalent to modern seawater values) no matter if the Ca:CO3 stoichiometry was 2.8:1 or 47:1 (e,f) very little new CaCO3 material precipitated, instead we can see ACC with low relief aragonite needles or unconnected aragonite needles and dissolution pits.

Table 1.
Solutions setup for incubation experiments. Calcium, magnesium, and DIC concentrations are arranged by the amounts of CaCl2, MgCl2, and NaHCO3 added to the solutions. Temperature and salinity remained constant at 25 °C and 36 g kg−1, respectively. Carbonate concentrations and TA are calculated for equilibrium carbonate chemistry in NaCl using the dissociation constants of [41].
| Exp. | Ca2+:CO32− | Mg2+:Ca2+ | Ca2+ | CO32− | Mg2+ | Ωara | pH | DIC | TA |
|---|---|---|---|---|---|---|---|---|---|
| mol:mol | mol:mol | mM | µM | mM | µM | µM | |||
| 1a | 47 | 0 | 10.6 | 226 | 0 | 10 | 8.7 | 1777 | 2440 |
| 1b | 2.8 | 0 | 2.6 | 926 | 0 | 10 | 8.7 | 7270 | 9885 |
| 2a | 47 | 2.5 | 10.6 | 226 | 26.5 | 10 | 8.7 | 1777 | 2440 |
| 2b | 2.8 | 10.2 | 2.6 | 926 | 26.5 | 10 | 8.7 | 7270 | 9885 |
| 3a | 47 | 5 | 10.6 | 226 | 53 | 10 | 8.7 | 1777 | 2440 |
| 3b | 2.8 | 20.4 | 2.6 | 926 | 53 | 10 | 8.7 | 7270 | 9885 |
Table 2.
Two-way factorial ANOVA and least square (LS) means difference. The effect test showed significant interaction between Ca:CO3 and Mg concentration. Tukey–Kramer HSD comparisons indicates a significant difference between Mg-free and high Ca:CO3, and all other treatments, as well as Mg-free and low Ca:CO3 and all other treatments.
| Source | DF | SS | MS | F-Ratio | p > F |
|---|---|---|---|---|---|
| Model | 5 | 4.142 | 0.828 | 240.390 | <0.001 |
| Mg2+ | 2 | 2.592 | 375.980 | <0.001 | |
| Ca2+:CO32− | 1 | 0.510 | 148.143 | <0.001 | |
| Mg2+ * Ca2+:CO32− | 2 | 1.040 | 150.924 | <0.001 | |
| Error | 24 | 0.083 | 0.003 | ||
| Total Error | 29 | 4.224 |
Publisher’s Note: MDPI stays neutral with regard to jurisdictional claims in published maps and institutional affiliations. |
© 2021 by the authors. Licensee MDPI, Basel, Switzerland. This article is an open access article distributed under the terms and conditions of the Creative Commons Attribution (CC BY) license (http://creativecommons.org/licenses/by/4.0/).
Share and Cite
MDPI and ACS Style
Reymond, C.E.; Hohn, S. An Experimental Approach to Assessing the Roles of Magnesium, Calcium, and Carbonate Ratios in Marine Carbonates. Oceans 2021, 2, 193-214. https://0-doi-org.brum.beds.ac.uk/10.3390/oceans2010012
AMA Style
Reymond CE, Hohn S. An Experimental Approach to Assessing the Roles of Magnesium, Calcium, and Carbonate Ratios in Marine Carbonates. Oceans. 2021; 2(1):193-214. https://0-doi-org.brum.beds.ac.uk/10.3390/oceans2010012
Chicago/Turabian StyleReymond, Claire E., and Sönke Hohn. 2021. "An Experimental Approach to Assessing the Roles of Magnesium, Calcium, and Carbonate Ratios in Marine Carbonates" Oceans 2, no. 1: 193-214. https://0-doi-org.brum.beds.ac.uk/10.3390/oceans2010012