Article

Structure and Dynamics of the Ras al Hadd Oceanic Dipole in the Arabian Sea

1
Laboratoire d’Océanographie Physique et Spatiale, Institut Universitaire Européen de la Mer, Universite de Bretagne Occidentale, 29200 Brest, France
2
Le Laboratoire de météorologie dynamique (LMD), Ecole Polytechnique, 91120 Palaiseau, France
*
Author to whom correspondence should be addressed.
Submission received: 1 December 2020 / Revised: 26 January 2021 / Accepted: 27 January 2021 / Published: 4 February 2021

Abstract

:
The Ras al Hadd oceanic dipole is a recurrent association of a cyclone (to the northeast) and of an anticyclone (to the southwest), which forms in summer and breaks up at the end of autumn. It lies near the Ras al Hadd cape, southeast of the Arabian peninsula. Its size is on the order of 100 km. Along the axis of this dipole flows an intense jet, the Ras al Had jet. Using altimetric data and an eddy detection and tracking algorithm (AMEDA: Angular Momentum Eddy Detection and tracking Algorithm), we describe the life cycle of this oceanic dipole over a year (2014–2015). We also use the results of a numerical model (HYCOM, the HYbrid Coordinate Ocean Model) simulation, and hydrological data from ARGO profilers, to characterize the vertical structure of the two eddies composing the dipole, and their variability over a 15 year period. We show that (1) before the dipole is formed, the two eddies that will compose it, come from different locations to join near Ras al Hadd, (2) the dipole remains near Ras al Hadd during summer and fall while the wind stress (due to the summer monsoon wind) intensifies the cyclone, (3) both the anticyclone and the cyclone reach the depth of the Persian Gulf Water outflow, and (4) their horizontal radial velocity profile is often close to Gaussian but it can vary as the dipole interacts with neighboring eddies. As a conclusion, further work with a process model is recommended to quantify the interaction of this dipole with surrounding eddies and with the atmosphere.

1. Introduction

Over the last three decades, there has been growing interest in the Arabian Sea and in its marginal gulfs and seas, for geopolitical, economic, and scientific reasons. These seas form a complex region in terms of oceanographic variability as they are influenced by the North Equatorial Current and by the Southwest Monsoon Current. The monsoon winds, blowing over this region, are highly variable with the seasons, coming strong and northeastward from May to September, weaker and southwestward from December to February, and quite weak and variable in direction during the two intermonsoon periods (March–April and October–November). These winds drive coastal and regional ocean currents, upwellings, and downwellings near the coast. These winds also play a major role in the vertical mixing of the upper ocean water masses [1,
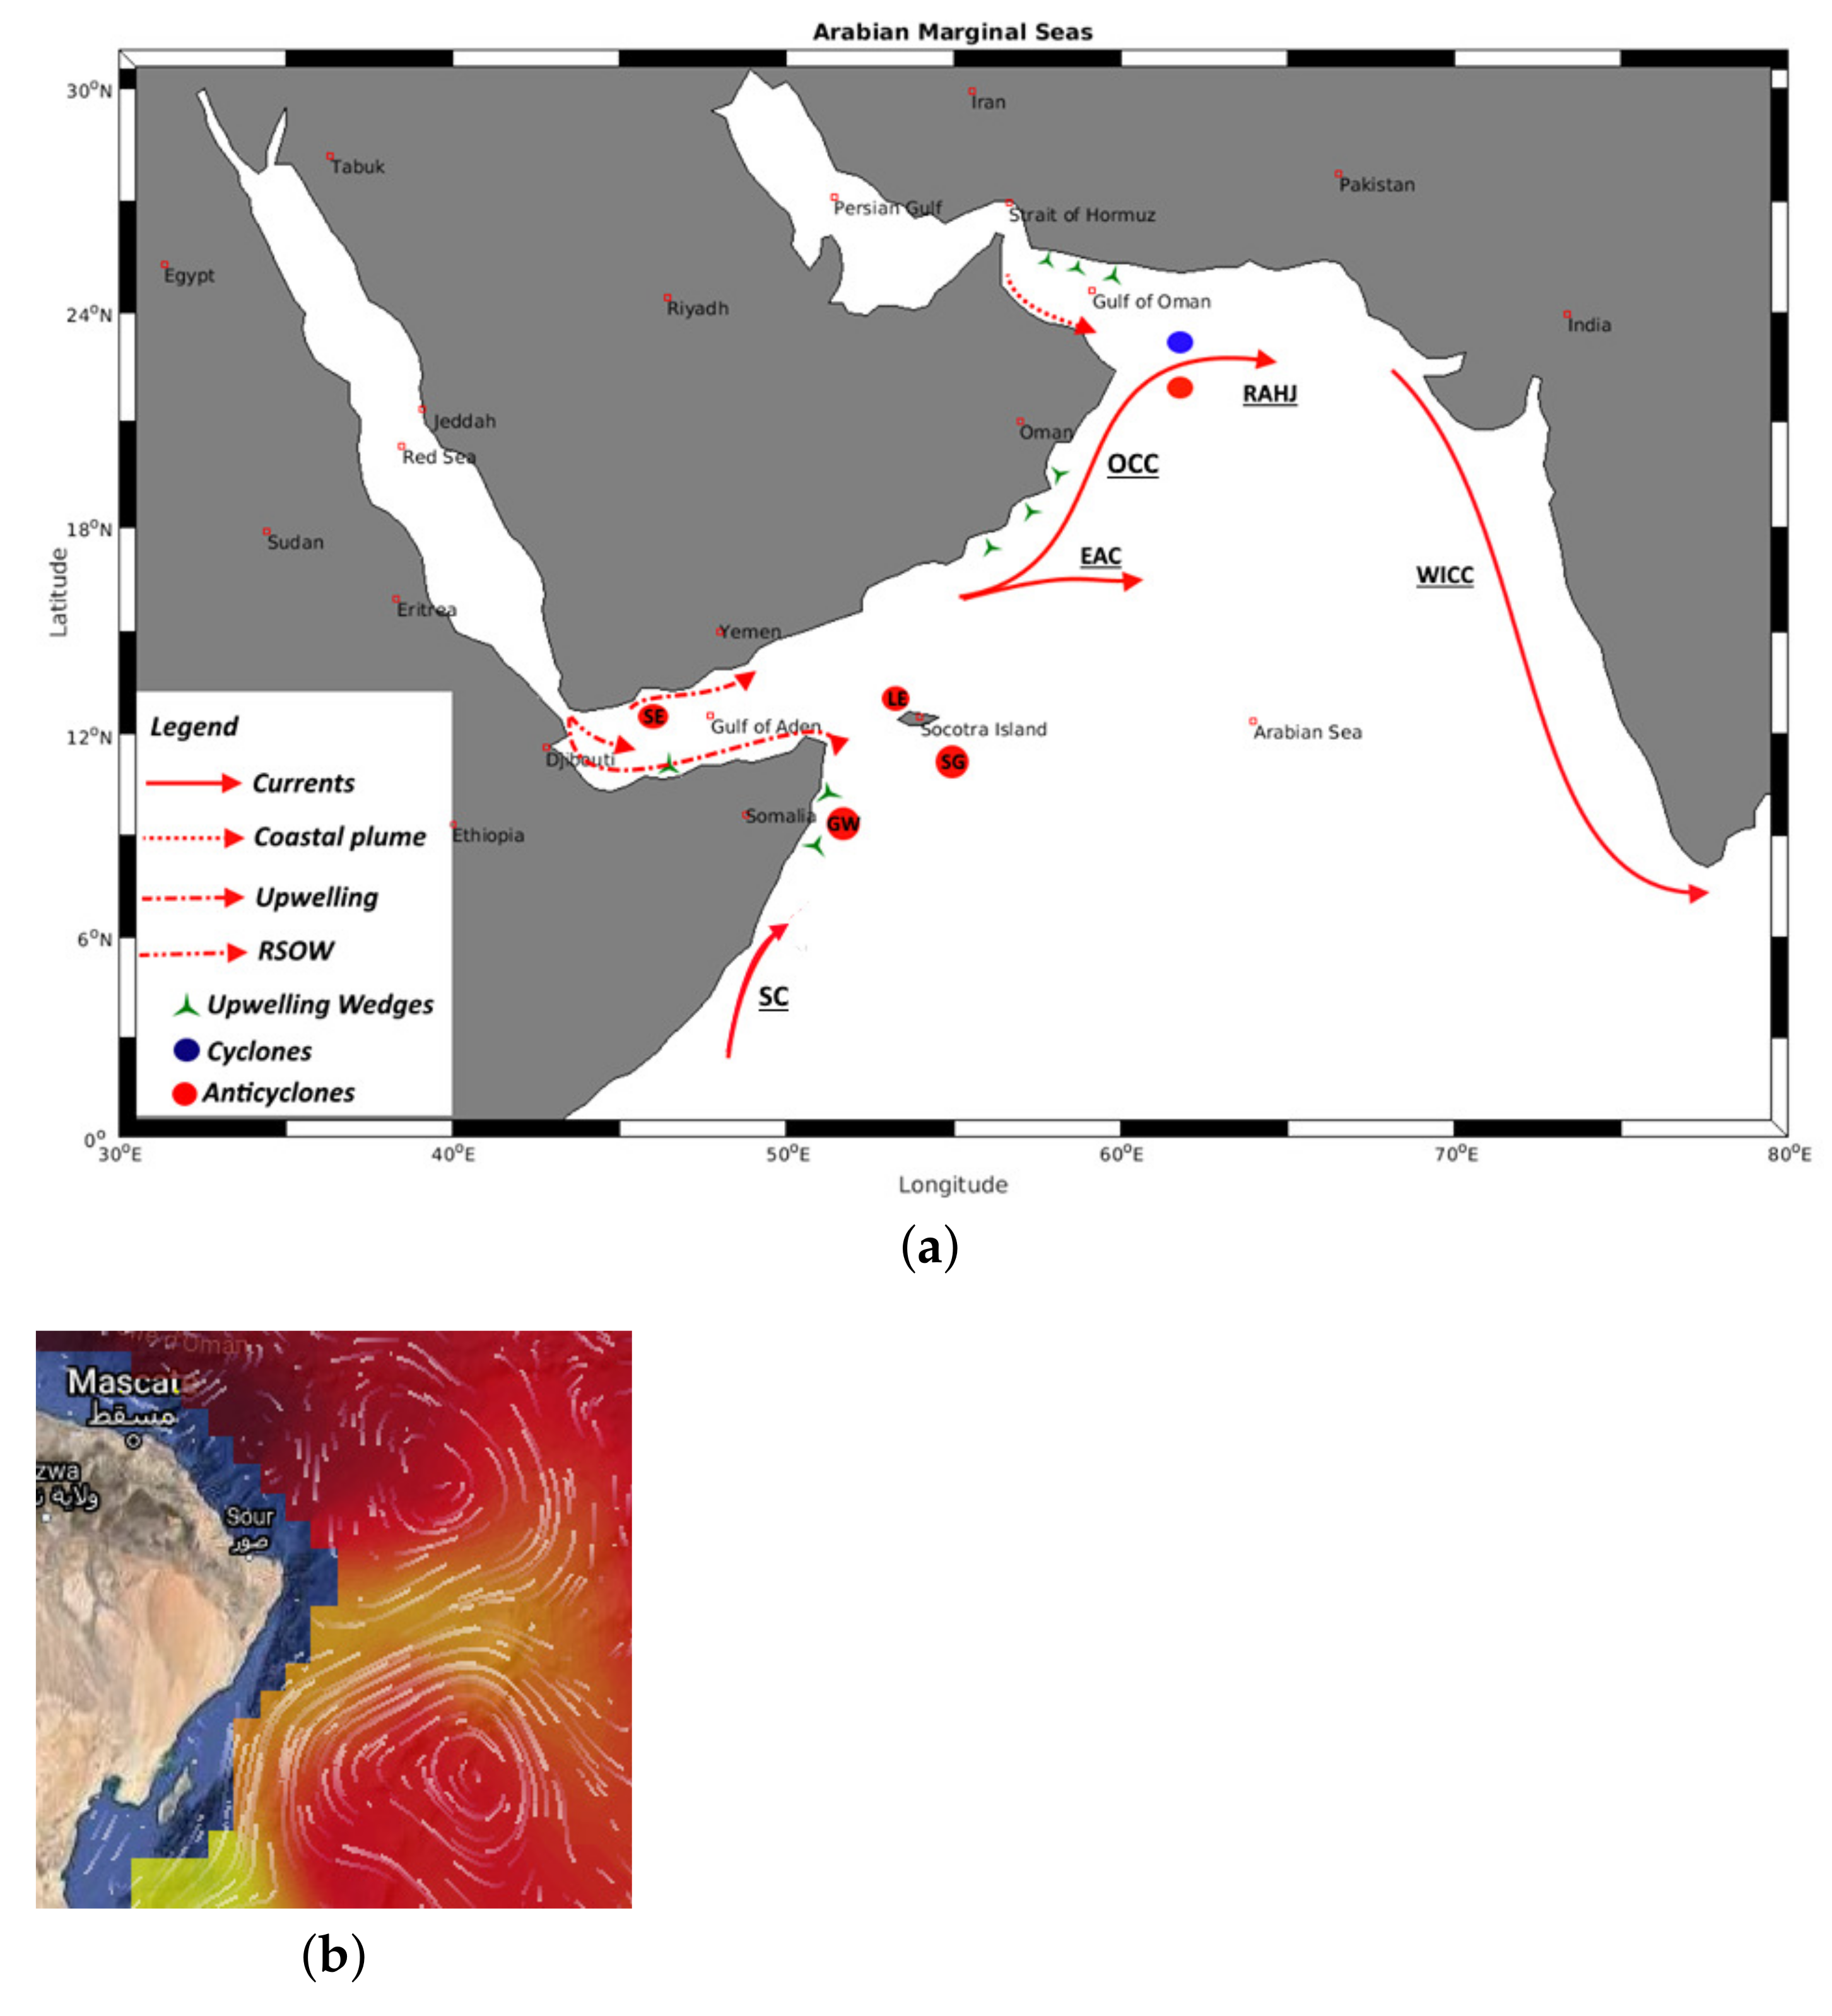
2]. The alongshore currents are therefore seasonally variable too. During the summer (southwest) monsoon, the Oman Coastal Current (OCC) flows northeastward, southeast of the Arabian Peninsula, and the West India Coastal Current (WICC) flows southward. In winter, the WICC flows northward (see Figure 1a).
Satellite observations and high resolution, primitive equation model simulations reveal that a strong turbulent activity takes place near the ocean surface in the Arabian Sea and in its marginal gulfs. The mesoscale (the mesoscale in the ocean characterizes motions of horizontal size from 10 to 250 km and time scales of 2 to 30 days) surface eddies (eddies are oceanic vortices) can be generated by the instability of alongshore currents [3,4] and are influenced by the wind stress curl and by Rossby waves [5,6]. These Rossby waves are generated at the western coast of India [7] and propagate westward towards the south Arabian or Somali coasts. There, they can break and intensify pre-existing eddies. Since both these Rossby waves, and the coastal currents, are surface intensified, the eddies thus formed are also concentrated near the ocean surface. Some of these eddies have already been studied, some of them have received less attention.
Among the most often studied eddies in the region is the Great Whirl, a large surface eddy near the coast of Somalia. It is generated, and its intensity is modulated, by the summer monsoon wind stress curl, and by the incoming Rossby waves [8,9,10]. In the central Arabian Sea, Fisher et al. [11] observed several surface eddies via a moored currentmeter array. These eddies were generated during the summer monsoon wind stress. In the Gulf of Aden, the formation of eddies and their westward propagation are often due to wind stress during the summer monsoon [12] but current instabilities play an essential role in eddy dynamics during the fall intermonsoon and Rossby waves play a role during the winter monsoon. In November, eddies in the eastern Gulf of Aden are formed by a northward inflow of the Somali Current through the Socotra Passage [13]. In the Gulf of Aden, Bower and Furey [14] discovered two eddies, the Summer Eddy and the Lee Eddy, formed by the splitting of the Gulf of Aden Eddy at the end of the Spring intermonsoon. The Summer Eddy propagates westward into the Gulf of Aden, while the Lee Eddy remains fairly stationary north of Socotra Island and these two eddies are influenced by the wind stress curl.
The importance of these mesoscale eddies lies both in their interaction with the regional dynamics, or with the atmosphere, and in their effect on the marginal sea outflows. Indeed, the Red Sea and the Persian Gulf produce salty waters which are exported into the Arabian Sea via the straits of Bab el Mandeb and of Hormuz. These two water masses are the RSOW (Red Sea Outflow Water) also called RSW (Red Sea Water) and the PGW (Persian Gulf Water). After exiting the marginal seas, the RSW and PGW outflows mix with the surrounding water masses in the Gulf of Aden and in the Gulf of Oman, respectively, then, the RSW plume stabilizes at 600–1000 m and the PGW plume at a 250–350 m depth [15,16,17]. Due to the influence of mesoscale eddies or bottom topography [4,18,19,20], the PGW or RSW outflows are destabilized and they often shed smaller-scale eddies (of radii ranging between 5 and 20 km). These eddies, formed at a depth near the coast, drift away into the open ocean, carrying their warm and salty waters (see [3,21,22] for the small RSW eddies, and [23,24,25] for the PGW eddies). These small eddies contribute to the regional budgets of heat, salt, and momentum.
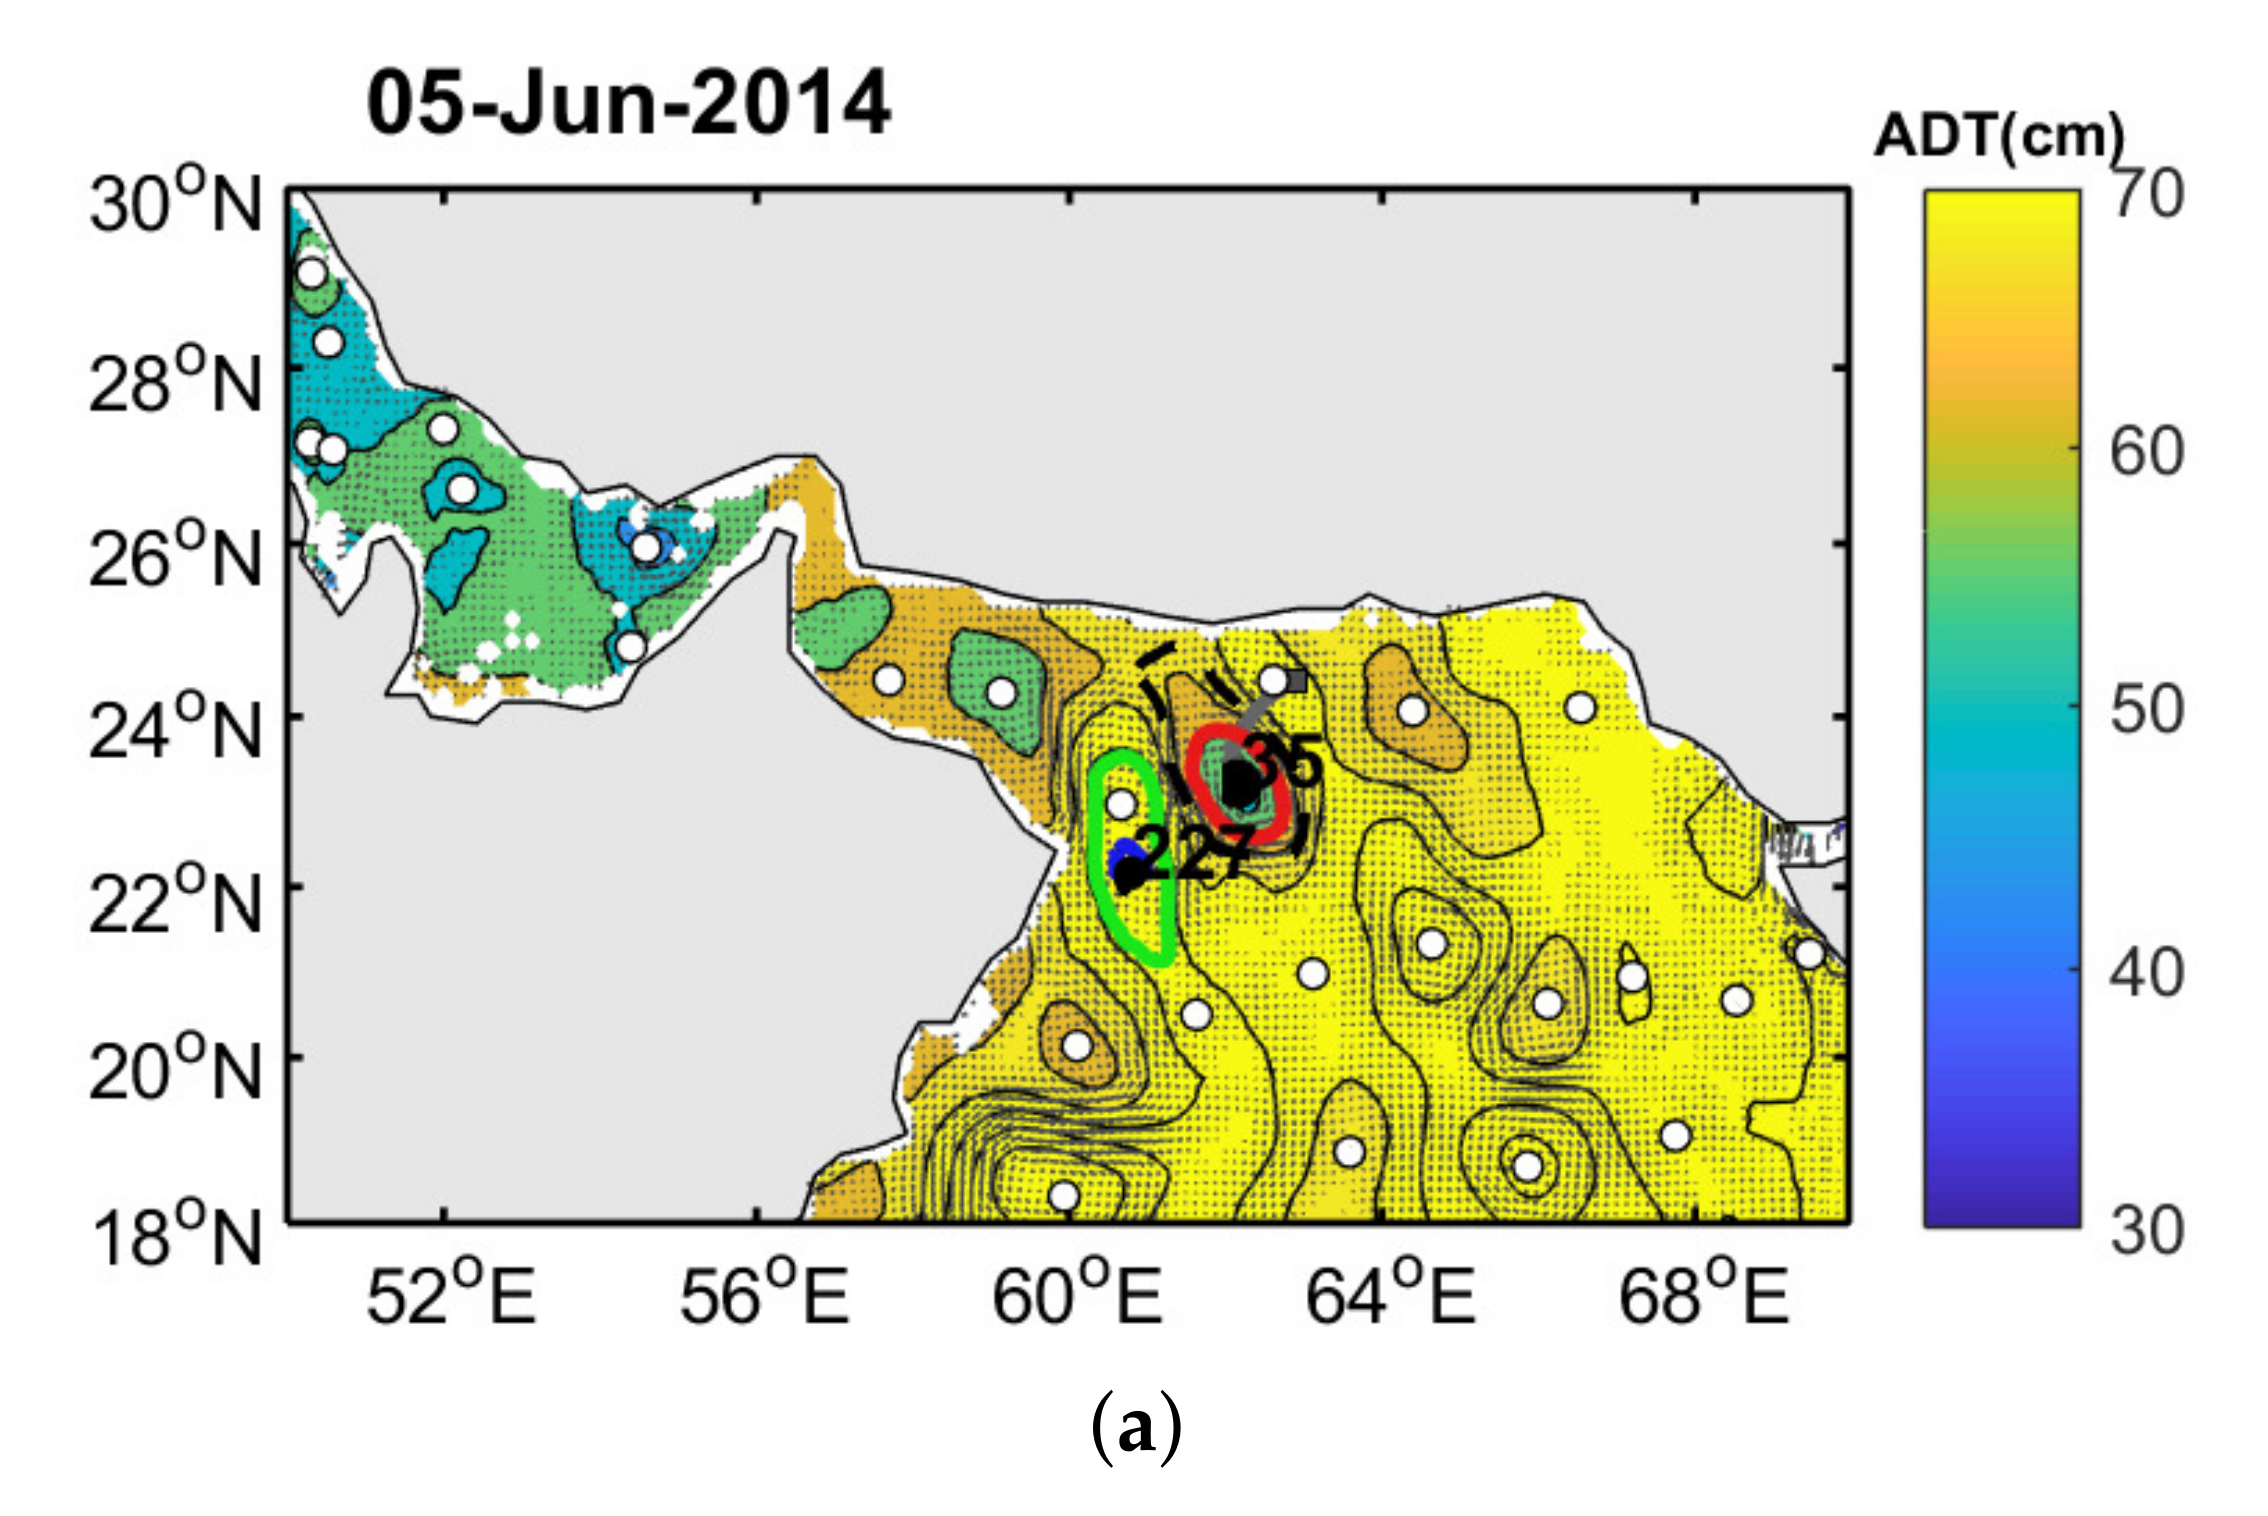
A less studied surface mesoscale eddy, or more precisely a pair of eddies, is the Ras al Hadd oceanic dipole. This association of a cyclone and of an anticyclone, exists from May to October, near Ras al Hadd, the southeastern-most cape of the Arabian Peninsula (see Figure 1b). An intense offshore jet, the Ras al Hadd jet, lies between the two eddies. It was studied by Böhm et al. [26] using high resolution radiometric data and Acoustic Doppler Current Profiler observations. Though Böhm et al. mentionned the presence of the two eddies near the jet, and noted their size of about 150 km, they mostly concentrated on the jet which advects cold water offshore during the summer monsoon. Indeed, this dipole marks the eastern edge of the Oman upwelling system which contains cold water. Apart from the study by Böhm et al., the Ras al Hadd dipole has not been studied in detail. Taking advantage of a new, high-resolution altimetric dataset, analyzed via vortex identification and tracking software (AMEDA: Angular Momentum Eddy Detection and tracking Algorithm), of ARGO profiling float data in the region (from the ARGO program), of a regional primitive equation model (HYCOM), the structure and the evolution of the Ras al Hadd dipole are examined here.
This paper is organized as follows: First, we present satellite and profiling float data, the AMEDA algorithm, and the HYCOM model simulations (Section 2). Then we analyze the Ras al Hadd dipole by studying its life cycle over a year (April 2014 to April 2015), and its horizontal and vertical structures using the altimetric and the float data, and the model results (Section 3), evaluating its inter-annual variability over a 15 year period. These results are discussed to present the impact of this dipole on its environment (Section 4). Finally, conclusions are drawn.

2. Materials and Methods

Time series of sea surface height data were obtained via a combination of up-to-date measurements by altimetric satellites (Topex/Poseidon, ERS-2, GFO, Jason-1, Envisat, Jason-2, Cryosat-2, Altika et HY2A). Using all available missions, an ADT (Absolute Dynamic Topography) product for the Arabian Sea was processed by CLS-Argos on a 1 8 Mercator grid, with time intervals of 24 h, for the 2000–2015 period. Those products were processed by SSALTO/DUACS and distributed by AVISO+, https://www.aviso.altimetry.fr (accessed on 1 December 2020)) with support from CNES, Centre National d’Etudes Spatiales, Toulouse, France The geostrophic velocity fields were then derived from absolute dynamic topography. The MDT used to calculate the ADT from SLA is described on the AVISO/CNES website https://www.aviso.altimetry.fr/en/data/products/auxiliary-products/mdt/mdt-description.html (accessed on 1 December 2020) and results from an average of sea surface height above the geoid over the 1993–2012 period. It takes into account the last geoid model GOCO05S (based on the complete GOCE mission and on 10.5 years of the GRACE mission) and 25 years of altimetric and in situ data (hydrological profiles, drifting buoys). The spatial resolution of this disseminated regional data set resolves the internal deformation radius, R d 50–60 km, in the Arabian Sea. The spatio-temporal interpolation performed on the multiple altimetric tracks in order to build gridded products provides this 1 8 resolution while the signal resolution of altimetry is about 100 km [27,28]. The sensitivity test performed on the AMEDA algorithm [29] shows that only eddies with a characteristic radius larger than 25 km could correctly be detected with the regional AVISO/CMEMS data set. In addition, a recent work [30] compared eddies identified in a 1 60 resolution model with those found in the 1 8 AVISO product used here and concluded that eddies with radii smaller than 25 km could not reliably be detected. The Ras al Hadd dipole eddies have radii larger than 45 km. Thus these two eddies can be detected with confidence in this AVISO/CMEMS product.
To relate vortex generation or intensification with the wind stress curl, the ECMWF (European Center of Medium-range Weather Forecast) meteorological model re-analyses (ERA-Interim) were used [31]. These re-analyses provided the regional wind every 6 h, with a 1 4 resolution.
To support our analysis of the Ras al Hadd dipole, we also used HYCOM (Hybrid Coordinate Ocean Model) model simulations. These model simulations were performed by SHOM (Service Hydrographique and Oceanographique de la Marine, France). The model has a 5 km horizontal resolution, 40 vertical levels (the upper ones being sigma levels—or terrain following levels, and the lower ones, isopycnic levels—that is, isodensity levels). The atmospheric forcing for the ocean model was extracted from the Meteo-France atmospheric model results over the region with a 1 4 horizontal resolution and a 6 h period for the year 2011. This year was chosen as typical of the meteorological variability in this region. The HYCOM model was initialized using a situation obtained from a global, lower resolution ocean model (MERCATOR PSY3, with 1 4 resolution). The results of MERCATOR PSY3 were also used for the external boundary conditions of HYCOM (temperature, salinity, and currents). The geographical domain of the HYCOM model covers the Arabian Sea, the gulfs of Oman and of Aden, the Red Sea, and the Persian Gulf, north of 10 S, and west of 80 E. The tidal forcing of HYCOM was provided by TOPEX and was included in the model at the open boundaries. Vertical mixing was parameterized with the KPP (K-profile parameterization) scheme [32]. This numerical model has been described and validated in [18].
To identify vortices, and in particular the Ras al Hadd dipole, in the altimetric data, we used the AMEDA algorithm. The AMEDA (Angular Momentum Eddy Detection and tracking Algorithm) method is an algorithm that detects and tracks oceanic vortices in the horizontal (geostrophic) velocity fields derived from satellite measurements of the sea surface [29]. The AMEDA method is available and decribed on the website of the DYNED ATLAS project https://www.lmd.polytechnique.fr/dyned/methods (accessed on 1 December 2020) with its strengths and weaknesses, and in particular, a comparison of the geostrophic and cyclogeostrophic velocities. This comparison is also performed in [33]. The vortex centers are identified as extreme in local angular momentum, and each vortex boundary is determined via the connexity of the vortices thus found (the boundary must be a closed streamline). Tracking vortices in time relies on the spatial closeness and on the shape similarity between two vortices successively identified in time. Nevertheless, short gaps in the time series are allowed provided that the temporal continuity can be ensured (the distance between two successive positions of a given vortex must not exceed a threshold). The model also identifies merging (connection) and splitting of vortices, via the connection or separation of contours. This algorithm contains a minimal number of tunable parameters. It has been successfully tested on AVISO altimetry datasets, on ROMS model output, and on velocity fields issued from laboratory experiments. Here the AMEDA algorithm was applied to the high resolution altimetric maps.
Finally, ARGO profiling float data were extracted from the Coriolis database with only validated data with a high quality index that corresponded to the period of study, used. The ARGO profilers are deep reaching oceanic floats, equipped with temperature, conductivity (salinity) and possibly oxygen concentration sensors. These floats first dive to a given depth (the parking depth, usually between 500 and 1000 m), then they drift at this depth under the influence of the oceanic currents, for a prescribed duration (their cycle period, usually 5 or 10 days). Once every cycle, the ARGO floats move up to the sea surface, thus performing a vertical profile of temperature, salinity, and sometimes oxygen concentration, of the ocean. At the surface, the floats are positioned via GPS and they transmit their data back to the scientific institutes, via a satellite link. Then, they dive back to their parking depth for a new cycle. Therefore the vertical profile data are positioned but the exact trajectory of the ARGO floats at depth is unknown. The ARGO data used here (temperature and salinity only) were collected by floats with cycling periods of 5 or 10 days, and a parking depth of 1000 m. The Ras al Hadd AMEDA outputs for the studied period with their respective Argo profiles given in https://github.com/aayouche/RASALHADD (accessed on 1 December 2020).

3. Results

3.1. Seasonal Variability of the Ras al Hadd Dipole from Mid-April 2014 to Mid-April 2015

3.1.1. Origin and Evolution of the Two Eddies Composing the Dipole, Obtained from Surface Data Analysis

The AMEDA algorithm applied to the altimetric data (the satellite measurements of the sea surface elevation) allows the tracking in time of the eddies detected. This tracking can thus be reversed in time to determine the origin of the two eddies (the cyclone and the anticyclone) which form the Ras al Hadd dipole. These two eddies are detected in the altimetric data as early as April 2014. At that time, the two eddies lie far from each other, in the Arabian Sea. The cyclone is then at the mouth of the Gulf of Oman, near the Iranian/Pakistani coast. The anticyclone is then located east of Ras al Hadd. Altimetric maps show that the two eddies slowly migrate during the 2014 summer monsoon (see Figure 2). The cyclone (CE) drifts southeastward (early to mid-June), then it remains at the same location and elongates until mid-August. The anticyclone (AE) drifts southeastward early to mid June and then remains steady (at the same location). It intensifies in July due to the interaction with a few neighboring eddies and then weakens in mid-August.
During their migrations, the cyclone and anticyclone are altered by their mutual interaction, and by interactions with other eddies. For instance, in June 2014, the anticyclone becomes strongly elongated under the influence of a cyclone (see Figure 3a). The aspect ratio of the anticyclone (obtained from a best elliptical fit) increases beyond a value of 3, in early June 2014 (Figure 3d). Hydrodynamical theory states that an elliptical vortex with an aspect ratio larger than 3 is prone to breaking into two separate vortices [34]. And indeed, a temporary breaking of the anticyclone is observed in June.
In April 2015, the cyclone merges with another cyclone, which is then located to its east (see Figure 3b). Hydrodynamical theory states that two eddies can merge when the distance between them becomes smaller than 3 times their radii. In April 2015, the two cyclones are closer than this distance (see Figure 3c).
AMEDA also provides the time evolution of the cyclone and anticyclone radii, for a year (note that these two eddies may be associated in the dipole or separate during that period). Notable time variations of these radii reflect in part the successive interactions of the dipole with neighboring eddies (see Figure 4). In particular, we can see the growth of the cyclone by merger with a cyclone nearby, in August 2014 and in addition, what is noticeable is the growth of the cyclone radius from September to November 2014. A possible mechanism explaining this intensification is presented below (the effect of the wind). Between mid-January and early March 2015, the cyclone is elongated and loses mass due to the shear exerted by other eddies. In April 2015, it merges again with a cyclone nearby.
The anticyclone of the dipole evolves as follows: In early October 2014, it grows in a favorable environment (with neighboring anticyclonic eddies) then, it splits and decreases in size. It intensifies again at the end of December 2014, early January 2015, in a favorable anticyclonic environment (via mass transfer between eddies). It decreases thereafter by elongation due to the shear of its cyclonic partner. Finally, it intensifies again via a merger with a neighboring anticyclone (in February–March 2015). These evolution of the two eddies of the dipole show the importance of vortex-vortex interactions in this region.
To explain another part of the eddy radii and intensity variations with time, we investigate the effect of the wind on the cyclone and on the anticyclone. We correlate the absolute dynamic topography anomaly (the Absolute Dynamic Topography (ADT) anomaly is the total ADT minus its instantaneous geographical average in a subdomain of 5 × 5 degrees around the eddy) and the wind stress curl for the Ras al Hadd dipole. In summer, the wind stress curl correlation was often positive with the cyclone and negative with the anticyclone (Figure 5). Indeed, during this period, the summer monsoon winds blow from Africa to Asia, and veer northward around Ras al Hadd. At this location, the wind stress curl is therefore positive in summer and early fall. During the winter monsoon and spring inter-monsoon, the wind direction is more variable and therefore the wind correlation with the eddies fluctuates more (see again Figure 4).
Now, we study the internal structure of each eddy. The internal velocity-pressure balance in a nearly circular eddy is the cyclogeostrophic balance:
V θ 2 / r + f 0 V θ = ( 1 / ρ ) d p / d r
where V θ is the azimuthal (tangential) velocity, r is the local radius of the point considered in the vortex, f 0 is the Coriolis parameter, ρ is seawater density, and d p / d r is the radial gradient of pressure. The first term in this equation is the centrifugal acceleration, the second is the Coriolis acceleration, and the right hand side in the pressure gradient. For large vortices, the balance lies essentially between the Coriolis acceleration and the pressure gradient and the equilibrium is geostrophic. For smaller and faster spinning eddies, the first term, the cyclostrophic correction to geostrophy, is not negligible. We calculate the ratio of the centrifugal to the Coriolis accelerations for the two eddies, when they are well developed (when their radius is close to 100 km):
C e / C o = V θ / f 0 R
to estimate how nonlinear this balance is. This ratio is shown on Figure 6 with respect to the eddy radius, for each of them. The cyclostrophic correction reaches 20% in the eddy core (10 km from the eddy center) and decreases to about 11% for cyclones and 7% for anticyclones beyond the radius of maximal velocity. We note that it never reaches a large value (e.g., 50%). Therefore, the geostrophic balance is a good approximation for the internal dynamics of these two eddies.

3.1.2. Vertical Structure of the Dipole from the HYCOM Model Results

To complement this surface analysis of the dipole, we present its vertical sections of temperature, salinity, density, and perpendicular current issued from the HYCOM model (see Figure 7). The HYCOM model reproduces well the location and intensity of the Ras al Hadd dipole during the summer monsoon period (see Figure A1). This numerical model has been validated with in-situ observations in previous studies and showed that the main water masses (e.g., the PGW) are well reproduced in the Gulf of Oman and in the northern Arabian Sea [24]. The sections presented in Figure 7a are snapshots extracted from the model. Firstly, the upwards or downwards curvature of the main pycnocline is clearly seen for each vortex, in particular, near a 200 m depth though a few small scale density features are observed near the surface (Figure 7a,b). The 200 m depth corresponds to a marked thermocline and halocline (associated with the presence of Persian Gulf Water), above which the Ras al Hadd eddy velocities are intensified and can reach 0.5 m/s. This magnitude compares well with that measured by ADCP [26]. The velocity field is slightly asymmetric with respect to each eddy vertical axis, but this is due to the deformation effect induced by the surrounding flow (Figure 7c). The vortex flow has a baroclinic component but no flow reversal occurs, at least down to 1500 m depth (not shown). The flow coherence above a 250 m depth indicates that the surface information (eddy drift, interaction or deformation) correctly characterizes the deeper structure of each eddy (Figure 7d).

3.2. Interannual Evolution of the Dipole Over the 2000–2015 Period

Variations of the Surface Features of the Dipole

The AMEDA algorithm is now applied to altimetric data over the 2000–2015 period, to study the long-term variations of the Ras al Hadd dipole structure. During this period, years 2005 and 2009 are not presented because of the dipole position (southwest of the Ras al Hadd cape; see Figure A2 and Figure A3). This dipole is long-living and similar in intensity (radius) to the the Ras al Hadd dipole observed during the other studied years. In this paper, we study the dipole only when it is located at the Ras al Hadd cape at the entrance of the Gulf of Oman (GO), which is not the case for these years. Another dipole is observed at the entrance of GO but is short lived (less than 3 months), therefore for these reasons the dipole is not presented for years 2005 and 2009. For both eddies composing the dipole, we show the time variation of: (1) The radius R m a x of (2) the maximal azimuthal velocity V m a x (defining each eddy core), (3) the steepness α of each eddy velocity profile fitted on:
V θ ( r ) = V m a x r R m a x exp ( 1 α ) exp ( ( r / R m a x ) α / α ) ,
and (4) the dynamical Rossby number R o = ζ c 2 f e 1 α where ζ c is the maximal relative vorticity of each eddy and f is the Coriolis parameter. The calculation of the steepness α is accurate only for large eddies; this is the case of the two eddies composing the dipole. Figure 8 shows that, over 14 years, the anticyclone of the Ras al Hadd is slightly wider and spins often faster than the cyclone. A direct correlation with the interannual variability of the summer wind stress averaged over the Northwestern Arabian Sea (see Figure 7a of [35]) was not found for the dipole. This may be due to the fact that the dipole is both a local feature and that its intensity also varies by interaction with the surrounding eddies. For the anticyclone, the velocity profile is most often Gaussian ( α ∼ 2), but for 2011 when this anticyclone was deformed, it created locally intense ( α ≥ 3) and locally weaker ( α ∼ 1) vorticity gradients. For the cyclone, the velocity profile was also often Gaussian. In 2004 and 2012, it was less steep ( α ∼ 1), either because the cyclone was weaker (2012) or because it was not interacting much with neighboring eddies. The nonlinearity of oceanic eddies is also measured by the dynamical Rossby umber: During the summer monsoons of these 14 years, the values of R o were below 0.3; note that the velocity deduced from altimetry is weaker than that measured at sea because of the low spatial resolution of altimetric data. Nevertheless, we can state that the geostrophic balance holds to a good accuracy for both eddies.

3.3. Variations of the Vertical Structure of the Dipole

The vertical structure of the Ras al Hadd dipole is now evaluated using ARGO float co-localization in the two eddies. The co-localization is performed during the summer monsoon for 6 years (from 2010 to 2015). In the inner core of each eddy, the colocalized profiles give the structure of potential density and a few background profiles are obtained outside of the eddy (at 150 km from the eddy outermost closed contour). At each time step (when ARGO data are available), the inner core density anomaly is computed ( ρ e d d y ρ b a c k g r o u n d ). The background state is calculated out of the outermost eddy closed contour (using an average over 5 points). Then a time average is calculated (over the summer monsoon) and over all the detected profiles. The number of ARGO floats co-located with the dipole varies from year to year. It is indicated on Figure 9b. The eddy depth is defined here as the depth of the maximum density anomaly. On Figure 9b, we can see that the anticyclone is globally deeper than the cyclone. The anticyclone reaches a 280 m depth for most of the 6 years while the cyclone depth is closer to 225 m. The year 2010 is of interest for the study; the number of co-localized profiles reaches 30 (Figure 9b) for both the cyclone and the anticyclone. For this year, the vertical distribution of the density anomaly (Figure 9a) shows a strong intensification near the surface (in the upper 50 m); these are mixed layer variations of the eddy density anomalies. They are negative for the anticyclone and positive for the cyclone. The density anomaly remains noticeable for the anticyclone and cyclone even below a 250 m depth. The thickness of each eddy can be computed from the vertical profiles of density anomalies. Choosing a 0.1 kg/m 3 value (an e-folding scale from the maximum) as a threshold for each eddy thickness, we obtain a thickness of 250 m for the anticyclone and of 300 m for the cyclone.

4. Discussion

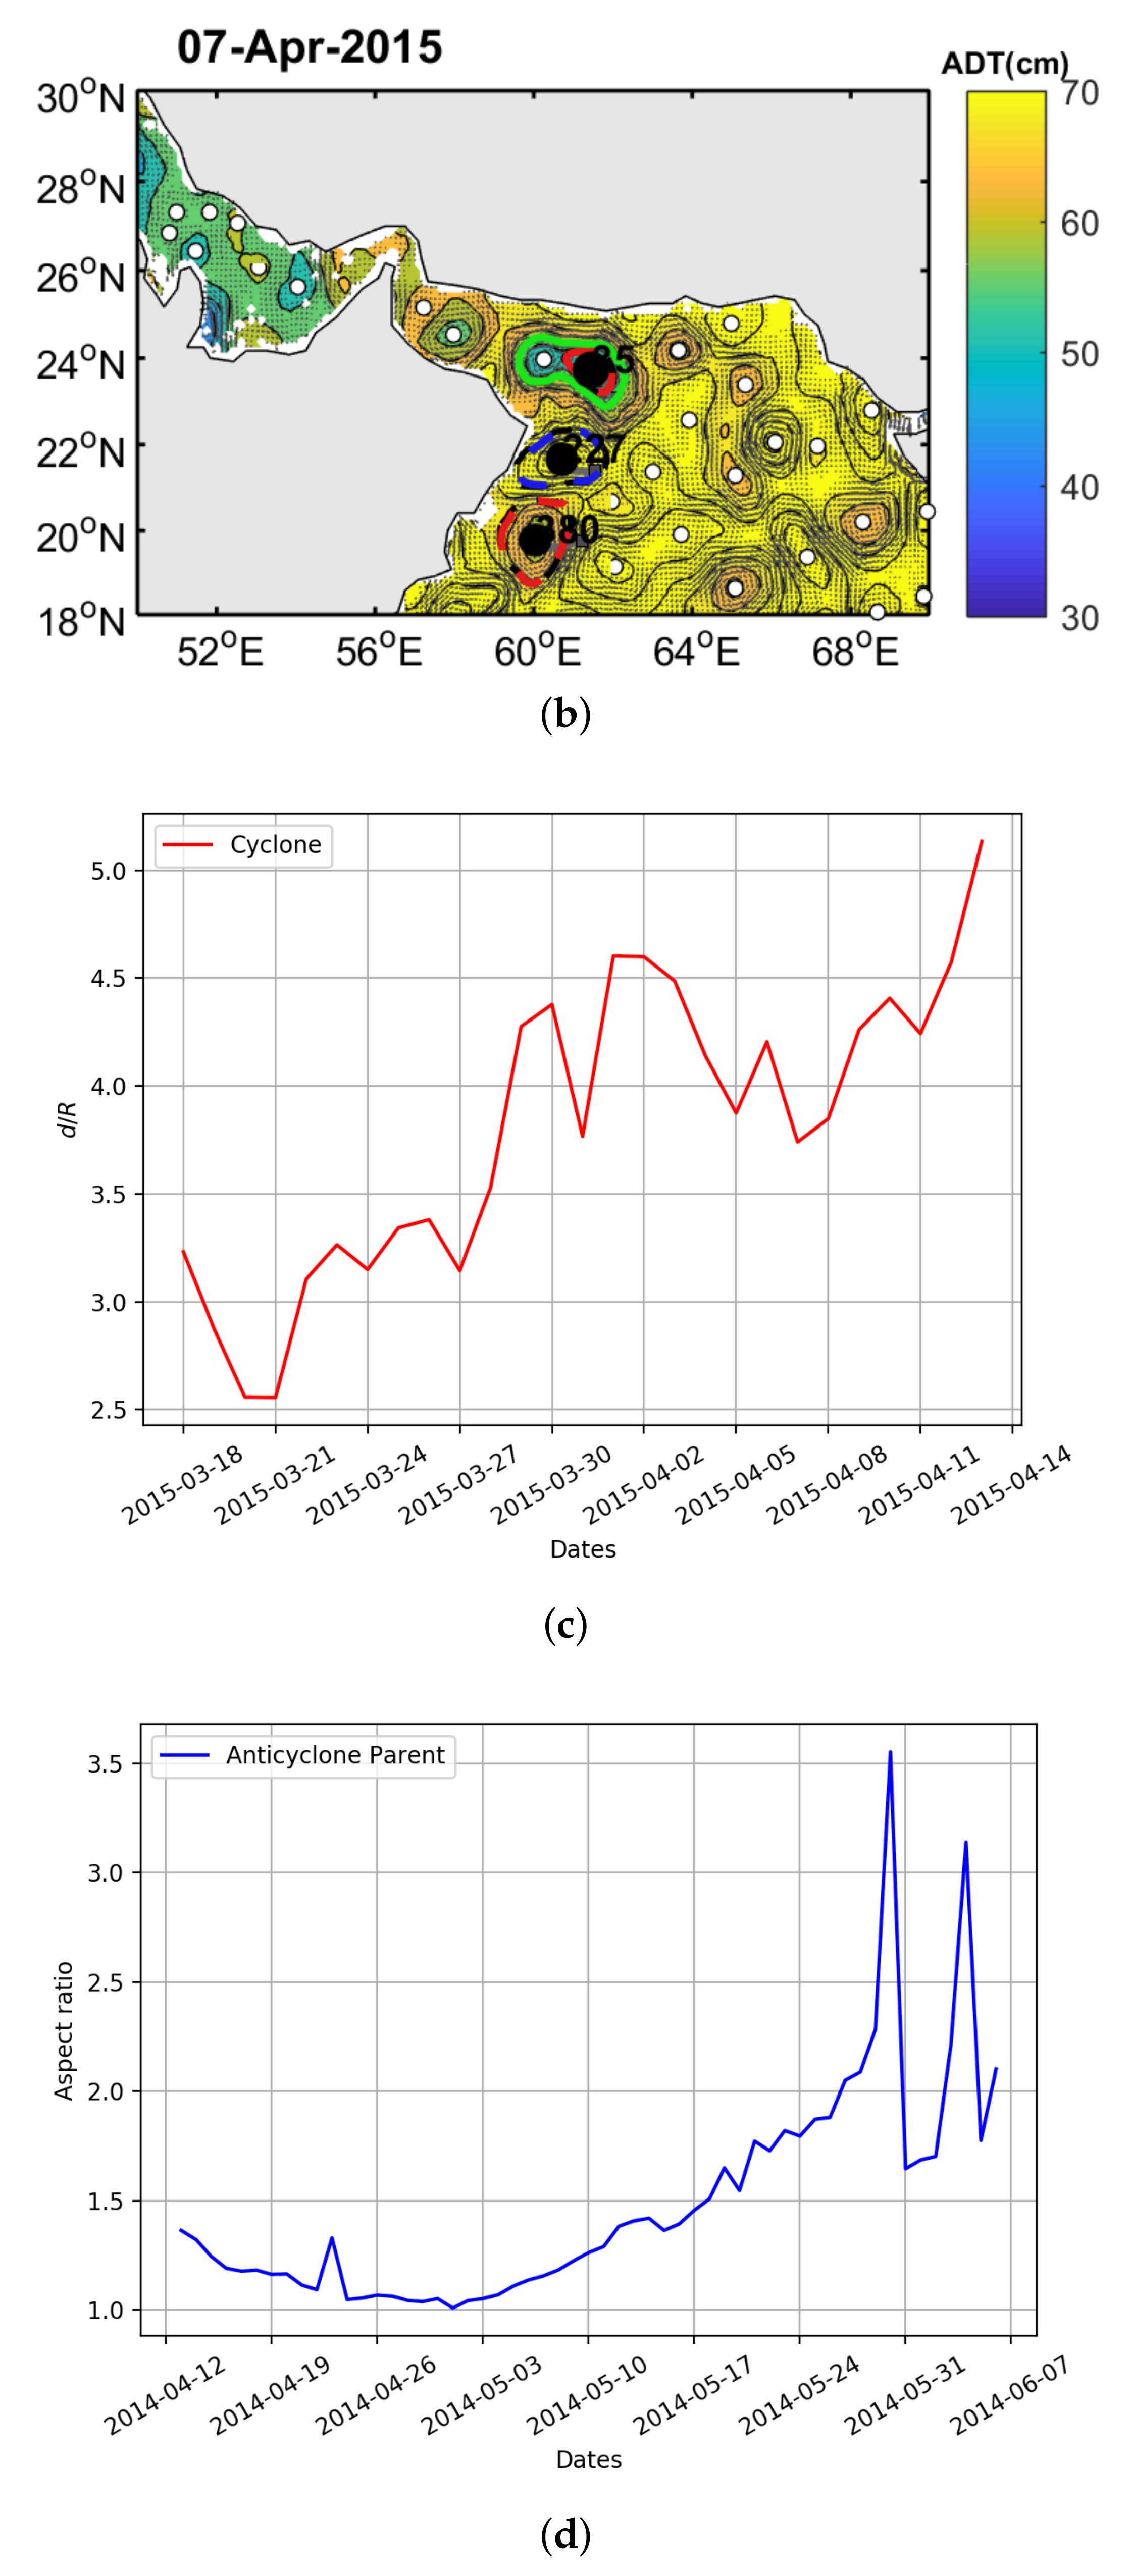
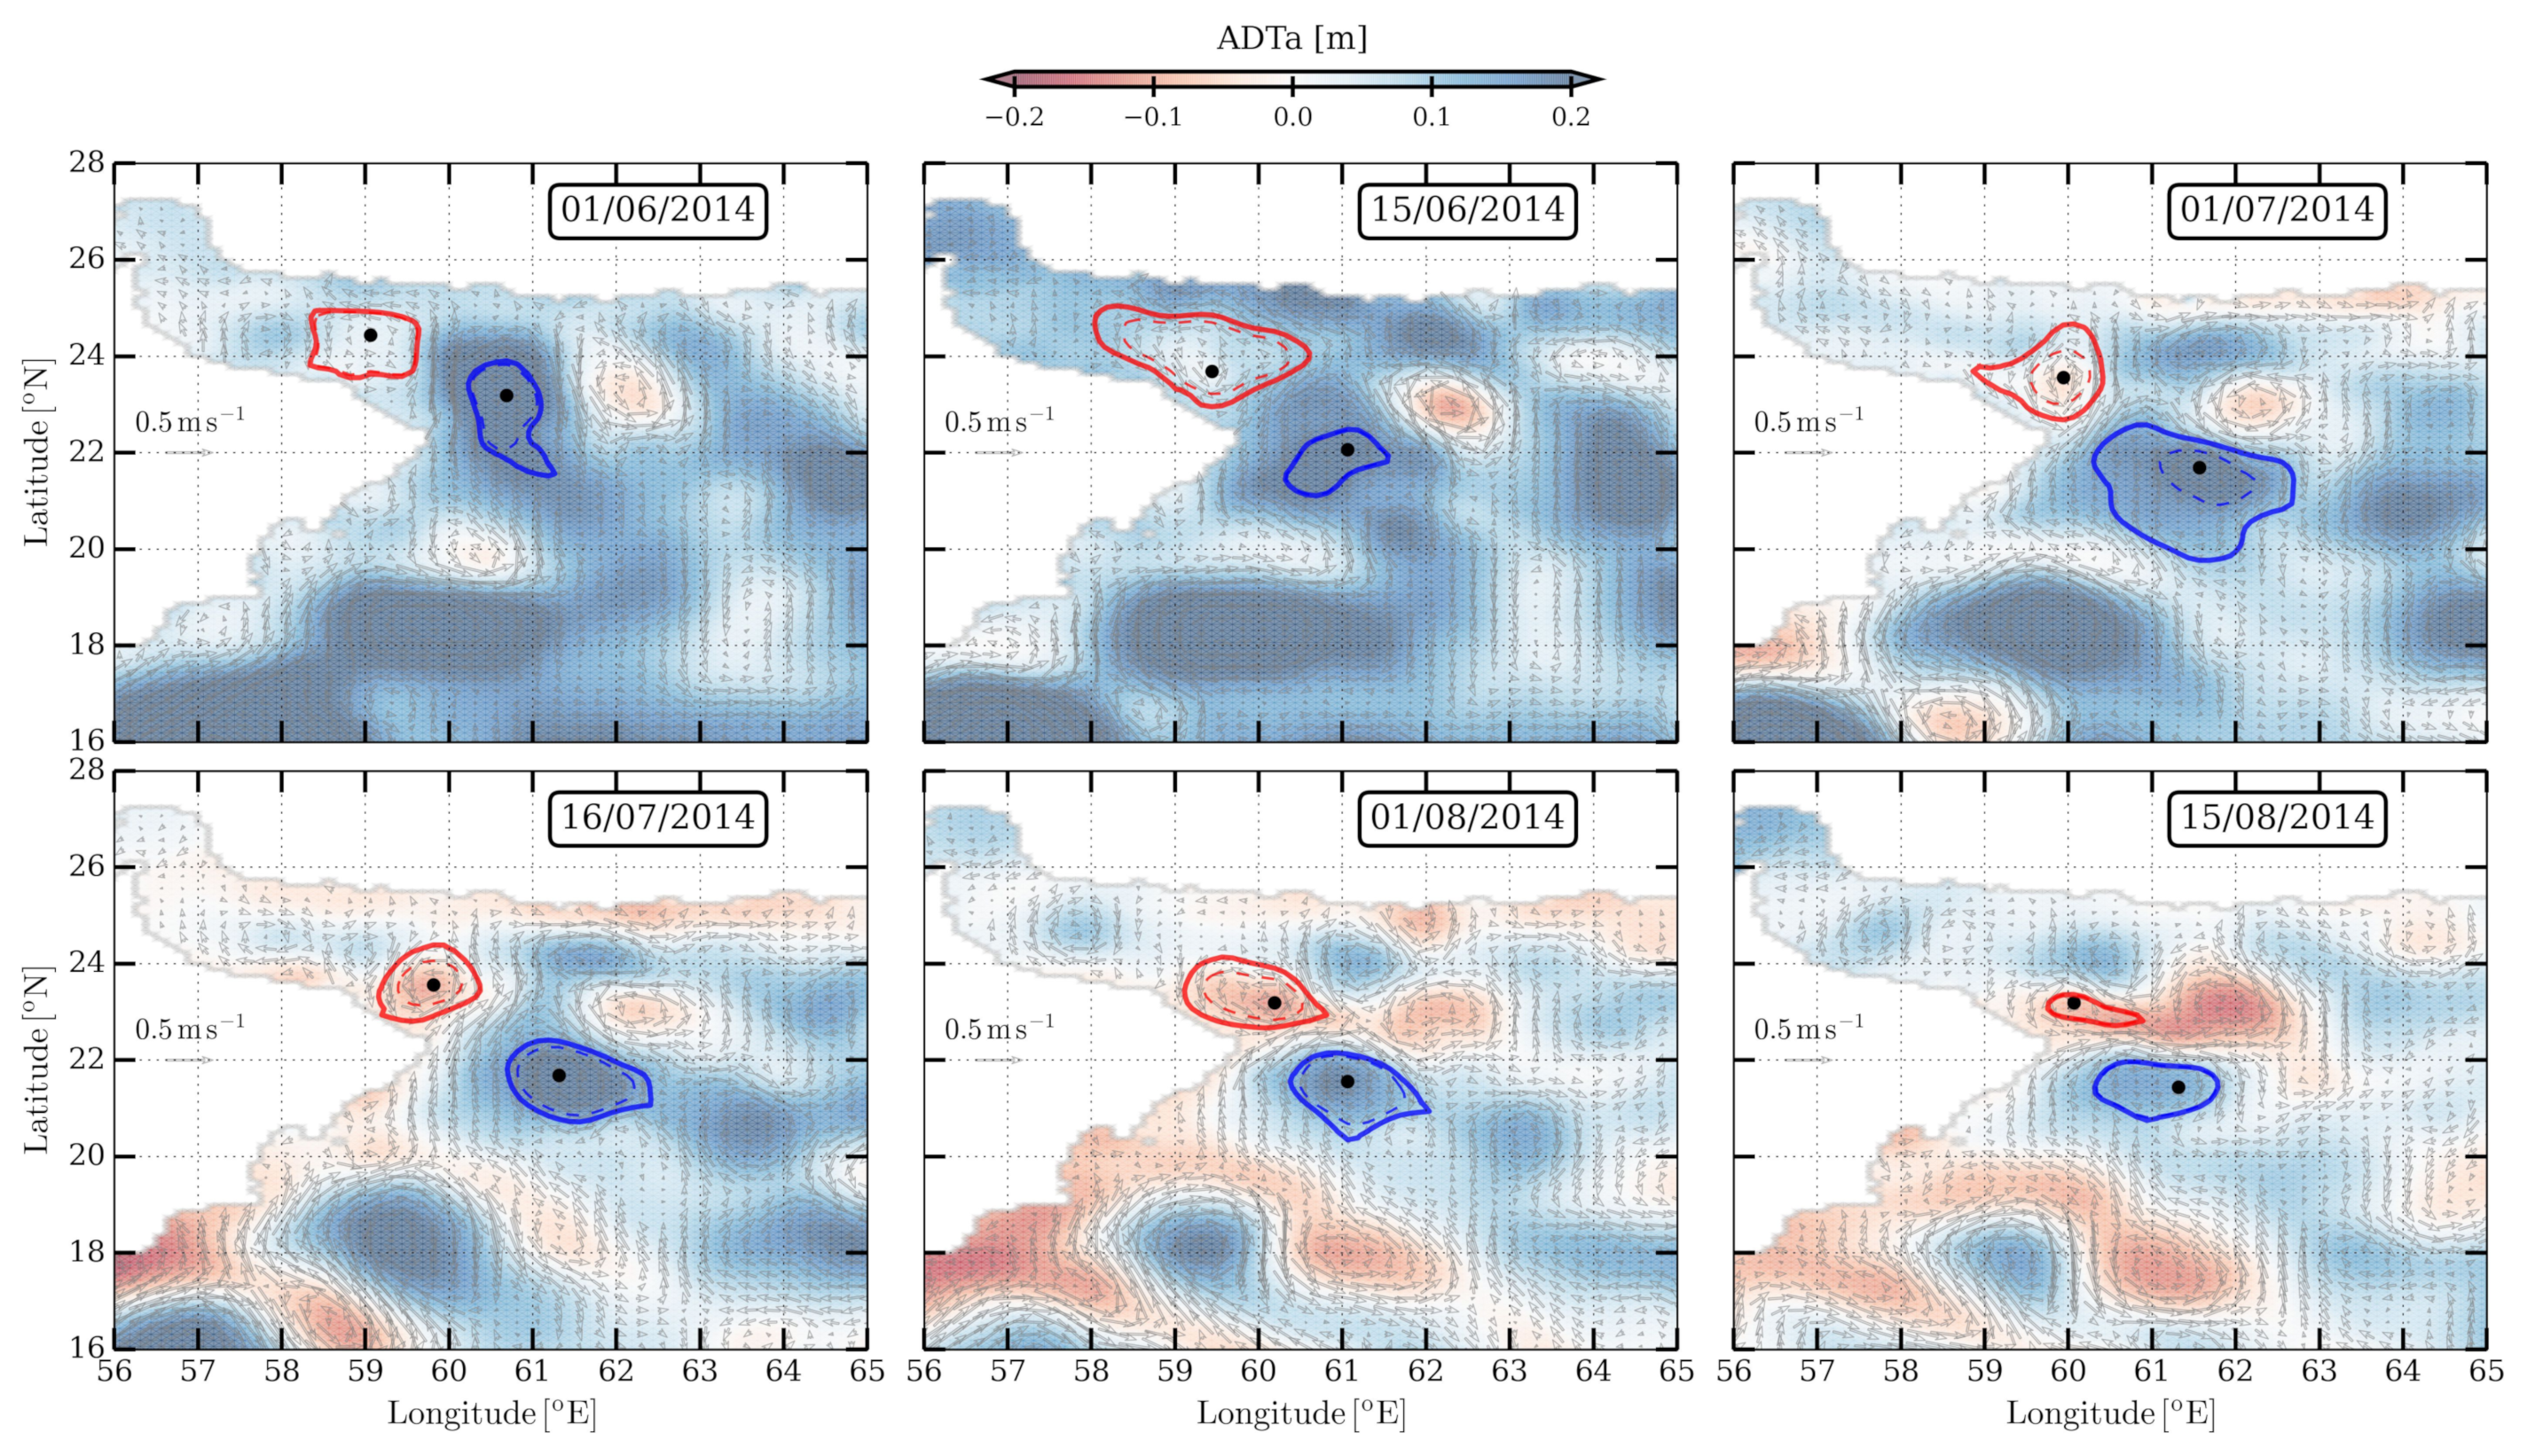
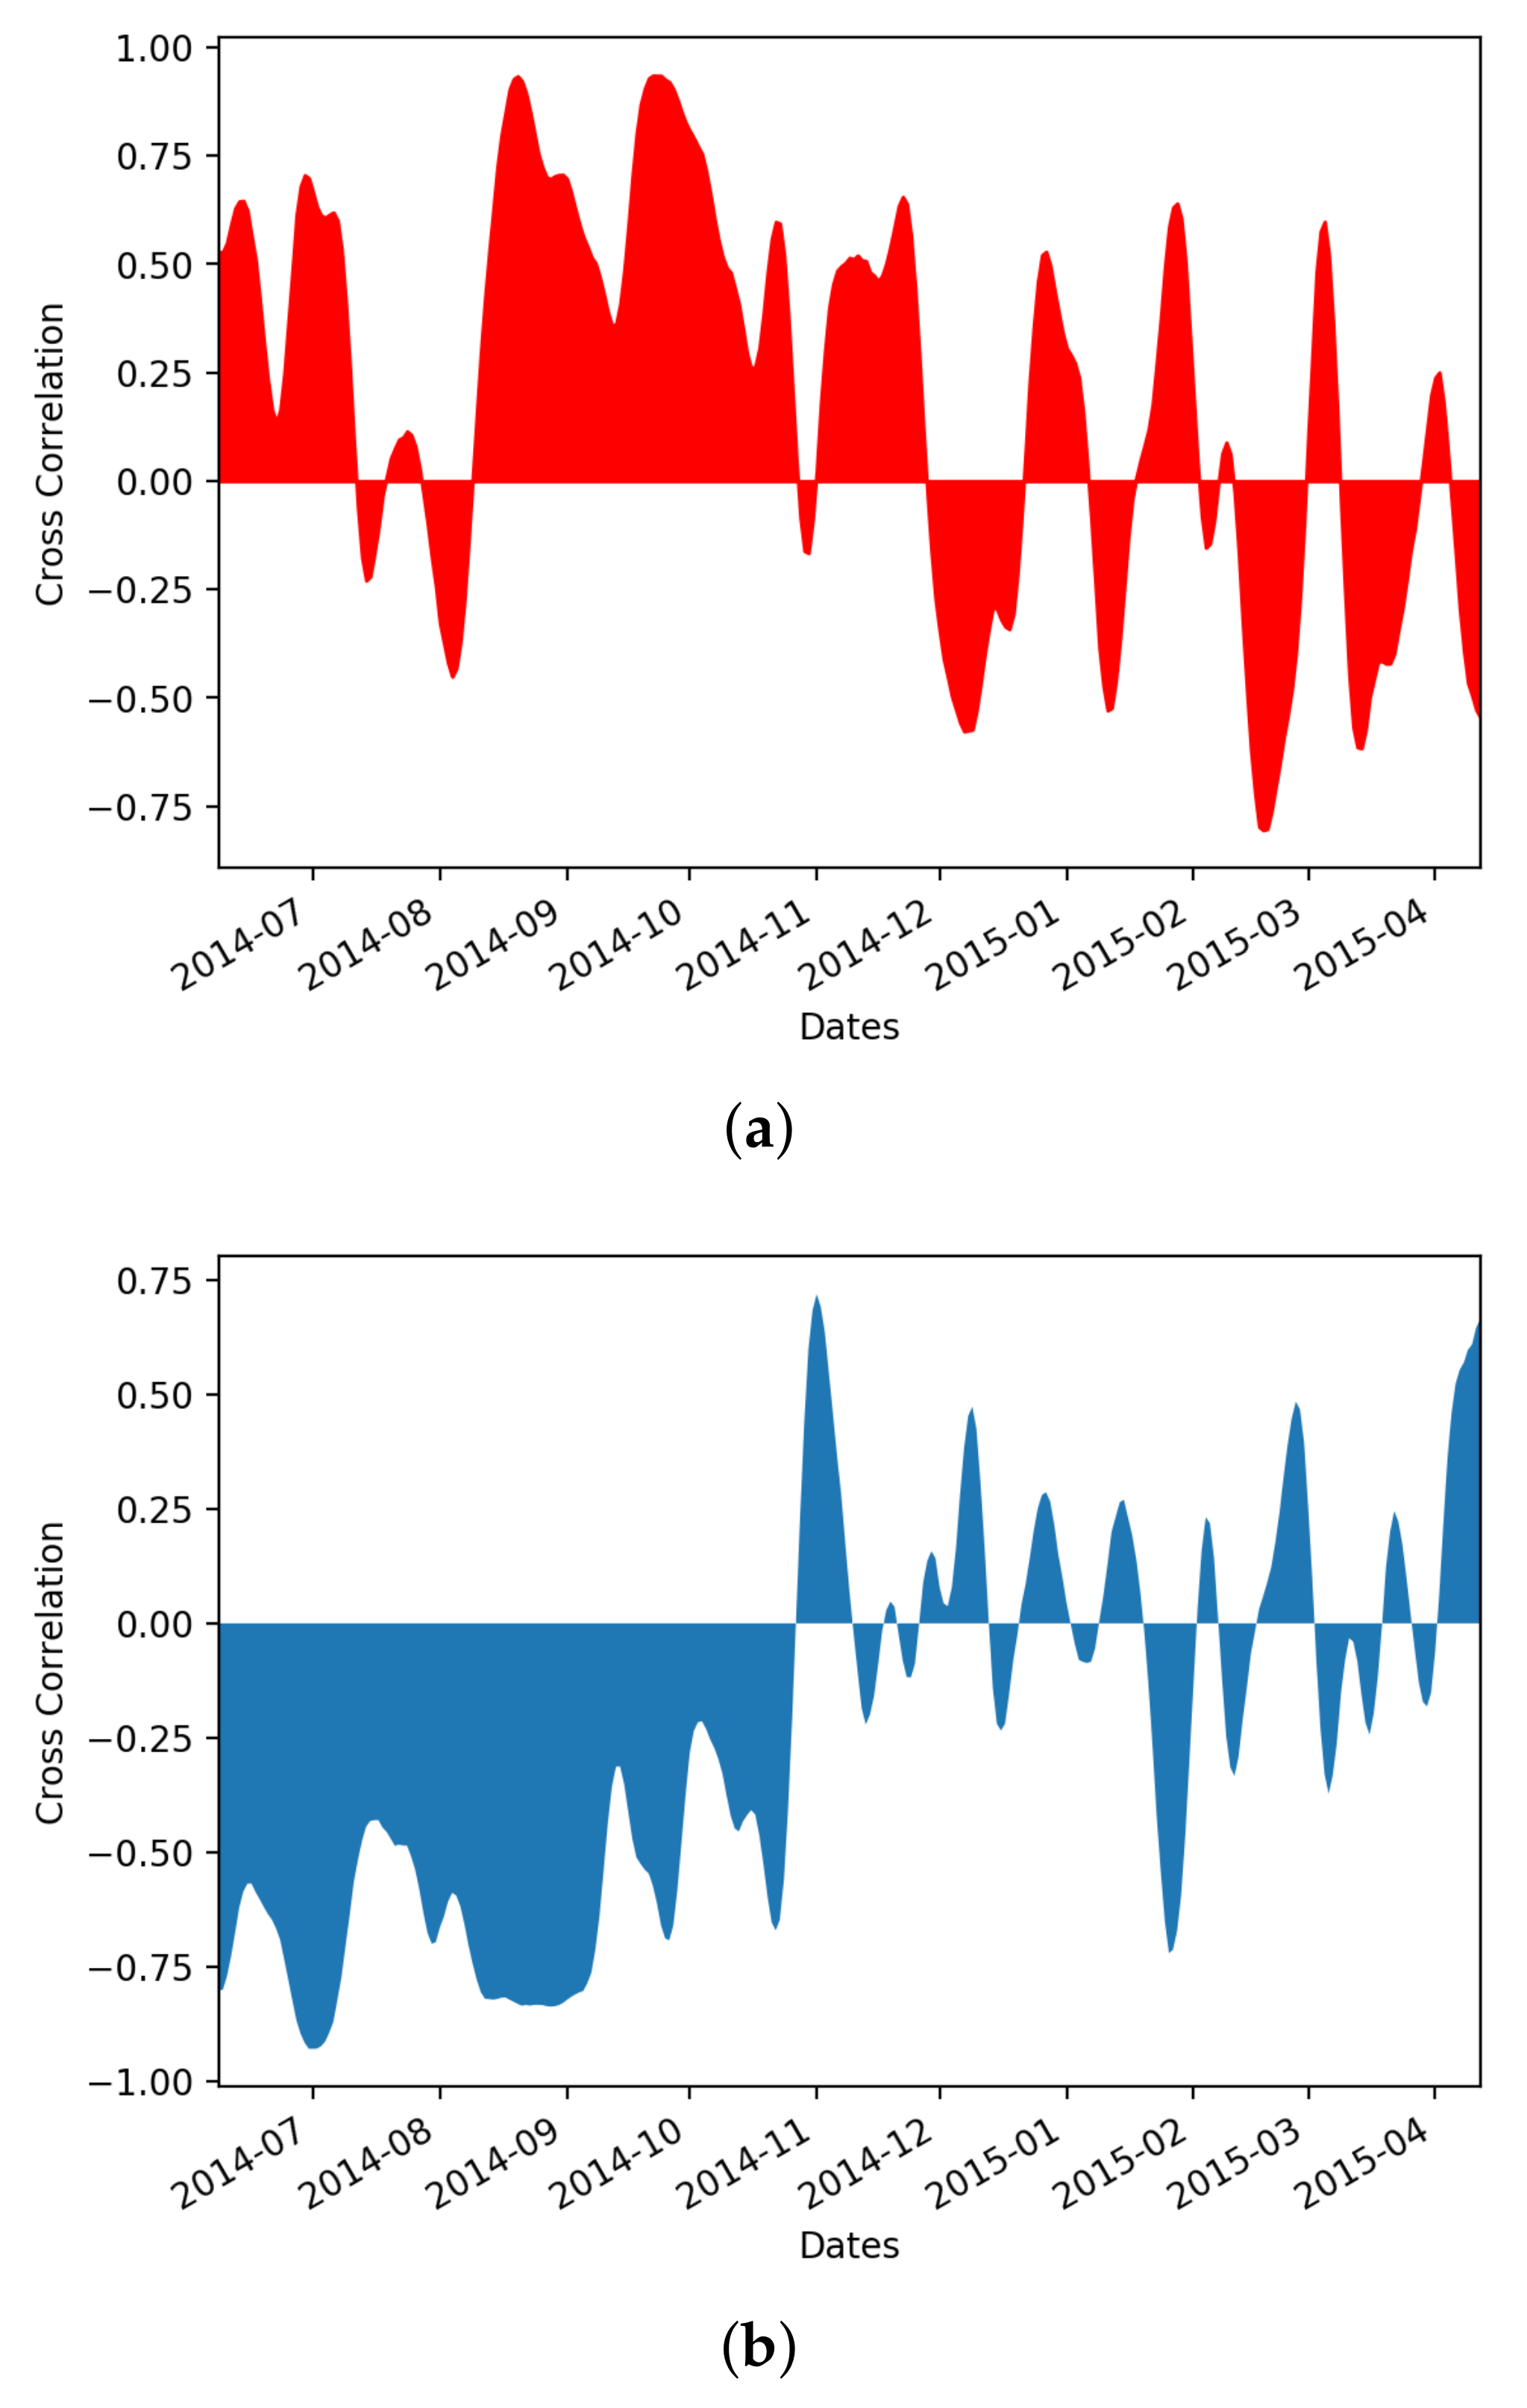
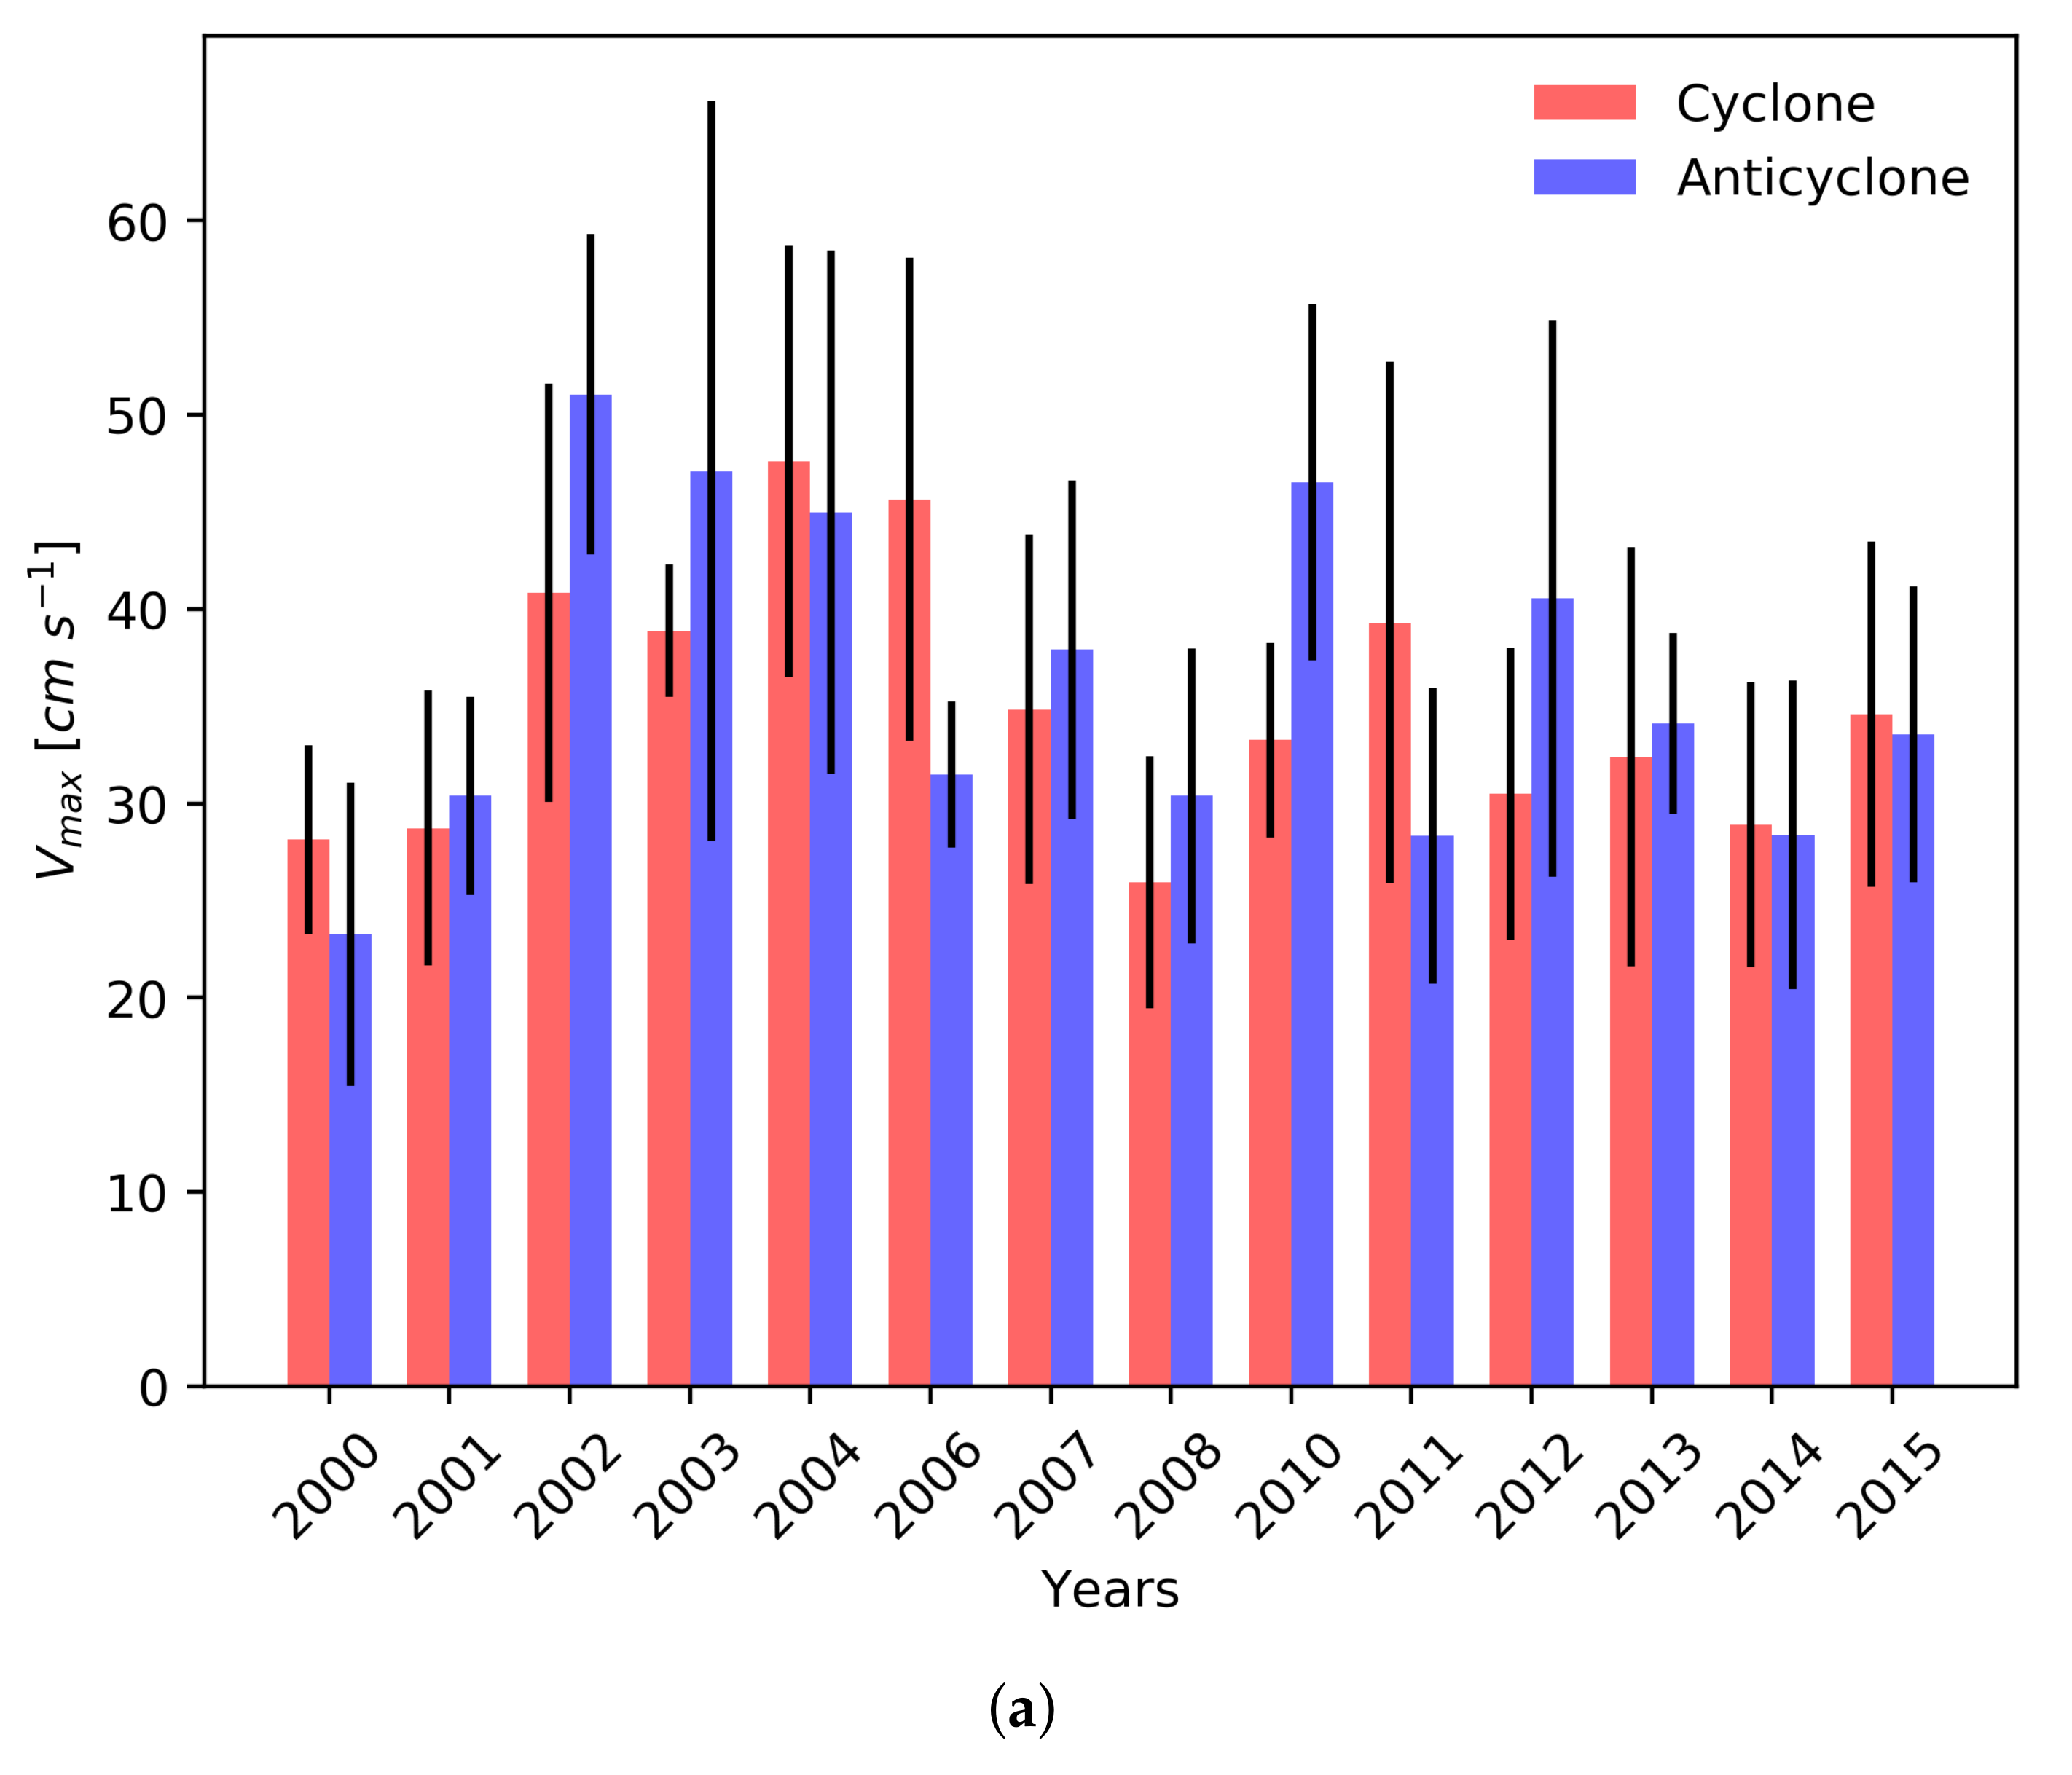
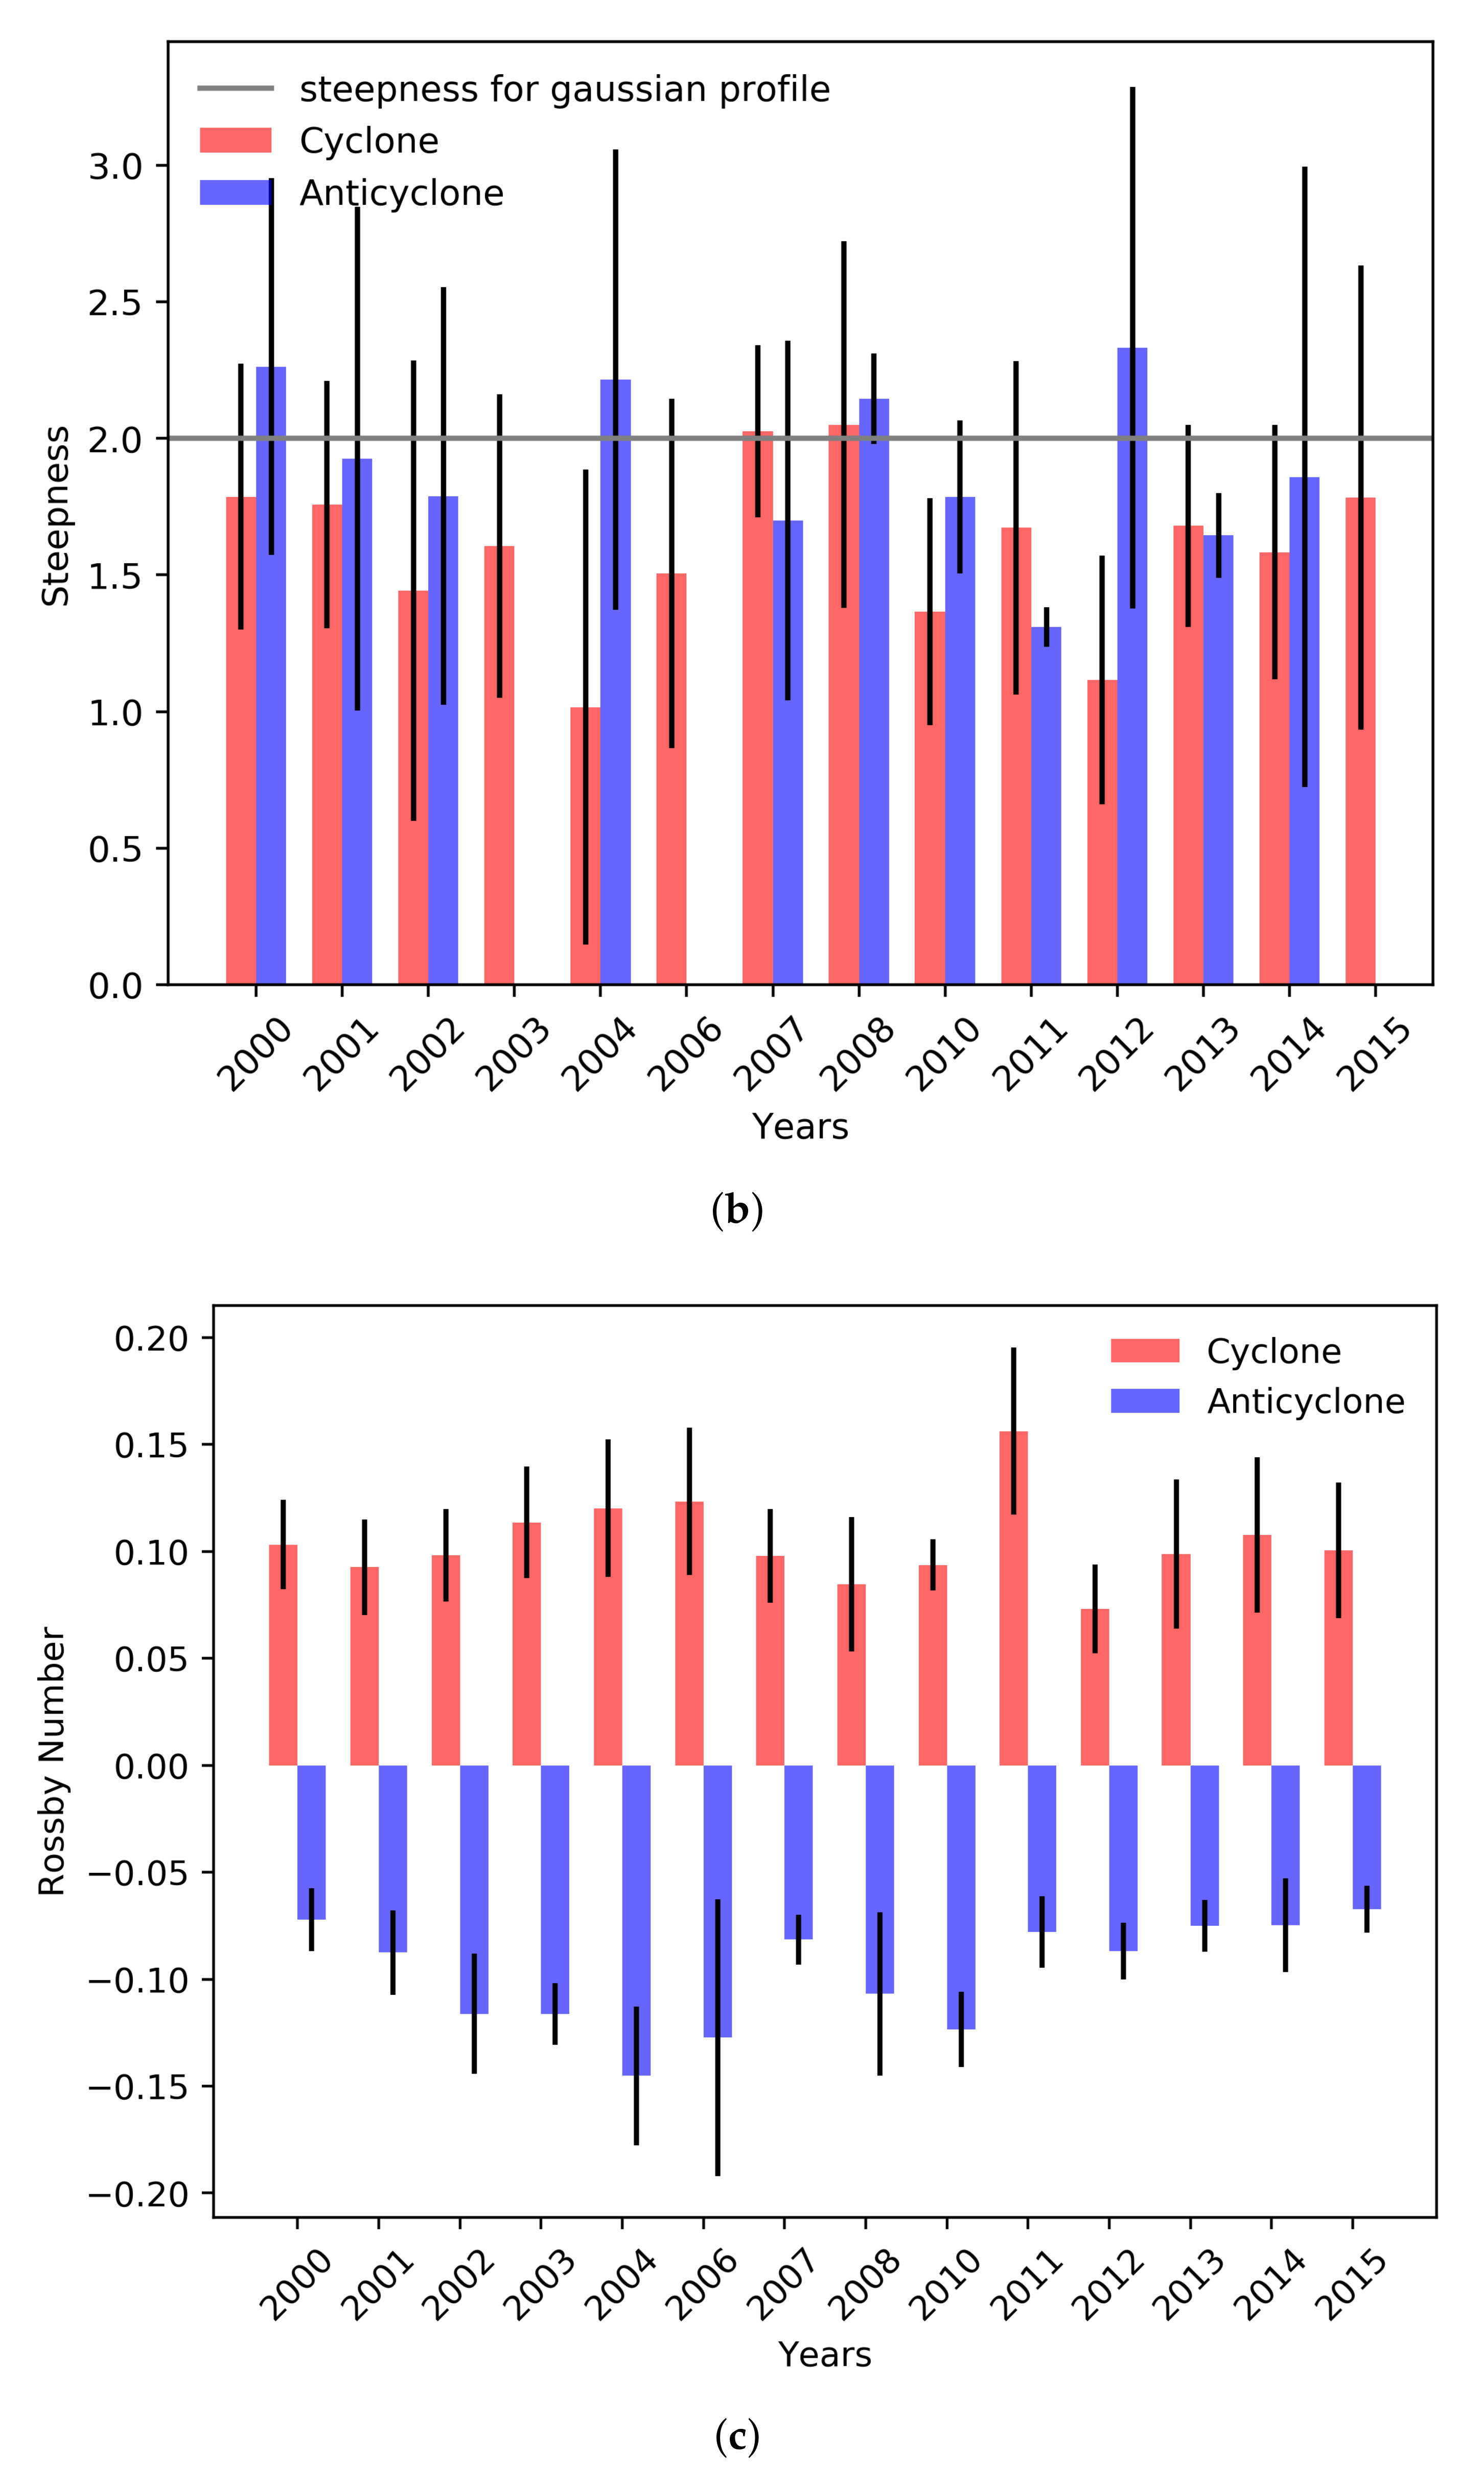
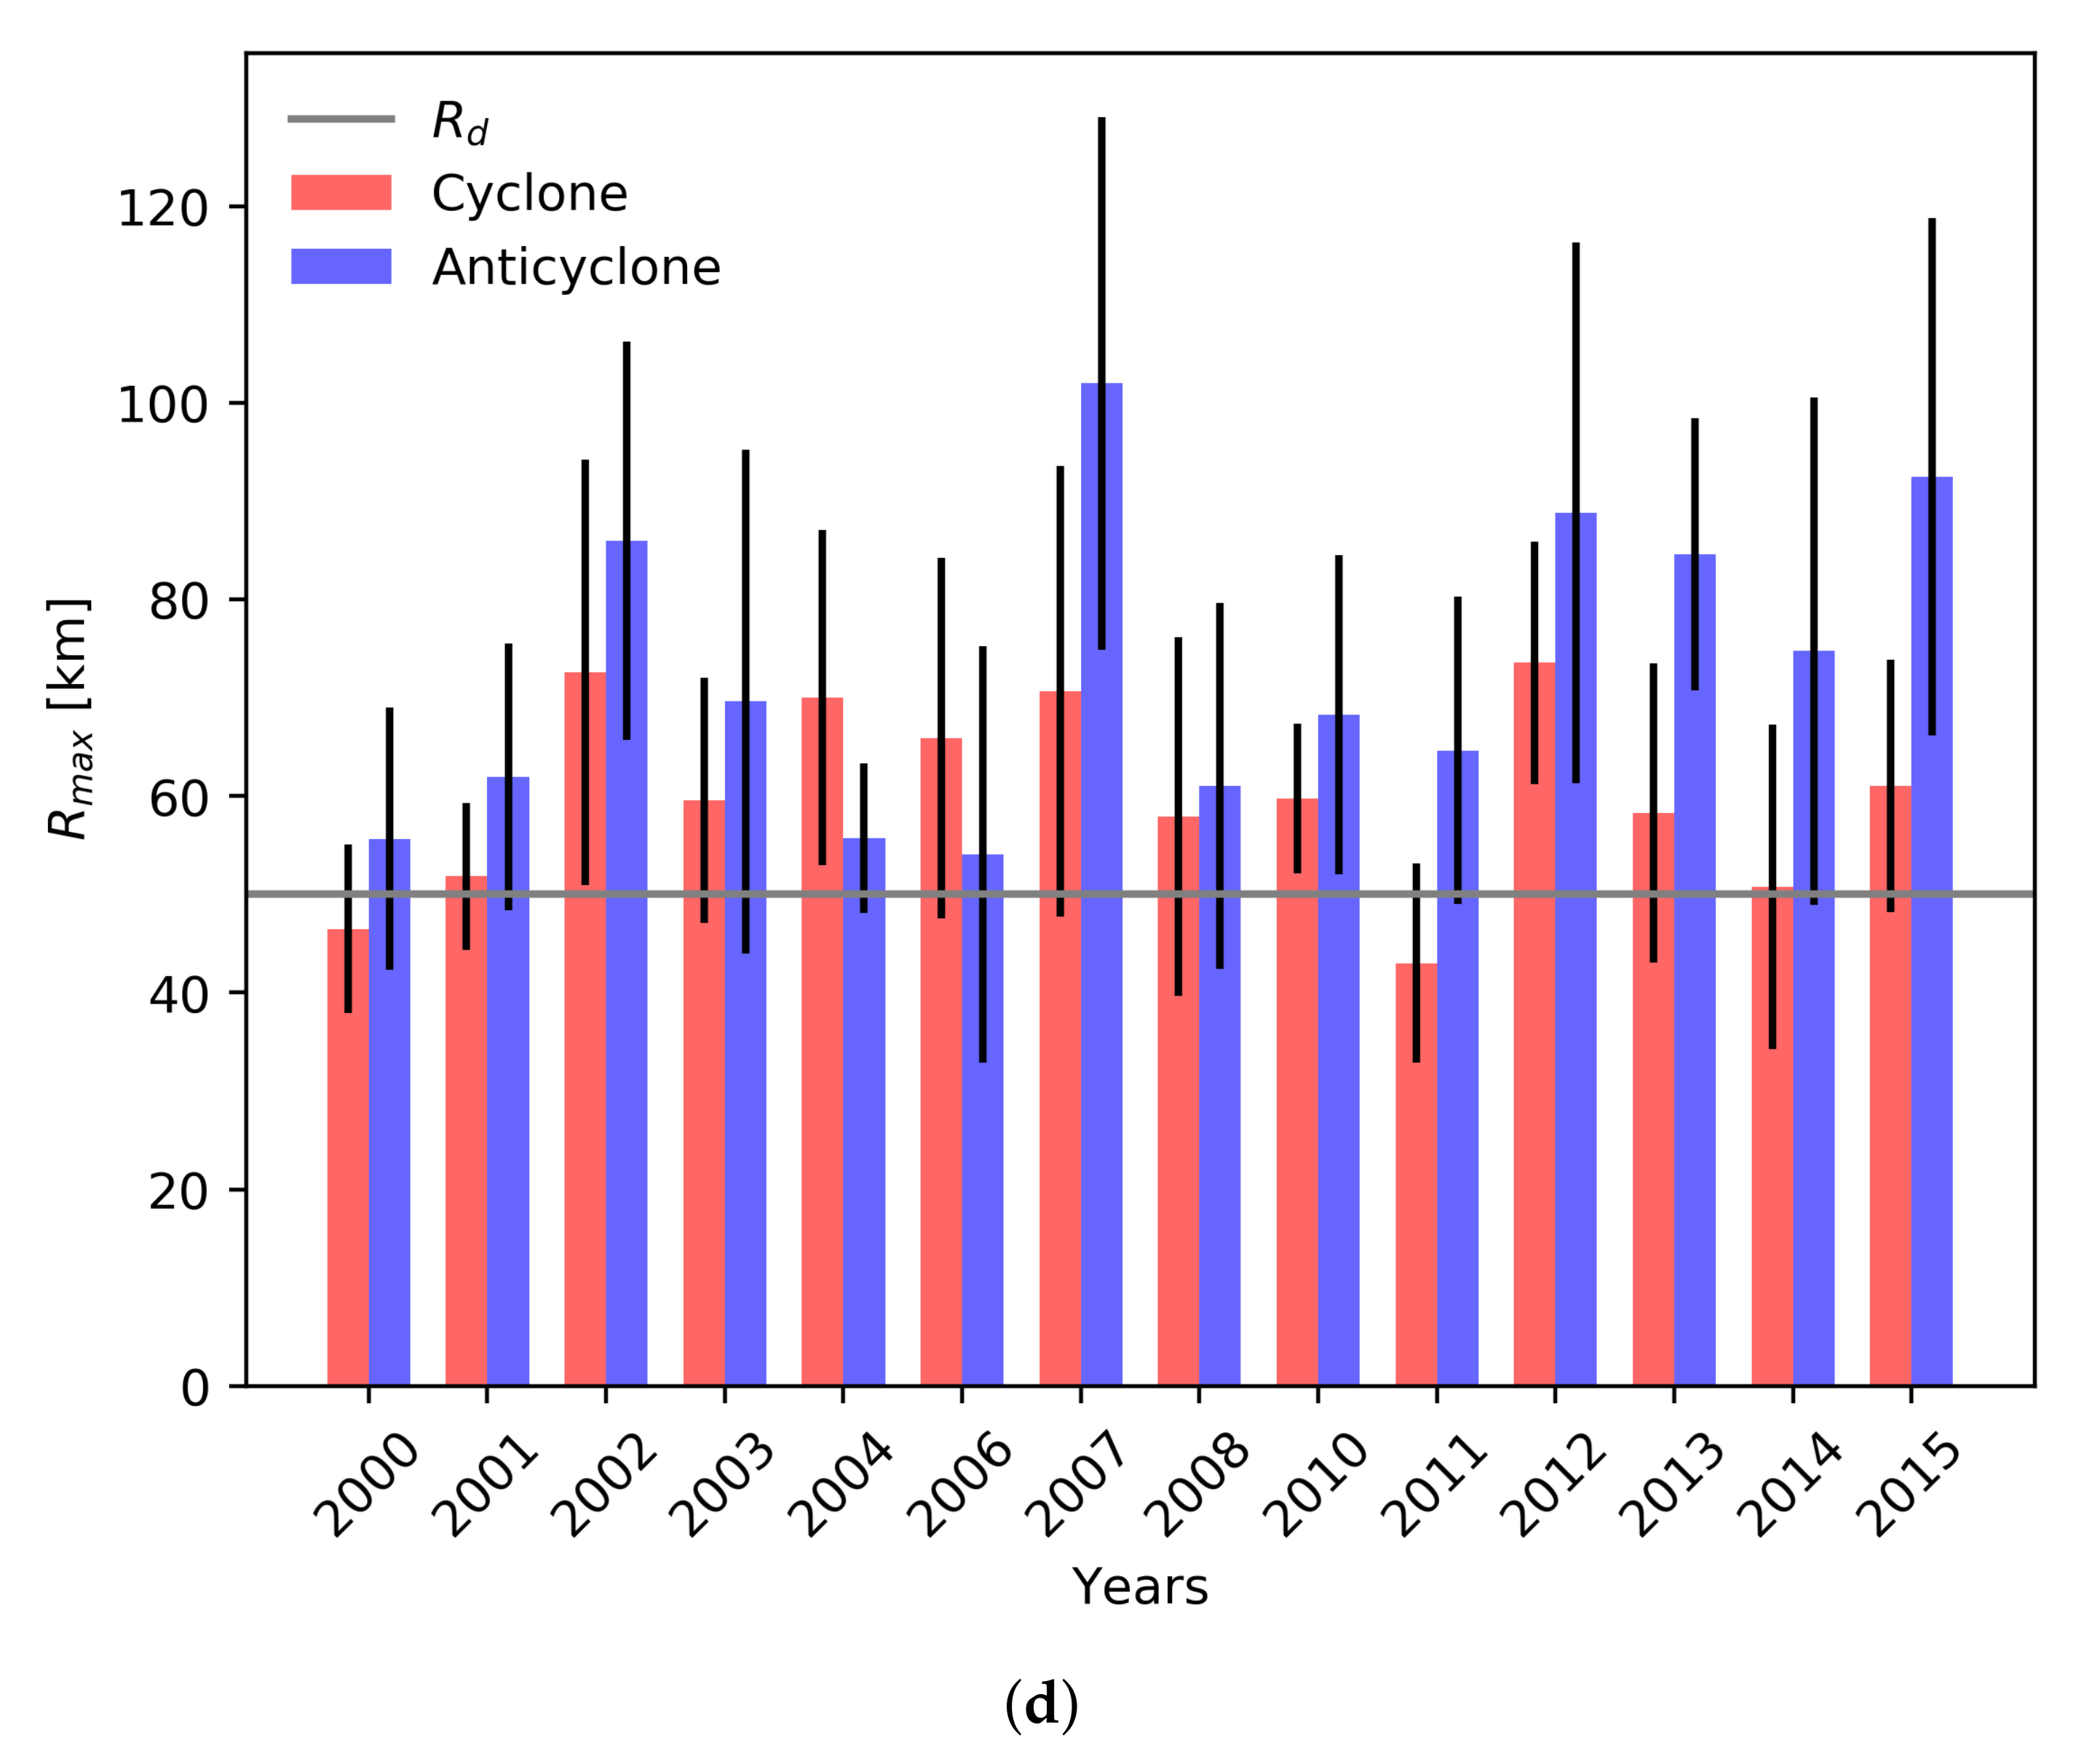
The Ras al Hadd dipole is a recurrent feature composed of two eddies (a cyclone to the northeast and an anticyclone to the southwest) near the southeasternmost cape of the Arabian Peninsula, Ras al Hadd. It appears in the summer monsoon and breaks up in winter. Its position (at the cape or west of the cape) can vary from year to year. Its radius and azimuthal velocity also vary from year to year. We have found that, seasonally, the local wind stress curl intensifies the cyclone and weakens the anticyclone. It is likely that the anticyclone is strengthened both by the circulation at the upwelling front and by an upwelling Rossby wave (like the Great Whirl); a formal proof of this should be searched in forthcoming studies. Interannually, a correlation of the dipole intensity with the regionally averaged wind stress has not been evidenced. However, as Piontkovski et al. [
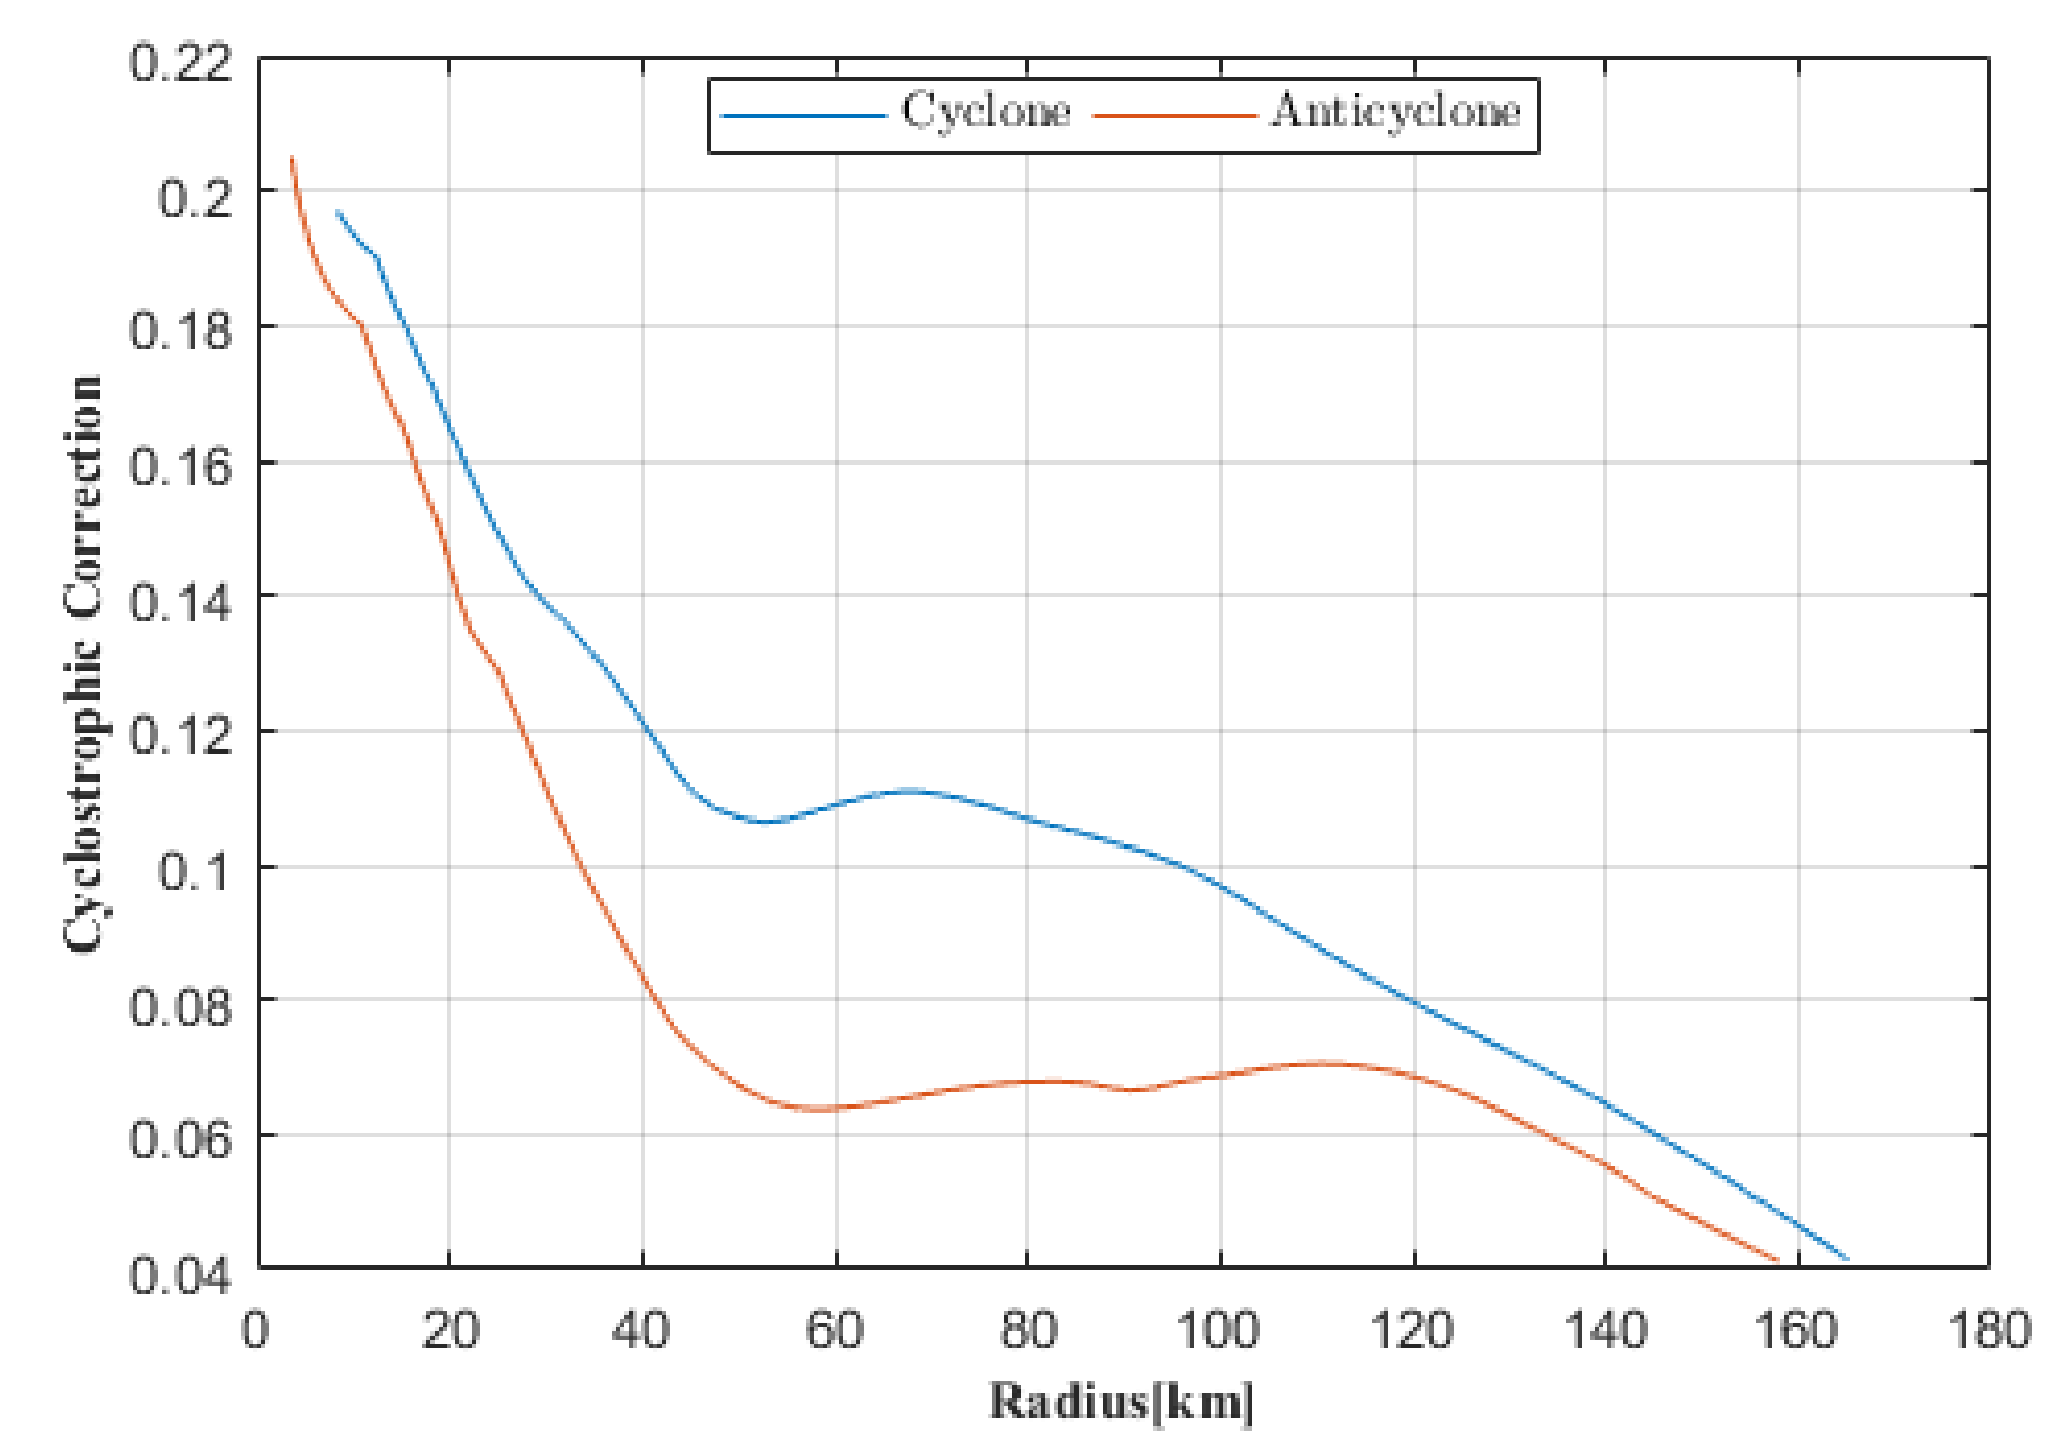
35] indicate, the wind stress is spatially heterogeneous so that a regional average may not represent the local effect. The recurrence of this eddy dipole is also related to the Ras al Hadd front which separates the warm waters of the Gulf of Oman, from the colder water of the upwelling south of Oman. By inspecting the dipole life cycle, it was shown that each eddy evolved via strong interactions with neighboring eddies. The two eddies are fairly wide (100 km) and their Rossby number is small, so that the cyclostrophic correction to geostrophy is small. The radial profile (the velocity steepness profile) also evolves in time with the eddy interactions. It becomes steeper as the eddy periphery is eroded under the influence of neighboring eddies. It becomes smoother as the eddy undergoes few or no interaction and as dissipation slowly acts. On average over the years, the anticyclone is slightly steeper than the cyclone. In most cases, the two eddy velocity profiles are close to Gaussian (with a steepness in the range [2.25, 2.4]). The Burger Number of each eddy ( B u = ( R d R m a x ) 2 ) is of order unity, and the Rossby number is small, which shows that quasi-geostrophic dynamics should apply to model the evolution of these eddies, which are stable [34].
An order of magnitude of the kinetic energy and heat content stored in this dipole can be obtained. Assuming that the azimuthal velocity also decays vertically as a Gaussian, we obtain, from our eddy model, and with the maximal velocities observed, a kinetic energy on the order of:
K = 1 2 ρ π 0 V 0 2 ( r / R ) 2 exp [ 2 ( r / R ) 2 ] r d r 0 exp [ 2 ( z / H ) 2 ] d z
with R = 2 R m a x , V 0 = 2 e V m a x , H = 250 m . For each eddy, this leads to:
K = π 8 K 0 , with K 0 = π R 2 H ρ V 0 2 / 2 .
Taking ρ = 1025 kg/m 3 , R = 5 × 10 4 m, H = 250 m, and V 0 = 1.15 m/s, we have K 10 14 J for each eddy.
Via geostrophy and hydrostatics and assuming a vertical dependence of the azimuthal velocity as exp ( ( z / H ) 2 ) , we obtain:
ρ ( r , z ) = R o / B u ( z / H ) exp ( ( r / R ) 2 ) exp ( ( z / H ) 2 )
where ρ 
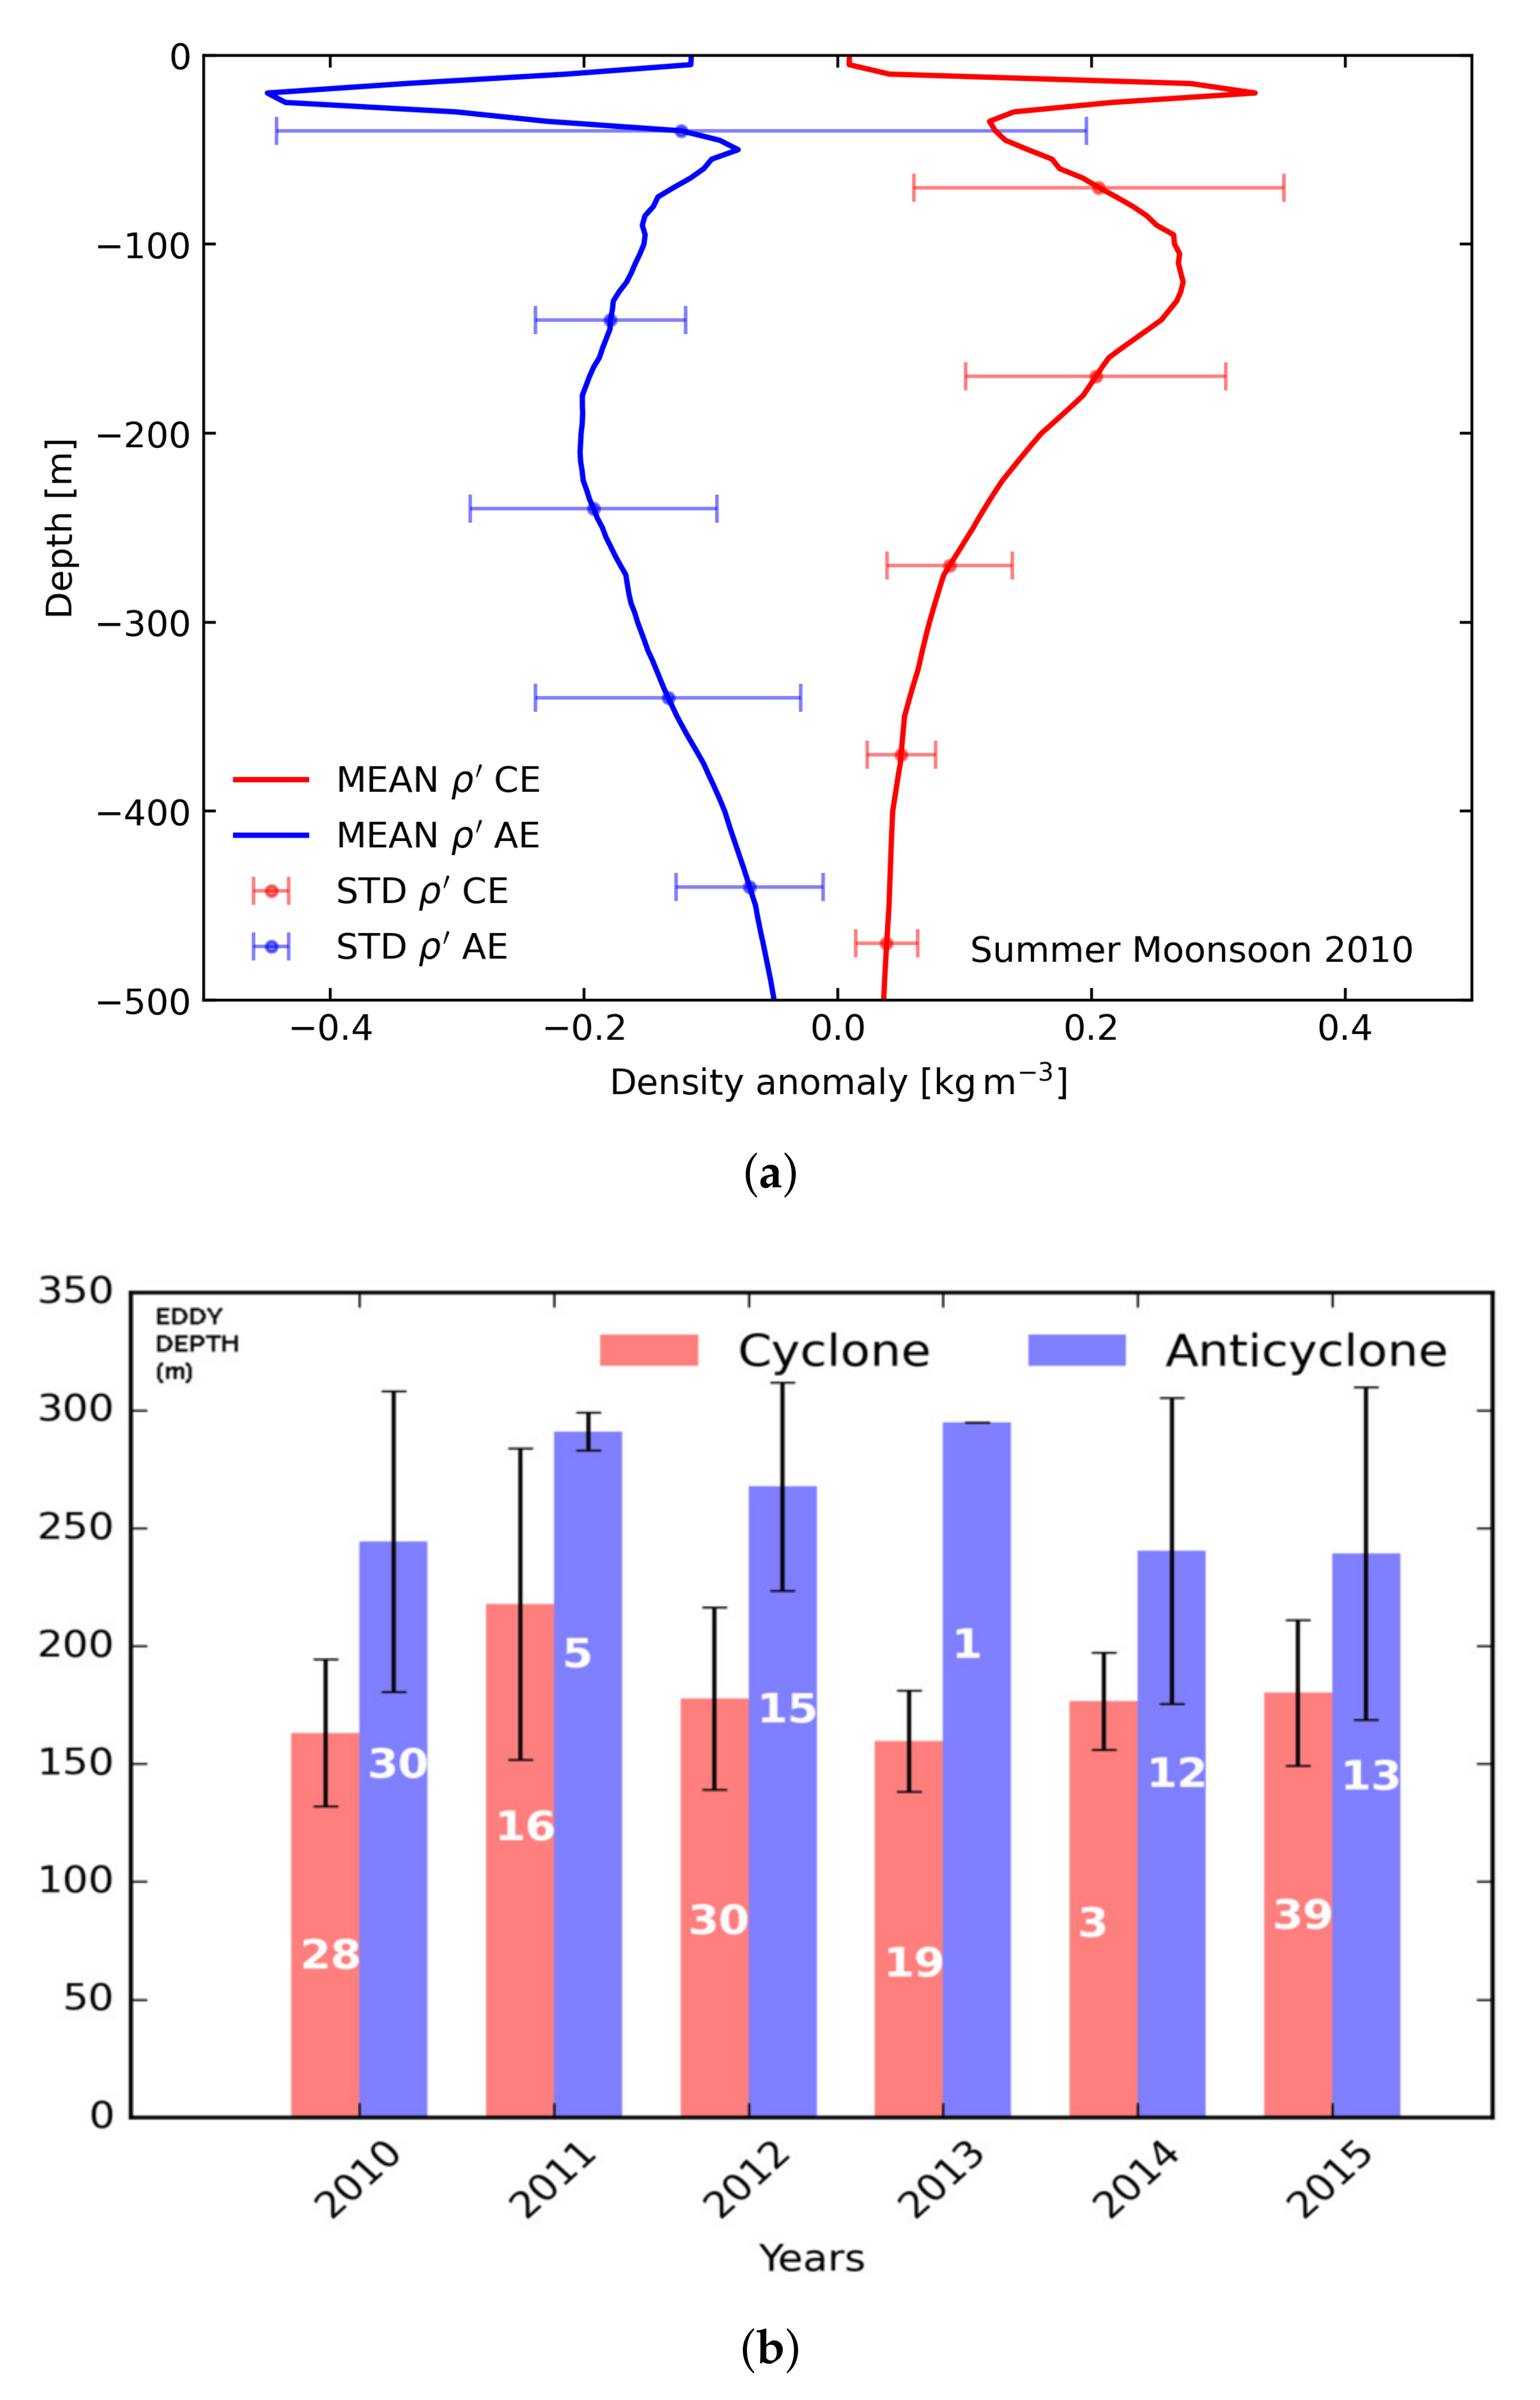
is the density anomaly. Such a vertical dependence can indeed fit the vertical variation of the density anomaly shown in Figure 9a. Via a linear equation of state for the upper ocean, assuming that temperature variations follow density variations, we have:
T ( r , z ) = T 0 ( z / H ) exp ( ( r / R ) 2 ) exp ( ( z / H ) 2 )
where T is the temperature anomaly associated with each eddy, and T 0 = 2 C its maximum. The total heat (anomaly) content of each eddy is therefore:
Q = ρ C 0 r d r 0 d z T
or Q = π M e C T 0 where M e is the eddy mass and C is the heat capacity of seawater. This yields Q = 2.85 × 10 19 J for each eddy.
Both values of eddy kinetic energy and of heat content are one order of magnitude smaller than those of the Gulf Stream rings. However the lifetime of the Ras al Hadd dipole (about 6 months) renders its contribution to the regional budgets of eddy kinetic energy and heat non negligible. Its heat fluxes towards the atmosphere should be evaluated in further work.
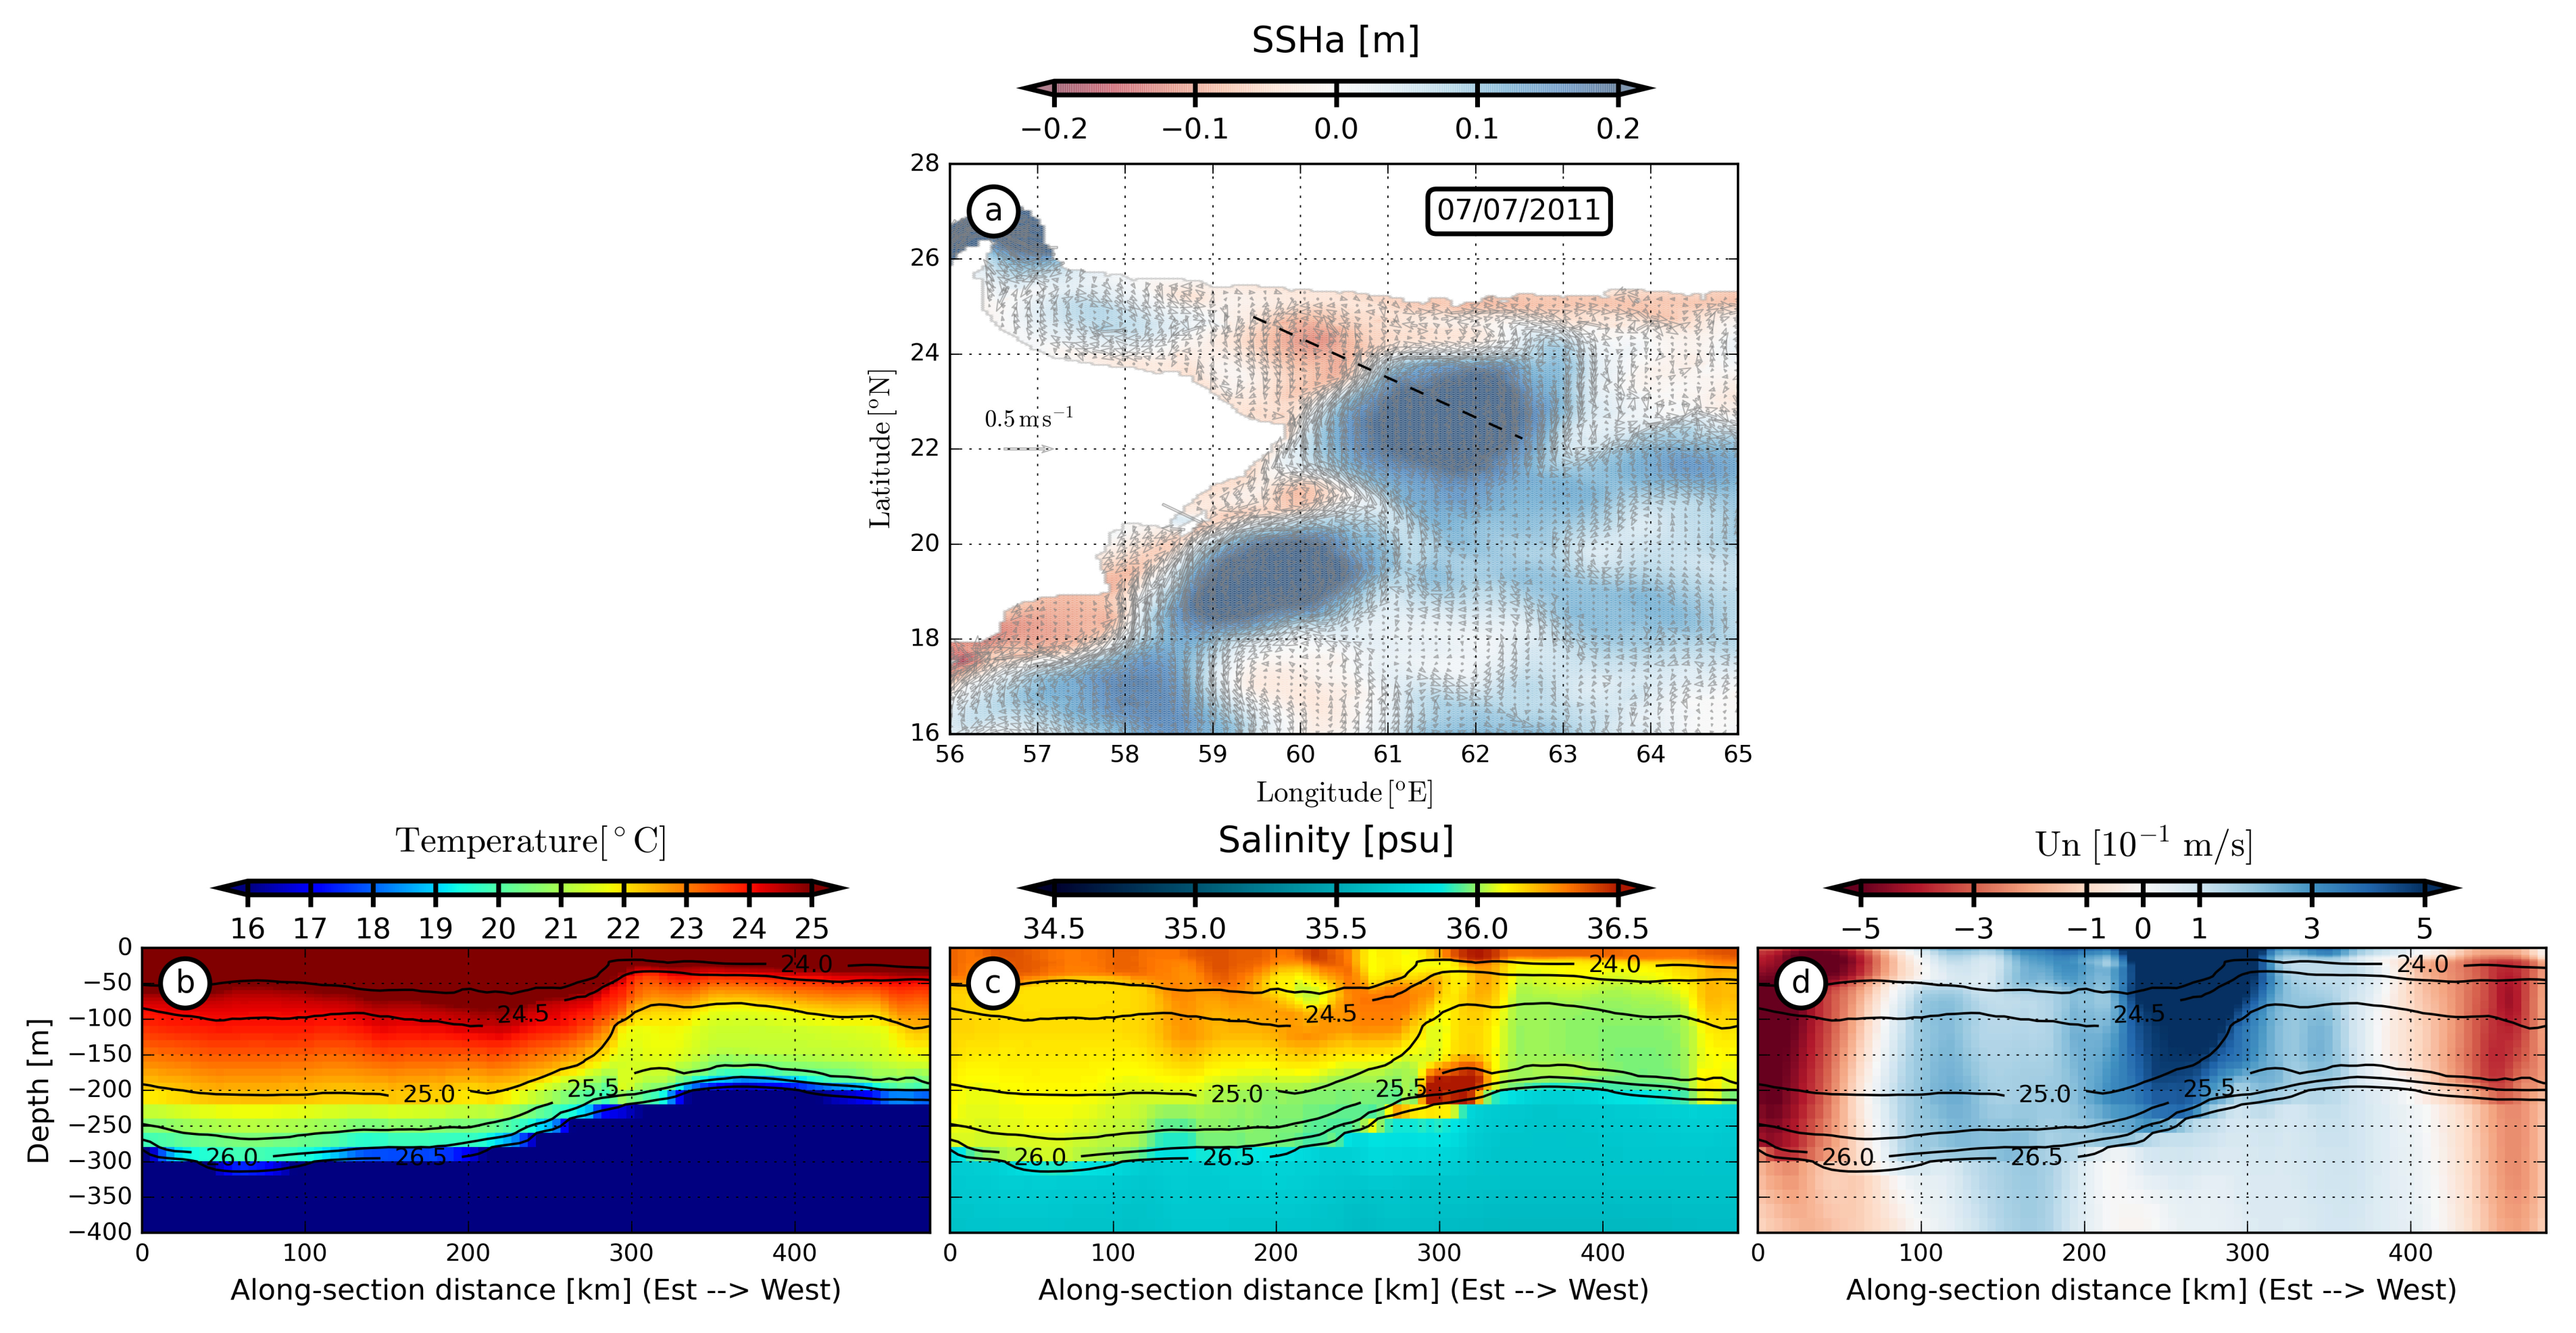
Furthermore, the Ras al Hadd eddies have a dynamical influence on deeper water masses, though the azimuthal velocity of these eddies is intensified in the upper 250 m of the water column. This surface intensification is due to at least two mechanisms: The stronger energy of the wind forced ocean above the thermocline, and the presence of a heterogeneous water mass at depth (PGW), which creates a strong pycnocline, attenuating the vertical penetration of the energy. The values of the azimuthal velocity for both eddies found in the present study are comparable with those measured at sea (with ADCP’s) by [26]. The anticyclone spins slightly faster than the cyclone below a 250 m depth. However both eddies have a noticeable velocity at depth (about 0.25–0.3 m/s), which can influence the subsurface path of the PGW outflow in the region [25]. As noted by [25] and by [1], the strong surface-intensified eddies of the Gulf of Oman and of the Arabian Sea pull PGW fragments away from the coast. This has been modeled hydrodynamically by [19,20]. The surface eddies distort the alongshore outflow and also creates an unstable boundary layer vorticity sheet, which detaches offshore and breaks into subsurface submesoscale eddies containing PGW. These small eddies play a role in the transport of heat and salt from the Gulf of Oman to the Arabian Sea.

5. Conclusions

The objective of this paper was the description of the seasonal life cycle and of the inter-annual variability of the two eddies composing the Ras al Hadd oceanic dipole. Using altimetric data and eddy identification and tracking software (AMEDA), we were able to determine the characteristics of the two eddies composing it, for a year (2014–2015). We determined their origin and drift from their initial position to their final junction near Ras al Hadd. We showed the importance of eddy-eddy interactions during the lifetime of the dipole. The evolution of the dipole was also driven by the local wind stress curl, by the upwelling circulation, and by the incoming Rossby waves.
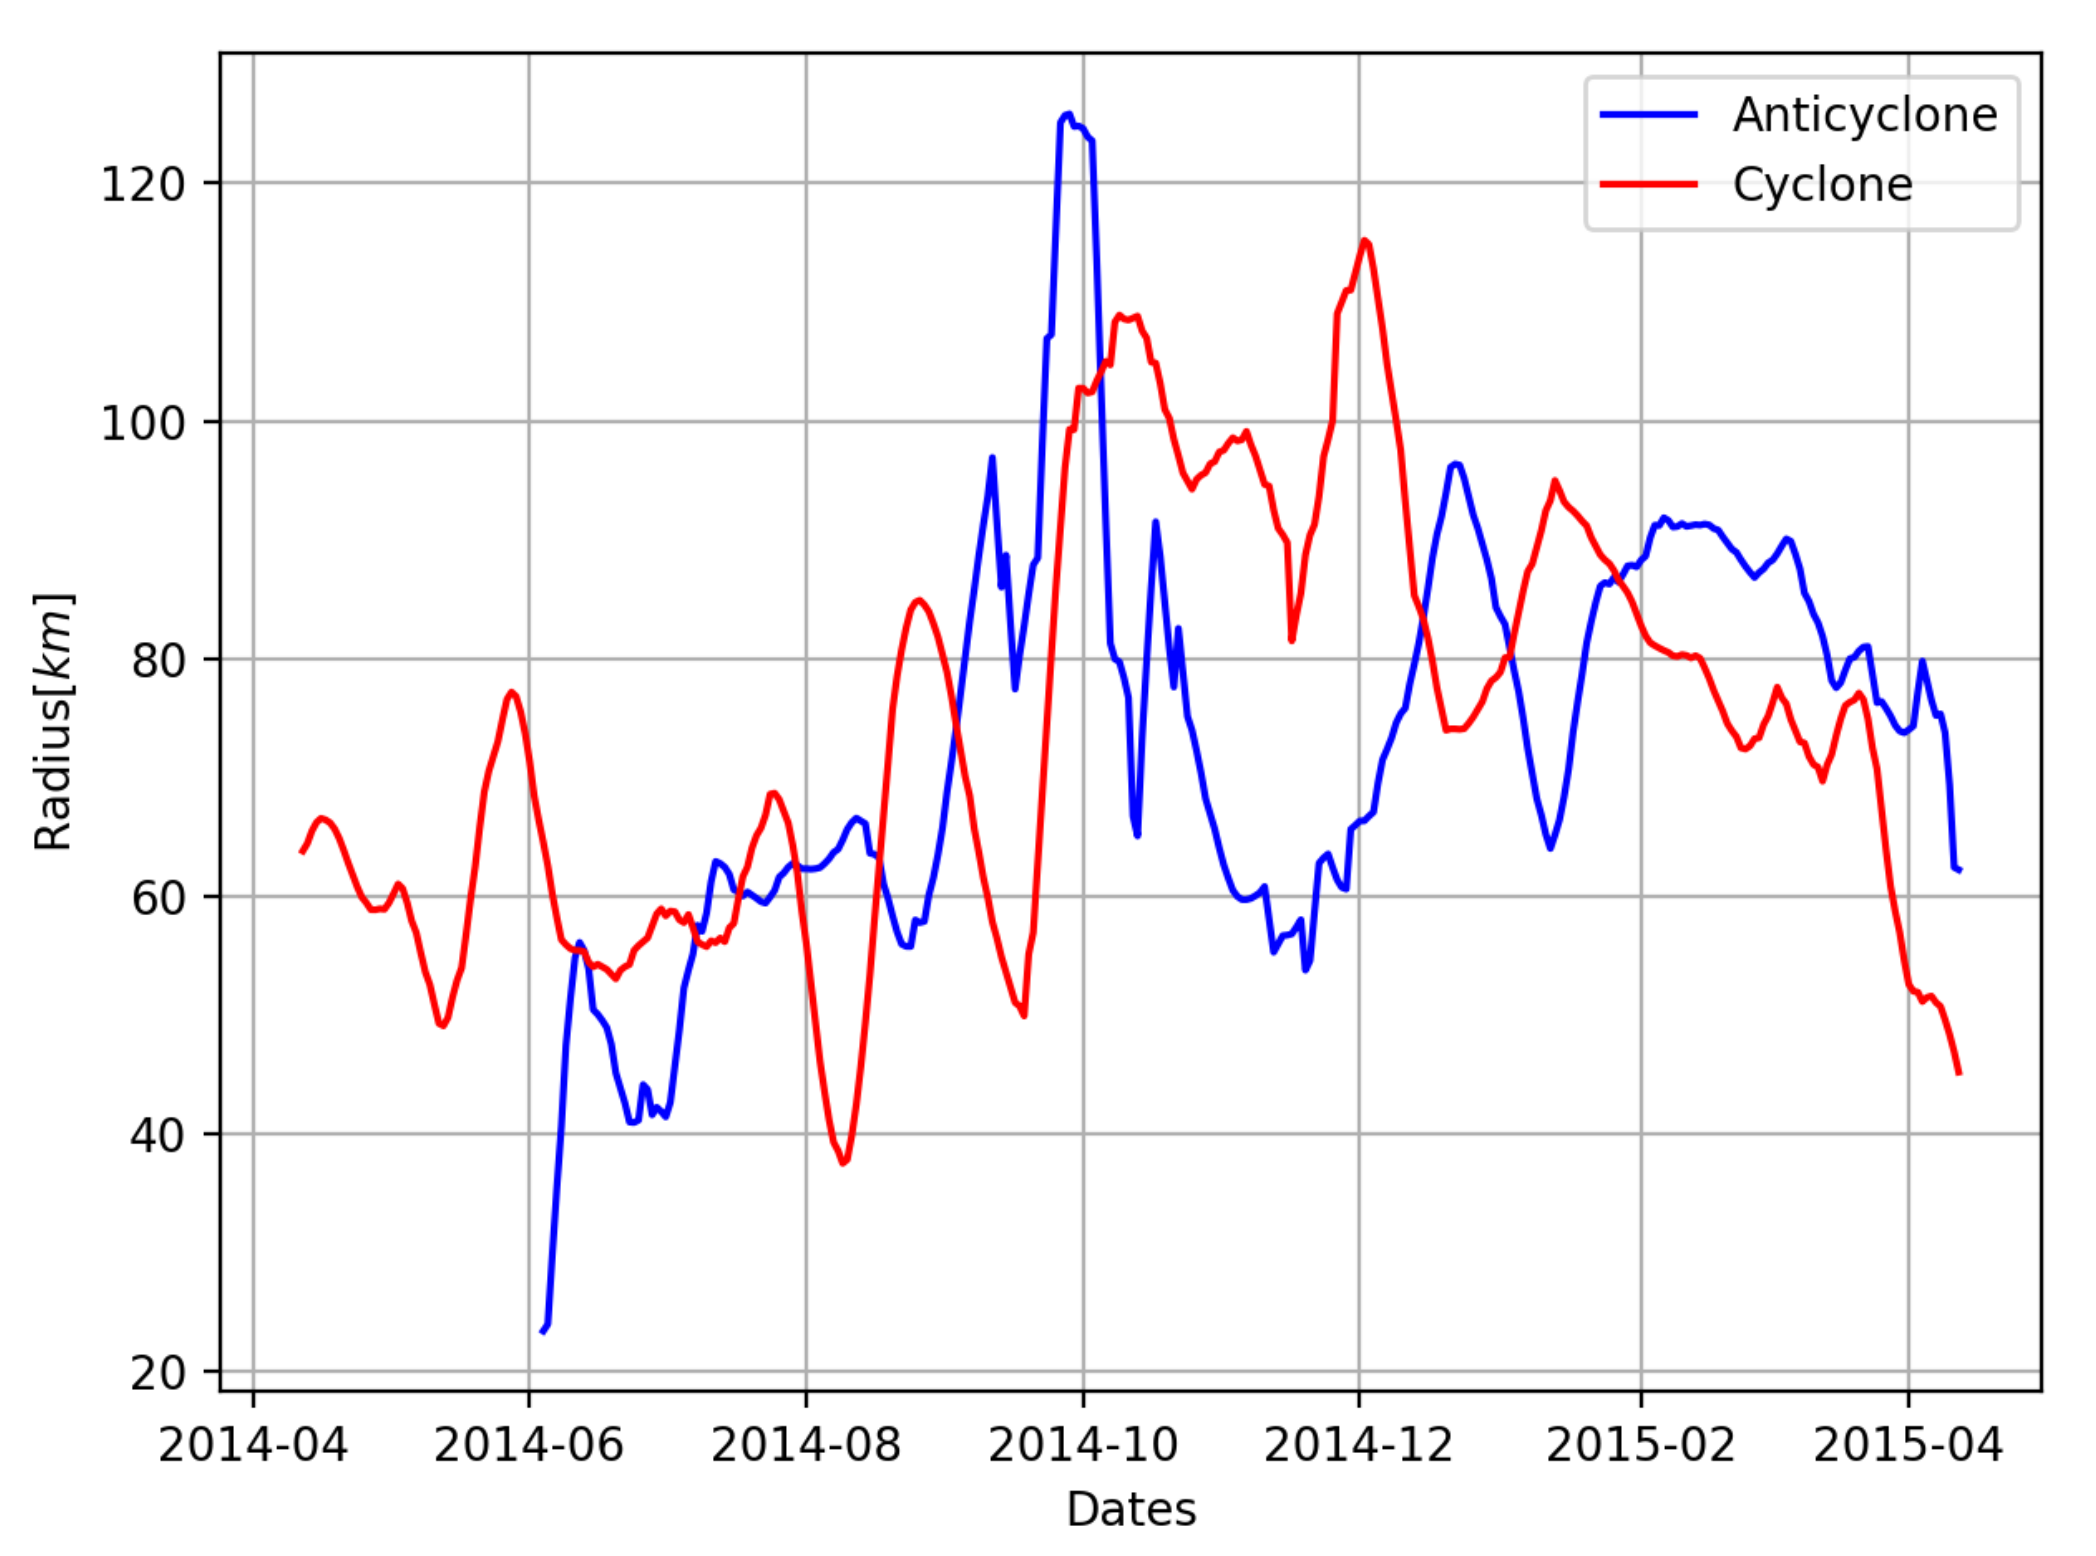
On a longer period (about 15 years), we noted that the anticyclone was larger than the cyclone of the Ras al Hadd dipole. Though the maximal internal velocities could reach 50 cm/s, in particular for the anticyclone, the cyclostrophic correction could be neglected as the dynamical Rossby number did not exceed 0.3. This is due to the large horizontal size of the eddies. On average, the two eddies have a Gaussian radial profile of velocity, but the steepness of this profile varies with the interactions undergone by each eddy. The vertical structure of both eddies is intensified above the layer of the Persian Gulf Water but influences it dynamically.
This leads us to propose process studies to deepen our understanding of this oceanic dipole. The quasi-geostrophic approximation holds for both eddies and this could be used first to perform a stability analysis of this dipole, with respect to velocity profile steepness, to the Burger number, assuming that the cyclone and anticyclone of the RAH dipole are isolated. Secondly, the interaction of this dipole with neighboring eddies and with the Rossby waves originating from the eastern boundary of the Arabian Sea deserves a specific analysis. Finally, the dipole interaction with the atmosphere should be assessed in detail, in particular for the heat and freshwater exchanges.

Author Contributions

Conceptualization, X.C., C.D.M., A.S. and A.A.; methodology, B.L.V., P.L. and A.S.; software and validation, B.L.V. and M.M.; analysis and investigation, A.A., C.D.M., M.M., P.L. and X.C.; writing—original draft preparation, A.A.; writing—review and editing, X.C. All authors have read and agreed to the published version of the manuscript.

Funding

This research was funded by SHOM contract HYCOM to UBO.

Data Availability Statement

The data sources are specified in the text.

Acknowledgments

This work is a contribution to the PHYSINDIEN research program.

Conflicts of Interest

The authors declare no conflict of interest.

Appendix A. Representation of the Ras al Hadd Dipole in the HYCOM Model

To validate the ability of the HYCOM model to represent the Ras al Hadd dipole, we present here snapshots of the sea surface height anomaly in the model compared with the AVISO MADT anomaly. The dipole location (near Ras al Hadd) was well represented in HYCOM model. A small difference (∼5–10 cm) in the amplitudes of each eddy of this dipole is observed. The HYCOM model represents a more intense dipole compared to AVISO data. Differences may be due to the different horizontal resolution of HYCOM and AVISO, to the HYCOM model atmospheric forcings, or to the parameterization of momentum or heat diffusion in the model. Still, HYCOM reproduces well the known location and radius of the cyclone and anticyclone of the Ras al Hadd dipole. It also provides a proper positioning and extent of the upwelling. Finally, the surrounding eddies in the model and in the data have similar sizes and intensities. At deeper levels (in particular for the Persian Gulf outflow), the HYCOM model has been validated by [24]. Thus we can properly use the HYCOM model results in this region.
Figure A1. Snapshots of the ADT anomaly (AVISO) (top row). Black red and blue solid contours represent the external shape (closed contour) of the cyclone and anticyclone, respectively. The dashed contours characterize the inner core of these eddies. The black dot represents their centers. Snapshots of the SSH anomaly from HYCOM model (bottom row).
Oceans 02 00007 g0a1

Appendix B. Details for Specific Years 2005 and 2009

In this appendix, the Ras al Hadd dipole locations and intensities are represented for the two specific years 2005 and 2009.
In our study, this dipole is considered to be long-living, intensified in summer monsoon and located near Ras al Hadd. Another important criterion for this dipole is the existence of the jet of Ras al Hadd between the cyclone (north) and anticyclone (south). This jet is also considered intense in summer monsoon season.
Figure A2. (a) Absolute Dynamic Topography anomaly for the 2005 year (snapshot); blue and red contours are for anticyclones and cyclones respectively, dashed contours are for eddy core, and solid contours for the last closed contour. The black dot represents the anticyclone and cyclone instantaneous center position. The solid red and blue trajectories are for cyclone and anticyclone, respectively during their lifetime. The black triangle and square represent the initial and final position of each eddy, respectively; (b) time series of the cyclone and anticyclone radii for 2005.
Oceans 02 00007 g0a2
As can be seen in the following two figures, in 2005 and 2009, only a weak (and intermittent) dipole is observed near Ras al Hadd. The largest and most stable dipole lies southwest of Ras al Hadd. Thus, these two years are considered as “anomalous”.
Figure A3. (a) Absolute Dynamic Topography anomaly for the 2009 year (snapshot); blue and red contours are for anticyclones and cyclones respectively, dashed contours are for eddy core, and solid contours for the last closed contour. The black dot represents the anticyclone and cyclone instantaneous center position. The solid red and blue trajectories are for cyclone and anticyclone, respectively during their lifetime. The black triangle and square represent the initial and final position of each eddy, respectively and (b) time series of the cyclone and anticyclone radii for year 2009.
Oceans 02 00007 g0a3
We can suggest several reasons for these anomalous years which would have to be confirmed: A weaker summer monsoon wind would lead to a smaller extent of the upwelling region. Then, the eastern edge of this upwelling, which corresponds to the position of the anticyclone, would be west of its usual position near Ras al Hadd. Another possibility is that the eddy field in this region has interacted with the cyclone and anticyclone to the west of their usual positions and progressively intensified them there. Finally it is possible that the Oman Coastal Current is weaker these years and thus is unable to advect the dipole towards the cape.

References

  1. Flagg, C.N.; Kim, H.S. Upper ocean currents in the northern arabian sea from shipboard ADCP measurements collected during the 1994–1996 US JGOFS and ONR programs. Deep Sea Res. Part II 1998, 45, 1917–1959. [Google Scholar] [CrossRef]
  2. Lee, C.M.; Jones, B.H.; Brink, K.H.; Fisher, A.S. The upper-ocean respecton to monsoonal forcing in the Arabian Sea: Seasonal and spatial variability. Deep Sea Res. II 2000, 47, 1177–1226. [Google Scholar] [CrossRef]
  3. Carton, X.; L’Hegaret, P.; Baraille, R. Mesoscale variability of water masses in the Arabian Sea as revealed by ARGO floats. Ocean Sci. 2012, 8, 227–248. [Google Scholar] [CrossRef] [Green Version]
  4. Morvan, M.; L’Hegaret, P.; de Marez, C.; Carton, X.; Corréard, S.; Baraille, R. Life cycle of mesoscale eddies in the Gulf of Aden. Geophys. Astrophys. Fluid Dyn. 2020, 114, 631–649. [Google Scholar] [CrossRef]
  5. Wang, Z.; DiMarco, S.F.; Jochens, A.E.; Ingle, S. High salinity events in the northern Arabian Sea and Sea of Oman. Deep Sea Res. I 2013, 74, 14–24. [Google Scholar] [CrossRef]
  6. L’Hegaret, P.; Lacour, L.; Carton, X.; Baraille, R.; Correard, S. A seasonal dipolar eddy near Ras Al Hamra (Sea of Oman). Ocean Dyn. 2013, 63, 633–659. [Google Scholar] [CrossRef]
  7. Brandt, P.; Stramma, L.; Schott, F.; Fischer, J.; Dengler, M.; Quadfasel, D. Annual Rossby waves in the Arabian Sea from TOPOX/POSEIDON altimeter and in situ data. Deep Sea Res. II 2002, 49, 1197–1210. [Google Scholar] [CrossRef]
  8. Beal, L.M.; Hormann, V.; Lumpkin, R.; Folz, G.R. The response of the surface circulation of the Arabian Sea to Monsoonal forcing. J. Phys. Oceanogr. 2013, 43, 2008–2022. [Google Scholar] [CrossRef] [Green Version]
  9. Beal, L.M.; Donohue, K.A. The Great Whirl: Observations of its seasonal development and interannual variability. J. Geophys. Res. C 2013, 18, 1–13. [Google Scholar] [CrossRef] [Green Version]
  10. Vic, C.; Roullet, G.; Carton, X.; Capet, X. Mesoscale dynamics in the Arabian Sea and a focus on the Great Whirl lifecycle: A numerical investigation using ROMS. J. Geophys. Res. 2014, 119, 6422–6443. [Google Scholar] [CrossRef] [Green Version]
  11. Fischer, A.S.; Weller, R.A.; Rudnick, D.L.; Eriksen, C.C.; Lee, C.M.; Brink, K.H.; Fox, C.A.; Leben, R.R. Mesoscale eddies, coastal upwelling and the upper ocean heat budget in the Arabian Sea. Deep Sea Res. II 2002, 49, 2231–2264. [Google Scholar] [CrossRef]
  12. Al Saafani, M.A.; Shenoi, S.S.C.; Shankar, D.; Aparna, M.; Kurian, J.; Durand, F.; Vinayachandran, P.N. Westward motion of eddies into the Gulf of Aden from the Arabian Sea. J. Geophys. Res. C 2007, 112, 11004. [Google Scholar] [CrossRef]
  13. Fratantoni, D.M.; Bower, A.S.; Johns, W.E.; Peters, H. Somali Current rings in the eastern Gulf of Aden. J. Geophys. Res. C 2006, 111, 09039. [Google Scholar] [CrossRef] [Green Version]
  14. Bower, A.S.; Furey, H.H. Mesoscale eddies in the Gulf of Aden and their impact on the spreading of Red Sea Outflow Water. Prog. Oceanogr. 2012, 96, 14–39. [Google Scholar] [CrossRef] [Green Version]
  15. Bower, A.S.; Hunt, H.D.; Price, J.F. Character and dynamics of the Red Sea and Persian Gulf outflows. J. Geophys. Res. C 2000, 105, 6387–6414. [Google Scholar] [CrossRef]
  16. Pous, S.P.; Carton, X.; Lazure, P. Hydrology and circulation in the Strait of Hormuz and the Gulf of Oman; results from the GOGP99 Experiment: Part I. Strait of Hormuz. J. Geophys. Res. 2004, 109, 1–15. [Google Scholar] [CrossRef] [Green Version]
  17. Pous, S.P.; Carton, X.; Lazure, P. Hydrology and circulation in the Strait of Hormuz and the Gulf of Oman; results from the GOGP99 Experiment: Part II. Gulf of Oman. J. Geophys. Res. 2004, 109, 1–26. [Google Scholar] [CrossRef] [Green Version]
  18. Morvan, M.; Carton, X.; Gula, J.; L’Hegaret, P.; Vic, C.; Sokolovskiy, M.; Koshel, K. The life cycle of submesoscale eddies generated by topographic interactions. Ocean Sci. 2019, 15, 1531–1543. [Google Scholar] [CrossRef] [Green Version]
  19. Morvan, M.; Carton, X.; Corréard, S.; Baraille, R. Submesoscale dynamics in the Gulf of Aden and the Gulf of Oman. Fluids 2020, 5, 146. [Google Scholar] [CrossRef]
  20. Morvan, M.; de Marez, C.; L’Hegaret, P.; Carton, X. On the dynamics of an idealized bottom density current overflowing in a semi-enclosed basin: Mesoscale and submesoscale eddy generation. Geophys. Astrophys. Fluid Dyn. 2020, 114, 607–630. [Google Scholar] [CrossRef]
  21. Meschanov, S.L.; Shapiro, G.I. A young lens of Red Sea Water in the Arabian Sea. Deep Sea Res. 1998, 45, 1–13. [Google Scholar] [CrossRef] [Green Version]
  22. De Marez, C.; Carton, X.; Corréard, S.; L’Hegaret, P.; Morvan, M. Observation of a deep submesoscale cyclonic vortex in the Arabian Sea. Geophys. Res. Lett. 2020, 47, e2020GL087881. [Google Scholar] [CrossRef]
  23. Senjyu, T.; Ishimaru, T.; Matsuyama, M.; Koike, Y. High salinity lens from the Strait of Hormuz. In Offshore Environment of the ROPME Sea Area after the War-Related Oil Spill, Results of the 1993–1994 Umitaka-Maru Cruises; Otsuki, A., Abdulraheem, M.Y., Reynolds, R.M., Eds.; Terra Scientific Publishing Company: Tokyo, Japan, 1998; pp. 35–48. [Google Scholar]
  24. L’Hegaret, P.; Duarte, R.; Carton, X.; Vic, C.; Ciani, D.; Baraille, R.; Correard, S. Seasonal mesoscale variability in the Arabian Sea from HYCOM model and observations: Impact on the Persian Gulf Water path. Ocean Sci. 2015, 11, 667–693. [Google Scholar] [CrossRef] [Green Version]
  25. L’Hegaret, P.; Carton, X.; Louazel, S.; Boutin, G. A submesoscale lens of Persian Gulf off the Omani coast in Spring 2011. Ocean Sci. 2016, 12, 687–701. [Google Scholar] [CrossRef] [Green Version]
  26. Böhm, E.; Morrison, J.M.; Manghnani, V.; Kim, H.S.; Flagg, C.N. The Ras al Hadd Jet: Remotely sensed and acoustic Doppler current profiler observations in 1994–1995. Deep Sea Res. Part II 1999, 46, 1531–1549. [Google Scholar] [CrossRef]
  27. Ballarotta, M.; Ubelmann, C.; Pujol, M.-I.; Taburet, G.; Fournier, F.; Legeais, J.-F.; Faugère, Y.; Delepoulle, A.; Chelton, D.; Dibarboure, G.; et al. On the resolutions of ocean altimetry maps. Ocean Sci. 2019, 15, 1091–1109. [Google Scholar] [CrossRef] [Green Version]
  28. Quilfen, Y.; Chapron, B. On denoising satellite altimeter measurements for high-resolution geophysical signal analysis. Adv. Space Res. 2020, in press. [Google Scholar] [CrossRef]
  29. Le Vu, B.; Stegner, A.; Arsouze, T. Angular Momentum Eddy Detection and tracking Algorithm (AMEDA) and its application to coastal eddy formation. J. Atmos. Ocean. Technol. 2017, 35, 739–762. [Google Scholar] [CrossRef]
  30. Amores, A.; Jorda, G.; Arsouze, T.; Sommer, J.L. Up to What Extent Can We Characterize Ocean Eddies Using Present-Day Gridded Altimetric Products? J. Geophys. Res. Oceans 2018, 123, 7220–7236. [Google Scholar] [CrossRef]
  31. Dee, D.P.; Uppala, S.M.; Simmons, A.J.; Berrisford, P.; Poli, P.; Kobayashi, S.; Andrae, U.; Balmaseda, M.A.; Balsamo, G.; Bauer, D.P.; et al. The ERA-Interim reanalysis: Configuration and performance of the data assimilation system. Q. J. R. Met. Soc. 2011, 137, 553–597. [Google Scholar] [CrossRef]
  32. Large, W.G.; McWilliams, J.C.; Doney, S.C. Oceanic vertical mixing: A review and a model with a nonlocal boundary layer parameterization. Rev. Geophys. 1994, 32, 363–403. [Google Scholar] [CrossRef] [Green Version]
  33. Ioannou, A.; Stegner, A.; Tuel, A.; LeVu, B.; Dumas, F.; Speich, S. Cyclostrophic corrections of AVISO/DUACS surface velocities and its application to mesoscale eddies in the Mediterranean Sea. J. Geophys. Res. Oceans 2019, 124, 8913–8932. [Google Scholar] [CrossRef] [Green Version]
  34. Carton, X. Hydrodynamical modeling of oceanic vortices. Surv. Geophys. 2001, 22, 179–263. [Google Scholar] [CrossRef]
  35. Piontkovski, S.A.; Al-Tarshi, M.H.; Al-Ismaili, S.M.; Al-Jardani, S.S.; Al-Alawi, Y.H. Inter-annual variability of mesoscale eddy occurrence in the western Arabian Sea. Int. J. Oceans Oceanogr. 2019, 13, 1–23. [Google Scholar]
Figure 1. (a) Regional map of the Arabian Sea—in summer—displaying the main oceanographic phenomena: Currents, outflows, upwellings, and eddies and (b) snapshot of the Ras al Hadd dipole in summer 2020 with the cyclone to the northeast and the anticyclone to the southwest (from “Ocean Virtual laboratory web portal (ESA, OceanDataLab, https://ovl.oceandatalab.com (accessed on 1 December 2020)”)).
Oceans 02 00007 g001
Figure 2. Snapshots of the Absolute Dynamic Topography (ADT) anomaly for the 2014 summer monsoon; the blue and red contours are for anticyclones and cyclones respectively; the dashed contours circle the eddy core; and solid lines indicate the outermost closed contours. The black dots represent the anticyclone and cyclone instantaneous center positions.
Oceans 02 00007 g002
Figure 3. (a) Sea surface height map showing the elongation of the Ras al Hadd anticyclone (green contour, eddy 227) under the influence of cyclone 35, on 5 June 2014; (b) sea surface height map showing the merging of the Ras al Hadd cyclone with eddy 35 on 7 April 2015 (green contour); (c) ratio of mutual distance to the mean radius of the two cyclones for the merging event; and (d) aspect ratio of the anticyclone for the splitting event.
Oceans 02 00007 g003aOceans 02 00007 g003b
Figure 4. Time series of the Ras al Hadd cyclone and anticyclone radii from April 2014 to 2015.
Oceans 02 00007 g004
Figure 5. (a) Cross-correlation between the wind stress curl and the cyclone of the Ras al Hadd dipole with days starting in April 2014; (b) same as (a) for the correlation of the wind with the anticyclone of the dipole.
Oceans 02 00007 g005
Figure 6. Ratio of the centrifugal to the Coriolis accelerations V θ / f 0 R for the cyclone and the anticyclone of the Ras al Hadd dipole.
Oceans 02 00007 g006
Figure 7. (a) Snapshot of the sea surface height (SSH) anomaly (HYCOM). The black dashed line represents the location of the vertical section. (bd) Represent the temperature, salinity, and the cross-section velocity for the cyclone and anticyclone of the Ras al Hadd dipole, respectively. The black solid lines represent the isopycnals.
Oceans 02 00007 g007
Figure 8. 2D (surface) statistics for both eddies of the Ras al Hadd dipole with error bars (vertical segments at the end of the colored lines): (a) Maximal azimuthal velocity V m a x , (b) steepness of the radial profile of azimuthal velocity, (c) dynamical Rossby number R o , and (d) radius of maximal velocity R m a x . The horizontal gray line in the steepness plot indicates a Gaussian profile of velocity and the horizontal gray line in the R m a x plot indicates the value of the internal Rossby radius of deformation.
Oceans 02 00007 g008aOceans 02 00007 g008bOceans 02 00007 g008c
Figure 9. (a) Mean density anomaly (error bars for standard deviation (STD)) in the cyclone and anticyclone and (b) dipole depth as defined by the depth of the maximal density anomaly (the number of co-localized ARGO float profiles is indicated in white bold characters).
Oceans 02 00007 g009
Publisher’s Note: MDPI stays neutral with regard to jurisdictional claims in published maps and institutional affiliations.

