Article

Clinical Outcomes in Burns Patients with Early Venous Thromboembolism Prophylaxis Compared with Late-Anticoagulated Patients: A Retrospective Study

by
Rose Brazilek
1,* and
Heather J. Cleland
1,2
1
The Victorian Adult Burns Unit, The Alfred Hospital, Melbourne, VIC 3185, Australia
2
Department of Surgery, Monash University Central Clinical School, Melbourne, VIC 3185, Australia
*
Author to whom correspondence should be addressed.
Submission received: 11 February 2021 / Revised: 19 June 2021 / Accepted: 21 June 2021 / Published: 29 June 2021

Abstract

:
The aim of this study was to describe the timing of venous thromboembolism diagnosis in patients with severe burns and determine the relationship between venous thromboembolism prophylaxis and venous thromboembolism development in a large trauma hospital. A retrospective cohort study over 10 years from 2009 to 2019 was conducted. Records of 226 patients with >20% total body surface area burns were surveyed, and 20 patients with symptoms suggestive of venous thromboembolism had a diagnosis of VTE confirmed on imaging. Enoxaparin was the most common primary thromboprophylaxis (85%, n = 192), followed by heparin (13.71%, n = 31) and sequential compression devices (0.88%, n = 2). Compared with patients who did not develop a venous thromboembolism, patients who developed a venous thromboembolism had a mean difference in time from admission to thromboprophylaxis prescription of 1.72 days (95% CI = −1.50 to 4.92, p > 0.05) and 10.51 days in those who developed a pulmonary embolus (mean difference = 10.51, 95% CI = 3.73 to 17.32, p = 0.0006). A threshold of 4 days was identified by which 96% of patients who never developed venous thromboembolism during admission were prescribed prophylaxis, compared with 32% of those who developed a pulmonary embolus. No bleeding or adverse events were recorded. Timely prescription of thromboprophylaxis in patients with severe burns is critical in reducing venous thromboembolism incidence. Avoidance of delay post injury is especially critical in preventing venous thromboembolism development. Guidelines on thromboprophylaxis must be considered on an individualised patient basis, considering likely surgical requirements and obesity.

1. Introduction

Studies determining venous thromboembolism (VTE) incidence in people with severe burns estimate an incidence between 6% and 10%, with pulmonary embolism (PE) accounting for 0.61–3.2% incidence [1,2,3]. VTE events have significant correlation with poorer patient outcomes, including longer hospital stay, morbidity, and mortality [4,5,6]. From a pathophysiological perspective, increased risk of VTE events in burn patients is explained by a number of factors: dehydration secondary to loss of the protective epithelial layer [7], and hypercoagulability of blood arising through activation of a global inflammatory response [7]. There is also evidence that the hyperdynamic nature of circulation post-burn increases renal clearance, resulting in faster elimination of anticoagulants, and suggestions have been made to increase doses if clinically appropriate [8].
Though hospital patients are at high risk for VTE events, burns patients may be an especially high-risk population, as they may be immobile, have periods without anticoagulation prior to surgery, and have other comorbidities [7,9]. Most hospital systems and expert groups include VTE prophylaxis in their admission guidelines to reduce hospital-acquired VTE [10,11]; however, these guidelines may be inappropriately applied, or clinical course may contraindicate its use. This study was undertaken to determine the correlation between timing of first dose VTE prophylaxis upon admission and timing of VTE events, as well as to assess sub-optimal prophylaxis dosing in at-risk patients on a case-by-case basis to analyse areas of improvement. Data in this study included inpatient notes from Melbourne’s Alfred Hospital, which provides the state-wide service for adult burns, and corresponding records from the Burns Registry of Australia and New Zealand (BRANZ) database.

2. Materials and Methods

This was a retrospective cohort study of patients in a specialist burns unit. After approval from Alfred Health Ethics Department (approval number: 362/19), medical records from 2009 to 2019 were reviewed. Due to the retrospective nature of the data, patient consent for inclusion in the database was deemed sufficient and further consent was not required. Records of 317 patients with >20% total body surface area (TBSA) burns were initially analysed (excluding duplicates). Patients were excluded if they did not meet the study inclusion criteria: primary admission secondary to acute severe burn injury, burn >20% TBSA, age >18, and length of stay >24 h. Patients were also excluded if they had a documented bleeding phenotype or were receiving anticoagulant therapy prior to admission. Diagnosis of VTE was judged as a positive finding on duplex ultrasound for deep vein thrombosis (DVT), computed tomography (CT) pulmonary angiography or ventilation–perfusion scan for PE, and CT for stroke arising from patent foramen ovale. Imaging studies were performed if clinically indicated and not on asymptomatic patients.
Risk factors for VTE development were identified by conducting a literature review of several electronic databases from inception to March 2019. Any studies that included measurement of VTE as a patient outcome in adults with burns were included. Databases included MEDLINE, the Cochrane Library, EMBASE, and Google Scholar. These identified risk factors were then used to guide collection of patient demographic data, in addition to data regarding VTE prophylaxis prescription and burns treatment through collation of data from BRANZ and patient records from September 2009 to March 2019. Data regarding VTE prescription were collected from internal hospital records, and ‘first prescription’ was taken as the time the first anticoagulant was prescribed on the medical record.
Descriptive statistics were reviewed to include the timing of initiation of pharmacologic or mechanical VTE prophylaxis. Independent continuous variables were analysed in SPSS with t-test comparison of means. Discrete binary variables were analysed through relative risk calculation. Graphing was performed in GraphPad Prism and Microsoft Excel.

3. Results

This study included 226 adults, of whom 20 (8.85%) developed either a DVT, PE, or cerebrovascular event directly associated with patent foramen ovale (Figure 1). All patients in this study were prescribed VTE prophylaxis during admission.
There were 201 patients (88.94%) who were prescribed the recommended dose, while 24 patients (10.62%) were underdosed according to weight, and 1 patient did not receive renal dose-adjustment for VTE prophylaxis. There were no documented episodes of surgical site wound bleeding, haemorrhagic stroke, joint haemorrhage, or epistaxis. The majority of patients in this cohort of patients with severe burns were male (72.12%) (Table 1). DVT was the most common VTE event (65% of all events) (Table 1). There were 42 deaths during the time of the study (18.58% of patients). Of these deaths, 2 patients had developed VTEs during admission (10% of patients who developed a VTE) and 40 patients had not (19.42% of patients in the ‘no VTE’ subgroup).
Table 2 displays the relative risk of VTE development for several demographic risk factors and characteristics of the burn. Past medical history was not a risk factor for VTE development in this study. Current smoking history was a small risk factor for risk of VTE development (RR 2.19, 95% CI = 1.38 to 3.50, p = 0.0007). Patients who were obese also demonstrated increased rates of VTE during admission (RR: 2.80, 95% CI = 1.17 to 6.72, p = 0.0212). Those with VTE had a greater average burned TBSA, though the difference was not statistically significant (mean difference: 8.57% greater TBSA in VTE patients, 95% CI = −0.943 to 18.08, p > 0.05).
Table 3 demonstrates the relative risk of burn location for VTE development. Patients with burns to eyes (RR 2.218, 95% CI = 1.06 to 4.64, p = 0.035), scalp (RR 2.218, 95% CI = 1.06 to 4.64), trunk (RR 1.43, 95% CI = 1.17 to 1.74, p = 0.0004), or burns to lower limbs (RR 1.44, 95% CI = 1.27 to 1.64, p < 0.0001) demonstrated greater risk of VTE development.
Table 4 demonstrates the relative risk of VTE development for individual treatment factors. VTE development correlated with increased likelihood of ICU admission (RR 1.29, 95% CI = 1.06 to 1.56, p = 0.0096). Patients requiring skin grafting also demonstrated decreased likelihood of VTE development (RR 0.59, 95% CI = 0.00 to 0.27, p = 0.0307) though use of temporary skin increased risk (RR 1.38, 95% CI = 1.11 to 1.69, p = 0.0026).
Figure 2 shows the risk of VTE development due to timing of first dose of VTE prophylaxis. Figure 2a demonstrates a marked reduction in timely prescription of VTE prophylaxis when compared with patients who were not found to have a VTE during their admission. This delay is more pronounced in the ‘patients who developed a PE’ subgroup. VTE prophylaxis prescription approached 100% after day 30. There was a significant lag-time between first dose of VTE prophylaxis and VTE development, with 80% of VTEs developing before 174 days. All VTE events reported in this study were diagnosed by day 800 of inpatient admission. However, most were diagnosed after initiation of at least one dose of thromboprophylaxis had been administered. The relative risk of developing VTE increased as the time until prescription was prolonged, and statistical significance was reached at the 4-day benchmark. At this timepoint, there was a relative risk of 5.29 that patients who had not been prescribed thromboprophylaxis would develop a VTE (95% CI = 3.13 to 7.45, p = 0.004).
Figure 3 contains subgroup analyses of timing of thromboprophylaxis as stratified by patient population. VTE development in general did not correlate with timing of first dose of VTE prophylaxis. Some patients had extremely delayed VTE prescription (>15 days). Comparison between patients who developed a PE and patients without VTE events demonstrated a statistically significant difference between timing of prophylaxis initiation (mean difference = 10.5 days, 95% CI = 3.73 to 17.32, p = 0.0006). There was no statistically significant difference between timing of prescription between any of the groups when a t-test was applied. Patients with superficial PT burns showed the greatest variation with prescription initiation, while those with deep PT burns had the shortest time until first prescription of thromboprophylaxis.
Figure 4 demonstrates differences between VTE incidence with different methods or prophylaxis. Enoxaparin was the favoured VTE prevention method, though heparin and SCD (sequential compression devices) were also used. While there was no significant difference between VTE rate with either anticoagulant or patients treated solely with sequential compression devices (analysis not shown), patients who were prescribed enoxaparin comprised the majority of VTE events due to greater proportion of prescription.

4. Discussion

4.1. Institutional Protocol for VTE Prophylaxis

Prudent, early prescription and identification of at-risk populations is critical to prevent development of VTEs and subsequent inherent morbidity and mortality [3,11]. Local guidelines differ but suggest initiation of VTE prophylaxis as early as possible in admission. Institutional protocol was formalized in 2018, involving a mandatory VTE screen performed on all patients which should be performed on admission and reviewed daily if VTE prophylaxis was withheld. The on-line screening questionnaire aims to assess risk factors for VTE development and provides an automatic link to weight-based and renally adjusted dosing for all patients judged ‘high-risk’ for VTE for which thromboprophylaxis is not contraindicated.
Summarily, the protocol states patients who have an eGFR above 30 and are judged to weigh between 45 and 100 kg receive 40 mg enoxaparin nocte, while those with impaired renal function of an eGFR between 10 and 30 or weight less than 50 kg received a dose of 20 mg. Those above 130 kg required consultation with the hematology unit, and guidelines recommended a dosing regimen of 60 mg daily or 40 mg twice daily with factor Xa level monitoring, if appropriate. Patients may have been prescribed unfractionated heparin due to renal impairment with weight-based dosing with APTT review on a 4–6 h basis until the APTT was within the target range. This protocol was not specific to patients with severe burns, nor was their thromboprophylaxis regimen or monitoring altered from the general patient population. New literature suggests anti-Xa monitoring for patients with severe burns may be important given their hyperdynamic circulation and metabolism of enoxaparin, and this monitoring may become routine in the future [13]. Anti-factor Xa levels testing for enoxaparin prescription was not common in clinical practice at the time of study initiation, and bariatric patients may have been routinely under-dosed. Older texts and patient records indicate enoxaparin was the anticoagulant of choice for thromboprophylaxis from the year of study initiation to present [14].

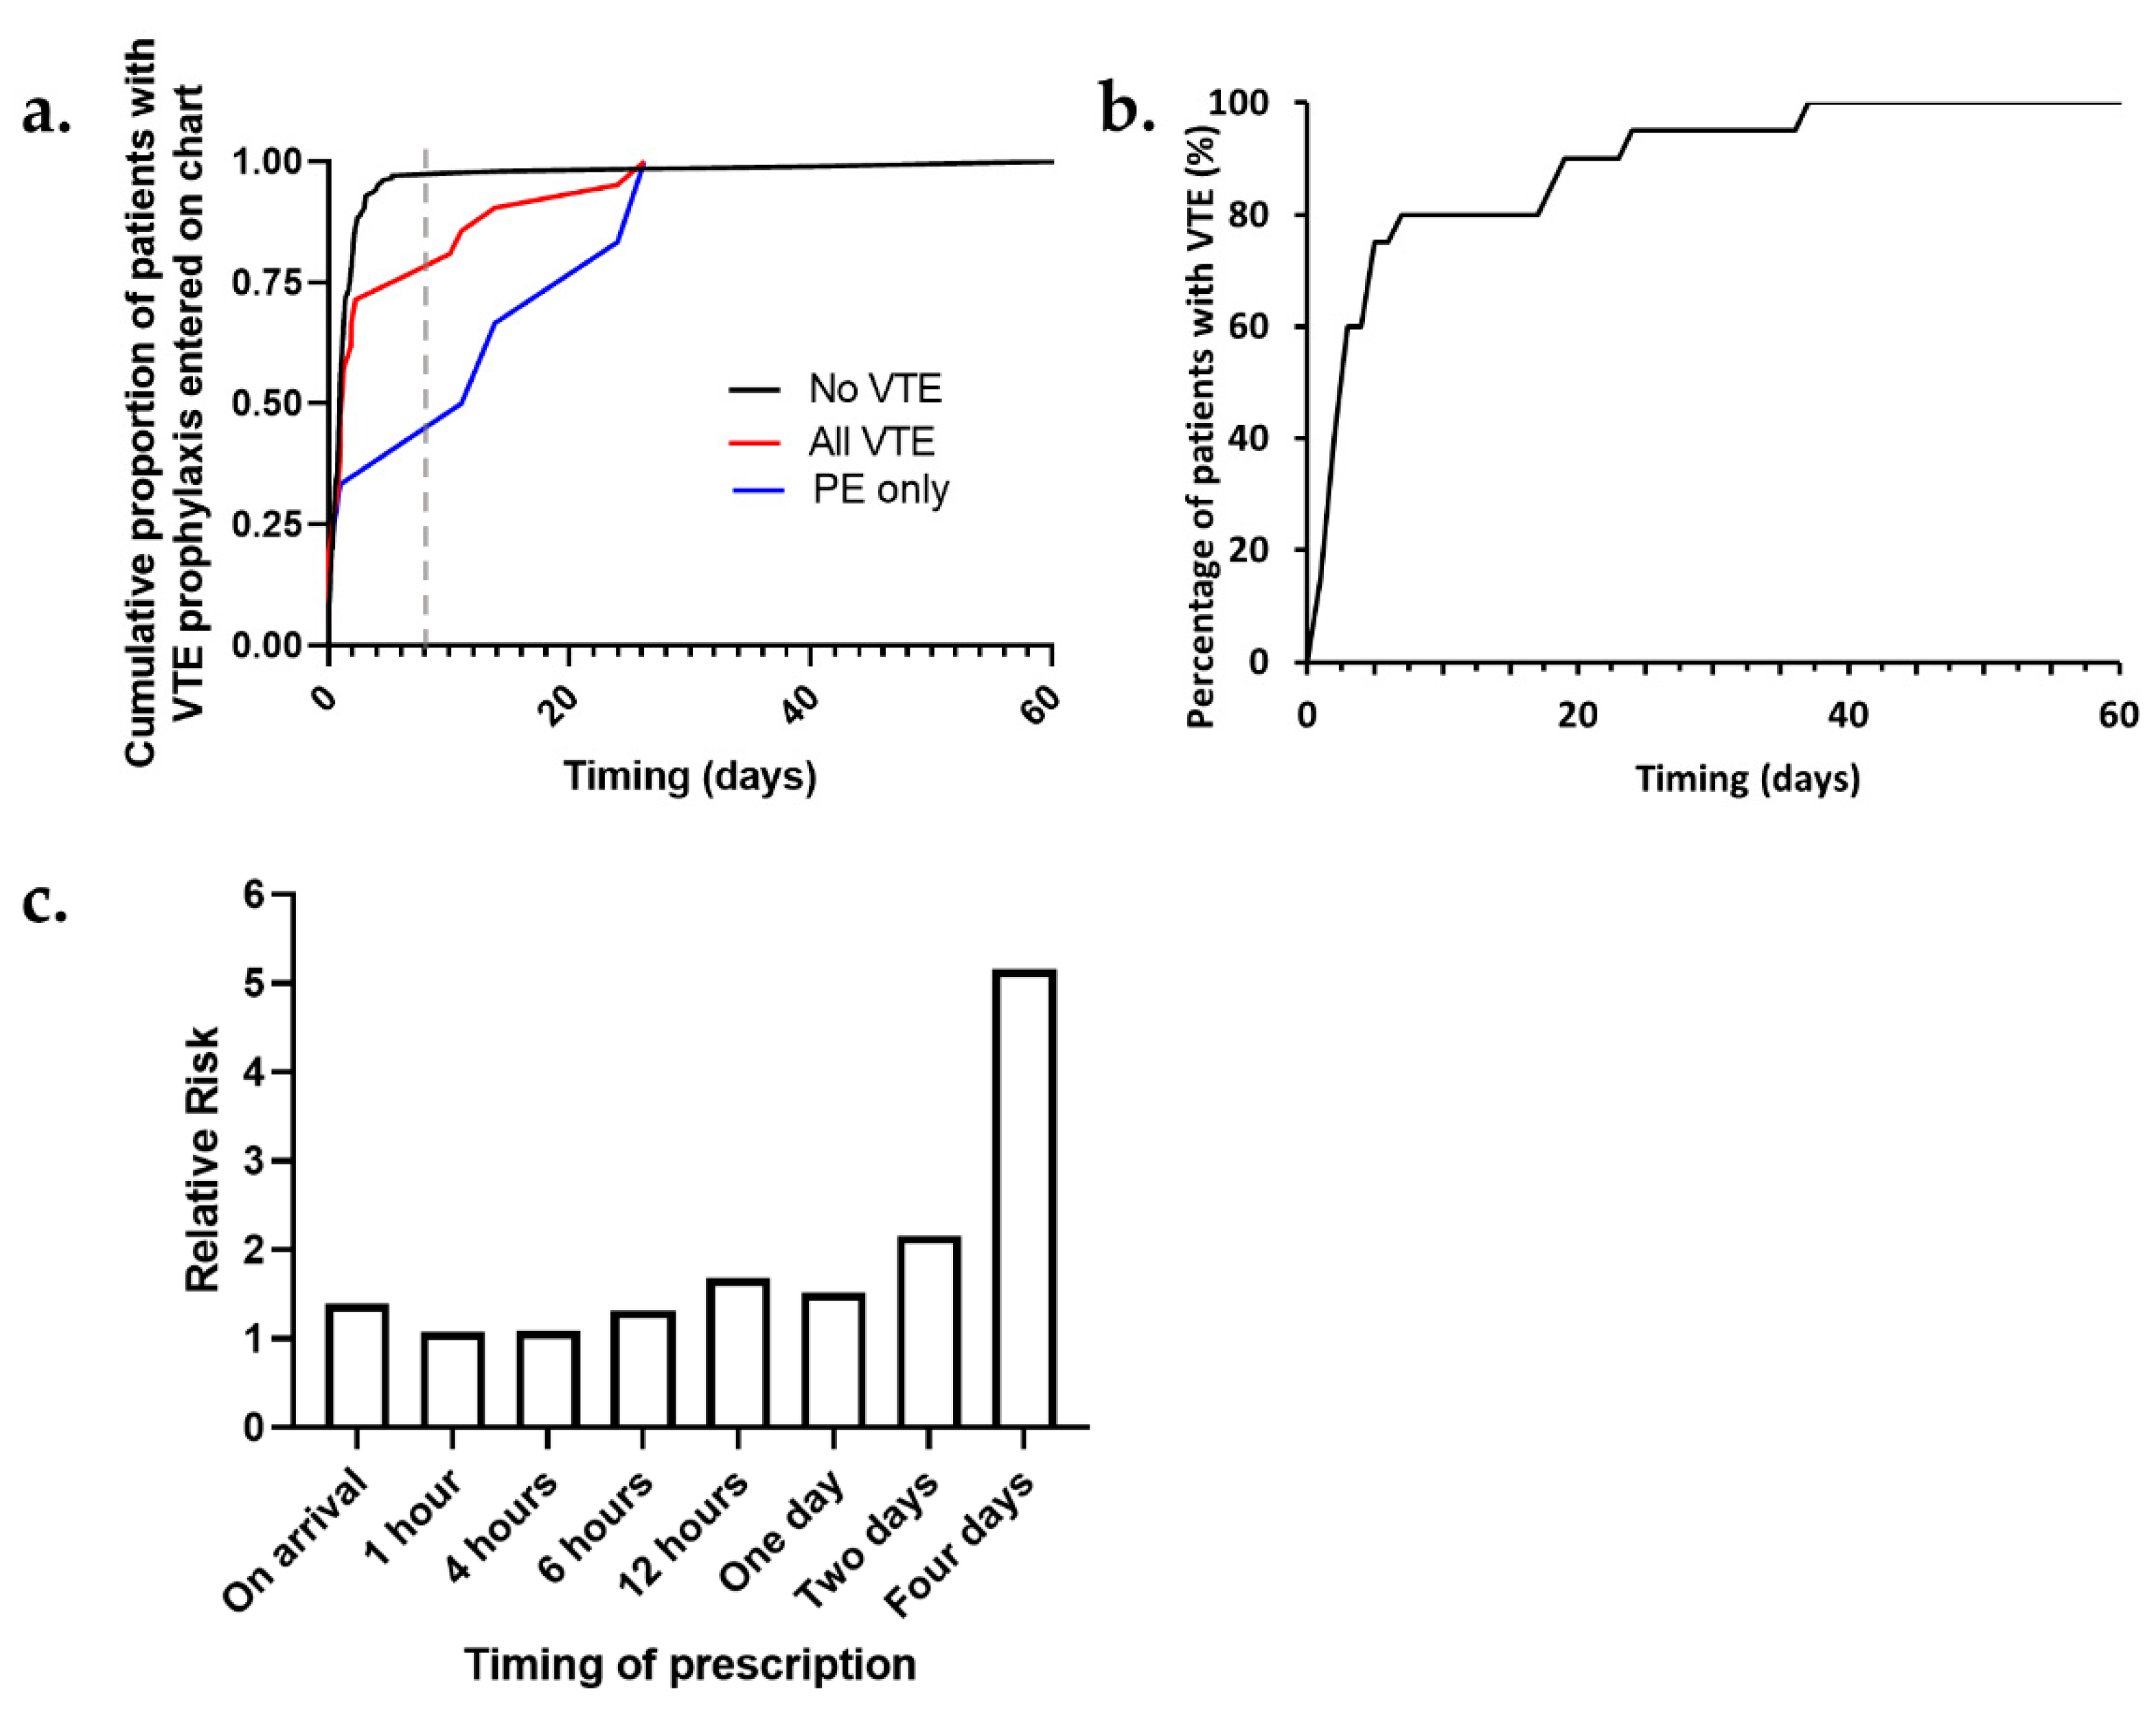
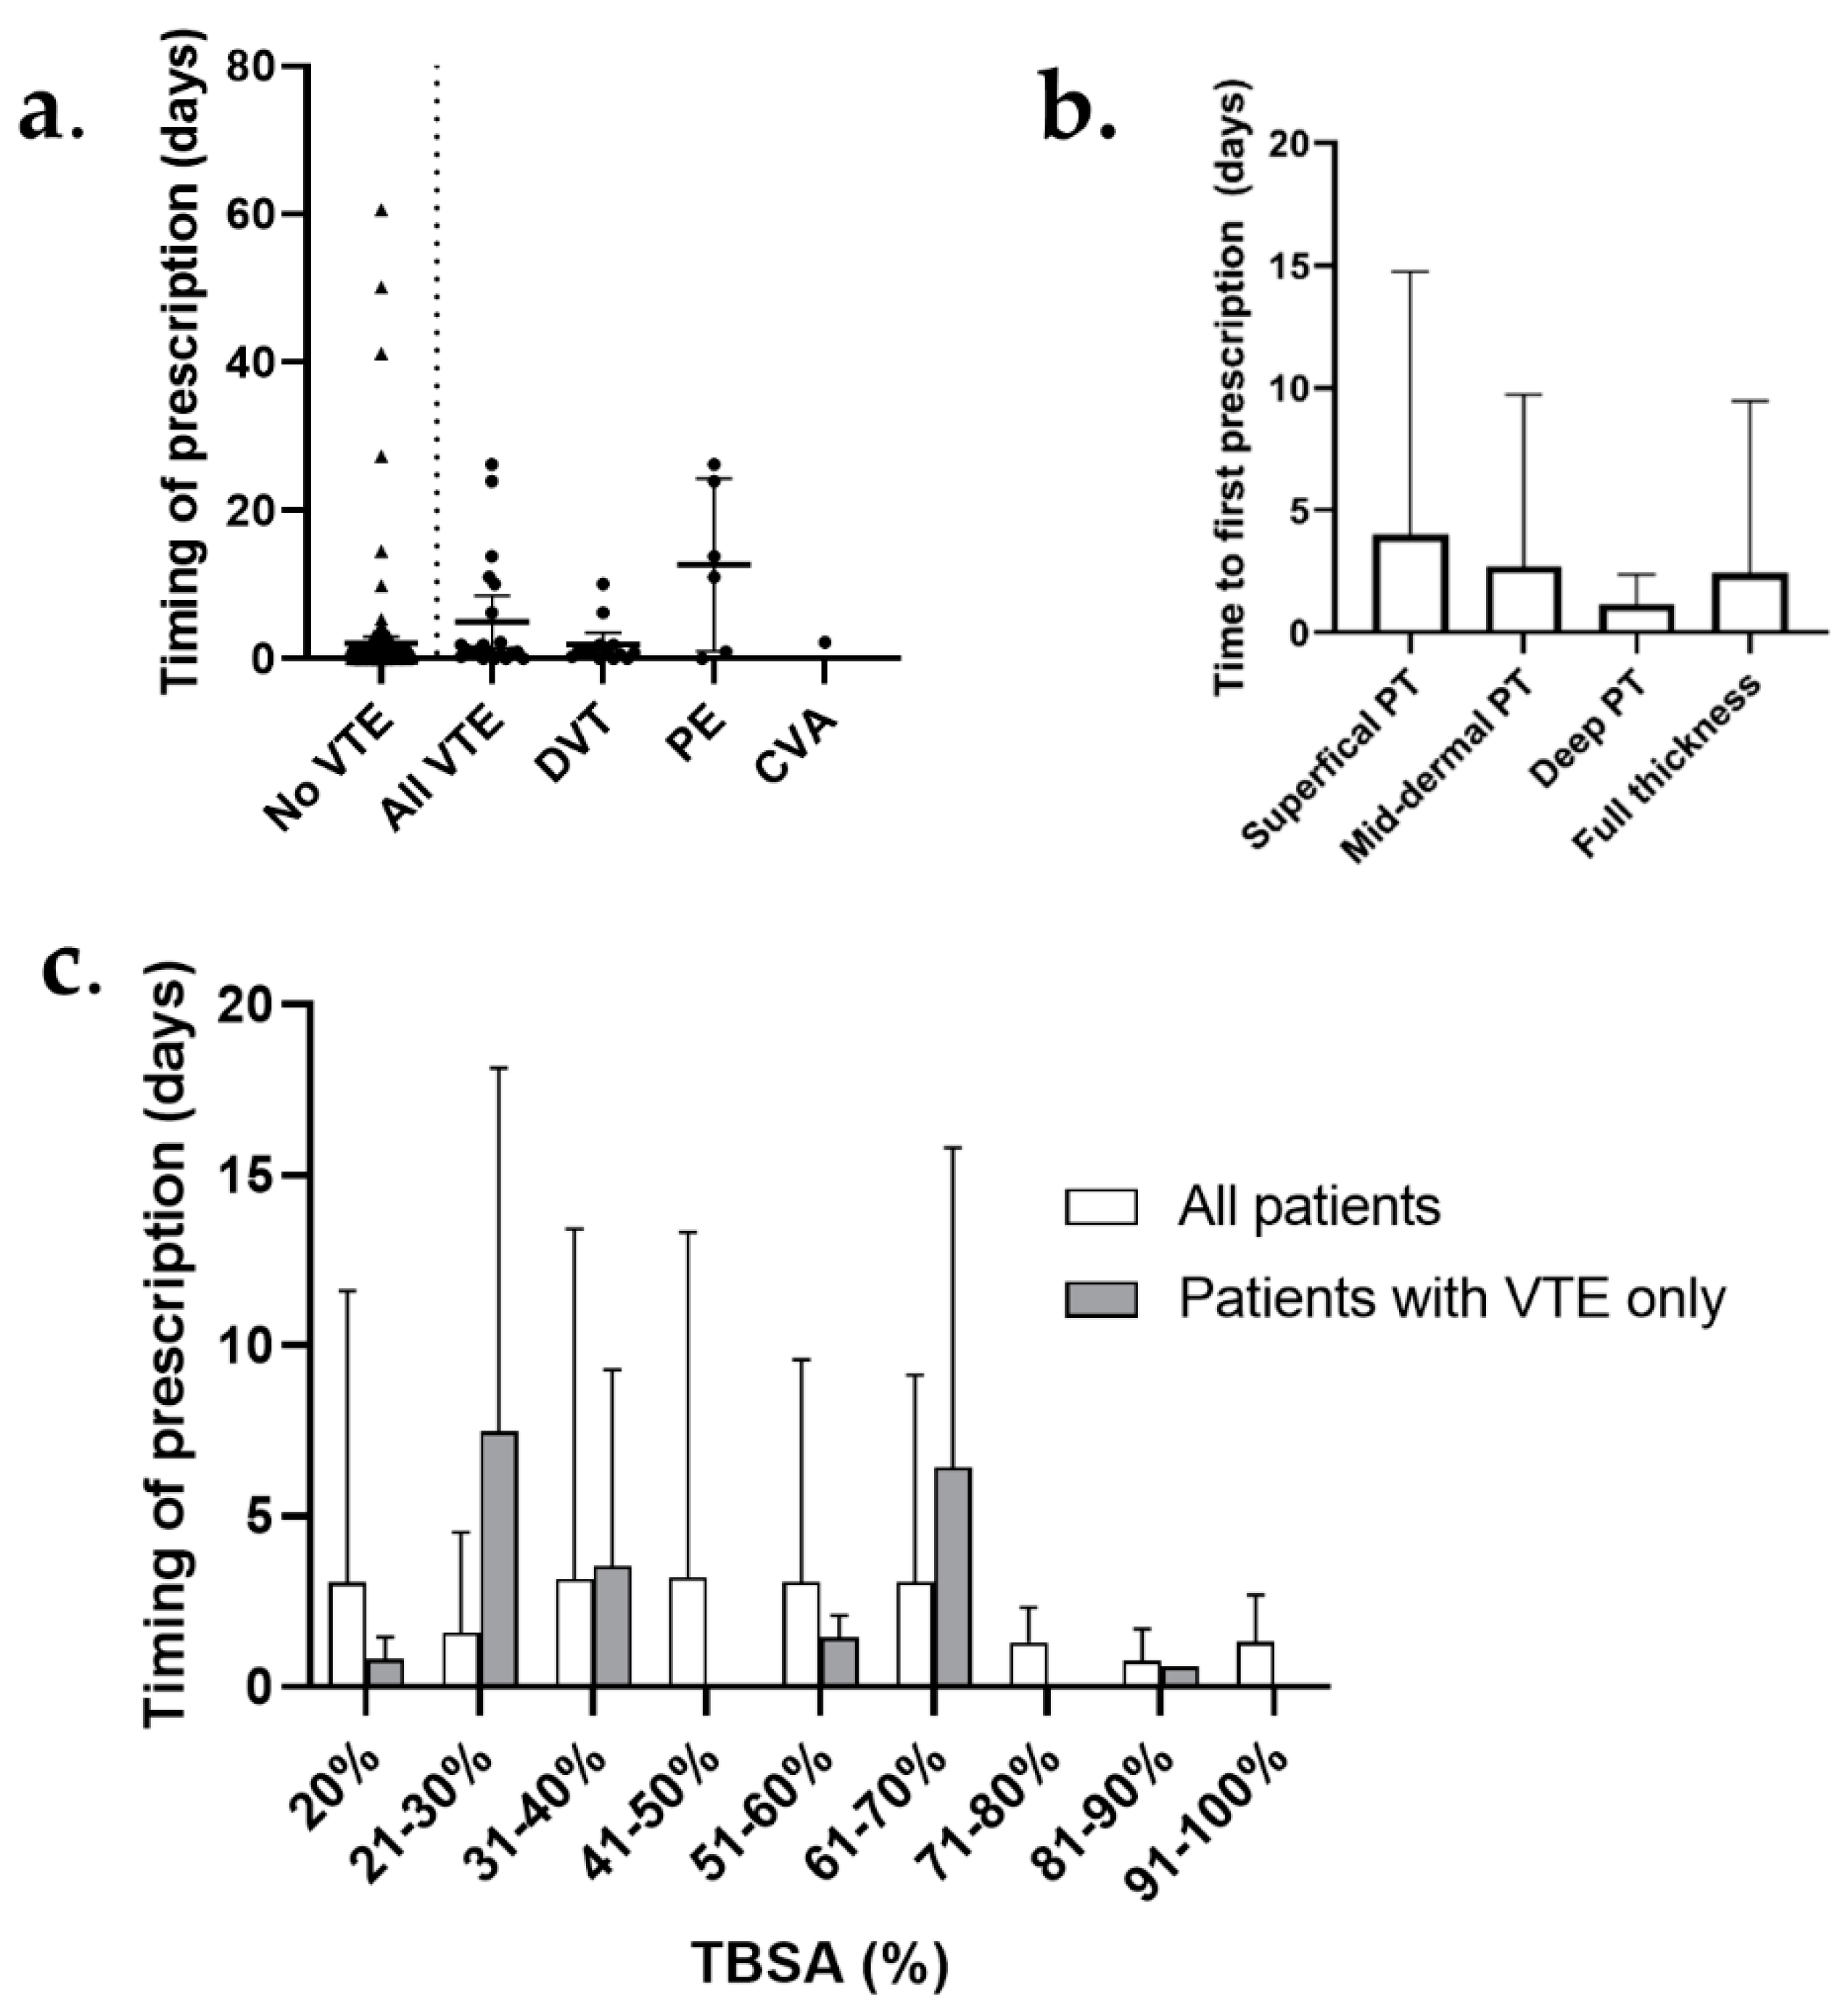
4.2. Timing of VTE Prophylaxis Initiation

The primary endpoint of this study was the rate of VTE development in patients with delayed prescription of thromboprophylaxis. Understanding the optimal time to chart VTE prevention may inform decisions weighing risks of VTE events and surgical complications and the urgency with which thromboprophylaxis should be administered.
Figure 2 demonstrates stratification of VTE risk into patient subsets: those who did not develop a VTE, those who developed any VTE (including DVT or PE), and those who developed a PE (excluding a sole DVT diagnosis). Significantly, in the ‘no VTE’ subgroup, 95% of patients were prescribed thromboprophylaxis by the fourth day of admission, while only 72% of patients who developed any VTE and 32% of patients with a PE were prescribed prophylaxis at this timepoint (see Figure 2a,b). This may indicate that the critical time to prevent VTE development appeared to be around day four of admission, with an increased relative risk of VTE with a delay in prescription (RR = 5.29, 95% CI = 3.13 to 7.45, p = 0.004) (see Figure 2c).

4.3. Examination of Patient Subset Who Developed a Pulmonary Embolus

While mean timing of initiation of VTE thromboprophylaxis did not significantly differ between patients who did and did not develop VTE, prescription was significantly delayed in patients who developed a PE (mean difference = 10.51, 95% CI = 3.73 to 17.32, p = 0.0006) (see Figure 3a). The rate of subclinical DVTs has been estimated to be between 19% and 84% in hospital populations [15], and a consequent PE is far more likely to be the presenting complaint due to resulting hemodynamic compromise. It is possible patients in this cohort may not have a VTE diagnosed until their presentation was suspicious of a PE given the difficulties of assessing major burn patients for DVT, seriousness of their condition, and high rate of medical factors complicating their presentation. In the majority patients who may have had delayed thromboprophylaxis initiation, no cause was identified on file review, and VTE prophylaxis may have simply been delayed amongst consideration of the rest of their treatment. A small number of patients were admitted with trauma wounds and required major surgery prior to safe thromboprophylaxis initiation. The automated survey system to assess VTE risk and appropriate prescription described above was implemented to reduce some of the delays evidenced in this study.
A t-test was conducted to compare risk factors for VTE development in those who did not develop a VTE and patients who developed a PE specifically (data not shown). However, patient numbers were too small to make clinically significant conclusions regarding risk factors for PEs specifically in patients with severe burns. It was found that those who developed a PE specifically had a mean greater TBSA affected than those who did not (mean difference: 18.04%, 98% CI = 9.31 to 26.77, p = 0.0397). This may indicate that larger burns are a specific risk for PE rather than VTE generally, though more research is needed to corroborate this finding.

4.3.1. Risk Factor Analysis—Total Body Surface Area Affected by Burn

Risk factors for development of VTE in patients with severe burns, such as greater TBSA affected and greater burn depth, are well established [4,5,6]. However, Figure 3b,c demonstrates that both patients with deeper burns and those with higher TBSA burns had reduced time until first prescription of thromboprophylaxis in this study. Quicker rate of thromboprophylaxis initiation may reflect medical staff understanding of the greater risk of VTE in these patients.
This study also demonstrated important learning points regarding recognition of patients at increased VTE risk. Obesity is a significant risk factor for VTE [16,17] due to the underlying pro-inflammatory state and comorbidities, and a weight-adjusted dose of enoxaparin is suggested in guidelines [12]. This study included 30 obese patients (BMI ≥ 30 kg/m2), of whom 6 developed VTE (see Table 1), and 24 were inadequately anticoagulated according to current weight-based guidelines (data not shown). Obesity was demonstrated to be a statistically significant risk factor for VTE development (RR: 2.80, 95% CI = 1.17 to 6.72, p = 0.0212) (see Table 2). Obesity increases VTE risk with proposed mechanisms including genetic predisposition, increase in venous stasis, and chronic low-grade inflammation [18]. The high rate of VTE in this population suggests that tailored prescribing for obese patients may be critical to VTE prevention.

4.3.2. Risk Factor Analysis—Smoking

In this study, patients who smoked demonstrated an increased incidence of VTE (RR: 2.19 (95% CI = 1.39 to 3.46, p = 0.0007) (see Table 2). However, smoking was not a risk factor for delayed VTE prescription (data not shown). Smoking is contentious as a cause of VTE, with studies suggesting that it may be a confounding factor and that comorbid conditions such as malignancy may increase risk of VTE [19,20]. While this debate is outside the scope of this paper, previous literature has suggested that a history of heavy smoking is a risk factor for VTE only in patients with other antecedent major risk factors, a subset which would include patients in this study [20].

4.3.3. Risk Factor Analysis—Anatomical Burn Location

The t-test analysis of risk of VTE development as stratified by burn location demonstrated a high increased relative risk among those with burns to lower limbs, eyes, and the trunk (see Table 3). Eye and trunk wounds may indicate patients who are more likely to require other established risk factors for VTE development, such as ICU admission and skin grafting. Increased incidence of VTE events in patients with lower limb wounds correlates well with clinical experience and published data demonstrating that lower limb immobilization markedly increases VTE rates. Increased incidence may be attributable to decreased mobilisation, resulting in haematological stasis and optimal conditions for VTE formation [21]. Recognition of this risk factor may be practice-changing in certain patient subgroups, as prevention of lower limb immobilisation is an easy, cheap intervention that may prevent VTE formation in this subgroup.

4.4. Mode of Thromboprophylaxis

Consideration of the mode of prophylaxis is critical in patients with severe burns, as the complex pathophysiology may complicate treatment, monitoring, and management. Burns patients present in a hyperdynamic state, increasing metabolism of many medications [22], and early phase reduction in cardiac output increases venous stasis and further increases likelihood of VTE development [22,23]. Figure 4 demonstrates enoxaparin was the most commonly used mode of prophylaxis (87%), with heparin utilised in temporally earlier patient entries. There was no statistically significant difference between patients treated with heparin and those treated with enoxaparin. However, lack of statistical differentiation between the thromboprophylaxis methods may be confounded by small patient numbers, a lack of recognition in earlier patient entries, and development of more sensitive diagnostic imaging techniques.

4.5. Study Limitations

Limitations of this study include the small sample size of VTE positive events, lack of definitive exclusion of procoagulant phenotypes, and lack of follow-up for development of VTE in the community to the immediate post-hospital period. Additionally, the dataset arose from a single health network hospital, which limits external validity of conclusions. Finally, further study is needed to determine the impact of intermittent VTE prophylaxis prescription, as patients requiring recurrent operative interventions may have thromboprophylaxis withheld. Given the short half-life of anticoagulants (especially enoxaparin), it is likely certain patients had periods of subtherapeutic anticoagulation, though this is not reflected in VTE rates (see Table 4) [24].

5. Conclusions

This review of a large cohort of patients with severe burn injury demonstrates a clear increase in risk of PE development in those who have delayed VTE prophylaxis prescription. While multiple factors complicate adequate and timely dosing of burns patients, this study provides support for early institution of thromboprophylaxis post injury, with special consideration given to high-risk populations, such as the obese.

Author Contributions

Conceptualization, H.J.C.; methodology, R.B. and H.J.C.; validation, R.B.; formal analysis, R.B.; investigation, R.B. and H.J.C.; resources, H.J.C.; data curation, H.J.C.; writing—original draft preparation, R.B.; writing—review and editing, H.J.C.; visualization, R.B.; supervision, H.J.C.; project administration, H.J.C.; funding acquisition, N/A. All authors have read and agreed to the published version of the manuscript.

Funding

This research received no external funding.

Institutional Review Board Statement

Project No: 362/19 Project Title: Clinical outcomes in burns patients with VTE prophylaxis compared with non-anticoagulated patients: a retrospective study was considered for Low-Risk Review and APPROVED on 26 June 2019. The study was conducted according to the guidelines of the Declaration of Helsinki and was approved by the Ethics Committee of Alfred Health (protocol code 362/19, 26/06/2019).

Informed Consent Statement

Patient consent was waived, as patient consent had been obtained to place data on the registry from which they were extracted (the BRANZ database) and for subsequent studies arising from the data. Specific patient consent was not required, as patient information was de-identified.

Conflicts of Interest

The authors declare no conflict of interest.

References

  1. Sikora, S.; Papp, A. Venous thromboembolism in burn patients is not prevented by chemoprophylaxis. Burns 2017, 43, 1330–1334. [Google Scholar] [CrossRef]
  2. Pannucci, C.; Osborne, N.; Wahl, W. Venous Thromboembolism in Thermally Injured Patients: Analysis of the National Burn Repository. J. Burn Care Res. 2011, 32, 6–12. [Google Scholar] [CrossRef]
  3. Moheimani, F.; Jackson, D.E. Venous thromboembolism: Classification, risk factors, diagnosis, and management. ISRN Hematol. 2011, 2011, 124610. [Google Scholar] [PubMed] [Green Version]
  4. Ensor, J.; Riley, R.D.; Moore, D.; Snell, K.I.; Bayliss, S.; Fitzmaurice, D. Systematic review of prognostic models for recurrent venous thromboembolism (VTE) post-treatment of first unprovoked VTE. BMJ Open 2016, 6, e011190. [Google Scholar] [CrossRef] [PubMed]
  5. Kourelis, T.V.; Wysokinska, E.M.; Wang, Y.; Yang, P.; Mansfield, A.S.; Tafur, A.J. Early venous thromboembolic events are associated with worse prognosis in patients with lung cancer. Lung Cancer 2014, 86, 358–362. [Google Scholar] [CrossRef] [Green Version]
  6. Tagalakis, V.; Patenaude, V.; Kahn, S.R.; Suissa, S. Incidence of and mortality from venous thromboembolism in a real-world population: The Q-VTE Study Cohort. Am. J. Med. 2013, 126, 832-e13. [Google Scholar] [CrossRef] [PubMed]
  7. Kesieme, E.; Kesieme, C.; Jebbin, N.; Irekpita, E.; Dongo, A. Deep vein thrombosis: A clinical review. J. Blood Med. 2011, 2, 59. [Google Scholar] [CrossRef] [PubMed] [Green Version]
  8. Horner, K.; Isitt, C.; Shida, A. The Critically Ill Burn Patient: How Do We Get It Right? In Key Topics in Management of the Critically Ill; Springer: Cham, Switzerland, 2016; pp. 155–166. [Google Scholar]
  9. Pannucci, C.J.; Osborne, N.H.; Park, H.S.; Wahl, W.L. Acquired inpatient risk factors for venous thromboembolism after thermal injury. J. Burn Care Res. 2012, 33, 84–88. [Google Scholar] [CrossRef]
  10. Stashenko, G.; Lopes, R.D.; Garcia, D.; Alexander, J.H.; Tapson, V.F. Prophylaxis for venous thromboembolism: Guidelines translated for the clinician. J. Thromb. Thrombolysis 2011, 31, 122–132. [Google Scholar] [CrossRef]
  11. Gould, M.K.; Garcia, D.A.; Wren, S.M.; Karanicolas, P.J.; Arcelus, J.I.; Heit, J.A.; Samama, C.M. Prevention of VTE in nonorthopedic surgical patients: Antithrombotic therapy and prevention of thrombosis: American College of Chest Physicians evidence-based clinical practice guidelines. Chest 2012, 141, e227S–e277S. [Google Scholar] [CrossRef] [Green Version]
  12. Johnson, R.M.; Richard, R. Partial-thickness burns: Identification and management. Adv. Ski. Wound Care. 2003, 16, 178–187. [Google Scholar] [CrossRef] [PubMed]
  13. Lu, P.; Harms, K.A.; Paul, E.; Bortz, H.; Lo, C.; Cleland, H. Venous thromboembolism in burns patients: Are we underestimating the risk and underdosing our prophylaxis? J. Plast. Reconstr. Aesthetic Surg. 2020. Epub ahead of print. [Google Scholar] [CrossRef] [PubMed]
  14. Janus, E.; Bassi, A.; Jackson, D.; Nandurkar, H.; Yates, M. Thromboprophylaxis use in medical and surgical inpatients and the impact of an electronic risk assessment tool as part of a multi-factorial intervention. A report on behalf of the elVis study investigators. J. Thromb. Thrombolysis 2011, 32, 279–287. [Google Scholar] [CrossRef] [Green Version]
  15. Kelly, J.; Rudd, A.; Lewis, R.R.; Hunt, B.J. Screening for subclinical deep-vein thrombosis. QJM An. Int. J. Med. 2001, 94, 511–519. [Google Scholar] [CrossRef] [PubMed] [Green Version]
  16. Yang, G.; de Staercke, C.; Hooper, W.C. The effects of obesity on venous thromboembolism: A review. Open J. Prev. Med. 2012, 2, 499. [Google Scholar] [CrossRef] [PubMed] [Green Version]
  17. Allman-Farinelli, M.A. Obesity and venous thrombosis: A review. Semin. Thromb. Hemost. 2011, 37, 903–907. [Google Scholar] [CrossRef] [PubMed]
  18. Lindström, S.; Germain, M.; Crous-Bou, M.; Smith, E.N.; Morange, P.E.; van Hylckama Vlieg, A.; de Haan, H.G.; Chasman, D.; Ridker, P.; Brody, J.; et al. Assessing the causal relationship between obesity and venous thromboembolism through a Mendelian Randomization study. Hum. Genet. 2017, 136, 897–902. [Google Scholar] [CrossRef]
  19. Cheng, Y.J.; Liu, Z.H.; Yao, F.J.; Zeng, W.T.; Zheng, D.D.; Dong, Y.G.; Wu, S.H. Current and former smoking and risk for venous thromboembolism: A systematic review and meta-analysis. PLoS Med. 2013, 10, e1001515. [Google Scholar] [CrossRef] [Green Version]
  20. Enga, K.F.; Braekkan, S.K.; Hansen-Krone, I.J.; Le Cessie, S.; Rosendaal, F.R.; Hansen, J.B. Cigarette smoking and the risk of venous thromboembolism: The Tromsø Study. J. Thromb. Haemost. 2012, 10, 2068–2074. [Google Scholar] [CrossRef]
  21. Barker, R.C.; Marval, P. Venous thromboembolism: Risks and prevention. Contin. Educ. Anaesth. Crit. Care Pain 2011, 11, 18–23. [Google Scholar] [CrossRef]
  22. Lin, H.; Faraklas, I.; Cochran, A.; Saffle, J. Enoxaparin and antifactor Xa levels in acute burn patients. J. Burn. Care Res. 2011, 32, 1–5. [Google Scholar] [CrossRef] [PubMed] [Green Version]
  23. Bittner, E.A.; Shank, E.; Woodson, L.; Martyn, J.J. Acute and perioperative care of the burn-injured patient. Anesthesiology 2015, 122, 448–464. [Google Scholar] [CrossRef] [PubMed] [Green Version]
  24. Barrett, Y.C.; Wang, J.; Song, Y.; Pursley, J.; Wastall, P.; Wright, R.; LaCreta, F.; Frost, C. A randomised assessment of the pharmacokinetic, pharmacodynamic and safety interaction between apixaban and enoxaparin in healthy subjects. Thromb. Haemost. 2012, 107, 916–924. [Google Scholar] [PubMed]
Figure 1. Patient selection. Patient records from the BRANZ database collected between 2009 and 2019 were cross-referenced with internal documents from the Alfred Hospital to determine eligibility of patient inclusion in this retrospective cohort study. Overall, 226 patient records were included in this study, with 20 recorded VTEs. Patients excluded with an admission length <24 h included those who had died within that timeframe. Patients who died during admission were included in analysis provided they met all other inclusion criteria.
Ebj 02 00006 g001
Figure 2. Timing of prophylaxis vs. VTE risk. (a) demonstrates the proportion of patients in the ‘no VTE’, ‘any VTE’, and ‘PE only’ subgroups who were prescribed VTE prophylaxis, graphed on a ‘time until initiation of prophylaxis’ axis (x axis). The vertical dashed line indicates the 4-day point at which there is a 95% rate of thromboprophylaxis prescription amongst the ‘no VTE’ population, 75% rate of prescription in the patient population who would develop a VTE during their admission, and 32% rate of prescription among patients who would develop a PE specifically. (b) is a survival curve of the number of days from admission until VTE diagnosis in the 20 patients who developed any VTE event. (c) is a representation of the relative risk of delay of VTE prophylaxis initiation when compared with prescription on admission. The first bar refers to the relative risk of VTE development comparing patients prescribed prophylaxis at zero minutes of admission vs. patients prescribed it any time after the zero-minute timeframe. The second bar provides the relative risk if the patient population were stratified by those who were prescribed VTE prophylaxis in the first hour of admission compared with those prescribed it after the hour timeframe.
Ebj 02 00006 g002
Figure 3. Timing of thromboprophylaxis by patient population. (a) demonstrates mean time until first dose of VTE prophylaxis, stratified by VTE event. Error bars represent the standard deviation. (b) demonstrates the mean difference in time of initiation of prescription between patients with superficial PT, mid-dermal PT, deep-PT, and full thickness burns as coded in the BRANZ database (according to the Johnson and Reg classification) [12]. Error bars represent standard deviation. (c) demonstrates the mean time until initiation of thromboprophylaxis as stratified by TBSA and is shown for all patients (white bars) and for those who developed a VTE (grey bars). There was no statistically significant difference in mean time of initiation of thromboprophylaxis between these groups as measured by a Student t-test. Error bars represent standard deviation.
Ebj 02 00006 g003
Figure 4. VTE prophylaxis methods. (a) demonstrates the frequency of VTE thromboprophylaxis method used. No methods were used concurrently. Incidence of methods is indicated in the text attached to the chart segment, and proportional incidence is indicated by the % figure. (b) presents a subgroup analysis of chosen thromboprophylaxis method in patients who developed a VTE specifically. Patient numbers are indicated inside the chart segment.
Ebj 02 00006 g004
Table 1. Patient characteristics (n = 226).
CharacteristicPercentage (Patient Number) 1
Age (mean ± 95% CI)41 ± 17
Gender (Male)72.12% (163 patients)
BMI (kg/m2) (mean ± 95% CI)25.9 ± 5.5
Obese patients13.27% (30 patients)
Average length of stay (days) (mean ± 95% CI) 233.35 ± 30.5
Burn depth
  Superficial Partial Thickness (PT) burn11.50% (26 patients)
  Mid-dermal PT burn15.93% (36 patients)
  Deep PT burn3.54% (8 patients)
  Full thickness burn42.92% (97 patients)
  Not documented26.10% (59 patients)
Burn size (mean ± 95% CI)38.35% ± 20.30
  20% TBSA15.50% (35 patients)
  21–30% TBSA37.61% (85 patients)
  31–40% TBSA15.50% (35 patients)
  41–50% TBSA7.08% (16 patients)
  51–60% TBSA8.85% (20 patients)
  61–70% TBSA7.07% (16 patients)
  71–80% TBSA2.65% (6 patients)
  81–90% TBSA3.09% (7 patients)
  91–100% TBSA2.65% (6 patients)
VTE20 (8.85%)
  DVT13 (5.75%)
  PE6 (2.65%)
  CVA1 (0.44%)
1 Data above present disease prevalence and patient characteristics and are given as the mean ± SD or as n (%). Normal weight was defined as body mass index (BMI) 18.5–24.9 kg/m2, and obesity was defined as BMI ≥ 30 kg/m2. 2 Average length of stay for all patients in the study, including those who died during inpatient admission.
Table 2. The t-tests of patient demographics and burn characteristics to determine VTE risk (n = 226).
Relative Risk95% CIp Value
Obesity (BMI ≥ 30 kg/m2)2.801.17 to 6.720.0212 (*)
Heart failure4.480.20 to 106.95NS
Hepatic failure2.010.25 to 15.56NS
Renal failure1.920.62 to 5.88NS
Smoking history2.191.38 to 3.500.0007 (***)
Superficial PT burn0.400.02 to 6.54NS
Mid-dermal PT burn0.900.30 to 2.74NS
Deep-dermal PT burn0.790.31 to 2.03NS
Full thickness burn1.200.80 to 1.78NS
Mean difference
Age2.50−5.64 to 10.67NS
BMI0.14−2.41 to 2.693NS
Total Body Surface Area Burn (TBSA, %)8.57−0.94 to 18.08NS
Data are presented as relative risk or mean difference. All p values are from a t-test. NS = not significant, p > 0.05, * equates to p ≤ 0.05, *** equates to p ≤ 0.001.
Table 3. The t-tests of burn location to determine VTE risk.
Relative Risk95% CIp Value
Inhalation injury1.320.79 to 2.22NS
Scalp burns2.221.06 to 4.640.035 (*)
Facial burns1.200.87 to 1.65NS
Eye burns3.241.83 to 5.750.0001 (****)
Neck burns1.170.70 to 1.96NS
Breast burns1.370.92 to 2.03NS
Trunk burns1.431.17 to 1.740.0004 (***)
Buttock burns1.580.88 to 2.83NS
Perineum burns0.950.32 to 2.82NS
Dorsal hand burns1.790.86 to 3.70NS
Palmar hand burns1.710.76 to 3.87NS
Upper limb burns1.271.09 to 1.490.0027 (**)
Foot burns0.510.13 to 1.95NS
Dorsal foot burns2.160.52 to 8.95NS
Sole foot burns1.040.06 to 17.78NS
Lower limb burns1.441.27 to 1.64<0.0001 (****)
Data are presented as relative risk or mean difference. All p values are from a t-test. NS = not significant, p > 0.05, * equates to p ≤ 0.05, ** equates to p ≤ 0.01, *** equates to p ≤ 0.001, **** equates to p ≤ 0.0001.
Table 4. The t-tests of hospital treatment determining VTE risk comparing patients without VTE events with those developing VTE.
Relative Risk95% CIp Value
Sepsis1.280.51 to 3.21NS
Requiring Intensive Care Unit (ICU) admission1.291.06 to 1.560.0096 (**)
Operative burns management0.950.766 to 1.17NS
Required debridement0.620.09 to 4.27NS
Temporary skin substitute1.381.11 to 1.690.0026 (*)
Skin graft0.590.42 to 0.840.0034 (*)
Parenteral nutrition0.980.44 to 2.15NS
Death during admission0.520.14 to 1.99NS
Mean difference
Time to first dose (Minutes)2470−2155 to 7094NS
Total ICU minutes−379−11,739 to 10,980NS
Length of hospital stay (days)9.81−3.24 to 22.9NS
Data are presented as relative risk or mean difference. All p values are from a t-test. NS = not significant, p > 0.05, * equates to p ≤ 0.05, ** equates to p ≤ 0.01.
Publisher’s Note: MDPI stays neutral with regard to jurisdictional claims in published maps and institutional affiliations.

