Article

A Single Gene Expression Set Derived from Artificial Intelligence Predicted the Prognosis of Several Lymphoma Subtypes; and High Immunohistochemical Expression of TNFAIP8 Associated with Poor Prognosis in Diffuse Large B-Cell Lymphoma

1
Department of Pathology, Tokai University, School of Medicine, Isehara, Kanagawa 259-1193, Japan
2
Department of Hematology and Oncology, Tokai University, School of Medicine, Isehara, Kanagawa 259-1193, Japan
3
Department of Clinical Sciences, College of Medicine, University of Sharjah, Sharjah 27272, UAE
4
Division of Surgery and Interventional Science, UCL, London WC1E 6BT, UK
*
Author to whom correspondence should be addressed.
Submission received: 24 June 2020 / Revised: 17 July 2020 / Accepted: 17 July 2020 / Published: 21 July 2020
(This article belongs to the Special Issue Frontiers in Artificial Intelligence)

Abstract

:
Objective: We have recently identified using multilayer perceptron analysis (artificial intelligence) a set of 25 genes with prognostic relevance in diffuse large B-cell lymphoma (DLBCL), but the importance of this set in other hematological neoplasia remains unknown. Methods and Results: We tested this set of genes (i.e., ALDOB, ARHGAP19, ARMH3, ATF6B, CACNA1B, DIP2A, EMC9, ENO3, GGA3, KIF23, LPXN, MESD, METTL21A, POLR3H, RAB7A, RPS23, SERPINB8, SFTPC, SNN, SPACA9, SWSAP1, SZRD1, TNFAIP8, WDCP and ZSCAN12) in a large series of gene expression comprised of 2029 cases, selected from available databases, that included chronic lymphocytic leukemia (CLL, n = 308), mantle cell lymphoma (MCL, n = 92), follicular lymphoma (FL, n = 180), DLBCL (n = 741), multiple myeloma (MM, n = 559) and acute myeloid leukemia (AML, n = 149). Using a risk-score formula we could predict the overall survival of the patients: the hazard-ratio of high-risk versus low-risk groups for all the cases was 3.2 and per disease subtype were as follows: CLL (4.3), MCL (5.2), FL (3.0), DLBCL not otherwise specified (NOS) (4.5), multiple myeloma (MM) (5.3) and AML (3.7) (all p values < 0.000001). All 25 genes contributed to the risk-score, but their weight and direction of the correlation was variable. Among them, the most relevant were ENO3, TNFAIP8, ATF6B, METTL21A, KIF23 and ARHGAP19. Next, we validated TNFAIP8 (a negative mediator of apoptosis) in an independent series of 97 cases of DLBCL NOS from Tokai University Hospital. The protein expression by immunohistochemistry of TNFAIP8 was quantified using an artificial intelligence-based segmentation method and confirmed with a conventional RGB-based digital quantification. We confirmed that high protein expression of TNFAIP8 by the neoplastic B-lymphocytes associated with a poor overall survival of the patients (hazard-risk 3.5; p = 0.018) as well as with other relevant clinicopathological variables including age >60 years, high serum levels of soluble IL2RA, a non-GCB phenotype (cell-of-origin Hans classifier), moderately higher MYC and Ki67 (proliferation index), and high infiltration of the immune microenvironment by CD163-positive tumor associated macrophages (CD163+TAMs). Conclusion: It is possible to predict the prognosis of several hematological neoplasia using a single gene-set derived from neural network analysis. High expression of TNFAIP8 is associated with poor prognosis of the patients in DLBCL.

Graphical Abstract

1. Introduction

According to the WHO Classification of Tumors of Hematopoietic and Lymphoid Tissues, revised 4th edition, published in 2017, there are 21 disease groups. The WHO classification classifies neoplasms primarily according to lineage (myeloid, lymphoid, or histiocytic/dendritic) and a normal counterpart is postulated for each neoplasm. Among them we can identify the groups of acute myeloid leukemia (AML) and the mature B-cell neoplasms. In adults, the relative frequencies of the B-cell lymphoma subtypes are diffuse large B-cell lymphoma (DLBCL) (37%), follicular lymphoma (FL) (29%), chronic lymphocytic leukemia/small lymphocytic lymphoma (CLL/SLL) (12%), extranodal marginal zone lymphoma of mucosa-associated lymphoid tissue (MALT lymphoma) (9%), mantle cell lymphoma (MCL) (7%) and others with a frequency below the 3% such as primary mediastinal large B-cell lymphoma (PMBL), high grade B not otherwise specified (NOS) (2.5%) and splenic marginal zone lymphoma (SMZL), etc. [1]. The prognosis of these subtypes is heterogeneous, e.g., being more indolent in CLL/SLL and FL, and more aggressive in AML, MCL and DLBCL [1]. Within the lymphoma subtype there is also clinical variability. Therefore, the search of prognostic markers related to the prognosis of the patients is necessary. The gene expression profile (GEP) has provided a basis for the stratification of the prognosis of the patients. For example, in DLBCL GEP has classified the patients into different molecular subtypes: germinal center B-cell-like (GCB) and activated B-cell-like (ABC) [2]. PMBL has a characteristic GEP with high PD-L1 and PD-L2 expression [3]. Burkitt Lymphoma between pediatric and adult patients shows a different profile [4]. The GEP of CLL identified the ZAP70 gene, which has prognostic relevance [5]. Nevertheless, to our knowledge, a gene signature with predictive value in several lymphoma subtypes has not been identified yet.
The term neural network applies to a loosely related family of models, characterized by a large parameter space and flexible structure, descending from studies of brain functioning. Neural networks are the preferred tool for many predictive data mining applications because of their power, flexibility, and ease of use. Predictive neural networks are particularly useful in applications where the underlying process is complex. Among them, the multilayer perceptron (MLP) procedure produces a predictive model for one or more dependent (target) variables based on the values of the predictor variables [6]. Using MLP procedure on GEP data of 414 cases DLBCL we have recently identified a set of 25 genes with predictive value, a signature that was independent of the cell-of-origin molecular subtypes [7]. In the MLP procedure, the target variable (output) was the prognosis of the patients and the predictor variables were the 54,614 gene-probes of the array. The results ranked the genes according to their relative importance for the neural network model and above 70% we identified the 25 genes, which mainly associated to a poor prognosis. According to KEGG, these genes belonged to the pathways of ribosome, RNA polymerase, Epstein–Barr virus (EBV) infection, glycolysis and pyrimidine metabolism [7].
In this project, we aimed to know if this set of 25 genes also had a prognostic relevance in other lymphoid neoplasia. We did not aim to perform an exhaustive analysis in each subtype with correlation to many clinicopathological features, but more a general profiling and correlation with the outcome. This series of 2029 cases included CLL, MCL, FL, DLBCL, multiple myeloma (MM) and AML. We found that this single gene set can also predict the prognosis of the patients. In addition, we validated one of the most relevant markers in an independent series of DLBCL from Tokai University and we found that high protein expression of TNFAIP8 also quantified using artificial intelligence associated with a poor prognosis of the patients.

2. Materials and Methods

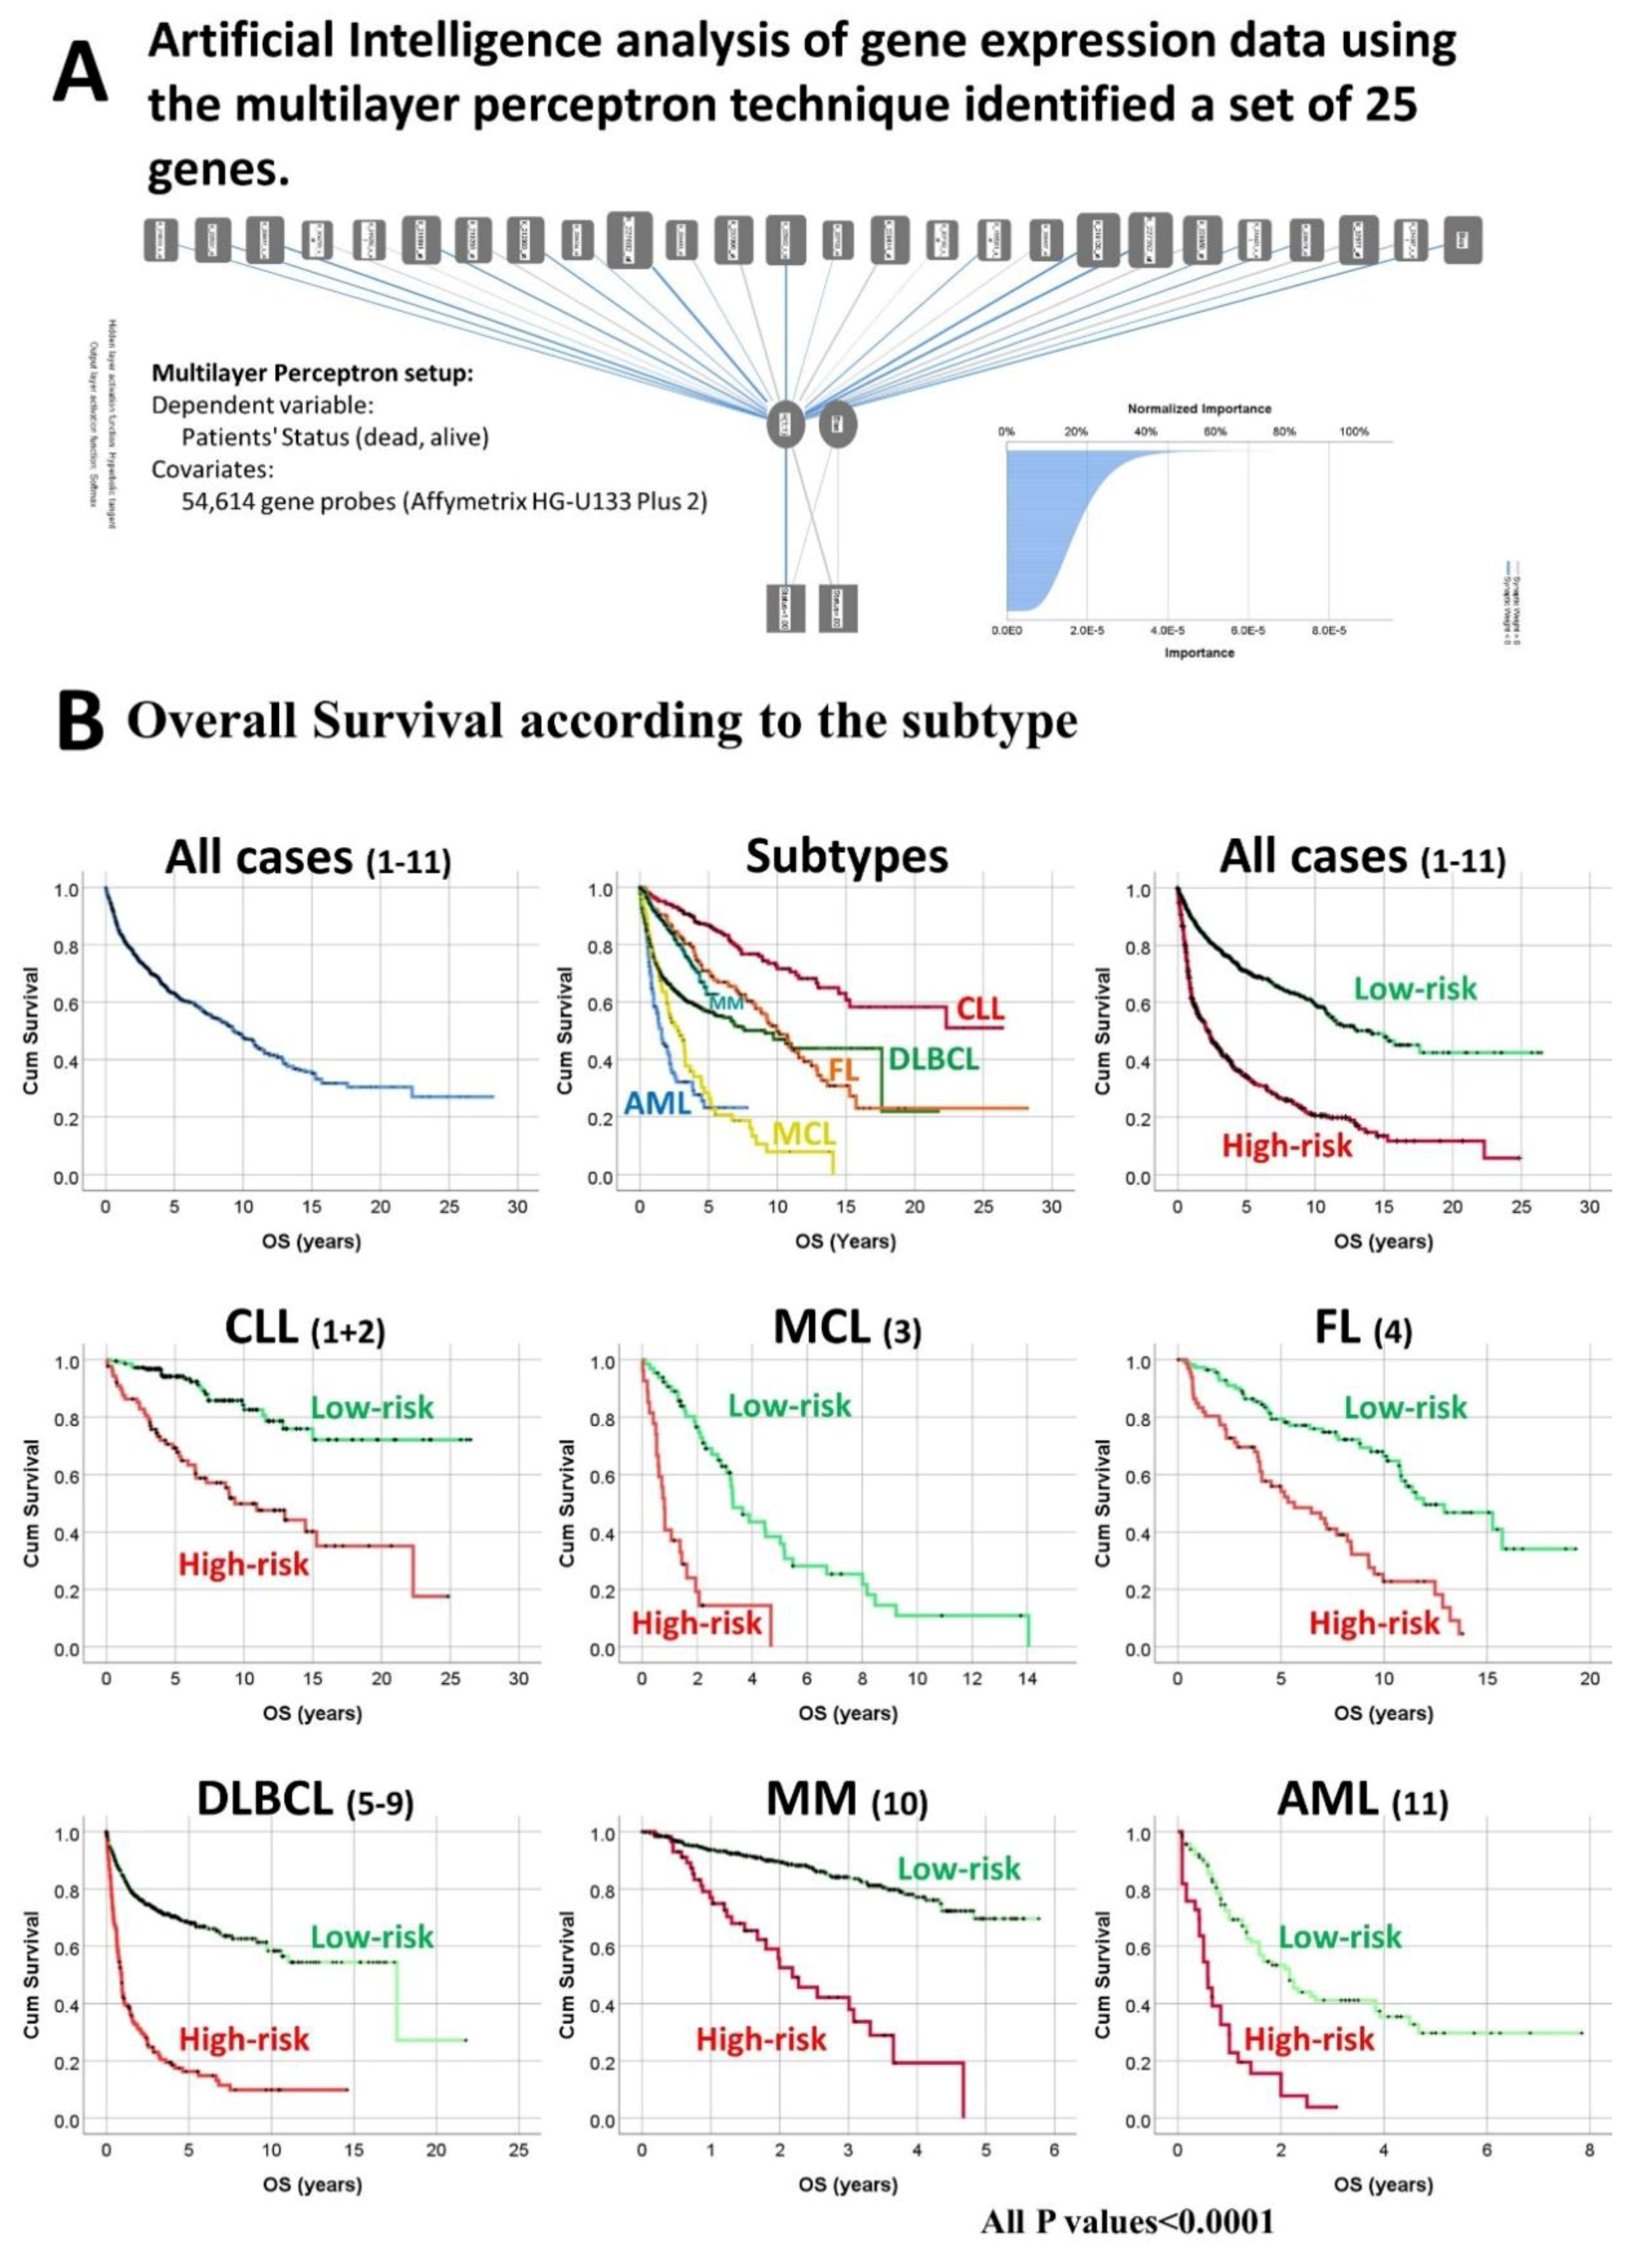
2.1. Subjects of Study and Set of Genes Derived from Artificial Intelligence Analysis

The subjects of study were obtained from several publicly available international lymphoma series of gene expression which are described in Table 1. In total, the series comprised 2029 cases as follows: CLL DataSet GSE22762 [8] (n = 107), CLL ICGC Dataset [9] (n = 201), MCL LLMPP [10] (n = 92), FL Dataset GSE16131 GPL96 [11] (n = 180), DLBCL Dataset GSE10846 [12] (n = 414), DLBCL Dataset GSE23501 [13] (n = 69), DLBCL E-TABM-346 [14] (n = 52), DLBCL TCGA [15] (n = 47), DLBCL GSE4475 [16] (n = 159), MM Dataset GSE2658 [17] (n = 559) and AML TCGA [15] (n = 149).
We had previously used the DLBCL gene expression set GSE10846 in our previous publication to perform the MLP analysis, in which we had identified the top 25 most relevant genes for the disease prognosis [7]. In summary, the MLP analysis was performed in a discovery set of 100 cases from Western countries diagnosed from nodal DLBCL. The mean age was 62 year, the male/female ratio was 1.2, the molecular subtype was activated b-cell type (ABC) in 49% (cell-of-origin classification based on the gene expression profile) and the original International Prognostic Index (IPI) for DLBCL was high-intermediate/high in 37% of the cases [7]. The samples were classified into a training group (n = 70) and a testing group (n = 30). The neural network had an input layer of 54,614 covariates (number of units), the hidden layer number was 1 (with 12 units) and used the hyperbolic tangent activation function, the output layer was characterized by 1 dependent variable (status, survival outcome of dead vs. alive), 2 unix, the Softmax activation function and the cross-entropy error function. In the neural network output the covariates were ranked according to their relative importance and the first 25th most relevant genes were identified as follows: SFTPC (100% normalized importance), ARHGAP19 (87%), MESD (84%), SNN (82%), ALDOB (81%), SPACA9 (C9orf9, 76%), SWSAP1 (C19orf39, 77%), WDCP (C2orf44, 77%), ZSCAN12 (76%), DIP2A (75%), ATF6B (75%), CACNA1B (75%), TNFAIP8 (74%), RPS23 (74%), POLR3H (74%), ENO3 (73%), RAB7A (72%), SERPINB8 (72%), SZRD1 (C1orf144, 72%), EMC9 (FAM158A, 71%), ARMH3 (C10orf76, 72%), LPXN (72%), KIF23 (71%), GGA3 (71%) and METTL21A (FAM119A, 70%) [7].
This human study had been reviewed by the ethics committee of the participating Institutions. Therefore, the investigation conforms to the principles outlined in the Declaration of Helsinki. All persons had given their informed consent prior to their inclusion in the study.

2.2. Gene Expression Analysis

Gene expression analysis was performed as we previously described [7]. For survival analysis the gene expression data was transformed to a prognostic index (also known as risk-score) to generate the risk-groups. Calculation was performed by multiplying the gene expression values with the estimated beta coefficients from the fitted Cox proportional hazards model. Of note, variables with positive coefficients (the B values) are associated with increased hazard and decreased survival times, i.e., as the predictor increases the hazard of the event increases and the predicted survival duration decreases. Negative coefficients indicate decreased hazard and increased survival times. Exp(B) is the ratio of hazard rates that are one unit apart on the predictor. After ranking the samples by their prognostic index, the samples were split into low-risk vs. high-risk groups. The risk-group splitting was also optimized using an algorithm that uses the inner-group p-value in order to identify the best cutoff for survival (i.e., lower p value). Then, conventional survival analysis was performed [7,18,19,20]. Within the 25 genes set, the most relevant genes are those that are consistently differently expressed between high-risk and low-risk groups although their weight and direction of the association is also taken into account.

2.3. Statistical Analysis

The analysis was performed using R version 3.6.3 (2020-02-29) (http://cran.r-project.org) as well as SPSS software (IBM SPSS Statistics 25, Armonk, NY, USA). The conventional criteria for overall survival was used. Survival analysis was performed with Kaplan–Meier and log rank tests, and Cox regression, method (enter), contrast (indicator). Hazard-ratios/risks (HR) were determined using Cox regression analysis (exp(B) values).

2.4. Validation of TNFAIP8 in an Independent Series of DLBCL

We validated one of the most relevant markers with immunohistochemistry using diagnostic biopsies in an independent series of 97 patients with Diffuse Large B-cell Lymphoma who were diagnosed at Tokai University Hospital from the years 2004 to 2011. This study was approved by the institutional review board (IRB 14R-080) and conducted in accordance with the Helsinki Declaration of 1975 as revised in 2008.

2.5. Immunohistochemistry of TNFAIP8 and Additional Markers

Immunohistochemistry (IHC) was performed in a Bond–Max fully automated IHC and in situ hybridization (ISH) equipment following the manufacturer’s instructions (Leica K.K., Tokyo, Japan) and using the 3,3′-Diaminobenzidine (DAB)-based BOND Polymer Refine Detection kit (#DS9800). For the cell of origin classification (Hans’ classifier) the following antibodies were used: CD10 (Clone 56C6, Novocastra, Leica K.K., Tokyo, Japan), BCL6 (LN22, Novocastra) and MUM1 (EAU32, Novocastra). Epstein–Barr virus (EBV) infection status was assessed by in situ hybridization of EBV-encoded mRNA (EBER, #BP0589, #AR0833, Novocastra). Macrophages were stained with anti-CD163 antibody (10D6, Novocastra). Apoptosis regulator BCL2 was stained with anti-BCL2 antibody (bcl2/100/D5, Novocastra). RGS1 expression was identified with an anti-RGS1 antibody (rabbit polyclonal, Thermo Fisher Scientific K.K., Tokyo, Japan). TNFAIP expression by the neoplastic B-lymphocytes was assessed using an anti-TNFAIP8 antibody (#14559-MM01, Sino Biological, Beijing, P.R. China), the proliferation index with anti-Ki67 (MM1, Novocastra) and the MYC proto-oncogene with anti-MYC (Y69, Abcam K.K., Tokyo, Japan). The antigen retrieval in most of the cases was the BOND Epitope Retrieval Solution 2 (Leica K.K.).

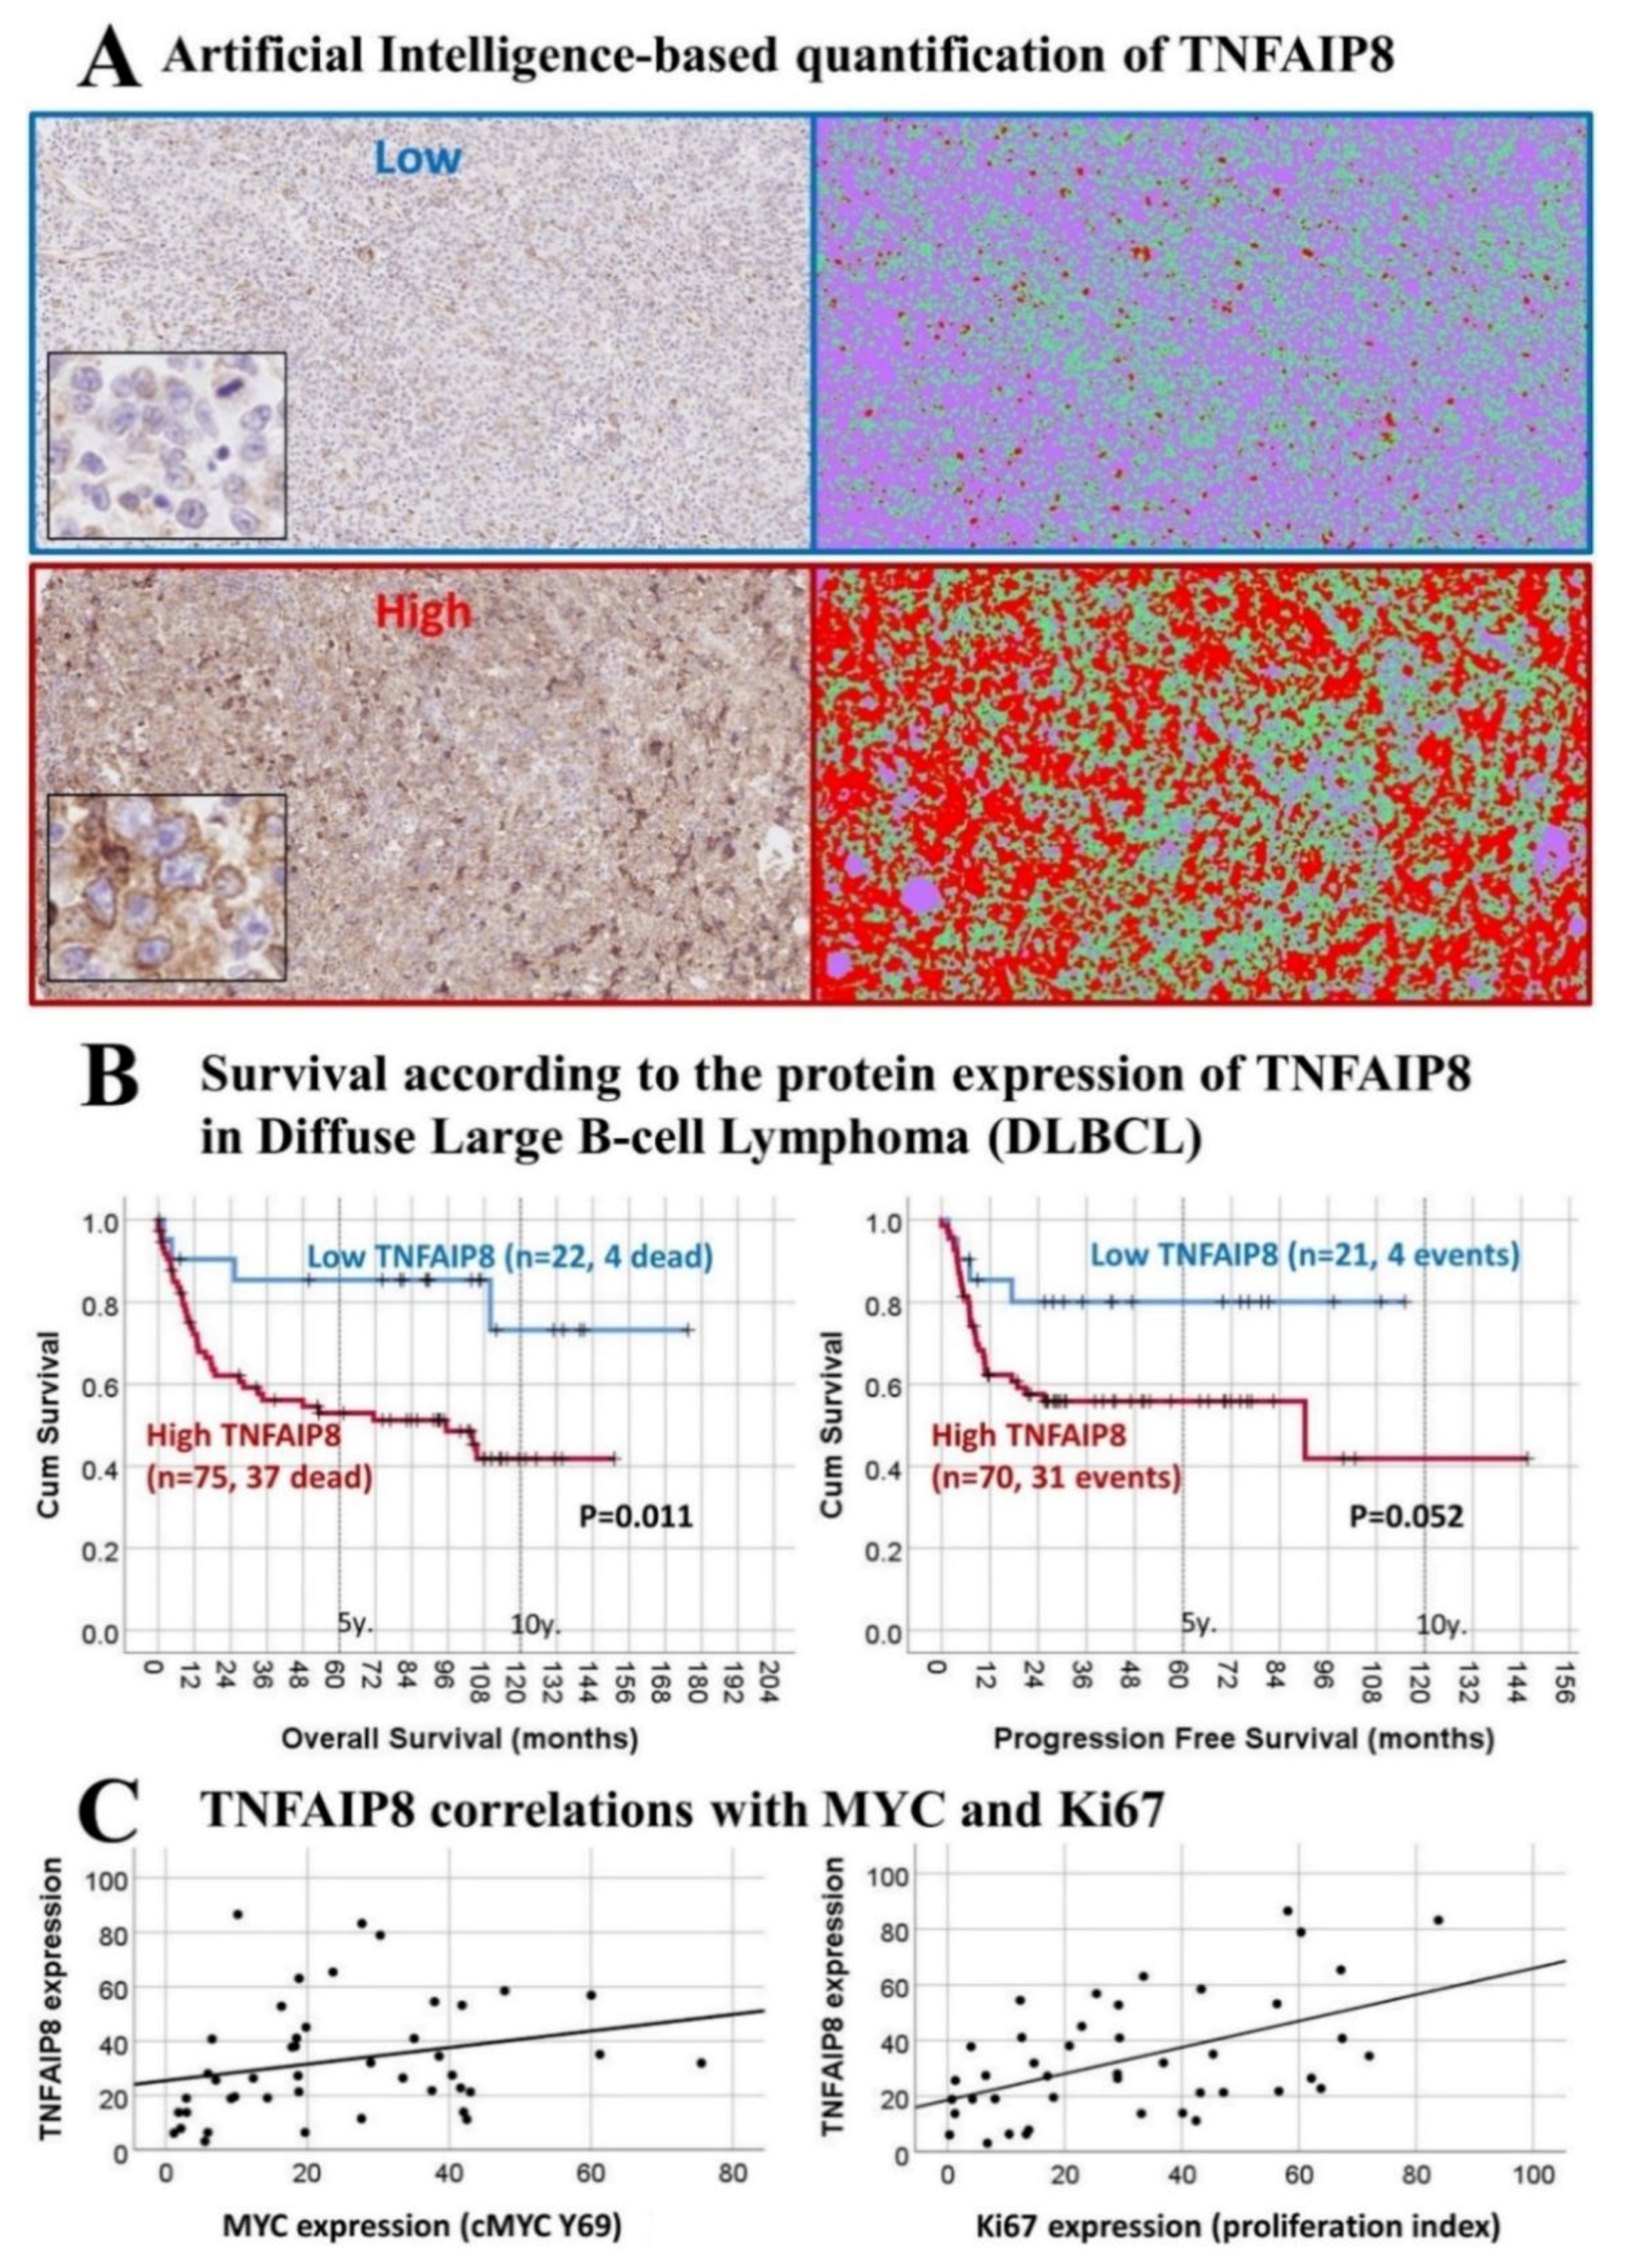
2.6. Conventional and Artificial Intelligence-Based Digital Image Analysis

Slides were visualized in an optical microscope (Olympus BX63, Olympus K.K., Tokyo, Japan) and later digitalized using a digital slide scanner (NanoZoomer S360, Hamamatsu Photonics, Hamamatsu City, Japan). For conventional analysis the image was evaluated as an ordinal variable: 0 (no staining), 1+ (low), 2+ (intermediate) and 3+ (high positive). Artificial intelligence-based digital image analysis was performed using Fiji software [(Fiji Is Just) ImageJ 2.0.0-rc-69/1.52p/Java 1.8.0_172 (64-bit)]. The artificial intelligence-based image analysis method quantified the marker based on the Waikato Environment for Knowledge Analysis [Weka, version 3.9.3, The University of Waikako Hamilton, New Zealand; with Java (TM) SE Runtime Environment, version 1.8.0_172-b11, Oracle Corporation, Redwood City, California, United States]. The raw immunohistochemical image, which corresponded with same area previously evaluated in the conventional analysis, was loaded into the analysis software and directly analyzed without type change. For the training input three types of pixels were selected: Class 1 (positive staining, DAB), Class 2 (negative areas) and Class 3 (absence of cellularity). The segmentation settings included as training features the Gaussian blur, hessian, membrane projections, Sobel filter and difference of Gaussians. The membrane thickness was set at value 1, membrane patch size at 19, minimum sigma at 1.0 and maximum sigma at 16.0. The training of the classifier included fast random forest. The classifying of the whole image used all available CPU threads. Finally, the segmentation of the whole image was performed, and each class area was inked in a different color and quantified using thresholds with Fiji software.

3. Results

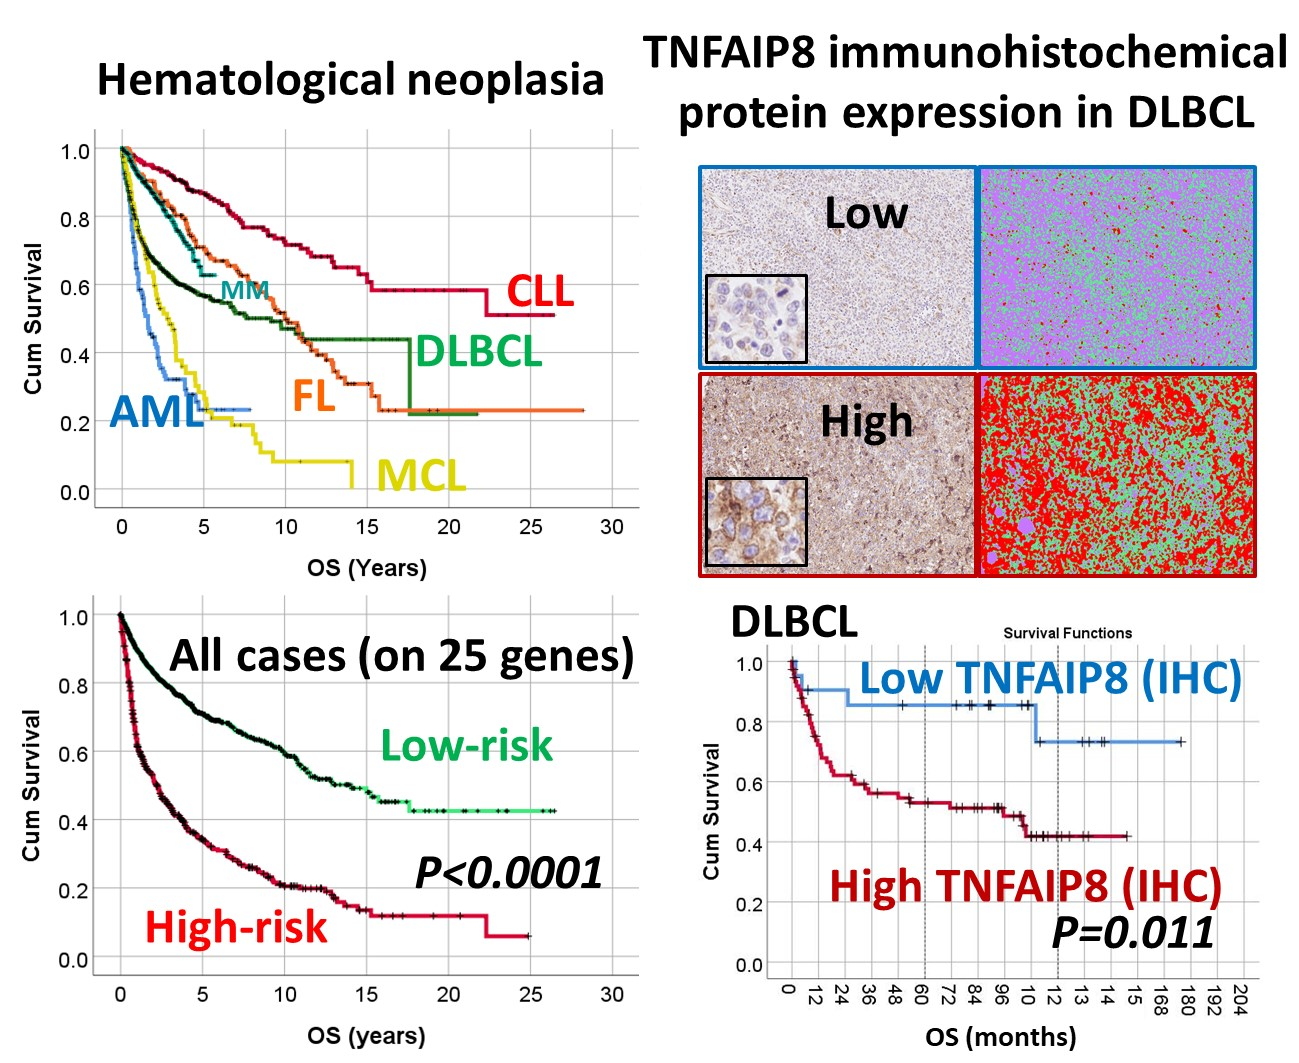
3.1. Overall Survival of the Lymphoma Subtypes and Acute Myeloid Leukemia.

This series of 2029 cases (identified in the Tables as “All”) was comprised of the hematological neoplasia’ subtypes of CLL, 308 cases (308/2029, 15%); MCL, 92 cases (5%), FL, 180 (9%); DLBCL, 741 (37%), MM, 559 (28%) and AML, 149 (7%) (Table 1). The follow-up time ranged from 0 to 26 years (Figure 1). The 1, 3 and 5-year overall survival (OS) was 84% (95%CI: 83–85%), 72% (70–72%) and 62% (62–63%). The overall survival was different between the different lymphoma subtypes and AML (p = 4.78 × 10−56). The subtype with better survival was CLL, followed by FL, MM, DLBCL, MCL and AML. In comparison to CLL (reference in SPSS), the hazard-risk were the following: FL (2.4), MM (1.9), DLBCL (3.5), MCL (6.6), and AML (8.3) (Table 1). Therefore, MCL is the lymphoma subtype with poorest prognosis.

3.2. Survival Analysis According to the Risk-Score Based on the Set of 25 Genes

The set of 25 genes, previously identified in the MLP, were analyzed for prognosis in the series of 2029 lymphoma cases. The analysis consisted on multivariate Cox regression analysis and the calculation of the risk-score. The risk-score values in each series were used for finding the most significant cut-off for overall survival and log-rank test (i.e., “maximized risk-groups”). The hazard-risks were calculated and the different gene expression between the two risk-groups were also tested. The analysis was made in each database independently as the gene expression was performed in different experimental conditions (i.e., different array platforms). In each lymphoma subtype, a final survival plot was created by merging the different risk-score groups (Figure 1).
In the Table 2 it is detailed the overall survivals data of the different subtypes according to the risk-groups obtained from the gene expression data. It includes the number of cases per group, the 5-year OS and the p value of the log-rank test, the hazard-risk/ratio and its p value. The risk-score based on the 25 genes managed find two risk groups in all the hematological subtypes with p values long below to 0.001 (the p values ranged from 6.58 × 10⁻⁸ to 3.92 × 10−42). The hazard-risks in average were 3.2, with a range from 3.0 to 5.2, being the differences more important in MCL and MM subtypes.
Correlation with several clinicopathological characteristics was available in some of the series. In MCL (Database Series 3), the prognostic relevance of the risk-groups was kept independently of the cyclin dependent kinase inhibitor 2A (CDKN2A, also known as INK/ARF), ATM serine/threonine kinase (ATM) and tumor protein p53 (TP53) deletion status. In case of FL (Series 4), the risk-groups were independent of the IPI. In DLBCL (Series 5) of the cell-of-origin molecular subtype and Eastern Cooperative Oncology Group (ECOG) performance status; and DLBCL of Series 6 and 9 from the molecular subtype as well.

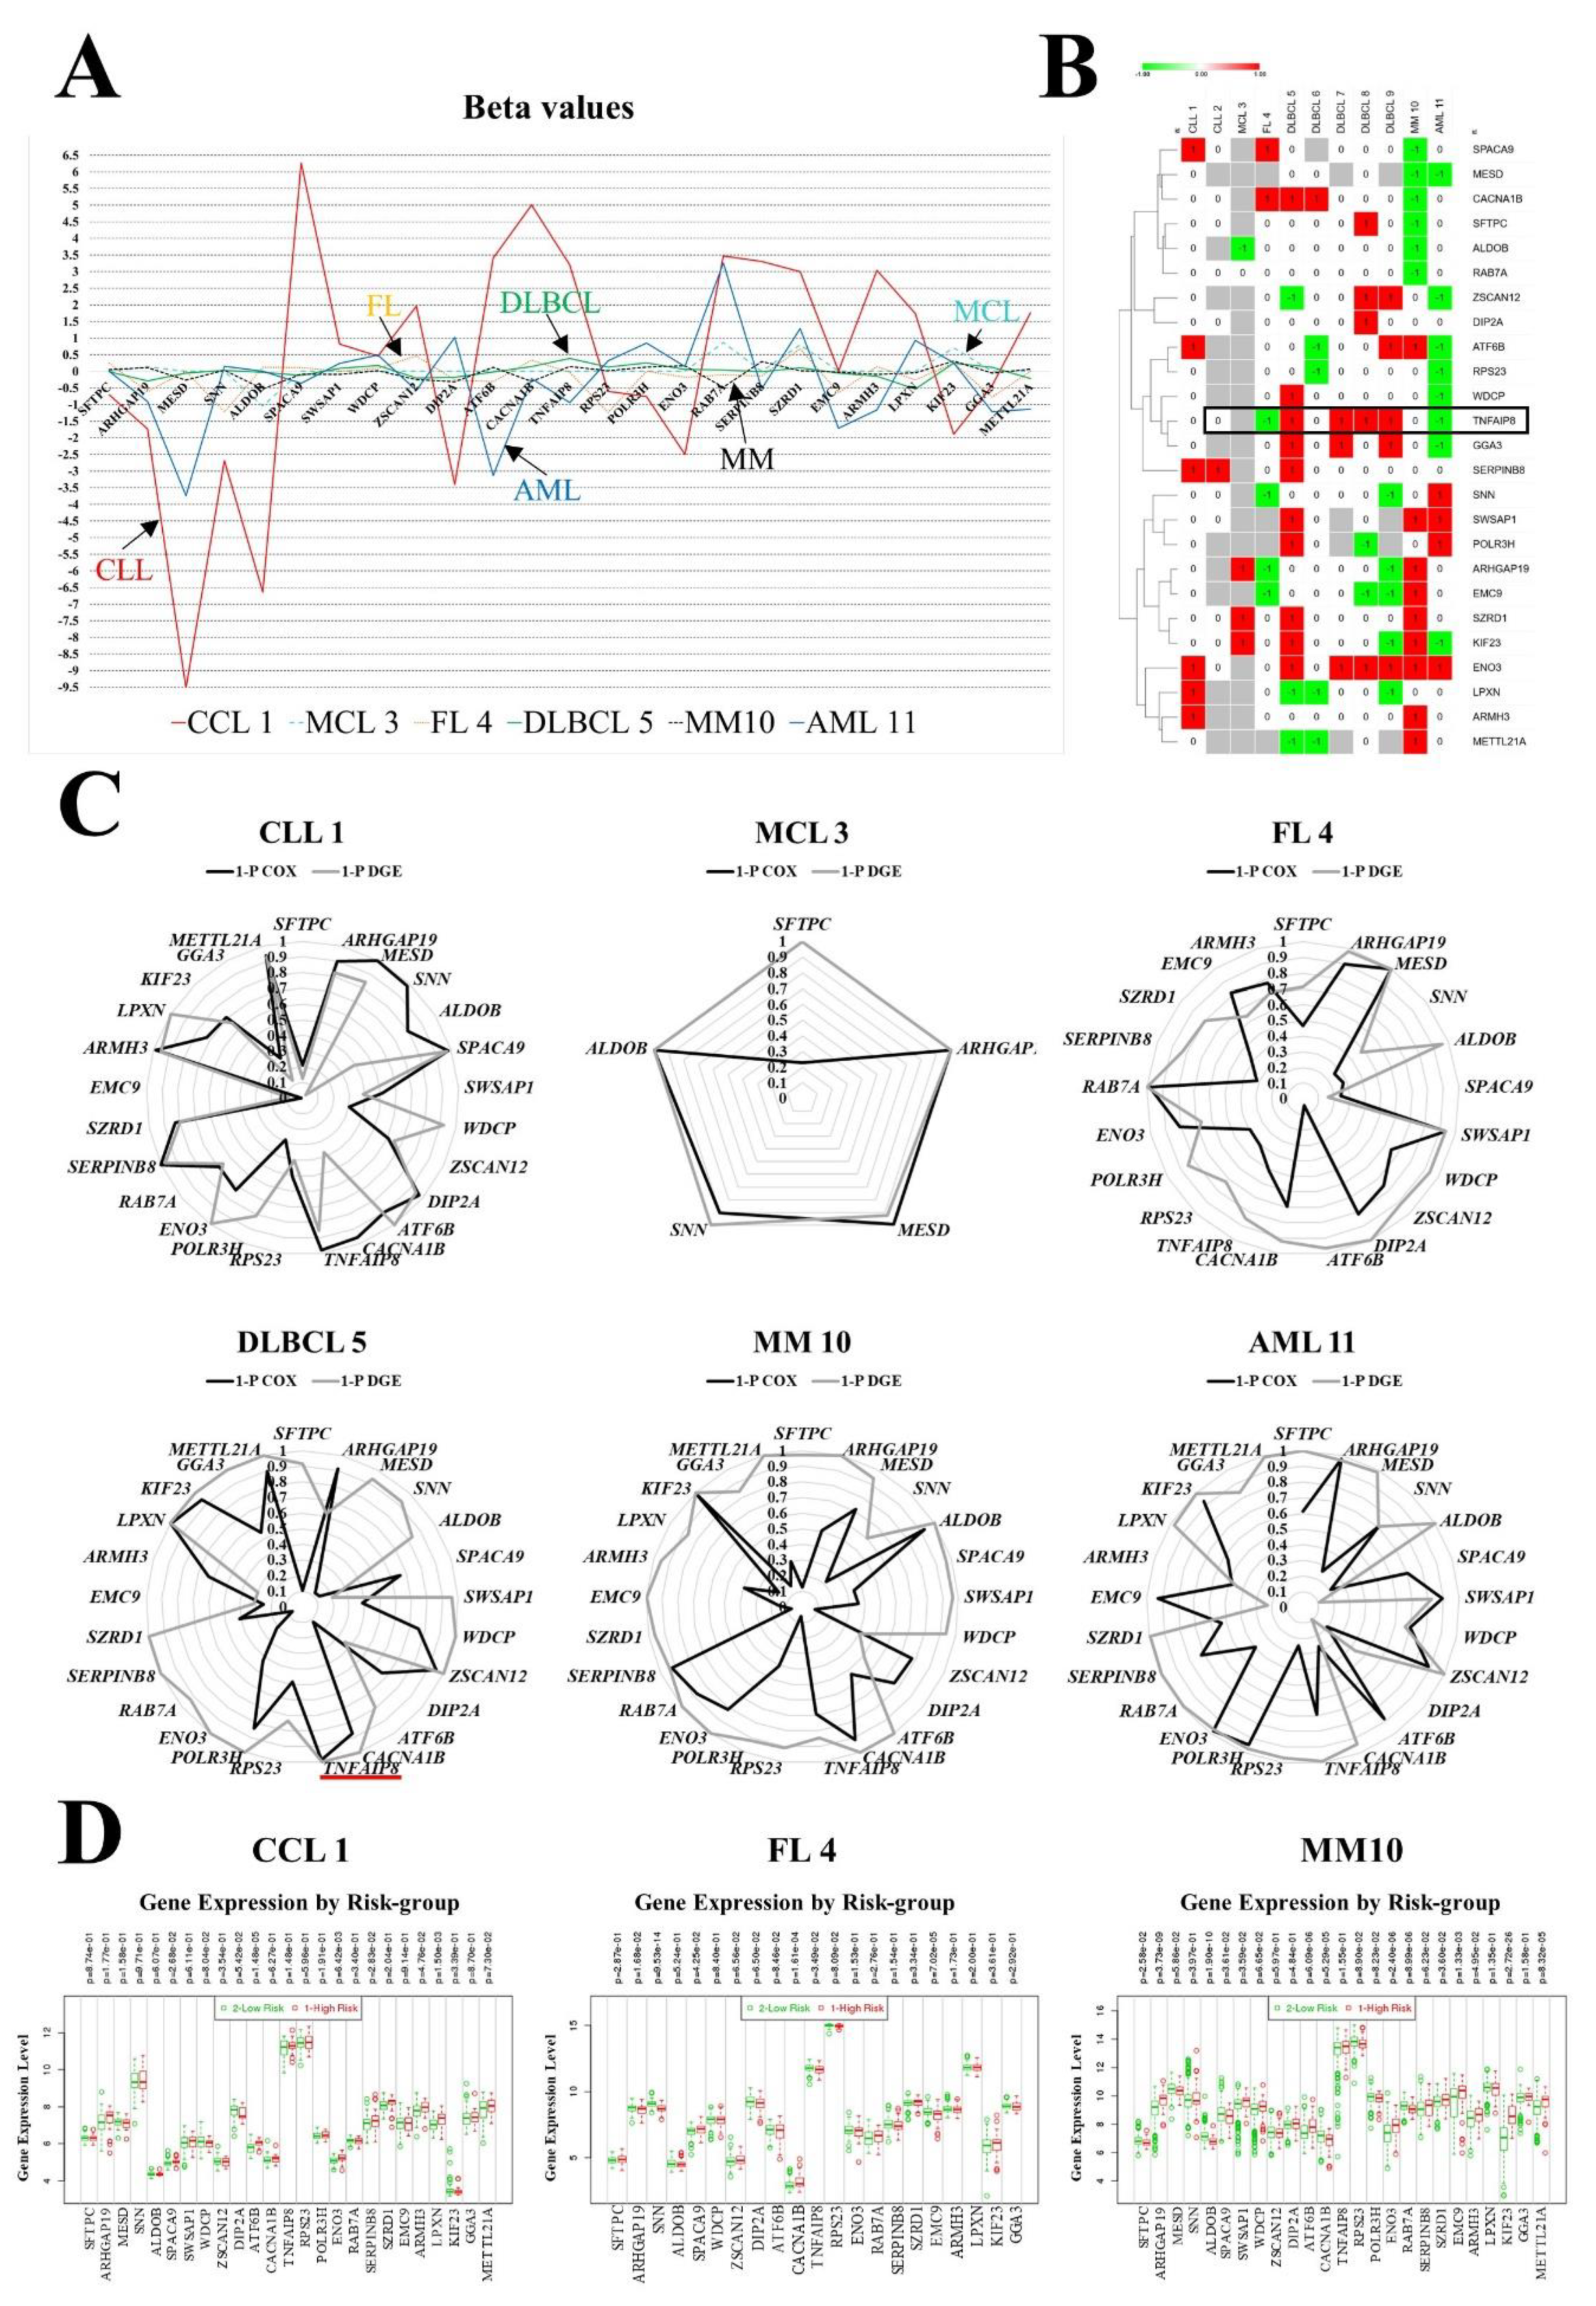
3.3. Gene Contribution to the Prognostic Model

The risk-groups are set up based on the risk-scores that are calculated with the beta values of the multivariate COX regression and the gene expression values (Figure 2). All the markers contribute to the final value of the risk-score as well as to the risk-group. Therefore, both beta and gene expression values are informative of which genes are the most relevant for the model and the direction of the association. In general, in our data, the most significant genes usually associated in the direction of high expression with poor prognosis but in some genes the association was inverted.
For example, in CLL Database Series 1, the multivariate COX regression analysis showed that among the 25 genes, 8 significantly contributed to the model (p < 0.05): MESD, SNN, SPACA9, DIP2A, CACNA1B, TNFAIP8, SERPINB8, ARMH3. Among them, high SPACA9, CACN1A, TNFAIP8, SERPINB8 and ARMH3 correlated with higher probability of death (positive correlation) while high MESD, SNN and DIP2A correlated with higher probability of being alive (inverse correlation). After risk-score calculation and stratification to risk-groups, analysis showed that high expression of SPACA9, ATF6B, ENO3, SERPINB8, ARMH3 and LPXN associated significantly to the high-risk group (p < 0.05).
In the MCL (Series 3), the array had only 5 of the genes of the 25 gene series. But with only 5 genes, it was possible to define the two risk-groups: high gene expression of ARHGAP19, SZRD1 and KIF23 associated to the high-risk group while high ALDOB to the low-risk group. In case of FL (Series 4), high expression of SPACA9 and CACNA1B associated to the high-risk group while high ARHGAP19, SNN, TNFAIP8 and EMC9 was associated to the low-risk group. In DLBCL (Series 5), high expression of SWSAP1, WDCP, CACNA1B, TNFAIP8, POLR3H, ENO3, SERPINB8, SZRD1, KIF23, GGA3, METIL21A associated to the high-risk group and high ZSCAN12 and LPXN to the low-risk group. In case of MM (Series 10) and AML (Series 11) most of the genes were represented in the high or low-risk profile. Please refer to the tables (e.g., Table 3) and figures for detailed information of all the neoplastic subtypes and database series. Of note, high ENO3 associates to the high-risk group in several subtypes including CLL, DLBCL, MM and AML.

3.4. Immunohistochemical Expression of TNFAIP8 in DLBCL

The characteristics of the subjects of the validation set of 97 cases from Tokai University Hospital are present in the Table 4. The age ranged from 14 to 97 years old with a median of 68 years, and 54 were men (55.7%). According to the cell of origin classification by the Hans’ classifier 33% were GCB and 67% non-GCB. Ninety-four percent of the cases had received RCHOP or RCHOP-like therapy. Patients that had an unfavorable prognosis associated with age >60 years, high LDH, high sIL2RA, ECOG performance status ≥2, clinical stage III–IV, extranodal sites >1, higher IPI score, a non-GCB molecular subtype, high RGS1 expression, positive BCL2 expression and positivity for Epstein–Barr virus (EBER+). The alive/dead ratio was 0.73.
The expression of TNFAIP8 ranged from 3.2% to 87.9%, with a median of 38.1% and a mean of 41.2% ± 25.3 STD. The TNFAIP8 staining was also evaluated by the pathologist (J.C.) under the microscope using a conventional ordinal scale approach (0, 1+, 2+ and 3+). Both quantifications had a good correlation (Spearman’s rho correlation 0.887, p = 1.0088 × 10⁻³³). The TNFAIP8 values from the A.I.-based quantification were ranked and the most adequate cutoff point for overall survival was calculated (≥19%). Patients with high TNFAIP8 expression had a 250% more risk of dying than the patients with low expression (hazard risk = 3.5, 95% CI 1.244–9.849). The 5-year overall survival of the patients, high vs. low TNFAIP8, was 53% (95% CI 63.8–41.2%) vs. 85% (95% CI 100.7–70.1%), respectively [log rank (Mantel–Cox) p = 0.011]. The 10-years overall survival of the patients, high vs. low TNFAIP8, was 42% (95%CI 55.5–28.1%) vs. 73% (95%CI 98.9–47.5%), respectively [Log Rank (Mantel-Cox) p = 0.011]. TNFAIP8 expression was also correlated with several clinicopathological characteristics. High TNFAIP8 correlated with age >60 years, high serum IL2RA, non-GCB phenotype and high infiltration of CD163+ M2-like tumor associated macrophages (CD163+TAMs). TNFAIP8 also moderately correlated with MYC (Spearman’s correlation coefficient 0.389, p = 0.009) and Ki67 (proliferation index; Spearman’s correlation coefficient 0.48, p = 0.001). High TNFAIP8 also associated (trend) a worse progression free survival (p = 0.052). Finally, a multivariate COX analysis between TNFAIP8 (high vs. low) and IPI (low+low/intermediate vs. high/intermediate+high) show that only TNFAIP8 kept the prognostic value (HR = 3.5, p = 0.040). All the information of this paragraph is present in the Table 4 and Table 5, and the Figure 3.

4. Discussion

Neural networks are a computer architecture, implementable in either hardware or software, modeled after biological neural networks. Like the biological system, the computerized neural networks that are known as perceptrons consist of neuron-like units. In our previous project, we focused on DLBCL and we used a multilayer perceptron approach with a hidden layer with 12 units that allowed us to identify the top 25 genes associated to the prognosis of the DLBCL patients [7,21]. Next, in this research, we aimed to know if that set of 25 genes also had predictive value in other hematological neoplasia. Therefore, we searched for available gene expression databases that we could easily use for the analysis. We selected 11 gene expression series comprising CLL, MCL, FL, DLBCL, MM and AML that in total included 2029 cases from Western countries. The follow-up of this series of 2029 cases ranged from 0 to 26 years and had a 1, 3 and 5-year OS of 84%, 72% and 62%, respectively. This survival is the standard of a general lymphoma series. Each hematological neoplasia had a different survival that was also in concordance with other series and as described in the WHO Classification of Tumors of Hematopoietic and Lymphoid Tissues. [1] Therefore, we expected that the results of this analysis would be applicable to patients of hematological neoplasia (mainly lymphoma subtypes) from Western countries.
A detailed description of the biological function of each of the 25 genes is present in our previous publication, [7] so refer to that publication for the thorough information. To the best of our knowledge, the prognostic relevance in lymphoma of these 25 markers have not been reported yet. In general, these markers are related to the following terms: ribosome, protein binding, RNA polymerase activity, transferase activity and enzyme binding. According to the KEGG pathways, the most relevant were ribosome, RNA polymerase, EBV infection, glycolysis and pyrimidine metabolism. [7] A functional network association analysis did not find significant straightforward association between these markers. [7] Therefore, these markers seem to be independent between them and do not belong to a common pathway.
All markers contribute to the risk-score (i.e., prognostic score) but they differ in their weight and in the direction of the association, which will be different in each series. Nevertheless, some markers had a conspicuous role in the prognosis of the patients in across several subtypes: ENO3, KIF23, EMC9, ARHGAP19 and TNFAIP8 were overexpressed in the high-risk or low-risk groups in several subtypes. ENO3 protein is the beta-enolase, with main function in striated muscle development and regeneration. This protein is involved in Step 4 of the sub pathway that synthesizes pyruvate from D-glyceraldehyde 3-phosphate. [22] Using bioinformatics analysis, ENO3 had been highlighted in the expression profile of hepatocellular carcinomas. [23] In our series, ENO3 had a significant role in CLL, DLBCL, MM and AML. KIF23 is a component of the centralspindlin complex that serves as a microtubule-dependent and Rho-mediated signaling required for the myosin contractile ring formation during the cell cycle cytokinesis. KIF23 is essential for cytokinesis in Rho-mediated signaling. [22] Therefore, KIF23 has a role in mitotic cytokinesis. In addition, according to Reactome, KIF23 is associated to the antigen processing and presentation of exogenous peptide antigen via MHC class II, [24] which is a function of B lymphocytes. In gastric cancer, KIF23 promotes cancer by stimulating cell proliferation. [25] KIF23 had a role in MCL, DLBCL, MM and AML. EMC9 is also known as ER Membrane Protein Complex Subunit 9 but not additional information about this protein is known. The relationship of EMC9 with lymphoid neoplasia is not reported as well. In our research, EMC9 had a role in FL, DLBCL and MM. ARHGAP19 is a signal transductor located in the nucleus that has GTPase activator activity. ARHGAP19 is predominantly expressed in hematopoietic cells and has an essential role in the division of T lymphocytes. Overexpression of ARHGAP19 in lymphocytes delays cell elongation and cytokinesis. [26] ARHGAP19 had a role in MCL, FL, DLBCL and MM. TNFAIP8 acts as a negative mediation of apoptosis and may play a role in tumor progression. Polymorphisms are related to the risk of non-Hodgkin’s lymphoma [27] and it has been previously identified in DLBCL [28]. TNFAIP8 had a role in FL, DLBCL and MM. ATF6B is a transcriptional factor that acts in the unfolded protein response (UPR) pathway by activating UPR target genes induced during ER stress. [22] To date, no manuscript has related ATF6B with lymphoma.
TNFAIP8 was one of the most relevant markers that we had identified by A.I. By gene expression, TNFAIP8 associated to a poor prognosis of the patients. Among the different lymphoid neoplasia subtypes, TNFAIP8 was especially relevant in DLBCL. Therefore, we decided to validate the prognostic value of TNFAIP8 in an independent DLBCL series from Tokai University Hospital. This series of Tokai is a conventional series of DLBCL as shown in Table 4. Therefore, our results should be reproducible by other researchers. Ninety-seven patients with de novo DLBCL were selected and the diagnostic biopsies were analyzed for protein expression of TNFAIP8 using immunohistochemistry. The expression of TNFAIP8 was evaluated using a conventional approach as an ordinal variable (0, 1+, 2+ and 3+) and with a novel digital image quantification method based on A.I. segmentation. Of note, good correlation between both methods was found. High protein expression of TNFAIP8 correlated with a poor prognosis of the patients. Therefore, we have confirmed the prognostic value of TNFAIP8 in DLBCL and we have shown how A.I. can be applied in the histopathological evaluations. TNFAIP8 acts as a negative mediator of apoptosis and may play a role in tumor progression. TNFAIP8 suppresses the TNF-mediated apoptosis by inhibiting caspase-8 activity but not the processing of procaspase-8, subsequently resulting in inhibition of BID cleavage and caspase-3 activation [29]. Interestingly, we also found correlation of TNFAIP3 with other clinicopathological characteristics that usually associate to poor prognosis of DLBCL such as age > 60 years, high sILRA, non-GCB subtype and high CD163+macrophages. The reason of these associations will need further investigation.
In conclusion, we have confirmed that it is possible to predict the prognosis of the patients with hematological neoplasia (mainly B-cell non-Hodgkin lymphomas) with a risk-score formula based on the gene expression of 25 genes, which were previously identified using artificial intelligence approach in a series of DLBCL. In addition, we have found that high protein expression of TNFAIP8 is associated to poor prognosis in DLBCL patients.

Author Contributions

J.C., principal investigator, designed the project, data acquisition, performed analysis and wrote the manuscript. R.H. supervised the project and revised the paper. N.N. supervised the project and approved final submission. Y.Y.K., M.M., S.H., S.T., H.I., Y.K., A.I., S.S., K.A. contributed to data acquisition and diagnosis of the cases. All authors have read and agreed to the published version of the manuscript.

Funding

This research was funded by grant KAKEN 18K15100 to Joaquim Carreras, Grant-in-Aid for Early-Career Scientists from the Japanese Society for the Promotion of Science (JSPS) of the Ministry of Education, Culture, Sports, Science and Technology-Japan (MEXT). R.H. was funded by Al-Jalila Foundation (AJF201741), the Sharjah Research Academy (Grant code: MED001) and University of Sharjah (Grant code: 1901090258).

Conflicts of Interest

The authors declare no conflict of interest.

References

  1. Swerdlow, S.H.; Campo, E.; Harris, N.L. WHO Classification of Tumors of Haematopoietic and Lymphoid Tissues, 4th ed.; International Agency for Research on Cancer: Lyon, France, 2017. [Google Scholar]
  2. Li, S.; Young, K.H.; Medeiros, L.J. Diffuse large B-cell lymphoma. Pathology 2018, 50, 74–87. [Google Scholar] [CrossRef]
  3. Rosenwald, A.; Wright, G.; Leroy, K.; Yu, X.; Gaulard, P.; Gascoyne, R.D.; Chan, W.C.; Zhao, T.; Haioun, C.; Greiner, T.C.; et al. Molecular Diagnosis of Primary Mediastinal B Cell Lymphoma Identifies a Clinically Favorable Subgroup of Diffuse Large B Cell Lymphoma Related to Hodgkin Lymphoma. J. Exp. Med. 2003, 198, 851–862. [Google Scholar] [CrossRef]
  4. Lee, S.; Day, N.S.; Miles, R.R.; Perkins, S.L.; Lim, M.S.; Ayello, J.; Van De Ven, C.; Harrison, L.; El-Mallawany, N.K.; Goldman, S.; et al. Comparative genomic expression signatures of signal transduction pathways and targets in paediatric Burkitt lymphoma: A Children’s Oncology Group report. Br. J. Haematol. 2017, 177, 601–611. [Google Scholar] [CrossRef] [Green Version]
  5. Codony, C.; Crespo, M.; Abrisqueta, P.; Montserrat, E.; Bosch, F. Gene expression profiling in chronic lymphocytic leukaemia. Best Pract. Res. Clin. Haematol. 2009, 22, 211–222. [Google Scholar] [CrossRef]
  6. IBM Corp. IBM SPSS Neural Networks 25. IBM SPSS Statistics for Windows, Version 25.0; IBM Corp.: Armonk, NY, USA, 2017.
  7. Carreras, J.; Hamoudi, R.; Nakamura, N. Artificial Intelligence Analysis of Gene Expression Data Predicted the Prognosis of Patients with Diffuse Large B-Cell Lymphoma. Tokai J. Exp. Clin. Med. 2020, 45, 37–48. [Google Scholar] [PubMed]
  8. Herold, T.; Jurinovic, V.; Metzeler, K.H.; Boulesteix, A.-L.; Bergmann, M.; Seiler, T.; Mulaw, M.A.; Thoene, S.; Dufour, A.; Pasalic, Z.; et al. An eight-gene expression signature for the prediction of survival and time to treatment in chronic lymphocytic leukemia. Leukemia 2011, 25, 1639–1645. [Google Scholar] [CrossRef] [PubMed]
  9. International Cancer Genome Consortium. International network of cancer genome projects. Nature 2010, 464, 993–998. [Google Scholar] [CrossRef] [Green Version]
  10. Rosenwald, A.; Wright, G.; Wiestner, A.; Chan, W.C.; Connors, J.M.; Campo, E.; Gascoyne, R.D.; Grogan, T.M.; Muller-Hermelink, H.K.; Smeland, E.B.; et al. The proliferation gene expression signature is a quantitative integrator of oncogenic events that predicts survival in mantle cell lymphoma. Cancer Cell 2003, 3, 185–197. [Google Scholar] [CrossRef] [Green Version]
  11. Leich, E.; Salaverria, I.; Bea, S.; Zettl, A.; Wright, G.; Moreno, V.; Gascoyne, R.D.; Chan, W.-C.; Braziel, R.M.; Rimsza, L.M.; et al. Follicular lymphomas with and without translocation t(14;18) differ in gene expression profiles and genetic alterations. Blood 2009, 114, 826–834. [Google Scholar] [CrossRef] [PubMed]
  12. Lenz, G.; Wright, G.; Dave, S.S.; Xiao, W.; Powell, J.; Zhao, H.; Xu, W.; Tan, B.; Goldschmidt, N.; Iqbal, J.; et al. Lymphoma/Leukemia Molecular Profiling Project. Stromal gene signatures in large-B-cell lymphomas. N. Engl. J. Med. 2008, 359, 2313–2323. [Google Scholar] [CrossRef] [PubMed] [Green Version]
  13. Shaknovich, R.; Geng, H.; Johnson, N.A.; Tsikitas, L.; Cerchietti, L.; Greally, J.M.; Gascoyne, R.D.; Elemento, O.; Melnick, A. DNA methylation signatures define molecular subtypes of diffuse large B-cell lymphoma. Blood 2010, 116, e81–e89. [Google Scholar] [CrossRef] [PubMed] [Green Version]
  14. Jais, J.P.; Haioun, C.; Molina, T.J.; Rickman, D.S.; De Reynies, A.; Berger, F.; Gisselbrecht, C.; Brière, J.; Reyes, F.; et al. The expression of 16 genes related to the cell of origin and immune response predicts survival in elderly patients with diffuse large B-cell lymphoma treated with CHOP and rituximab. Leukemia 2008, 22, 1917–1924. [Google Scholar] [CrossRef] [PubMed] [Green Version]
  15. Cancer Genome Atlas Research Network; Weinstein, J.N.; Collisson, E.A.; Mills, G.B.; Shaw, K.R.M.; Ozenberger, B.A.; Ellrott, K.; Shmulevich, I.; Sander, C.; Stuart, J.M. The Cancer Genome Atlas Pan-Cancer analysis project. Nat. Genet. 2013, 45, 1113–1120. [Google Scholar]
  16. Hummel, M.; Bentink, S.; Berger, H. Molecular Mechanisms in Malignant Lymphomas Network Project of the Deutsche Krebshilfe. A biologic definition of Burkitt’s lymphoma from transcriptional and genomic profiling. N. Engl. J. Med. 2006, 354, 2419–2430. [Google Scholar] [CrossRef] [PubMed] [Green Version]
  17. Zhan, F.; Huang, Y.; Colla, S.; Stewart, J.P.; Hanamura, I.; Gupta, S.; Epstein, J.; Yaccoby, S.; Sawyer, J.; Burington, B.; et al. The molecular classification of multiple myeloma. Blood 2006, 108, 2020–2028. [Google Scholar] [CrossRef] [Green Version]
  18. Tsuda, S.; Carreras, J.; Kikuti, Y.Y.; Nakae, H.; Dekiden-Monma, M.; Imai, J.; Tsuruya, K.; Nakamura, J.; Tsukune, Y.; Uchida, T.; et al. Prediction of steroid demand in the treatment of patients with ulcerative colitis by immunohistochemical analysis of the mucosal microenvironment and immune checkpoint: Role of macrophages and regulatory markers in disease severity. Pathol. Int. 2019, 69, 260–271. [Google Scholar] [CrossRef]
  19. Carreras, J.; Lopez-Guillermo, A.; Kikuti, Y.Y.; Itoh, J.; Masashi, M.; Ikoma, H.; Tomita, S.; Hiraiwa, S.; Hamoudi, R.; Rosenwald, A.; et al. High TNFRSF14 and low BTLA are associated with poor prognosis in Follicular Lymphoma and in Diffuse Large B-cell Lymphoma transformation. J. Clin. Exp. Hematop. 2019, 59, 1–16. [Google Scholar] [CrossRef] [Green Version]
  20. Aguirre-Gamboa, R.; Gomez-Rueda, H.; Martínez-Ledesma, E.; Chacolla-Huaringa, R.; Rodriguez-Barrientos, A.; Tamez-Pena, J.; Treviño, V. SurvExpress: An online biomarker validation tool and database for cancer gene expression data using survival analysis. PLoS ONE 2013, 8, e74250. [Google Scholar]
  21. Neural Networks (Computer). NCBI, MeSH Unique ID: D016571. Year Introduced: 1992. Available online: https://0-www-ncbi-nlm-nih-gov.brum.beds.ac.uk/mesh/?term=%22Neural+Networks+(Computer)%22%5BMeSH+Terms%5D (accessed on 20 May 2020).
  22. The UniProt Consortium. UniProt: A worldwide hub of protein knowledge. Nucleic Acids Res. 2019, 47, D506–D515. [Google Scholar] [CrossRef] [Green Version]
  23. Liu, Z.K.; Zhang, R.Y.; Yong, Y.L.; Zhang, Z.Y.; Li, C.; Chen, Z.N.; Bian, H. Identification of crucial genes based on expression profiles of hepatocellular carcinomas by bioinformatics analysis. Peer J. 2019, 7, e7436. [Google Scholar] [CrossRef] [Green Version]
  24. Fabregat, A.; Jupe, S.; Matthews, L.; Sidiropoulos, K.; Gillespie, M.; Garapati, P.; Haw, R.; Jassal, B.; Korninger, F.; May, B.; et al. The Reactome Pathway Knowledgebase. Nucleic Acids Res. 2018, 46, D649–D655. [Google Scholar] [CrossRef] [PubMed]
  25. Li, X.L.; Ji, Y.M.; Song, R.; Li, X.N.; Guo, L.S. KIF23 Promotes Gastric Cancer by Stimulating Cell Proliferation. Dis. Markers 2019, 2019, 9751923. [Google Scholar] [CrossRef] [PubMed] [Green Version]
  26. David, M.D.; Petit, D.; Bertoglio, J. The RhoGAP ARHGAP19 controls cytokinesis and chromosome segregation in T lymphocytes. J. Cell Sci. 2014, 127, 400–410. [Google Scholar] [CrossRef] [PubMed] [Green Version]
  27. Zhang, Y.; Wang, M.Y.; He, J.; Wang, J.-C.; Yang, Y.-J.; Jin, L.; Chen, Z.-Y.; Ma, X.-J.; Sun, M.-H.; Xia, K.-Q.; et al. Tumor necrosis factor-α induced protein 8 polymorphism and risk of non-Hodgkin’s lymphoma in a Chinese population: A case-control study. PLoS ONE 2012, 7, e37846. [Google Scholar] [CrossRef] [PubMed] [Green Version]
  28. Deeb, S.J.; Tyanova, S.; Hummel, M.; Schmidt-Supprian, M.; Cox, J.; Mann, M. Machine Learning-based Classification of Diffuse Large B-cell Lymphoma Patients by Their Protein Expression Profiles. Mol. Cell. Proteom. 2015, 14, 2947–2960. [Google Scholar] [CrossRef] [Green Version]
  29. You, Z.; Ouyang, H.; Lopatin, D.; Polver, J.P.; Wang, C.Y. Nuclear Factor-Kappa B-inducible Death Effector Domain-Containing Protein Suppresses Tumor Necrosis Factor-Mediated Apoptosis by Inhibiting caspase-8 Activity. J. Biol. Chem. 2001, 276, 26398–26404. [Google Scholar] [CrossRef] [Green Version]
Figure 1. Overall survival of the series. (A) We have recently performed artificial intelligence analysis using the multilayer perceptron technique in a series of cases of diffuse large B-cell lymphoma (DLBCL). We have identified a set of 25 with prognostic relevance in DLBCL. We aimed to check the usefulness of this set in other lymphoid neoplasia. (B) Overall survival of all the cases of the series (Subtypes 1 to 11) and comparison according to each subtype. Based on the gene expression of a single set of 25 genes and using a risk-score formula two groups were defined: low-risk and high-risk. In the log-rank tests, all p values were <0.0001. CLL, chronic lymphocytic leukemia; MCL, mantle cell lymphoma; FL, follicular lymphoma; DLBCL, diffuse large B-cell lymphoma; MM, multiple myeloma; AML, acute myeloid leukemia.
Ai 01 00023 g001
Figure 2. Gene contribution to survival. (A) Beta values from the multivariate Cox analysis of the most relevant subtypes. The risk-scores were calculated with multiplication of the beta values with the gene expression values. A positive beta value corresponds to a risk factor and a negative to protective factor for outcome (dead). (B) Heatmap of the Table 3. Correlation between high gene expression of a marker with the risk-groups in the different subtypes: 1, high-risk group (red color); −1, low-risk group (green); 0, no risk-group association (white); genes that are not present in the array (grey). (C) Radial plots of the most relevant subtypes. Black color lines correspond to the p values (1−p calculation) of each gene in the multivariate Cox regression analysis. Grey colors correspond to the p values (1−p) of the differential gene expression (DGE) between high-risk vs. low-risk groups (grey color). Values >0.95 correspond to p < 0.05. Note: risk-scores are calculated by multiplying the beta values with the gene expression. The p values are useful to identify the most relevant markers, but all markers contribute to the risk-score calculation. (D) Differential gene expression between high-risk and low-risk group in three representative subtypes (Subtype 1 of CLL, FL 4 and MM 10).
Ai 01 00023 g002
Figure 3. Immunohistochemical analysis of the TNFAIP8 expression in diffuse large B-cell lymphoma (DLBCL). (A) The expression of TNFAIP8 was quantified using an artificial intelligence-based segmentation analysis. The expression of TNFAIP3 was found in the neoplastic B-lymphocytes of the lymphoma (in some cases, TNFAIP8+plasma cells-like were found). (B) The expression of TNFAIP8 in DLBCL correlated with the prognosis of the patients. High TNFAIP8 expression was associated with a poor overall survival and progression free survival. Of note, good correlation was found between the evaluation of TNFAIP8 by the pathologist (Carreras J.) using the microscope and the digital image quantification based on A.I. method (p = 1.1855 × 10⁻¹²). Low expression: ordinal 0, +1; A.I. quantification (3.2–18.9%). High expression: ordinal +2, +3; A.I. quantification (19.0–87.9%). (C) The expression of TNFAIP3 correlated with several clinicopathological characteristics. A moderate but significant correlation was also found with MYC and the proliferation index assessed with the Ki67 marker.
Ai 01 00023 g003
Table 1. Series of cases and survival characteristics.
N.Series IDCasesTotal Num. (%)Log-Rank
p Value
5-y OS (±95% CI)HR
p Value
HR
(95% CI)
Chronic lymphocytic leukemia (CLL)
1GSE22762 GPL570107308 (15.2%)Reference86.7% (84.9–88.5%)3.59 × 10−48reference
2ICGC CLLE-ES v.2016201
Mantle cell lymphoma (MCL)
3LLMPP Rosenwald 20039292 (4.5%)6.10 × 10−3928.3% (26.7–29.9%)2.45 × 10−266.6 (4.6–9.3)
Follicular Lymphoma (FL)
4GSE16131 GPL96180180 (8.9%)6.79 × 10−870.7% (68.2–73.2%)9.24 × 10−82.4 (1.7–3.2)
Diffuse Large B-cell Lymphoma (DLBCL)
5GSE10846414741 (36.5%)1.03 × 10−1756.5% (55.3–57.7%)1.10 × 10−193.5 (2.7–4.6)
6GSE2350169
7E-TABM-34652
8TCGA DLBCL v.201647
9GSE4475159
Multiple Myeloma (MM)
10GSE2658559559 (27.6%)2.47 × 10−862.7% (59.95–65.5%)7 × 10−51.9 (1.4–2.6)
Acute Myeloid Leukemia (AML)
11TCGA-AML v.2016149149 (7.3%)1.47 × 10−4623.2% (22.1–24.3%)6.11 × 10−378.3 (5.9–11.5)
AllSeries 1–1120292029 (100%)4.78 × 10−5662.4% (61.6–63.2%)--
N., number. HR, hazard-risk/ratio. In the “general” vs. “all” comparison analysis with Cox regression, the group “All” was set as reference.
Table 2. Overall survival according to the risk-groups based on the set of 25 genes.
Sub-TypeSeriesLow-Risk/High-RiskLog-Rank5-Year OS (95% CI)HRHR
Num. (%)p ValueLow-RiskHigh-Riskp Value(95% CI)
CLL1–2219 (71.1%)/89 (28.9%)3.07 × 10−1094.2% (92.6–95.8%)69.2% (69.2–65.7%)7.63 × 10−094.3 (2.6–7.0)
MCL365 (70.7%)/27 (29.3%)1.46 × 10−0938.4% (35.6–41.2%)0% (0–0%)3.22 × 10−085.2 (2.9–9.2)
FL4113 (62.8%)/67 (37.2%)6.58 × 10−0879.3% (76.2–83.4%)55.9% (52.4–59.4%)2.59 × 10−073.0 (1.9–4.6)
DLBCL5–9587 (79.2%)/154 (20.8%)3.92 × 10−4268.1% (66.5–69.7%)16.3% (15.7–16.9%)1.32 × 10−354.5 (3.5–5.7)
MM10499 (89.3%)/60 (10.7%)1.84 × 10−1669.6% (66.6–72.6%)0% (0–0%)1.63 × 10−135.3 (3.4–8.2)
AML11116 (77.9%)/33 (22.1%)1.23 × 10−0929.7% (27.9–31.5%)3.9% (3.8–4.0%)1.66 × 10−083.7 (2.4–5.9)
All1–111599 (78.8%)/430 (21.2%)9.26 × 10−5970.9% (69.9–71.9%)34.4% (33.5–35.3%)9.53 × 10−533.2 (2.8–3.7)
HR, hazard-risk/ratio. CLL, chronic lymphocytic leukemia; MCL, mantle cell lymphoma; FL, follicular lymphoma; DLBCL, diffuse large B-cell lymphoma not otherwise specified; MM, multiple myeloma; and AML, acute myeloid leukemia.
Table 3. Correlation between high RNA expression levels (RNA) and risk-groups (high-risk and low-risk).
High RNA of GeneCLL 1CLL 2MCL 3FL 4DLBCL 5DLBCL 6DLBCL 7DLBCL 8DLBCL 9MM 10AML 11%
SFTPCNCNC-NCNCNCNCHRNCLRNC20
ARHGAP19NC-HRLRNCNCNCNCLRHRNC40
MESDNC---NCNC-NC-LR *LR33
SNNNCNC-LRNCNCNCNCLRNCHR *30
ALDOBNC-LRNCNCNCNCNCNCLRNC20
SPACA9HRNC-HRNC-NCNCNCLRNC33
SWSAP1NCNC--HRNC-NC-HRHR *43
WDCPNC--NCHRNCNCNCNCNCLR22
ZSCAN12NC--NCLRNCNCHR*HRNCLR44
DIP2ANCNC-NCNCNCNCHRNCNCNC10
ATF6BHR--NCNCLRNCNCHRHRLR56
CACNA1BNCNC-HRHRHRNCNCNCLRNC40
TNFAIP8NCNC-LRHRNCHRHRHRNCLR60
RPS23NC--NCNCLRNCNCNCNCLR22
POLR3HNC---HRNC-LR-NCHR50
ENO3HRNC-NCHRNCHRHR*HRHRHR70
RAB7ANCNCNCNCNCNCNCNCNCLRNC9
SERPINB8HRHR *-NCHRNCNCNCNCNCNC30
SZRD1NCNCHRNCHRNCNCNCNCHRNC27
EMC9NC--LRNCNCNCLRLRHRNC44
ARMH3HR--NCNCNCNCNCNCHRNC22
LPXNHR--NCLRLRNCNCLRNCNC44
KIF23NCNCHRNCHRNCNCNCLRHRLR45
GGA3NC--NCHRNCHRNCHRNCLR44
METTL21ANC---LRLR-NC-HRNC50
HR, high-risk group; LR, low-risk group; NC, no correlation; “-”, the gene is not available in the gene expression array of the series. The asterisk “*” indicates that the p value is in the limit of significance (0.1 < p value >0.05). The underlined genes are the most relevant. The percentage (%) indicates the percentage of the series with significant association with the high or low-risk groups. Of note, all the genes contributed to the risk score and the risk score groups generation (i.e., to the overall survival of the patients), but their weight and direction of the association was variable.
Table 4. Clinicopathological characteristics of the validation series of diffuse large B-cell lymphoma from Tokai University.
VariableNum.%p ValueHazard Risk95.0% CI for HR
LowerUpper
Sex Male54/9755.70.7141.1240.6032.095
Age > 6068/9770.10.0043.9681.55510.126
Location
  Nodal (+spleen)52/9753.6Reference---
  Extranodal
    Waldeyer’s ring9/979.30.2380.2380.0321.774
    Gastrointestinal10/9710.30.8000.80.2382.687
    Other extranodal26/9726.81.6251.6250.8473.12
LDH High (>219)58/9660.40.0033.2691.5017.119
Seric IL2RA High (>530)70/9077.80.0243.9141.212.762
ECOG Performance Status ≥213/7716.93.90 × 10−44.0191.8638.668
Clinical stage III or IV41/8846.60.0471.9811.013.884
Extranodal disease site >118/7324.70.0003813.7841.8167.884
B symptoms18/7922.80.3111.4910.6893.226
International Prognostic Index (IPI)
Low risk (L)30/8037.5Reference---
Low-intermediate risk (LI)25/8031.30.0113.5231.3349.304
High-intermediate risk (HI)14/8017.50.0463.0531.0229.114
High risk (H)11/8013.80.0055.0351.61515.701
Cell-of-origin Subtype (Hans)
GCB31/9433----
Non-GCB63/94670.0112.9061.2836.583
High RGS1 expression52/9654.20.0322.1471.0664.323
Positive BCL2 expression73/9279.30.0243.8871.19512.639
Epstein–Barr virus, EBER+17/9517.90.0052.8221.3715.809
Treatment
RCHOP64/8971.9Reference---
RCHOP-like20/8922.50.1481.7150.8263.561
Others5/895.60.3941.8810.448.037
Response to treatment
CR63/8574.1Reference---
PR+PD+SD+NC22/8525.92.06 × 10−1216.0447.40134.779
Overall survival (outcome)
Dead41/9742.3----
Alive56/9757.7----
Statistically significant p values (p < 0.05) are underlined.
Table 5. Correlation between TNFAIP8 and the clinicopathological features of the patients of the validation series of diffuse large B-cell lymphoma from Tokai University.
Predictors for High TNFAIP8p ValueOdds Ratio95% C.I. for OR
LowerUpper
Sex Male0.3940.6530.2451.74
Age >600.0223.1671.1778.519
Location
  Nodal (+spleen)Reference---
  Extranodal
    Waldeyer’s ring0.3570.5070.1192.15
    Gastrointestinal0.9410.9460.2154.154
Other extranodal0.9986.51 × 10+80.
LDH High (>219)0.5221.3690.5233.582
Serum soluble IL2RA High (>530)0.00161.99118.078
ECOG Performance Status ≥20.8230.850.2043.539
Clinical stage III or IV0.3731.5770.5794.298
Extranodal disease site >10.1494.7440.57239.361
B symptoms0.1942.8440.58813.765
High-intermediate+high IPI0.3521.7930.5246.129
Non-GCB Subtype (Hans’ algorithm)0.0004746.5882.28918.963
High RGS1 protein expression0.1592.0040.7625.271
Positive BCL2 protein expression (>30%)0.1092.4580.8197.38
High CD163+ tumor-associated macrophages (TAMs)0.0173.31.2358.819
Epstein–Barr virus, EBER+0.9680.9750.2833.363
Absence of clinical response to treatment0.2132.3410.6148.927
Binary logistic regression setup: dependent variable (TNFAIP8), predictors (clinicopathological features). Statistically significant p values (p < 0.05) are underlined.

