Article

Convolutional Neural Networks with Transfer Learning for Recognition of COVID-19: A Comparative Study of Different Approaches

1
Department of Electrical Engineering, Punjab Engineering College (Deemed to be University), Chandigarh 160012, India
2
Department of Computer Science and Engineering, Jodhpur Institute of Engineering and Technology, Jodhpur 342001, India
3
Power System Planning Division, Rajasthan Rajya Vidyut Prasaran Nigam Ltd., Jaipur 302005, India
4
Department of Electrical Engineering, Jai Narain Vyas University, Jodhpur 342001, India
*
Author to whom correspondence should be addressed.
Submission received: 2 November 2020 / Revised: 16 December 2020 / Accepted: 18 December 2020 / Published: 21 December 2020
(This article belongs to the Section Medical & Healthcare AI)

Abstract

:
To judge the ability of convolutional neural networks (CNNs) to effectively and efficiently transfer image representations learned on the ImageNet dataset to the task of recognizing COVID-19 in this work, we propose and analyze four approaches. For this purpose, we use VGG16, ResNetV2, InceptionResNetV2, DenseNet121, and MobileNetV2 CNN models pre-trained on ImageNet dataset to extract features from X-ray images of COVID and Non-COVID patients. Simulations study performed by us reveal that these pre-trained models have a different level of ability to transfer image representation. We find that in the approaches that we have proposed, if we use either ResNetV2 or DenseNet121 to extract features, then the performance of these approaches to detect COVID-19 is better. One of the important findings of our study is that the use of principal component analysis for feature selection improves efficiency. The approach using the fusion of features outperforms all the other approaches, and with this approach, we could achieve an accuracy of 0.94 for a three-class classification problem. This work will not only be useful for COVID-19 detection but also for any domain with small datasets.

1. Introduction

COVID-19, a global pandemic, is still spreading in many parts of the world since its identification in late December 2019. In these nine to ten months, this disease has become one of the most significant public health emergencies requiring remedial measures and early diagnosis. In many countries till recently, reverse transcription-polymerase chain reaction (RT-PCR) tests are the most popular diagnostic method for detecting COVID-19. Although popular, this method suffers from limitations in its long wait time and low sensitivity. Therefore, for the early diagnosis of COVID-19, many have started using molecular tests to determine the coronavirus. For example, many existing machines like Genmark’s ePlex Respiratory Pathogen instrument or Abbott’s ID, etc., have a COVID-19 feature for testing, which takes much less time [1,2]. The other advantage is that the sensitivity of these molecular tests is around 90% better than the RT-PCR method having a sensitivity of about 70%. However, both the RT-PCR method or molecular testing approach need expensive equipment and trained professionals. Further, the availability of these methods is limited in remote areas and low and middle-income countries. Thus, it necessitates developing useful diagnostic tools suitable for use in remote areas and low and middle-income group countries. Studies suggest an association of coronavirus with a dysregulation in blood investigations [3]. Apart from these methods, radiological imaging has utility in COVID-19 detection [3]. Further, Rubin et al. [4] report the recommendations by a panel of radiologists and pulmonologists for using CXR and computer tomography (CT) in the diagnosis, progression, and management of COVID-19. CT, in comparison to CXR, has superior diagnostic accuracy, but in terms of cost, ease of use, availability, and less cumbersome sanitization process CXR is a better option. Furthermore, it is easy to install and operate portable units having a CXR facility in COVID wards, intensive care units, COVID screening areas [5]. There are subtle changes in CXR due to COVID-19. COVID creates septal thickening [6], peripheral airspace opacities, ground-glass opacity [7], peribronchial consolidation, multifocal airspace opacities, and diffuse mid and lower zone consolidation in CXR [5]. Moreover, CXR is abnormal in 9% of cases, even for patients having negative initial RT-PCR results. For a detailed review of the role of CXR in COVID diagnosis and prognosis, see [5]. The use of CXR is not new; its usage includes disease detection, evaluation of prognosis, forecasting the response to treatment, and monitoring of disease status. It helps diagnose specific diseases such as tuberculosis, interstitial lung diseases, and pulmonary nodules [8]. Automatic CXR analysis acts as an assistive tool for radiologists and improves detection accuracy [8]. More recently, the inherent capability of deep neural networks to capture hidden representations and extract features of the input images has led to their remarkable success in the automatic analysis of medical images. Deep learning algorithms help in identifying, classifying, and quantifying patterns in medical images [9]. Applications of deep neural networks in medical image analysis have been highlighted by [9,10,11,12,13,14,15,16]. Among many different types of deep neural networks, currently, convolutional neural networks (CNNs) are the most researched in the medical image analysis [9,11,17,18,19]. CNNs show a more distinct resemblance to the biological system. The connectivity patterns of CNNs in Convolutional layers resemble the connectivity pattern of the mammalian visual system. The most noteworthy characteristic of CNNs is that, like the mammalian visual system, these networks build the representation of input image hierarchically without prior knowledge or human effort. CNN directly processes two or three-dimensional images; this keeps the structural and configural information of the image intact making them the most suitable networks for accomplishing different tasks in medical imaging [9]. CNNs have a large number of parameters; for optimizing them; in general, there is a requirement of large scale annotated datasets. In the medical field, the availability of such large scale datasets is rare. To overcome this limitation, researchers use CNNs with transfer learning. In transfer learning, the image representations learned with CNNs on large-scale datasets are effectively and efficiently transferred to the other tasks having an availability of small-scale datasets, for example, to medical image analysis [20,21,22]. Li et al. [23] showed that for diabetic retinopathy fundus image classification, CNN with a transfer learning approach for classification outperformed other existing methods of classification. In another study, InceptionV3 pre-trained based model with transfer learning was successfully used to classify pulmonary images [24]. Mormont R et al. [25], in their work on digital pathology, compared VGG16, VGG19, InceptionV3, ResNet50, InceptionResNetV2, DenseNet, MobileNet pre-trained models with transfer learning. They found that the performance of VGG based model was worst while the performance of the model based on ResNet and DenseNet was much better than the model based on other pre-trained models. Shin et al. [19] used CifarNet, AlexNet, and GoogleNet pre-trained ImageNet models to transfer knowledge for thoracoabdominal lymph node and interstitial lung disease detection. Their study shows that the GoogleNet pre-trained based model performs poorly compared to either AlexNet or CifarNet pre-trained based models.
Recently many of the researchers applied the approach of CNN with transfer learning for the detection of COVID-19.
Training deep CNNs from scratch requires large scale annotated datasets, but the availability of the COVID-19 image dataset is limited. Therefore, CNN models proposed so far for detecting COVID-19 made use of transfer learning. Some researchers made tailored CNNs to detect COVID-19 [26,27]. In these tailormade models, to overcome the limited availability of the COVID image data set, Wang et al. [26] first trained their proposed model on the ImageNet dataset and then on COVIDx dataset. In contrast, Afshar et al. [27] pre-trained their proposed model on an external dataset consisting of 94,323 frontal view chest X-ray images for common thorax diseases then fine-tuned the model on a dataset containing COVID-19 images. Islam et al. [28] applied long short term memory (LSTM) for COVID detection after the extraction of the feature using CNN. Rahimzadeh et al. [29] proposed a concatenated CNN model made by using Xception and ResNet50V2 models to detect COVID-19 cases using chest X-rays. Alqudah et al. [30] applied different machine learning approaches such as support vector machine (SVM), CNN, and random forest (RF) for the detection of COVID-19. Ucar et al. [31] applied probabilistic based deep Bayes-squeezeNet for the diagnosis of coronavirus. In another approach, Kumar et al. [32] used nine pre-trained models for feature extraction and then support vector machine for classification. Jain et al. [33] applied deep learning-based approach on PA view of chest X-ray scans for COVID-19 affected patients as well as healthy patients for classification of COVID-19. In their work after cleaning up the images and applying data augmentation, a comparison between different deep learning-based CNN models is made. They collected 6432 chest X-ray scans samples from the Kaggle repository, out of which 5467 were used for training and 965 for validation. Abbas et al. [34] extracted the features using CNN and applied principal component analysis (PCA) for dimensionality reduction. On these feature vectors, they applied a clustering technique to decompose original classes into multiple classes. They again used a pre-trained CNN to classify features into original classes using DeTraC deep neural network. Others have used the pre-trained CNN model-based transfer learning approach to detect COVID-19 with reasonable accuracy [35,36,37,38,39,40,41,42].
These studies show that either a pre-trained or tailormade CNN model can successfully detect COVID-19. Important implicit conclusions of these studies are that CNN is like a black box that does not require any domain knowledge, and the features extracted by trained CNN are generic. In other words, these studies implicitly reinforce the notion that the transferability is possible despite the disparity between the training domain consisting of large scale annotated databases and the classification task domain having small scale annotated datasets. Many of these studies perform comparative studies to show that one of the pre-trained models with some conventional classifier outperforms the other combinations of pre-trained models and classifiers. These studies compare the performance of models based on the classification accuracy, sensitivity, etc., and do not comment either on the feature extraction capabilities of these models or provide the justifications and the reasons for the difference in the performance of various models.
In this work, we use CNN with transfer learning to detect COVID-19 using chest X-ray images. During recognition using a visualization approach, we comment on the feature extraction capabilities of different pre-trained CNN models. We show that after the extraction of features using pre-trained CNNs, even the K-means algorithm, a simple unsupervised learning mechanism can be made to work as a COVID-19 detector. Moreover, we compare the performance of the K-means detector with two integrated models, namely, a simple integrated model (SIM) and a fused, integrated model (FIM). Furthermore, we also compare the results of these models, as mentioned above, with a new CNN model using shallow tuning. The new model is built by copying the feature extracting blocks of pre-trained models and by adding classifier layers on top of it. In this work, we also analyze the role of principal component analysis in feature selection from the extracted features in improving the classification performance of the models. Like other studies that use CNN for COVID-19 detection, our work also has limitations as studies show that since COVID-19 chest X-ray available on public domain include unconfirmed cases, samples of pediatric patients etc., CNN based approach for COVID-19 detection is giving biased results.
Furthermore, in the absence of validation of results on external datasets and verification of results by clinicians reliability of the obtained results using a CNN based approach is questionable [43,44]. Interpretation of results requires a cautious approach as the data that we have used is in non-DICOM format, and it may have resulted in the loss of quality of the images and lack of consistency. Therefore, in this work, we did not apply any interpretation methods for the CNN models. As, one of the main aims of our study is to compare the feature extraction capabilities of different pre-trained networks. Since the data used for comparison is same for all the pre-trained models, the effect of the type of data or the absence of verification of results by clinicians does not alter our judgement on the comparative analysis of the feature extraction capabilities of different pre-trained models. Many studies using transfer learning have been proposed for COVID-19 detection. There is no consensus about which pre-trained model is the best model for transferring the knowledge in some studies it has been shown that VGG19 is the best in other studies DenseNet or Resnet have been shown to outperform the other pre-trained models. However, in our study, we make use of PCA to show that DenseNet pre-trained model has better feature extraction capability.

2. Preliminaries

2.1. Convolutional Neural Networks (CNNs)

In the mammalian visual system, the representations of visual input from simple to complex are progressively built up hierarchically [45,46]. CNNs like the mammalian visual system, build the representation of input image hierarchically. The term convolutional neural network was, for the first time, formally introduced in LeCun et al. 1998 [47]. They called their CNN as LeNet-5 and showed that LeNet-5 could outperform many other pattern recognition approaches for recognizing handwritten characters. Since then, different researchers have proposed many variants of CNN that have applications in different areas.

2.2. Architecture of Basic CNNs

Basic CNNs are composed of two main building blocks: trainable feature extraction block (TFEB) and trainable classification block (TCB). Several convolutional subblocks are stacked together to form a trainable feature extraction block (TFEB.). Each convolutional subblock has two processing stages. In the first stage, a convolution operation is performed between the feature map (for the first subblock, this is an input image) of the previous layer and a kernel(filter). The output of convolution operation is processed by nonlinear processing units such as the Rectified Linear Unit (ReLU). The use of nonlinear processing units helps to learn abstraction and to embed nonlinearity in the feature space. In the second stage, by pooling operation, a downsampled feature map is obtained. The pooling operation reduces spatial resolution and sensitivity to small shifts and distortions [47]. This downsampled feature map represents many different same level representations obtained using many different learnable filters in each subblock. At the end of the feature extraction block (TFEB), one or many fully connected layers are connected, representing the trainable classifier block (TCB). Filter weights and the weights of all the connections in the fully connected layers represent the parameters of the given CNN. CNNs are specialized networks that can accomplish feature extraction, selection, and classification using a general-purpose learning algorithm, thus eliminating the requirement of a human expert. Furthermore, these networks are insensitive to variations in position, rotation, translation, scaling of the input data [47]. There are many parameters to be optimized in CNNs, and therefore, in general, these networks require large-scale annotated dataset to train them.

2.3. Transfer Learning Using CNNs

CNN’s acquire knowledge consisting of feature representations of the input image in a hierarchal manner, decision boundaries, and regions. In the transfer learning, there is a transfer of the acquired knowledge from one domain to another in complete or partial form, followed by supplemental learning. In one approach of domain transfer, a tailormade model acquires knowledge using a domain having a sufficient training dataset. As part of supplemental learning, this model is fine-tuned end to end for the domain with insufficient datasets. In another approach of domain transfer, a new model is made by copying the first n layers of a pre-trained model (knowledge transfer) and adding new layers on top of it. After that, as a part of supplemental learning, one of the following strategies is adopted (a) Shallow tuning: The parameters of the copied layers are frozen, and the parameters of the newly added layers are randomly initialized and then optimized. We call this approach to be a shallow tuning approach. (b) Deep fine-tuning: Deep fine-tuning is the process of fine-tuning the parameters of the new model in an end to end manner. In yet another approach called the feature extractor approach of transfer learning, a pre-trained network acts as a feature extractor. Then these extracted features are applied as input to the standard classifier, such as support vector machine, etc. This approach is called an off-the-shelf feature method [48]. In this work, we apply shallow tuning and off the shelf feature methods.

2.4. Pre-Trained Deep Networks

Several models have performed exceedingly well on the ImageNet data classification task [25]. In this study, we evaluate five such deep networks, namely VGG16, ResNet50V2, InceptionResNetV2, DenseNet121, and MobileNetV2, and compare their performance when used in transfer learning mode for detection of COVID-19. Out of the five models mentioned above, VGG16 belongs to six VGG models developed by the Visual Geometry Group [49]. Models of this family secured first and second position in classification plus localization category of the ILSVR2014 competition. VGG is an example of stacked module architecture, with a 3 × 3 filter size in all the layers. VGG16 has 13 convolutional and three fully connected layers. ResNet50 belongs to the family of deep residual learning framework [50]. Networks in this family also have a highly modular structure. One of the highlights of the models belonging to this family is that they can be very deep (needed to extract more complicated features of the image). They still do not face the problem of vanishing/exploding gradients or degeneration [51]. These models could overcome the problems mentioned above by making use of short cut connections. ResNet50, like its predecessors, is a two-branch network where one branch is the identity mapping performed by the short cut connections which skip one or more layers. ResNet50 is the first network to use 1 × 1 filters as a bottleneck to reduce the number of channels in the output feature map. This network has performed exceedingly well on classification tasks of the ImageNet dataset [50]. InceptionNet can address the problem of properly recognizing the objects covering a different sized area in an image. For example, recognizing an object covering a large area in an image requires spatial information at a coarse level. In contrast, for recognizing an object covering a small area, fine-level spatial information is required [52]. InceptionNet networks contain an inception module having parallel paths with different sized kernels (1 × 1, 3 × 3, 5 × 5) to capture spatial information at different scales. InceptionResNetV2 is a network that embeds in it the properties of inception networks and deep residual networks [53].
MobileNetV2 is suited to work on devices having low computational capabilities and low memory. These networks, based on MobileNetV1, also use depth-wise, separable convolution, and pointwise convolution to reduce the computational complexity and model size. Additionally, they have inverted residual blocks for channel expansion to overcome the limitation of depthwise separable convolution with a limited fixed number of input channels [54]. Therefore, MobileNetV2 have better accuracy than MobileNetV1 in multiple image classification and detection tasks for mobile application. Dense Convolutional Network [55] contains short paths that form a direct connection between any layer and its preceding layers. Like InceptionNet, in this network, the features are concatenated at each layer. Such a connection scheme helps CNN to alleviate the vanishing gradient problem, strengthening the propagation of features and narrowing of the net. DenseNet CNN performs at par with another state of the art CNNs with a requirement of substantially fewer parameters, thus making them computationally efficient. Table 1 compares the five models (used in our study) for classification tasks on the ImageNet dataset.

3. Material and Methods

3.1. X-ray Image-Dataset

In this study, we have used open public datasets developed in a project by Cohen J.P., [56]. This dataset contains chest X-ray images of MERS, SARS, ARDS, and other respiratory diseases. The X-ray images in this database are from various public sources, through the indirect collection from hospitals and physicians. We have used this dataset to collect Chest X-rays of the patients which are positive or suspected of COVID-19. Chest X-rays of healthy patients and pneumonia infected patients were taken from Kaggle [57]. The images from Kaggle, have chest X-rays that were already initially screened for quality control by removing all low quality or unreadable scans. Moreover, in the Kaggle dataset the diagnoses for the images are graded by two expert physicians before being cleared for uploading them on the website. For further use, two datasets, namely dataset1 containing 142 images of COVID-19 and 300 images of Normal chest X-rays and dataset2 that included 142 images of COVID-19, 300 images each for Pneumonia and Normal chest X-rays, were created. All images were resized to 224 × 224 pixels and normalized before using them as input. We did not apply any other preprocessing steps as many other studies have been done without preprocessing, and adopting a similar approach helped us in comparing our methods with other studies. The details of the dataset used are as given in Table 2.

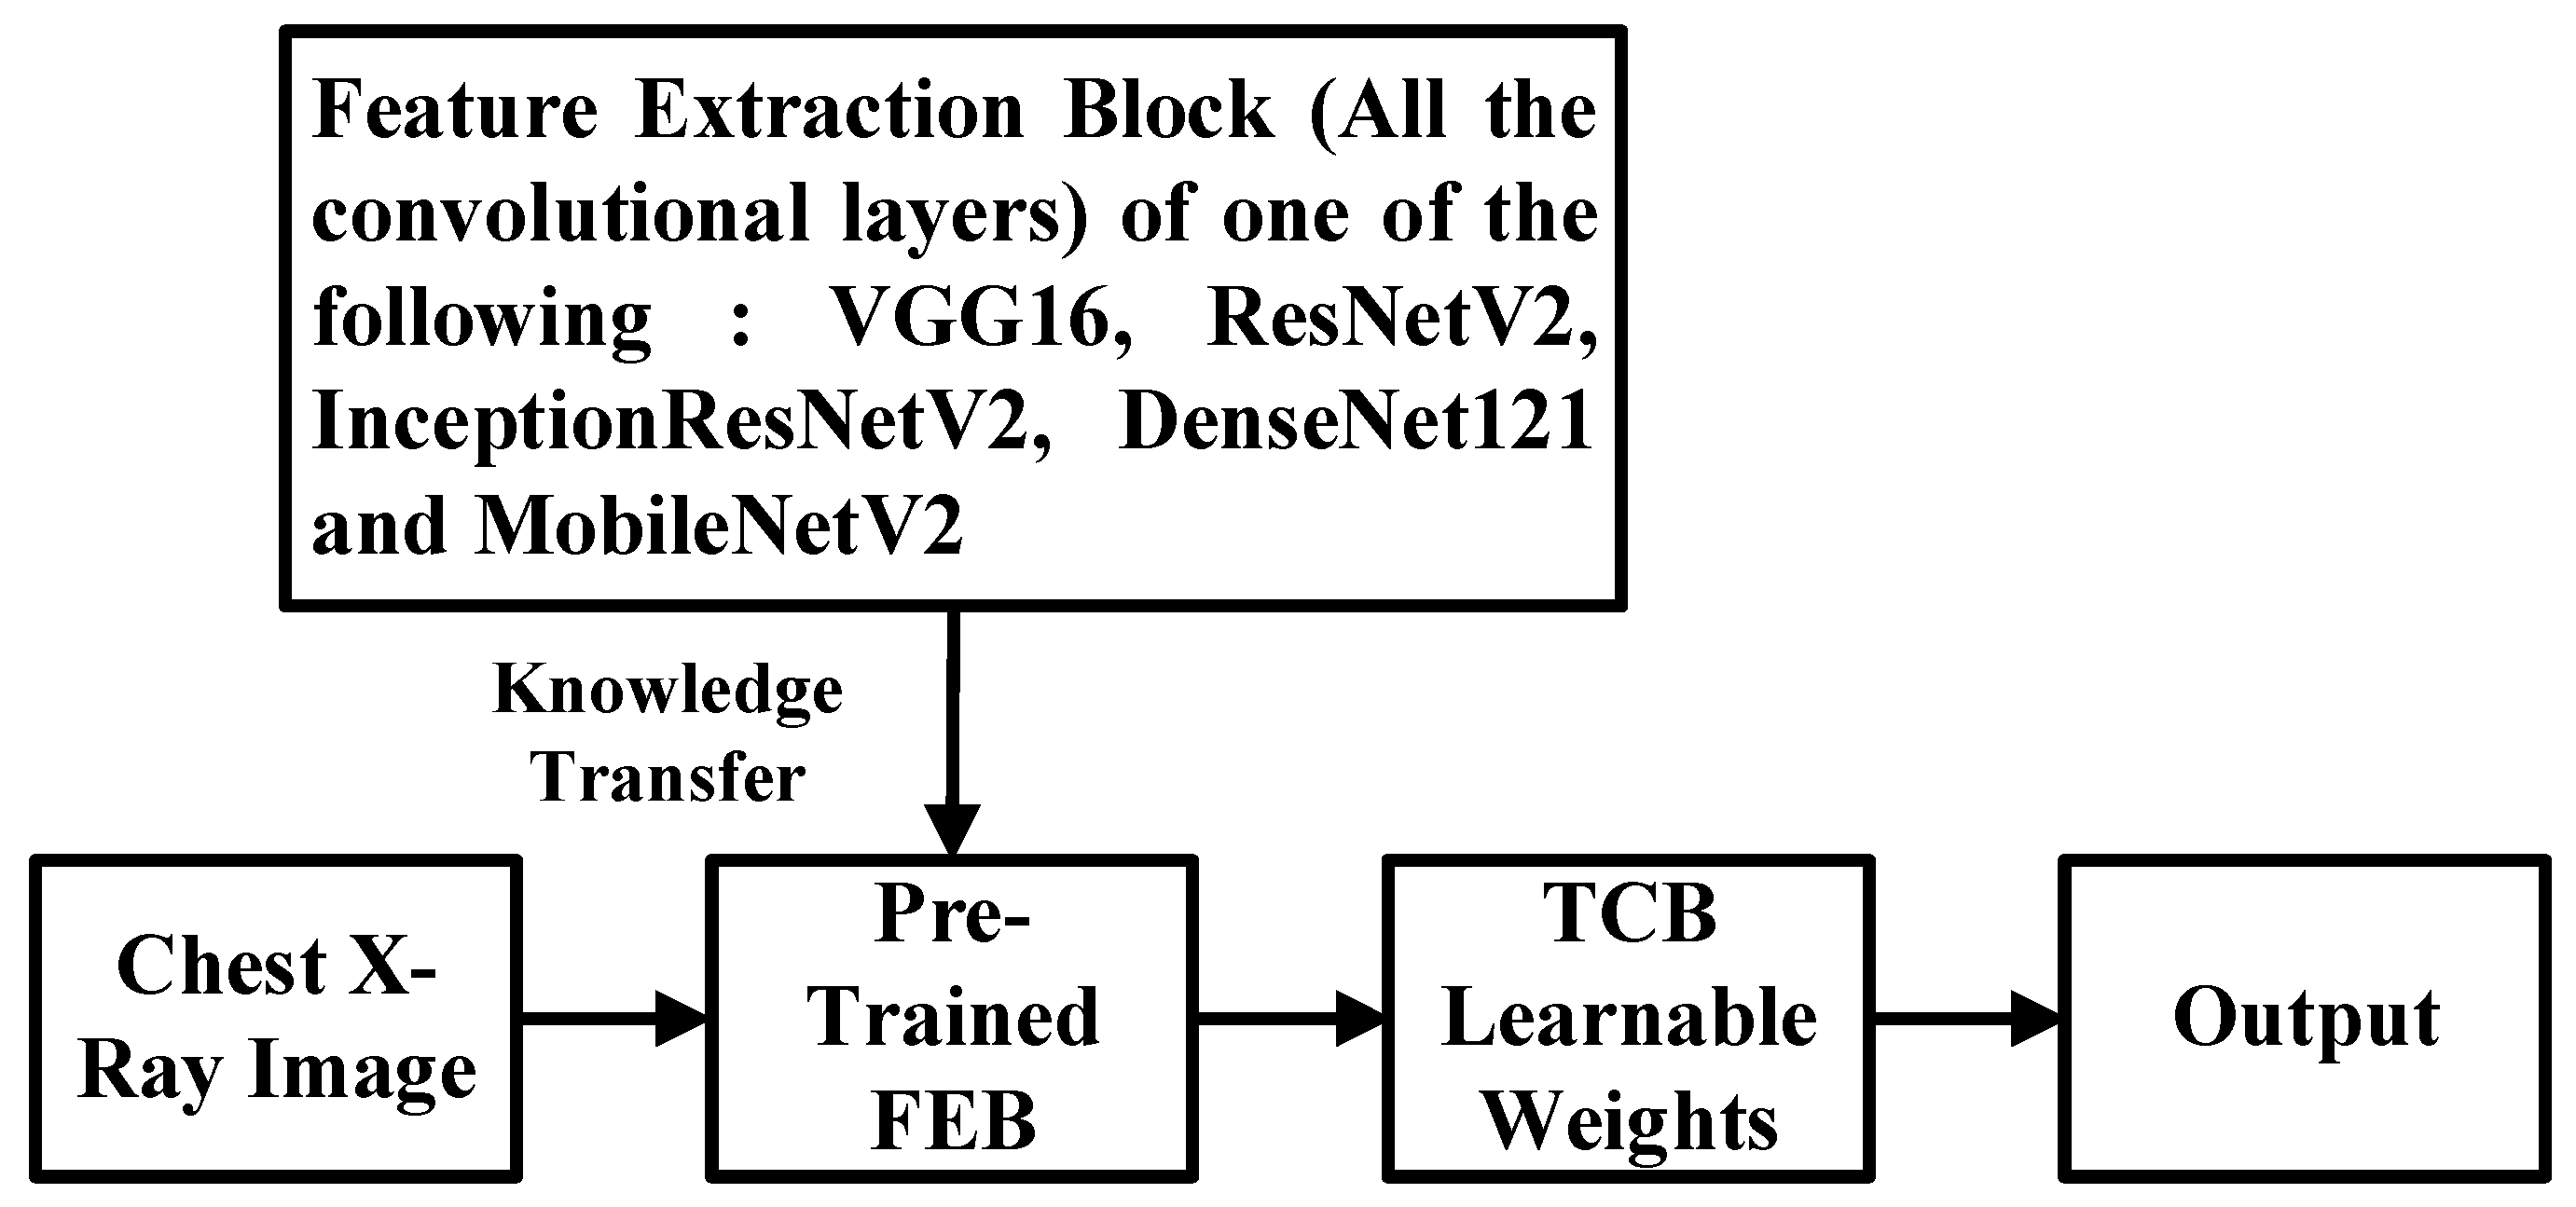
3.2. New CNN Model with Shallow Tuning and Its Training Procedure

Rather than proposing our architecture, we make use of the transfer learning approach. We build a CNN with a feature extraction block adapted from CNNs previously trained on ImageNet database and adding fully connected layers on top of it, as shown in Figure 1. With feature extracting block of VGG16, ResNetV2, InceptionResNetV2, DenseNet121, and MobileNetV2 respectively as the pre-trained FEB, and a fully connected dense layer between the output of this FEB and the output layer resulted in four CNN models. The feature extraction block of these deep networks, when inserted in the new CNN, retains both its original architecture and optimized parameter of their training on the ImageNet dataset. After that, we apply supplemental learning to this new CNN. The training steps followed as follows:
Step 1: We choose one of the datasets (dataset1 or dataset2).
Step 2: We split this dataset randomly into two independent data subsets with 70% and 30% for training and testing.
Step 3: We decide on either cross-entropy or class weighted cross-entropy loss function.
Step 4: The parameters of the trainable classifier block are initialized randomly to random values. Many adaptive and non-adaptive optimizers are well suited for optimizing the Neural Networks [58]. These optimizers have shown to find quite different solutions with very different generalization properties [59]. We utilize the ADAM optimizer for supplemental training of newly formed CNNs. ADAM optimizer [60] use the first and second moments of gradients to compute the individual learning rate for different parameters.
During the entire course of training, parameters of the pre-trained FEB are kept frozen to their initial values. After completion of training, we test the performance of the trained model on the training and test dataset. To analyze the results, we obtain the confusion matrix for the training and test data subsets. The models trained on dataset1 classify the images into COVID-19 and normal and on dataset2 classify images into COVID-19, normal, and pneumonia. For comparison purposes for all models, training hyperparameters, the number of neurons in the trainable layers, and the value of dropout are kept the same. After every training cycle, using the confusion matrix, the performance measures that include accuracy, sensitivity, Positive predictive Value (PPV), and specificity is determined separately for each model.

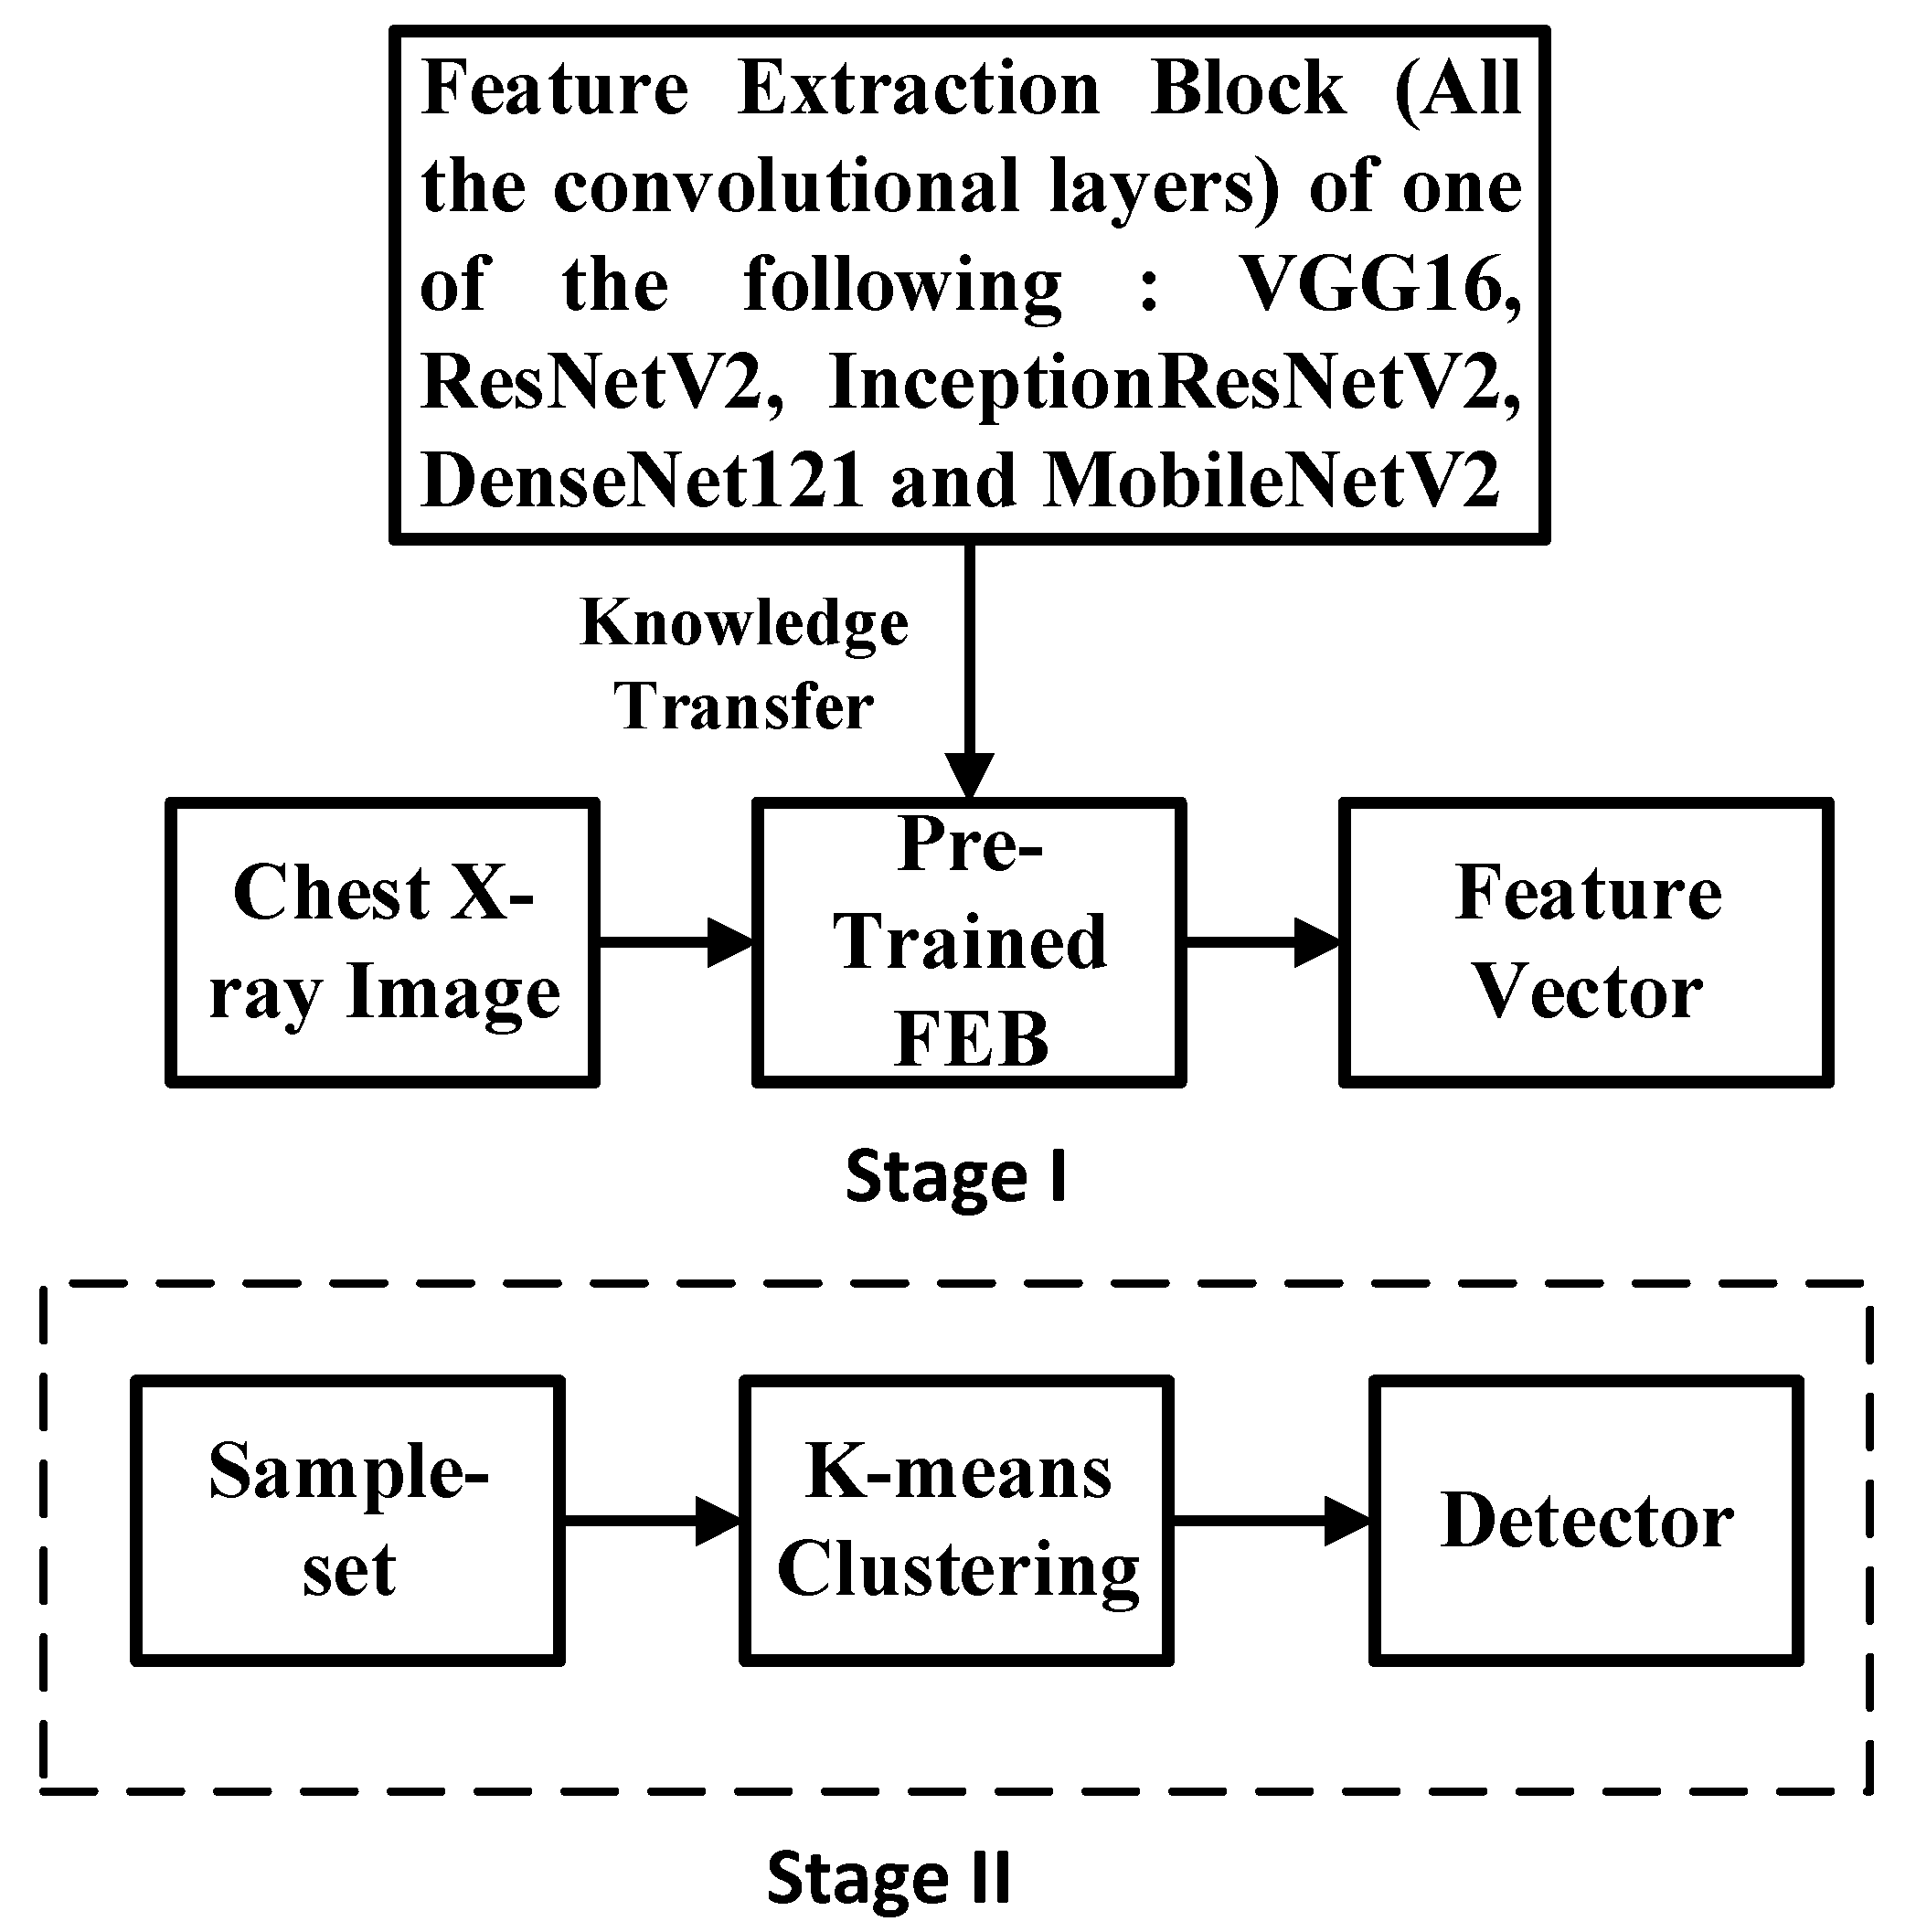
3.3. Semi-Supervised K-Means Detector

K-means detector is composed of a two-stage process. The first stage comprises of creation of samples. The sample-set includes feature vectors extracted with chest X-rays of dataset1 or dataset2 as input to any one of the CNNs namely VGG16, ResNetV2, InceptionResnetV2, DenseNet121, and MobileNetV2 pre-trained on ImageNet dataset. The block diagram of the K-means detector is, as shown in Figure 2.
In the second stage, the sample-set obtained from the stage I is first labeled, and then we randomly split it into two independent sample subsets, namely A and B, with 70% and 30%, respectively, for clustering and testing. We now use the K-means algorithm [61] to cluster sample set A into three or two clusters for a two class and three class classification problem respectively in an unsupervised manner. The process of clustering results in providing a cluster center for each cluster and the samples belonging to that cluster. To assign the class labels to each cluster and for detecting the class for any sample from either sample subsets A or B, we adopt the following steps:
Step 1: We use the sample labels of subset A to label the cluster, and its center with the label of the class having the maximum number of samples in that cluster.
Step 2: For detection, we pick any sample from subset A, or B, and determine the Euclidean distance of this sample from each cluster center. We then assign this sample the label of the cluster center with minimum Euclidean distance (ED) among the EDs from this sample.
We now obtain the confusion matrix for both subsets A and B. To compare with other methods using this confusion matrix, we obtain the performance measures that include accuracy, sensitivity, PPV, and specificity.

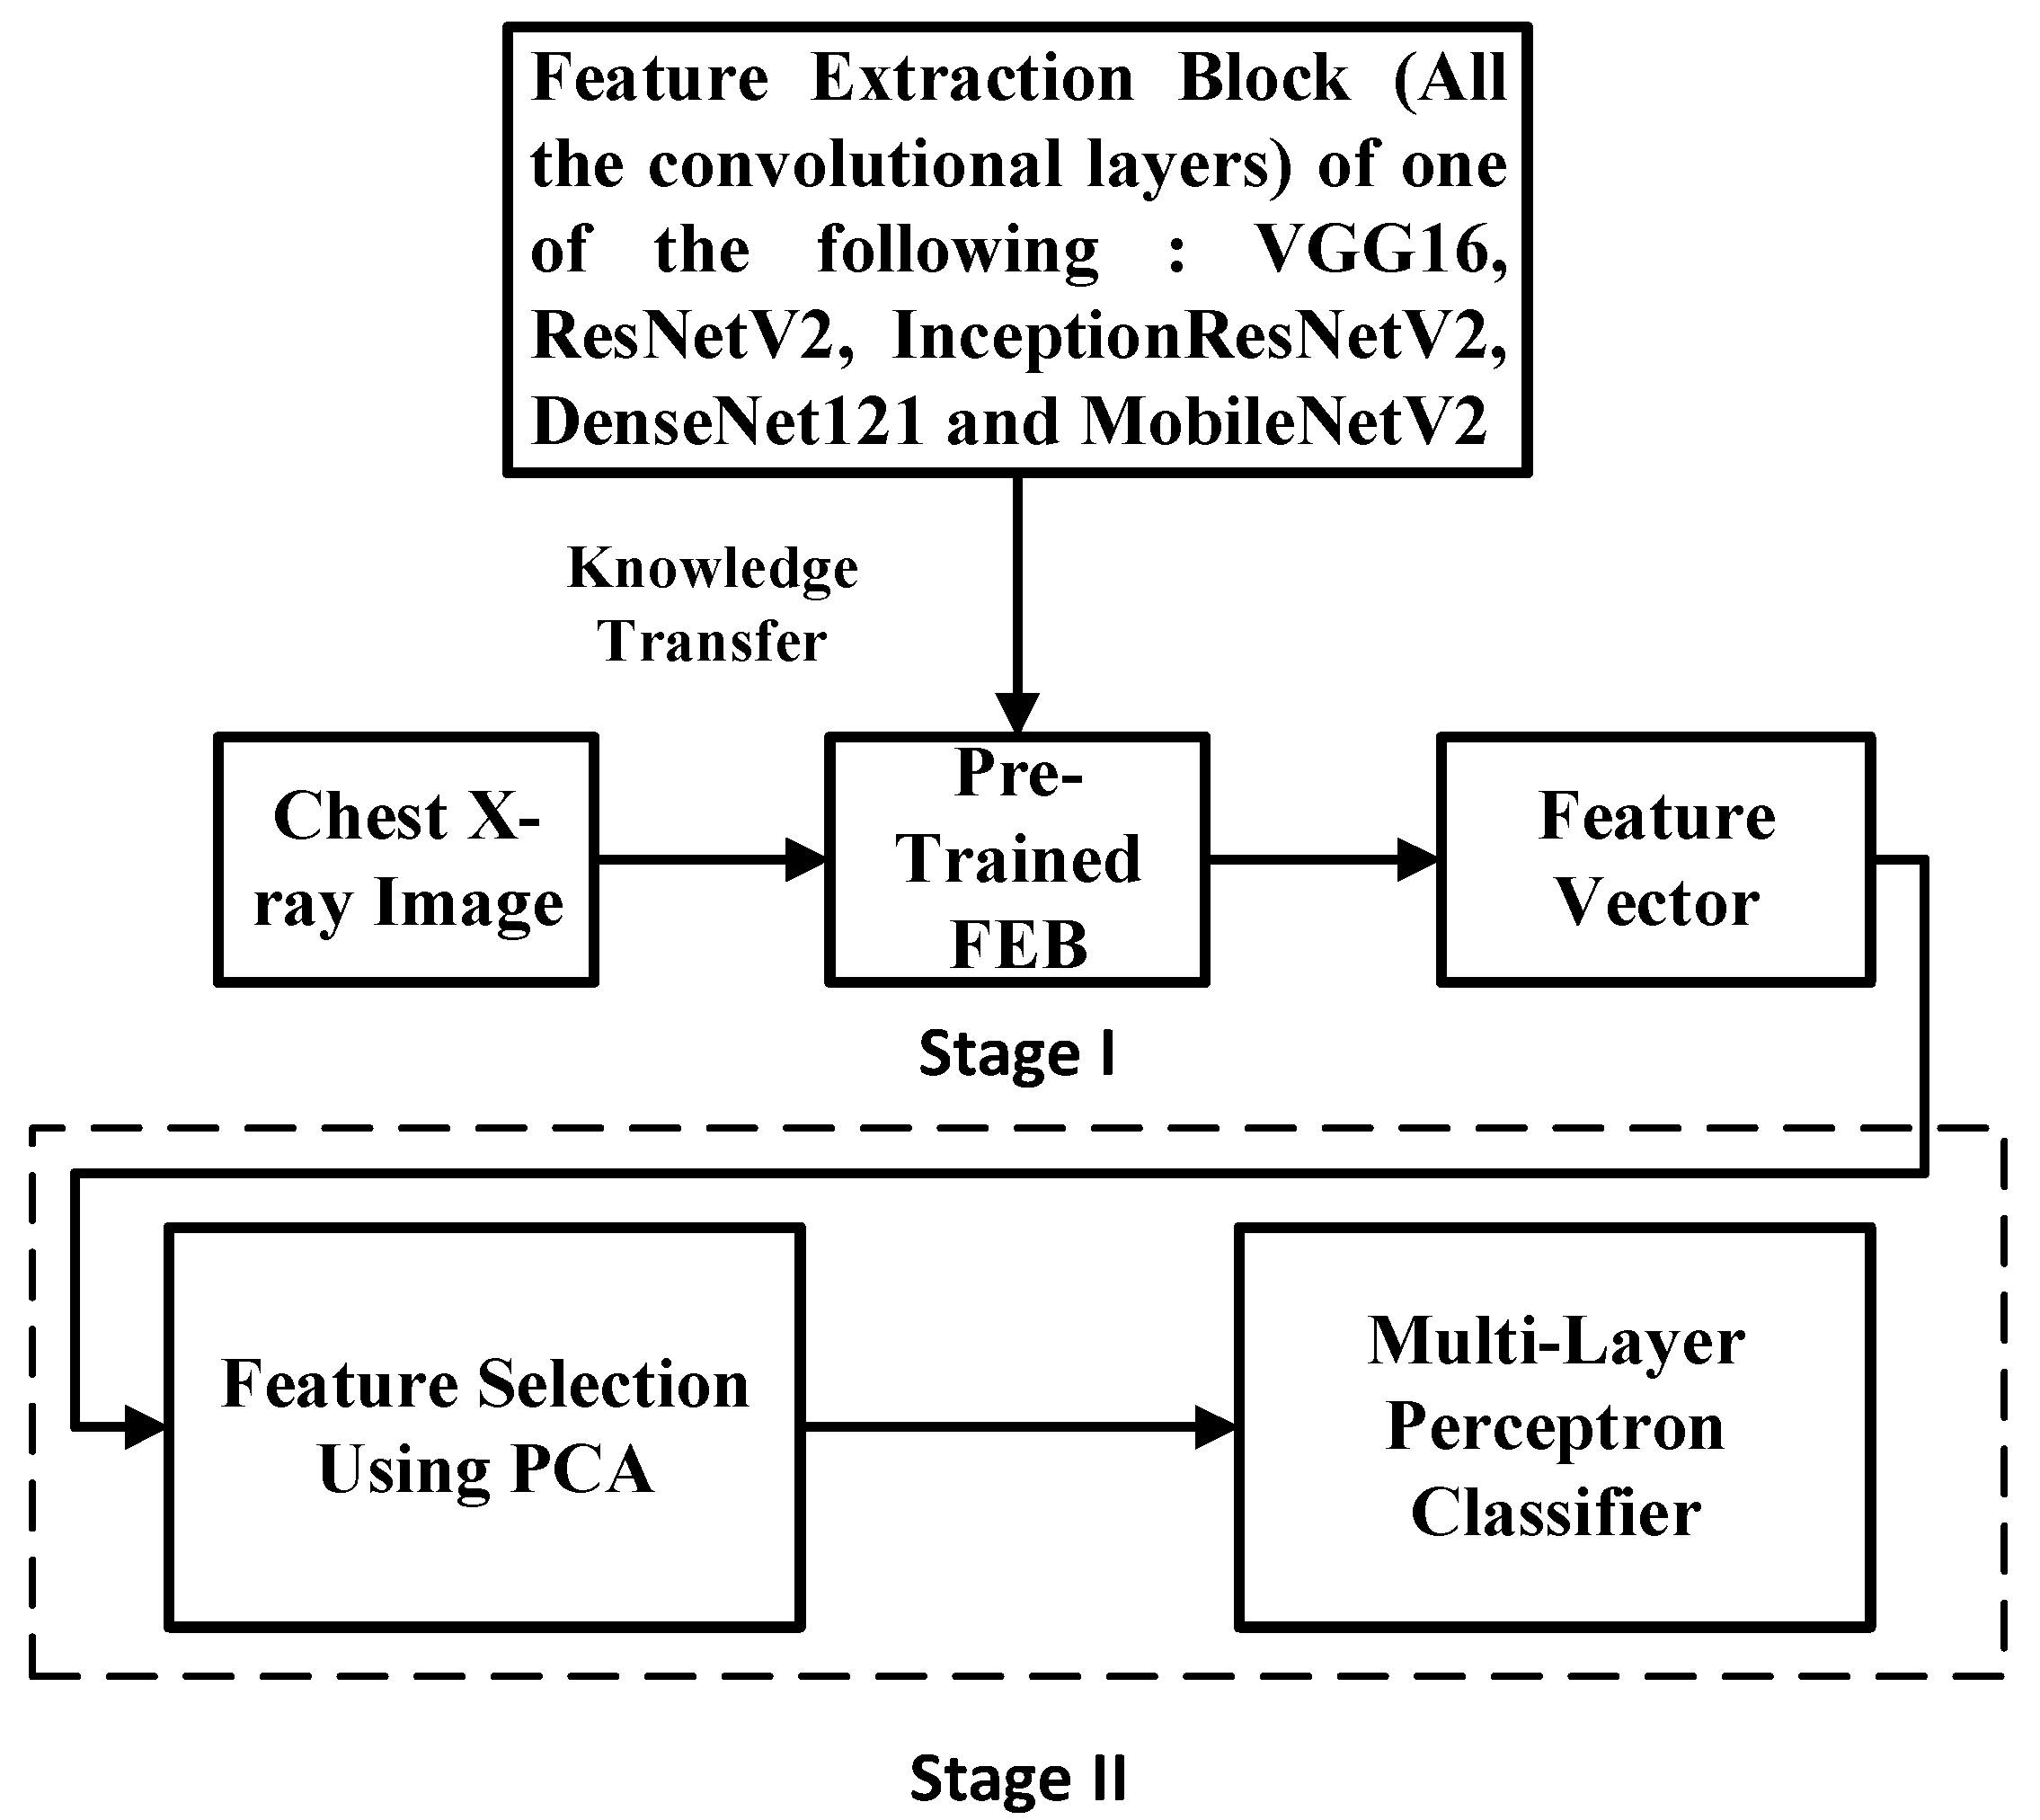
3.4. Simple Integrated Model (SIM)

We built a simple integrated model by integrating an additional feature selection block between the feature extraction block and the classifier block of the conventional convolutional neural network. The block diagram of the SIM is, as shown in Figure 3. SIM, in the first stage, extracts the feature vector using one of the pre-trained CNN as already described in the previous sections. In the second stage, after selecting the features using principal component analysis (PCA), these selected features act as an input to the multilayer perceptron classifier. PCA is a standard statistical technique that helps find patterns in the data of high dimension and has applications in fields such as face recognition and image processing [62]. Suitable selection of the principal components helps in dimensionality reduction, which helps in improving the computational efficiency of the classifier. We use the technique described by Jolliffe, T. [62] for determining the principal components. The final block of SIM is a multilayer perceptron (MLP) neural network. MLP is one of the prevalent artificial neural networks with many applications that include solving classification and regression problems [63]. MLP is an extension of the perceptron and contains hidden layers directly not connected with the outside world. These networks are built by connecting many different processing units. In these network weights of the interconnections are the adjustable parameters optimized by the error backpropagation algorithm [64]. MLPs perform better or equivalent to many conventional classifiers such as K-NN, quadratic Gaussian, or Bayesian maximum likelihood classifiers [63].

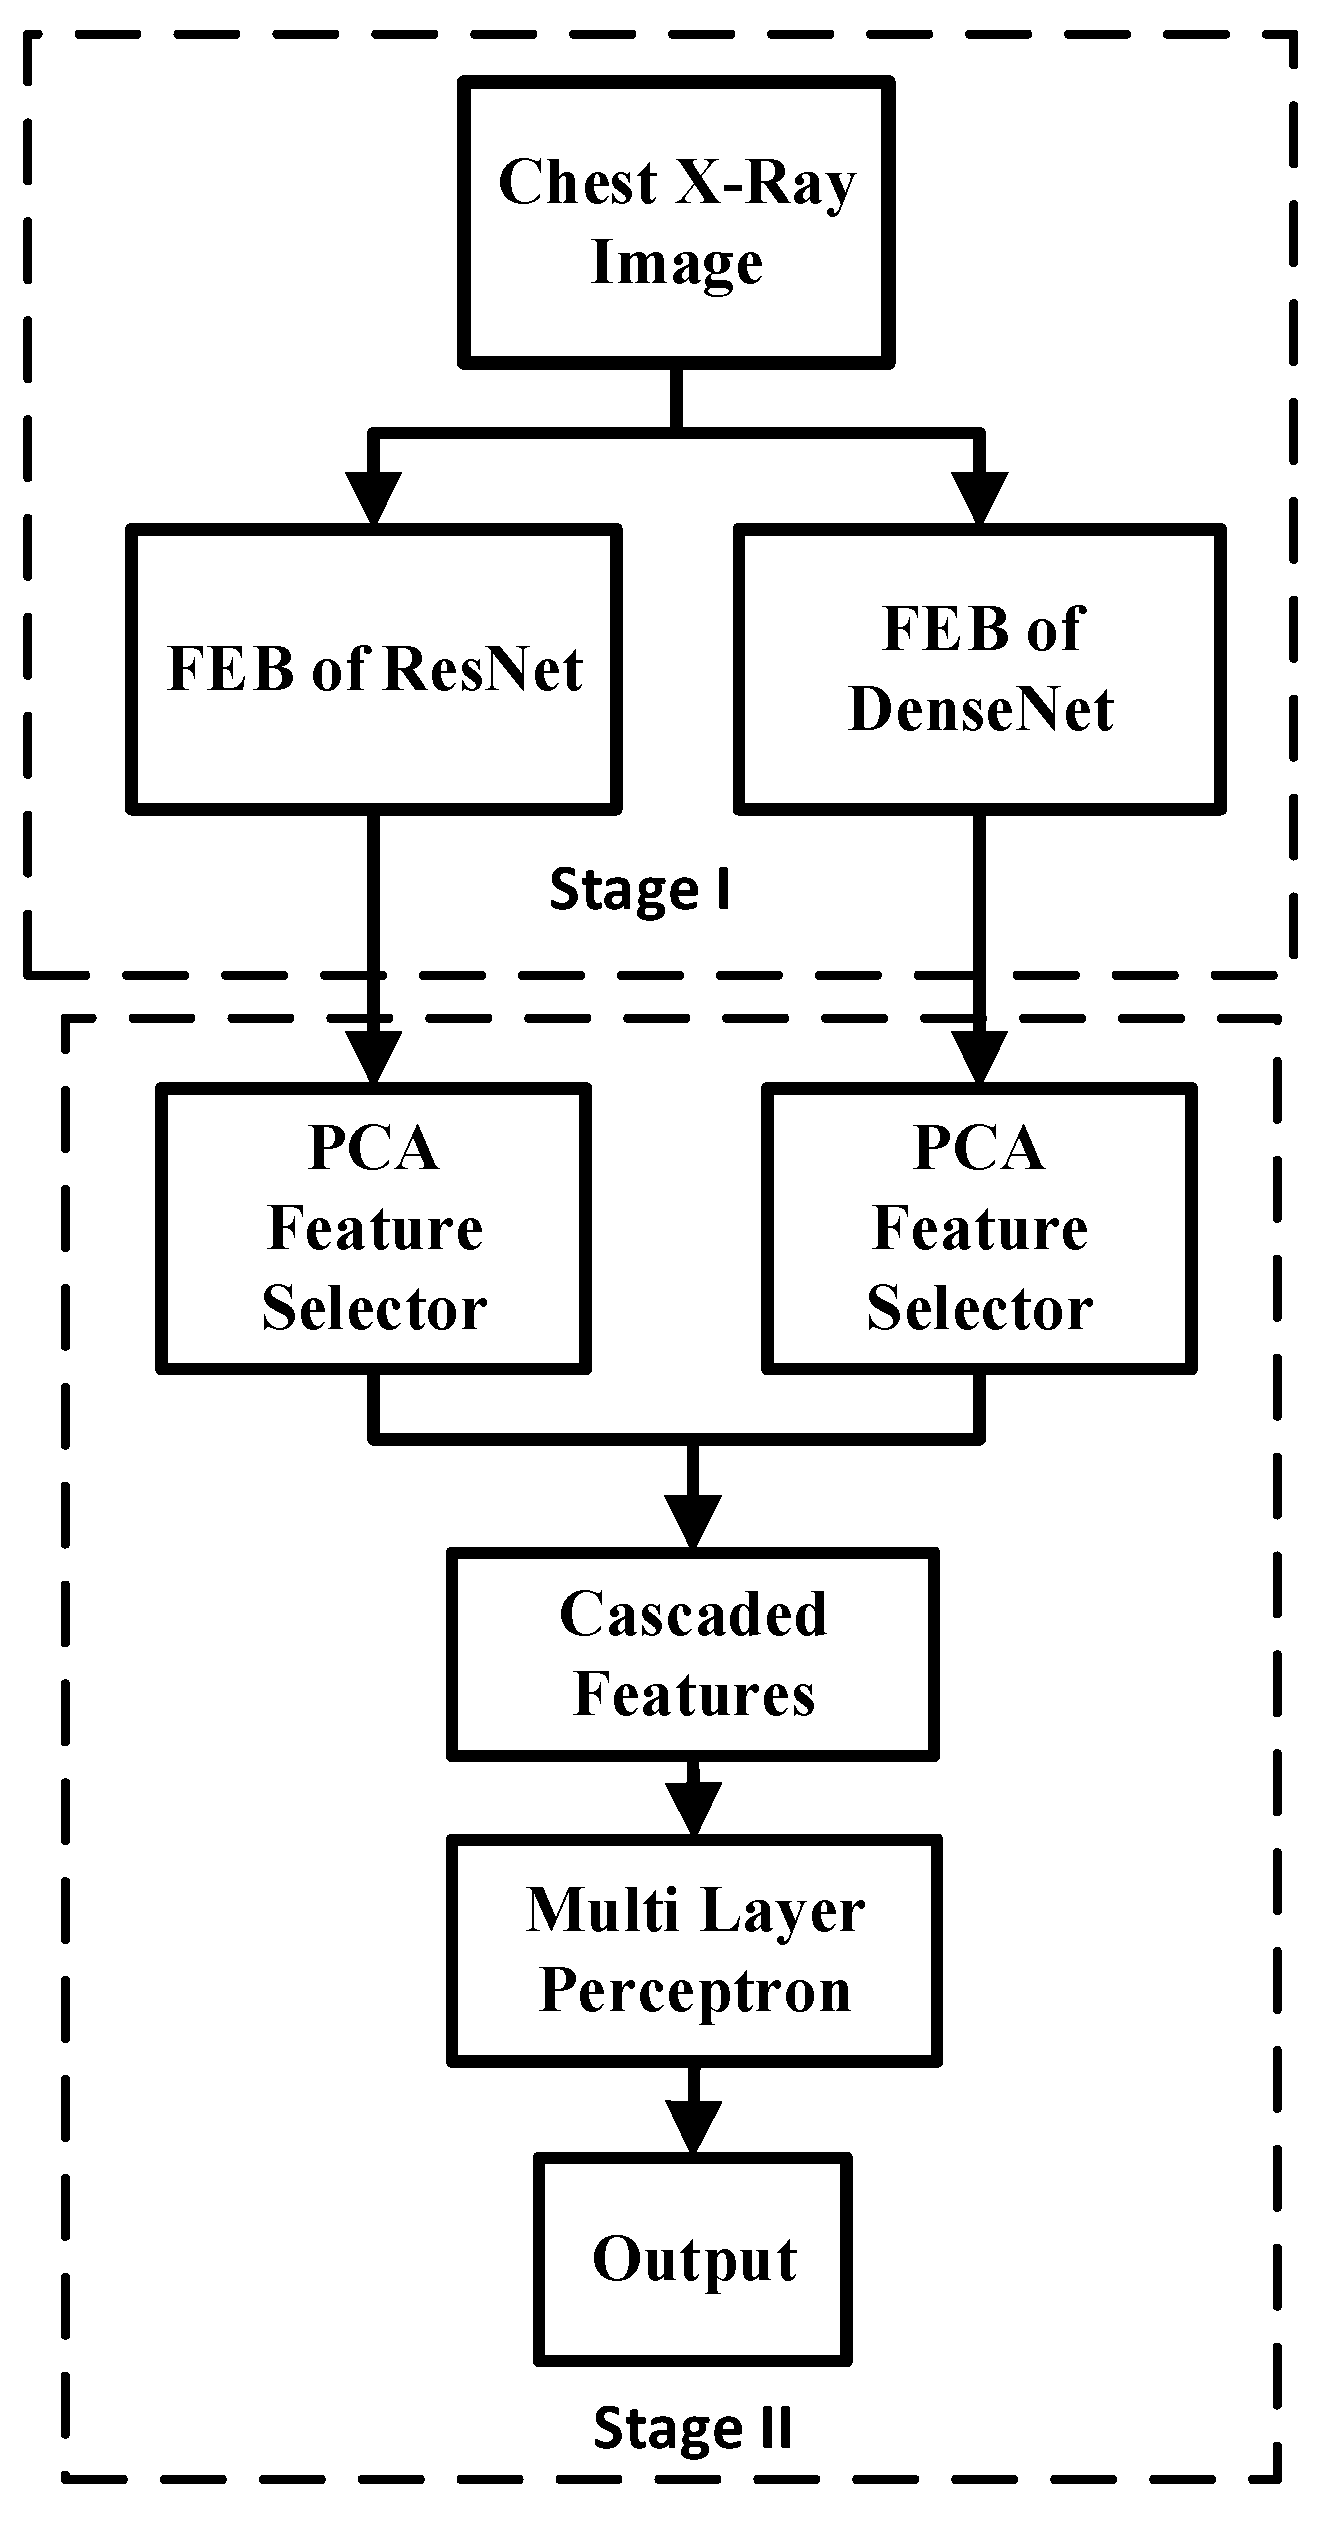
3.5. Fused Integrated Model (FIM)

The fused integrated model is an extension of a simple integrated model. The steps involved in the processing of this model are as follows:
Step 1: In the first stage, we extract two feature vectors parallelly using ResNetV2 and DenseNet121 from the Chest X-ray image.
Step 2: In the second stage, we apply these extracted features as input to PCA, which works as a feature selector.
Step 3: Next, we concatenate the selected features to form a concatenated vector.
Step 4: Finally, we apply the concatenated vector as input to the multilayer perceptron.
Figure 4 represents the block diagram of the fused integrated model. For both the SIM and FIM, we first choose one of the datasets (dataset1 or dataset2) and split it randomly into two independent data subsets with 70% and 30% for training and testing. In this work, we use MLP with two hidden layers, input and output layer. We use an error backpropagation algorithm [64] to optimize the network parameters with a learning rate of 0.3 on the training dataset. After completing the training of MLP, we obtain the confusion matrix for both training and test datasets. To compare with other methods using this confusion matrix, we obtain the performance measures that include accuracy, sensitivity, PPV, and specificity. The next subsection provides the details about getting these performance measures.

3.6. Performance Measures

The metrics to analyze the performance of different models are accuracy-percentage of correct predictions., specificity-percentage of an accurately predicted healthy individual sensitivity-percentage of accurately predicted unhealthy individuals, and positive predictive value-percentage of correct positive predictions.
The confusion matrix for dataset1 is as given in Table 2. We use Equations (1) to (4) to determine the values of the metrics, as mentioned above, for a two-class classification problem. The confusion matrix for dataset2 is as given in Table 3.
A c c u r a c y = T P + T N T P + T N + F P + F N
S e n s i t i v i t y ( R e c a l l ) = T P T P + F N
S p e c i f i c i t y = T N T N + F P
P o s i t i v e   P r e d i c t i v e   V a l u e   ( P P V ) = T P T P + F P
In the case of dataset2, we have three classes A(COVID-19), B(Normal), and C(Pneumonia); therefore, values of a false negative, false positive, and true negative are calculated for each of these class separately. Table 4 depicts Confusion Matrix for Dataset2.
As an example, the calculations for class A are as follows:
False Negative for class A is
FNA = Sum of all values in Row(A) − True Positive value of A (TPA), therefore, FNA = TPA + FAB + FAC − TPA = FAB + FAC.
Similarly, False Positive of class A is FPA = Sum of all values in Column(A) − True Positive value of A (TPA), therefore, FPA = TPA + FBA + FCA − TPA = FBA + FCA.
True Negative TNA = (Sum of all columns (Except Column A) +Sum of all rows (Except Row A)), or
TNA = TPB + FBC + FCB + TPC.
Equation (5) gives the accuracy of the models for dataset2.
A c c u r a c y = T P A + T P B + T P C T P A + T P B + T P C + F A B + F A C + F B A + F B C + F C A + F C B
The sensitivity, selectivity, and positive predictive value for class A are as per Equations (6) to (8).
S e n s i t i v i t y   ( A ) = T P A T P A + F N A
S e n s i t i v i t y   ( A ) = T N A T N A + F P A
P P V   ( A ) = T P A T P A + F P A
Similarly, the performance metrics for class B and class C.

4. Simulation Results

We carried out the simulations on the Google Colab Linux server, having an availability of a high-end processor. The GPUs available in Colab often include Nvidia K80s, T4s, P4s, and P100s, and there is no facility for choosing any one of them. The type of GPU available varies over time and is automatically assigned. Simulations carried by us help us to analyze the feature extraction capabilities of each of the pre-trained models. We obtain the performance metrics of all the pre-trained models using the different modeling methods, namely the new CNN model with shallow tuning, semi-supervised K-means detector, and simple integrated model. Once we identify the pre-trained model with the best feature extracting capability, we compare different modeling strategies to determine the best among them. In the first part of the simulation results, we show and compare the performance of each pre-trained model for each modeling approach.
For ease of representation, in the further discussion from now onwards, we use short forms, namely VN, IN, RN, DN, and MN, denoting VGG16, ResNet50, InceptionResNetV2, DenseNet121, and MobileNetV2 pre-trained models, respectively.

4.1. Analysis of New CNN Models with Shallow Tuning on Dataset1 and Dataset2

As depicted in Figure 5 and Figure 6, the performance of the new CNN model built using VGG16 is better in comparison to the models built with other pre-trained models. This VGG16 based model with shallow tuning achieves an accuracy of about 0.98 and 0.87 for two-class and three-class classification problem. As can be seen from the same figures, the performance of the MobileNetV2 based model is worst, and this model achieves an accuracy of 0.65 and 0.37 for two-class and three-class classification problems, respectively. It is observed that the performance of all the developed models deteriorates substantially for dataset2; see, for example, the value of sensitivity for COVID class is less than or equal to 0.64 for all the five developed models. The performance of the ResNetV2 or DenseNet121 based model achieves an accuracy of about 0.85 and 0.7 for the two-class and three-class problem. The other performance measures for model based on either ResNetV2 or DenseNet121 are also having similar values. The performance of the InceptionResNetV2 based model is inferior to all the developed models except the model based on MobileNetV2.

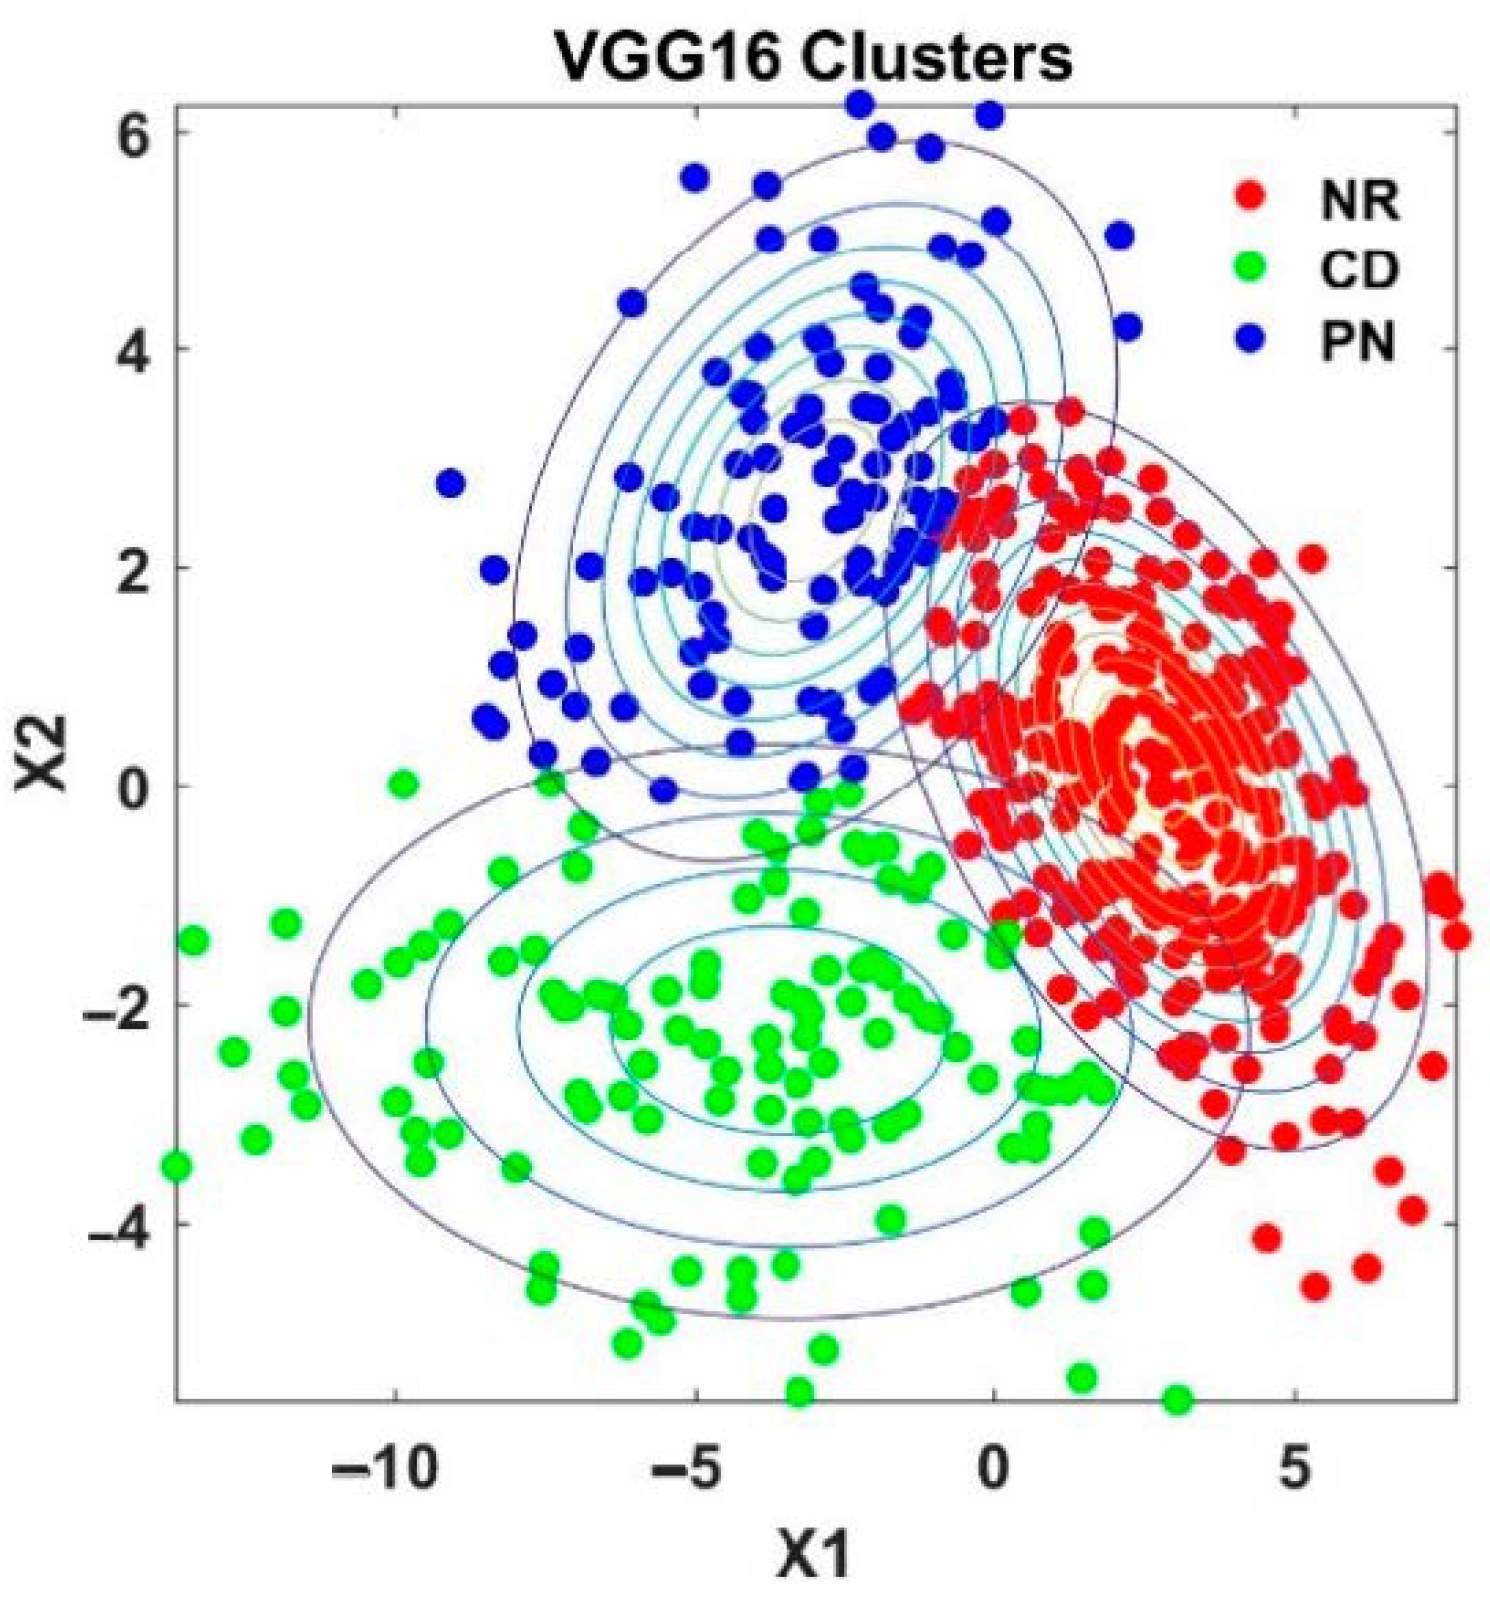
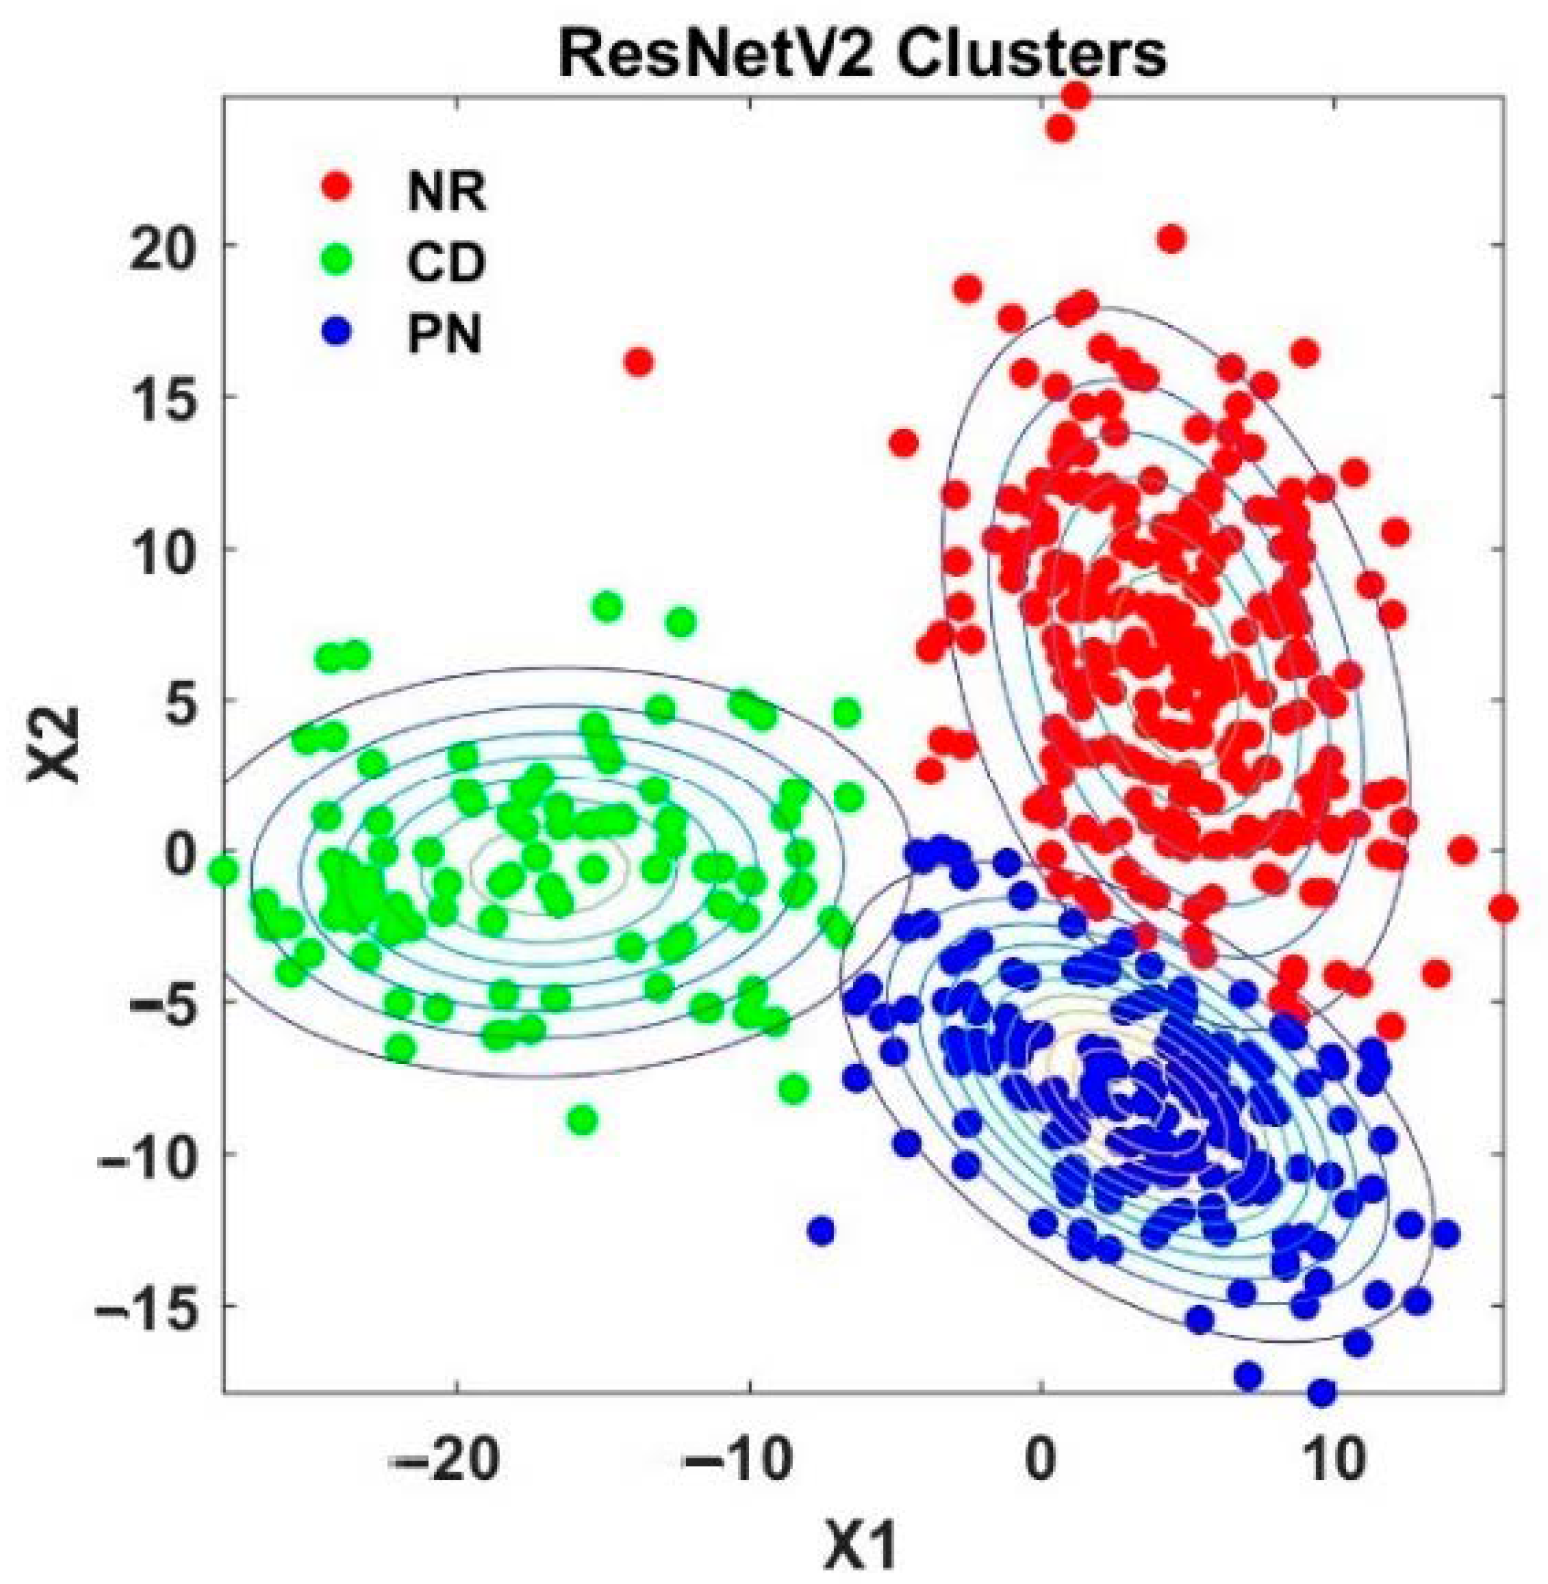
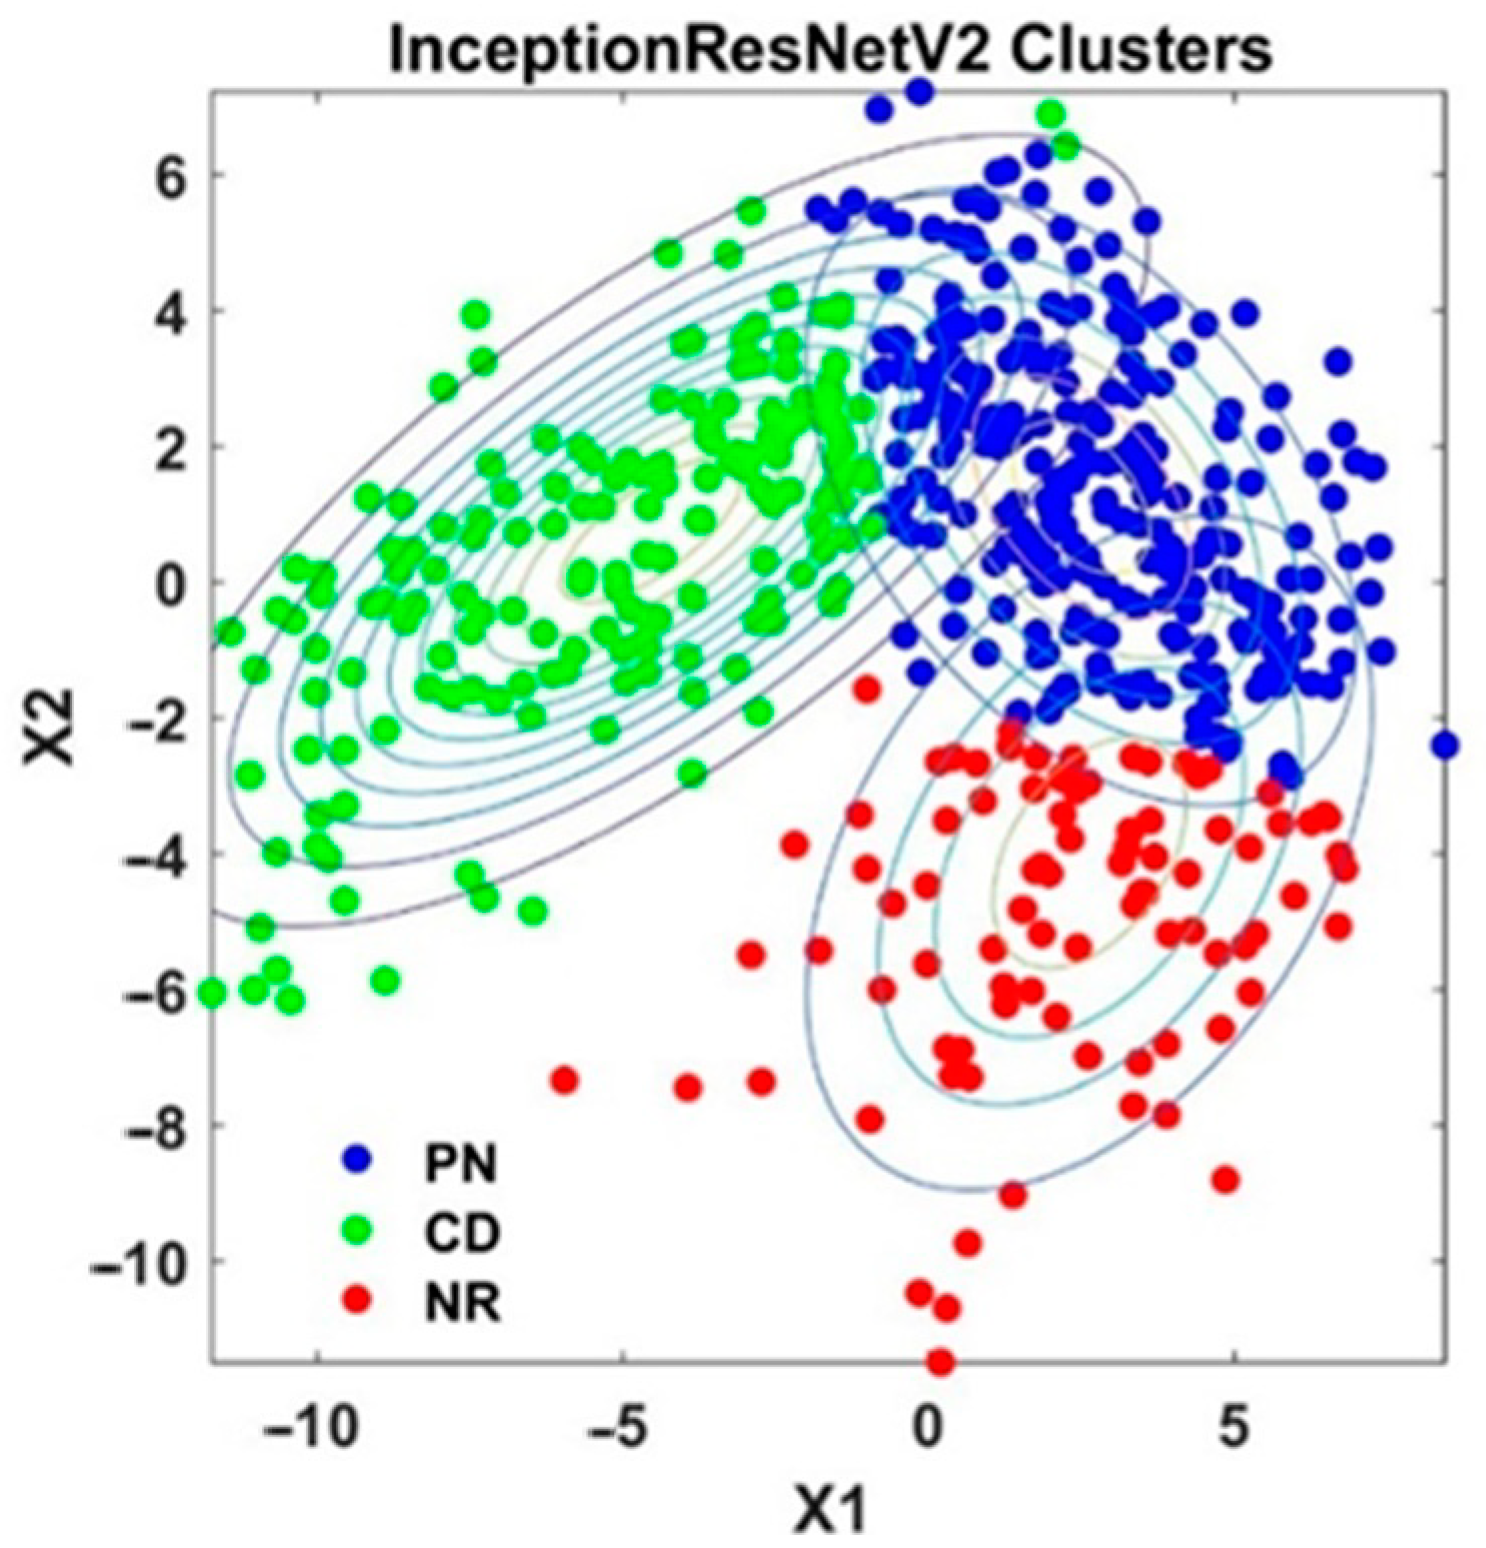
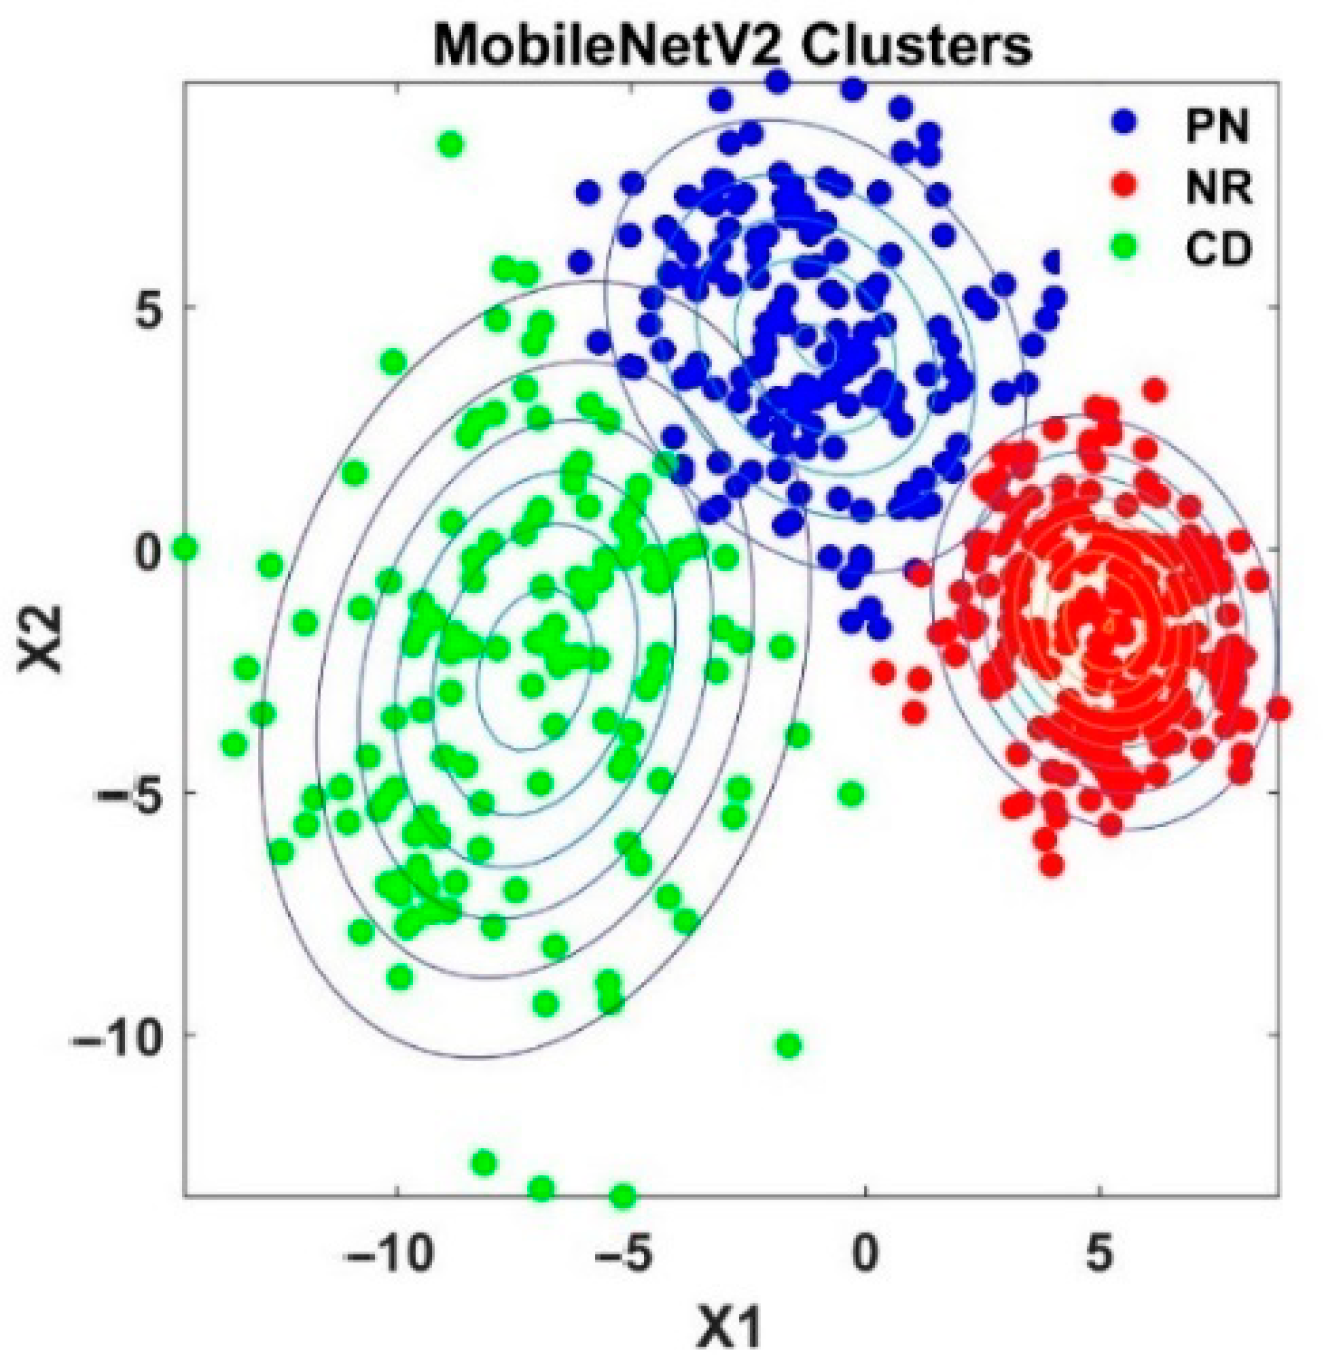
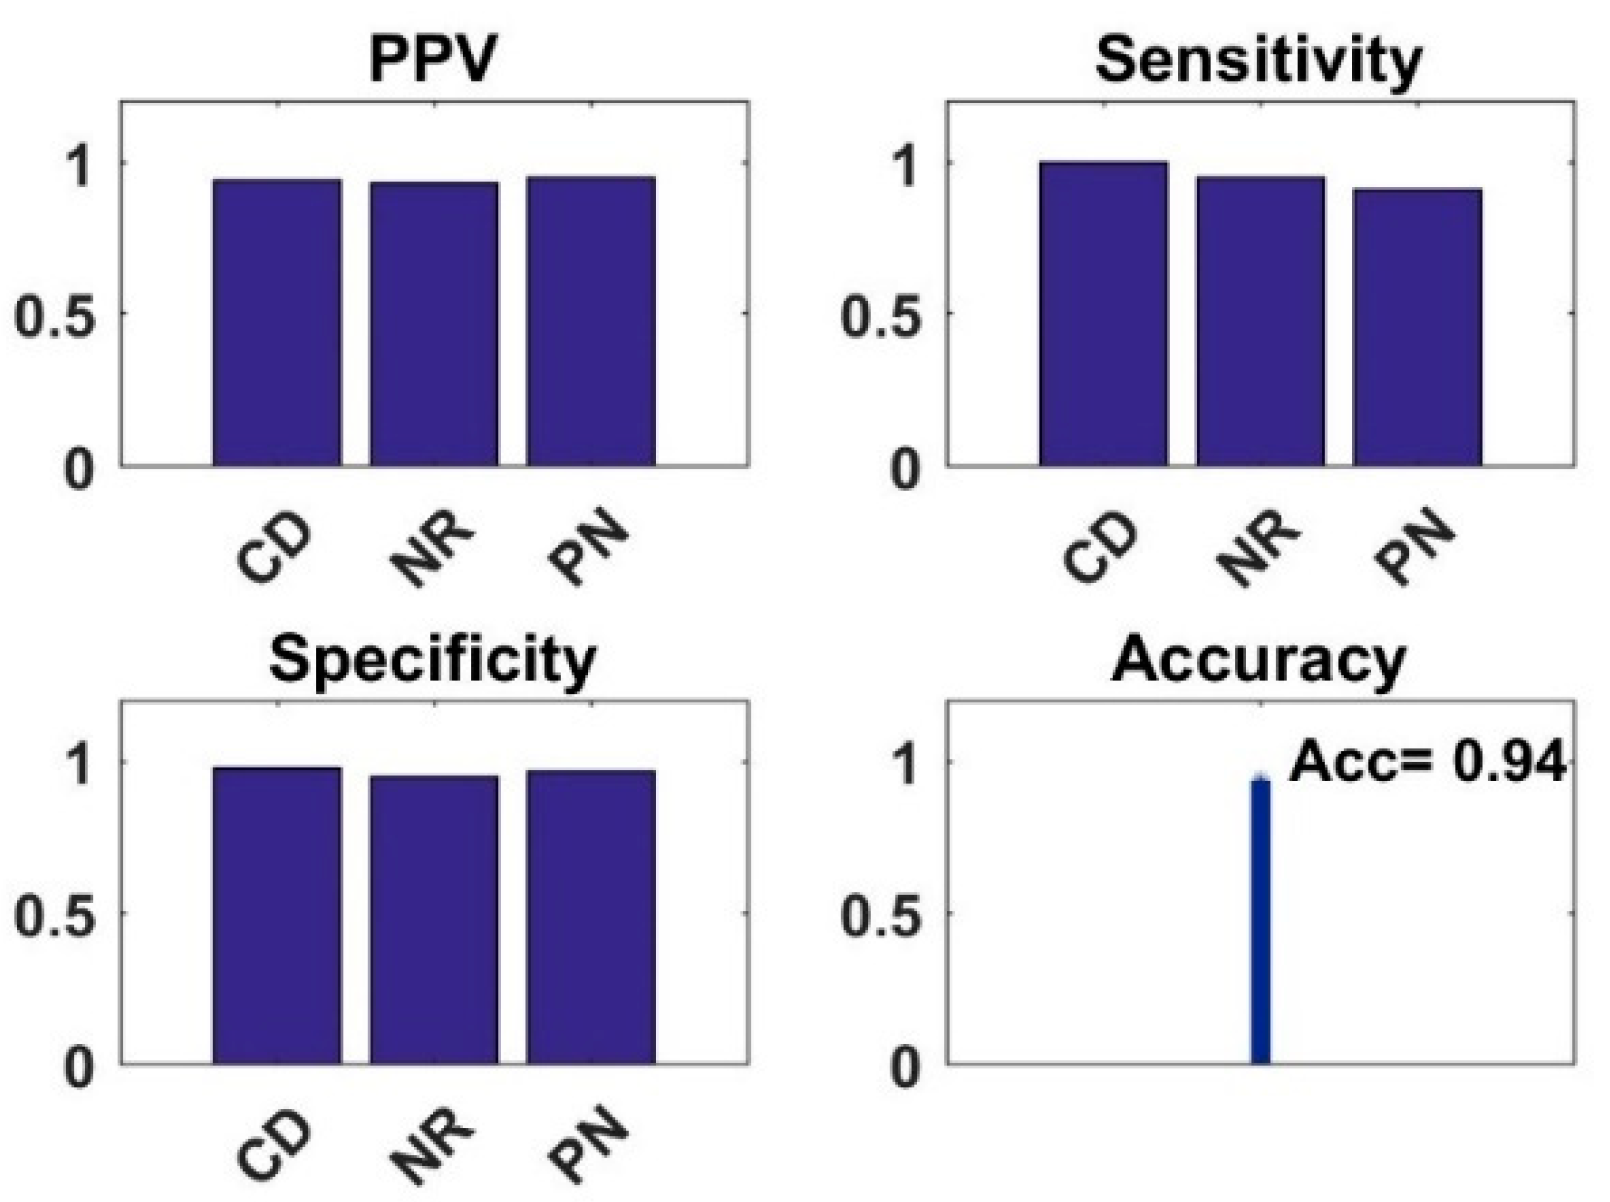
4.2. Analysis of Semi-Supervised K-Means Detector

As shown in Figure 7 for the two-class classification problems, the performance of the semi-supervised K-means approach is comparable for the features extracted using any of the five pre-trained CNN models. All the pre-trained models used in our study extract the requisite features to enable semi-supervised K-means technique to classify the X-ray images into normal and COVID with an accuracy of almost 1. Close observations reveal that the performance of the VGG16 based pretrained CNN model is slightly inferior in comparison to other pre-trained CNN models. Figure 8 shows the performance measures of a semi-supervised K-means detector for a three-class classification problem. We obtain these performance measures individually after extracting feature vectors using different pre-trained models. On comparing, we find that the performance of this semi-supervised K-means detector is superior when the extraction of features is done using either DenseNet121 or ResNetV2 pre-trained CNN model. For these two cases, the detector achieves an accuracy of 0.91; when the features are extracted using MobileNetV2, the detector achieves an accuracy of 0.89. The extraction of features using either InceptionResNetV2 or VGG16 pre-trained CNN models results in poor performance of the detector with an accuracy of around 0.7. Other performance measures also follow similar trends for all three classes (see Figure 8).

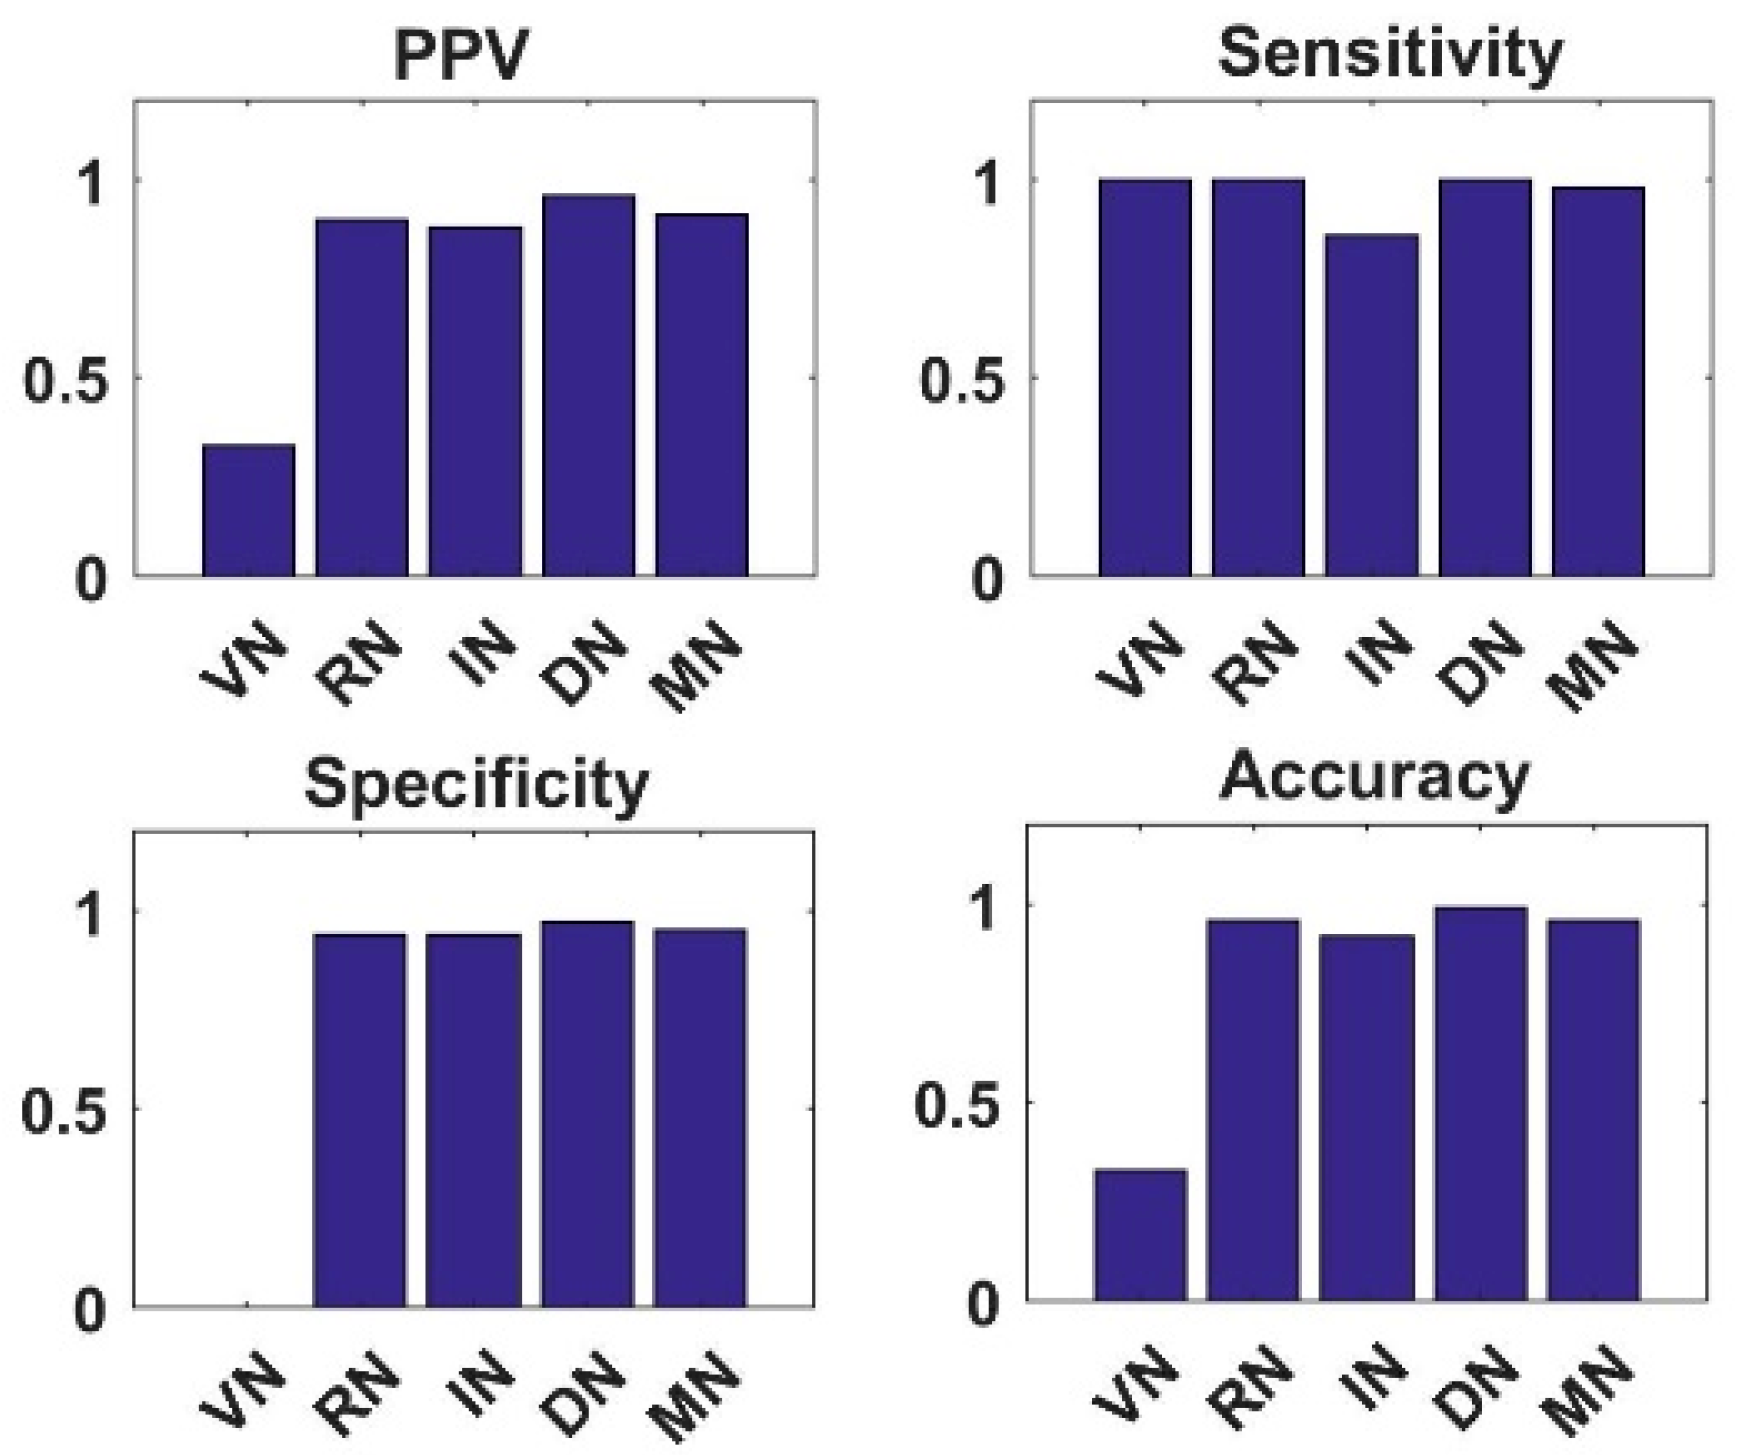
4.3. Analysis of Simple Integrated Model (SIM)

Simulation results shown in Figure 9 for the two-class classification problem show that the extraction of features using the DenseNet121 pre-trained CNN model makes the simple integrated model achieve an accuracy of 0.99. In comparison, when the SIM uses either MobileNetV2 or ResNetV2 pre-trained CNN models for extracting features, then it achieves an accuracy of 0.96. This model achieves an accuracy of 0.92 and 0.33 when the model extracts features using InceptionResNetv2 and VGG16 pre-trained CNN models. Other performance measures follow similar trends. These results show that for two-class classification problems, SIM performs the best when it extracts features using the DenseNet pre-trained model, and it performs the worst when it extracts the features using the VGG16 pre-trained CNN model.
Figure 10 depicts the bar charts for the values of performance measures obtained for three-class classification problems using a simple integrated model. The accuracy bar chart in Figure 10, compared with that of Figure 9, reveals that the performance of the simple integrated model deteriorates for a three-class classification problem (TCCP). For a TCCP, this model achieves an accuracy of 0.85, 0.82, 0.81, 0.66, and 0.23 when it extracts features using the DenseNet121, ResNetV2, MobileNetV2, InceptionResNetV2 and VGG16 pre-trained models, respectively. Other performance measures follow similar trends. Like its performance for the two-class classification problem for TCCP, this model performs the best when extracting features using the DenseNet pre-trained CNN model. SIM performs the worst when it extracts the features using the VGG16 pre-trained CNN model. During simulations, the hyperparameters were kept the same for different pre-trained CNN models. Further, during simulations, we applied the two most prominent principal components obtained using principal component analysis as input to the multi-layered perceptron.

4.4. Analysis of Knowledge Transfer Capability of Different Pre-Trained CNN Models

Simulation results for different approaches discussed in the previous sections use pre-trained CNN models for knowledge transfer. In these approaches, performance largely depends upon the knowledge transfer capabilities of the pre-trained models. The feature vector in abstract form represents this knowledge. Therefore, to analyze the pre-trained models’ knowledge transfer capabilities, we plot the extracted feature vectors in two-dimensional space. To plot the feature vectors in two-dimensional space, we utilize principal component analysis. After extracting feature vectors using different pre-trained models, we obtain their two most prominent principal components (PC) and then plot these prominent PCs in two-dimensional space. Figure 11, Figure 12, Figure 13, Figure 14 and Figure 15 are showing representative extracted feature vectors for VGG16, ResNetV2, InceptionResNetV2, DenseNet121 and MobileNetV2, respectively.
As shown in these figures, the feature vectors for different classes (COVID, Normal, and Pneumonia) occupy regions with minimal overlap among regions if extracted using DenseNet121 or ResnetV2 pre-trained CNNs (Figure 12 and Figure 14).
In comparison, the amount of overlap among regions representing different classes for features extracted using either VGG16 or InceptionResNetV2 pre-trained CNNs is quite large (Figure 10 and Figure 12). The overlap between the regions representing different classes for feature vectors extracted using MobileNetV2 pre-trained CNN is between the above two cases (Figure 14). These results suggest that DenseNet121 and ResNetV2 pre-trained CNNs transfer adequate knowledge, whereas VGG16 and InceptionResNetV2 transfer coarse knowledge requiring further processing. It also helps us to build the notion that VGG16 and InceptionResNetV2 can extract low-level features, whereas DenseNet121 and ResNetV2 can extract high-level features making the images quite distinctive.

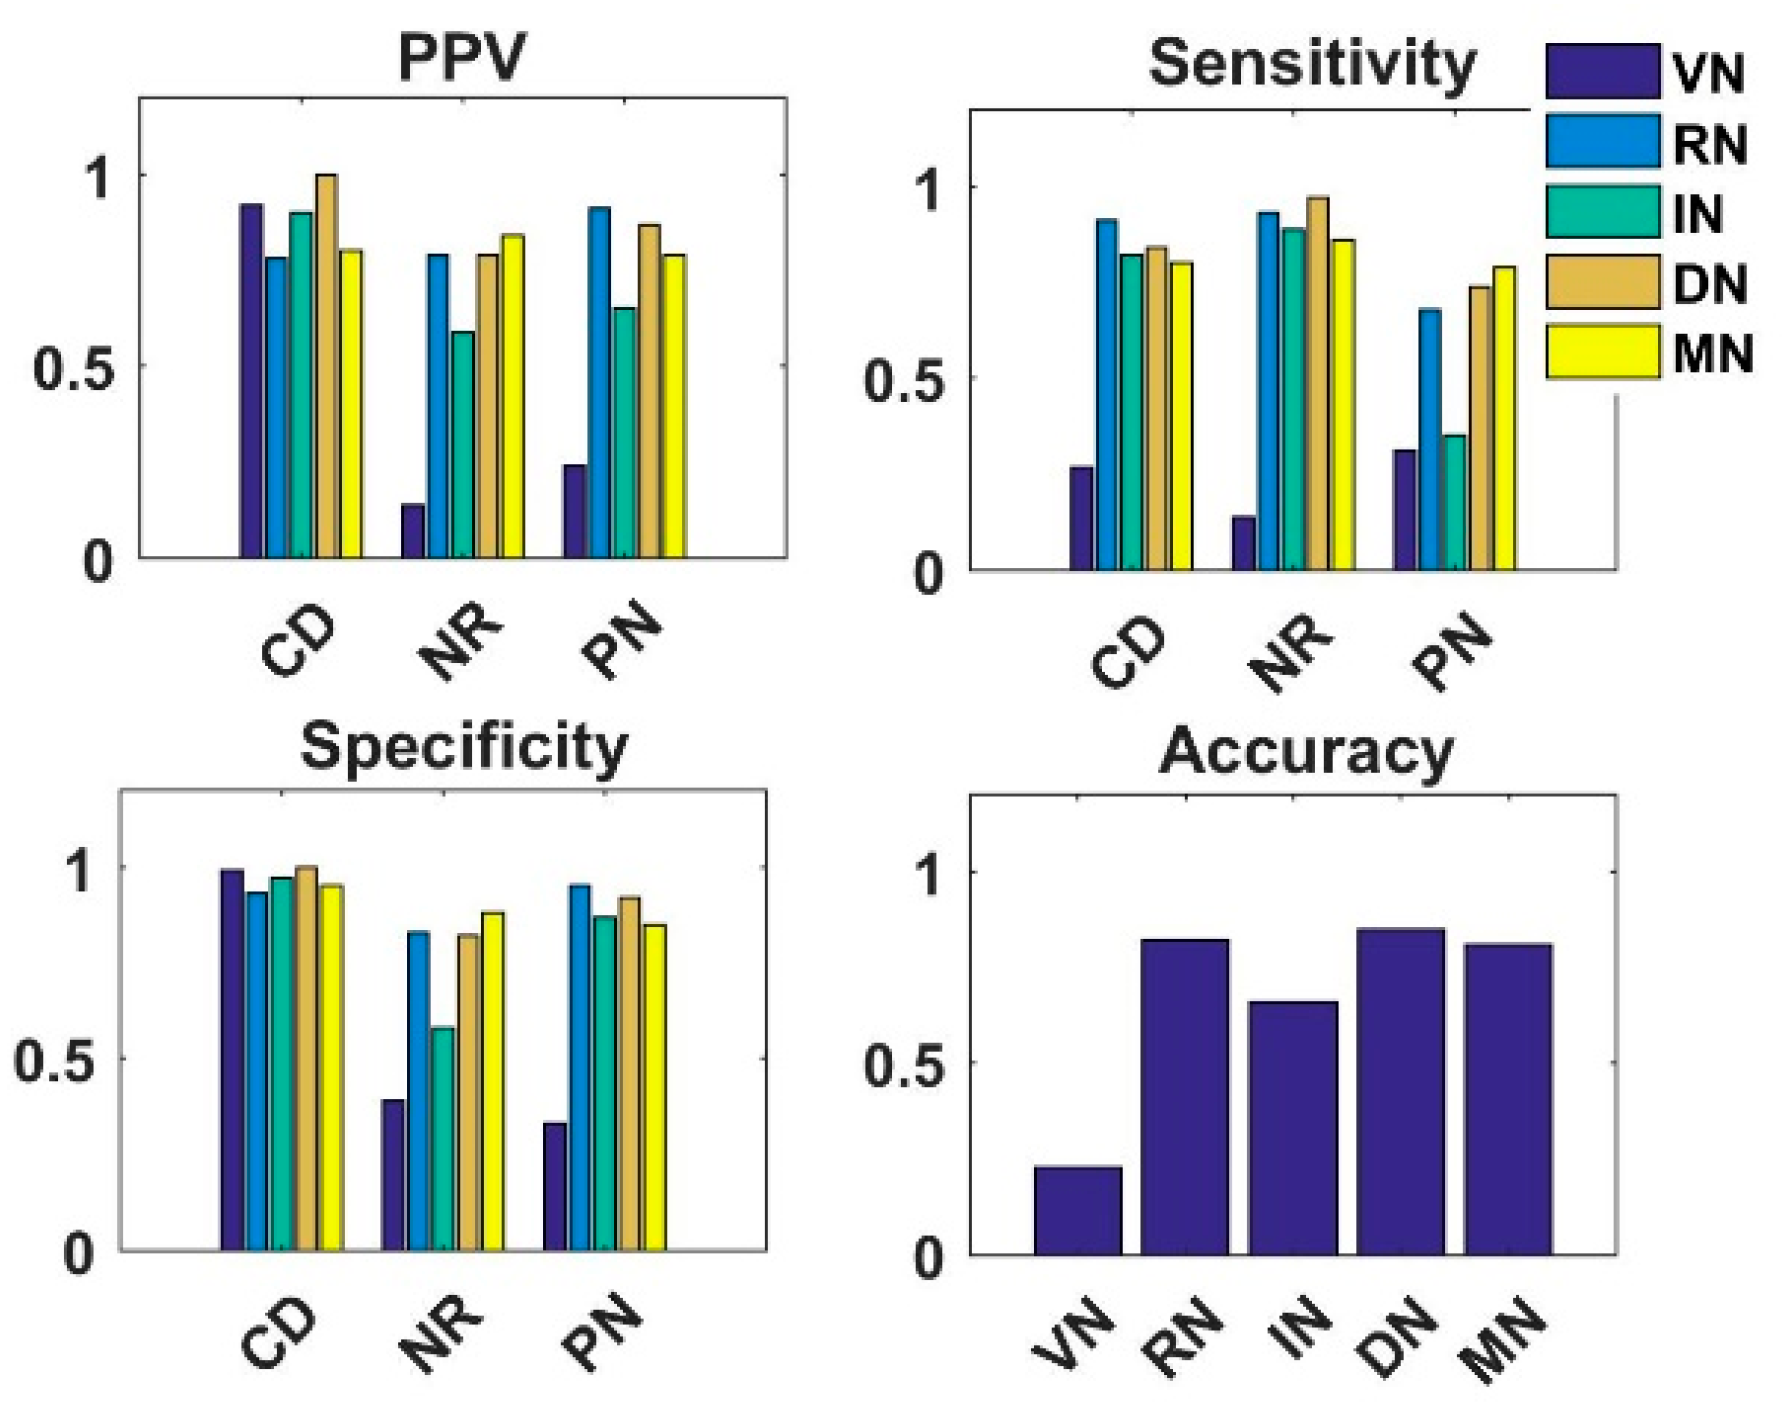
4.5. Analysis of Fused Integrated Model

To access the impact of combining features extracted using different pre-trained CNN models, we in this work framed the fused integrated model wherein the feature vectors extracted with the help of DenseNet121 and ResNetV2 were concatenated before applying to MLP. Figure 16 shows the bar chart for different performance measures for all three classes. This model achieves an accuracy of 0.94 for a three-class classification problem TCCP. This accuracy is better than the best that we could achieve in all the other three approaches signifying the usefulness of fusing the feature vectors extracted using different pre-trained models. The other performance measures also show the same trends, i.e., an improvement in values compared to all other approaches for all classes.

5. Comparison of Results with other Modeling Studies

The comparison of our proposed models with other modeling studies reveal that we also obtain similar kind of results. The comparison is depicted in Table 5. As can be seen from this table that accuracy for three-class classification problem is always less than accuracy for two-class classification problem. Our results are consistent with the other similar studies.

6. Conclusions

In this work, we proposed four different approaches for the detection of COVID-19. For the extraction of features using CNN we used Python. For K-means approach, principal component analysis, visualization, plotting of figures etc., we made use of Matlab. The number of epoch and batch size for different approaches is 15 epochs and batch size 5. All these approaches are based on the concept of transfer learning using pre-trained convolutional neural networks. We used VGG16, ResNetV2, InceptionResNetV2, DenseNet121, and MobileNetV2 CNNs pre-trained on the ImageNet dataset individually in the three approaches and used ResNetV2 with DenseNet in fused integrated model approach. It is interesting to find that even though there is a little resemblance between the ImageNet dataset and X-ray images dataset, these pre-trained models possess sufficient knowledge transfer capabilities to make them suitable and useful for classification purposes. We could show that even a straightforward unsupervised K-means clustering algorithm clusters the extracted features into three clusters. Another important conclusion is that the application of the concept of feature selection not only reduces the computational time but also helps in improving the performance of the classifiers. Surprisingly we found that the performance of VGG16 based model was better than other pre-trained based models in case of a shallow tuning approach. This result indicates that if the pre-trained model extracts low-level features, then the chance of getting improved performance while using shallow tuning gets enhanced. Of all the approaches fused integral model approach achieves better values for different performance measures. These results suggest that different pre-trained CNN models have different feature extraction capabilities, and the fusion of these extracted features enhances the classifier performance. Although we have used these approaches to classify X-ray images, our results indicate that these approaches will prove useful to classify data of any domain with a limited dataset. Finally, it is essential to mention that since in this study we did not apply any interpretation method we recommend that present study and the results obtained in this study should not be directly used in clinical cases.

Author Contributions

Data curation, T.G.; formal analysis, A.R.G.; investigation, A.R.G.; methodology, A.R.G.; resources, O.P.M.; software, T.G.; supervision, O.P.M.; writing—original draft, M.G.; writing—review and editing, A.R.G. All authors have read and agreed to the published version of the manuscript.

Funding

This research received no external funding.

Conflicts of Interest

The authors declare no conflict of interest.

References

  1. Allam, M.; Cai, S.; Ganesh, S.; Venkatesan, M.; Doodhwala, S.; Song, Z.; Hu, T.; Kumar, A.; Heit, J.; COVID-Nineteen Study Group; et al. COVID-19 diagnostics, tools, and prevention. Diagnostics 2020, 10, 409. [Google Scholar] [CrossRef]
  2. Abbott. Abbott Launches Molecular Point-of-Care Test to Detect Novel Coronavirus in as Little as Five Minutes. Available online: https://abbott.mediaroom.com/2020-03-27-Abbott-Launches-MolecularPoint-of-Care-Test-to-Detect-Novel-Coronavirus-in-as-Little-as-Five-Minutes (accessed on 25 October 2020).
  3. Mitra, A.P.; Suri, S.; Goyal, T.; Misra, R.; Singh, K.; Garg, M.K.; Misra, S.; Sharma, P. Association of comorbidities with Coronavirus disease 2019: A review. Ann. Natl. Acad. Med. Sci. 2020, 56, 102–111. [Google Scholar] [CrossRef]
  4. Rubin, G.D.; Ryerson, C.J.; Haramati, L.B.; Sverzellati, N.; Kanne, J.P.; Raoof, S.; Schluger, N.W.; Volpi, A.; Yim, J.-J.; Martin, I.B.; et al. The role of chest imaging in patient management during the COVID-19 pandemic. Chest 2020, 158, 106–116. [Google Scholar] [CrossRef] [PubMed]
  5. Bhalla, A.S.; Jana, M.; Naranje, P.; Manchanda, S. Role of chest radiographs during COVID-19 pandemic. Ann. Natl. Acad. Med Sci. 2020, 56, 138–144. [Google Scholar] [CrossRef]
  6. Li, Y.; Xia, L. Coronavirus disease 2019 (COVID-19): Role of chest CT in diagnosis and management. Am. J. Roentgenol. 2020, 214, 1280–1286. [Google Scholar] [CrossRef]
  7. Zhao, W.; Zhong, Z.; Xie, X.; Yu, Q.; Liu, J. Relation between chest CT findings and clinical conditions of coronavirus disease (COVID-19) pneumonia: A multicenter study. Am. J. Roentgenol. 2020, 214, 1072–1077. [Google Scholar] [CrossRef]
  8. Qin, C.; Yao, D.; Shi, Y.; Song, Z. Computer-aided detection in chest radiography based on artificial intelligence: A survey. Biomed. Eng. Online 2018, 17, 1–23. [Google Scholar] [CrossRef] [Green Version]
  9. Shen, D.; Wu, G.; Suk, H. Deep learning in medical image analysis. Annu. Rev. Biomed. Eng. 2017, 19, 221–248. [Google Scholar] [CrossRef] [Green Version]
  10. Litjens, G.; Kooi, T.; Bejnordi, B.E.; Setio, A.A.A.; Ciompi, F.; Ghafoorian, M.; Van Der Laak, J.A.W.M.; Van Ginneken, B.; Sánchez, C.I. A survey on deep learning in medical image analysis. Med. Image Anal. 2017, 42, 60–88. [Google Scholar] [CrossRef] [Green Version]
  11. Ker, J.; Wang, L.; Rao, J.; Lim, T. Deep learning applications in medical image analysis. IEEE Access 2018, 6, 9375–9389. [Google Scholar] [CrossRef]
  12. Faust, O.; Hagiwara, Y.; Hong, T.J.; Lih, O.S.; Acharya, U.R. Deep learning for healthcare applications based on physiological signals: A review. Comput. Methods Programs Biomed. 2018, 161, 1–13. [Google Scholar] [CrossRef] [PubMed]
  13. Murat, F.; Yildirim, O.; Talo, M.; Baloglu, U.B.; Demir, Y.; Acharya, U.R. Application of deep learning techniques for heartbeats detection using ECG signals-analysis and review. Comput. Biol. Med. 2020, 120, 103726. [Google Scholar] [CrossRef] [PubMed]
  14. Topol, E.J. High-performance medicine: The convergence of human and artificial intelligence. Nat. Med. 2019, 25, 44–56. [Google Scholar] [CrossRef] [PubMed]
  15. Esteva, A.; Robicquet, A.; Ramsundar, B.; Kuleshov, V.; Depristo, M.; Chou, K.; Cui, C.; Corrado, G.; Thrun, S.; Dean, J. A guide to deep learning in healthcare. Nat. Med. 2019, 25, 24–29. [Google Scholar] [CrossRef]
  16. Kermany, D.S.; Goldbaum, M.; Cai, W.; Valentim, C.C.S.; Liang, H.; Baxter, S.L.; McKeown, A.; Yang, G.; Wu, X.; Yan, F.; et al. Identifying medical diagnoses and treatable diseases by image-based deep learning. Cell 2018, 172, 1122–1131. [Google Scholar] [CrossRef] [PubMed]
  17. Lan, L.; Ye, C.; Wang, C.; Zhou, S. Deep convolutional neural networks for WCE abnormality detection: CNN architecture, region proposal and transfer learning. IEEE Access 2019, 7, 30017–30032. [Google Scholar] [CrossRef]
  18. Brown, J.M.; Campbell, J.P.; Beers, A.; Chang, K.; Ostmo, S.; Chan, R.P.; Dy, J.; Erdogmus, D.; Ioannidis, S.; Kalpathy-Cramer, J.; et al. Automated diagnosis of plus disease in retinopathy of prematurity using deep convolutional neural networks. JAMA Ophthalmol. 2018, 136, 803–810. [Google Scholar] [CrossRef]
  19. Shin, H.-C.; Roth, H.R.; Gao, M.; Lu, L.; Xu, Z.; Nogues, I.; Yao, J.; Mollura, D.; Summers, R.M. Deep convolutional neural networks for computer-aided detection: CNN architectures, dataset characteristics and transfer learning. IEEE Trans. Med. Imaging 2016, 35, 1285–1298. [Google Scholar] [CrossRef] [Green Version]
  20. Oquab, M.; Bottou, L.; Laptev, I.; Sivic, J. Learning and Transferring Mid-level Image Representations Using Convolutional Neural Networks. In Proceedings of the 2014 IEEE Conference on Computer Vision and Pattern Recognition, Institute of Electrical and Electronics Engineers (IEEE), Columbus, OH, USA, 23–28 June 2014; pp. 1717–1724. [Google Scholar]
  21. Kaur, T.; Gandhi, T.K. Deep convolutional neural networks with transfer learning for automated brain image classification. Mach. Vis. Appl. 2020, 31, 1–16. [Google Scholar] [CrossRef]
  22. Tajbakhsh, N.; Shin, J.Y.; Gurudu, S.R.; Hurst, R.T.; Kendall, C.B.; Gotway, M.B.; Liang, J. Convolutional neural networks for medical image analysis: Full training or fine tuning? IEEE Trans. Med. Imaging 2016, 35, 1299–1312. [Google Scholar] [CrossRef] [Green Version]
  23. Li, F.; Liu, Z.; Chen, H.; Jiang, M.-S.; Zhang, X.; Wu, Z. Automatic detection of diabetic retinopathy in retinal fundus photographs based on deep learning algorithm. Transl. Vis. Sci. Technol. 2019, 8, 4. [Google Scholar] [CrossRef] [PubMed] [Green Version]
  24. Wang, C.; Chen, D.; Hao, L.; Liu, X.; Zeng, Y.; Chen, J.; Zhang, G.; Lin, H.; Liu, B.X.; Zeng, C.Y.; et al. Pulmonary image classification based on inception-v3 transfer learning model. IEEE Access 2019, 7, 146533–146541. [Google Scholar] [CrossRef]
  25. Mormont, R.; Geurts, P.; Maree, R. Comparison of Deep Transfer Learning Strategies for Digital Pathology. In Proceedings of the 2018 IEEE/CVF Conference on Computer Vision and Pattern Recognition Workshops (CVPRW), Institute of Electrical and Electronics Engineers (IEEE), Salt Lake City, UT, USA, 18–22 June 2018. [Google Scholar]
  26. Wang, L.; Wong, A. COVID-net: A tailored deep convolutional neural network design for detection of COVID-19 cases from chest radiography images. arXiv 2020, arXiv:2003.09871. [Google Scholar] [CrossRef] [PubMed]
  27. Afshar, P.; Heidarian, S.; Naderkhani, F.; Oikonomou, A.; Plataniotis, K.N.; Mohammadi, A. COVID-CAPS: A capsule network-based framework for identification of COVID-19 cases from X-ray images. Pattern Recognit. Lett. 2020, 138, 638–643. [Google Scholar] [CrossRef] [PubMed]
  28. Islam, Z.; Islam, M.; Asraf, A. A combined deep CNN-LSTM network for the detection of novel coronavirus (COVID-19) using X-ray images. Inform. Med. Unlocked 2020, 20, 100412. [Google Scholar] [CrossRef]
  29. Rahimzadeh, M.; Attar, A. A new modified deep convolutional neural network for detecting COVID-19 from X-ray images. arXiv 2020, arXiv:2004.08052. [Google Scholar]
  30. Alqudah, A.M.; Qazan, S.; Alquran, H.H.; Qasmieh, I.A.; Alqudah, A. Covid-2019 Detection Using X-ray Images and Artificial Intelligence Hybrid Systems. Available online: https://0-doi-org.brum.beds.ac.uk/10.13140/RG.2.2.16077.59362/1 (accessed on 3 December 2020).
  31. Ucar, F.; Korkmaz, D. COVIDiagnosis-Net: Deep Bayes-SqueezeNet based diagnosis of the coronavirus disease 2019 (COVID-19) from X-ray images. Med Hypotheses 2020, 140, 109761. [Google Scholar] [CrossRef]
  32. Kumar, P.; Kumari, S. Detection of Coronavirus Disease (COVID-19) Based on Deep Features. Available online: https://Www.Preprints.Org/Manuscript/202003.0300/V1 (accessed on 3 December 2020).
  33. Jain, R.; Gupta, M.; Taneja, S.; Hemanth, D.J. Deep learning based detection and analysis of COVID-19 on chest X-ray images. Appl. Intell. 2020, 1–11. [Google Scholar] [CrossRef]
  34. Abbas, A.; Abdelsamea, M.M.; Gaber, M.M. Classification of COVID-19 in chest X-ray images using DeTraC deep convolutional neural network. Appl. Intell. 2020, 1–11. [Google Scholar] [CrossRef]
  35. Hemdan, E.E.D.; Shouman, M.A.; Karar, M.E. COVIDX-net: A framework of deep learning classifiers to diagnose COVID-19 in X-ray images. arXiv 2020, arXiv:2003.11055. [Google Scholar]
  36. Apostolopoulos, I.D.; Mpesiana, T.A. Covid-19: Automatic detection from X-ray images utilizing transfer learning with convolutional neural networks. Phys. Eng. Sci. Med. 2020, 43, 635–640. [Google Scholar] [CrossRef] [PubMed] [Green Version]
  37. Narin, A.; Kaya, C.; Pamuk, Z. Automatic detection of Coronavirus disease (COVID- 19) using X-ray images and deep convolutional neural networks. arXiv 2020, arXiv:2003.10849. [Google Scholar]
  38. Ozturk, T.; Talo, M.; Yildirim, E.A.; Baloglu, U.B.; Yildirim, O.; Acharya, U.R. Automated detection of COVID-19 cases using deep neural networks with X-ray images. Comput. Biol. Med. 2020, 121, 103792. [Google Scholar] [CrossRef] [PubMed]
  39. Luz, E.; Lopes Silva, P.; Silva, R.; Moreira, G. Towards an efficient deep learning model for covid-19 patterns detection in x-ray images. arXiv 2020, arXiv:2004.05717. [Google Scholar]
  40. Ghoshal, B.; Tucker, A. Estimating uncertainty and interpretability in deep learning for coronavirus (COVID-19) detection. arXiv 2020, arXiv:2003.10769. [Google Scholar]
  41. Zhang, J.; Xie, Y.; Li, Y.; Shen, C.; Xia, Y. COVID-19 screening on Chest X-ray images using deep learning based anomaly detection. arXiv 2020, arXiv:2003.12338. [Google Scholar]
  42. Sethy, P.K.; Behera, S.K.; Ratha, P.K.; Biswas, P. Detection of Coronavirus disease (COVID-19) based on deep features and support vector machine. Int. J. Math. Eng. Manag. Sci. 2020, 5, 643–651. [Google Scholar] [CrossRef]
  43. Roberts, M. Machine learning for COVID-19 detection and prognostication using chest radiographs and CT scans: A systematic methodological review. arXiv 2020, arXiv:2008.06388. [Google Scholar]
  44. Majeed, T.; Rashid, R.; Ali, D.; Asaad, A. Issues associated with deploying CNN transfer learning to detect COVID-19 from chest X-rays. Phys. Eng. Sci. Med. 2020, 1–15. [Google Scholar] [CrossRef]
  45. Hubel, D.H.; Wiesel, T.N. Receptive fields, binocular interaction, and functional architecture in the cat’s visual cortex. J. Physiol. 1962, 160, 106–154. [Google Scholar] [CrossRef]
  46. Van Essen, D.C.; Maunsell, J.H. Hierarchical organization and functional streams in the visual cortex. Trends Neurosci. 1983, 6, 370–375. [Google Scholar] [CrossRef]
  47. LeCun, Y.; Bottou, L.; Bengio, Y.; Haffner, P. Gradient-based learning applied to document recognition. Proc. IEEE 1998, 86, 2278–2324. [Google Scholar] [CrossRef] [Green Version]
  48. Razavian, A.S.; Azizpour, H.; Sullivan, J.; Carlsson, S. CNN Features Off-the-Shelf: An Astounding Baseline for Recognition. In Proceedings of the 2014 IEEE Conference on Computer Vision and Pattern Recognition Workshops, Institute of Electrical and Electronics Engineers (IEEE), Columbus, OH, USA, 23–28 June 2014; pp. 512–519. [Google Scholar]
  49. Simonyan, K.; Zisserman, A. Very deep convolutional networks for large-scale image recognition. arXiv 2014, arXiv:1409.1556. [Google Scholar]
  50. Xie, S.; Girshick, R.; Dollar, P.; Tu, Z.; He, K. Aggregated Residual Transformations for Deep Neural Networks. In Proceedings of the 2017 IEEE Conference on Computer Vision and Pattern Recognition (CVPR), Institute of Electrical and Electronics Engineers (IEEE), Honolulu, HI, USA, 21–26 July 2017; pp. 5987–5995. [Google Scholar]
  51. He, K.; Zhang, X.; Ren, S.; Sun, J. Spatial pyramid pooling in deep convolutional networks for visual recognition. arXiv 2014, arXiv:1406.4729. [Google Scholar]
  52. Zewen, L.; Wenjie, Y.; Shouheng, P.; Fan, L. A survey of convolutional neural networks: Analysis, applications, and prospects. arXiv 2020, arXiv:2004.02806v1. [Google Scholar]
  53. Szegedy, C.; Ioffe, S.; Vanhoucke, V. Inception-v4, Inception-Resnet and the Impact of Residual Connections on Learning. In Proceedings of the 2016 International Conference on Learning Representations, San Juan, PR, USA, 2–4 May 2016. [Google Scholar]
  54. Sandler, M.; Howard, A.; Zhu, M.; Zhmoginov, A.; Chen, L.-C. MobileNetV2: Inverted Residuals and Linear Bottlenecks. In Proceedings of the IEEE/CVF Conference on Computer Vision and Pattern Recognition, Salt Lake City, UT, USA, 18–23 June 2018; pp. 4510–4520. [Google Scholar]
  55. Huang, G.; Liu, Z.; Van Der Maaten, L.; Weinberger, K.Q. Densely Connected Convolutional Networks. In Proceedings of the IEEE Conference on Computer Vision and Pattern Recognition (CVPR), Institute of Electrical and Electronics Engineers (IEEE), Salt Lake City, UT, USA, 21–26 July 2017; pp. 2261–2269. [Google Scholar]
  56. Cohen, J.P. COVID-19 image data collection. arXiv 2020, arXiv:2003.11597. Available online: https://github.com/ieee8023/covid-chestxray-dataset (accessed on 25 October 2020).
  57. Kermany, D.; Zhang, K.; Goldbaum, M. Labeled Optical Coherence Tomography (OCT) and Chest X-ray Images for Classification Mendeley Data. Available online: http://0-dx-doi-org.brum.beds.ac.uk/10.17632/rscbjbr9sj.2 (accessed on 3 December 2020).
  58. Ruder, S. An overview of gradient descent optimization algorithms. arXiv 2016, arXiv:1609.04747. [Google Scholar]
  59. Wilson, A.C.; Roelofs, R.; Stern, M.; Srebro, N.; Recht, B. The marginal value of adaptive gradient methods in machine learning. arXiv 2017, arXiv:1705.08292. [Google Scholar]
  60. Kingma, D.P.; Ba, J. Adam: A method for stochastic optimization. arXiv 2014, arXiv:1412.6980. [Google Scholar]
  61. Mehta, S.; Shete, D.; Lingayat, N.S.; Chouhan, V. K-means algorithm for the detection and delineation of QRS-complexes in Electrocardiogram. IRBM 2010, 31, 48–54. [Google Scholar] [CrossRef]
  62. Jolliffe, T. Principal Component Analysis; Springer: New York, NY, USA, 1986. [Google Scholar]
  63. Murtagh, F. Multilayer perceptrons for classification and regression. Neurocomputing 1991, 2, 183–197. [Google Scholar] [CrossRef]
  64. Haykin, S. Neural Networks and Learning Machines; Pearson Education: Upper Saddle River, NJ, USA, 2009. [Google Scholar]
Figure 1. The new convolutional neural network (CNN) constructed by adapting feature extracting block of any one of VGG16, ResNetV2, InceptionResNetV2, MobileNetV2, and DenseNet121 CNNs trained on the ImageNet database consisting of 1000 classes. The trainable classifier block, consisting of fully connected layers, is recreated in new CNN with initial randomized weights. After completing the supplemental learning process with chest X-rays as input, the new CNN can classify Chest X-rays into different classes.
Ai 01 00034 g001
Figure 2. The Semi-supervised K-means Detector.
Ai 01 00034 g002
Figure 3. The Simple Integrated Model.
Ai 01 00034 g003
Figure 4. The Fused Integrated Model.
Ai 01 00034 g004
Figure 5. Positive predictive value (PPV), Sensitivity, Specificity, and Accuracy bar charts for dataset1 with different pre-trained CNN models.
Ai 01 00034 g005
Figure 6. PPV, Sensitivity, Specificity, and Accuracy bar charts for dataset2 with different pre-trained CNN models. In this figure, CD, NR, and PN represent COVID, Normal, and Pneumonia, respectively.
Ai 01 00034 g006
Figure 7. PPV, Sensitivity, Specificity, and Accuracy bar charts for dataset1 with different pre-trained CNN models. Results for semi-supervised K-means detector.
Ai 01 00034 g007
Figure 8. PPV, Sensitivity, Specificity, and Accuracy bar charts for dataset2 with different pre-trained CNN models. In this figure, CD, NR, and PN represent COVID, Normal, and Pneumonia, respectively. Results for semi-supervised K-means detector.
Ai 01 00034 g008
Figure 9. PPV, Sensitivity, Specificity, and Accuracy bar charts for dataset1 with different pre-trained CNN models. Results for SIM.
Ai 01 00034 g009
Figure 10. PPV, Sensitivity, Specificity, and Accuracy bar charts for dataset2 with different pre-trained CNN models. In this figure, CD, NR, and PN represent COVID, Normal, and Pneumonia, respectively Results for SIM.
Ai 01 00034 g010
Figure 11. Clusters for feature extracted using VGG16 pre-trained CNN model. In this figure, CD, NR, and PN represent COVID, Normal, and Pneumonia, respectively.
Ai 01 00034 g011
Figure 12. Clusters for feature extracted using ResNetV2 pre-trained CNN model. In this figure, CD, NR, and PN represent COVID, Normal, and Pneumonia, respectively.
Ai 01 00034 g012
Figure 13. Clusters for feature extracted using InceptionResNetV2 pre-trained CNN model. In this figure, CD, NR, and PN represent COVID, Normal, and Pneumonia, respectively.
Ai 01 00034 g013
Figure 14. Clusters for feature extracted using DenseNet121 pre-trained CNN model. In this figure, CD, NR, and PN represent COVID, Normal, and Pneumonia, respectively.
Ai 01 00034 g014
Figure 15. Clusters for feature extracted using MobileNetV2 pre-trained CNN model. In this figure, CD, NR, and PN represent COVID, Normal, and Pneumonia, respectively.
Ai 01 00034 g015
Figure 16. PPV, Sensitivity, Specificity, and Accuracy bar charts for dataset2 for a fused, integrated model (FIM). In this figure, CD, NR, and PN represent COVID, Normal, and Pneumonia.
Ai 01 00034 g016
Table 1. ILSVRC Image Classification Results.
ModelTop-1 val. Error (%)Top-5 val. Error (%)Reference
MobileNetV225.3-[54]
VGG1625.68.1[49]
ResNet50V223.9-[50]
InceptionResNetV219.94.9[53]
DenseNet121 23.616.66[55]
Table 2. Dataset details.
Images/DatasetCOVIDNormalPneumonia
Dataset1142300-
Dataset2142300300
Table 3. Confusion Matrix for Dataset1.
Actual Predicted
COVID-19Normal
COVID-19True Positive Values (TP)False Negative Values (FN)
NORMALFalse Positive Values (FP)True Negative Values (TN)
True positive if COVID-19 detected as COVID-19, False Negative if COVID-19 detected as Normal, False positive if Normal detected as COVID-19 and True Negative if Normal detected as Normal.
Table 4. Confusion Matrix for Dataset2
Actual Predicted
CD-19 (A)NR (B)PN (C)
CD-19TPAFABFAC
NRFBATPBFBC
PNFCAFCBTPC
TPA = number of COVID-19(A) cases detected as COVID-19(A), FAB = number of COVID-19 (A) cases identified as Normal (B), and so on.CD-19, NR and PN are COVID-19, Normal, and Pneumonia.
Table 5. Comparison of Accuracy for different modeling studies
StudyTypeModelAccuracy
Ioannis et al. [36]Chest X-rayVGG19 (3-Class)
VGG19 (2-Class)
93.48
98.75
Sethy and Behera [42]Chest X-rayResNet +SVM
(3-Class)

95.38
Hemdan et al [35]Chest X-rayCOVIDX-Net
(2-Class)

90
Narin et al. [37]Chest X-rayDeep CNN ResNet- 50
(2-Class)

98
Afshar et al. [27]Chest X-rayCOVID-CAPS
(3-Class)

95.7
Eduardo et al. [39]Chest X-rayEfficient Net
(3-Class)

91.4
Tulin et al. [38]Chest X-rayDarknet
(3-Class)
(2-Class)

87.02
98.08
Proposed:
Chest X-rayShallow Tuning
VGG (3-Class)
VGG (2-Class)

87
98
Chest X-raySIM
DenseNet (3-Class)
DenseNet (2-Class)

85
99
Chest X-rayFIM
DenseNet+ResNet
(3-Class)

94
Chest X-rayK-Means
DenseNet (3-Class)
DenseNet (2-Class)

91
99
Publisher’s Note: MDPI stays neutral with regard to jurisdictional claims in published maps and institutional affiliations.

