Article

A Combination of Multilayer Perceptron, Radial Basis Function Artificial Neural Networks and Machine Learning Image Segmentation for the Dimension Reduction and the Prognosis Assessment of Diffuse Large B-Cell Lymphoma

1
Department of Pathology, School of Medicine, Tokai University, 143 Shimokasuya, Isehara 259-1193, Japan
2
Department of Clinical Sciences, College of Medicine, University of Sharjah, P.O. Box 27272 Sharjah, United Arab Emirates
3
Division of Surgery and Interventional Science, University College London, Gower Street, London WC1E-6BT, UK
*
Authors to whom correspondence should be addressed.
Submission received: 20 October 2020 / Revised: 17 January 2021 / Accepted: 22 February 2021 / Published: 8 March 2021
(This article belongs to the Special Issue Frontiers in Artificial Intelligence)

Abstract

:
The prognosis of diffuse large B-cell lymphoma (DLBCL) is heterogeneous. Therefore, we aimed to highlight predictive biomarkers. First, artificial intelligence was applied into a discovery series of gene expression of 414 patients (GSE10846). A dimension reduction algorithm aimed to correlate with the overall survival and other clinicopathological variables; and included a combination of Multilayer Perceptron (MLP) and Radial Basis Function (RBF) artificial neural networks, gene-set enrichment analysis (GSEA), Cox regression and other machine learning and predictive analytics modeling [C5.0 algorithm, logistic regression, Bayesian Network, discriminant analysis, random trees, tree-AS, Chi-squared Automatic Interaction Detection CHAID tree, Quest, classification and regression (C&R) tree and neural net)]. From an initial 54,613 gene-probes, a set of 488 genes and a final set of 16 genes were defined. Secondly, two identified markers of the immune checkpoint, PD-L1 (CD274) and IKAROS (IKZF4), were validated in an independent series from Tokai University, and the immunohistochemical expression was quantified, using a machine-learning-based Weka segmentation. High PD-L1 associated with poor overall and progression-free survival, non-GCB phenotype, Epstein–Barr virus infection (EBER+), high RGS1 expression and several clinicopathological variables, such as high IPI and absence of clinical response. Conversely, high expression of IKAROS was associated with a good overall and progression-free survival, GCB phenotype and a positive clinical response to treatment. Finally, the set of 16 genes (PAF1, USP28, SORT1, MAP7D3, FITM2, CENPO, PRCC, ALDH6A1, CSNK2A1, TOR1AIP1, NUP98, UBE2H, UBXN7, SLC44A2, NR2C2AP and LETM1), in combination with PD-L1, IKAROS, BCL2, MYC, CD163 and TNFAIP8, predicted the survival outcome of DLBCL with an overall accuracy of 82.1%. In conclusion, building predictive models of DLBCL is a feasible analytical strategy.

1. Introduction

Diffuse large B-cell lymphoma (DLBCL) is the most common histologic subtype of non-Hodgkin lymphoma (NHL). DLBCL accounts for approximately 25 percent of adult NHL cases. It is increasingly appreciated that the diagnostic category of “DLBCL” is quite heterogeneous in terms of morphology, genetics and biologic behavior. DLBCL is curable in approximately half of cases with current therapy, particularly in those who achieve a complete remission with first-line treatment. The molecular pathogenesis of DLBCL is a complex, multistep process that ultimately results in the transformation and expansion of a malignant B-cell clone. This neoplastic B-cell is of germinal or post-germinal B cell-of-origin. Two molecular subtypes are identified according to the gene expression: the “germinal center B-cell-like” (GCB) and the “activated B-cell-like” (ABC), including a third subtype that is “unclassified”. Based on the immunohistochemistry of CD10, BCL6 and MUM1 (IRF4), the Hans classifier also stratifies the samples into GCB and non-GCB (ABC). Despite that some of the molecular mechanisms have been elucidated, most of the pathogenesis remains unknown [1,2,3,4,5]. Therefore, new approaches in analysis may help to clarify the remaining unknown pathogenic factors.
Deep learning (also known as deep structured learning or differential programming) is part of a broader family of machine learning methods based on artificial neural networks with representation learning; the learning can be supervised, semi-supervised or unsupervised [6,7,8,9]. Artificial neural networks are a set of algorithms, modeled loosely after the human brain, that are designed to recognize patterns. They interpret sensory data through a kind of machine perception, labeling or clustering of the raw input data/information. The patterns that artificial neural networks recognize are numerical, contained in vectors, into which all real-world data (be it images, sound, text or time series) must be translated [10]. In this project, we have used the Trainable Weka Segmentation method to quantify the raw colors of the immunohistochemical protein expression of markers that are present in the DLBCL tissue. The Trainable Weka Segmentation is a plugin and library that combines a collection of machine learning algorithms with a set of selected image features to produce pixel-based segmentations.
Artificial neural networks allow to cluster and to classify, they can group unlabeled data according to similarities among the example inputs, and they classify data when they have a labeled dataset to train on [10]. With classification, the predictive analytics can be performed by correlations between present and future events. For example, a correlation between the gene or protein expressions levels of DLBCL samples and future events such as the patients’ outcome (alive or dead) or other clinicopathological characteristics including the International Prognostic Index (IPI).
Artificial neural networks are the preferred tool for many predictive data-mining applications, because of their power, flexibility and ease of use [11]. Artificial neural networks used in predictive applications, such as the Multilayer Perceptron (MLP) and the Radial Basis Function (RBF) networks, are supervised in the sense that the model-predicted results can be compared against known values of the target variables [11]. Both MLP and RBF have a structure known as a “feedforward architecture” because the connections in the network flow forward from the input layer to the output layer without any feedback loops. The architecture composition is the following: (1) an input layer that contains the predictors; (2) a hidden layer with unobservable nodes, or units; and (3) the output layer that contains the responses. The value of each hidden unit is some function of the predictors. The exact form of the function depends, in part, upon the network type and in part upon user-controllable specifications. The choice of procedure, MLP or RBF, is influenced by the type of data and the level of complexity to uncover. While the MLP procedure can find more complex relationships, the RBF procedure is generally faster [11].
We have recently described the use of MLP for the analysis of gene expression of DLBCL, using a series of 100 cases [12,13]. This continuation project was characterized by (1) the series of cases expanded up to 414 cases (four times larger), (2) the artificial neural network analysis included the comparison and integration of both MLP and RBF methods, and (3) the aim to predict several clinicopathological characteristics, in addition to the overall survival. Finally, after the integration of the results we validated two of the most relevant markers by immunohistochemistry in another series of 113 cases from Tokai University Hospital. The digital quantification of the validation marker was also performed by using machine learning and the Waikato Environment for Knowledge Analysis (Weka).

2. Materials and Methods

2.1. Study Subjects

The subjects of the study for the artificial neural network of gene expression data were obtained from a well-known and robust series of DLBCL from Caucasian subjects (Table 1). This series belongs to the Lymphoma/Leukemia Molecular Profiling Project (LLMPP) and the patients are from several institutions in Europe and USA. This series is publicly available from the NCBI GEO datasets as GSE10846 and comprises 414 cases [14]. The sample data are from an Affymetrix Human Genome U133 Plus 2.0 Array and the processing used the MAS 5.0 Data Processing Protocol. The data were analyzed with the Microarray Suite version 5.0 (MAS 5.0), using the Affymetrix default analysis settings and global scaling as normalization method. The trimmed mean target intensity of each array was arbitrarily set to 500. The post-normalized data were log-2 scaled. For the MLP and RBF analysis on this discovery set all the 414 cases were selected. The clinicopathological characteristics of the discovery series is shown in the Table 1. In summary, the age ranged from 14 to 92 years old, with a median of 62.5 years, and 226 were men (54.6%). According to the cell-of-origin (COO) molecular classification of DLBCL based on the gene expression [1,2,3,4,5], 44.2% of the cases were of germinal center B-cell subtype (GCB), 40.3% of activated B-cell subtype (ABC) and 15.5% of unclassified. Fifty-six percent of the cases had received rituximab, cyclophosphamide, doxorubicin hydrochloride, vincristine sulfate, and prednisone (RCHOP)-like therapy. As expected in a conventional series of DLBCL, several variables correlated with the overall survival of the patients. Patients that had an unfavorable prognosis associated with several clinical variables including age > 60 years, high LDH, Eastern Cooperative Oncology Group (ECOG) Performance Status ≥ 2, clinical stage III/IV, extranodal sites >1, higher National Comprehensive Cancer Network International Prognostic Index (NCCN IPI) score and an activated B-cell (ABC) molecular subtype. The alive/dead ratio of this series was 1.51. The clinicopathological characteristics of this series is in concordance with a standard series of DLBCL.
The validation set consisted of 113 cases of DLBCL from Tokai University Hospital. This validation set was used for the immunohistochemical quantification of the protein expression of two of the most relevant genes, previously identified in the artificial neural network analysis and later confirmed by Cox analysis. One of the markers was associated to a poor and the other to a good prognosis of the patients. The clinicopathological characteristics of the validation set is shown in the Table 2. In summary, the age ranged from 14 to 97 years old, with a median of 67 years, and 64 were men (55.8%). According to the cell-of-origin classification, using the Hans classifier, 33.6% were GCB and 66.4% non-GCB. The Hans classifier uses three markers that can be tested by immunohistochemistry (CD10, BCL-6 and MUM-1), and the cases can be assigned to either of two groups, using a new nomenclature: GC-group and non-GC group. Ninety-five percent of the cases had received RCHOP or RCHOP-like therapy. Patients that had an unfavorable prognosis associated with age > 60 years, high LDH, high sIL2RA, ECOG Performance status ≥ 2, clinical stage III/IV, extranodal sites > 1, higher IPI score, a non-GCB cell-of-origin subtype and positivity for Epstein–Barr virus (EBER+). The alive/dead ratio was 0.82. The clinicopathological characteristics of this series from Tokai University are also in concordance with a standard series of DLBCL.
No cases of primary mediastinal B-cell lymphoma (PMBL) were included in this research.
This study was conducted in compliance with the Helsinki Declaration, and the project was approved by the Institutional Review Board (IRB14R-080).

2.2. Statistical Analysis

Statistical analyses were performed by using R programming language version 3.6.3 (2020-02-29) and RStudio (version 1.3.959) [15], and with IBM SPSS (Statistics version 26 and Modeler version 18.0; IBM, New York, United States), following the manufacturers’ instructions. Comparisons of means was performed with independent-samples T-Test or with non-parametric two-independent-samples test (Mann–Whitney U test) when required. The criteria for overall survival was based on the time calculated from the date of diagnosis to the date of death or last follow-up. The survival analysis was performed, using Kaplan–Meier (with Log rank, Breslow and Tarone–Ware tests) and Cox regression, method (Enter), contrast (Indicator) and reference category (First). Multivariate Cox regression was also performed with the backward conditional method. Hazard Ratios/Risks (HRs) were calculated with Cox regression. The odds ratios (ORs) were determined with binary logistic regression. The significance level was set up at a priori with a p-value < 0.05. R programming language software, instructions and methods can be found at http://cran.r-project.org (accessed on 4 March 2021). Instructions for RStudio are found at https://rstudio.com/ and for SPSS at https://www.ibm.com/jp-ja/analytics/spss-statistics-software (accessed on 4 March 2021).

2.3. Artificial Neural Network Analysis of Gene Expression Data

MLP and RBF analysis on the discovery series was performed, using similar strategy as previously described [12,13]. The desktop workstation had a Ryzen 7 3700X CPU and 16 GB of RAM.
For MLP analysis, the setup included a series of items. The dependent variable (i.e., the nominal variable that we want to predict) was the outcome of the overall survival as well as several other clinicopathological features including the cell-of-origin classification, the National Comprehensive Cancer Network International Prognostic Index (NCCN-IPI), stage, extranodal disease, etc. (Figure 1). The predictor variables were the genes that were specified as covariates (scale). The rescaling of the covariates was standardized. Partition dataset: The cases were randomly assigned based on the relative number of cases.
The partitions were the training (relative number = 7, 70%), the test (3, 30%), the holdout (0, 0%). The architecture can be automatically selected, with a minimum number of units in the hidden layer from 1 to 50 or can be a custom architecture. A custom architecture includes a setup for the hidden layers and the output layer. In the hidden-layers section, the following options can be arranged: (1) number of hidden layers (one, two), (2) activation function (hyperbolic tangent, sigmoid) and (3) number of units (automatically compute or custom for hidden layer 1 and 2). In the output layer section, the options are: (1) activation function (identity, softmax, hyperbolic tangent and sigmoid), (2) rescaling of scale dependent variables (standardized, normalized (correction 0.02 or another value), adjusted normalized (0.002 or another value) or none). Of note, the activation function chosen for the output layer determines which rescaling methods are available. The training can be of batch, online or mini-batch type. The optimization algorithm can be scaled conjugant gradient or gradient descent. The training options were initial lambda (0.0000005), initial sigma (0.00005), interval center (0) and interval offset (+/-0.5).
The output includes a network structure (description, diagram and synaptic weights) and the network performance (model summary, classification results, ROC curve, cumulative gains chart, lift chart, predicted by observed chart and residual by predicted chart). In addition, the cases processing summary and the independent variable importance analysis is also performed. The synaptic weight estimates were exported to a XML file. As options, the user-missing values were excluded. The stopping rules had a 0.0001 minimum relative change in the training error and 0.001 minimum relative change in the training error ratio.
For the RBF setup, the architecture can have several units that can be automatically computed or specified. The activation function for the hidden layer can be normalized or ordinary Radial Basis Function and the overlap among hidden units can be automatically computed or specified. Receiver Operating Characteristic (ROC) curve displays a curve for each categorical dependent variable. It also displays a table giving the area under each curve. For a given dependent variable, the ROC chart displays one curve for each category. Independent variable importance analysis performs a sensitivity analysis, which computes the importance of each predictor in determining the artificial neural network. The analysis is based on the combined training and testing samples or only on the training sample if there is no testing sample. This creates a table and a chart displaying importance and normalized importance for each predictor.
In this study, the analysis method included several individual MLP and RBF analysis (Figure 1). Each individual artificial neural network analysis included the gene-expression data of 414 cases (GSE10846, Affymetrix U133 Plus 2.0 Array, 54,613 gene-probes), which were correlated with a single target (dependent) variable. The target variables were the following: survival outcome (dead or alive), outcome only in the RCHOP-like subgroup, outcome only in the CHOP-like subgroup, cell-of-origin (GCB vs. ABC, the unclassified was excluded), age (≤60 vs. >60), LDH ratio (≤1 vs. >1), LDH ratio (≤3 vs. >3), ECOG PS (<2 vs. ≥2), stage (I/II vs. III/IV), extranodal disease (≤1 vs. >1), gender (male vs. female), NCCN-IPI (low + low-intermediate vs. high-intermediate + high), multi-dependent variable and survival extremes (dead < 1.5 years vs. alive > 7 years). In total, 28 AI individual analyses were performed. Each AI analysis provided an output in which the 54,613 gene probes were ranked according to their importance for prediction of the target variable. Then, the normalized importance values were processed as follows: (1) The gene probes with a normalized importance ≥70% in each target variable (with exclusion of gender) were selected and merged in a new database. (2) The normalized importance of each gene probe was averaged for all the predictive variables (with exclusion of gender) and the averaged values ranked from most to least important. Therefore, the results comprised 4 lists, top 1% of the averaged normalized importance for MLP and RBF analyses and the merged ≥70% normalized importance for MLP and RBF. Then, the gene-probes were merged and the duplicated were deleted.
The relevance of each identified gene-probe was tested in the series, using univariate and multivariate Cox regression analyses [12,13], with a second round of MLP and RBF, gene-set enrichment analysis (GSEA), and finally with an overall survival modeling and screening based on the overall accuracy for prediction of the overall survival outcome variable. This modeling included the following model types: C5.0 algorithm, logistic regression, Bayesian Network, discriminant analysis, linear support vector machine (LSVM), random trees, tree-AS, Chi-squared automatic interaction detection (CHAID) tree, Quick, unbiased, efficient statistical (QUEST) tree, classification and regression (C&R) tree and neural network. The GSEA was performed as described earlier by Carreras et al. [12], Hamoudi et al. [16] and Subramanian et al. [17]. In Figure 1, the details of the analysis’s algorithm are shown.

2.4. Immunohistochemistry

Immunohistochemistry was performed in a Bond-Max Fully automated immunohistochemistry (IHC) and in situ hybridization (ISH) equipment following the manufacturer’s instructions (Leica K.K., Tokyo, Japan) and using the DAB-based BOND Polymer Refine Detection kit (#DS9800). In summary, the immunohistochemical protocol follows the next steps: bake, dewax, rehydrate, antigen retrieval, block endogenous peroxidase, primary antibody, detection of bond antibody (post-primary antibody and polymer), color development with 3’-Diaminobenzidine (DAB), counterstain with hematoxylin and mounting. Each step is followed by washes (standard Bond wash). Mounting was performed, using a Leica CV5030 Fully Automated Glass Coverslipper.
For the cell-of-origin classification with the Hans classifier, the following antibodies were used: CD10 antigen (1:100, Clone 56C6, Novocastra, Leica K.K., Tokyo, Japan), BCL-6 oncoprotein (1:100, LN22, Novocastra) and Multiple Myeloma Oncogene 1 (MUM-1, also known as IRF4) (1:100, EAU32, Novocastra) can we put the dilutions used for each Ab. Epstein–Barr virus (EBV) infection status was assessed by in situ hybridization of EBV-encoded mRNA (EBER, #BP0589, #AR0833, Novocastra). Validation of the prognostic markers from artificial neural network analysis was made targeting PD-L1 (Extracellular Domain Specific) (1:100, enhancer A Toyobo, retrieval in pressure cooker, E1J2J, Cell Signaling Technology K.K., Tokyo, Japan) and IKAROS (1:100, D6N9Y, CST). The antigen retrieval solution was EDTA-based (Leica BOND epitope retrieval solution 2 for 20 min for all antibodies, with exception of CD10 that was for 30 min).

2.5. Conventional and Machine-Learning-Based Digital Image Analysis

Slides were visualized in an optical microscope (Olympus BX63, Olympus K.K., Tokyo, Japan) and later digitalized, using a digital slide scanner (NanoZoomer S360, Hamamatsu Photonics, Hamamatsu City, Japan). Both conventional and machine-learning-based digital-image analysis were performed, using Fiji software. Fiji is an image processing package based on ImageJ, that contains scientific image analysis functions. Fiji is an open-source project hosted on GitHub (https://github.com/fiji) (accessed on 4 March 2021) maintained by the Eliceiri/LOCI group at the University of Wisconsin-Madison and the Jug and Tomancak labs at the MPI-CBG in Dresden (https://fiji.sc/) (accessed on 4 March 2021). For conventional analysis, the image processing was carried out on the RGB stack and the positive/negative pixel identification made use of the threshold function. This RGB method is the gold standard method and depends on the pathologist direct supervision to define the positive and negative areas (pixels). Percentage quantification was calculated in excel, using the following formula:
Percentage of positive cells = Area of positive pixels ÷ by the total area (i.e., positive + negative pixels) × 100.
The machine-learning-based image analysis quantified the marker based on the Waikato Environment for Knowledge Analysis (Weka), developed at the University of Waikato, New Zealand, version 3.2.24. The Weka can be downloaded from GitHub (https://github.com/fiji/Trainable_Segmentation) (accessed on 4 March 2021). The raw immunohistochemical image was loaded into the analysis software and directly analyzed without type change. For the training input, three types of pixels were selected: Class 1 (positive staining, DAB), Class 2 (negative areas) and Class 3 (absence of cellularity). Around 30 different areas for each color class in 6 characteristic cases were trained to set up the classifier properties, which was later used to create a result. Then, the same classifier was automatically applied to the rest of the cases. Of note, in 13 cases of PD-L1 staining the classifier made a result that was discordant with the conventional RGB-based method and the ordinal evaluation by the pathologist (Joaquim Carreras). These 13 cases were re-evaluated, using a new trained classifier that was more sensitive for a lower and diffuse expression of the PD-L1 marker. The segmentation settings included as training features the Gaussian blur, Hessian, membrane projections, Sobel filter and difference of Gaussians. The membrane thickness was set at value 1, membrane patch size at 19, minimum sigma at 1.0 and maximum sigma at 16.0. The training of the classifier included fast random forest. The classifying of the whole image used all available CPU threads. Classifying a characteristic whole image datum took from 80,113 to 89,663 milliseconds. Finally, the segmentation of the whole image was performed, and each class area was inked with a different color and quantified.

3. Results

3.1. Artificial Neural Network Analysis of Gene Expression Data

The core of the analysis comprises 28 artificial-neural-network-based analyses (14 MLP and 14 RBF) that were run independently (Figure 1). The aim was to identify which gene-probes among the 54,613 input probes had a higher importance for prediction of the 14 target variables. The target variables included the survival outcome (dead or alive) but also other relevant clinicopathological variables such as the IPI and cell-of-origin as germinal centre B-cell (GCB) vs. activated B-cell–like (ABC) that also are relevant for the prognosis of the DLBCL patients. The genes above 70% of normalized importance for each variable were selected and pooled with the top 1% averaged normalized important as shown in the Figure 1. After deleting the duplicates, the resulting set comprised 1202 gene-probes, which equals to a 45 times reduction.
The results are shown in the Table 3, Table 4 and Table 5 and Figure 2. The two artificial neural network methodologies of MLP and RBF used distinct activation and error functions. Both methods had comparable overall performances, with similar training set percentages of cases (≈70% of the total series), testing set cases of percentages (≈30%), percentages of incorrect predictions in the training and testing sets (≈30%), and overall percentages of correct classifications in the training and testing sets (≈70%). Nevertheless, they differed in the number of units in the hidden layers (nine in MLP and six in RBF), in the training time (≈7 min for MLP and ≈114 min for RBF) and in the ROC area under the curve (0.7 in MLP and 0.6 in RBF). Of note, the classification model’s performance differed according the target variable. For instance, in MLP, the artificial neural network ability to predict the binary target variable was higher in the variables “Extranodal disease” (Area under the curve of 0.88), “Alive < 1.5 years vs. Alive => 7 years” (AUC of 0.84), “cell of origin” (0.80), “Outcome Dead CHOP-like only” (0.76), “LDH ratio >3” (0.75), “ECOG ≥ 2” (0.73) and “Outcome Dead” (0.70).
The number of genes with a normalized importance >70% for each individual artificial neural network analysis of MLP ranged from 1 to 132, with an average of 34 and a median of 12. In case of RBF ranged from 3 to 84 with an average of 34 and a median of 24. After integration with the top 1% of normalized importance set and once the duplicates were deleted, the final set comprised 1202 gene-sets. In order to identify the most relevant ones we performed a univariate Cox regression analysis and only the probes with significant correlation for overall survival were selected (n = 448). The most relevant genes based on their p-value and Hazard Risk are shown in Table 6, Table 7 and Table 8.
In general, MLP was more “efficient” than RBF. In comparison to the RBF artificial neural network, the MLP characterized by a significantly lower training time and better areas under the curve. In addition, although not statistically significant, MLP also had a lower percentage of incorrect predictions and higher overall percent correct.
The set of 448 genes was subjected to GSEA analysis in order to confirm the association to the prognosis outcome (dead vs. alive phenotype), using the same series of cases (Figure 3). Within the core enrichment 233 genes were found. The top five genes were DMBT1, OR14J1, OCRL, DEFA1 and ELFN1-AS1. Within the core enrichment an important marker of the tumoral immune response with known potential relevance for the pathogenesis of DLBCL was highlighted, the Programmed Cell Death 1 Ligand 1 (PD-L1, CD274). Of note, PD-L1 can be targeted by immune checkpoint inhibitors. In the previous univariate Cox regression analysis, PD-L1 was associated to a bad overall survival of the patients, with a Hazard Risk of 1.178 (95%CI 1.023–1.356, p = 0.023). Outside the core enrichment, and towards the good prognosis phenotype we identified IKAROS. IKAROS also belongs to the immune checkpoint pathway, with a Hazard Risk of 0.488 (95%CI: 0.376–0.633, p = 7.3 × 10⁻⁸). Due to the biological importance of both PD-L1 and IKAROS for the pathogenesis of DLBCL, these two markers were selected for validation in an independent series of DLBCL patients from Tokai University Hospital, the protein expression was evaluated by immunohistochemistry and AI-based image segmentation and digital quantification was performed.
The set of 448 genes was also analyzed by a functional network association analysis; the results are shown in the Figure 4.
In order to highlight the most relevant markers and to reduce the number of genes within the set of 448, a second round of artificial neural network analysis was performed, including MLP and RBF, as shown in Figure 1. As a result, the set was reduced to 16 genes: PAF1, USP28, SORT1, MAP7D3, FITM2, CENPO, PRCC, ALDH6A1, CSNK2A1, TOR1AIP1, NUP98, UBE2H, UBXN7, SLC44A2, NR2C2AP and LETM1 (Table 9).
A multivariate Cox regression for overall survival analysis, using the backward conditional, was applied to the set of 16 genes and the final step included only six genes (Table 10). In Figure 5, the relevance of these six genes for the overall survival of the patients is shown. A cutoff that stratified the patients according to the gene expression of each marker (70% vs. 30% approximately). In Figure 6, the correlation with known genes that are relevant for the pathogenesis of DLBCL is shown. The genes BCL2 and MYC are relevant for the pathogenesis of the tumoral B-lymphocytes of DLBCL (anti-apoptosis and cell cycle), CD163 is a marker of M2-like tumor associates macrophages (TAMs) and TNFAIP8 is an apoptosis inhibitor expressed by the B-lymphocytes of DLBCL as well as for the TAMs. The biological functions of the set of 16 genes is shown in the Table 11.
Prognostic modeling for overall survival outcome (dead vs. alive) was also applied to the set of 16 genes, and the tests with an overall accuracy above 70% were selected (Figure 7, Figure 8 and Figure 9): classification and regression tree (C&R tree) (overall accuracy of 74.39%), C5 decision tree (72.46) and Bayesian Network (72.38).

3.2. Machine-Learning-Based Quantification of the Immunohistochemical Expression and Correlation with the Clinicopathological Characteristics of the Patients

The results of this section are shown in Figure 10 and Figure 11 and Table 12 and Table 13.
Two markers were selected from the gene expression analysis for validation in an independent lymphoma series of DLBCL from Tokai University Hospital. PD-L1 and IKAROS were immuno-stained. After image digitization, the protein expression was quantified by using a machine-learning-trainable segmentation method.
The protein expression of PD-L1 ranged from 0.01% to 92.5%, with a median of 16.9% and a mean of 25.0% ± 24.0 STD. The PD-L1 staining was also quantified by using a conventional RBG approach. Both quantifications had a good correlation (Pearson Correlation 0.853, p = 4.6 × 10⁻³³) (Figure 11). The PD-L1 values from the AI Weka segmentation were ranked and the most significant cutoff point for overall survival was calculated (31%). The patients with a high PD-L1 expression had an 86% more risk of dying than the patients with low expression (Hazard Risk = 1.86, 95%CI 1.05–3.31). The five-years overall survival of the patients, high vs. low PD-L1, was 40% (95%CI 58–23%) vs. 67% (95%CI 77–56%) (p = 0.031), respectively. PD-L1 expression was also correlated with several clinicopathological characteristics. High PD-L1 expression correlated with a non-GCB phenotype, Epstein–Barr virus infection (EBER+), high RGS1 expression, high sIL2RA, clinical stage III/IV, presence of B symptoms and high to high-intermediate IPI. High PD-L1 also associated to a worse progression free survival (p = 0.054, “trend of association”) (Table 12; Figure 10 and Figure 11)
The protein expression of IKAROS ranged from 0.53% to 44.1%, with a median of 18.9% and a mean of 18.0% ± 12.5. The cutoff for overall survival was 28.85%. High IKAROS expression associated with favorable prognosis. The five-years overall survival, high vs. low, 82% (95%CI 98–66%) vs. 55% (95%CI 67–43%), respectively (p = 0.034, Breslow). The correlation with the clinicopathological characteristics of the patients showed that high IKAROS associated with a GCB phenotype and with a positive clinical response to treatment. High IKAROS also correlated with a favorable progression free survival (p = 0.003) (Table 13, Figure 10).
Finally, no correlation was found between the expression of PD-L1 and IKAROS.

3.3. Integration of the Data with Known Prognostic Biomarkers for the Assessment of the Overall Survival of the Patients with Diffuse Large B-Cell Lymphoma, Using Machine-Learning Analysis

Finally, the set of 16 genes, PD-L1 (CD274) and IKAROS were merged with biomarkers known to play a role in the pathogenesis and prognosis of the patients with DLBCL, including BCL2, MYC, CD163 and TNFAIP8 [13]. Machine learning analysis was applied testing 11 models including C5, logistic regression, Bayesian Network, discriminant, LSVM, random trees, tree-AS, CHAID, Quest, C&R tree and neural net. After analysis, the models were ranked according to their overall accuracy (%) for prediction of the overall survival. The best models were C5 (82.126%), CHAID (81.401%) and Bayesian Network (79.286%). The result of the Bayesian Network and C5 decision tree are shown in Figure 12 and Figure 13.

4. Discussion

Diffuse large B-cell lymphoma is the most common subtype of non-Hodgkin lymphoma (NHL), accounting for approximately 25 percent of NHL cases. The diagnostic category of DLBCL is morphologically, genetically and biologically heterogeneous [1,2,3,4,5].
The molecular genetics of DLBCL have focused on the study of the cell-of-origin, which is based on the gene expression profiling (GEP). GEP is the gold standard for determining the cell-of-origin but this technique requires the use of RNA and frozen tissue. Therefore, alternative methods based on immunohistochemistry have been developed, such as the Hans classifier. The Hans classifier has a good correlation with the GEP. This classifier is an algorithm based on three markers: CD10, BCL-6 and MUM-1 (IRF4) [1,2,3,4,5]. Nowadays it is possible to perform GEP from paraffin-embedded formalin-fixed using the Lymph2Cx platform, which provides comparable results to the gold standard technique that is based on fresh frozen tissue [18]. In addition to the cell-of-origin analysis, the GEP has also identified different DLBCL subgroups that have distinct genetic profiles. These subtypes have been shown to influence the tumor biology and improve the prediction value of the gene-expression-based survival analysis [19]. A correlation between copy-number changes and GEP was performed and putative target genes were identified, such as REL and XPO1 (2p14-p16); PDCD10 and TNFSF10 (3q); PPHLN1, SENP1 and MCRS1; (12q) and MADH2, MALT1 and BCL2 (18q) [19]. The gene expression has also managed to characterize the tumoral immune microenvironment and has also enabled the prediction of patients’ survival [20]. Recently, the gene expression analysis has also focused on specific subtypes such as the IRF4-rearranged DLBCL [21].
In this study, we have used as a discovery set the well-recognized series of GEP of DLBCL, the GSE10846 that is comprised of 414 cases. This series is relevant not only because it is has a lot of cases but also because it has served to develop the current cell-of-origin classification. In this research we have also used a validation set of 113 cases from Tokai University Hospital and for the cell-of-origin classification we have used the Hans algorithm. This algorithm is still valid in the modern rituximab-based therapy era [22]. In this research, we had the following aims: (1) to reanalyze the gene-expression data of GSE10846, using artificial intelligence (AI), based on artificial neural networks, in order to identify biomarkers; (2) to compare the efficiency between two techniques, the Multilayer Perceptron (MLP) and Radial Basis Function (RBF) networks, and to integrate the results; and (3) to validate the AI results in another series, using immunohistochemistry, by quantifying the protein expression by also using the AI-based Weka segmentation.
Artificial neural networks are the preferred tool for many predictive data-mining applications because of their power, flexibility and ease of use. Predictive artificial neural networks are particularly useful in applications where the underlying process is complex. We used both the MLP and RBF procedures. Both are supervised learning techniques as they map relationships implied by the data. Both use feedforward architectures, as the data move in only one direction, from the input nodes through the hidden layer of nodes to the output nodes. While MLP procedure can find more complex relationships, the RBF procedure is generally faster [23]. In this research we found that the performance comparison between MLP and RBF was similar in most of the parameters. Both methods managed to reduce a list of 54,613 gene-probes to a final set of 24 and 33, respectively, which accounts for more than a 99.9% reduction. Nevertheless, they differed in the activation and error functions, the number of units in the hidden layer, the training time and in the areas under the curve of the ROC analysis. In summary, we found that MLP has an overall better performance with shorter training time and a better predictive power, that is better areas under the curves. Therefore, MLP may be more appropriate for the analysis of this type of data. Both techniques managed to identify prognostically relevant markers, most of them not previously highlighted in the literature. Interestingly, a 30% of the identified genes were common between both techniques. On the other hand, a 70% of the final sets had different genes. All of them are potentially relevant and should be explored with more detail in future research. In this research we used the gene-probes without collapsing as the start input for the artificial neural network analyses. Nevertheless, a more robust and reproducible approach would include the dataset collapsing, which could include the max, median, mean or sum of probes values.
From the final set of genes, we selected two biomarkers for validation by immunohistochemistry in another cohort from Tokai University. The two biomarkers are CD274 (PD-L1) for the set of bad prognosis; and IKZF4 (IKAROS) for the good prognosis set.
Programmed cell death 1 ligand 1 (PD-L1, CD274) plays a critical role in induction and maintenance of the immune tolerance to self [24]. As a ligand for the inhibitory receptor PDCD1/PD-1, modulates the activation threshold of T-cells and limits T-cell effector response [24]. Through a yet unknown activating receptor, PD-L1 may costimulate T-cell subsets that predominantly produce interleukin-10 (IL10) [25,26,27]. The PDCD1 (PD-1)-mediated inhibitory pathway is exploited by tumors to attenuate antitumor immunity and escape destruction by the immune system, thereby facilitating tumor survival [28,29]. The interaction with PD-1 inhibits cytotoxic T lymphocytes (CTLs) effector function [28]. The blockage of the PD-1-mediated pathway results in the reversal of the exhausted T-cell phenotype and the normalization of the antitumor response, providing a rationale for cancer immunotherapy [27,28]. Our data showed that a high expression of PD-L1 in DLBCL is associated to an unfavorable overall survival and progression-free survival of the patients. In addition, high PD-L1 levels also correlated with several unfavorable clinicopathological features such as a non-GCB cell-of-origin subtype (Hans’s classifier), Epstein–Barr virus positivity, high RGS1 expression and IPI high/high-intermediate. Of note, our findings are in concordance with previous literature [29,30].
DNA-binding protein Ikaros (IKAROS, IKZF1) is a transcription regulator of hematopoietic cell differentiation. IKAROS binds gamma-satellite DNA and plays a role in the development of lymphocytes, B-cells and T-cells. IKAROS regulates transcription through association with both HDAC-dependent and HDAC-independent complexes and in adult erythroid cells increases normal apoptosis [27,31,32,33]. IKAROS has multiple functions in hematological malignancies (leukemia), solid tumors (lung, ovarian and colorectal cancer) and autoimmune diseases (systemic lupus erythematosus and Sjogren’s syndrome) [34]. In solid cancers, high IKAROS has been associated with poor prognosis [34]. In our series of DLBCL, we have found that high IKAROS protein expression associated to a good prognosis of the patients, with a favorable overall survival and progression-free survival. In addition, high IKAROS also associated to a GCB cell of origin subtype and good clinical response to treatment.
In conclusion, artificial neural network analysis can be a useful computational tool to identify prognostic markers from gene-expression data and to quantify immunohistochemical biomarkers in the tumor samples; thus, it provides a complete tool to identify and validate diagnostic and prognostic disease-specific biomarkers. This study found that MLP is slightly more “efficient” than RBF artificial neural network, and the AI methodology identified two DLBCL prognostic biomarkers (PD-L1 and IKAROS) that were validated.

Author Contributions

J.C., principal investigator, designed the project, data acquisition, performed analysis and wrote the manuscript. R.H. supervised the project and revised the paper. N.N. supervised the project and approved final submission. Y.Y.K., M.M., S.H., S.T., H.I., Y.K. and A.I. contributed to data acquisition and diagnosis of the cases. All authors have read and agreed to the published version of the manuscript.

Funding

This research was funded by grant KAKEN 18K15100 to Dr. Joaquim Carreras, grant-in-Aid for Early-Career Scientists from the Japanese Society for the Promotion of Science (JSPS) of the Ministry of Education, Culture, Sports, Science and Technology-Japan (MEXT). R. H is funded by Al-Jalila Foundation (AJF201741), the Sharjah Research Academy (Grant code: MED001) and University of Sharjah (Grant code: 1901090258).

Institutional Review Board Statement

The study was conducted according to the guidelines of the Declaration of Helsinki, and approved by the Institutional Review Board and the Ethics Committee of Tokai University, School of Medicine (protocol code IRB14R-080 and IRB-156).

Informed Consent Statement

Informed consent was obtained from all subjects involved in the study.

Data Availability Statement

The gene expression data of DLBCL (GEO dataset GSE10846) was obtained from the publicly available database of the NCBI resources webpage, located at https://0-www-ncbi-nlm-nih-gov.brum.beds.ac.uk/gds (accessed on 4 March 2021).

Acknowledgments

We would like to thank all the members of the Lymphoma/Leukemia Molecular Profiling Project (LLMPP) including Louis M. Staudt, Elias Campo, WC Chan and ES Jaffe (among others) for creating and sharing publicly the GSE10846 dataset.

Conflicts of Interest

The authors declare no conflict of interest.

References

  1. Brown, J.R.; Freedman, A.S.; Aster, J.C. Pathobiology of Diffuse Large B Cell Lymphoma and Primary Mediastinal Large B Cell Lymphoma; Lister, A.; Rosmarin, A.G., Eds.; Up-to-Date, Wolters Kluwer Health division of Wolters Kluwer (Philadelphia, Pennsylvania, USA) 2020. Available online: http://www.uptodate.com (accessed on 3 April 2020).
  2. Brown, J.R.; Freedman, A.S.; Aster, J.C. Epidemiology, Clinical Manifestations, Pathologic Features, and Diagnosis of Diffuse Large B Cell Lymphoma; Lister, A., Rosmarin, A.G., Ed.; Up-to-Date, Wolters Kluwer Health division of Wolters Kluwer (Philadelphia, Pennsylvania, USA) 2020. Available online: http://www.uptodate.com (accessed on 3 April 2020).
  3. Brown, J.R.; Freedman, A.S.; Aster, J.C. Prognosis of Diffuse Large B Cell Lymphoma. Lister, A., Rosmarin, A.G., Eds.; Up-to-Date, Wolters Kluwer Health division of Wolters Kluwer (Philadelphia, Pennsylvania, USA) 2020. Available online: http://www.uptodate.com (accessed on 3 April 2020).
  4. Morton, L.M.; Wang, S.S.; Devesa, S.S.; Hartge, P.; Weisenburger, D.D.; Linet, M.S. Lymphoma incidence patterns by WHO subtype in the United States, 1992–2001. Blood 2006, 107, 265–276. [Google Scholar] [CrossRef]
  5. Swerdlow, S.H.; Campo, E.; Harris, N.L.; Jaffe, E.S.; Pileri, S.A.; Stein, H.; Thiele, J. (Eds.) WHO Classification of Tumours of Haematopoietic and Lymphoid Tissues, revised 4th ed; International Agency for Research on Cancer (IARC): Lyon, France, 2017. [Google Scholar]
  6. Bengio, Y.; Courville, A.; Vincent, P. Representation Learning: A Review and New Perspectives. IEEE Trans. Pattern Anal. Mach. Intell. 2013, 35, 1798–1828. [Google Scholar] [CrossRef]
  7. Schmidhuber, J. Deep learning in neural networks: An overview. Neural Netw. 2015, 61, 85–117. [Google Scholar] [CrossRef] [Green Version]
  8. LeCun, Y.; Bengio, Y.; Hinton, G. Deep learning. Nature 2015, 521, 436–444. [Google Scholar] [CrossRef]
  9. Deep Learning. (n.d.). Wikipedia. Available online: https://en.wikipedia.org/wiki/Deep_learning#cite_note-BENGIO2012-1 (accessed on 29 March 2020).
  10. A.I. Wiki. (Chris Nicholson). Pathmind. Available online: https://pathmind.com/wiki/neural-network (accessed on 29 March 2020).
  11. IBM SPSS Neural Networks 25. In IBM SPSS Statistics 25 Documentation; Document Number: 618179; IBM K.K.: Tokyo, Japan, 17 June 2018.
  12. Carreras, J.; Hamoudi, R.; Nakamura, N. Artificial Intelligence Analysis of Gene Expression Data Predicted the Prognosis of Pa-tients with Diffuse Large B-Cell Lymphoma. Tokai J. Exp. Clin. Med. 2020, 45, 37–48. [Google Scholar]
  13. Carreras, J.; Kikuti, Y.Y.; Miyaoka, M.; Hiraiwa, S.; Tomita, S.; Ikoma, H.; Kondo, Y.; Ito, A.; Shiraiwa, S.; Hamoudi, R.; et al. A Single Gene Expression Set Derived from Artificial Intelligence Predicted the Prognosis of Several Lymphoma Subtypes; and High Immunohistochemical Expression of TNFAIP8 Associated with Poor Prognosis in Diffuse Large B-Cell Lymphoma. AI 2020, 1, 23. [Google Scholar] [CrossRef]
  14. Cardesa-Salzmann, T.M.; Colomo, L.; Gutierrez, G.; Chan, W.C.; Weisenburger, D.; Climent, F.; González-Barca, E.; Mercadal, S.; Arenillas, L.; Serrano, S.; et al. High microvessel density determines a poor outcome in patients with diffuse large B-cell lymphoma treated with rituximab plus chemotherapy. Haematologica 2011, 96, 996–1001. [Google Scholar] [CrossRef] [Green Version]
  15. R Core Team. R: A Language and Environment for Statistical Computing; R Foundation for Statistical Computing: Vienna, Austria, 2018; Available online: https://www.R-project.org (accessed on 4 March 2021).
  16. Hamoudi, R.A.; Appert, A.; Ye, H.; Ruskone-Fourmestraux, A.; Streubel, B.; Chott, A.; Raderer, M.; Gong, L.; Wlodarska, I.; De Wolf-Peeters, C.; et al. Differential expression of NF-kappaB target genes in MALT lymphoma with and without chromosome translocation: Insights into molecular mechanism. Leukemia 2010, 24, 1487–1497. [Google Scholar]
  17. Subramanian, A.; Tamayo, P.; Mootha, V.K.; Mukherjee, S.; Ebert, B.L.; Gillette, M.A.; Paulovich, A.; Pomeroy, S.L.; Golub, T.R.; Lander, E.S.; et al. Gene set enrichment analysis: A knowledge-based approach for interpreting genome-wide expression profiles. Proc. Natl. Acad. Sci. USA 2005, 102, 15545–15550. [Google Scholar] [CrossRef] [Green Version]
  18. Scott, D.W.; Wright, G.W.; Williams, P.M.; Lih, C.-J.; Walsh, W.; Jaffe, E.S.; Rosenwald, A.; Campo, E.; Chan, W.C.; Connors, J.M.; et al. Determining cell-of-origin subtypes of diffuse large B-cell lymphoma using gene expression in formalin-fixed paraffin-embedded tissue. Blood 2014, 123, 1214–1217. [Google Scholar] [CrossRef]
  19. Beà, S.; Zettl, A.; Wright, G.; Salaverría, I.; Jehn, P.; Moreno, V.; Burek, C.; Ott, G.; Puig, X.; Yang, L.; et al. Diffuse large B-cell lymphoma subgroups have distinct genetic profiles that influence tumor biology and improve gene-expression-based survival prediction. Blood 2005, 106, 3183–3190. [Google Scholar] [CrossRef]
  20. Ciavarella, S.; Vegliante, M.C.; Fabbri, M.; De Summa, S.; Melle, F.; Motta, G.; De Iuliis, V.; Opinto, G.; Enjuanes, A.; Rega, S.; et al. Dissection of DLBCL microenvironment provides a gene expression-based predictor of survival applicable to formalin-fixed paraffin-embedded tissue. Ann. Oncol. 2018, 29, 2363–2370. [Google Scholar]
  21. Ramis-Zaldivar, J.E.; Gonzalez-Farré, B.; Balagué, O.; Celis, V.; Nadeu, F.; Salmerón-Villalobos, J.; Andrés, M.; Martin-Guerrero, I.; Garrido-Pontnou, M.; Gaafar, A.; et al. Distinct molecular profile of IRF4-rearranged large B-cell lymphoma. Blood 2020, 135, 274–286. [Google Scholar] [CrossRef]
  22. Ichiki, A.; Carreras, J.; Miyaoka, M.; Kikuti, Y.Y.; Jibiki, T.; Tazume, K.; Watanabe, S.; Sasao, T.; Obayashi, Y.; Onizuka, M.; et al. Clinicopathological Analysis of 320 Cases of Diffuse Large B-cell Lymphoma Using the Hans Classifier. J. Clin. Exp. Hematop. 2017, 57, 54–63. [Google Scholar] [CrossRef] [Green Version]
  23. IBM SPSS Neural Networks. New Tools for Building Predictive Models. IBM Software Business Analytics; IBM Corporation Software Group: Somers, NY, USA, 2017. [Google Scholar]
  24. Tamura, H.; Dong, H.; Zhu, G.; Sica, G.L.; Flies, D.B.; Tamada, K.; Chen, L. B7-H1 costimulation preferentially enhances CD28-independent T-helper cell function. Blood 2001, 97, 1809–1816. [Google Scholar] [CrossRef] [Green Version]
  25. Freeman, G.J.; Long, A.J.; Iwai, Y.; Bourque, K.; Chernova, T.; Nishimura, H.; Fitz, L.J.; Malenkovich, N.; Okazaki, T.; Byrne, M.C.; et al. Engagement of the PD-1 immunoinhibitory receptor by a novel B7 family member leads to negative regulation of lymphocyte activation. J. Exp. Med. 2000, 192, 1027–1034. [Google Scholar]
  26. Wang, S.; Bajorath, J.; Flies, D.B.; Dong, H.; Honjo, T.; Chen, L. Molecular Modeling and Functional Mapping of B7-H1 and B7-DC Uncouple Costimulatory Function from PD-1 Interaction. J. Exp. Med. 2003, 197, 1083–1091. [Google Scholar] [CrossRef]
  27. The UniProt Consortium UniProt: A worldwide hub of protein knowledge. Nucleic Acids Res. 2019, 47, D506–D515. [CrossRef] [Green Version]
  28. Iwai, Y.; Ishida, M.; Tanaka, Y.; Okazaki, T.; Honjo, T.; Minato, N. Involvement of PD-L1 on tumor cells in the escape from host immune system and tumor immunotherapy by PD-L1 blockade. Proc. Natl. Acad. Sci. USA 2002, 99, 12293–12297. [Google Scholar] [CrossRef] [Green Version]
  29. Kataoka, K.; Shiraishi, Y.; Takeda, Y.; Sakata, S.; Matsumoto, M.; Nagano, S.; Maeda, T.; Nagata, Y.; Kitanaka, A.; Mizuno, S.; et al. Aberrant PD-L1 expression through 3’-UTR disruption in multiple cancers. Nature 2016, 534, 402–406. [Google Scholar] [CrossRef]
  30. Cheng, Z.; Dai, Y.; Wang, J.; Shi, J.; Ke, X.; Fu, L. High PD-L1 expression predicts poor prognosis in diffuse large B-cell lymphoma. Ann. Hematol. 2018, 97, 1085–1088. [Google Scholar] [CrossRef]
  31. Dijon, M.; Bardin, F.; Murati, A.; Batoz, M.; Chabannon, C.; Tonnelle, C. The role of Ikaros in human erythroid differentiation. Blood 2008, 111, 1138–1146. [Google Scholar] [CrossRef] [Green Version]
  32. Ronni, T.; Payne, K.J.; Ho, S.; Bradley, M.N.; Dorsam, G.; Dovat, S. Human Ikaros function in activated T cells is regulated by coor-dinated expression of its largest isoforms. J. Biol. Chem. 2007, 282, 2538–2547. [Google Scholar]
  33. Kim, J.-H.; Ebersole, T.; Kouprina, N.; Noskov, V.N.; Ohzeki, J.-I.; Masumoto, H.; Mravinac, B.; Sullivan, B.A.; Pavlicek, A.; Dovat, S.; et al. Human gamma-satellite DNA maintains open chromatin structure and protects a transgene from epigenetic silencing. Genome Res. 2009, 19, 533–544. [Google Scholar] [CrossRef] [Green Version]
  34. Chen, Q.; Shi, Y.; Chen, Y.; Ji, T.; Li, Y.; Yu, L. Multiple functions of Ikaros in hematological malignancies, solid tumor and autoimmune diseases. Gene 2019, 684, 47–52. [Google Scholar] [CrossRef]
Figure 1. 
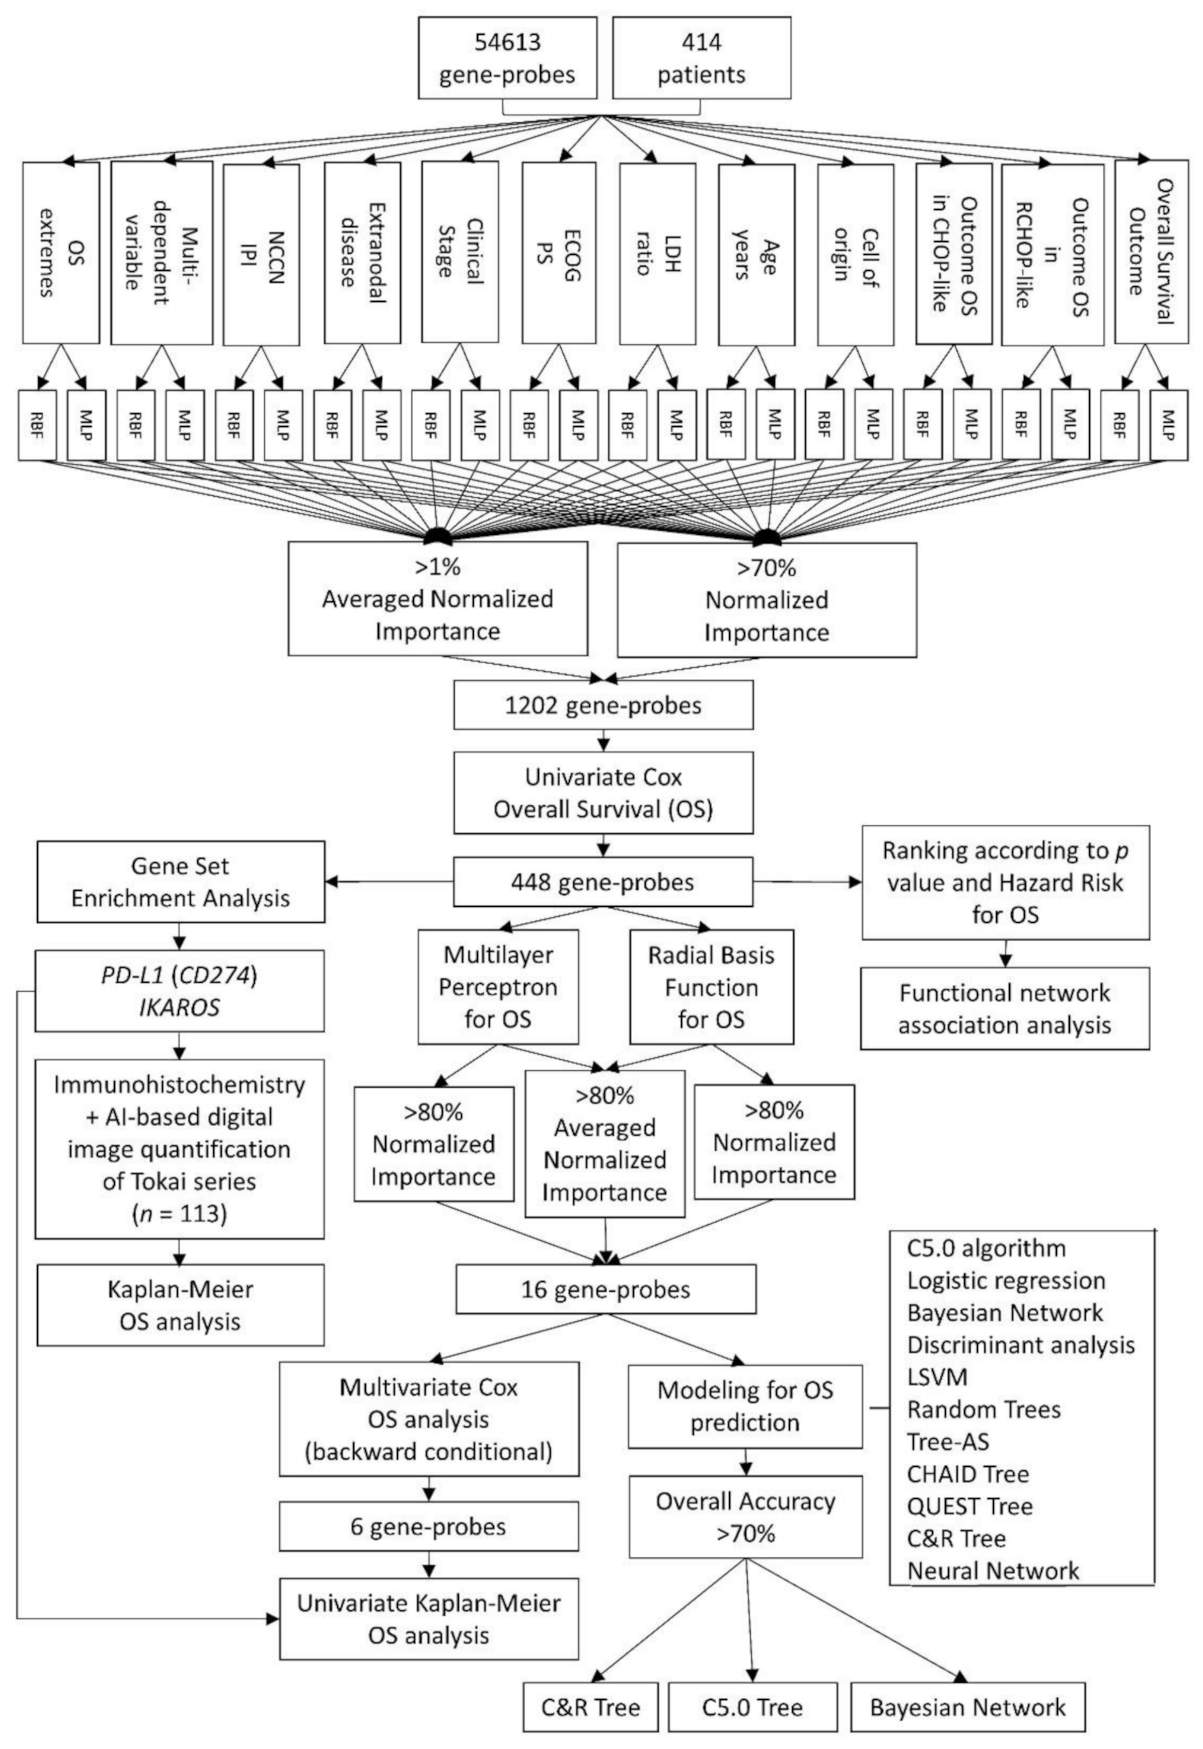
Analysis algorithm. In this project, two types of artificial neural network analyses were performed: Multilayer Perceptron (MLP) and Radial Basis Function (RBF). The input data were the gene expression of 54,613 gene-probes from 414 patients with diffuse large B-cell lymphoma (DLBCL). The target variables were the outcome of the overall survival (dead versus alive), as well as several relevant clinicopathological characteristics, including the cell-of-origin classification and the International Prognostic Index (IPI). The gen-probes were ranked according to their normalized importance (NI). A cutoff of >70% of normalized importance and >1% of averaged normalized importance was applied. Cox regression analysis (univariate and multivariate) reduced the final list to the most relevant genes (n = 448). The gene-set enrichment analysis (GSEA) technique confirmed the association toward bad or good prognosis and PD-L1 and IKAROS were validated in an independent series of Tokai University. Additional data reduction was performed with Cox and Kaplan–Meier overall survival analyses, second round of artificial neural networks and predictive modeling in a multistep process up to a final 16 and 6 genes sets.
Ai 02 00008 g001
Figure 2. 
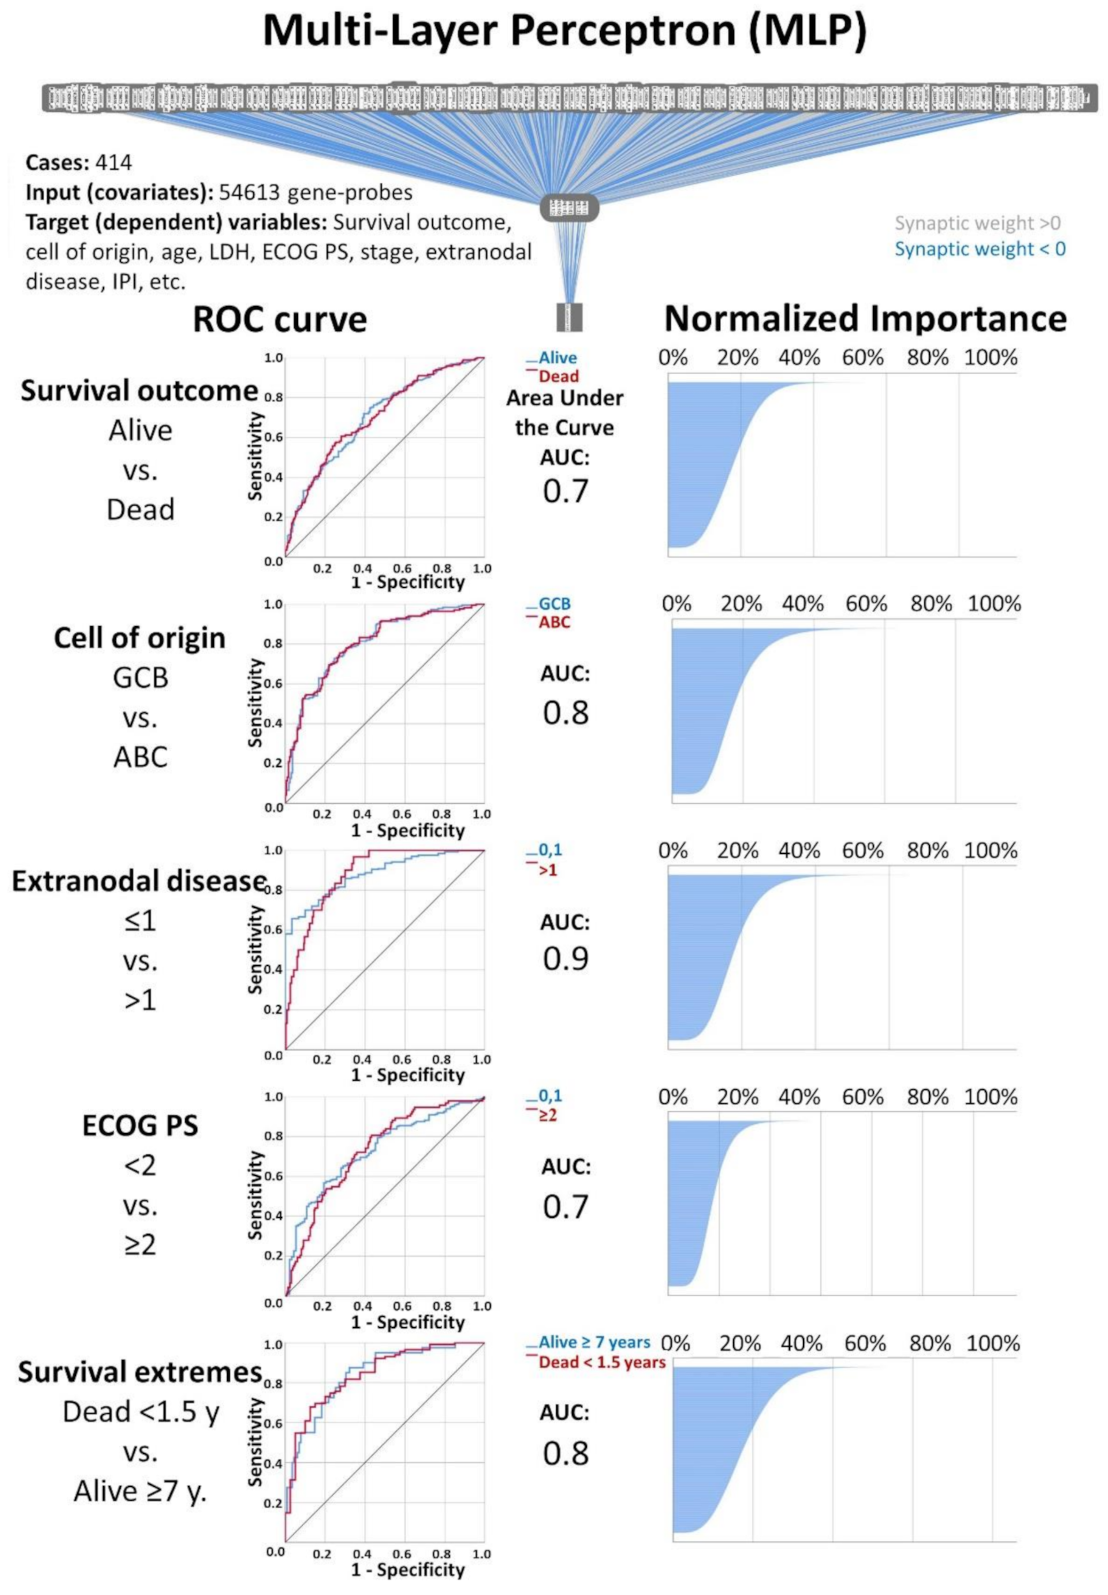
Multilayer Perceptron (MLP) analysis: The artificial neural network analysis consisted of applying of Multilayer Perceptron (MLP) and Radial Basis Function (RBF) artificial neural networks on publicly available gene-expression data from DLBCL patients. For both MLP and RBF, the inputs (covariates) were the 54,613 gene-probes, and the target variables (dependent variables) were the overall survival outcome (dead vs. alive) and a series of clinicopathological variables, including the cell of origin molecular classification, age, LDH, ECOG Performance Status, clinical stage, extranodal disease and IPI. A total of 26 individual AI analyses were performed. The most relevant genes were selected according to their normalized importance, following a strategy as described in Material and Methods and in Table 3. This figure shows part of the results of the MLP analysis. AUC, area under the curve.
Ai 02 00008 g002
Figure 3. 
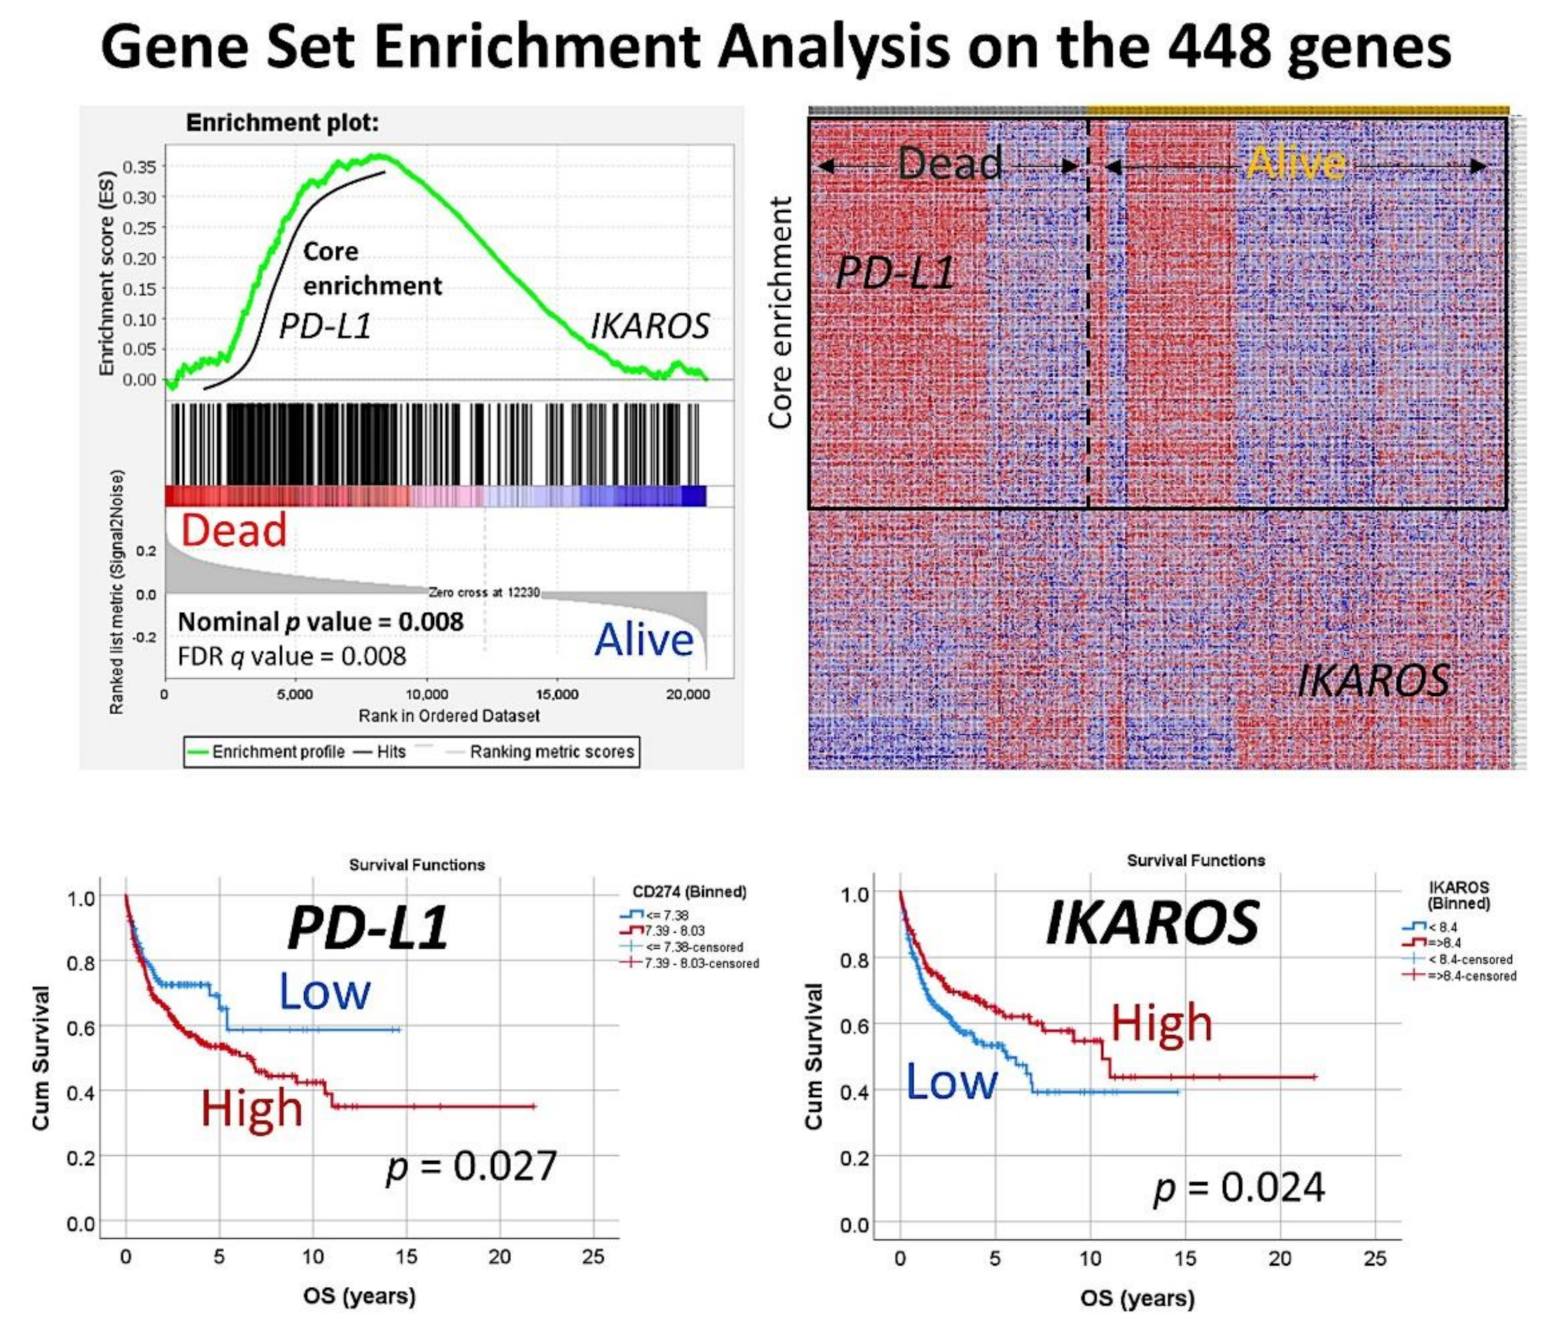
Gene-set enrichment analysis on the set of 448 genes. The set of 448 genes was used in a GSEA analysis, to confirm the association of this set to the overall survival outcome of the patients (dead vs. alive phenotype). In the core enrichment associated to poor prognosis (dead), the PD-L1 (CD274) gene was identified. In the side of good prognosis (alive), the gene IKAROS was identified. Both markers that belong to the immune checkpoint pathway were further validated by immunohistochemistry in an independent series of DLBCL from Tokai University Hospital.
Ai 02 00008 g003
Figure 4. 
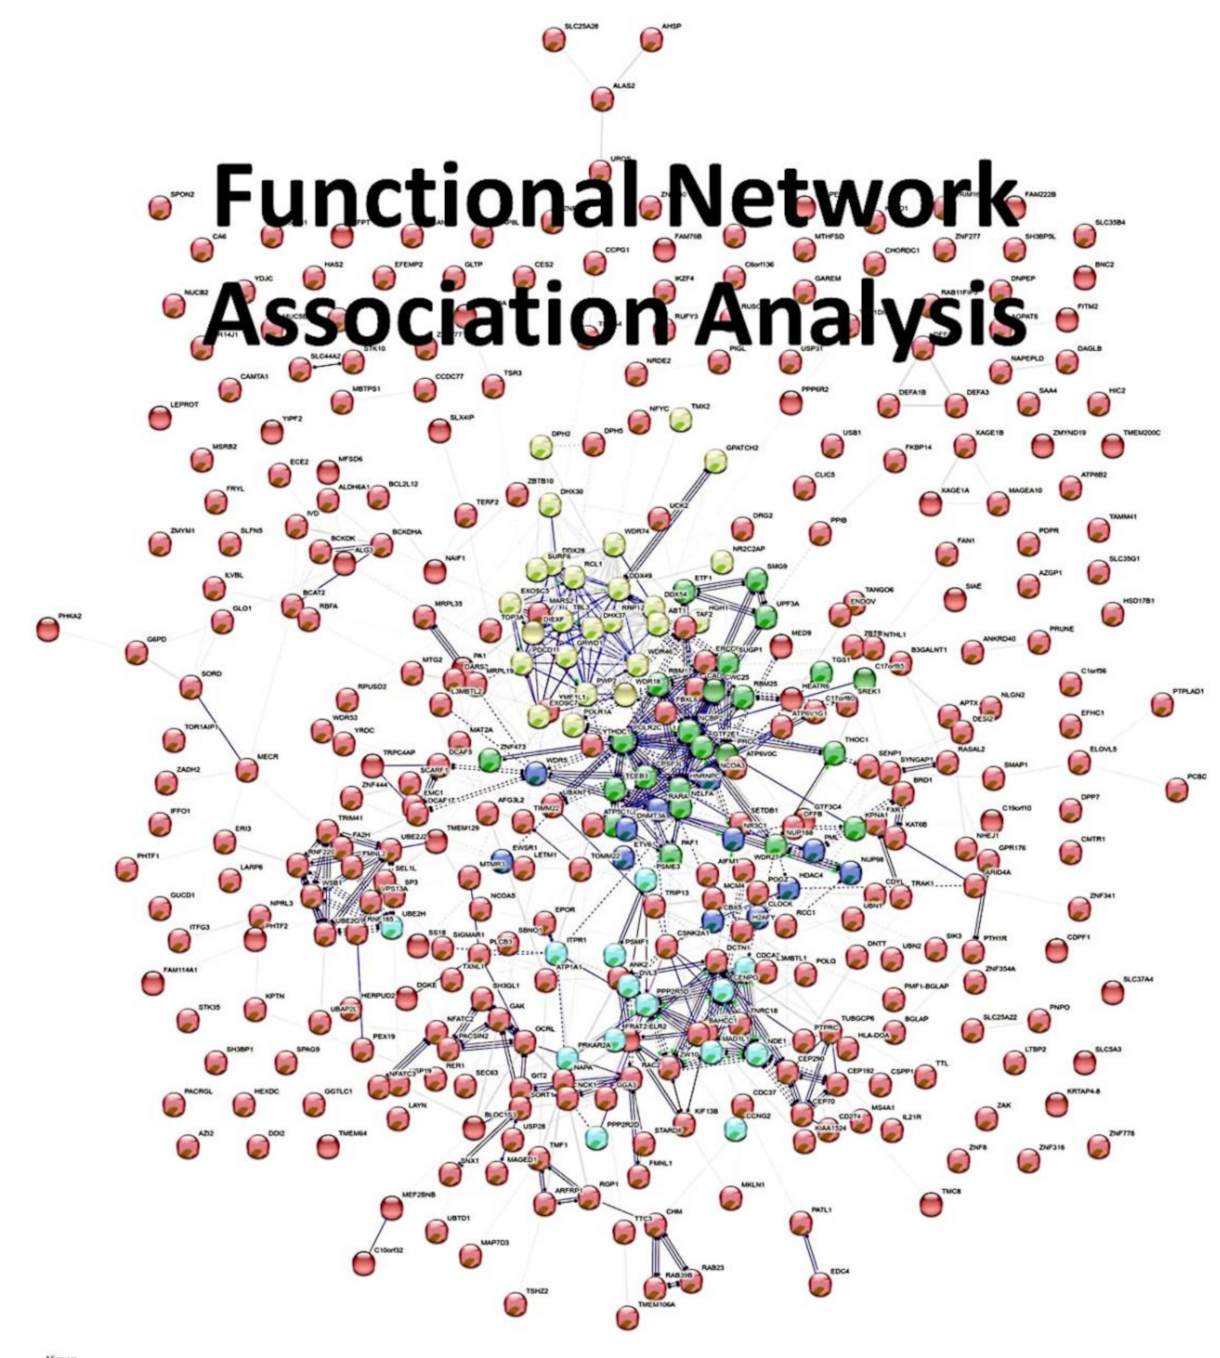
Functional network association analysis on the set of 448 genes. In order to analyze the set of 448 genes according to the biological processes, molecular function, cellular component and pathways, a network analysis was made. The network was characterized by 390 nodes, 791 edges, an average node degree of 4.06, average local clustering coefficient of 0.376 and a protein-protein interaction (PPI) enrichment p-value of 1 × 10⁻¹⁶. In general, the set belonged to the Gene Ontology (GO) nuclei acid metabolic process (GO: 0090304, False Discovery Rate (FDR) = 0.00012). Of note, within the general network, five clusters could be identified.
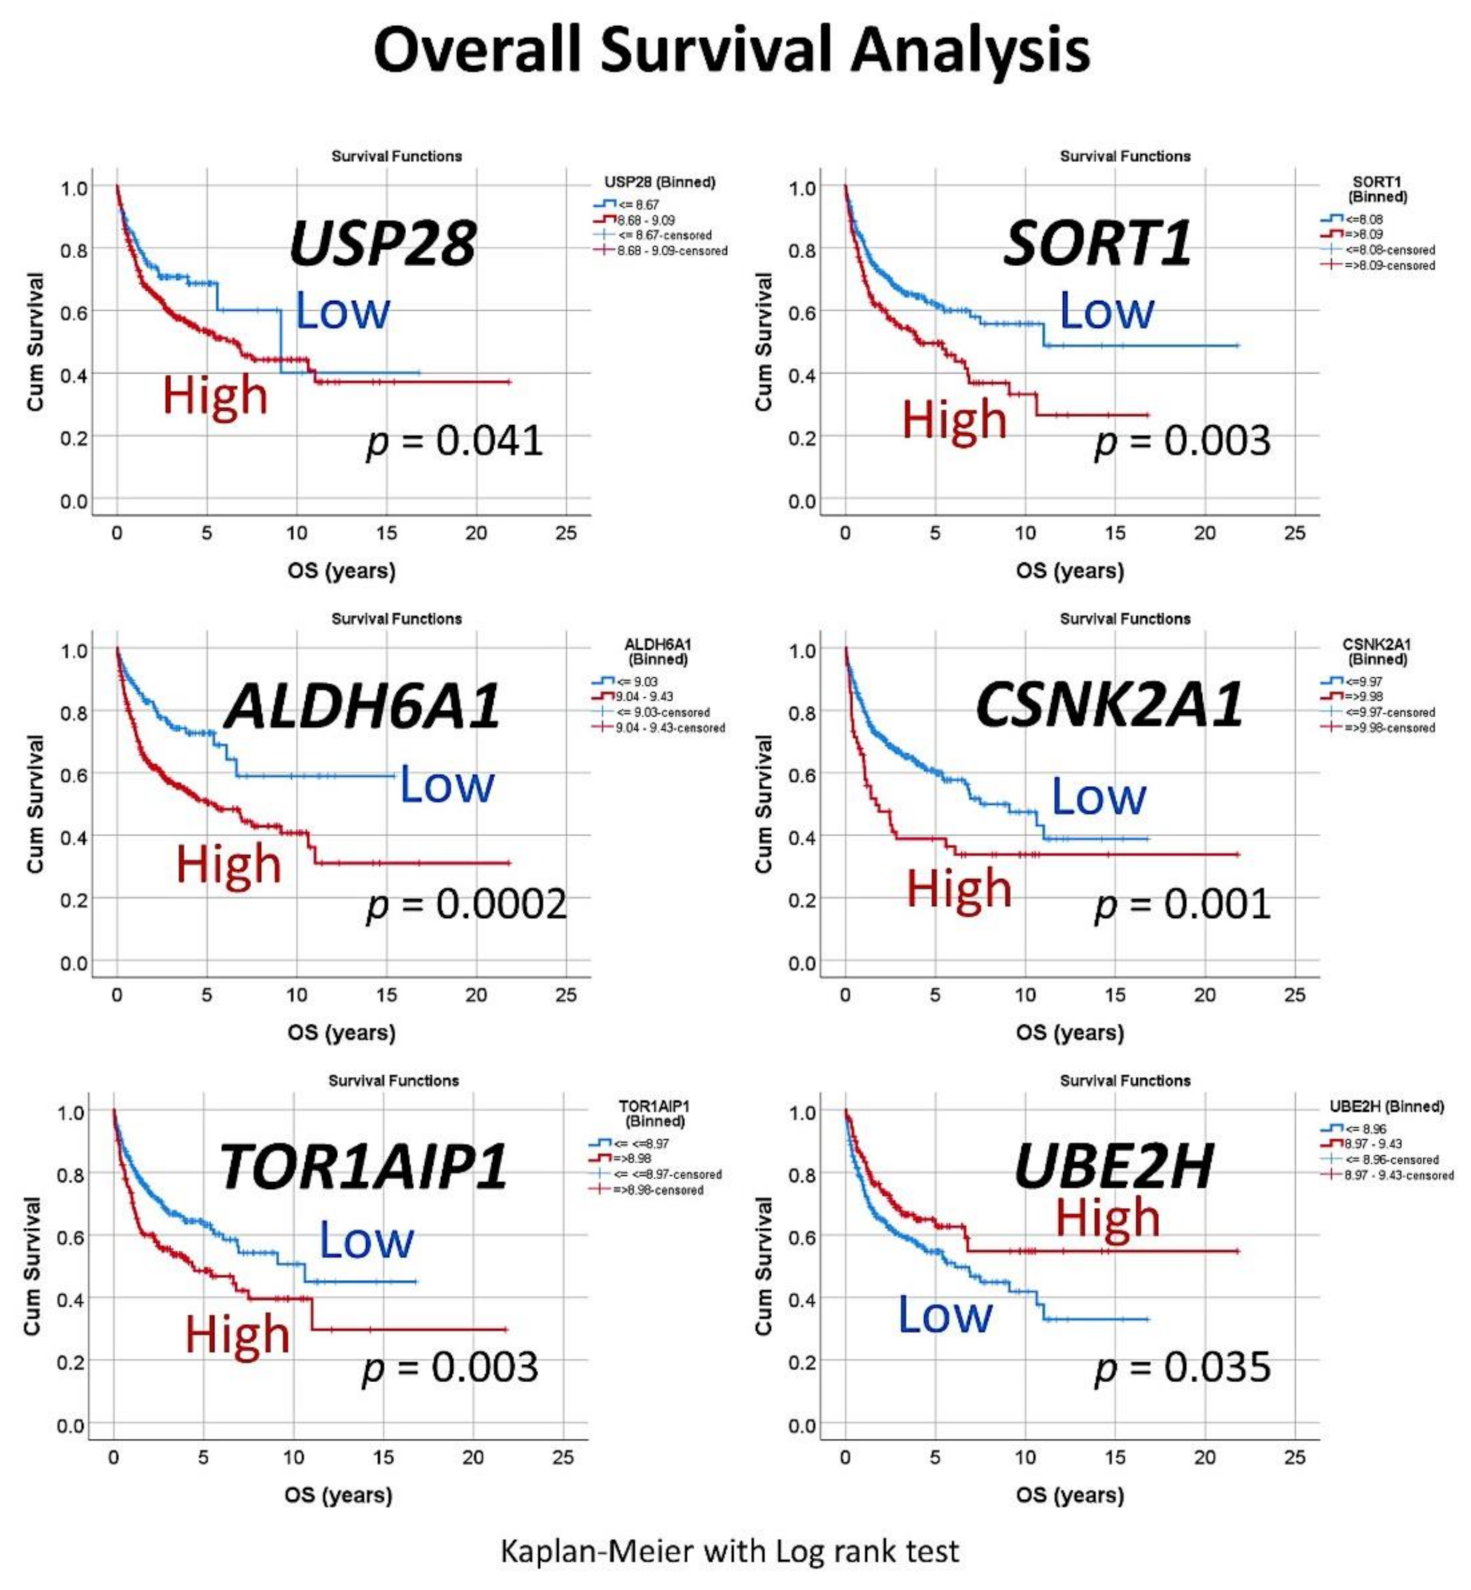
Ai 02 00008 g004
Figure 5. Univariate overall survival analysis of the set of six genes. For each of the six genes, a cutoff was searched to stratify the patients into high and low expression. Then, the overall survival for each marker was analyzed, using the Kaplan–Meier with Log rank test.
Ai 02 00008 g005
Figure 6. Correlation with known pathogenic biomarkers of DLBCL. The clinical relevance for overall survival of known pathogenic biomarkers, including BCL2, MYC, CD163 and TNFAIP8, was tested in this series. After that, an unsupervised hierarchical clustering was performed with the set of six genes (USP28, SORT1, ALDH6A1, CSNK2A1, TOR1AIP1 and UBE2H), PD-L1 (CD204), IKAROS, BCL2, MYC, CD163 and TNFAIP8. The dendrogram for the rows showed how TNFAIP8, ALDH6A1, PD-L1 and USP2B clustered in the same group. In addition, CSNK2A1 and MYC were also close.
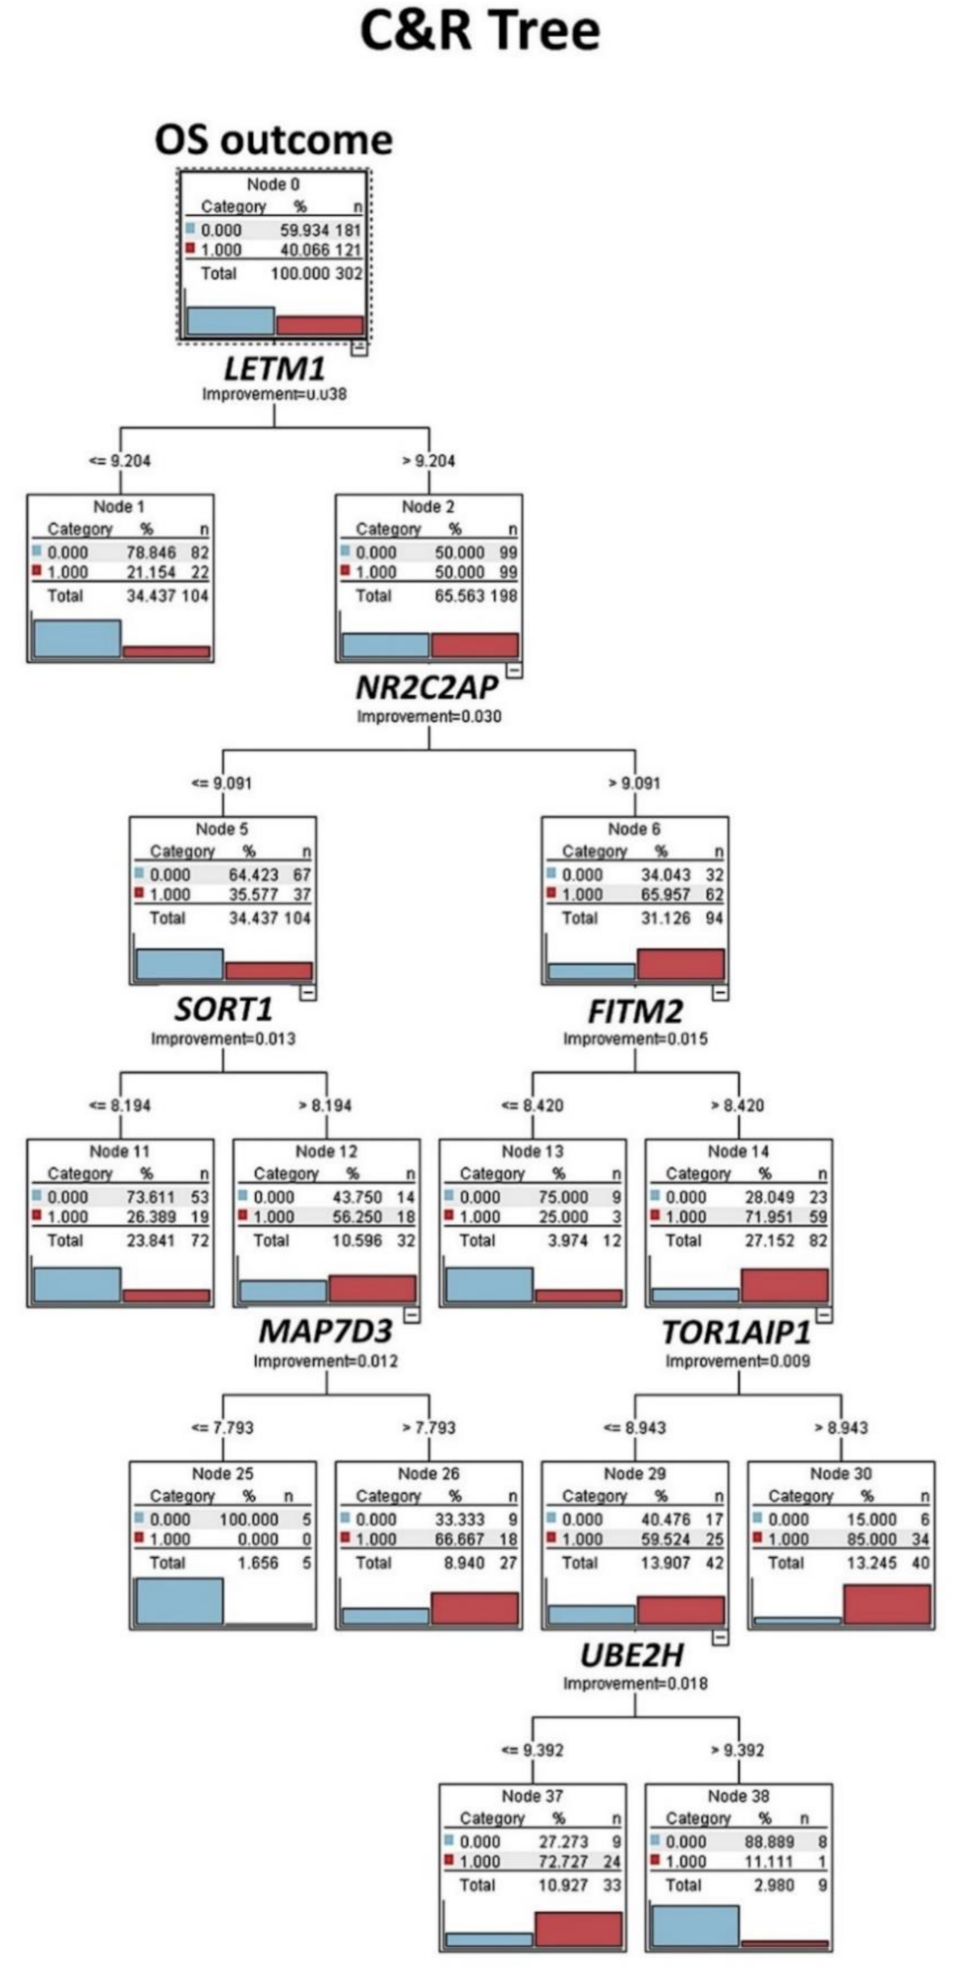
Ai 02 00008 g006
Figure 7. Classification and regression tree (C&R tree): Prognostic modeling was performed, using the set of 16 genes, as shown in Figure 1, and 12 different types of machine-learning analyses were tested. Then, the ones with >70% of overall accuracy were selected. This figure shows the result of the C&R tree. Decision list models identify subgroups or segments that show a higher or lower likelihood of a binary (yes or no) outcome relative to the overall sample. C&R tree node generates a decision tree that allows you to predict or classify future observations. The method uses recursive partitioning to split the training records into segments by minimizing the impurity at each step. Dead outcome, red color (number 1). Alive outcome, blue color (number 0).
Ai 02 00008 g007
Figure 8. C5 decision tree: The set of 16 genes was also tested, using C5 decision tree. This result had an overall accuracy above 70%. The C5.0 node builds either a decision tree or a rule set. The model works by splitting the sample based on the field that provides the maximum information gain at each level. The target field must be categorical (in our case, the overall survival outcome as dead vs. alive). Multiple splits into more than two subgroups are allowed. Dead outcome, red color (number 1). Alive outcome, blue color (number 0).
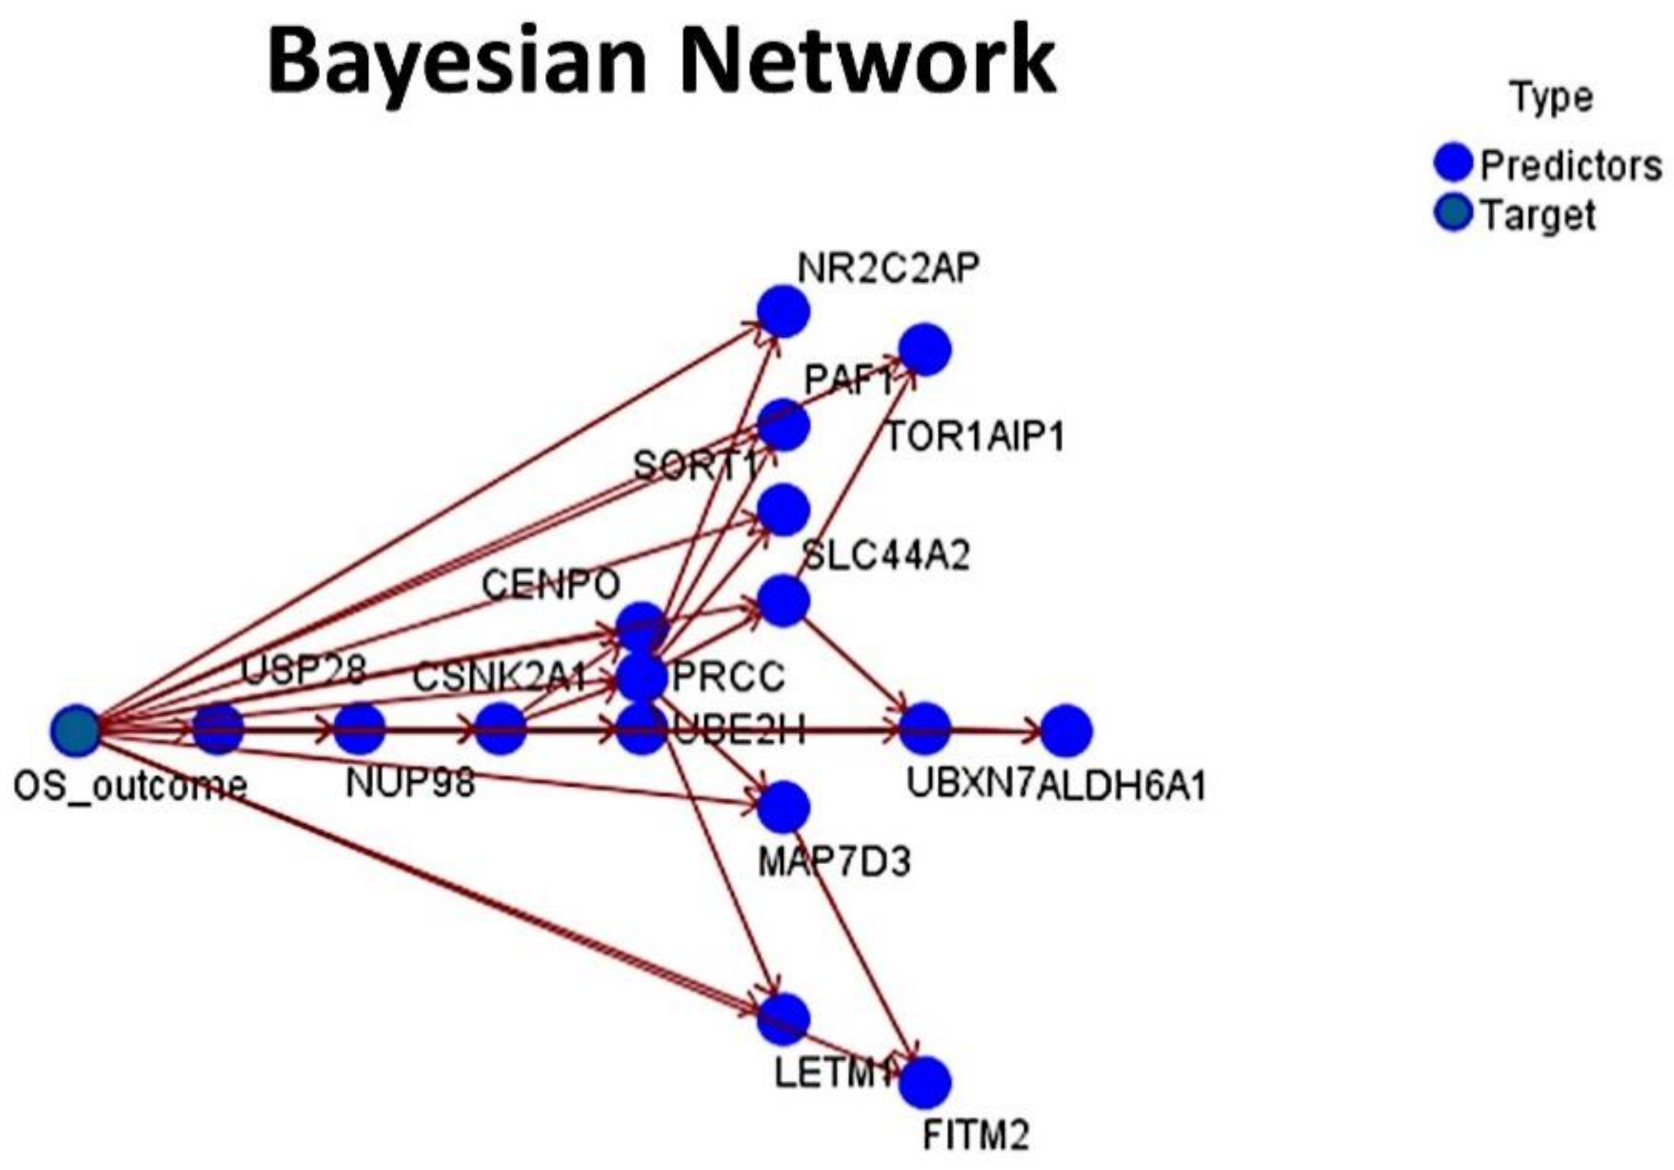
Ai 02 00008 g008
Figure 9. Bayesian Network: The set of 16 genes was also tested, using a Bayesian Network. The result had an overall accuracy above 70%. A Bayesian Network is a graphical model that displays variables (nodes) in a dataset and the probabilistic, or conditional, independencies between them. Causal relationships between the several variables may be represented by a Bayesian Network; however, the links (arcs) between the nodes do not necessarily represent a direct cause and effect.
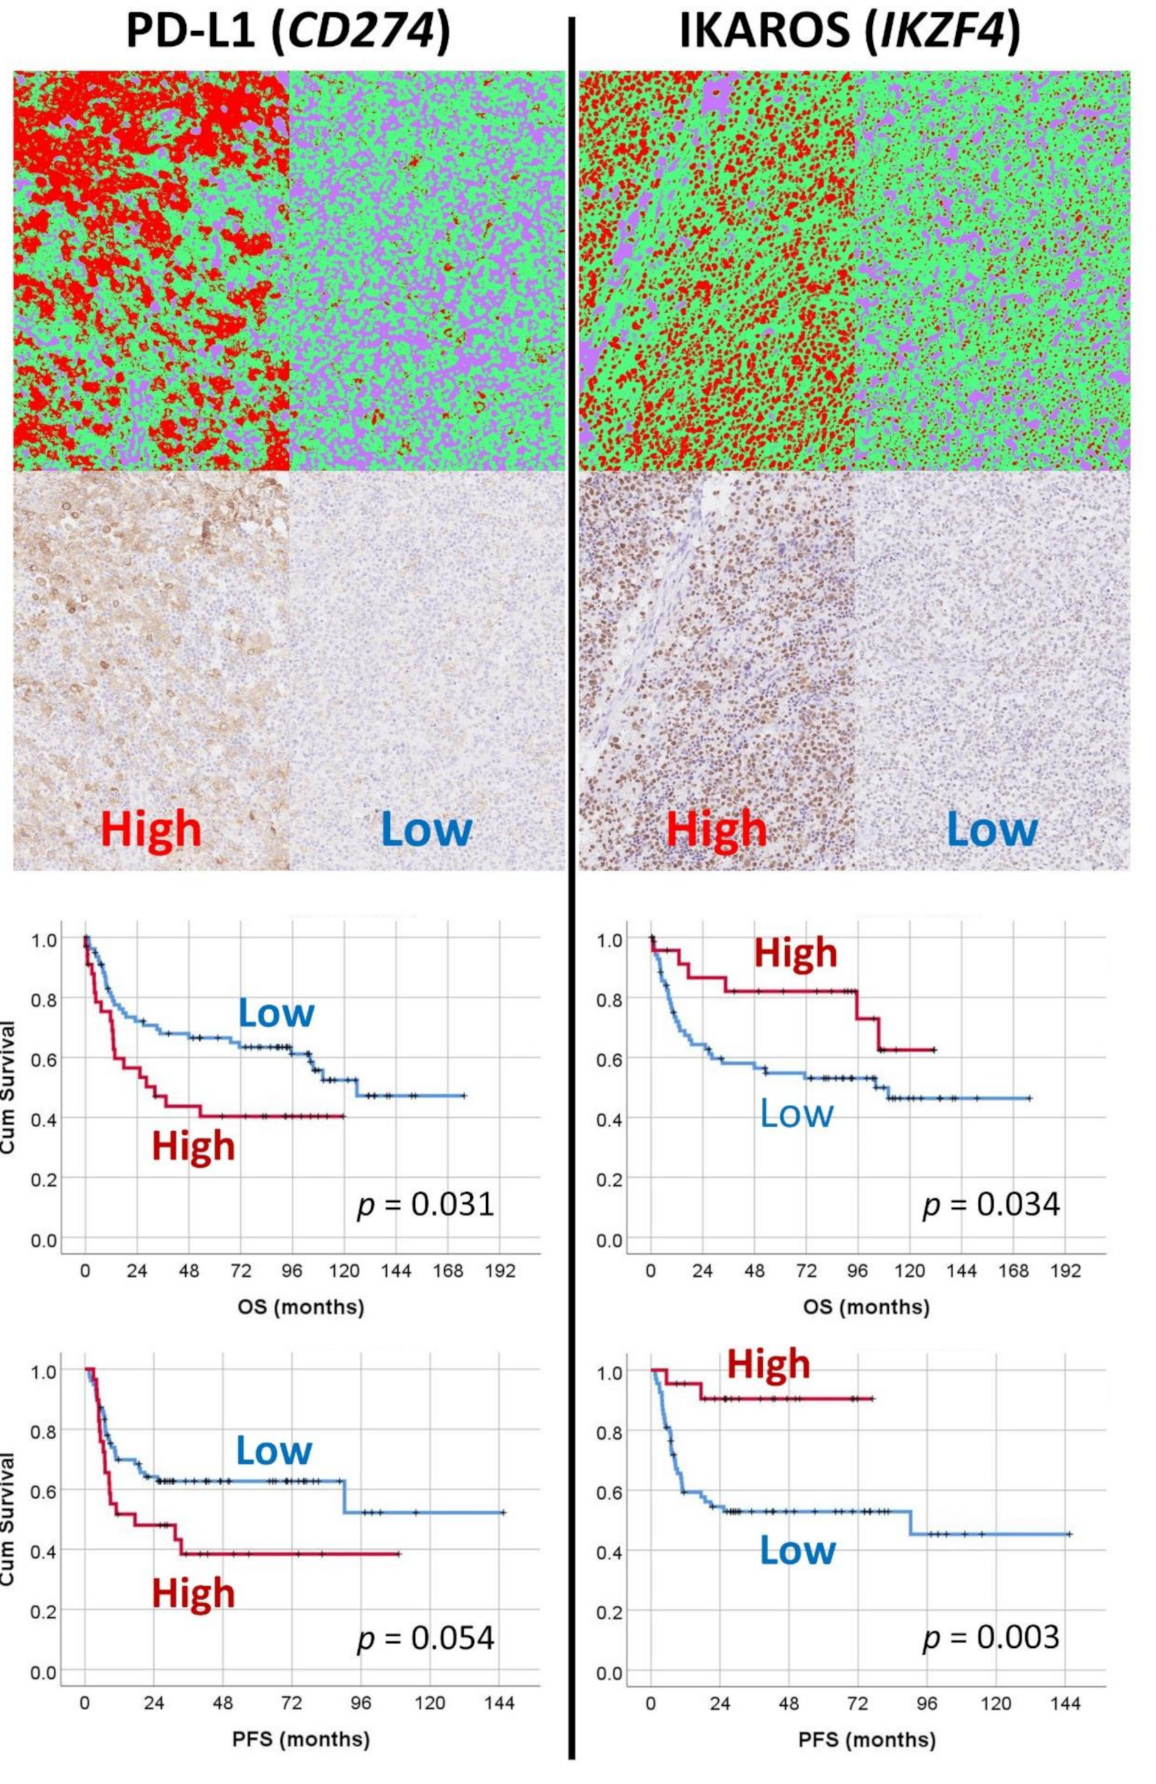
Ai 02 00008 g009
Figure 10. Machine-learning-based digital-image analysis of immunohistochemical expression of PD-L1 and IKAROS and their correlation with the survival of the patients. The markers of PD-L1 and IKAROS were identified in the artificial neural network analysis of gene-expression data as bad prognosis and good prognosis markers, respectively. The immunohistochemical expression was tested in an independent DLBCL series from Tokai University. For the digital-image quantification, an AI-based segmentation method was used. Correlation with the survival of the patients confirmed the AI results.
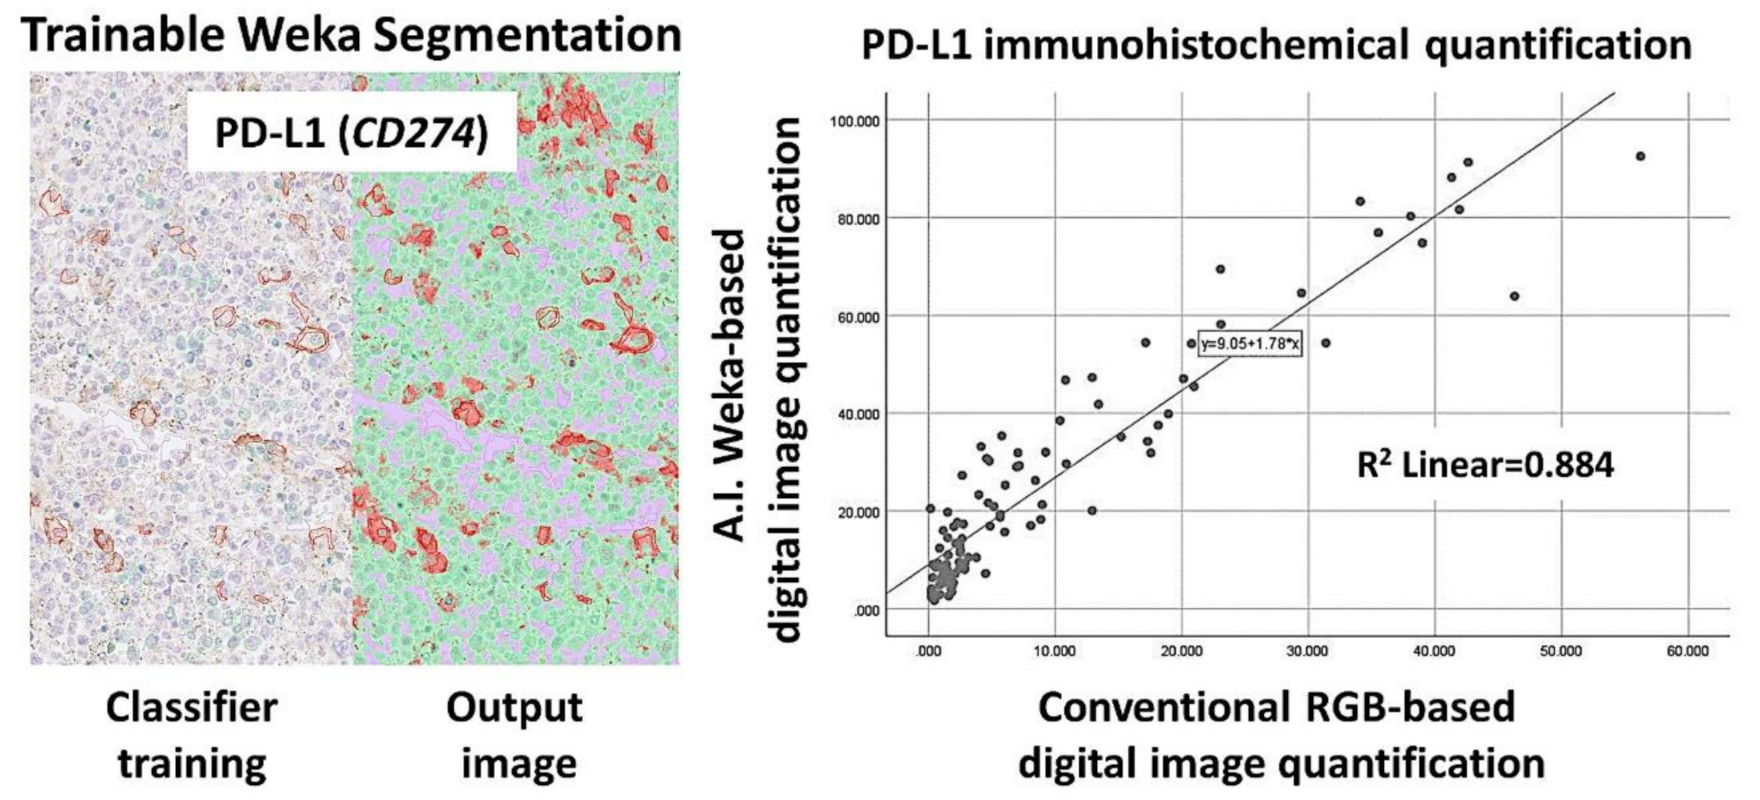
Ai 02 00008 g010
Figure 11. PD-L1 (CD274) marker validation, using digital image. Digital image quantification of PD-L1. PD-L1 was analyzed, using a conventional RGB-based analysis, as well as with a machine-learning trainable segmentation method. Good correlation was found between both methods.
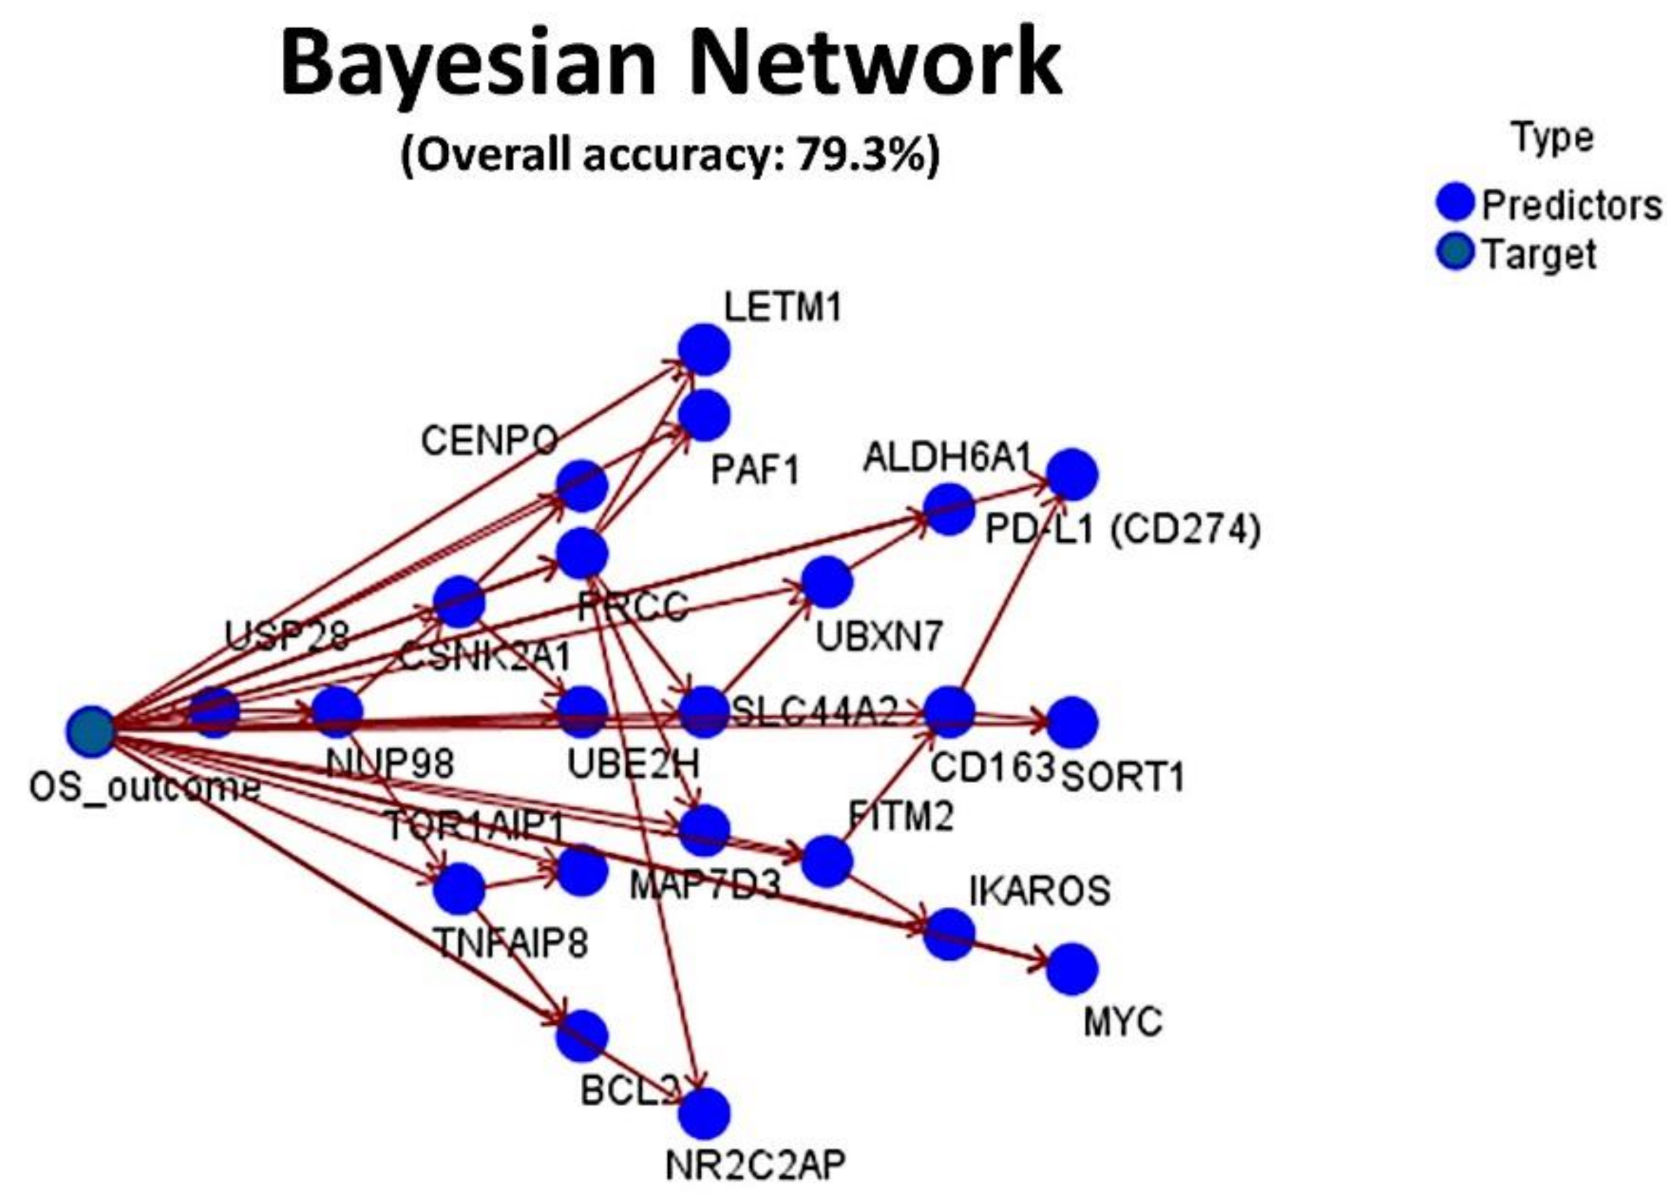
Ai 02 00008 g011
Figure 12. Final integrated Bayesian Network. The set of 16 genes, PD-L1 (CD274) and IKAROS were merged with known biomarkers with prognostic relevance in diffuse large B-cell lymphoma (DLBCL), including BCL2, MYC, CD163 and TNFAIP8. The resulting machine-learning analysis had an overall accuracy for prediction of the overall survival of 79.3%.
Ai 02 00008 g012
Figure 13. Final integrated C5.0 decision tree. The set of 16 genes, PD-L1 (CD274) and IKAROS were merged with known biomarkers with prognostic relevance in diffuse large B-cell lymphoma (DLBCL), including BCL2, MYC, CD163 and TNFAIP8. The resulting machine-learning analysis had an overall accuracy for prediction of the overall survival of 82.1%. Dead outcome, red color (number 1). Alive outcome, blue color (number 0).
Ai 02 00008 g013
Table 1. Clinicopathological characteristics of the discovery series (GSE10846).
Variableno.%p-ValueHazard Risk95.0% CI for HR
LowerUpper
Sex Male224/41454.60.91.0210.7441.402
Age > 60226/41454.62 × 10−62.2091.593.069
LDH ratio > 1182/35151.95.1 × 10−82.7231.8993.905
LDH ratio > 332/3519.12.9 × 10−83.6732.3195.818
ECOG Performance Status ≥ 293/38923.93.1 × 10−102.8352.0493.921
Clinical stage III or IV218/40653.72.5 × 10−41.8341.3262.537
Extranodal disease site > 130/3837.80.0141.9271.1443.246
NCCN IPI
  Low risk54/32116.85.2 × 10−08---
  Low-intermediate risk152/32147.43.8 × 10−45.2212.09613.004
  High-intermediate risk98/32130.54 × 10−68.743.49321.871
  High risk17/3215.36.9 × 10−817.7616.24450.521
Cell-of-origin molecular subtype
  Germinal center B-cell (GCB)183/41444.22.8 × 10−8---
  Activated B-cell (ABC)167/41440.31.1 × 10−82.751.9443.891
  Unclassified64/41415.50.21.3890.842.298
Treatment
  RCHOP-like233/41456.37.8 × 10−50.520.3760.719
  CHOP-like181/41443.7----
Overall survival (outcome)
  Dead165/41439.9----
  Alive249/41460.1----
Overall survival
  Dead < 1.5 years115/41427.83.3 × 10−9113.44823.654544.122
  Alive ≥ 7 years40/4149.7----
The first three columns of the table show the clinicopathological characteristics of patients of this series GSE10846 of diffuse large B-cell lymphoma (DLBCL), with the frequencies of cases per each variable. The variables include clinical variables such as sex, age, the International Prognostic Index, etc., as well as biological factors, such as the cell-of-origin molecular subtypes. Columns 4 to 7 show the prognostic relevance of the variables, using a univariate Cox regression analysis for overall survival. The data show the statistical p-value, the Hazard Risk and the 95% confidence interval (CI) for the Hazard Risk. ECOG, Eastern Cooperative Oncology Group. NCCN IPI, National Comprehensive Cancer Network International Prognostic Index. RCHOP, rituximab, cyclophosphamide, doxorubicin hydrochloride, vincristine sulfate, and prednisone.
Table 2. Clinicopathological characteristics of the validation series (Tokai cases).
Variableno.%p-ValueHazard Risk95.0% CI for HR
LowerUpper
Sex Male63/11355.80.91.0450.61.821
Age > 6078/11269.60.012.5531.245.253
Location
  Nodal (+spleen)63/11355.80.4---
Extranodal
  Waldeyer’s ring11/1139.70.20.4860.1471.613
  Gastrointestinal10/1138.80.60.7350.2232.422
  Other extranodal29/11325.70.41.3260.7252.427
  LDH High (>219)70/11262.51.8 × 10−33.031.516.083
  Seric IL2RA High (>530)83/10678.31.4 × 10−23.6271.29910.125
ECOG Performance Status ≥ 215/9016.76.2 × 10−43.4661.7017.062
  Clinical stage III or IV52/10549.50.012.1381.173.905
  Extranodal disease site >120/8623.35.1 × 10−53.9852.0417.78
  B symptoms24/9425.50.21.5570.8053.011
International Prognostic Index (IPI)
  Low risk (L)34/9635.41.9−10-2---
  Low-intermediate risk (LI)29/9630.20.013.2651.3927.656
  High-intermediate risk (HI)20/9620.80.022.991.1937.495
  High risk (H)13/9613.54.9 × 10−34.3261.55812.016
Cell-of-origin subtype (Hans)
  GCB37/11033.6----
  Non-GCB73/11066.41.4 × 10−22.3181.1864.529
  Epstein–Barr virus, EBER+16/11114.42.5 × 10−22.2911.114.729
Treatment
  RCHOP79/10674.50.3---
  RCHOP-like22/10620.80.11.6770.8733.219
  Others5/1064.70.51.7010.4067.134
Response to treatment
  CR72/10163.7-
  PR+PD+SD+NC29/10128.72.9 × 10−1311.4675.95622.076
Overall survival (outcome)
  Dead51/11345.1----
  Alive62/11354.9----
The first 3 columns show the frequencies of each clinicopathological variables. Columns 4 to 7 show the results of the univariate Cox regression analysis for overall survival.
Table 3. Multilayer Perceptron (MLP) artificial neural network analysis for the prediction of DLBCL prognosis.
Multilayer PerceptionDependent VariableOutcome DeadOutcome Dead RCHOP-Like OnlyOutcome Dead CHOP-Like OnlyCell-of-Origin Activated B-Cell-LikeAge > 60LDH Ratio ≥ 1LDH Ratio > 3ECOG ≥ 2Stage III/IVExtranodal Sites > 1Sex MaleNCCN IPI–like HI+HDead < 1.5 vs. Alive => 7 y.Multivariate
Case processing summaryTraining283161131252279253239264295260268222104187
Training Percentage68.4069.1072.4072.0067.4072.1068.1067.9072.7067.9067.7069.2067.1069.00
Testing13172509813598112125111123128995184
Testing Percentage31.6030.9027.6028.0032.6027.9031.9032.1027.3032.1032.3030.8032.9031.00
Valid414233181350414351351389406383396321155271
Excluded6000669693114372499265149
Total420233181350420420420420420420420420420420
Network informationNumber of Units54,61354,61354,61354,61354,61354,61354,61354,61354,61354,61354,61354,61354,61354,613
Rescaling Method of CovariatesStandardized
Hidden layerNumber of Hidden Layers11111111111111
Number of Units in Hidden Layer66915591598888107
Activation FunctionHyperbolic tangent
Output layerDependent variable11111111111118
Number of Units222222222222216
Activation FunctionSoftmax
Error FunctionCross-entropy
Model summary trainingCross-Entropy Error174.1685.8079.90140.50178.40163.9074.50132.80193.9047.50186.20136.5046.49840.80
Percent of Incorrect Predictions33.9024.8033.6027.8038.4036.8010.5024.6039.306.5045.4033.8019.2030.20
Stopping Rule Used *11111111111111
Time in Minutes9.124.924.607.108.208.026.807.929.357.639.337.322.987.83
Model summary testingCross-Entropy Error77.3936.1025.3049.8087.3063.0022.7061.5069.6027.6080.6059.1018.80397.90
Percent of Incorrect Predictions32.1026.4026.0025.5039.3035.706.3023.2034.208.9035.2030.3019.6032.90
ClassificationTraining Overall Percent66.1075.2066.4072.2061.6063.2089.5075.4060.7093.5054.5066.2080.8069.80
Testing Overall Percent67.9073.6074.0074.5060.7064.3093.8076.8065.8091.1064.8069.7080.4067.10
Area under the curveAlive0.700.690.760.800.680.670.750.730.660.880.600.680.840.66
Dead0.700.690.760.800.680.670.750.730.660.880.600.680.840.66
RCHOP, rituximab, cyclophosphamide, doxorubicin hydrochloride, vincristine sulfate and prednisone; LDH, lactate dehydrogenase; IPI, International Prognostic Index; HI, high intermediate; H, high; * consecutive with no decrease in error.
Table 4. Radial Basis Function (RBF) artificial neural network analysis for the prediction of DLBCL prognosis.
Radial Basis FunctionDependent VariableOutcome DeadOutcome Dead RCHOP-Like OnlyOutcome Dead CHOP-Like OnlyCell-of-Origin Activated B-Cell-LikeAge > 60LDH Ratio ≥ 1LDH Ratio > 3ECOG ≥ 2Stage III/IVExtranodal Sites > 1Sex MaleNCCN IPI–Like HI+HDead < 1.5 vs. Alive => 7 yearsMultivariate
Case processing summaryTraining283161131239301239240264295261269222104187
Training Percentage68.3069.1072.4068.3072.7068.1068.4067.9072.7068.1067.9069.2067.1069.00
Testing1317250111113112111125111122127995184
Testing Percentage31.6030.9027.6031.7027.3031.9031.6032.1027.3031.9032.1030.8032.9031.00
Valid414233181350414351351389406383396321155271
Excluded60070669693114372499265149
Total420233181420420420420420420420420420420420
Network informationNumber of Units54,61354,61354,61354,61354,61354,61354,61354,61354,61354,61354,61354,61354,61354,613
Rescaling Method of CovariatesStandardized
Hidden layerNumber of Hidden Layers11111111111111
Number of Units in Hidden Layer102310210932102888
Activation FunctionSoftmax
Output layerDependent variable11111111111118
Number of Units222222222222216
Activation FunctionIdentity
Error FunctionSum of Squares
Model summary trainingCross Entropy Error57.5031.2031.3047.6074.2055.9023.7048.4073.3015.5066.6049.4016.60293.60
Percent of Incorrect Predictions33.6026.7041.2027.6046.2039.7011.3024.2046.107.7046.1034.7023.1031.10
Stopping Rule Used *-
Time in Minutes171.0832.7021.07127.07221.92127.37117.73145.20145.75141.83171.65107.2013.3357.70
Model summary testingCross Entropy Error27.8012.9012.5024.9028.0027.005.3022.3027.708.6031.2022.609.30138.30
Percent of Incorrect Predictions32.1023.6044.0036.0043.3041.104.5023.2046.808.2048.8035.4029.4033.60
ClassificationTraining Overall Percent66.4073.3058.8072.4053.8060.3088.8075.8053.9092.3053.9065.3076.9068.90
Testing Overall Percent67.9076.4056.0064.0056.6058.9095.0076.8053.2091.8051.2064.6070.6066.40
Area under the curveAlive0.710.580.540.750.540.620.590.520.490.830.520.580.750.64
Dead0.710.580.540.750.540.620.590.520.490.830.520.580.750.64
RCHOP, rituximab, cyclophosphamide, doxorubicin hydrochloride, vincristine sulfate and prednisone; LDH, lactate dehydrogenase; IPI, International Prognostic Index; HI, high-intermediate; H, high. * Consecutive with no decrease in error.
Table 5. Comparison of Performance between MLP and RBF artificial neural networks for prediction of DLBCL prognosis.
Artificial Neural Network ParametersMLPRBFp-Value
(n = 14)(n = 14)
Training set number228.4 ± 59.7228.3 ± 60.90.995
Training set percentage69.4% ± 2.069.2% ± 1.90.864
Testing set number101.2 ± 28.2101.4 ± 26.90.989
Testing set percentage30.6% ± 2.030.7% ± 1.90.872
Valid number of cases329.6 ± 86.7329.6 ± 86.71
Number of gene-probes (units)54,61354,6131
Rescaling method for covariatesStandardizedStandardizedN/A
Hidden layer(s)
  Number of hidden layers11N/A
  Number of units in hidden layer8.8 ± 2.96.2 ± 3.60.048
  Activation functionHyperbolic tangentSoftmaxN/A
Output layer
  Dependent (target) variable1 (8 for multivariate)1 (8 for multivariate)1
  Number of units2 (16 for multivariate)2 (16 for multivariate)1
   Activation functionSoftmaxIdentityN/A
  Error functionCross-entropySum of SquaresN/A
Model summary
Training
  Cross-entropy error177.2 ± 197.763.2 ± 69.10.058
  Percent of incorrect predictions28.9% ± 11.031.4% ± 12.30.559
  Training time (min)7.2 ± 1.8114.4 ± 61.97.5 × 10−7
Testing
   Cross-entropy error76.9 ± 95.228.5 ± 32.80.091
  Percent of incorrect predictions26.8% ± 9.832.1% ± 13.50.245
Classification
   Training sample, overall percent correct71.1% ± 11.068.6% ± 12.30.583
  Testing sample, overall percent correct73.2% ± 9.867.8% ± 13.40.239
   Area under the curve (ROC)0.7 ± 0.10.6 ± 0.10.007
After the +/- symbol, the standard deviation is shown.
Table 6. Top 10 genes according to the p-value (set of 448 gene-probes).
GeneProbeBSEWalddfp-ValueHazard RiskLowerUpper
ALG3207396_s_at0.740.13430.25713.8 × 10−82.0951.612.727
UCK2209825_s_at0.5890.1128.45419.6 × 10−81.8031.4522.238
ZMYND19227477_at0.6870.1327.9611.2 × 10−71.9881.5412.564
ELFN1-AS1231443_at0.5510.10726.36912.8 × 10−71.7351.4062.141
PHTF21554780_a_at-0.550.10825.96813.5 × 10−70.5770.4670.713
EXOSC7212627_s_at0.5460.1124.45317.6 × 10−71.7261.392.144
BCAT2203576_at0.5940.12123.94619.9 × 10−71.811.4272.296
TBRG4220789_s_at0.6450.13323.64611 × 10−61.9061.472.471
THOC1204064_at0.9060.18623.67611 × 10−62.4761.7183.566
KIF13B202962_at0.4130.08623.24711 × 10−61.5111.2781.787
Table 7. Top 10 bad prognostic genes according to the Hazard Risk (set of 448 gene-probes).
GeneProbeBSEWalddfp-ValueHazard RiskLowerUpper
THOC1204064_at0.9060.18623.67611 × 10−62.4761.7183.566
TMX2201175_at0.8780.18422.69812 × 10−62.4071.6773.455
HNRNPC214737_x_at0.7480.20213.76212 × 10−42.1131.4233.138
ALG3207396_s_at0.740.13430.25713.8 × 10−82.0951.612.727
NELFA203112_s_at0.7190.15322.0413 × 10−62.0521.522.77
PPP6R2202791_s_at0.6950.15819.29211.1 × 10−62.0031.4692.73
ZMYND19227477_at0.6870.1327.9611.2 × 10−71.9881.5412.564
TBRG4220789_s_at0.6450.13323.64611 × 10−61.9061.472.471
GLO1200681_at0.6430.15716.79514 × 10−51.9031.3992.588
BORCS81553978_at0.620.16314.51311 × 10−51.8591.3512.558
Table 8. Top 10 good prognostic genes according to the Hazard Risk (set of 448 gene-probes).
GeneProbeBSEWalddfp-ValueHazard RiskLowerUpper
TTC3208663_s_at−0.1240.03413.11510.00020.8840.8260.945
YTHDC1214814_at−0.1340.0439.51410.0020.8750.8030.952
B3GALNT1223374_s_at−0.1460.0586.32610.0120.8640.7710.968
ZNF2771555193_a_at−0.1520.0744.24610.0390.8590.7440.993
RAB39B238695_s_at−0.1540.0635.8710.0150.8570.7570.971
ITPR1211323_s_at−0.1560.0655.67110.0170.8560.7530.973
CLIC5213317_at−0.1570.0665.74510.0170.8540.7510.972
SEL1L202062_s_at−0.160.0774.33510.0370.8520.7320.991
N/A242693_at−0.1670.0695.96210.0150.8460.740.968
MFSD6219858_s_at−0.1710.0647.25110.00710.8430.7440.955
Table 9. Set of 16 prognostic genes.
GeneProbeBSEWalddfp-ValueHazard RiskLowerUpper
PAF1202093_s_at0.2370.1184.0110.0451.2671.0051.597
USP281552678_a_at0.4220.13310.08310.00151.5261.1751.98
SORT1212807_s_at0.1770.0814.75810.031.1941.0181.401
MAP7D3219626_at0.3760.1357.7910.0051.4561.1181.896
FITM2226805_at0.3020.1484.16210.041.3521.0121.807
CENPO226118_at0.3240.1088.94610.0031.3831.1181.71
PRCC208938_at0.2290.1173.85610.051.25811.581
ALDH6A1221588_x_at0.5150.15810.5710.00121.6731.2272.282
CSNK2A1212075_s_at0.4180.1349.71510.00181.521.1681.977
TOR1AIP1212409_s_at0.3840.1625.60710.0181.4681.0682.017
NUP98203194_s_at0.3390.1316.71810.0091.4041.0861.814
UBE2H221962_s_at-0.4150.12111.69910.00060.660.5210.838
UBXN7217100_s_at0.2690.1086.18710.0131.3091.0591.618
SLC44A2224609_at0.2510.1075.50310.0191.2861.0421.586
NR2C2AP226839_at0.3550.1495.68710.0171.4271.0651.911
LETM1222006_at0.2820.1374.27510.0381.3261.0151.733
Table 10. Set of six prognostic genes.
GeneProbeBSEWalddfp-ValueHazard RiskLowerUpper
USP281552678_a_at0.443090.1554628.12333510.0041.5581.1482.112
SORT1212807_s_at0.1963010.0823055.68840810.0171.2171.0361.430
ALDH6A1221588_x_at0.4038880.1673325.82590410.0161.4981.0792.079
CSNK2A1212075_s_at0.3042480.1528043.96447410.0471.3561.0051.829
TOR1AIP1212409_s_at0.3136680.1695283.42340110.061.3680.9821.908
UBE2H221962_s_at−0.632610.11392130.8367912.8 × 10−80.5310.4250.664
Multivariate Cox regression for overall survival analysis (backward conditional).
Table 11. Biological function of the set of 16 prognostic genes.
GeneFunction
PAF1Positive regulation of cell cycle G1/S phase transition
USP28DNA damage response checkpoint and MYC proto-oncogene stability
SORT1Endocytosis
MAP7D3Microtubule cytoskeleton organization
FITM2Cytoskeleton organization and lipid and energy homeostasis
CENPOMitotic progression and chromosome segregation
PRCCRegulation of cell cycle progression
ALDH6A1Pyrimidine metabolism, RNA binding
CSNK2A1Cell cycle, apoptosis process
TOR1AIP1Regulation of nuclear membrane integrity, protein localization to nucleus
NUP98Role in the nuclear pore complex (NPC) assembly and/or maintenance
UBE2HATP binding, ubiquitin-protein transferase activity
UBXN7Ubiquitin binding
SLC44A2Positive regulation of I-kappaB kinase/NF-kappaB signaling
NR2C2APTranscription initiation from RNA polymerase II promoter
LETM1Regulation of concentration of calcium ion.
Based on data provided by UniProt database (https://www.uniprot.org/) (accessed on 4 March 2021).
Table 12. Correlation between PD-L1 and the clinicopathological features of the patients in the validation series (Tokai cases).
Predictors for High PD-L1p-ValueOdds Ratio95% CI for OR
LowerUpper
Sex Male0.2111.6990.7413.898
Age > 600.9941.0040.4152.429
Location
    Nodal (+spleen) (Reference)----
    Extranodal
      Waldeyer’s ring0.99900-
      Gastrointestinal0.7561.2420.3174.875
      Other extranodal0.4870.710.271.864
LDH High (>219)0.1152.0370.8414.933
Seric IL2RA high (>530)0.01612.4531.59897.065
ECOG Performance Status ≥ 20.2072.1110.6616.741
Clinical stage III or IV0.0063.5851.4528.851
Extranodal disease site > 10.7410.8250.2632.588
B symptoms0.0044.3331.61811.606
IPI HI+H0.0412.5791.0376.411
Non-GCB Subtype (Hans’s algorithm)0.0143.7571.30710.794
Epstein–Barr virus, EBER+0.0054.9311.62015.005
High RGS1 protein expression0.0153.0031.2417.264
Absence of clinical response to treatment0.0782.2840.9125.717
Binary logistic regression setup: dependent variable (PD-L1) and predictors (the clinicopathological features).
Table 13. Correlation between IKAROS and the clinicopathological features of the patients in the validation series (Tokai cases).
Predictors for High IKAROSp-ValueOdds Ratio95% CI for OR
LowerUpper
Sex Male0.2160.5490.2131.418
Age > 600.7681.1730.4053.4
Location
    Nodal (+spleen) (Reference)----
    Extranodal
      Waldeyer’s ring0.3170.330.0382.887
      Gastrointestinal0.8691.1330.2565.004
      Other extranodal0.4830.6610.2082.101
LDH high (>219)0.4070.6690.2591.728
Seric IL2RA high (>530)0.1890.4810.1621.433
ECOG Performance Status ≥ 20.6320.7110.1762.873
Clinical stage III or IV0.9550.9720.3682.566
Extranodal disease site >10.8020.860.2642.796
B symptoms0.6350.7390.2132.566
IPI HI+H0.7311.2060.4143.512
GCB subtype (Hans’s algorithm)0.0083.7561.40510.04
Epstein–Barr virus, EBER+0.2760.4180.0872.008
High RGS1 protein expression0.1120.4590.1761.199
Clinical response to treatment0.0319.7671.22677.796
Binary logistic regression setup: dependent variable (PD-L1) and predictors (the clinicopathological features).
Publisher’s Note: MDPI stays neutral with regard to jurisdictional claims in published maps and institutional affiliations.

