Article

SLASSY—An Assistance System for Performing Design for Manufacturing in Sheet-Bulk Metal Forming: Architecture and Self-Learning Aspects

Engineering Design, Friedrich-Alexander-Universität Erlangen-Nürnberg, Martensstraße 9, 91058 Erlangen, Germany
*
Author to whom correspondence should be addressed.
Submission received: 30 April 2021 / Revised: 6 July 2021 / Accepted: 7 July 2021 / Published: 8 July 2021

Abstract

:
Substantial efforts have been made to integrate manufacturing- and design-relevant knowledge into product development processes. A common approach is to provide the relevant knowledge to the design engineers using a knowledge-based system (KBS) that, in turn, becomes the engineering assistance system. Keeping the knowledge up to date is a critical issue, making knowledge acquisition a bottleneck of developing and maintaining KBS. This article presents a robust metamodel optimization and performance estimation architecture for developing and maintaining a KBS useful for design-for-manufacturing from the context of sheet-bulk metal forming. It is shown that the presented KBS or engineering assistance system helps achieve performing design-for-manufacturing, integrating both design and manufacturing knowledge. Using the presented approach helps overcome the bottleneck of knowledge acquisition and knowledge update through its self-learning component based on data mining and knowledge discovery.

1. Introduction

Design engineering can be regarded as the core process of product development related tasks in the engineering departments of modern companies, irrespective of whether they are active in the fields of mechanical, aerospace, automotive or plant engineering. However, in the 21st century, the working environment of design engineers is subject to a constant change. For example, the progressing globalization of formerly local markets, the increasing need for innovative and individualized mass products, the ever-shortening product lifecycles and many more aspects lead to a huge set of differentiated requirements. Companies that want to ensure future competitiveness must adapt their products and the inherent product development processes. Different approaches are available for that purpose, such as front loading [1,2], lean development [3] or concurrent engineering [4]. Another promising approach is knowledge-based engineering (KBE).
KBE means the intellectual penetration of the engineering design process, in as much as it is possible to formalize this process completely or at least sequentially [5]. The formalization is then the key to computer-aided support during tasks that are either of a repetitive character or that can only be fulfilled after extensive information and knowledge retrieval. Many different knowledge based systems (KBS) have been developed and successfully used (see Table 1) over the last decades.

1.1. KBS for the Assessment of Manufacturability

Both groups of tasks, no matter whether they are repetitive or knowledge-intensive, are crucially dependent on the availability of design-relevant knowledge. The potential of KBE to assist these kinds of design engineering tasks has been proven in different publications, for example, Cooper et al. [6], Skarka [7], Van der Laan [8], Lutz and Gerhard [9], Kratzer et al. [10], Verhagen et al. [11]. However, for this contribution the authors focus on KBE applications that assist during the assessment of a part’s manufacturability. Knowledge-based systems for manufacturability assessment have been developed inter alia by Lander et al. [12], Wartzack [13], Fu [14] and Kumar and Singh [15]. All these KBE applications share the objective of easing or enabling the knowledge exchange between manufacturing and design engineering departments. This is a prerequisite for design engineers to profit from a certain manufacturing process in terms of available design space (e.g., viable geometries, tolerances or surface qualities) and the ability to assess the manufacturing costs to compare processes. On the other hand, manufacturing engineers profit in that they receive hints about in which direction their process windows should be broadened.
The development of a KBS involves the crucial step of knowledge acquisition. This has always been the Achilles’ heel of knowledge engineering processes or the “bottleneck” as Feigenbaum [16] calls it. The objective is to elicit knowledge from different sources (e.g., experts, books, Computer Aided Design (CAD) models, spreadsheets) and formalize it to ensure computer processability in a KBE application. In terms of manufacturing related knowledge, today’s state-of-the-art is to acquire the design relevant knowledge only after the manufacturing process has been developed. For “classical” manufacturing technologies, design engineers can fall back on methods that are based on assured manufacturing knowledge, for example:
  • The well-known “inscribed circles method” of Heuvers [17] (see e.g., Campbell [18] for an English explanation of Heuvers’ circles) can be used to find and correct casting cross sections that require sufficient feeding via a riser. This method has been formalized for computer-aided support by Ransing et al. [19].
  • The manufacturability of bent sheet metal parts depends crucially on characteristics defined by the design engineer, such as sheet thickness, bending radius and material [20]. Meerkamm et al. [21] developed a KBS to assist the embodiment design of sheet metal parts.
  • In design for the machining (milling, turning) of metal parts, the golden rule ’never deviate from the primary tool axis’ Hodgson and Pitts [22] is still valid to ensure single-set-up machining [23]. For modern processes, such as free form machining, Korosec et al. [24] developed an approach to evaluate the manufacturability based on artificial neural networks.
However, in the case of the technology sheet-bulk metal forming (SBMF), the objective has to be to realize the acquisition and maintenance of the necessary knowledge simultaneously to the development of the manufacturing process to enable design engineers to profit from the potential in the early phases of the product development process (see Figure 1). SBMF is an example of a rather “young” manufacturing technology, the research on which started a few years ago (see Merklein et al. [25]) and which is still being developed. It also stands synonymously for plate forging [26]. SBMF unites the advantages of sheet and bulk metal forming processes to manufacture geometrically complex parts with variants and functional elements from thin sheet metal through cold forming. The manufacturing of sheet-bulk metal formed parts out of sheet metals requires the overlapping or the sequence of two- and three-axis strain and stress states. More technological details and exemplary parts are shown in Section 2.
Without anticipating parts of Section 3.3, where the different acquisition techniques are discussed, it can be said that, in the context of SBMF, a suitable automatic knowledge acquisition process is necessary to tackle the outlined objective. This is pursued with the Self Learning Assistance System, called SLASSY.
Table 1. Collection of examples for knowledge-based systems within the domain of engineering design.
NamePurposeUse CaseCAD IntegrationInstitutionYearSource
KS mfkengineering design system,
design for manufacturing
shafts, casted workpieces,
sheet metal parts
Pro/E®University of Erlangen1990[27]
WYCADengineering design systemhydraulic excavatorn. a.Zhejiang University of Hangzhou1990[28]
WISKONengineering design systemmechanical
drive train systems
n. a.University of Kassel1995[29]
Predictive
Engineering
engineering workbench for
multi-criteria design analysis
car door systemPro/E®University of Erlangen2000[13]
DEKASdecision making support toolsecurity facilitiesn. a.University of Strathclyde Glasgow2001[30]
RRCDPE 1 variant design systemuniversal
rotational connection
SolidEdge®, Unigraphics®University of Ljubljana2002[31]
ProKonagent-based system, pro-active
support of design engineer
shaft-hub connectionPro/E®University of Stuttgart2010[10]
LeanCostdesign-task oriented systemdesign cost estimationSolidEdge®University of Ancona2011[32]
PKA assistance
system
configuration and dimensioningfollow-on composite tools,
handling module
SolidWorks®Technical University of Vienna2011[33]
1 Rolling Rotational Connection Design Program Environment.

1.2. Contribution Structure

This contribution is structured as follows: First, the research on sheet-bulk metal forming is examined. The potential that this technology can offer to design engineers is highlighted. Afterwards, the state-of-the-art of knowledge based systems is highlighted, of course with a focus on the design engineering domain. Part of this is the description and discussion of knowledge acquisition methods. Afterwards, the architecture of SLASSY with its different components is explained, with a focus on the self-learning component. This paper shows an application of SLASSY for the synthesis and knowledge-based analysis of a sheet metal part that is to be manufactured with SBMF. Finally, a conclusion and an outlook are presented.

2. Research on Sheet-Bulk Metal Forming

The manufacturing technology sheet-bulk metal forming (SBMF) is being developed within the transregional collaborative research center 73 (SFB/TR 73), funded by the German Research Foundation (DFG). The SFB/TR 73 is a research initiative of three German universities, namely the University of Erlangen–Nuremberg, the Technical University of Dortmund, and Leibniz Universität Hannover. Different subprojects research SBMF related issues such as material flow, tool development, coatings, material models or adaptive finite element methods [34,35,36,37]. This contribution is part of the subproject ’simultaneous development of a self-learning engineering assistance system,’ which deals with the issue of design for sheet-bulk metal forming. Further details and publications can be found on the SFB/TR 73’s homepage, http://www.tr-73.de/index.php/en, accessed on 30 April 2021.
SBMF offers several potential advantages. From the point of view of the design engineer who is developing parts to be manufactured through SBMF, the following advantages can be highlighted:
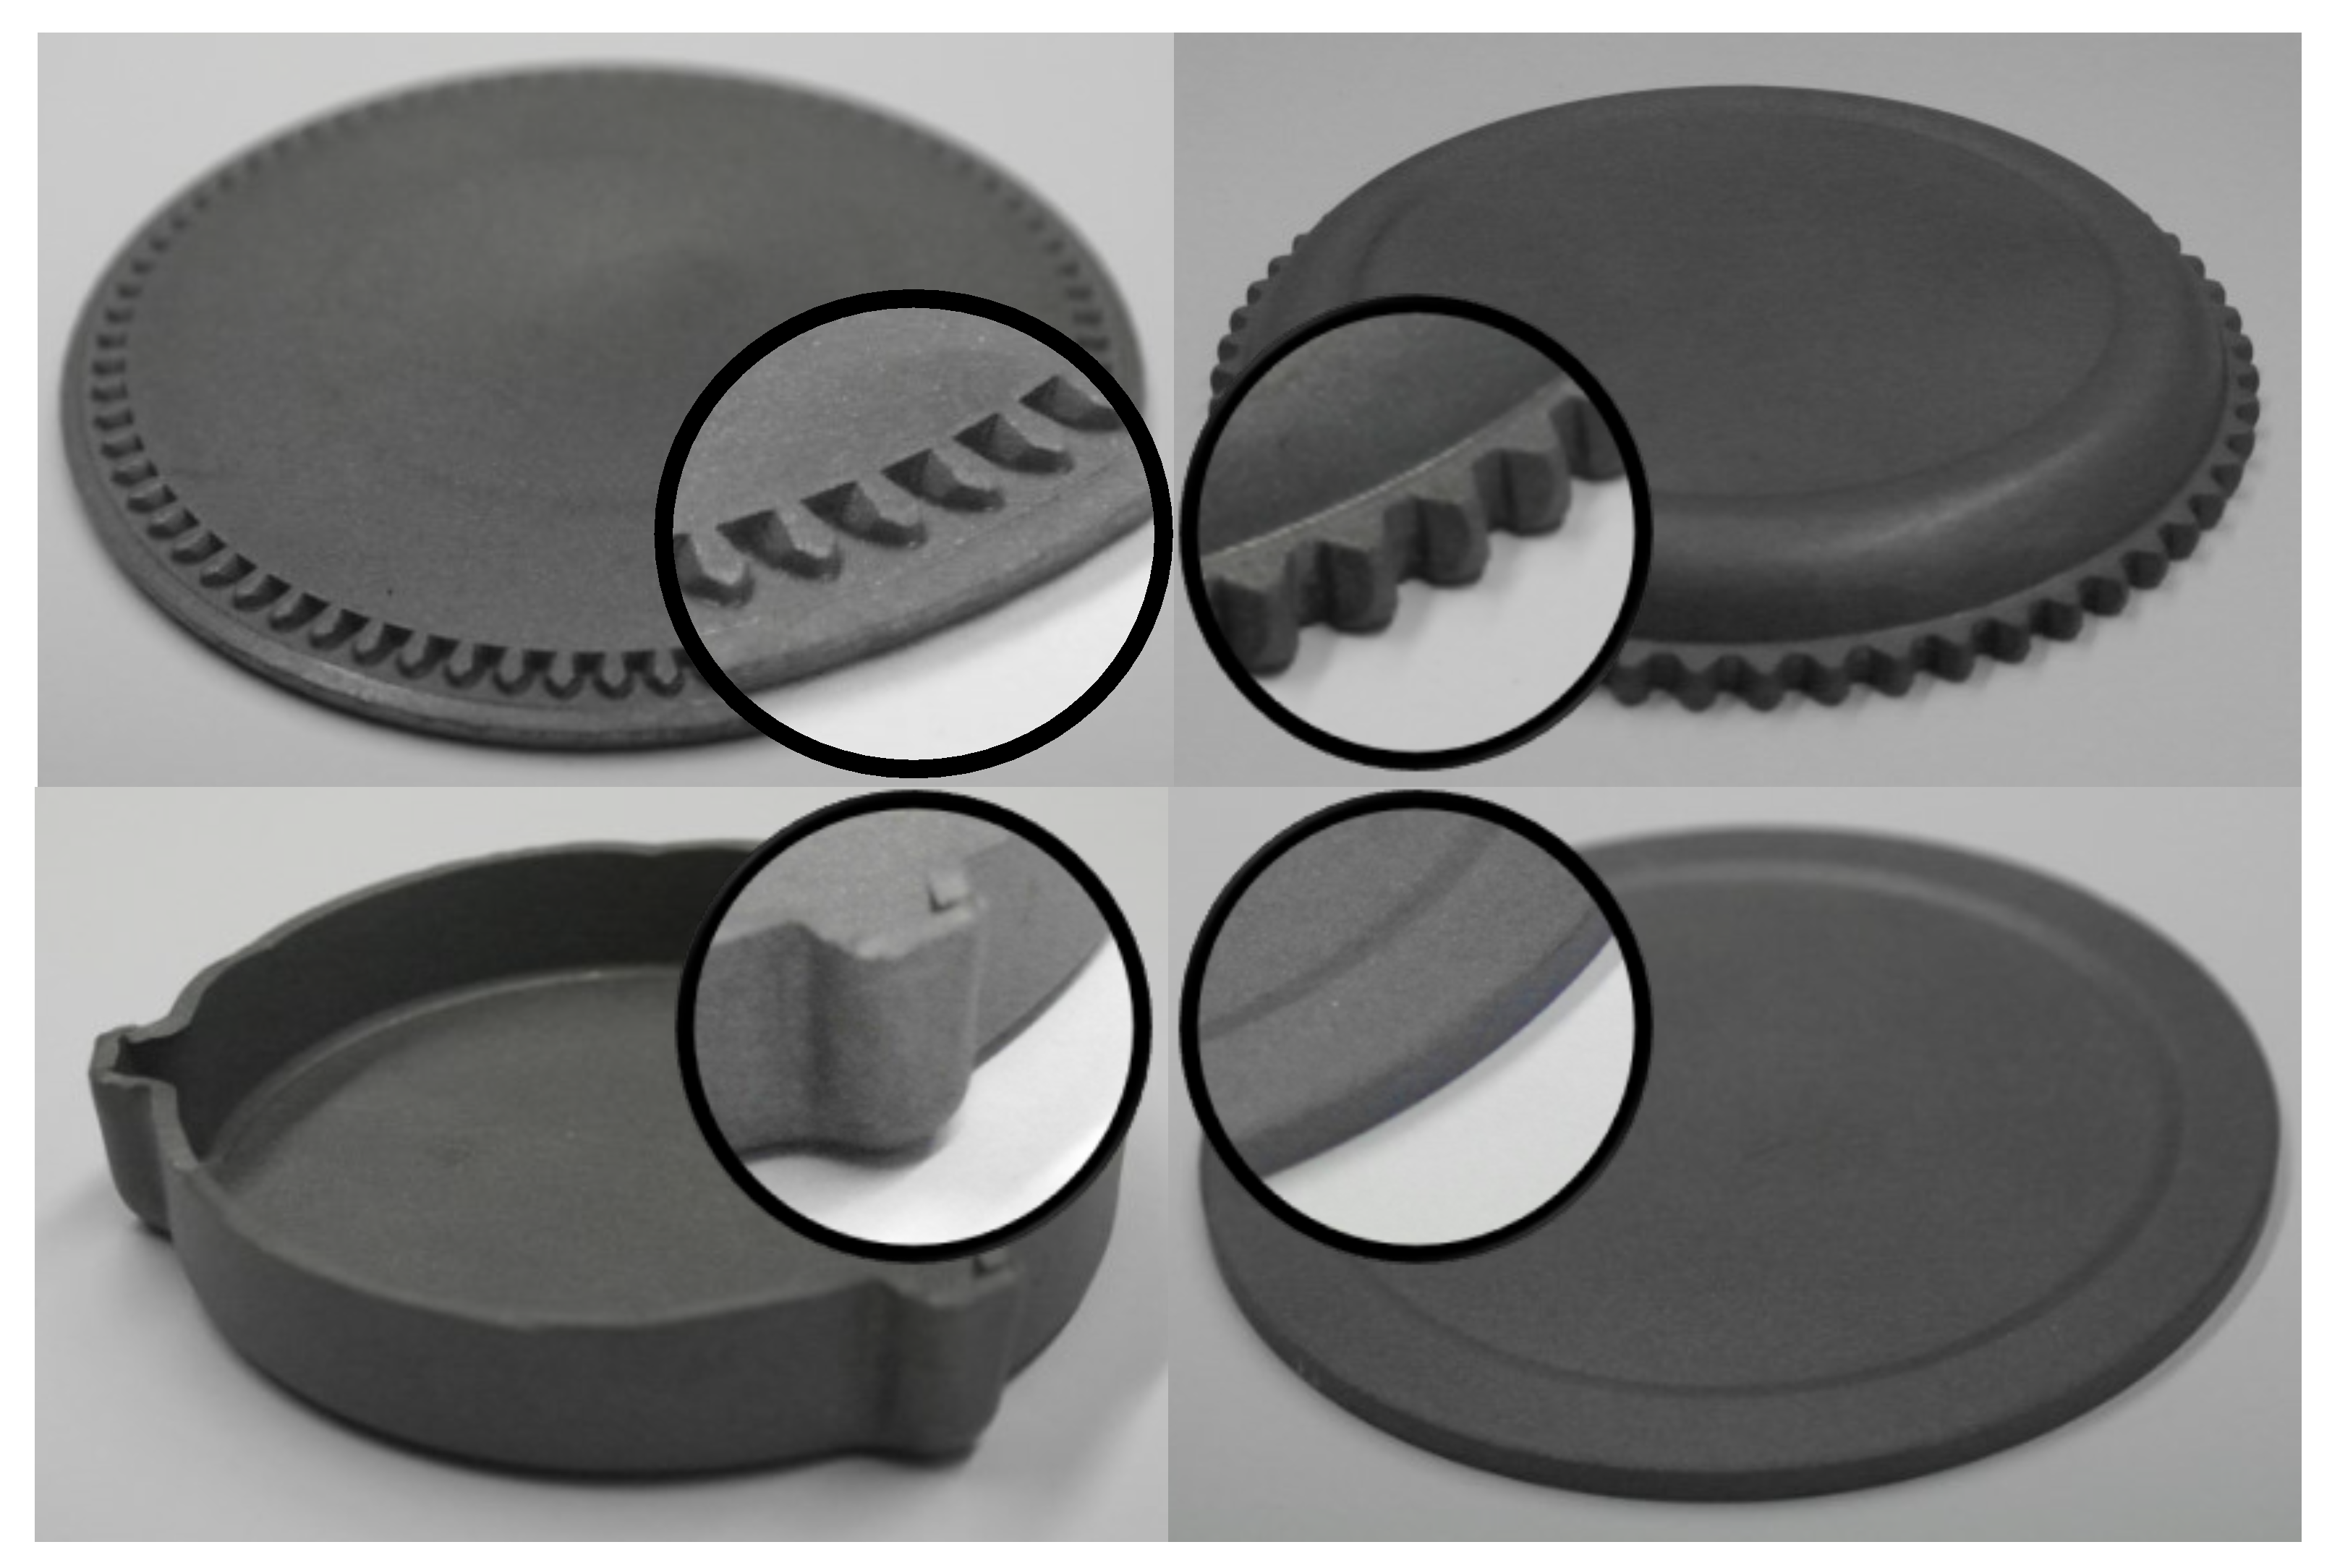
  • increased design freedom due to the merger of sheet and bulk metal forming;
  • maximizing functional density with different design features per part;
  • realization of narrow tolerances and thus increased robustness of the part’s function fulfillment;
  • easier adoption of part design to new requirements due to shortened process chain.
SBMF unites the advantages of sheet and bulk metal forming processes to manufacture geometrically complex parts with variants and functional elements from thin sheet metals (≤ 5 m m ) through forming. The manufacturing of such variants out of sheet metal requires the overlapping or the sequencing of two- and three-dimensional strain and stress states. Sample parts that are typical for SBMF and corresponding SDF are shown in Figure 2. These samples are the results of different subprojects within the SFB/TR 73, where prototype productions were performed. The samples cannot be used for a specific industrial application but with respect to their characteristics (diameter, sheet thickness, material), they mirror real parts, for example synchronizer rings, gear drums, disk gears, seat adjusters or control levers.

3. Knowledge-Based Systems in Engineering Design

Within computer science, the research domain of artificial intelligence (AI) has the objective of mapping the cognitive capabilities of the human mind or brain onto computers [38]. Leaving AI sophistications aside, knowledge-based systems in general can be seen as one main result of those research efforts. The marriage of AI and Computer Aided Design is often referred to as the hour of birth of KBE [39]. In fact, the term’s emergence can be dated back to the early 1980s. However, after three decades of development, KBE is no longer necessarily bound to CAD. Over the last years, the field of knowledge-based simulation has received particular attention. The objective is to assist the design engineer during the pre- and post-processing steps of Finite Element Analysis [40].

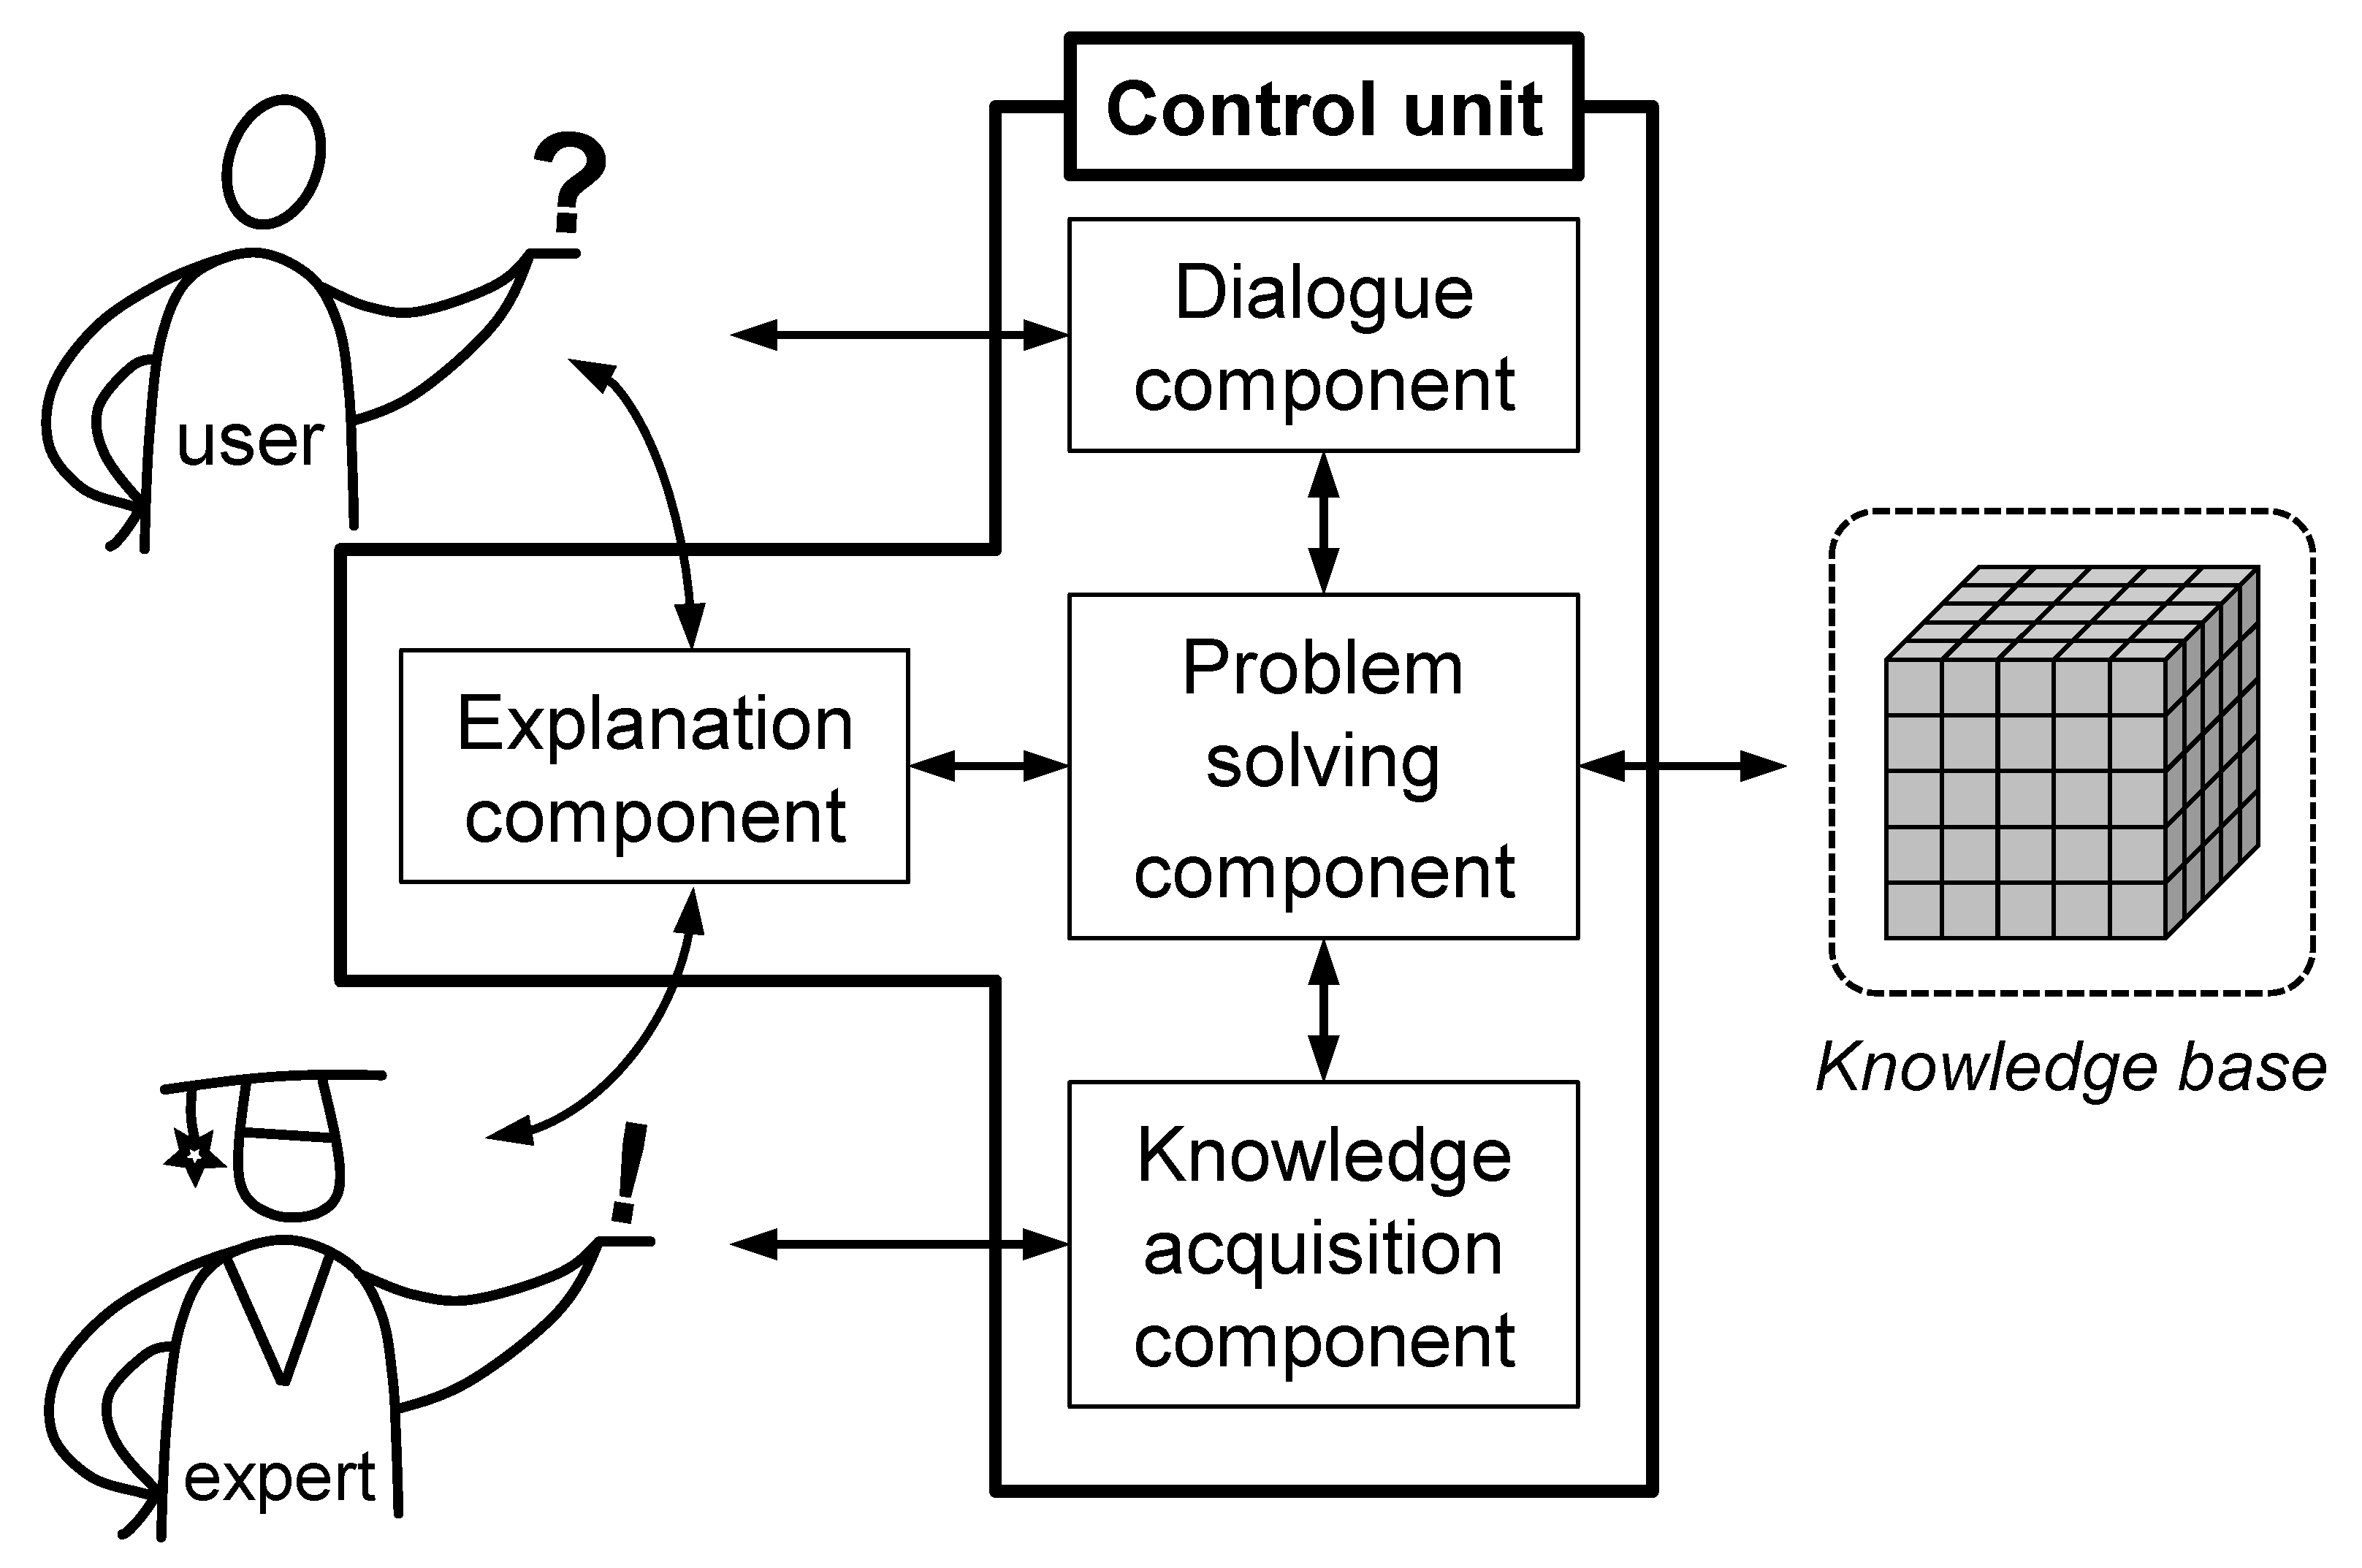
3.1. General Architecture of KBS

A KBS, as shown in Figure 3, consists of the core components of knowledge base and control unit. This structure corresponds to the functional separation of domain knowledge and the problem solving strategies of experts. Davis [41] divides the control unit further into different sub-modules:
  • The problem solving component is the interface between the knowledge base and the components that interact with the user and the expert. The processing of expert knowledge is defined by implemented inference strategies;
  • A dialogue component is necessary for the communication between the user and the assistance system. It enables the input of a user’s data and controls the output of results, suggestions or information;
  • The explanation component shows the KBS’ procedure to both the user and the expert. The former is enabled to comprehend the system’s decisions whereas the latter can search for errors in the knowledge base;
  • The knowledge acquisition component enables the transfer of knowledge from different sources into the knowledge base. New knowledge can be integrated and existing knowledge can be changed or removed.

3.2. Examples of KBS in Engineering Design

An extended literature review delivered a wide variety of KBS for different purposes in the domain of engineering design. Table 1 shows an overview of existing systems from different institutions that are related to engineering design or product development. However, it does not claim to be exhaustive. They cover different tasks of the product development process as it is described in [42], that is, planning and task classification, conceptual design, embodiment design and detailed design.

Engineering Design System mfk

The first prototype of the knowledge-based engineering design system mfk (the abbreviation mfk is derived from the German term ’methodisches und fertigungsgerechtes konstruieren,’ which literally corresponds to methodical design and design for manufacture) was presented in 1990. This KBS offers methodical assistance to the design engineer through the process of design for manufacture. It is possible to develop a principal solution of the product (conceptual phase) and continue this principle solution into the embodiment design phase and finally the detail design phase. The KBS mfk uses a CAD-system for visualizing the designed product and the analysis results. The core components are the synthesis tool, the analysis tool, the product data model and the characteristics editor, which was added at a later time. The synthesis tool is used for the product description and offers different design features in combination with specific semantics [43]. This means that they are related to corresponding manufacturing processes such as drilled holes, retention grooves, mould and draught angles or bend radius. The analysis tool contains methodical knowledge for the control of the analysis process and knowledge that is structured with respect to different classes such as problem solving knowledge (e.g., “how to calculate stresses?”), facts (e.g., material properties) and rules (e.g., “ff the bending stress is too high then increase the shaft diameter!”). The interaction between analysis and the synthesis tool is controlled by the product data model that contains product and process related information and the topological product structure. The user can integrate new design features and related knowledge via the characteristics editor. An analysis is initiated by the user after all necessary information has been entered into the system [27].

3.3. Knowledge Acquisition Methods

Every KBS development task needs to go through the process of knowledge acquisition for filling, and later on maintaining, the knowledge base [16]. The distinction of knowledge acquisition methods includes the classes direct, indirect and automatic. Within the process of direct knowledge acquisition, the expert formalizes his knowledge with the help of an acquisition component. This part of a KBS is a graphical user interface (GUI) where the expert can express the knowledge, for example, by means of formulas or rules (e.g., rules of thumb, equations). In the case of indirect acquisition methods, the acquisition component is substituted by the knowledge engineer. The knowledge engineer has the task of eliciting, structuring and formalizing the knowledge. In contrast to the direct and indirect methods, the automatic knowledge acquisition acquires knowledge from use cases, data or a text-based source such as books or protocols.
For the purpose of finding a suitable method for the knowledge acquisition module of SLASSY, the methods are discussed and compared using different criteria (cf. Table 2). A method spanning problem is the localization or identification of a suitable knowledge source and the availability of this source. For person-bound direct and indirect methods, this is emphasized by the fact that a basic willingness of the knowledge source or carrier (e.g., expert, experienced design engineer) to reveal his knowledge is necessary. For reasons of uncertainty regarding the quality of his knowledge and the fear of becoming exchangeable, he may refuse to reveal himself. Regarding sources for automatic acquisition purposes, a structured database is necessary to locate the knowledge. This can be achieved, for example, by implementing a company-wide Product Data Management (PDM) system. A further difficulty in acquiring human-bound knowledge is the fact that only a limited part is explicit, that is, formalized and computer interpretable. The majority is implicit and thus cannot be formalized or can only be limited. It is also mostly bound to specific situations and the expert cannot retrieve it at any time. The lack of verbalization and formalization leads to an incomplete and inconsistent direct or indirect knowledge acquisition. In addition, the communication between the expert and the knowledge engineer can be affected, for example, if the knowledge engineer is not familiar with the expert’s domain. Furthermore, the indirect and direct methods are, compared to an automatic acquisition, time- and cost-consuming, since several knowledge carriers have to be available and cannot work in daily business. Speaking of an indirect acquisition, the need for a knowledge engineer also increases costs. Regarding the mentioned issues, automatic acquisition techniques are not free but require necessary hard- and software as well as maintenance staff. However, these costs (e.g., IT-structure, licenses) are easier to estimate.

4. SLASSY—The Self-Learning Assistance System

SLASSY assists the design engineer during the development of sheet-metal parts with functional elements that are to be manufactured with sheet-bulk metal forming. The core activities of product development, that is, product synthesis and product analysis (in accordance with [44]), are supported. The synthesis step is enabled by offering feature elements for both primary design features (PDF) and secondary design features (SDF) to the design engineer. During the analysis step, a sheet-metal part consisting of a PDF (e.g., cup, plate, ring) and at least one SDF (e.g., tooth, strap, rib) is evaluated with regard to quantitative target values (e.g., forming force, contact ration, maximum plastic strain). These values are first specified by the manufacturing engineers since these values are used to estimate the manufacturability. The necessary knowledge for the analysis is acquired through a knowledge discovery in a database process (KDD) whereas the data are derived from SBMF simulations or experiments with parameter variation studies. It is worth noting that the knowledge discovery in the database process is very similar to the more popular term data mining, which has arisen in recent years. The explicit form of the design-relevant knowledge is represented by a metamodel, a result of the KDD process [45]. Further terms according to the literature are surrogate model, regression model or prediction model [46]. Each designation has its own justification, whereas metamodel describes the fact that a model of a model (e.g., simulation model, experiment model or set-up) is used. This is also the main difference to a machine learning model, where you want to learn the input–output correlation only through a given dataset. The overall architecture of SLASSY is suitable for supporting the described aspects including the management of the simulation data and the design-relevant knowledge derived from these data. It is depicted in Figure 4 and explained in detail in the following sections, whereas a focus is set on the self-learning component.

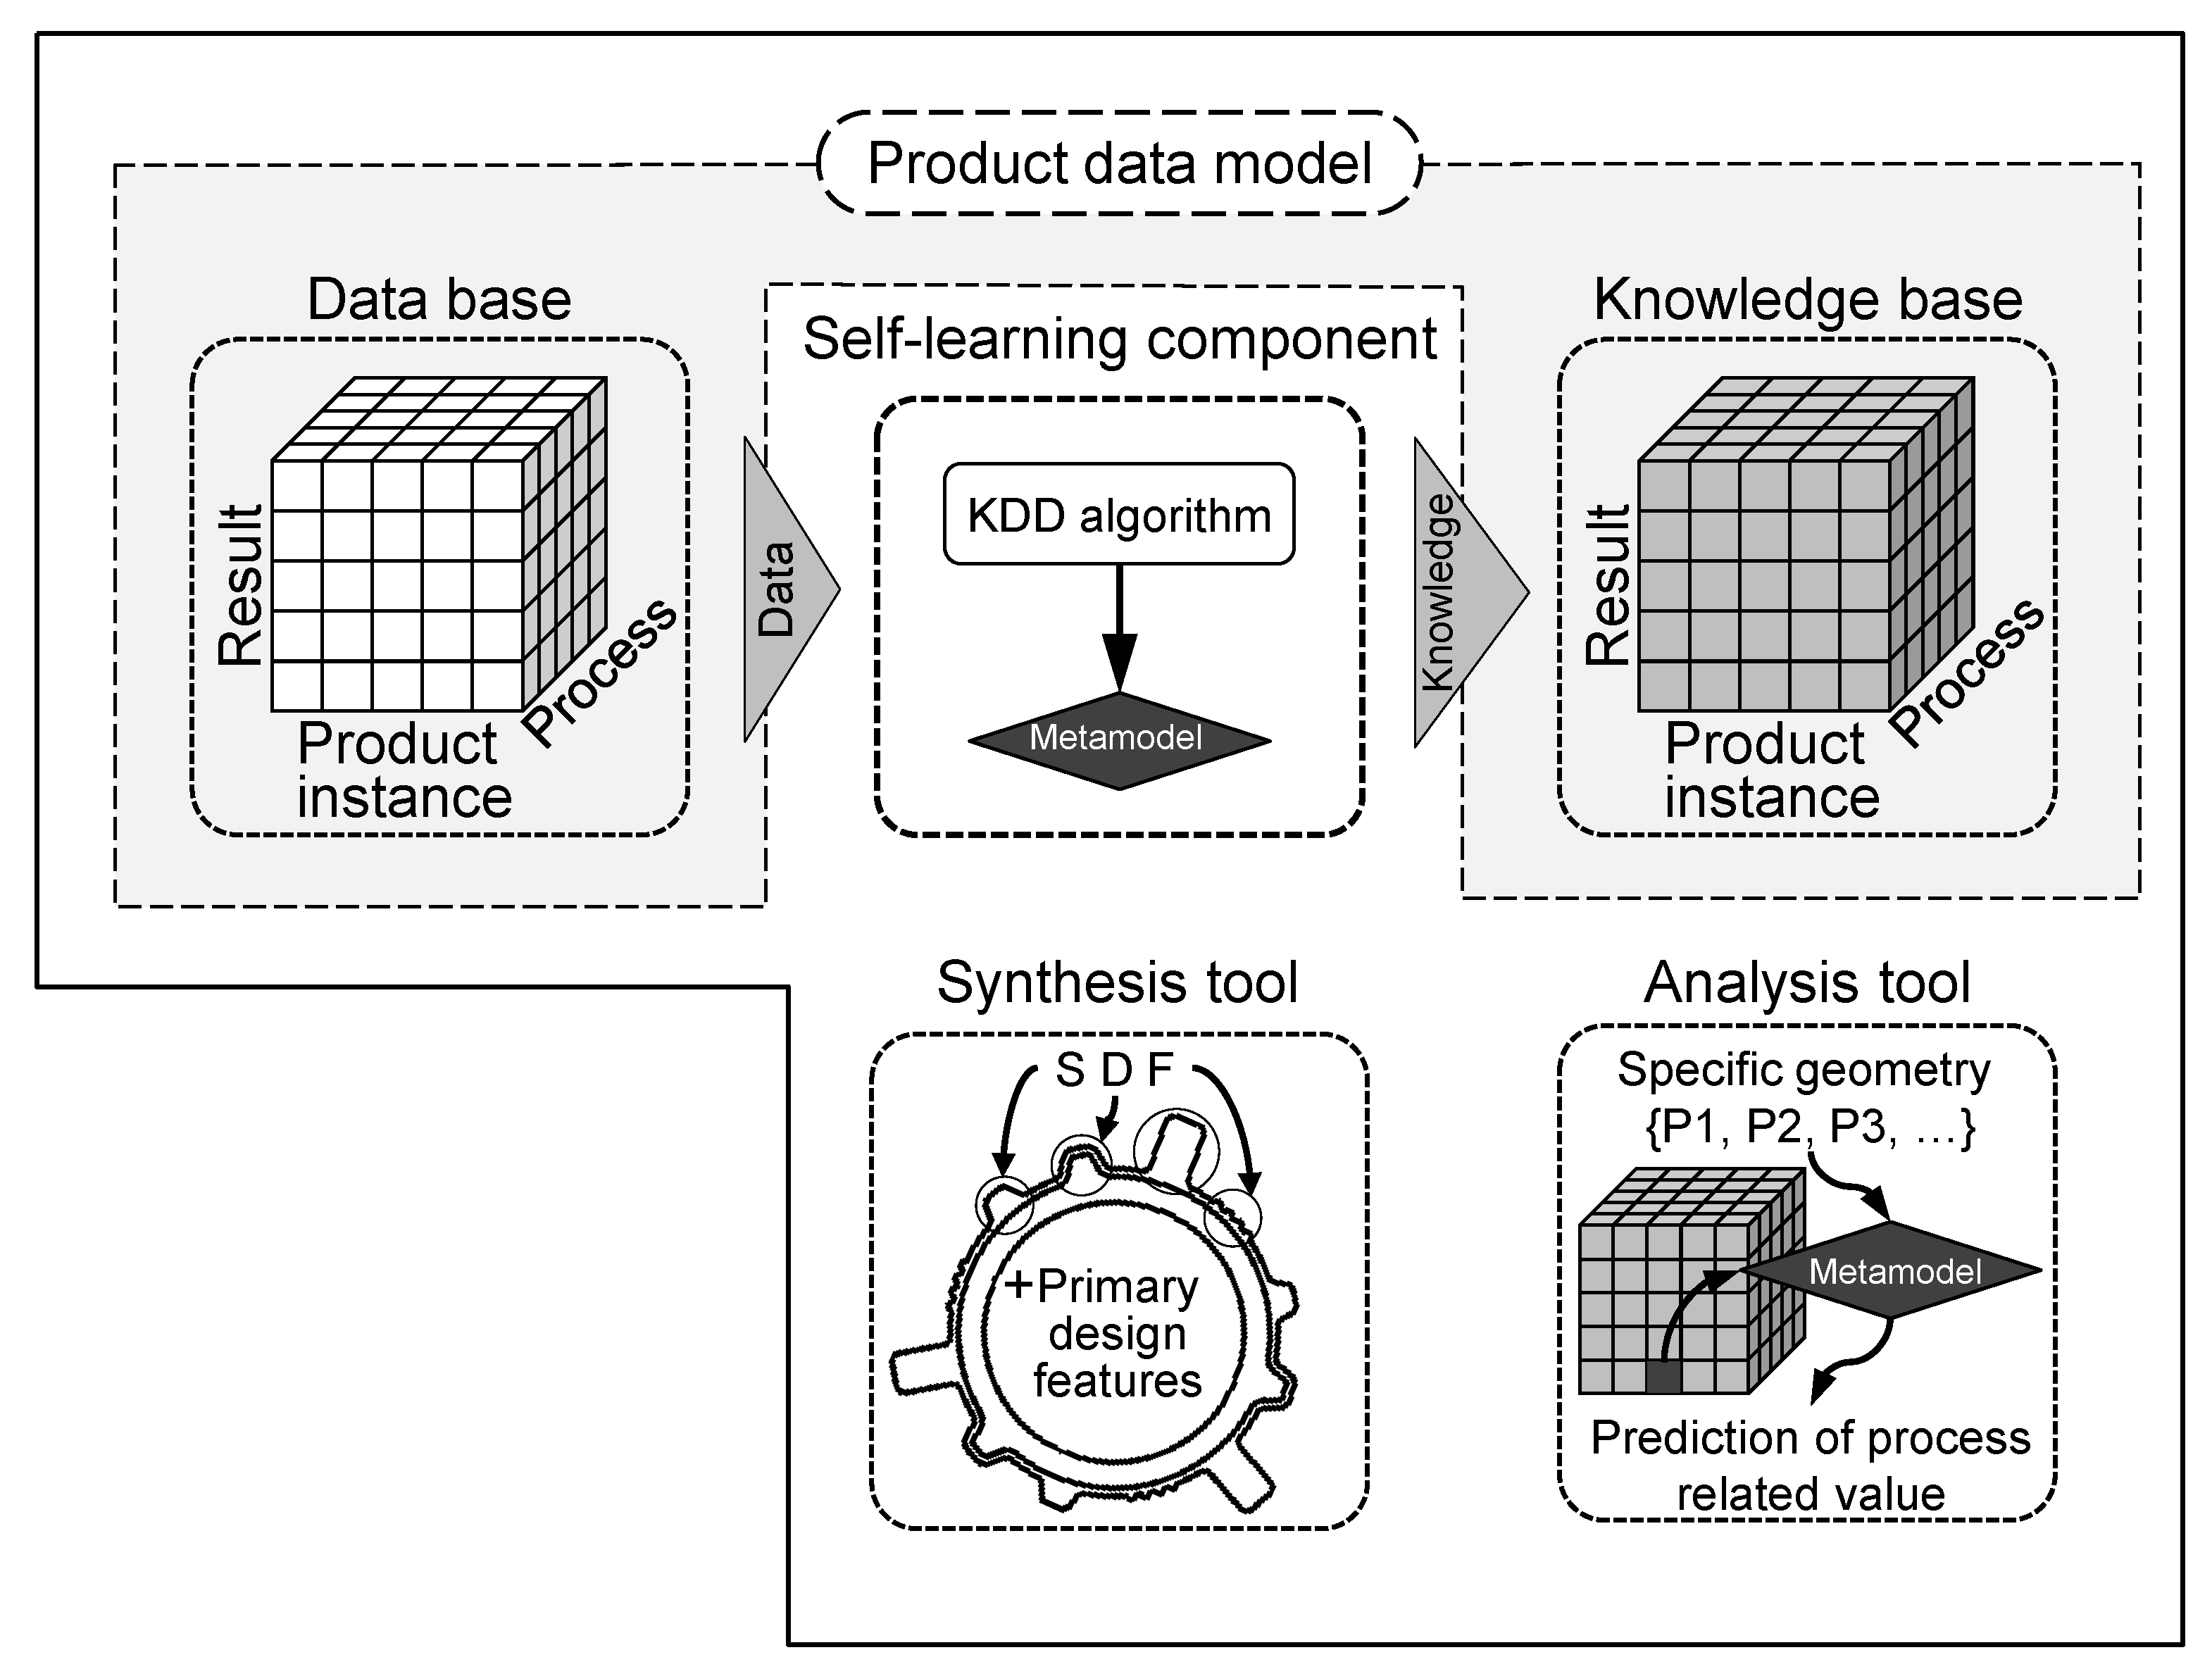
4.1. The Product Data Model

Suitable datasets for the present purpose are created in sub-projects of the SFB/TR 73 that focus on forming technology related issues such as tool design, material flow during the forming process or the impact of friction on the forming process (see [25]). This leads to a heterogeneous character of the data that is to be managed. The basis for efficient data management is a suitable product data model. The product data model of SLASSY consists of several entities aggregated in classes and implemented in a relational data basis framework. The relevant data as stored in this framework describe different issues such as: geometric and process-related parameters of different forming tool concepts, specific manufacturing processes (deep-drawing, extrusion, incremental forming etc.) and geometry information about a part with its PDF and SDF. Every experiment or simulation run of the mentioned parameter variation studies is stored within the product data model and is logically connected to the specific instance of a sheet-metal part. For each part, the self-learning component acquires the design-relevant knowledge by means of a metamodel, which is linked to the specific instance of the part. Hence, the product data model also includes the knowledge base for the later product analysis step.

4.2. Synthesis and Analysis Tool

The synthesis step is supported by offering feature elements for both the primary design features (PDF) and the secondary design features (SDF) to the design engineer. Depending on the CAD-system (in this research CATIA V5-6) these elements are designed as user defined features (UDF). Within the GUI, the designer selects the PDF of his choice. The availability of a design element is checked with the product data model during the start of SLASSY. The selected UDF is imported into the CAD-system and displayed. The design of the PDF is adopted via a context menu if needed. Afterwards, the SDF are attached to the PDF. Due to reference elements (planes, lines, points), the geometry of an SDF is always positioned correctly and changes its position if the shape (e.g., the diameter) of the PDF is changed. Like the PDF, the geometry of an SDF can be adopted according to requirements that are to be met. All geometrical values (tooth width, strap length, flank angle, etc.) are stored in the product data model for further use.

4.3. The KDD-Based Self-Learning Component

The overall objective of the self-learning component is to acquire the design relevant and manufacturing related knowledge by means of a KDD process. The result of this process is a metamodel that is used to predict process parameters related to the manufacturability. Furthermore, design engineers need information about the prediction quality as it might be the basis of a business-crucial decision in an early phase of product development. However, this information has to be reliable and robust.
Figure 5 shows the overall self-learning process. The first step ➀ is to download the input data from the database. These data are elicited in advance from experiment- or simulation-based parameter studies. Within these studies, manufacturing experts choose input parameters (e.g., length, width or angle of SDF) to be varied according to a specific design of experiment and research the behaviour of relevant process parameters (e.g., forming force, plastic strain) called target values. The input data are then processed by the ROPE step ➁ (robust meta model optimisation and performance estimation, see Section 4.3.3), which provides a set of metamodels together with their estimated performances. Afterwards, the most reliable (the “best”) metamodel is chosen by means of statistical tests ➂ (Section 4.3.4). The result of the self-learning process is a metamodel and the respective performance of the metamodel, which is stored in the knowledge base ➃. The process is repeated for every target value in the input data ➄ that is assigned to a specific part.

4.3.1. Implemented Metamodel Algorithms

There are several metamodel algorithms for approximation problems, therefore some requirements of metamodels for use within SLASSY have been defined (see Section 4): The metamodel has to predict numerical values as a result of the numerical input data and product developers need to be able to comprehend the metamodel’s prediction, which means it has to be understandable and interpretable as well as verifiable [48]. In SLASSY, four metamodel algorithms are implemented: Linear regressions [49], Polynomial regressions [50,51], M5P regression model trees [52,53] and M5Rules [48]. In particular, they can model non-linear system behaviour but are still interpretable by design engineers, a property that is very important for the acceptance of knowledge-based systems. An excerpt of an M5P regression model tree is shown in Figure 6. For more specific use cases, as for example with so-called local metamodels, deep learning methods are implemented [47], as they have shown even better prediction quality.

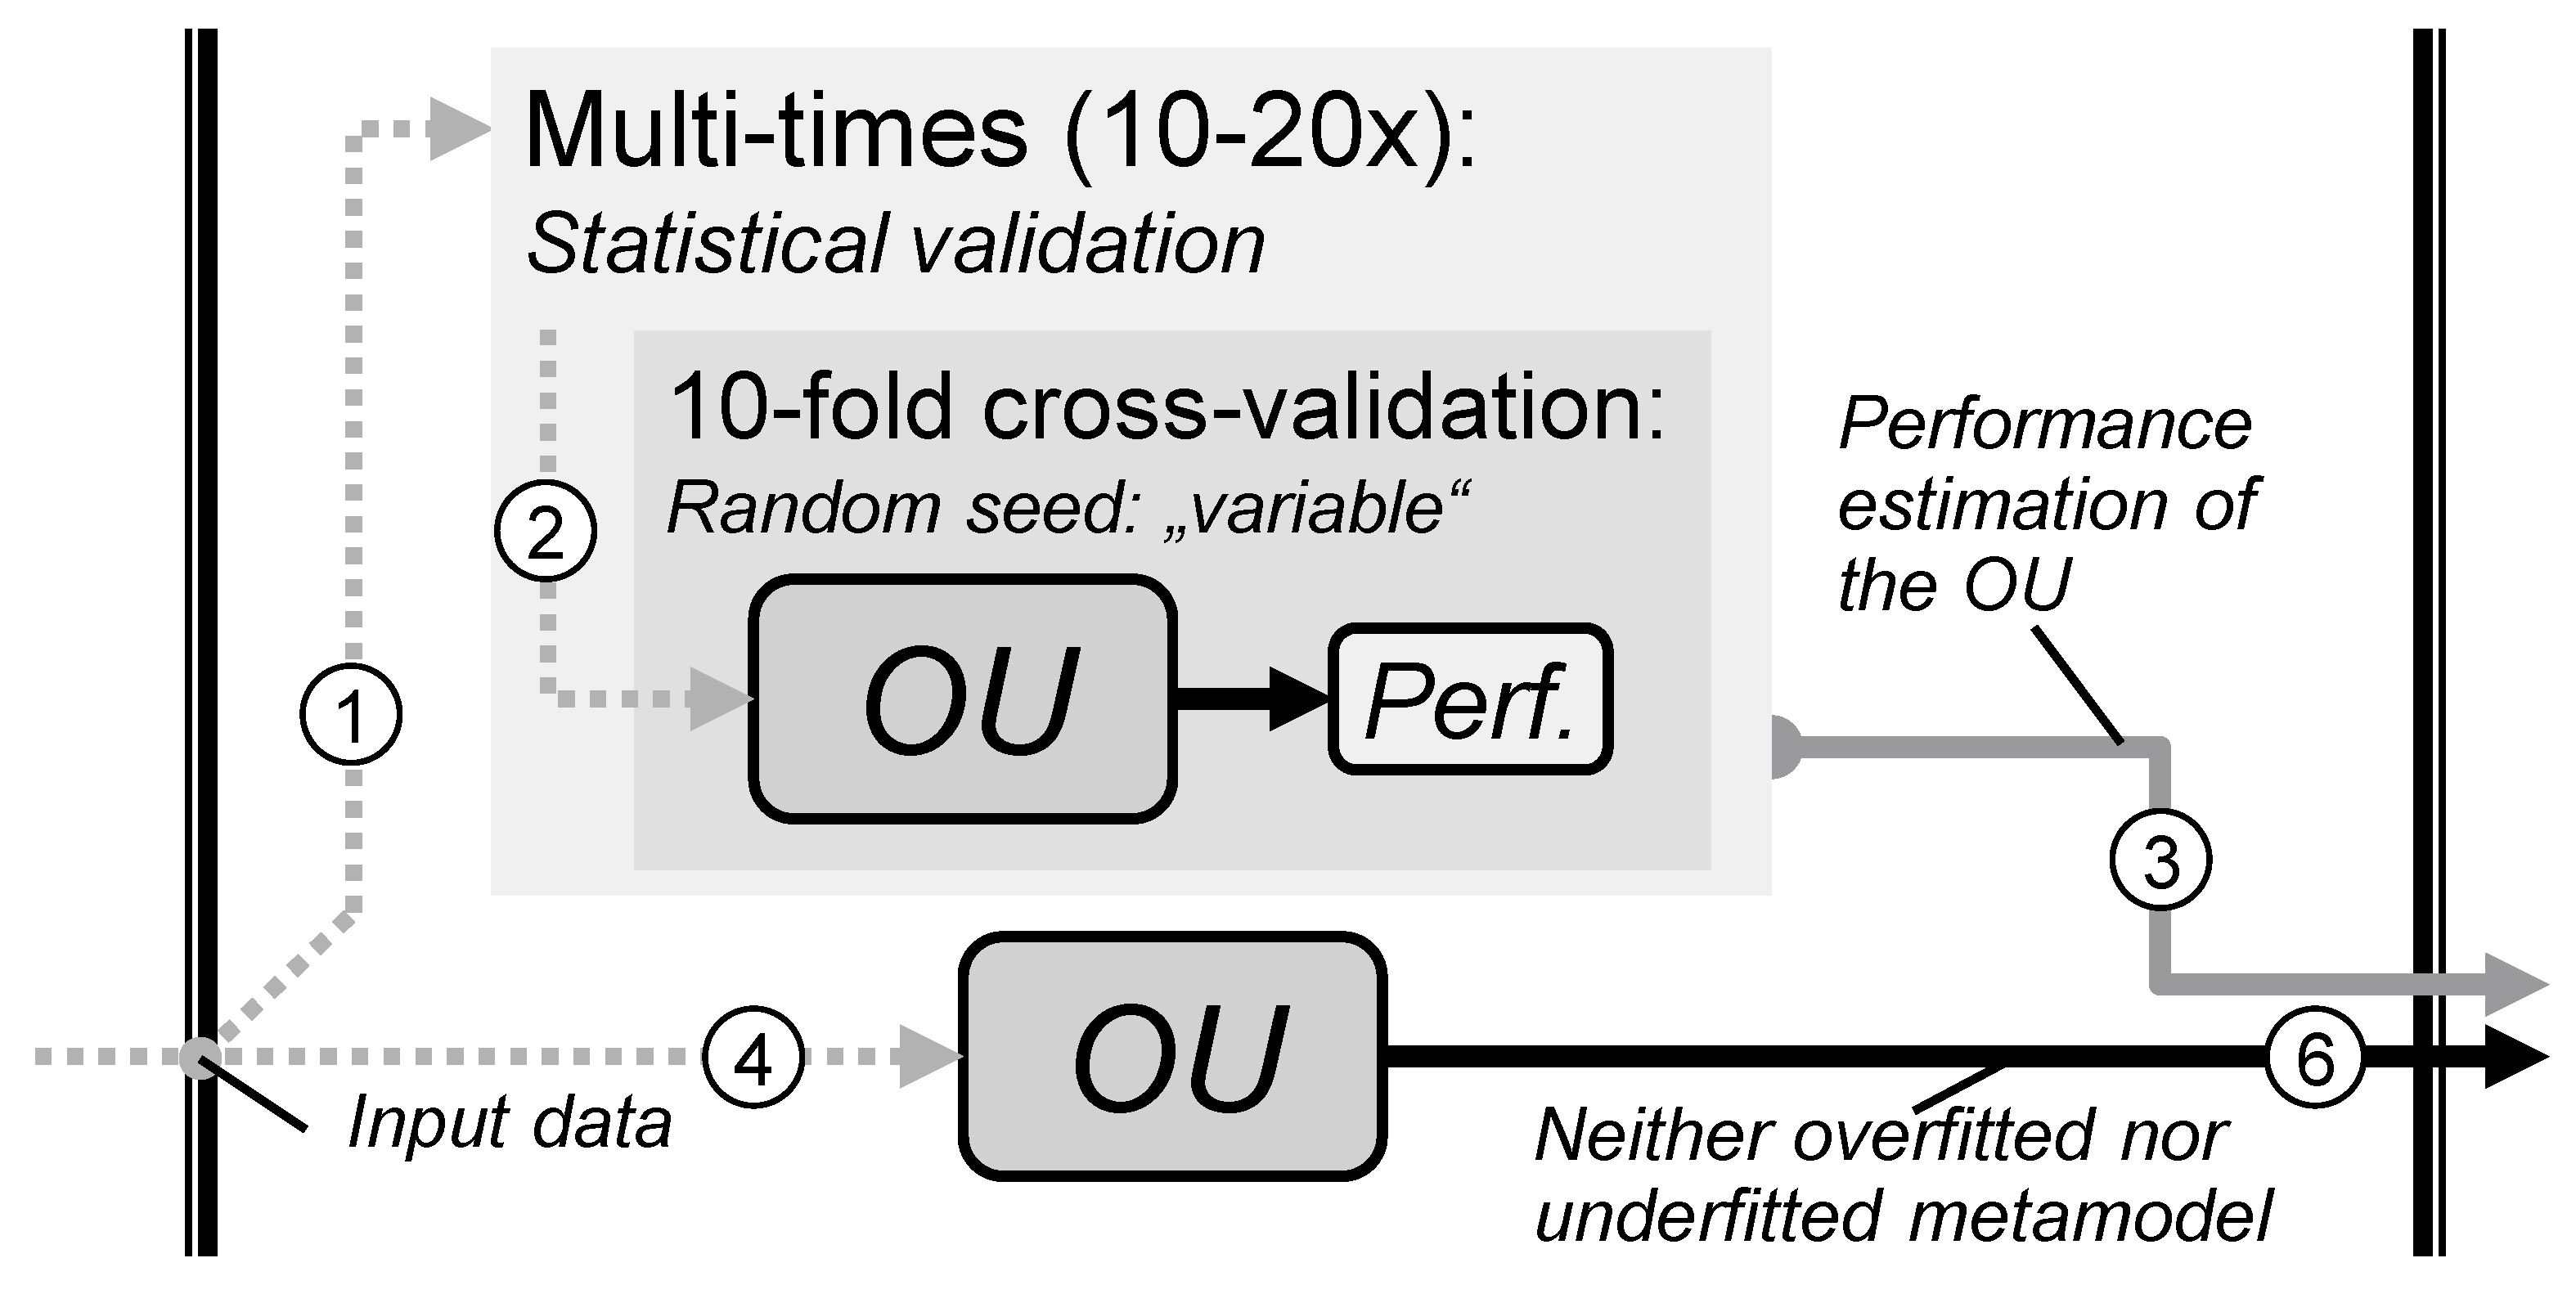
4.3.2. Evaluating the Prediction Quality of Metamodels

In practice, it is not enough to compute only the metamodel. We need to know the accuracy of the prediction of future or unknown data to give product developers an idea of the reliability of the metamodel on the one hand and to have a measure against which to compare metamodel algorithms on the other hand.
Many different performance measures are available in the literature. The most important for SLASSY are the mean absolute percentage error (MAPE) [54], coefficient of prognosis (CoP) [55] and root mean-squared error (RMSE) [49]. If the performance of a metamodel towards the data used for training is bad, it is called underfitted. In contrast, overfitted means that the model learned the data exactly and is not able to generalise; this means it is only able to replicate the data for all different inputs and cannot make meaningful predictions with new data. So SLASSY uses two techniques to generate neither overfitted nor underfitted metamodels: Optimisation is used to find a hyperparameter set for a metamodel to fit the training data best (counter-measure for underfitting). This hyperparameter set controls the training of a metamodel and should not be mixed up with the aforementioned input or output parameters. Examples of these hyperparameter sets are mentioned later on. The metamodel performance is estimated with a specific validation procedure called 10-fold cross-validation [49] (counter-measure for overfitting). This process is described in detail in the following section.

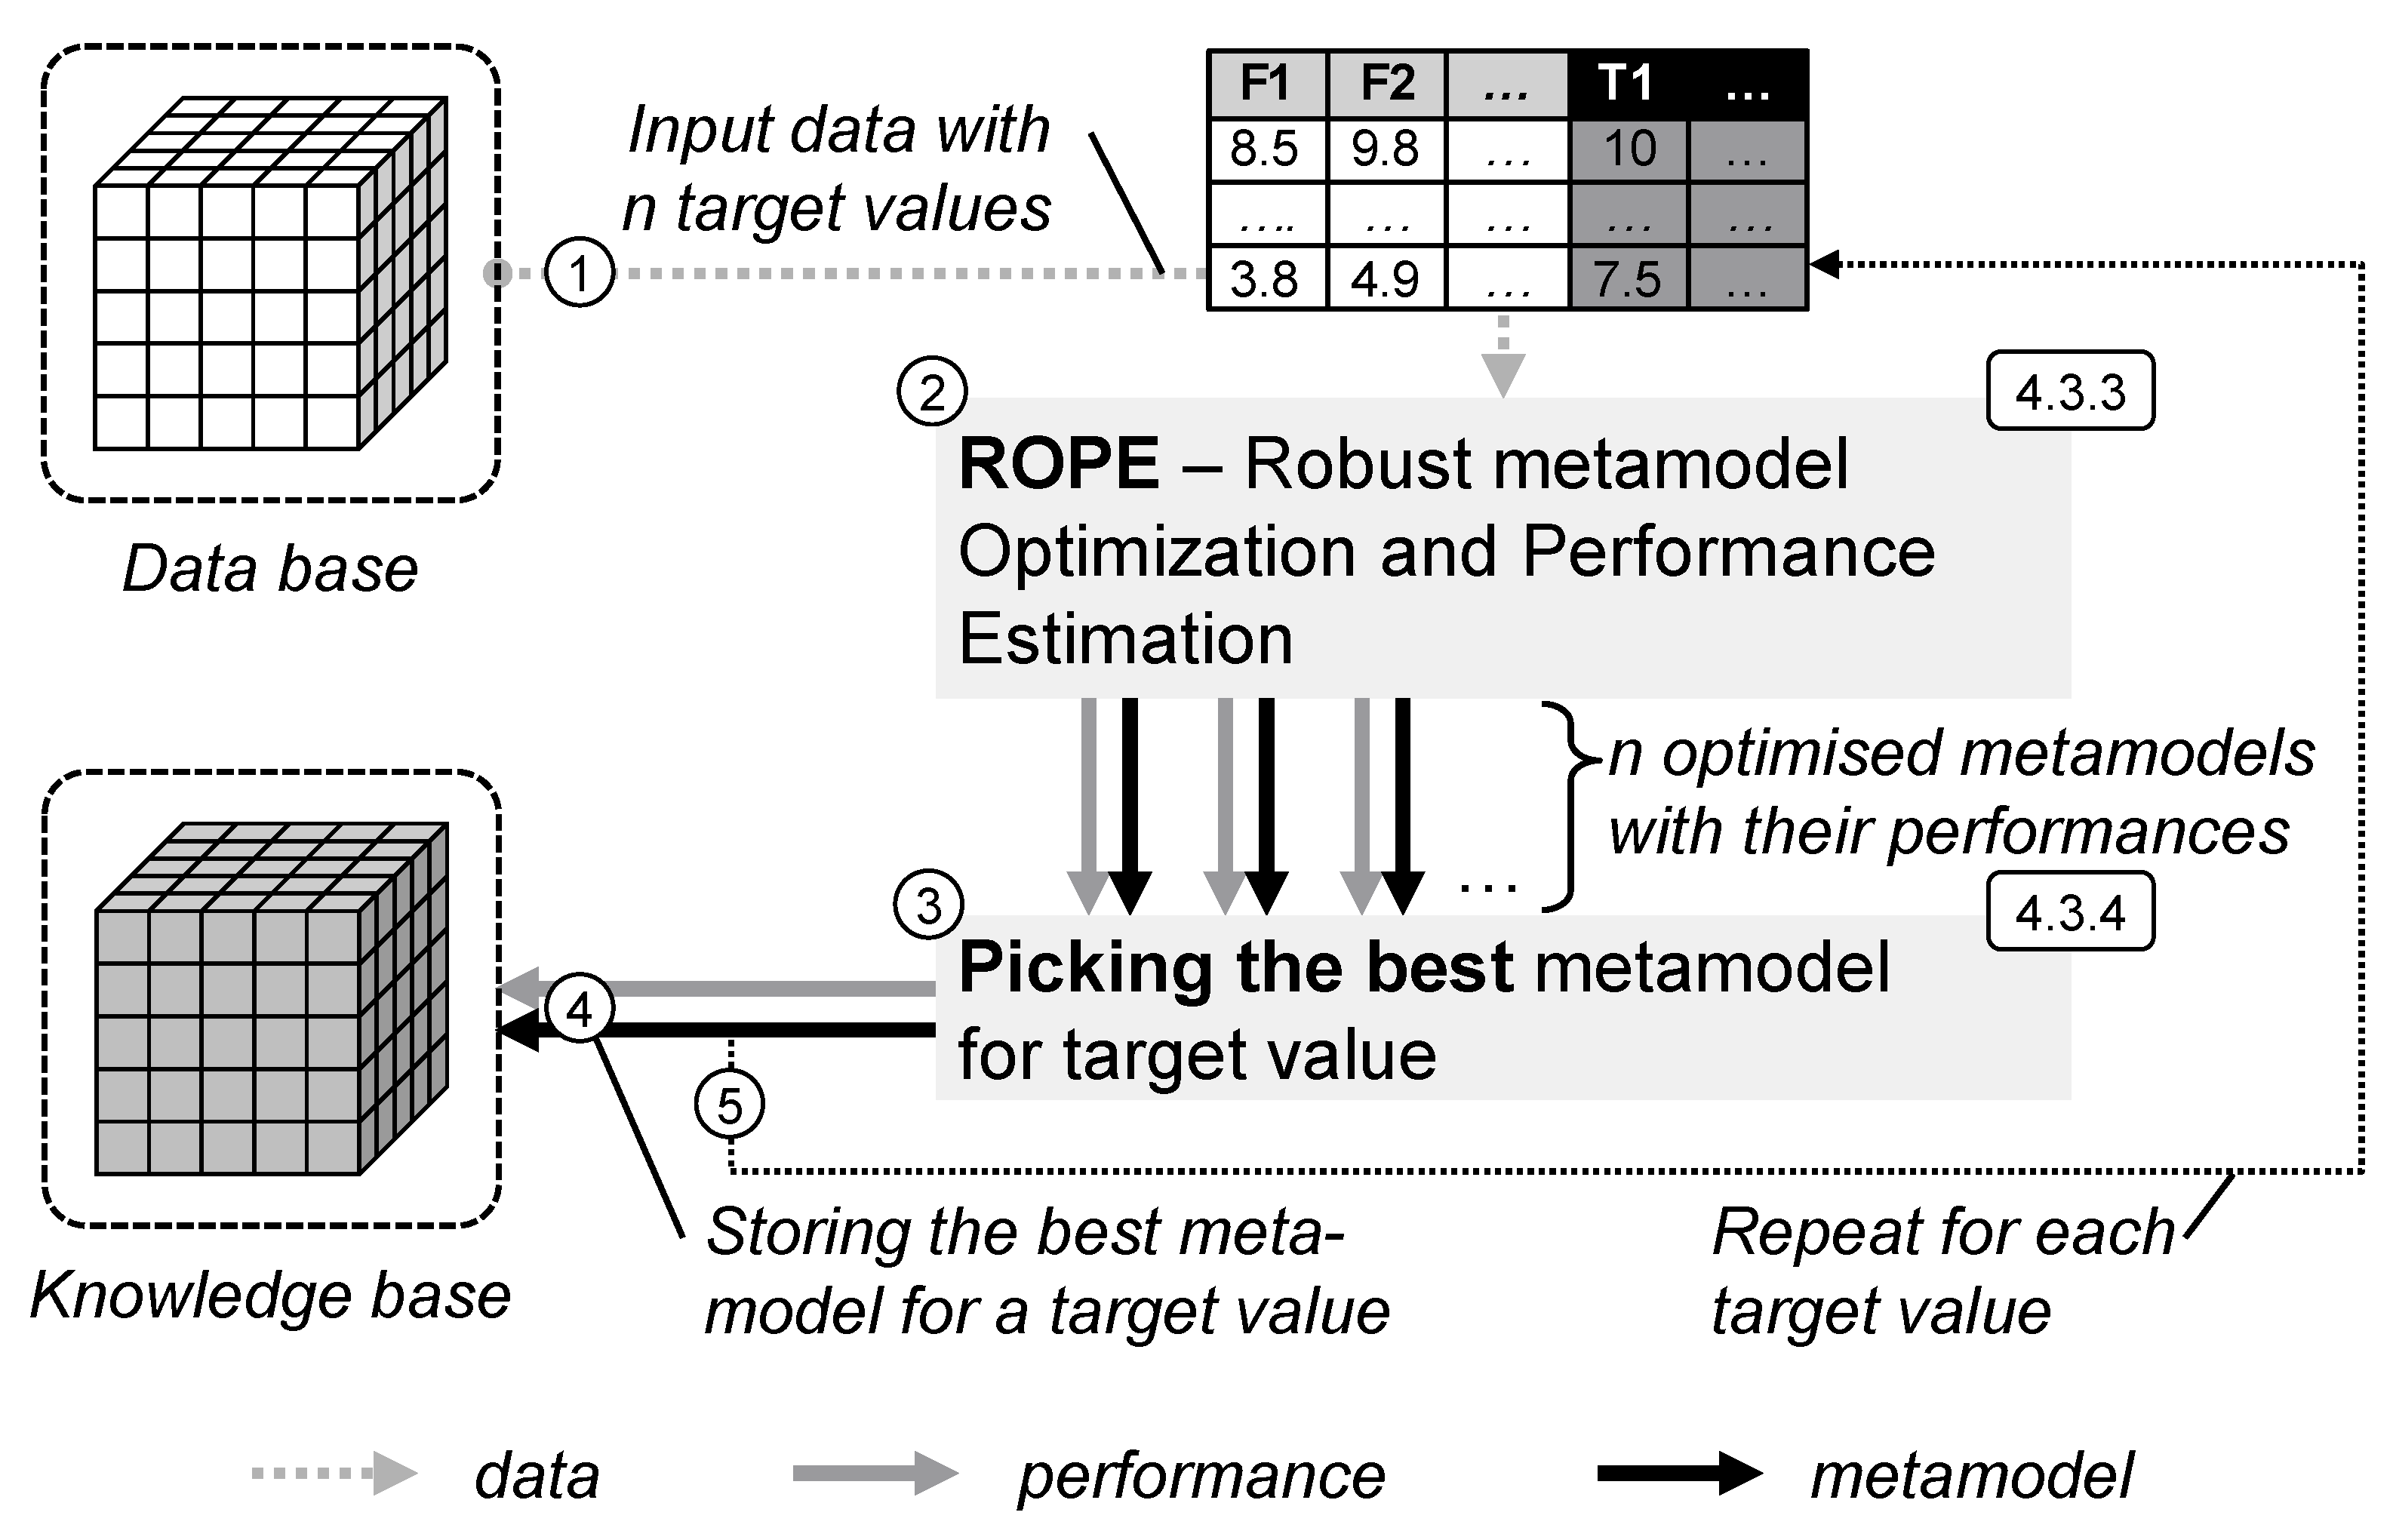
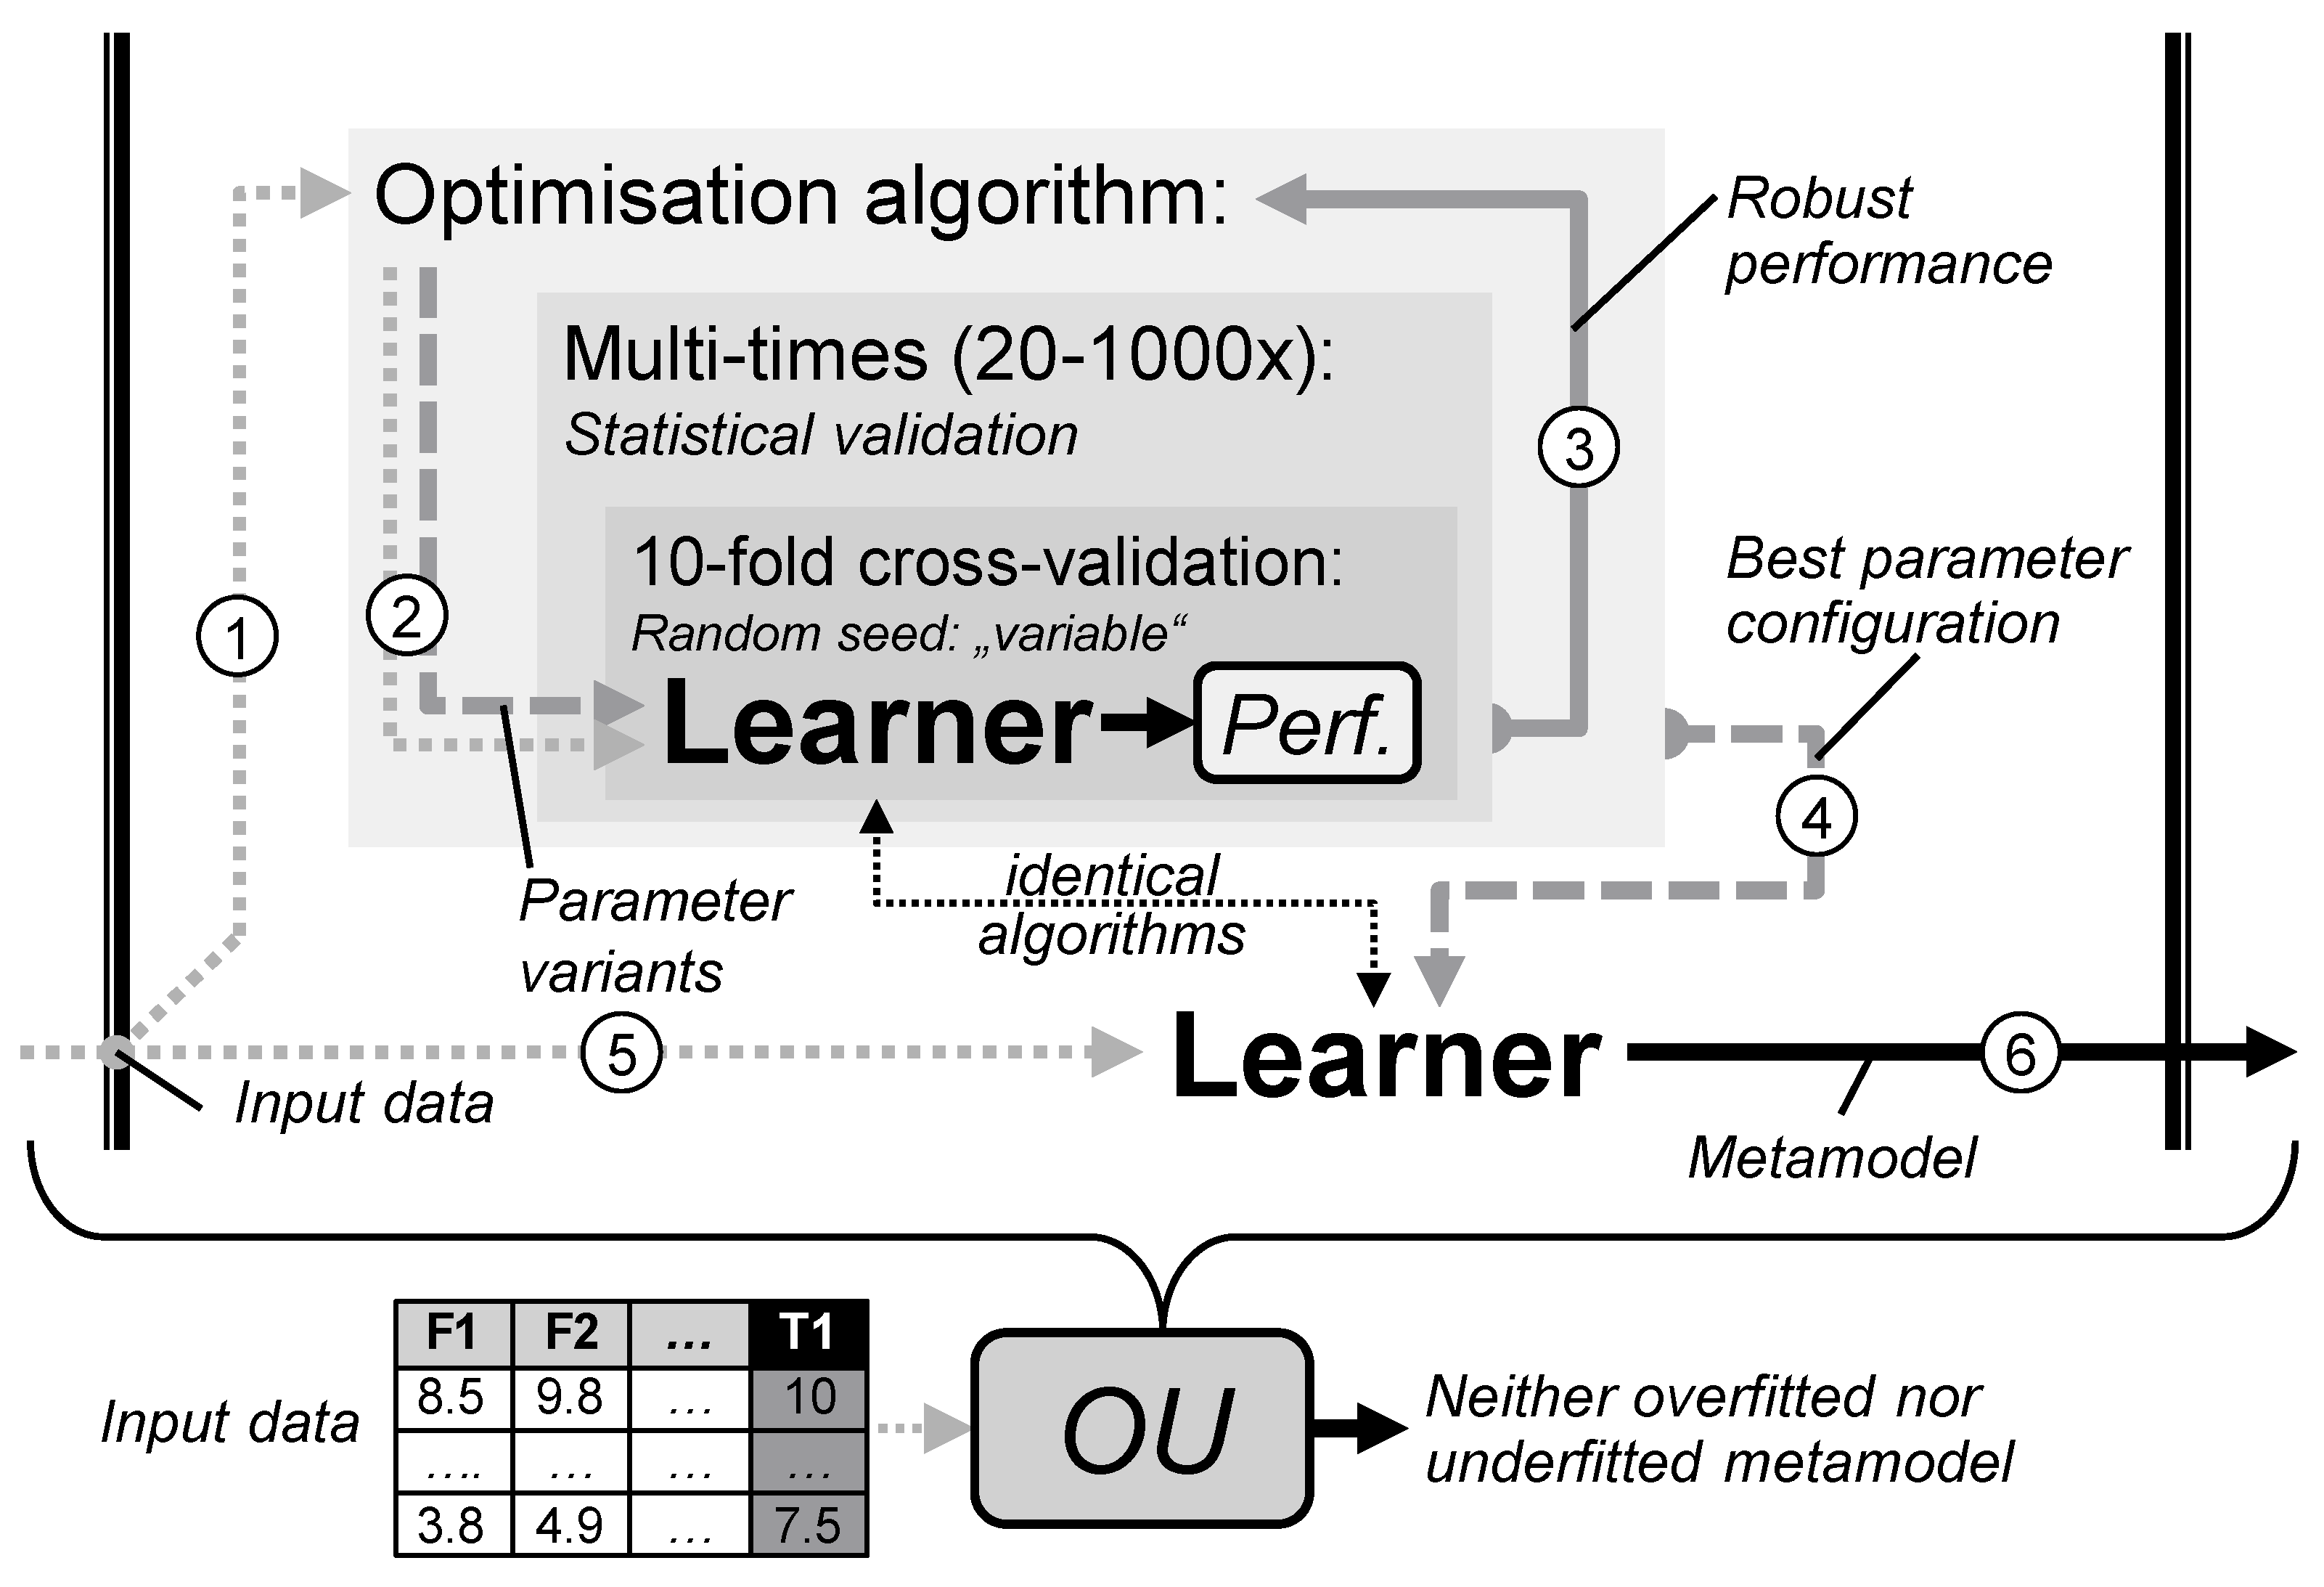
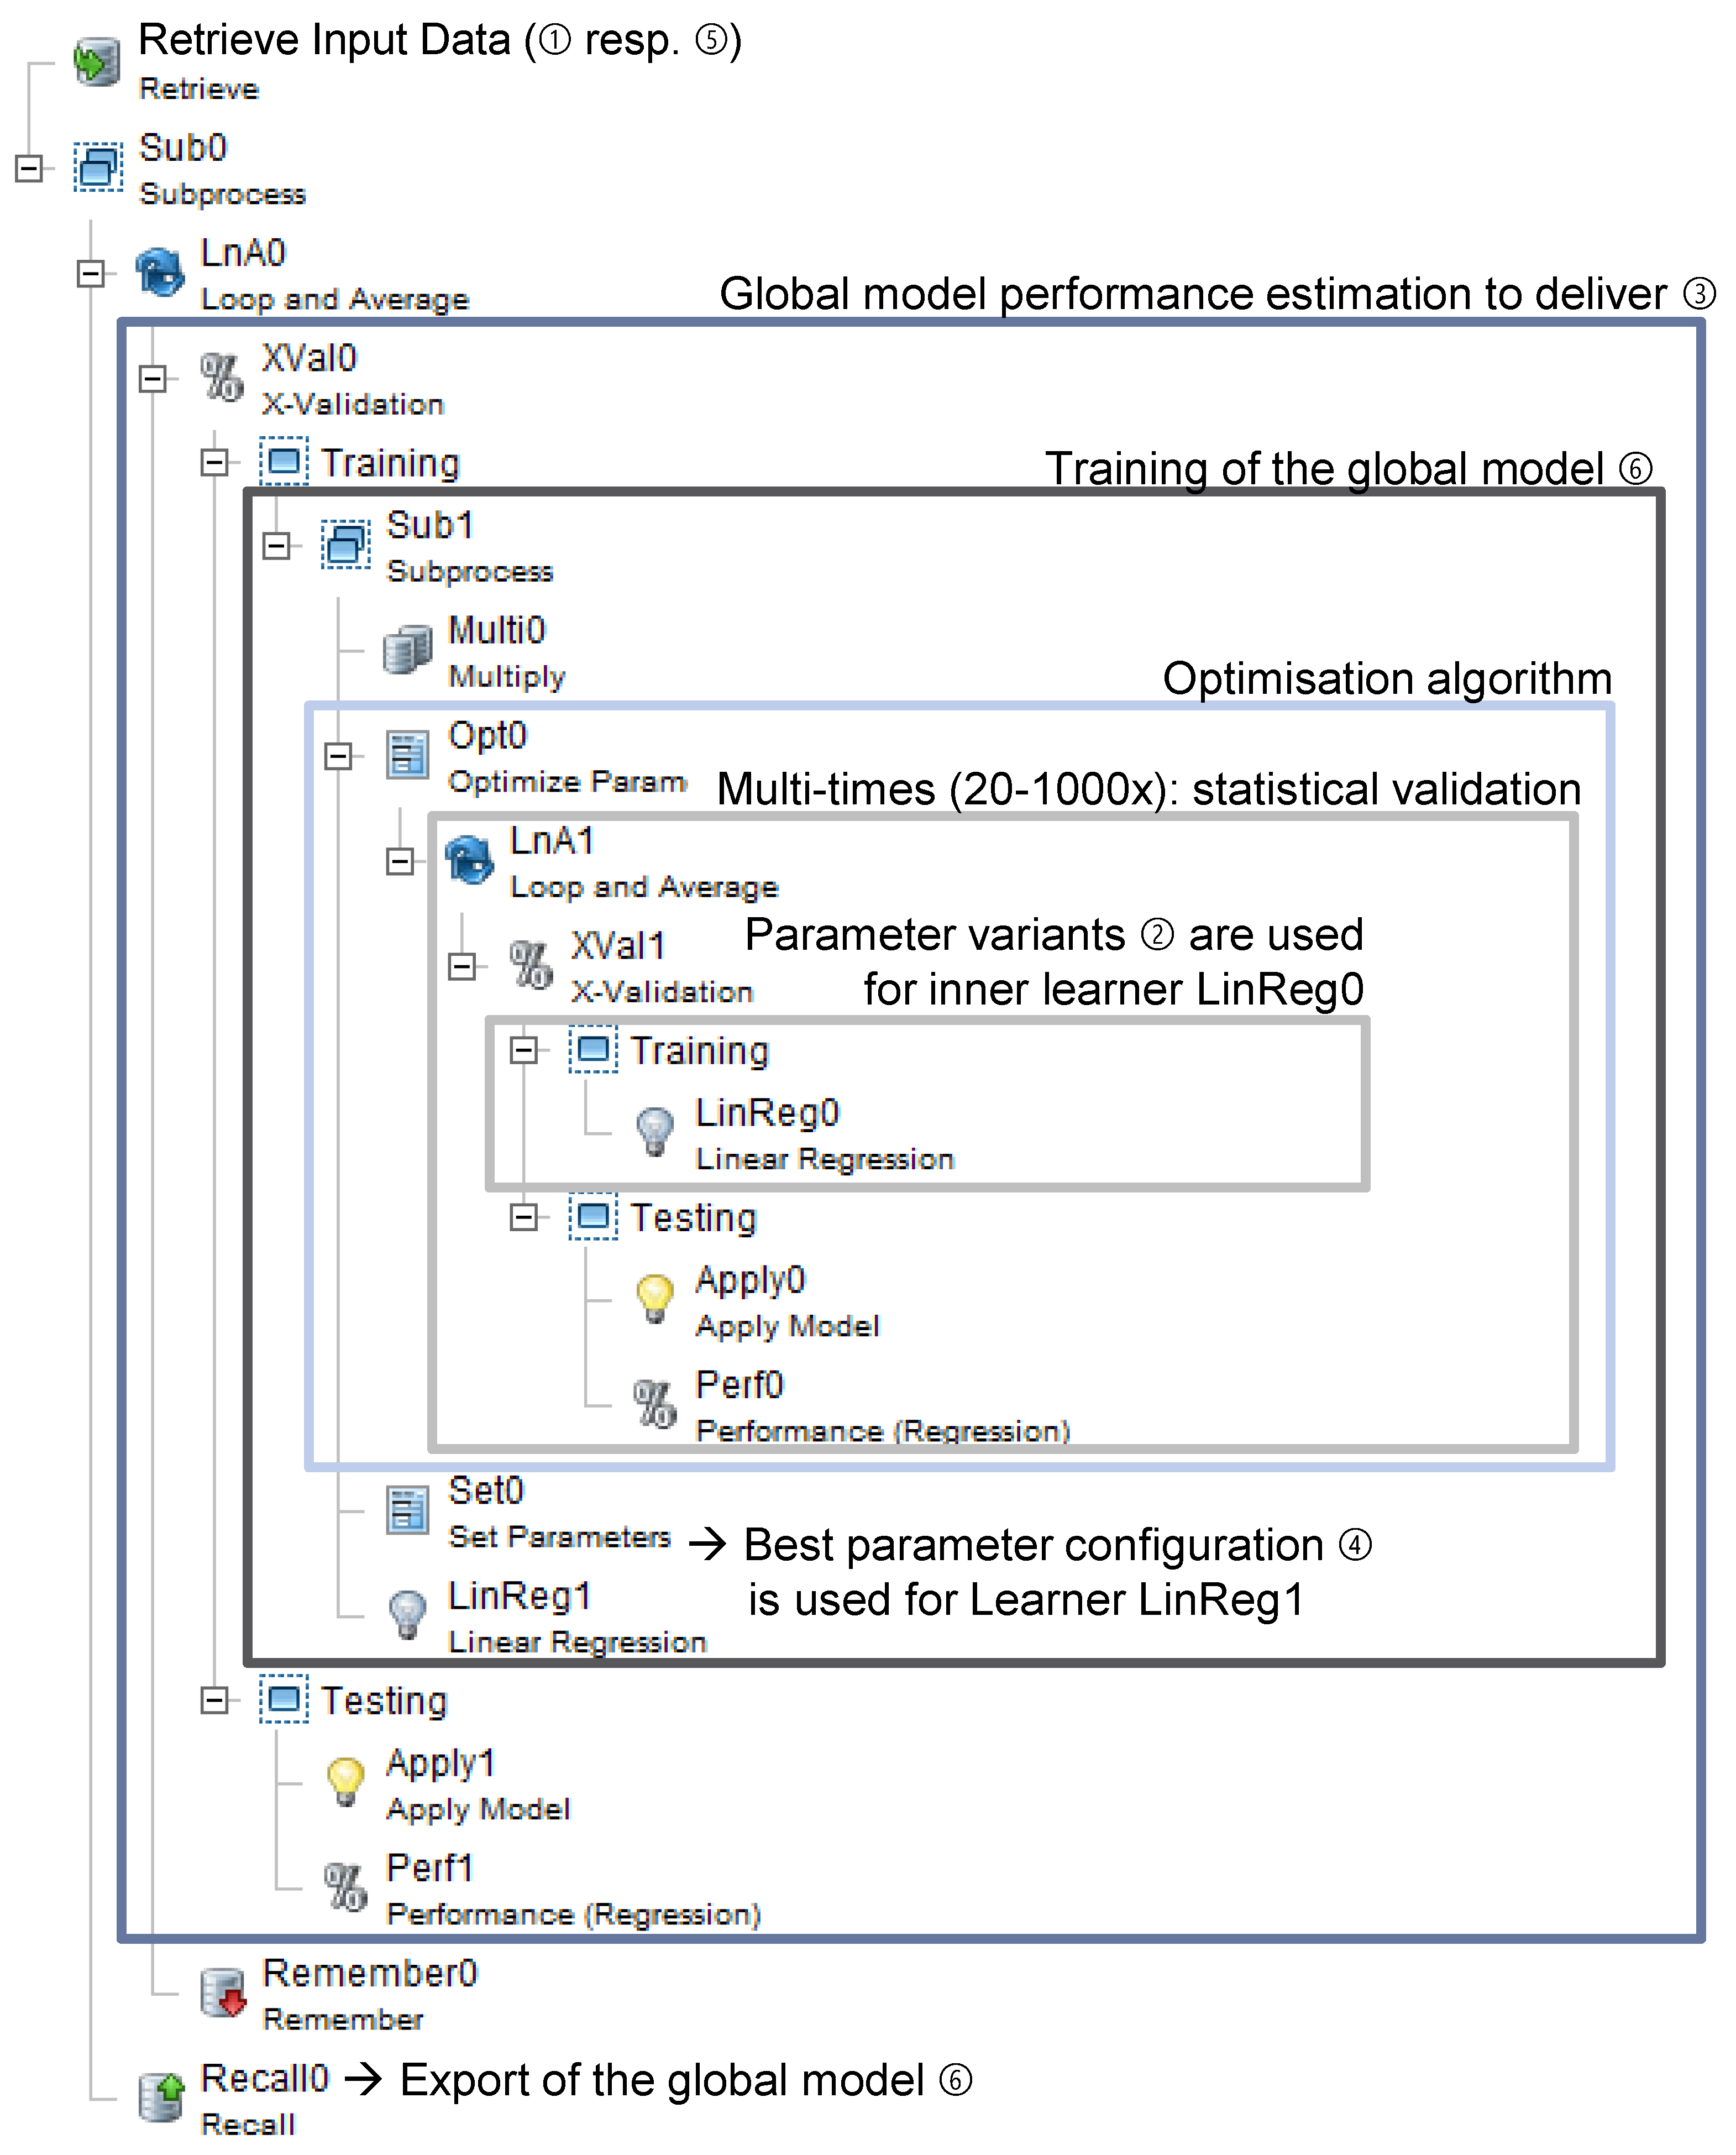
4.3.3. Robust Optimisation and Performance Estimation

The objective of the ROPE-process (Robust Optimisation and Performance Estimation) is, inter alia, to find a metamodel and its performance for a given dataset that is neither overfitted nor underfitted. The input dataset consists of features which are, for instance, geometry parameters of the PDF and SDF or manufacturing process related values like deformation rate of an experiment and target values which describe the result of an experiment (see Section 5.1).
The ROPE-process ensures, that metamodels map the underlying system behaviour of the dataset with respect to the target value. To ensure a maximum of flexibility and to be able to deal with both linear and non-linear system behaviour, several metamodels are trained on the data. Therefore, the ROPE-process uses four different metamodel algorithms (see Section 4.3.1) which can map linear or non-linear system behaviours (see Section 4.3.1). It is possible to use more metamodeling techniques, such as artificial neural networks, support vector machines or Gaussian processes, however, this is possible for specific use cases (e.g., local metamodels).
The learning behaviour of each metamodel algorithm can be influenced by a set of parameters. Usually, optimisation algorithms in combination with a cross-validation are used to find a parameter set which fits the data best (e.g., the maximum order of the polynome in a Polynomial Regression model) (see Section 4.3.2). The optimisation is used to try different parameter set configurations and the cross-validation is needed to compute the performance of the metamodel algorithm with a specific parameter configuration. For this, the performance has to be robust in order to be comparable. That is, the performance computation must be free of any form of external influences. Further research showed that the performance computation in a cross-validation is sensitive to the sequence of the input dataset as well as to the pseudo random values, which are used to divide the dataset into 10-folds to compute the performance [56]. To face this sensitivity and to make the performance computation robust, the cross-validation is to be statistically validated by repeating it, and averaging the performance results afterwards. Afterwards, the performances of the different parameter configurations can be compared and the best configuration can be chosen. In Figure 7, the optimisation unit (OU) is shown, which represents the optimisation process of a metamodel, eliminating the influence of the sequence of the input dataset and the influence of the pseudo random values on the performance estimation by the use of a variable random seed to generate better pseudo random values.
The process in Figure 7 starts with a dataset ①, which comes from the product data model, for instance (see Section 4.1). The dataset is passed to the optimisation algorithm, which performs a 10-fold cross-validation several times ②/③ with different parameter configurations for the metamodel algorithm (learner). After the optimisation algorithm has finished, the best parameter configuration is evaluated and passed to the metamodel algorithm (learner) again ④ to train the metamodel with the best parameter configuration and the given input dataset ⑤. The result of the OU is then a metamodel, which is neither overfitted nor underfitted ⑥.
At this point, we have the possibility of performing a robust optimisation of a metamodel, but we do not know its real performance on future data. A performance can be estimated by testing the metamodel on data it has never seen before. In the case of a large dataset, we can define a holdout dataset which is used for testing the model after the OU. This is called split validation [49]. In the case of a small dataset (our case) you cannot holdout data, because your training will produce an underfitted metamodel. That is, if all data are used during the training process, the risk of using data for testing that was also used for training will increase. In the OU, all the available data are used randomly several times (repeat and average) to compute the robust performance for the optimisation. For this, Prekopcsák et al. [57] suggest putting the OU in a cross-validation to estimate the performance on future data, where the OU is only applied to the training datasets. The optimised metamodel is tested with data that were not used during training (see Figure 8). Due to the use of the cross-validation for the computation of a performance, all training data can be used to compute the metamodel afterwards, which is necessary in the case of a small dataset. The cross-validation is performed multiple times to statistically validate it (see Section 4.3).
The process in Figure 8 starts with a dataset ①, which comes from the product data model, for instance (see Section 4.1). The dataset is passed to the 10-fold cross-validation, which is performed several times ② for statistical validation. In the cross-validation, the OU is used to compute a neither overfitted nor underfitted metamodel based on the training dataset. The result after the averaging of all cross-validation results ③ is a rate, which represents the best estimator for the performance of the OU. Finally, the OU is run again to train a metamodel on all available input data ④. The result of this process (the ROPE-process) is a metamodel that is neither overfitted nor underfitted (robust optimisation) and its estimated performance.
The ROPE-process is performed for each target value assigned to a specific part and is repeated for every implemented metamodel algorithm.

4.3.4. Picking the Best

So far, the developed ROPE process delivers a number of n metamodels, each with an estimated performance mean μ n i where i { 1 , , n } , expressed in terms of the root mean squared error (RMSE) and the mean error (ME), both averaged over the cross-validations. The next step is to find the best metamodel. However, just choosing the one with the lowest estimated μ n i will not lead to a proper decision and thus no reliable design knowledge is acquired. From a stochastic point of view, it is possible that the better prediction performance is just due to random effects during the cross-validations [56,57]. However, using reliable metamodels is necessary in engineering, for example, when they are used for optimisation purposes. The objective is to find the metamodel that is significantly better than each of the other models received from the ROPE process. Thus, a pairwise comparison of the estimated means is necessary. The literature suggests a paired t-test of the estimated means to compare two different data mining schemes [49,50,51]. A paired t-test is a test of the null hypothesis that computes the difference between two variable distributions. If it has a mean value of zero, the estimated performance means are the same, or in other words, if no metamodel is significantly different:
H 0 : μ n i = μ n j .
The null hypothesis can either be accepted or rejected whereas this decision is based on probability. Rejecting H 0 when the means are not significantly different leads to a type I error (false positive) whereas accepting it when the means are in fact different corresponds to a type II error (false negative). Along with the null hypothesis, the significance level α has to be determined. This value is the probability that the decision to reject H 0 leads to a type I error. The significance level is usually set to 0.05 . α is afterwards compared with the p-value, which, if determined correctly, guarantees to control the type I error rate not to be greater than α . If a test of significance produces a p-value lower than the significance level, the null hypothesis is rejected. However, the presence of n metamodels calls for the execution of n 2 pairwise t-tests. However, successively performing multiple paired t-tests would result in an increased chance of committing a type I error [58], the so-called α -error accumulation. This is avoided via a two-step statistical test procedure. The first step is an analysis of variance, generally abbreviated with ANOVA [59], followed by a post-hoc test [60]. The former allows for a comparison of n metamodels regarding the significant differences of their performances without increasing the probability of a type I error, whereas the latter allows for a quantification of the difference.
The basis for an ANOVA is the variances of the n performances derived in the ROPE process. Each total variance can be divided into a systematic (explained) and a residual (unexplained) part. Here, the core idea of using ANOVA is to check whether the difference between the variances of each of the n groups and the estimated residual variances is significant. Therefore, the f-value [61] is derived as the quotient of the latter and the former. The f-value is again used for a null hypothesis test by comparing it with a critical f-value that depends on the chosen significance level and the degree of freedom (in statistics, the degree of freedom (dof) is the number of parameters whose variations cannot be determined [62]. In the context of the present work d o f = k 1 , where k is the number of cross-validations in the ROPE process). The meaning of a significant f-value is, first, that the difference between the compared performance vectors is of a systematic origin and not of a stochastic one. However, neither is it possible to tell the actual value and trend of the performance differences nor can it be determined between which performance vectors the difference occurs.
This is where the ensuing post-hoc test catches up. Different post-hoc test procedures are available; an overview can be found in [63]. For the following procedure Tukey [64], the honest significance difference (Tukey’s HSD) test is applied. For each pair, this test determines the least difference that has to occur so that the difference is significant with respect to the pre-defined significance level. Hence, a critical mean difference is calculated whose exceedance can be interpreted as a significant difference between the compared pair. For the calculation of the HSD, the parameter q is used, which fulfils a similar role as the t-value in the t-test. With A ¯ 1 and A ¯ 2 being the compared means, σ R e s 2 being the estimated residual variances (from ANOVA) and z being the sample size, g results as:
q = A ¯ 1 A ¯ 2 σ ^ R e s 2 z .
The q-value is founded on a studentized range distribution. This allows the determination of a critical value q c r i t depending on the number of observed averages. Hence, an α -error accumulation is avoided. Substituting q c r i t in Equation (2) and solving for the mean difference delivers the critical difference HSD:
H S D = q c r i t · σ ^ R e s 2 z .
HSD is calculated for each pair and the significant difference can be quantified and visualized. A short use case describes the procedure with manufacturing process simulation data derived from the sheet-bulk forming research project.

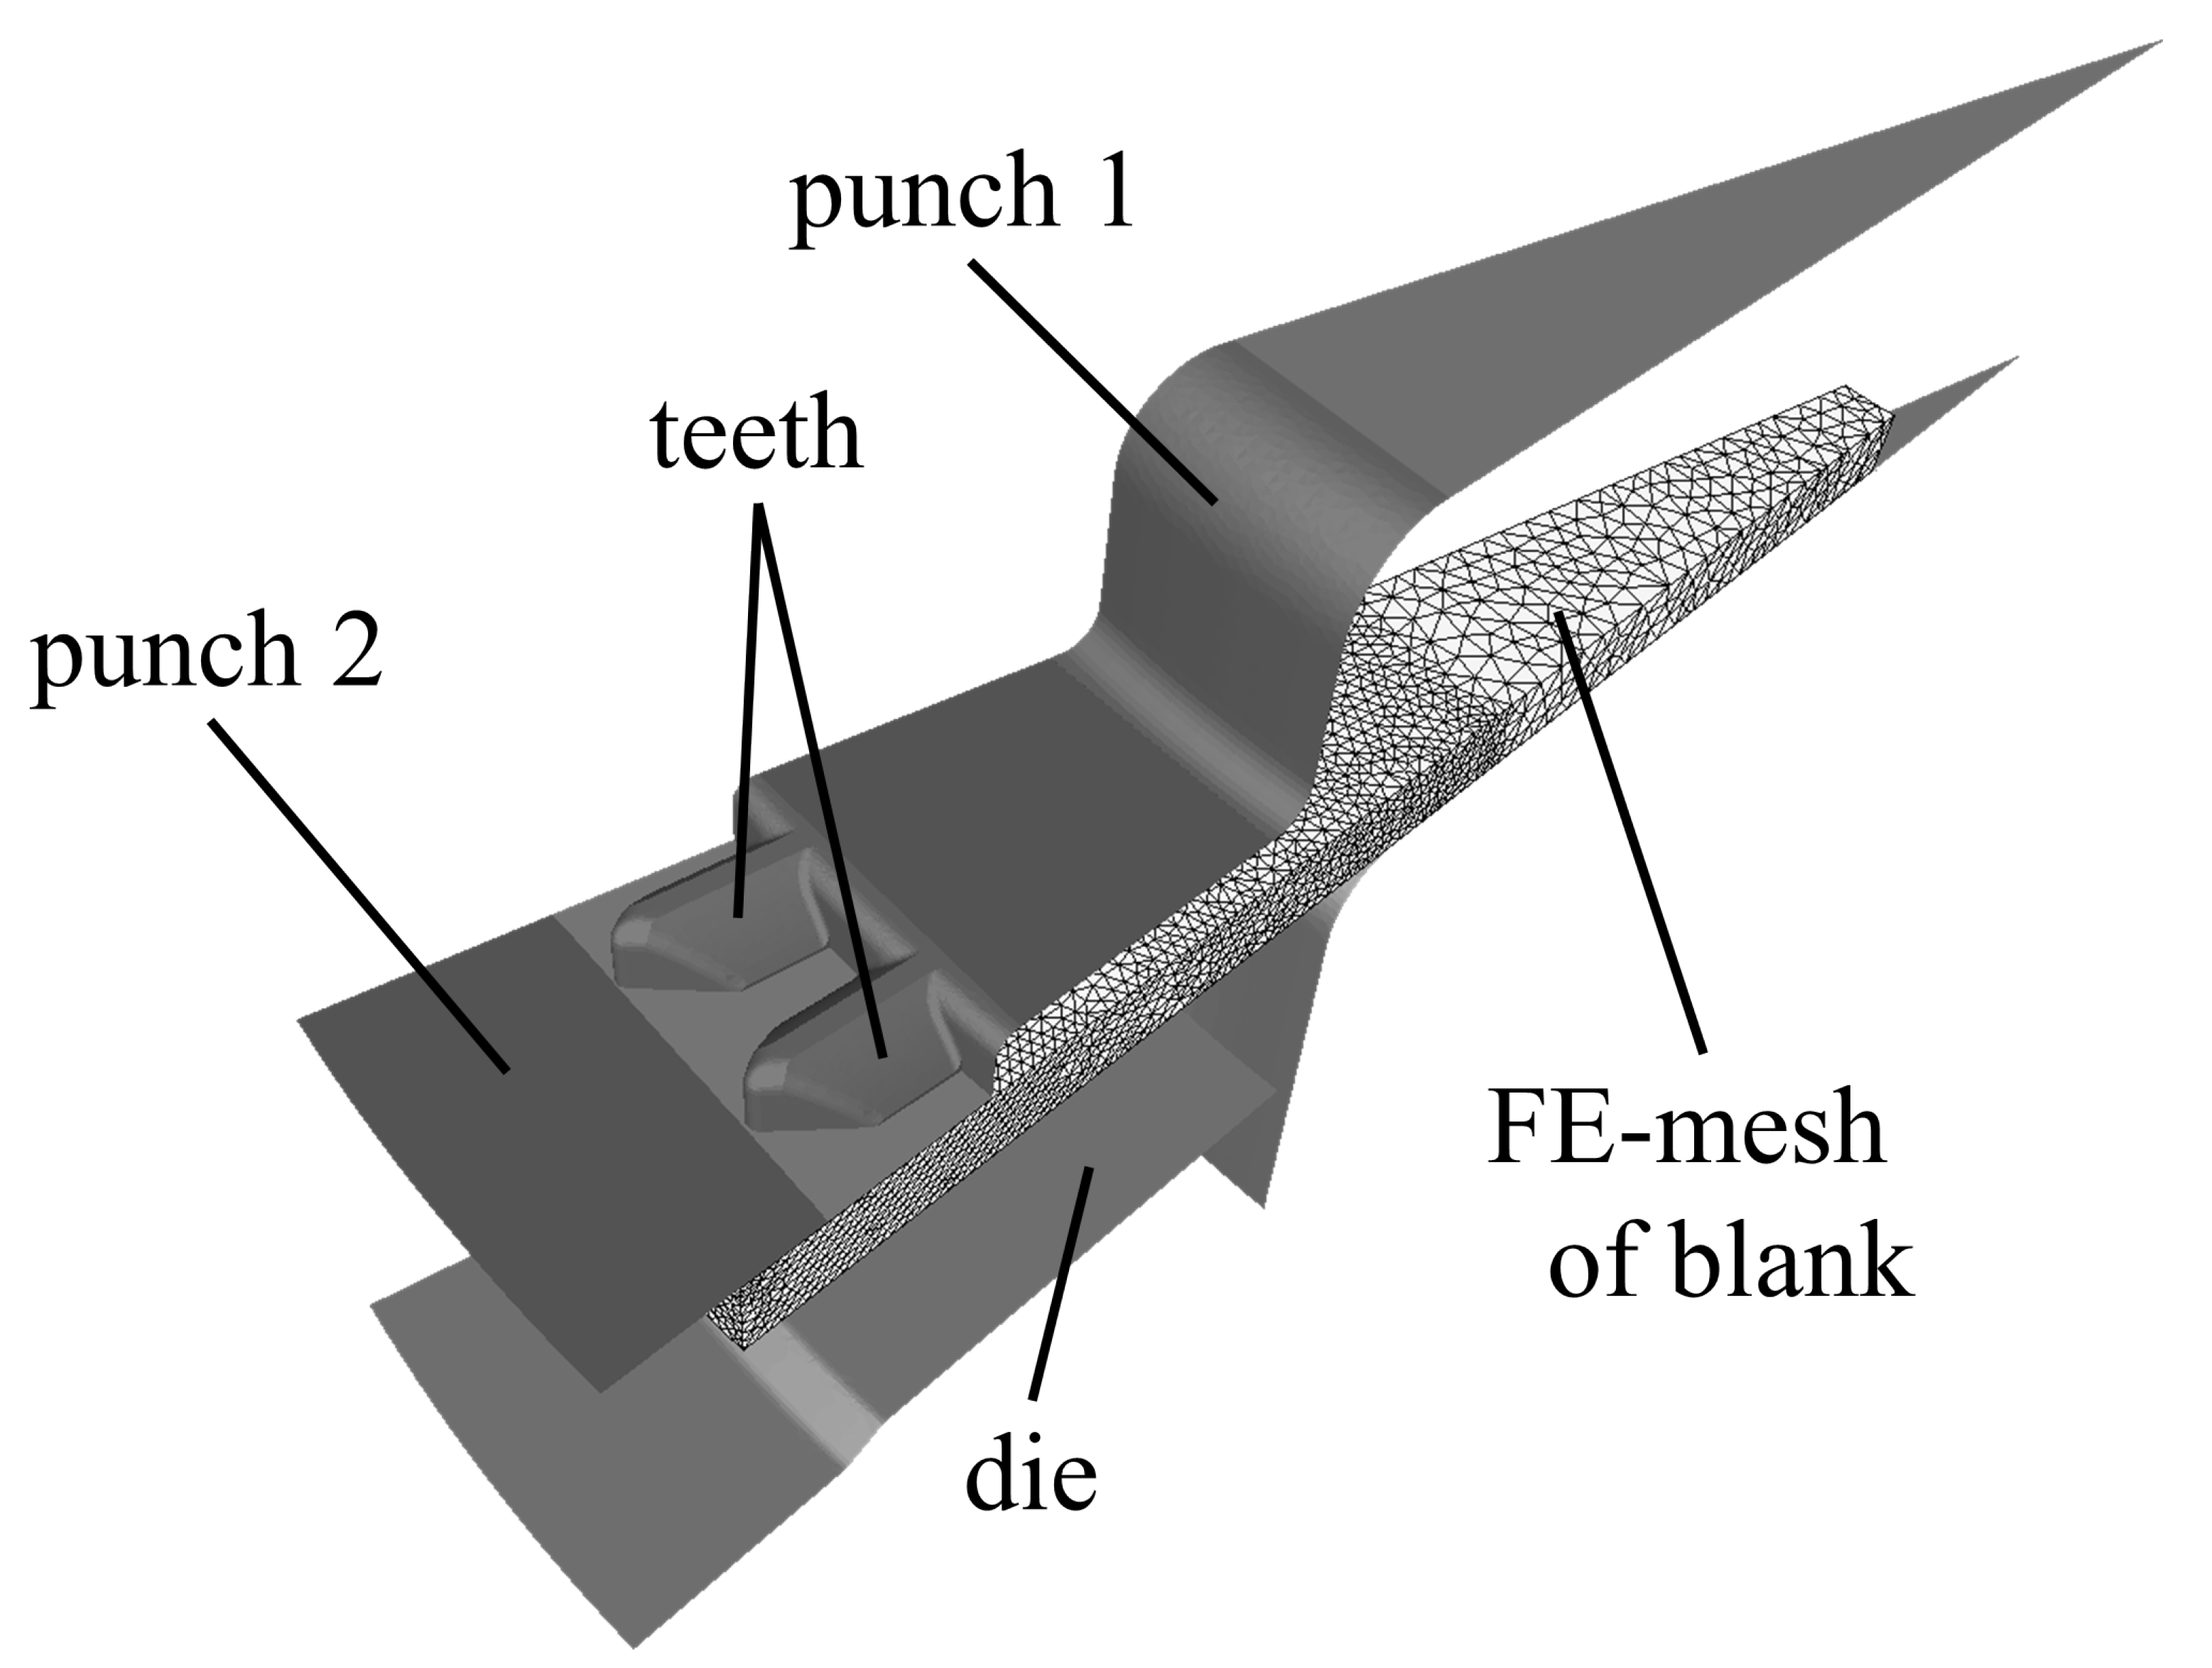
5. Use Case: Sheet-Bulk Metal Forming

5.1. Simulation-Based Parameter Study

In this use case, the simulation data of the combined sheet-bulk metal forming process “deep drawing-extrusion” will be used for the automatic acquisition of design-relevant knowledge. This data arose from a parameter study on the basis of a three-dimensional FEA (finite element analysis)-model, varying the geometric parameters of the teeth. The FEA-model is based on the part shown in the upper left corner of Figure 2. To reduce the computation time, just a 10 sector of the demonstrator was modelled, justified by the rotational symmetry of the demonstrator. Theoretically, regarding the symmetry condition, the modelling of a half tooth would be sufficient, but therefore the possibility concerning the verification of a faultless model would be dropped. A model can be recognized as faultless if both teeth are shaped nearly identically and the stress and strain values of both teeth are equal to each other. Furthermore, the modelling of the tool design as rigid bodies reduced the computation time. The friction conditions in the FE-model were defined differently. Between the contact bodies, blank and die, a friction factor of 0.3 was defined. The definition of the friction factor between the contact bodies, blank and punch, represents a special characteristic because the punch was partitioned into two sectors to influence the mould filling and the punch force. The sector “punch 1” was assigned a friction factor of 0.05 for the increase of the mould filling, whereas the sector “punch 2” was assigned a friction factor of 0.3 for the reduction of the punch force as well as for the increase of the mould filling. The semi-finished part was a circular blank with a thickness of 2 mm and with the material characteristics of DC04 steel.
The input parameters for this parameter variation study were a selection of product characteristics that can be influenced by the design engineer (see Table 3). As an exemplary simulation output for our use case we chose the forming force that is calculated by the simulation system (Simufact Forming version 12) for each simulation run. Table 3 shows an overview of the input and output parameters. The index X denotes that this is a parameter from an SDF, the index T 0 denotes the SDF teeth variant 0. There are further variants of SDF which are analysed within different studies. A total dataset of 162 samples (162 simulations) was created through a full-factorial design, as proposed by [65]. However, some simulations did not converge due to, for example, re-meshing problems or a lost contact between punch and blank mesh, and a final dataset of 151 samples was elicited. The data regarding the inputs and output of this 151 samples were then collected and put together to form the initial dataset for the following ROPE process.

5.2. Performing the ROPE Process

The objective of the ROPE process as it is described in Section 4.3.3 is to derive a defined number of metamodels (in previous sections n) in combination with a reliable performance estimation. As a tool for the process implementation, the software RapidMiner® was used. It is a data mining system that enables both user-driven modeling of data mining processes and batch mode runs. The latter can be regarded as a (computational) prerequisite for an automatic knowledge acquisition process. The GUI of RapidMiner® offers a drag’n’drop procedure to create a data mining process with an additional connection to the product data model. Figure 9 shows the implementation of the developed ROPE process in a RapidMiner® tree view. For reasons of simplicity, pre-processing (filtering, role definition, removing useless input attributes, etc.) and post-processing (result visualization, knowledge implementation in knowledge base) tasks were removed. The circled numbers in Figure 9 correspond to those in Figure 8.
The graphical representation of the ROPE process as transformed into an XML-based template. Specific entries were left blank as placeholders to be defined each time the self-learning process was executed. The data import was controlled via SLASSY’s GUI as shown in Figure 10. The user could choose the input and output parameters that were to be taken into account for the self-learning process.
The ROPE process was executed in batch mode by transferring the manufacturing data and the related product instance. Thus, the assignment of acquired knowledge to the wrong product instance was avoided. The user did not have to deal with database queries or blank filling, however, the progress of the self-learning process was displayed. The result of each ROPE process was a collection of tables or spreadsheets with statistics (real and predicted values). With these statistics the RMSE could be calculated as a basis for the ensuing statistical tests which were performed in the MATLAB® environment. For our use case, four ROPE processes for the four metamodels explained in Section 4.3.1 were performed. However, due to the concepts of ROPE and the picking-the-best procedure, the results of each self-learning process were independent of meta model numbers.

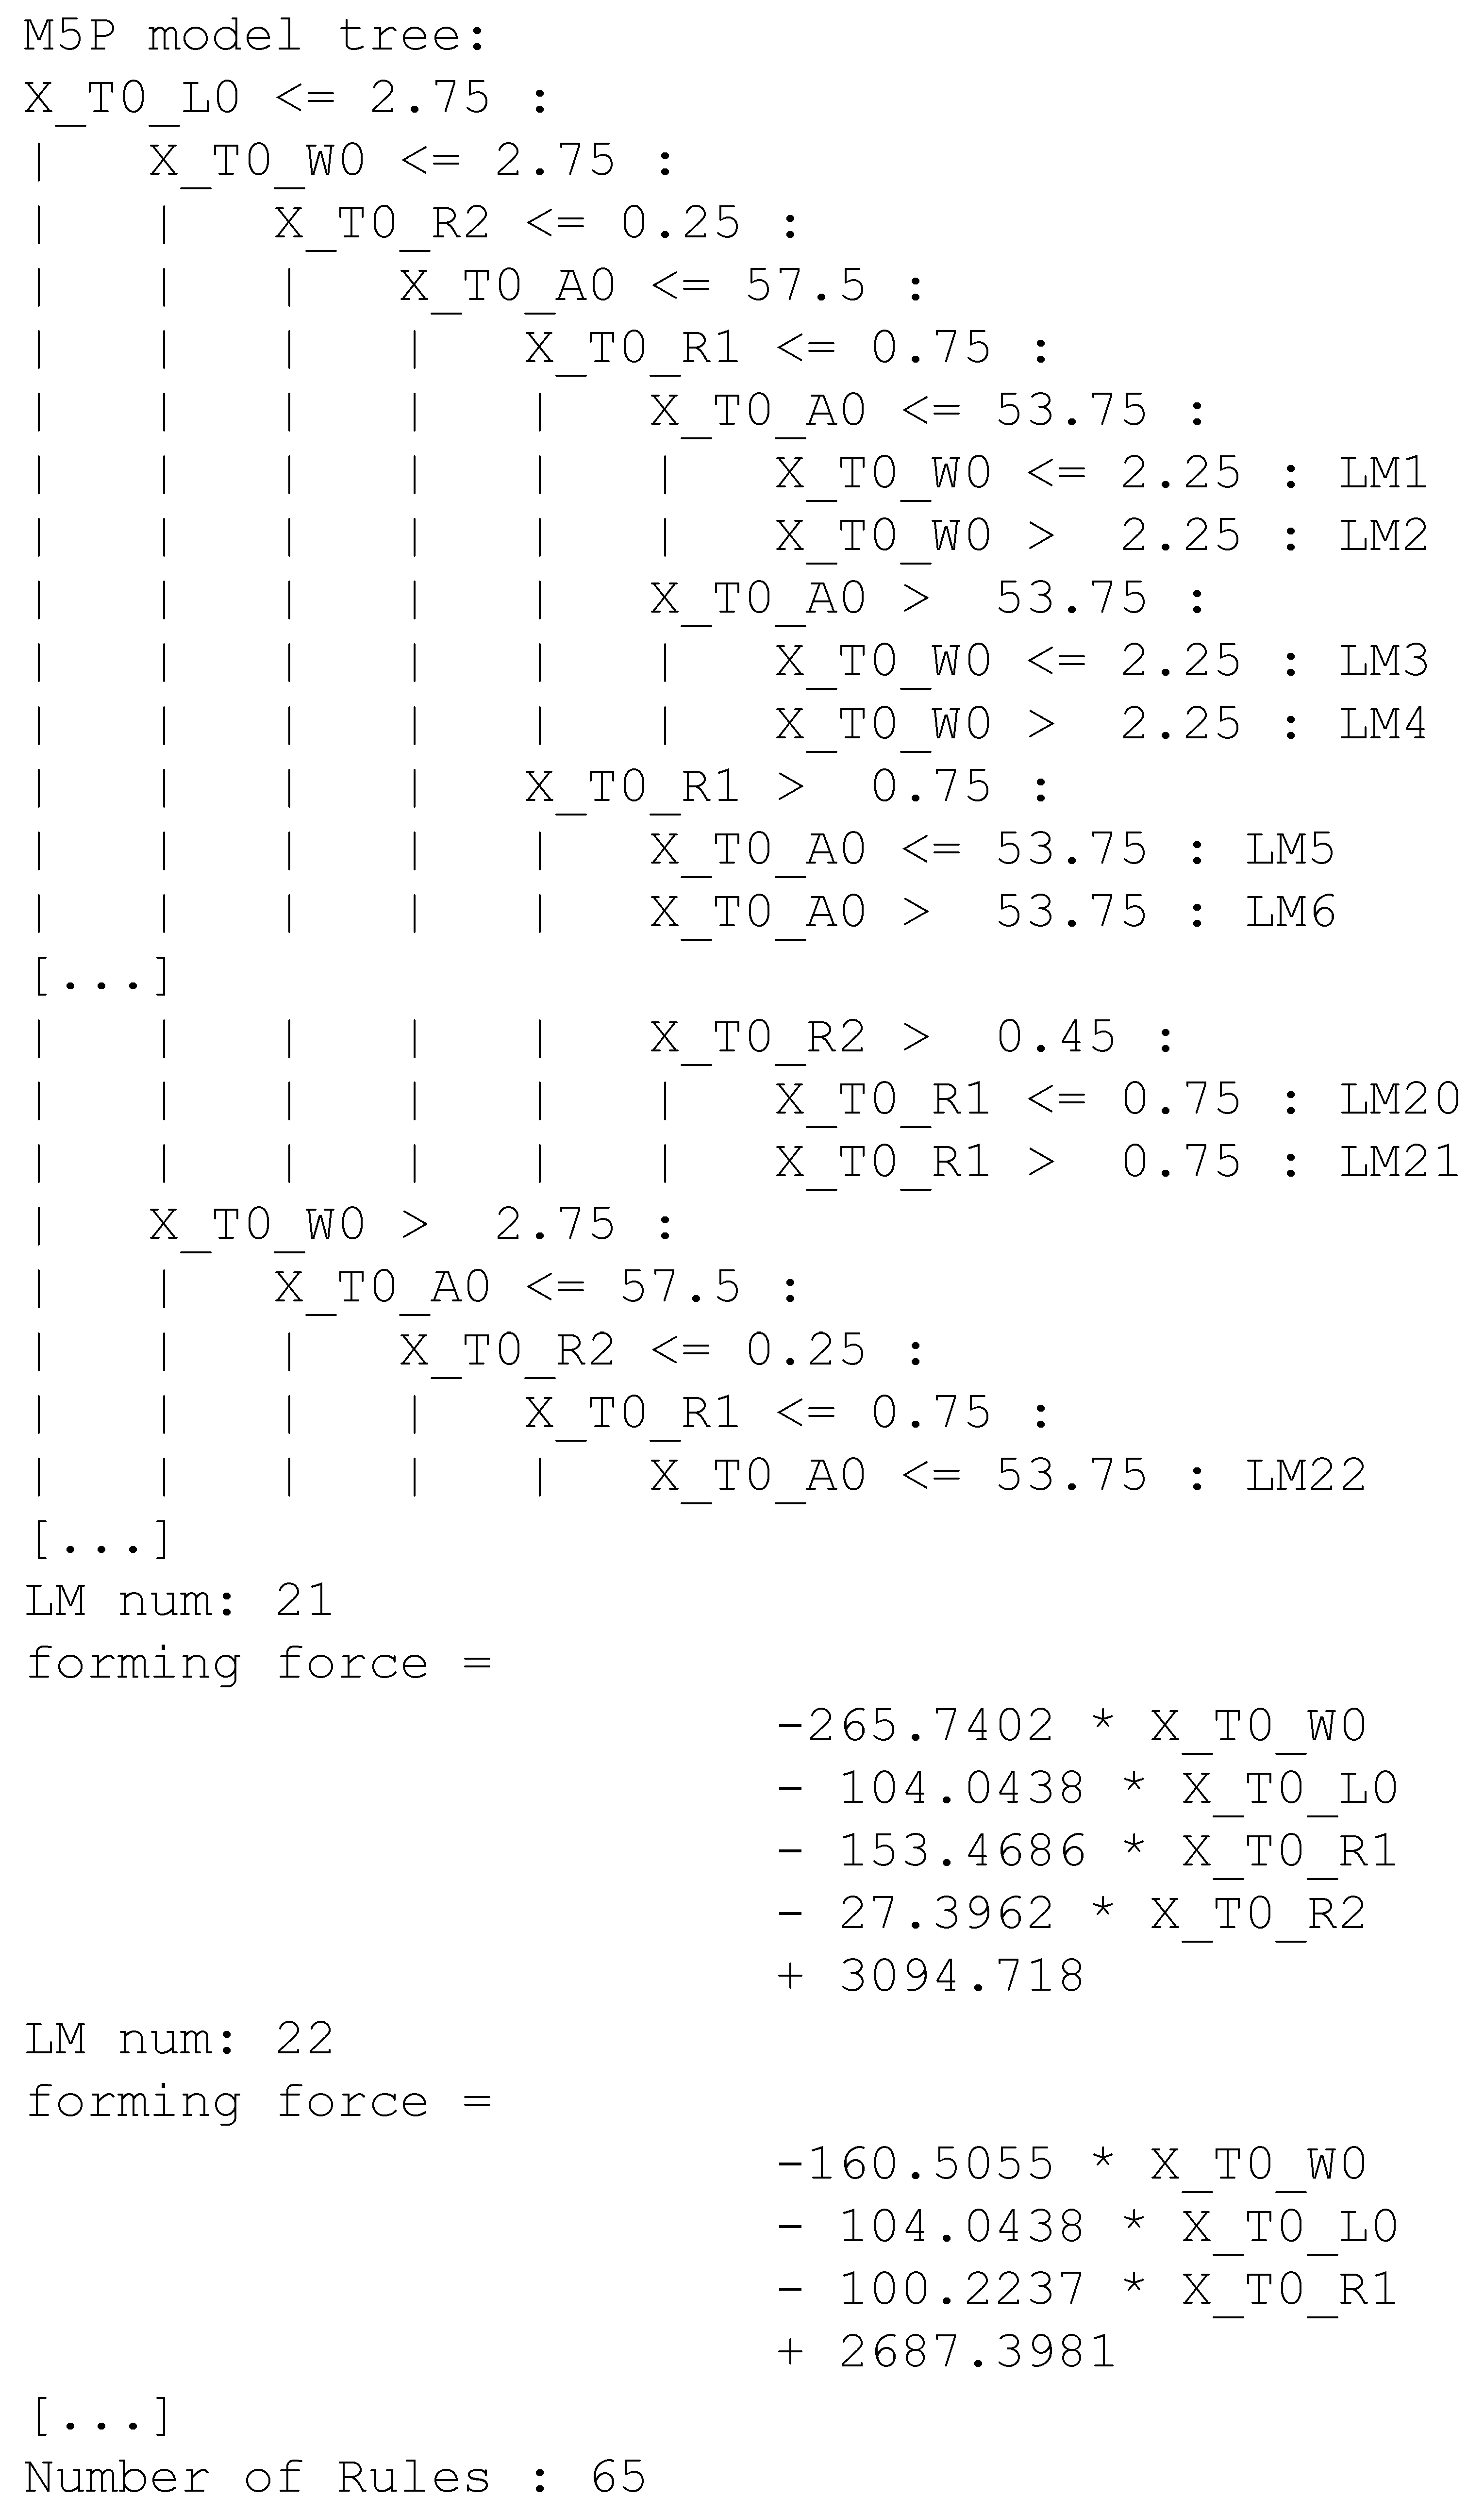
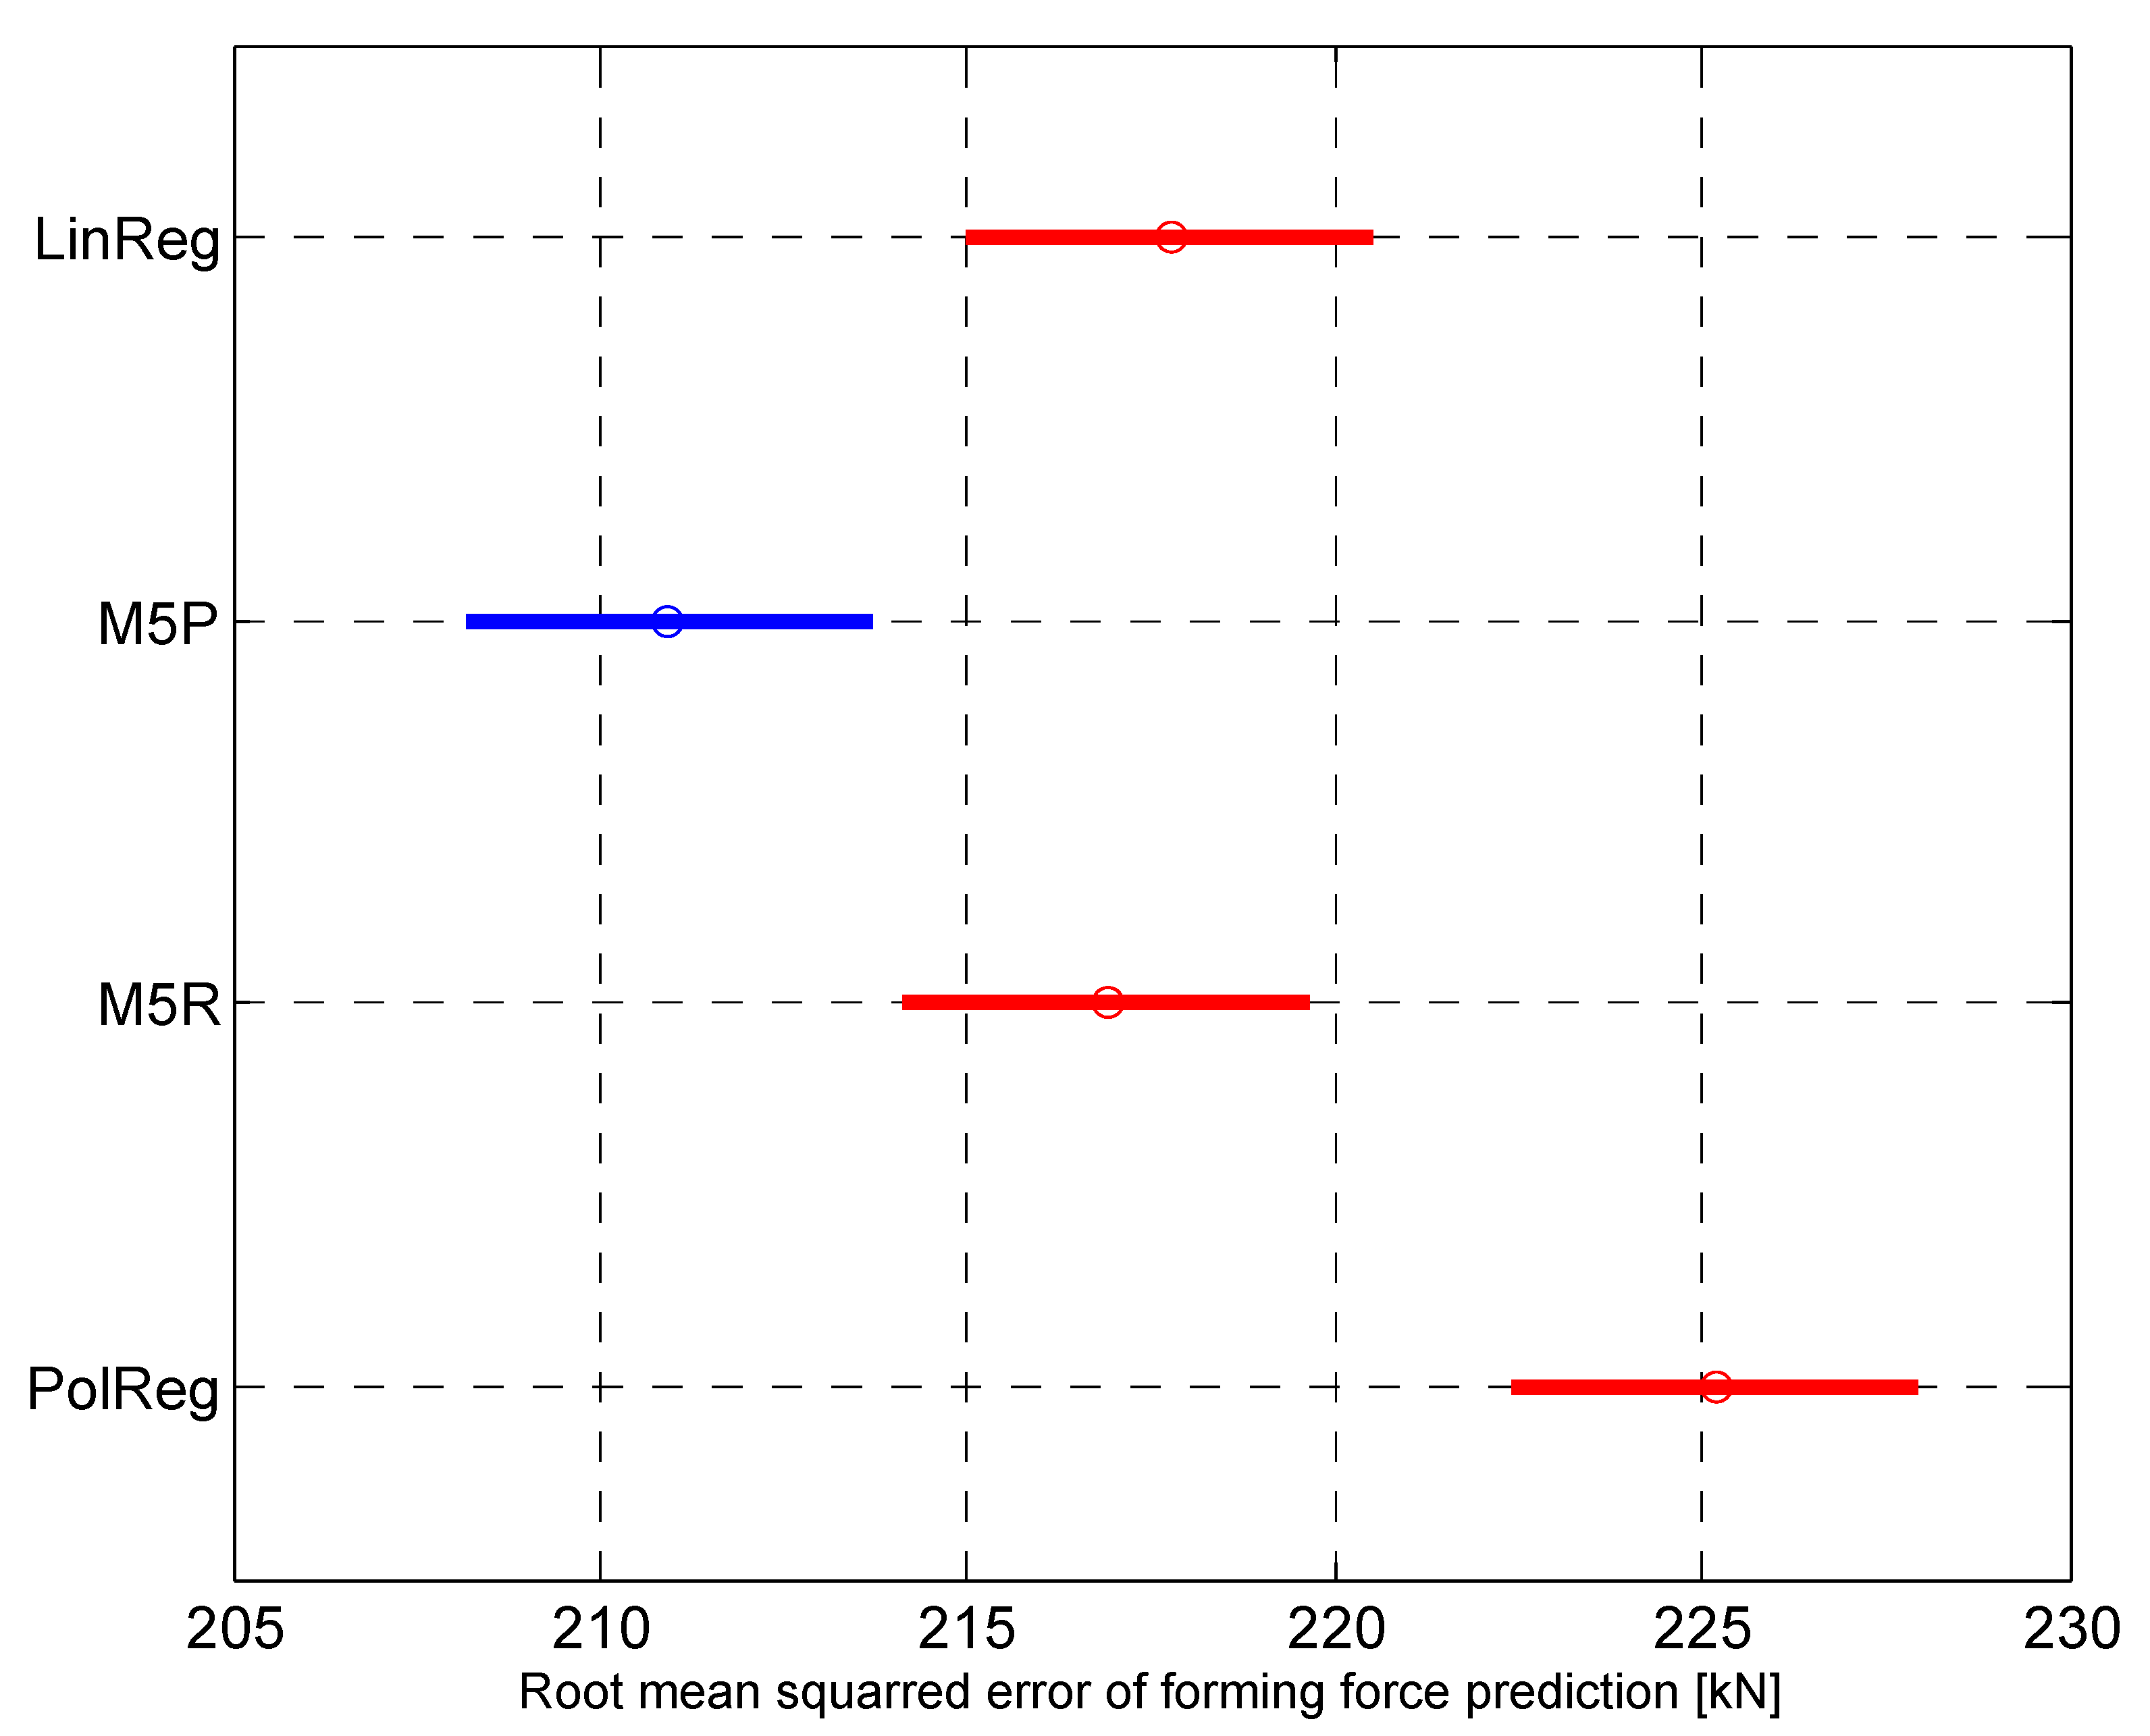
5.3. Best Model Derivation

The two-step statistic test procedure for choosing the most reliable metamodel as described in Section 4.3.4 was executed in the MATLAB® environment. Each of the five performance vectors contained 100 RMSE samples derived from a 10-times 10-fold cross validation. Performance statistics are shown in Table 4.
However, according to Pituch et al. [66] and Bock [67] a prerequisite for the ANOVA is that (a) all samples are either of the same size or their variances are (almost) equal, that (b) the samples are independent from each other and that (c) the samples’ underlying distribution is a normal distribution. Prerequisite (a) is fulfilled (100 samples in each vector) as well as prerequisite (b), since the RMSE samples were derived from single ROPE processes and thereby do not influence each other. A test regarding normal distribution was carried out via an Anderson–Darling test as proposed by [68]. According to the test result, the samples fail to reject the null hypothesis, “the samples come from a normal distribution”. Hence, prerequisite (c) is fulfilled. Being executed in MATLAB®, the ANOVA delivers Table 5.
In Table 5, the source of the observed variations is distinguished in between-groups variation (Groups) and within-groups variation (Error). S S means the Sum of Squares due to each source, and D o F is the degrees of freedom. The total D o F is the total number of observations minus one, which is ( 4 × 100 ) 1 = 399 . The between-groups D o F is the number of groups minus one, which is 4 1 = 3 . The within-groups D o F is the total D o F minus the between-groups degrees of freedom, which is 399 3 = 396 . M S is the Mean Squared error, which is S S per D o F for each source of variation. The F-value is the ratio of both mean squared errors. The p-value is the probability that the F-value can take a value greater than or equal to the value of the test statistic. The small p-value of 4.19 × 10 9 is a sign that the differences between the performances are statistically significant.
The next step is to identify the groups that differ from each other in order to find the group with the smallest prediction error. As described in Section 4.3.4, Tukey’s HSD procedure is suitable for balanced one-way ANOVA and procedures with equal sample sizes. Performing the procedure in MATLAB delivers Table 6). Column one and two mark the groups that are compared with each other, that is, “compare A with (→) B”. Columns three and five show the lower and upper limits of the true mean difference with 95 % confidence whereas the mean itself is shown in column four. The last column shows the p-value for the hypothesis test and that both mean values are the same. If the values are greater than 0.05 the null hypothesis that the mean performances are significantly different is rejected. The only groups with no significant differences are LinReg and M5R ( p = 0.9786 ). This can also be seen in Figure 11, where both bars are almost overlapping. All remaining pairwise comparisons show significant differences. The comparison of M5P and PolReg shows the highest absolute performance mean difference of |14.25| and marks M5P as the group with the least root mean squared error. This corresponds to Figure 11, where the blue M5P bar clearly stands out from the others. Hence, for the given product (Figure 12) an M5P regression tree describes the relevant process parameter forming force with the smallest possible prediction error. An excerpt of this metamodel is shown in Figure 6.

6. Conclusions and Outlook

The purpose of SLASSY is to help the product developer to design parts that are to be manufactured by sheet-bulk metal forming. This manufacturing technology is characterized by constant changes and additions to the underlying design-relevant knowledge, which has to be acquired and updated in order to perform analyses regarding a part’s manufacturability. So far, assistance systems have been equipped with knowledge acquisition tools that are based on direct or indirect acquisition methods. It has been shown that these methods work for knowledge about mature manufacturing technologies, and computer-based approaches have been presented. However, a reliable maintenance of the knowledge base cannot be enabled via direct or indirect knowledge acquisition methods for sheet-bulk metal forming. Hence, SLASSY is equipped with an automatic knowledge acquisition component. The basis is a two-step knowledge discovery in databases process. The data origin are experiments and/or simulations that are performed during the development of the manufacturing process. In a first step, the data are used within a ROPE process to train different metamodels and estimate their performances regarding the prediction of process parameters such as forming force, plastic strain or contact ratio. Afterwards, the performance means are compared to identify the metamodel with the least prediction error. This comparison uses statistical tests to ensure that the chosen model is significantly the best model. Through this process, SLASSY is able to independently acquire reliable design-relevant knowledge without user interaction. This property led to the expression self-learning. Due to the difficulty of knowledge maintenance via direct and indirect methods, the use of knowledge-based systems has been limited to tasks that rely on rather static knowledge. With the presented approach, the scope of modern KBS can be extended and new fields of application arise. Moreover, the methods and tools developed with SLASSY are not only applicable to sheet-bulk metal forming but can be used for different forming processes and technologies.

Author Contributions

Conceptualization, T.B., C.K., C.S., B.S. and S.W.; methodology, T.B., C.K. and C.S.; software, T.B., C.K. and C.S.; formal analysis, B.S. and S.W.; investigation, T.B., C.K. and C.S.; resources, S.W.; data curation, T.B., C.K. and C.S.; writing—original draft preparation, T.B., C.K. and C.S.; writing—review and editing, B.S. and S.W.; visualization, T.B., C.K. and C.S.; supervision, B.S. and S.W.; project administration, B.S. and S.W.; funding acquisition, S.W. All authors have read and agreed to the published version of the manuscript.

Funding

This work is funded within the scope of the Transregional Collaborative Research Centre TCRC73 by the German Research Foundation under Grant number TRR73-68237143.

Data Availability Statement

The related data generated and analyzed for the contribution is available from the corresponding author on request. The related code, used within the workbench, is available from C. Sauer on request.

Acknowledgments

The authors thank the German Research Foundation (DFG) that has funded this research work within the transregional collaborative research centre 73. As well as Paul Schächtl, who contributed with discussions and reviews of the presented research.

Conflicts of Interest

The authors declare no conflict of interest. The funders had no role in the design of the study; in the collection, analyses, or interpretation of data; in the writing of the manuscript, or in the decision to publish the results.

References

  1. Terwiesch, C.; Loch, C.H. Managing the process of engineering change orders: The case of the climate control system in automobile development. J. Prod. Innov. Manag. 1999, 16, 160–172. [Google Scholar] [CrossRef] [Green Version]
  2. Riviere, A.; DaCunha, C.; Tollenaere, M. Performances in engineering changes management. In Recent Advances in Integrated Design and Manufacturing in Mechanical Engineering; Springer: New York, NY, USA, 2003; pp. 369–378. [Google Scholar]
  3. Oppenheim, B.W. Lean product development flow. In Systems Engineering; Wiley: New York, NY, USA, 2004; Volume 7. [Google Scholar]
  4. Prasad, B. Concurrent Engineering Fundamentals; Prentice Hall: Englewood Cliffs, NJ, USA, 1996; Volume 1. [Google Scholar]
  5. Rude, S. Wissensbasiertes Konstruieren; Shaker: Aachen, Germany, 1998. [Google Scholar]
  6. Cooper, S.; Fan, I.S.; Li, G. Achieving Competitive Advantage through Knowledge-Based Engineering: A Best Practice Guide; Prepared for the Dept. of Trade and Industry by Dept. of Enterprise Integration, Cranfield University: Silsoe, UK, 1999. [Google Scholar]
  7. Skarka, W. Application of MOKA methodology in generative model creation using CATIA. Eng. Appl. Artif. Intell. 2007, 20, 677–690. [Google Scholar] [CrossRef]
  8. Van der Laan, A.H. Knowledge Based Engineering Support for Aircraft Component Design; TU Delft, Delft University of Technology: Delft, The Netherlands, 2008. [Google Scholar]
  9. Lutz, C.; Gerhard, D. Implementation of practice-orientated IT-Systems for knowledge based configuration and design of customised products. In Proceedings of the 43th CIRP International Conference on Manufacturing Systems—CIRP ICMS 2010, Vienna, Austria, 26–28 May 2010; Kuhlang, P., Sihn, W., Eds.; Neuer Wissenschaftlicher Verlag: Wien, Austria, 2010; pp. 1060–1069. [Google Scholar]
  10. Kratzer, M.; Rauscher, M.; Binz, H.; Groehner, P. An agent-based system for supporting design engineers in the embodiment design phase. In Proceedings of the 18th International Conference on Engineering Design, Denmark, Copenhagen, 15–18 August 2011; McAloone, T.C., Howard, T.J., Eds.; Technical University of Denmark: Denmark, Copenhagen, 2011; pp. 178–189. [Google Scholar]
  11. Verhagen, W.J.; Garcia, P.B.; Mariot, P.; Cotton, J.P.; Ruiz, D.; Redon, R.; Curran, R. Knowledge-based cost modelling of composite wing structures. Int. J. Comput. Integr. Manuf. 2012, 25, 368–383. [Google Scholar] [CrossRef]
  12. Lander, S.E.; Corkill, D.D.; Staley, S.M. Designing integrated engineering environments: Blackboard-based integration of design and analysis tools. Concurr. Eng. 1996, 4, 59–71. [Google Scholar] [CrossRef]
  13. Wartzack, S. Predictive Engineering—Assistenzsystem Zur Multikriteriellen Analyse Alternativer Produktkonzepte; VDI: Düsseldorf, Germany, 2001. [Google Scholar]
  14. Fu, M. The application of surface demoldability and moldability to side-core design in die and mold CAD. Comput. Aided Des. 2008, 40, 567–575. [Google Scholar] [CrossRef]
  15. Kumar, S.; Singh, R. Automation of strip-layout design for sheet metal work on progressive die. J. Mater. Process. Technol. 2008, 195, 94–100. [Google Scholar] [CrossRef]
  16. Feigenbaum, E.A. Expert systems in the 1980s. In State of the Art Report on Machine Intelligence; Pergamon-Infotech: Maidenhead, UK, 1981. [Google Scholar]
  17. Heuvers, A. Was hat der Stahlgießer dem Konstrukteur über Lunker-und Rissbildung zu sagen? Stahl Eisen 1929, 49, 1249–1256. [Google Scholar]
  18. Campbell, J. Castings Practice: The Ten Rules of Castings; Butterworth-Heinemann: Oxford, UK, 2004. [Google Scholar]
  19. Ransing, R.S.; Sood, M.P.; Pao, W. Computer implementation of Heuvers’ circle method for thermal optimisation in castings. Int. J. Cast Met. Res. 2005, 18, 119–128. [Google Scholar] [CrossRef]
  20. Schuler GmbH. Metal Forming Handbook; Springer Science & Business Media: New York, NY, USA, 1998. [Google Scholar]
  21. Meerkamm, H.; Rösch, S.; Storath, E.; Steber, M. A Design System Sheet Metal Parts as a Basis for a Concurrent Engineering Approach. In Proceedings of the 4th International Conference on Sheet Metal, Naples, Italy, 9–12 June 1996; pp. 147–154. [Google Scholar]
  22. Hodgson, B.; Pitts, G. Designing for CNC manufacture. Proc. Inst. Mech. Eng. Part D J. Automob. Eng. 1989, 203, 39–45. [Google Scholar] [CrossRef]
  23. Spur, G.; Stoferle, T. Handbook of Production Techniques. Volume 3/2: Machining (Handbuch der Fertigungstechnik. Band 3/2: Machining). (Book). (Retroactive Coverage); Carl Hanser Verlag: Munich, Germany, 1980. [Google Scholar]
  24. Korosec, M.; Balic, J.; Kopac, J. Neural network based manufacturability evaluation of free form machining. Int. J. Mach. Tools Manuf. 2005, 45, 13–20. [Google Scholar] [CrossRef]
  25. Merklein, M.; Koch, J.; Schneider, T.; Opel, S.; Vierzigmann, U. Manufacturing of complex functional components with variants by using a new metal forming process–sheet-bulk metal forming. Int. J. Mater. Form. 2010, 3, 347–350. [Google Scholar] [CrossRef]
  26. Chatti, S.; Laperrière, L.; Reinhart, G.; Tolio, T. (Eds.) Plate Forging. In CIRP Encyclopedia of Production Engineering; Springer: Berlin/Heidelberg, Germany, 2019; p. 1321. [Google Scholar] [CrossRef]
  27. Meerkamm, H. Design system mfk—An important step towards an engineering workbench. Proc. Inst. Mech. Eng. Part J. Eng. Manuf. 1993, 207, 105–116. [Google Scholar] [CrossRef]
  28. Jingzhi, H. Introduce Engineering Constraint to Graphic Parametrization for Process Parametrization. Manuf. Autom. 1997. [Google Scholar]
  29. Eulenbach, D. Konstruktionssystem WISKON: Ein Beitrag zur Weiterentwicklung von CAD-Systemen; VDI-Verlag: Berlin, Germany, 1990. [Google Scholar]
  30. West, G.; Strachan, S.; McDonald, J.; Duffy, A.; Farrell, J.; Gwyn, B. DEKAS-an evolutionary case-based reasoning system to support protection scheme design. Des. Manag. Process. Inf. Issues 2001, 2, 123. [Google Scholar]
  31. Kaiba, P.; Prebil, I.; Novak, A. Upgrading a CAD System with expert system. In Proceedings of the 7th International Design Conference (DESIGN 2002), Dubrovnik, Croatia, 14–17 May 2002; pp. 355–360. [Google Scholar]
  32. Germani, M.; Cicconi, P.; Mandolini, M. Manufacturing cost estimation during early phases of machine design. In Proceedings of the 18th International Conference on Engineering Design (ICED 11), Impacting Society through Engineering Design, Volume 5: Design for X/Design to X, Lyngby/Copenhagen, Denmark, 15–19 August 2011; pp. 198–209. [Google Scholar]
  33. Lutz, C.; Gerhad, D. IT-based configurationand dimensioning of customer specific products-towards a framework for implementing knowledge-based design assistant systems. In Proceedings of the 18th International Conference on Engineering Design (ICED 11), Impacting Society through Engineering Design, Volume 5: Design for X/Design to X, Lyngby/Copenhagen, Denmark, 15–19 August 2011; Volume 6. pp. 192–199. [Google Scholar]
  34. Hildenbrand, P.; Schneider, T.; Merklein, M. Flexible Rolling of Process Adapted Semi-Finished Parts and its Application in a 101 Sheet-Bulk Metal Forming Process. In Key Engineering Materials; Trans Tech Publ: Durnten-Zurich, Switzerland, 2015; Volume 639, pp. 259–266. [Google Scholar]
  35. Schmid, C.; Hetzner, H.; Tremmel, S.; Hilpert, F.; Durst, K. Tailored mechanical properties and residual stresses of aC: H: W Coatings. In Advanced Materials Research; Trans Tech Publ: Durnten-Zurich, Switzerland, 2014; Volume 996, pp. 14–21. [Google Scholar]
  36. Lehmann, E.; Faßmann, D.; Loehnert, S.; Schaper, M.; Wriggers, P. Texture development and formability prediction for pre-textured cold rolled body-centred cubic steel. Int. J. Eng. Sci. 2013, 68, 24–37. [Google Scholar] [CrossRef]
  37. Beyer, F.; Blum, H.; Kumor, D.; Rademacher, A.; Willner, K.; Schneider, T. Experimental and Simulative Investigations of Tribology in Sheet-Bulk Metal Forming. In Key Engineering Materials; Trans Tech Publ: Durnten-Zurich, Switzerland, 2015; Volume 639, pp. 283–290. [Google Scholar]
  38. Nilsson, N.J. Principles of Artificial Intelligence; Morgan Kaufmann: San Mateo, CA, USA, 2014. [Google Scholar]
  39. Verhagen, W.J.; Bermell-Garcia, P.; van Dijk, R.E.; Curran, R. A critical review of Knowledge-Based Engineering: An identification of research challenges. Adv. Eng. Inform. 2012, 26, 5–15. [Google Scholar] [CrossRef]
  40. Kestel, P.; Wartzack, S. Wissensbasierter Aufbau konstruktionsbegleitender Finite-Elemente-Analysen durch ein FEA-Assistenzsystem. In Entwerfen Entwickeln Erleben—Beiträge zu Virtuellen Produktentwicklung und Konstruktionstechnik; TUD Press: Dresden, Germany, 2016. [Google Scholar]
  41. Davis, R. Knowledge-based systems. Science 1986, 231, 957–963. [Google Scholar] [CrossRef]
  42. Pahl, G.; Beitz, W.; Blessing, L.; Feldhusen, J.; Grote, K.H.; Wallace, K. Engineering Design: A Systematic Approach, 3rd ed.; Springer: London, UK, 2007. [Google Scholar]
  43. Wartzack, S.; Meerkamm, H. Durchgängige Rechnerunterstützung in der Produktentwicklung aufgrund des Einsatzes semantisch hochwertiger Features. Konstruktion 2000, 52, 24–26. [Google Scholar]
  44. Weber, C. CPM/PDD–An extended theoretical approach to modelling products and product development processes. In 2nd German-Israeli Symposium on Advances in Methods and Systems for Development of Products and Processes; Bley, H., Jansen, H., Krause, F.L., Shpitalni, M., Eds.; Fraunhofer-IRB-Verlag: Stuttgart, Germany, 2005; pp. 159–179. [Google Scholar]
  45. Kleijnen, J.P. Statistical Tools for Simulation Practitioners; Marcel Dekker, Inc.: New York, NY, USA, 1986. [Google Scholar]
  46. Jin, R.; Chen, W.; Simpson, T.W. Comparative studies of metamodelling techniques under multiple modelling criteria. Struct. Multidiscip. Optim. 2001, 23, 1–13. [Google Scholar] [CrossRef]
  47. Sauer, C.; Schleich, B.; Wartzack, S. Simultaneous Development of a Self-learning Engineering Assistance System. In Sheet Bulk Metal Forming. Research Results of the TCRC73; Marion Merklein, A., Erman Tekkaya, B.A.B., Eds.; Lecture Notes in Production Engineering; Springer: Cham, Switzerland, 2020; pp. 127–146. [Google Scholar] [CrossRef]
  48. Holmes, G.; Hall, M.; Frank, E. Generating Rule Sets from Model Trees. In Proceedings of the Twelfth Australian Joint Conference on Artificial Intelligence, Canberra, Australia, 29–30 November 1999; pp. 1–9. [Google Scholar]
  49. Witten, I.H.; Frank, E.; Hall, M.A. Data Mining: Practical Machine Learning Tools and Techniques, 3rd ed.; Morgan Kaufmann: Burlington, MA, USA, 2011. [Google Scholar]
  50. Tan, P.N.; Steinbach, M.; Kumar, V. Introduction to Data Mining, Pearson International ed.; Pearson/Addison-Wesley: Boston, MA, USA, 2010. [Google Scholar]
  51. Han, J.; Kamber, M.; Pei, J. Data Mining: Concepts and Techniques, 2nd ed.; Morgan Kaufmann: Burlington, MA, USA, 2006. [Google Scholar]
  52. Quinlan, J.R. Learning with continuous classes. In Proceedings of the 5th Australian joint Conference on Artificial Intelligence, Hobart, Tasmania, 16–18 November 1992; World Scientific: Singapore, 1992; Volume 92, pp. 343–348. [Google Scholar]
  53. Wang, Y.; Witten, I.H. Inducing Model Trees for Continuous Classes. In Proceedings of the Ninth European Conference on Machine Learning, Prague, Czech Republic, 23–25 April 1997; pp. 128–137. [Google Scholar]
  54. Mayer, D.; Butler, D. Statistical validation. Ecol. Model. 1993, 68, 21–32. [Google Scholar] [CrossRef]
  55. Most, T.; Will, J. Metamodel of Optimal Prognosis-an automatic approach for variable reduction and optimal metamodel selection. Proc. Weimar. Optim. Und Stochastiktage 2008, 5, 20–21. [Google Scholar]
  56. Küstner, C.; Breitsprecher, T.; Wartzack, S. Die Auswirkung der Reihenfolge von Mess- und Simulationsdaten auf das Ergebnis der Kreuzvalidierung in KDD Prozessen. In Proceedings of the 24th Symposium Design for X, 19–20th, Hamburg, Germany, 19–20 September 2013; pp. 175–186. [Google Scholar]
  57. Prekopcsák, Z.; Henk, T.; Gáspár-Papanek, C. Cross-validation: The illusion of reliable performance estimation. In Proceedings of the RCOMM RapidMiner Community Meeting and Converence, Dortmund, Germany, 13–16 September 2010; pp. 1–6. [Google Scholar]
  58. Montgomery, D.C.; Runger, G.C. Applied Statistics and Probability for Engineers; John Wiley & Sons: New York, NY, USA, 2010. [Google Scholar]
  59. Durivage, M.A. Practical Engineering, Process, and Reliability Statistics; ASQ Quality Press: Milwaukee, WI, USA, 2014. [Google Scholar]
  60. Weinberg, S.L.; Abramowitz, S.K. Statistics Using SPSS: An Integrative Approach; Cambridge University Press: Cambridge, MA, USA, 2008. [Google Scholar]
  61. Harris, R.J. A Primer of Multivariate Statistics; Psychology Press: Hove, UK, 2014. [Google Scholar]
  62. Eisenhauer, J.G. Degrees of freedom. Teach. Stat. 2008, 30, 75–78. [Google Scholar] [CrossRef]
  63. Hinkle, D.E.; Wiersma, W.; Jurs, S.G. Applied Statistics for the Behavioral Sciences; Houghton Mifflin: Boston, MA, USA, 2003. [Google Scholar]
  64. Tukey, J.W. Comparing individual means in the analysis of variance. Biometrics 1949, 5, 99–114. [Google Scholar] [CrossRef] [PubMed]
  65. Fisher, R.A. The Design of Experiments; Oliver Boyd: Edinburgh, UK, 1935. [Google Scholar]
  66. Pituch, K.A.; Whittaker, T.A.; Stevens, J.P. Intermediate Statistics: A Modern Approach; Routledge: New Delhi, India, 2013. [Google Scholar]
  67. Bock, R.D. Multivariate Statistical Methods in Behavioral Research; Scientific Software International: Lincolnwood, IL, USA, 1985. [Google Scholar]
  68. Stephens, M.A. EDF statistics for goodness of fit and some comparisons. J. Am. Stat. Assoc. 1974, 69, 730–737. [Google Scholar] [CrossRef]
Figure 1. The acquisition of knowledge is necessary at an early point of process development; however, state-of-the-art is an acquisition of knowledge by the end of the process development.
Ai 02 00019 g001
Figure 2. Typical SBMF parts from test productions and different magnified secondary design features (SDF). The diameter is about 80 m m , the sheet thickness is 2 m m and the material is DC04 (1.0338).
Ai 02 00019 g002
Figure 3. The general architecture of a knowledge based system and its interaction with user and expert.
Ai 02 00019 g003
Figure 4. The overall architecture of SLASSY with the product data model, KDD process based self-learning component, synthesis and analysis tool and interface with the CAD-system according to [47].
Ai 02 00019 g004
Figure 5. The overall self-learning process.
Ai 02 00019 g005
Figure 6. Excerpt of the M5P regression tree, which was found to be the most reliable metamodel in this use case. […] marks skips of the complete text-based model which is about 660 lines.
Ai 02 00019 g006
Figure 7. The optimisation unit (OU).
Ai 02 00019 g007
Figure 8. Reliable performance estimation.
Ai 02 00019 g008
Figure 9. The ROPE process as a nested data mining scheme in RapidMiner® for a linear regression. For a different algorithm, e.g., regression tree (like M5P), the inner operators LinReg0 and LinReg1 are exchanged.
Ai 02 00019 g009
Figure 10. The GUI of SLASSY with the different steps to start the self-learning process.
Ai 02 00019 g010
Figure 11. Chart to evaluate the different performance means. LinReg, M5R and PolReg differ significantly from M5P with the lowest RMSE.
Ai 02 00019 g011
Figure 12. The FEA-model of the simulated use case manufacturing process “deep drawing-extrusion”.
Ai 02 00019 g012
Table 2. Comparison of knowledge acquisition methods.
CriteriaDirectIndirectAutomatic
Availability of knowledge sourceAi 02 00019 i001Ai 02 00019 i001Ai 02 00019 i002
Formalization of knowledgeAi 02 00019 i003Ai 02 00019 i003Ai 02 00019 i004
Susceptibility to errorsAi 02 00019 i003Ai 02 00019 i003Ai 02 00019 i004
Minimizing effort w. r. t. time and costAi 02 00019 i003Ai 02 00019 i003Ai 02 00019 i001
Legend: Ai 02 00019 i003 rather insufficient, Ai 02 00019 i001 barely sufficient, Ai 02 00019 i002 moderately sufficient, Ai 02 00019 i004 very sufficient
Table 3. Input and output parameters for the FEA parameter study.
ParameterDescriptionUnitInput/ OutputMeanStdRange
X_T0_A0angle of tooth (degree)input55.8333.128 [ 52.5 , 60.0 ]
X_T0_W0tooth widthmminput2.500.410 [ 2.0 , 3.0 ]
X_T0_L0tooth lengthmminput2.750.251 [ 2.5 , 3.0 ]
X_T0_R1top radiusmminput0.600.246 [ 0.3 , 0.9 ]
X_T0_R2radius at tooth addendummminput0.3670.17 [ 0.2 , 0.6 ]
F form achieved forming forcekNoutput1950287.93 [ 1233 , 2567 ]
Table 4. Performance statistics after the ROPE process. Minimum (min), maximum (max), mean and the standard deviation (std) are shown in kN .
NameMinMaxMeanStd
Linear reg.178.24261.46217.7615.84
M5P159.06264.46210.9218.05
M5R192.76241.72216.908.45
Polynomial reg.185.95266.54225.1716.22
Table 5. ANOVA table for the compared performance vectors. Since the derived p-value (4.19 × 10 9 ) is smaller than the significance level (0.05), the differences are statistically significant.
SourceSSDoFMSFp
Groups10,2403341414.724.19 × 10 9
Error91,880396232.01
Total102,120399
Table 6. Pairwise comparison of performance measurements from the ROPE process. A p-value smaller than 0.05 indicates a significant difference. The algebraic sign of the mean value allows for the decision of which model is better.
A BLower LimitMean Diff.Upper Limitp
LinRegM5P1.2996.83312.3670.0082
LinRegM5R−4.6760.8586.3900.9786
LinRegPolReg−12.95−7.42−1.8830.0032
M5PM5R−11.51−5.97−0.4410.0284
M5PPolReg−19.79−14.25−8.7170.0000
M5RPolReg−13.81−8.28−2.7420.0007
Publisher’s Note: MDPI stays neutral with regard to jurisdictional claims in published maps and institutional affiliations.

