
A Technology Acceptance Model Survey of the Metaverse Prospects


Department of Natural, Engineering and Technology Sciences, Arab American University, Ramallah P600, Palestine
*
Author to whom correspondence should be addressed.
AI 2022, 3(2), 285-302; https://0-doi-org.brum.beds.ac.uk/10.3390/ai3020018
Submission received: 25 February 2022
/
Revised: 24 March 2022
/
Accepted: 8 April 2022
/
Published: 11 April 2022
(This article belongs to the Special Issue Feature Papers for AI)
Abstract
:The technology acceptance model is a widely used model to investigate whether users will accept or refuse a new technology. The Metaverse is a 3D world based on virtual reality simulation to express real life. It can be considered the next generation of using the internet. In this paper, we are going to investigate variables that may affect users’ acceptance of Metaverse technology and the relationships between those variables by applying the extended technology acceptance model to investigate many factors (namely self-efficiency, social norm, perceived curiosity, perceived pleasure, and price). The goal of understanding these factors is to know how Metaverse developers might enhance this technology to meet users’ expectations and let the users interact with this technology better. To this end, a sample of 302 educated participants of different ages was chosen to answer an online Likert scale survey ranging from 1 (strongly disagree) to 5 (strongly agree). The study found that, first, self-efficiency, perceived curiosity, and perceived pleasure positively influence perceived ease of use. Secondly, social norms, perceived pleasure, and perceived ease of use positively influences perceived usefulness. Third, perceived ease of use and perceived usefulness positively influence attitude towards Metaverse technology use, which overall will influence behavioral intention. Fourth, the relationship between price and behavioral intention was significant and negative. Finally, the study found that participants with an age of less than 20 years were the most positively accepting of Metaverse technology.
1. Introduction
The deployment of technological innovations in various areas has an effective role in facilitating human life. It has become an essential need since we have entered the era of technological revolutions. Three major technical innovation waves have been recorded from the perspective of end consumers: the arrival of personal computers, the internet, and mobile devices [1]. Virtual reality and augmented reality are examples of technologies that are driving the current fourth wave of computing innovations [2]. The upcoming wave involves Metaverse technology, as illustrated in Figure 1.
The Metaverse is a combination of the words meta (prefix meaning beyond) and universe; it combines multiple different virtual spaces (mix of virtual and augmented reality) to express real life using avatars [3]. Although the metaverse does not yet exist in its entirety, metaverse-like features can be found on various platforms that use the virtual reality concept such as Pubg and Fortnite, second life games which allow users to make avatars which already can be used in Metaverse, hold in-game events, and build virtual economies. Through this technology, developers have pushed the boundaries of what a game can be [4]. As new technology is raised, it is important to test its acceptance among users and investigate the variables that may affect the engagement of the new technology.
Researchers in the literature deploy different modeling in real-life applications. For example, the study in [5] uses the multivariate adaptive regression splines model (MARS) and proposed two methods for the MARS knot positioning which are the hill-climbing method, and the hill-climbing method using prior change in RSS information. The study in [6] offers an optimal wind turbine layout in a wind farm using support vector regression guided genetic algorithm, using such a model solve the wind warm layout optimization problem by combining the ability of each individual to adapt itself for better “fitness” with guiding information sampled from a response surface approximated by support vector regression.
Technology acceptance model was proposed by Davis [7]. He states that perceived usefulness and perceived ease of use shape users’ attitudes towards technology use [7], and that these attitudes influence users’ behavioral intention to actual usage or reject technology. It is a theoretical model that explains and offers a valuable framework for the attitudes toward new technology [8]. Perceived usefulness and ease of use are the most critical variables that influence the use or rejection of new technology, which is also affected by other factors variables. A large number of studies used the technology acceptance model to investigate the attitude of new technologies. The authors of [9] investigated students’ attitudes towards E-learning technology and found that the students’ perceived usefulness, efficiency, and effectiveness affect the acceptance of the technology. The study in [10] investigates the antecedents to users’ decisions to revisit sites relevant to their jobs and found that the ease of understanding and finding affect perceived ease of use and usefulness affected by information quality. The study in [11] investigates the intention to use healthcare information systems and found that service quality, system quality, and information efficiency positively affect the perceived ease of use and usefulness.
Since Metaverse is a mix of virtual reality, augmented reality, and real-life, in this section we will review some of these studies. The study in [12] investigates the intention to use virtual reality and augmented reality technologies in classrooms. It found that technological pedagogical and content knowledge has a significant influence on perceived usefulness and perceived ease of use. In contrast, social norm influenced perceived usefulness, perceived ease of use, ultimately affecting attitudes toward technology use and then behavioral intention. The study in [13] investigates the factors that affect users’ intention to use virtual reality in a dynamic learning environment and found that perceived health risk, enjoyment, behavioral control, performance expectancy, self-efficiency were directly or indirectly impact behavioral intention. Ref. [14] investigates the factors that affect the attitude towards training and learning virtual reality technologies, and found that the interactivity of the virtual reality technology positively affects the desire to use it. The study in [15] investigates the factors that influence the intention to use the virtual reality headset and purchase intention and found that variables such as effort expectancy, price effectiveness, and facilitation conditions are the influencing factors that directly determine the purchase intention. The study in [16] used a technology acceptance model on anatomy learning using augmented reality and found that the factors of ease, usefulness, interest, and pleasure have positively affected the intention of use.
Since Mark Zuckerberg’s July announcement of Facebook’s intention to create a future Metaverse [17], many researchers have envisioned the structure, business model, and challenges for the new technology. Some of these studies which are related to the Metaverse in the literature including [18], which offers a virtual ecosystem, and research agenda for the metaverse; Ref. [19], which discusses the nature of Metaverse, some of the problems and challenges, and the first application areas of Metaverse; and [20], which analyses interest on the user side, the media side, and the research side to provide stakeholder insights into the successful adoption and growth of the Metaverse.
The study in [21] tests the intention of using metaverse in Korea and found that self-efficacy, social influence, perceived pleasure, and interactivity positively influence perceived ease. Interactivity and social influence had a significant effect on perceived usefulness. A study in [22] tested intention to use the Metaverse at Seol University using several factors and finds that perceived usefulness and perceived ease influence intention to use the Metaverse, perceived ease of use has an influence on perceived usefulness, content quality, perceived playfulness affect perceived usefulness, and social influence affects perceived usefulness and intention to use the Metaverse. Self-efficacy has influenced perceived ease and intention to use a Metaverse.
Due to accelerating technological development, it is essential to explain and review the behavioral acceptance of these technologies [23]. The intent is to fill a gap in the literature by testing the intention of Palestinian users towards using Metaverse and determining the factors affecting it and the relation between these factors. This will offer a possible understanding of Palestinian users and their potential behavior that may affect the use of Metaverse. By understanding these factors, the producers of the Metaverse technology may know how to motivate them to use Metaverse and interact with this technology in a better way.
The remainder of the paper is structured as follows: Section 2 describes the methodology used to investigate variables affecting the acceptance of Metaverse technology. Section 3 describes the present study results, Section 4 discusses the results and highlights motivations for future directions. Section 5 draws the paper’s overall conclusions.
2. Materials and Methods
2.1. Research Type
Based on previous related studies [24,25,26], a quantitative survey via a questionnaire was used. A Likert-scale survey was undertaken to investigate people’s attitudes towards Metaverse technology by investigating the variables that may affect their attitudes. The questionnaire can be distributed to a large number of participants, it is simple to construct and manage, and respondents have more flexibility in selecting their responses. At the same time, the data analysis can be carried out using computers in a fast and easy way [27]. The methodology used in this research is shown in Figure 2.
As shown in Figure 2, the methodology followed a five-stage research process: research and questionnaire design; hologram experiment; data collection; data analysis; and results and discussions.
2.2. Hologram Experiment
2.2.1. Methodology
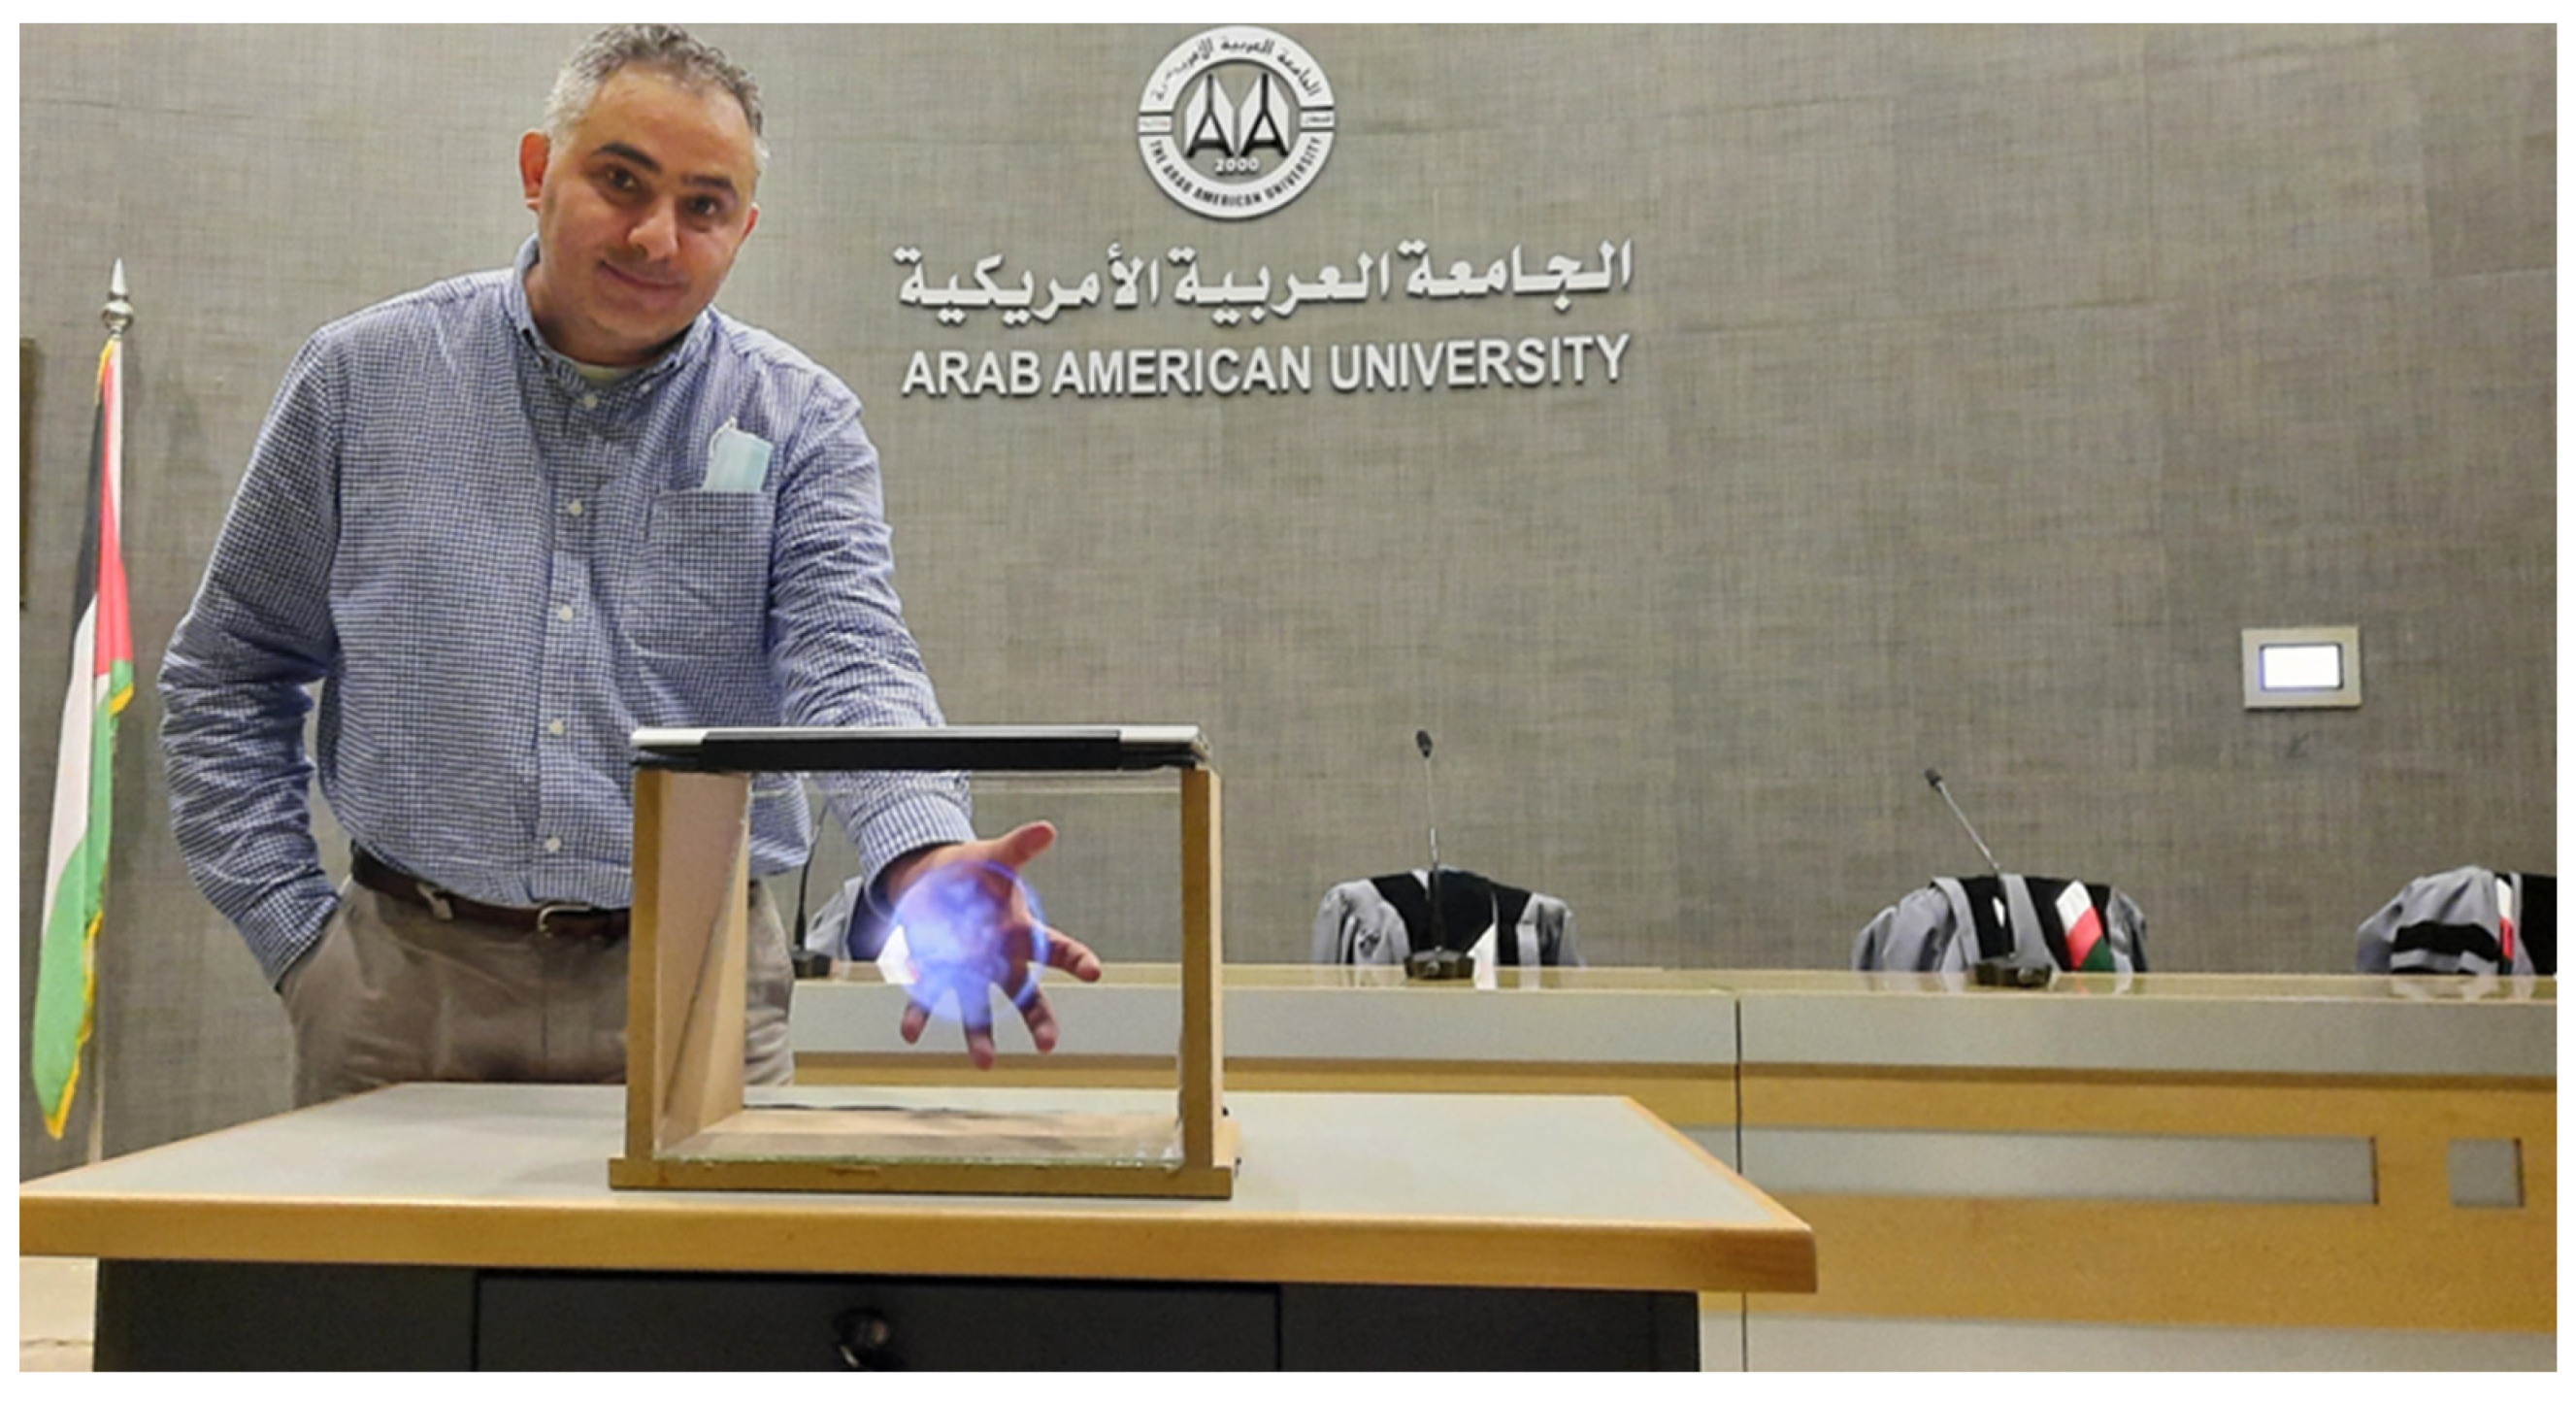
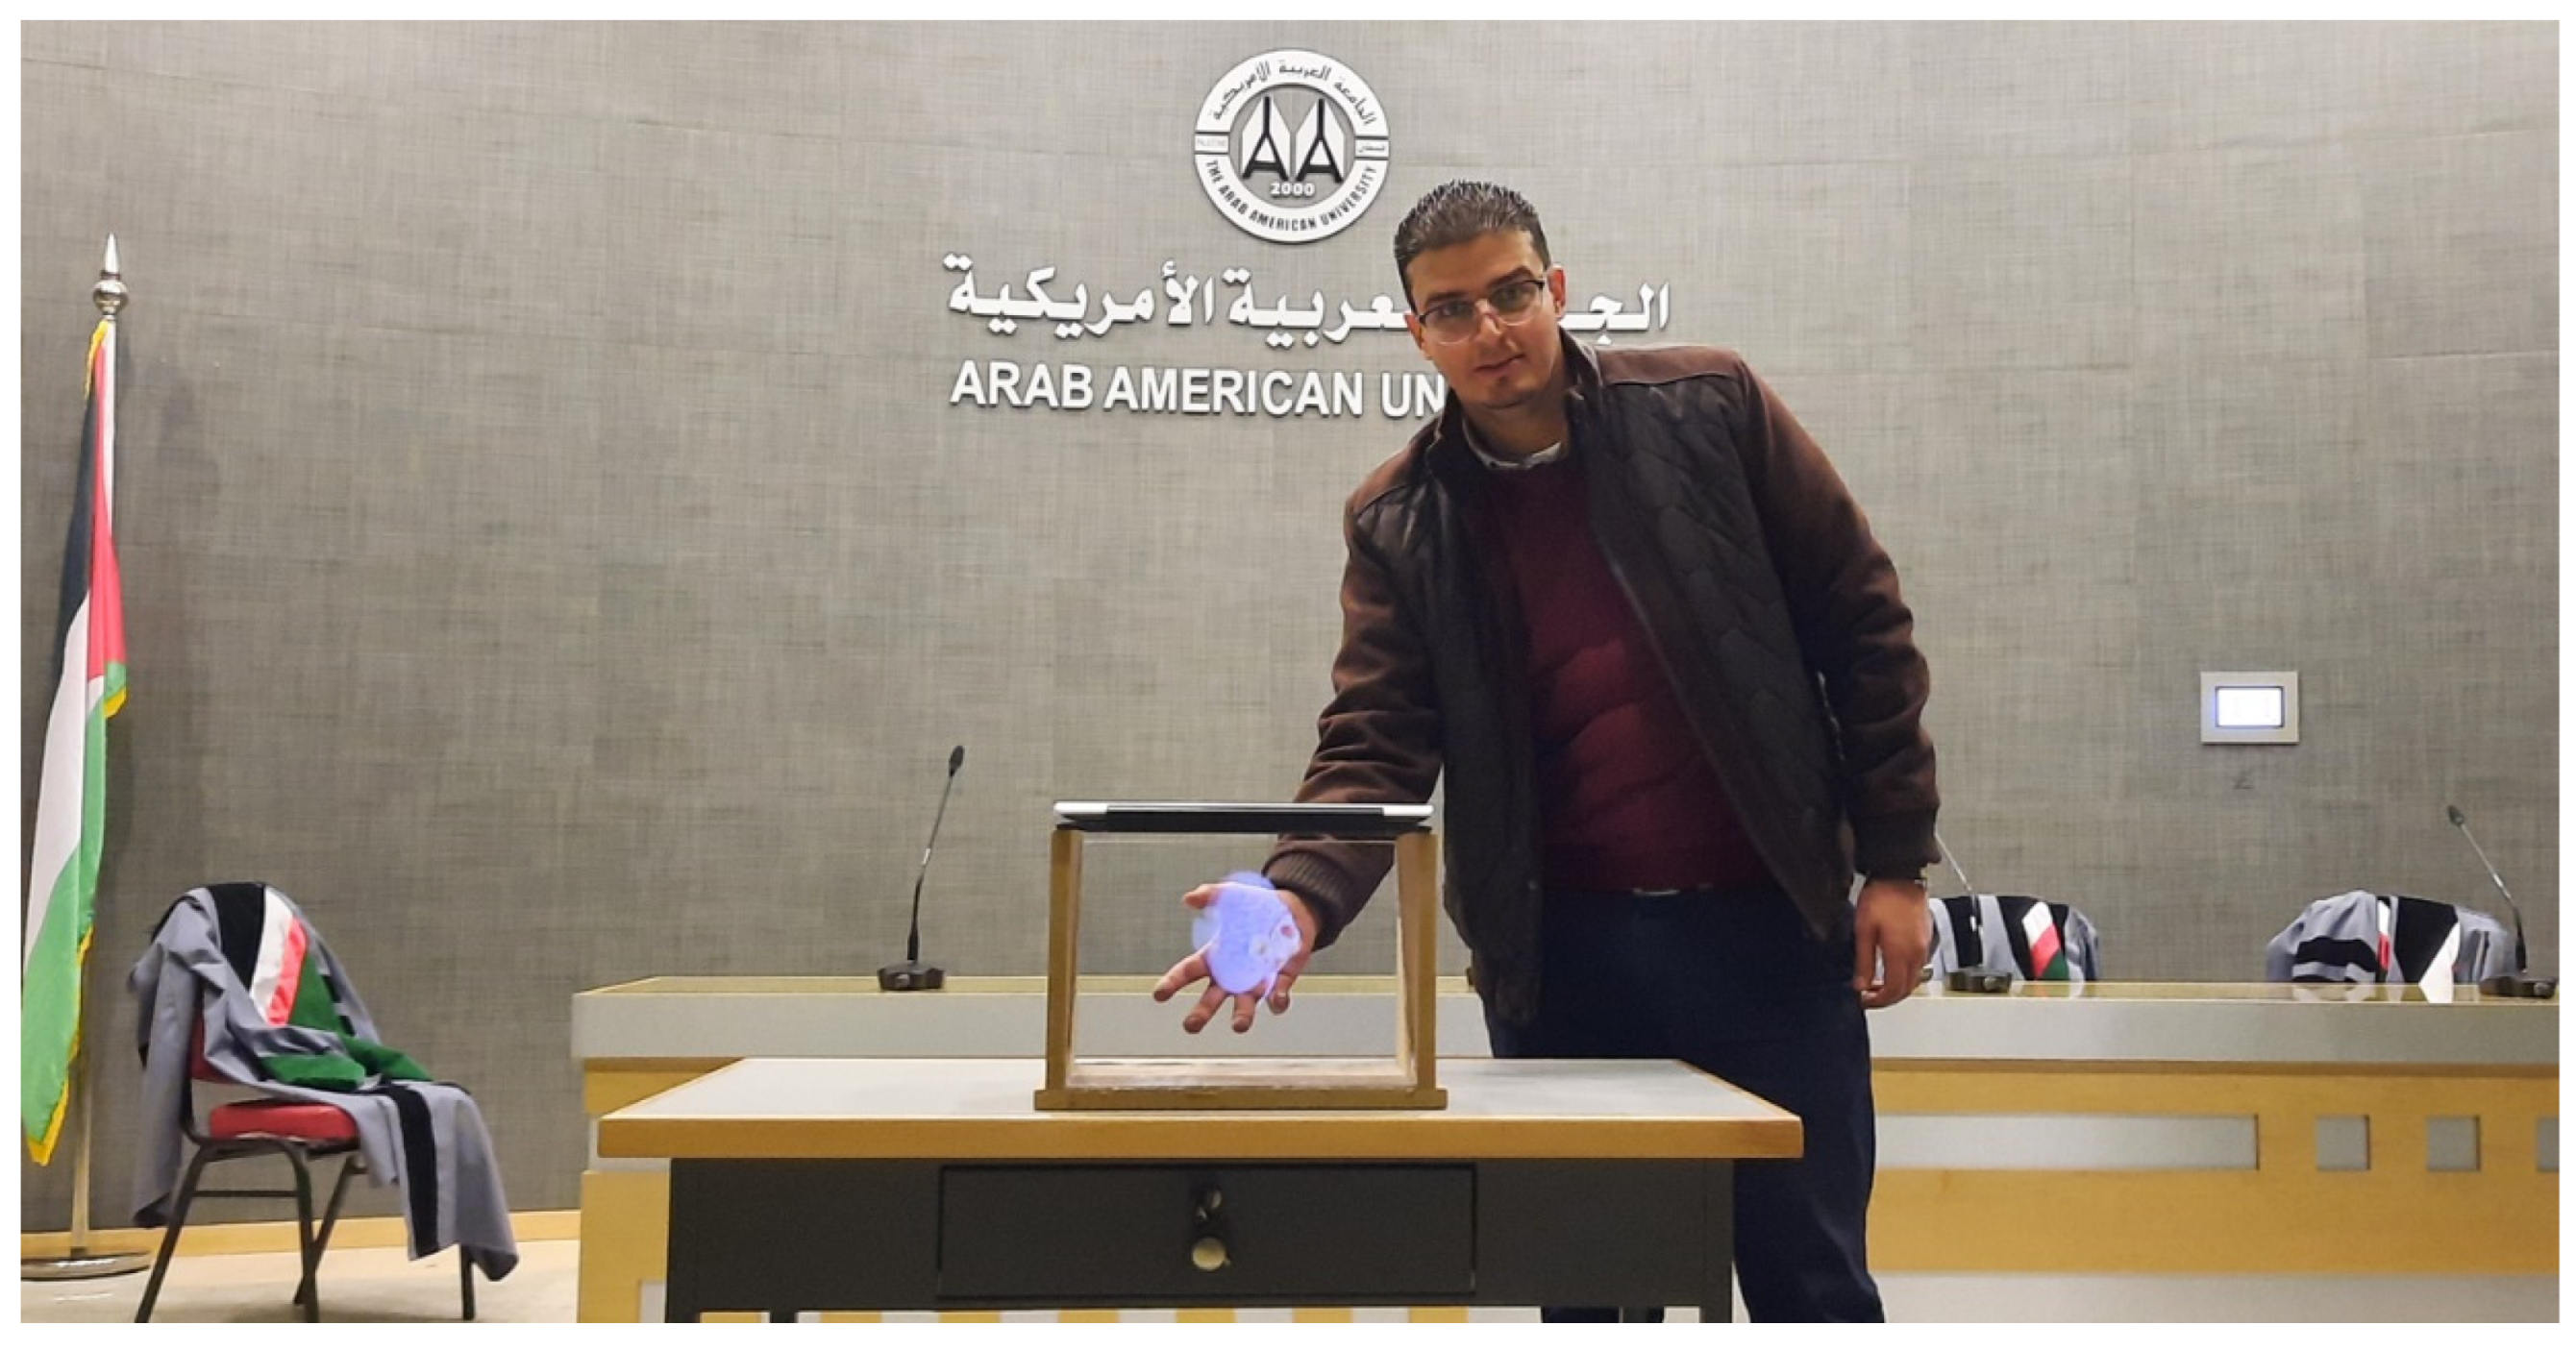
We experimented with a simple hologram projector based on a video reflection on a 45-degree glass within a woody box. After building the box, we brought a laptop and played one face hologram video from YouTube. Then, we put the laptop upside down over the woody box to get the hologram experience. Note that the box should be placed in a somewhat dark environment to get a better picture while experimenting. The experiment with the hologram projector attracted the people’s attention within our institution, the Arab American University. After conducting this experiment, we use to ask people to fill out the survey. The motivation of conducting the hologram experiment is to let the people understand what we mean by Metaverse and put them in the picture of our research idea; it was an approach to encourage people to fill out the survey. By letting them have a hologram experience, we get people’s attention and make them curious to ask what is happening. After that, we asked them to fill out the survey.
Figure 3 shows the box we made to simulate the hologram projector. The box consisting of three pieces of wood namely: side 1 (22 cm width * 23 cm height), side 2 (22 cm width * 23 cm height), and the base (32 cm width * 22 cm length). In addition, a piece of glass (30 cm width * 30 cm length) is used as illustrated in Figure 3. After installing side 1 and side 2 on the base, we installed the glass with 45-degree within the woody pieces.
2.2.2. Result
After performing the methodology described in Section 2.2. We use to play one face hologram video on the top of the woody box. Then we put a laptop to perform the Hologram experiment and the results obtained are illustrated in Figure 4, Figure 5 and Figure 6.
2.3. Survey Experiment
2.3.1. Methodology
Due to time limitations, convenience sampling (non-probabilistic) was chosen. convenience sampling collects samples from the community based on the researchers’ ease of access and closeness to the community. In this study, we decided to choose a sample of educated participants since we believe that they are mature enough to understand the new technology as they are familiar with the usage of the technology during their study. The survey was distributed as a link to give the participants the freedom to answer it. The link was sent to 350 individuals in Palestine via social media platforms (Facebook, WhatsApp), and we obtained 302 complete responses with a response rate of 86.28%. The sample size in this research was chosen based on other studies, for example, the study in [12] tested 292 in-service teachers about their deployment of virtual reality devices in learning by applying an extended technology acceptance model, the study in [21] used a sample of 22 participants to test the intention to use Metaverse platforms using technology acceptance model, and the study in [24], use a sample of 108 participants to investigate the variables influence using smart homes technologies.
2.3.2. Result
The participant’s demography includes (185) males and (117) females; we got (80) responses with age less than 20, (97) responses with age from 20–30 years, (93) responses from 31–40 years old, and (31) responses with age from 41 years and more. The most significant percentage of responses was at the education level of Bachelor degree (155) response with a percent of (51.3%), and age from 20–30 (97) responses with percent of (32.1%) as illustrated in Figure 7.
2.4. Data Collection and Analysis
This research used qualitative and quantitative research methods. After experimenting, the Likert scale survey was sent to let volunteers fill it; the survey included an introduction about Metaverse technology to give the participant a better understanding of the subject of the study. The first section in the survey consists of three questions about the demographical information gender, age, and educational level, the second section consists of a 5-point Likert scale ranging from “strongly disagree” (1) to “strongly agree” (5), and 15 questions to measure variables that may affect the use of Metaverse technology. We got 305 responses; three responses were excluded due to incompletion. After cleaning and preparing the data set, data were analyzed using SPSS version 26 and Excel. Table 1 shows the survey questions used in this research.
2.5. Research Model
Based on several investigations, the technology acceptance model is the most generally used model for explaining technology acceptance [18]. The initial technology acceptance model included two exogenous variables: perceived usefulness and perceived ease of use, both of which have a direct impact on attitudes toward technology use and, as a result, influence behavioral intention [31]. Many studies consider other external elements that influence perceived usefulness or ease of use to understand better new technologies [20,21], the external factors incorporated into extended technology acceptance model are diverse, depending on the disciplines and technology used.
As a result, this study will use the extended technology acceptance model using external variables shown in Figure 8, which are: self-efficiency, social norm, perceived curiosity, perceived pleasure, and price, and investigate their attitude towards technology use which will influence the behavioral intention to use or reject the Metaverse technology.
Perceived usefulness and perceived ease of use: Perceived usefulness is defined as the degree to which a person’s belief that using a specific technology will help them perform better, perceived ease of use is the degree to which a person can treat and interact with technology without complications or effort, the connection between perceived ease of use and perceived usefulness can be traced back to [7]. It was predicted that if the technology is easy to use, this will improve its usefulness. Many other investigations [28,32] have confirmed this relationship between perceived ease of use and perceived usefulness. Attitude towards technology use refers to the user acceptance or rejection to use a technology [33]. Behavioral intention is a measure of how much a person is willing to put in the effort to complete a behavior [34]. When assuming these factors together, the model tells us that when a user interacts with a new technology that is useful, simple to use, and valuable, the user will have a positive attitude, which will increase the intention to use that technology. For this study, the following hypothesis is proposed.
Hypothesis 1.
Perceived ease of use positively influences perceived usefulness.
Hypothesis 2.
Perceived ease of use positively influences attitude towards technology.
Hypothesis 3.
Perceived usefulness positively influences attitude towards technology.
Hypothesis 4.
Attitude towards technology use positively influences behavioral intention.
Price is the price of the Metaverse equipment that utilized to interact throw Metaverse platforms when the cost of the technology meets the expectations of the users that will facilitate the purchase process [35], and this will affect the attitude towards Metaverse technology use, that’s mean when the price of expected technology will be high this will lead to the technology rejection.
Hypothesis 5.
price negatively influences attitude towards technology use.
Hypothesis 6.
price negatively influences behavioral intention.
Perceived curiosity is a strong internal desire to learn new things that drive human activity and triggers information seeking [36,37,38]. Interest curiosity, in particular, relates to the pleasant sensation of gaining knowledge, which pushes people to learn how to use technology. As a result, curious people learn faster and think of advances as being simpler to use [28]. Overall, the more interested people in virtual reality equipment will influence perceived ease of use as soon as Metaverse depends on virtual reality equipment.
Hypothesis 7.
perceived curiosity positively influences perceived ease of use.
Perceived pleasure can be defined as the level of interest in consumers’ information while interacting in a particular media environment and perceiving it as cognitively enjoyable [39]. This perceived level of enjoyment aids users in gaining a better understanding of new technology by allowing them to enjoy using it. Users who believe that using a particular technology is pleasurable are also more likely to think that it is valuable and easy to use [40], and this will positively affect the attitude towards technology use [29,41].
Hypothesis 8.
perceived pleasure positively influences perceived ease of use.
Hypothesis 9.
perceived pleasure positively influences perceived usefulness.
Self-efficiency can be defined as how a person has faith in completing a task successfully with no complications [42]. People with better self-efficacy are more optimistic about utilizing new information technology, have an easier time accepting it, and have a higher sense of satisfaction [43,44]. In other words, expectations and perceptions that one can study and select new technologies on one’s own and apply and perform them quickly have a positive impact on the perceived usefulness of technology [45]. The study of [46] discovered that self-efficacy impacts the perceived utility of social media platforms such as Facebook, YouTube, Twitter, and Wikipedia in 2011, when social media was spread and launched in earnest. It was found to have a statistically significant favorable impact on perceived ease. Otherwise, the study of [47] validates the relationship between self-efficacy and perceived ease of use; he found that students’ belief in their self-efficiency will positively influence the perceived ease of use.
Hypothesis 10.
self-efficacy positively influences perceived ease of use.
Hypothesis 11.
self-efficacy positively influences perceived usefulness.
Social norm refers to people’s societal pressure when deciding whether or not to do something [48]. In other words, the social norm is the impact of others on the decision to engage in a specific action (using technology) [49]. It serves as a justification for people to engage in the behavior [45]. Social norm was not found to have a substantial impact on technology acceptance model in early studies; on the other hand, social norm was proven as a critical direct factor of intention in later investigations [12], mainly when organization-wide technology adoption was mandatory [45,50]. Several researchers [45,51,52,53] support the positive influence of social norm on perceived usefulness, and a study of the technology acceptance model found a significant association between social norm and perceived usefulness (91.6%) [50].
Hypothesis 12.
social norm significantly influences perceived usefulness.
3. Results
3.1. Statistics Analysis
Analysis of the data was performed using SPSS version 26. The data analysis followed similar statistical methods as previous studies in other fields [54,55,56]. The Pearson correlation coefficient was used to investigate whether there is a significant correlation between the variables that may affect the use of Metaverse technology. The technique of multiple linear regression was used through forwarding selection methods. The study is defined as trustworthy, as the Cronbach alpha value of the scale (survey questions) is 0.772.
Correlations between factors were implemented. Table 2 shows that there is a negative correlation, weak positive correlation and moderate positive correlations between variables. The correlation coefficients vary from (+1 > r > −1) the relationship between variables is considered weak when (0.3 < r < 0.5), moderate relation when (0.5 < r < 0.7), and strong relation when (0.5 < r < 0.7) [57]. Finally, most of the variables were positively correlated to each other, except for the following which were negatively correlated: (self-efficiency and social norm), (price and self-efficiency), and (price and attitude towards technology use).
From the descriptive statistics on the variables shown in Table 3, it can be seen that the mean is varied from (3.306–4.053), and the standard deviation is from (0.637–0.965). The maximum mean was for the behavioral intention with a value of (4.053), and the minimum was for the perceived curiosity with a value of (3.306). The Likert scale questionnaire was scaled from 1 (strongly disagree) to 5 (strongly agree) and the general indication was agree or strongly agree.
Table 4 shows the descriptive statistics on the survey questions, the mean values are varied from (2.828–4.053), and the standard deviation values are varied from (0.649–1.235).
The maximum mean was found to be for question 14 (I intend to use Metaverse in the future) and it is 4.053, this value indicate that most answers on the question was agreement. The minimum mean was found to be related to question 2 (I need specialist help to use the Metaverse equipment) with value of 2.828, this value indicates that most answers on question 2 were in disagreement.
Cronbach’s alpha tests is used to see if the multiple-question Likert scale surveys are reliable, its is a measure of internal consistency (that is, how closely related a set of items are as a group) [58]. The scale’s reliability analysis was measured using SPSS version 26, and Table 5 shows the Cronbach’s alpha value of the scale (the survey questions) α = 0.772, which is an indication acceptance as reported in [59].
The results presented in Table 6 are obtained using the SPSS software version 26 after we run a linear regression model to find the relationship between our variables and the tested hypothesis based on the p-value. As shown in Table 6, all hypotheses were accepted with a p-value < 0.01 and only two hypotheses were rejected (Hypothesis 5 and Hypothesis 11) with a p-value of (0.879, 0.806) respectively. Hypothesis 5: price negatively influences attitude towards technology use. Hypothesis 11: self-efficacy positively influences perceived usefulness.
3.2. Survey Questions Visualisation
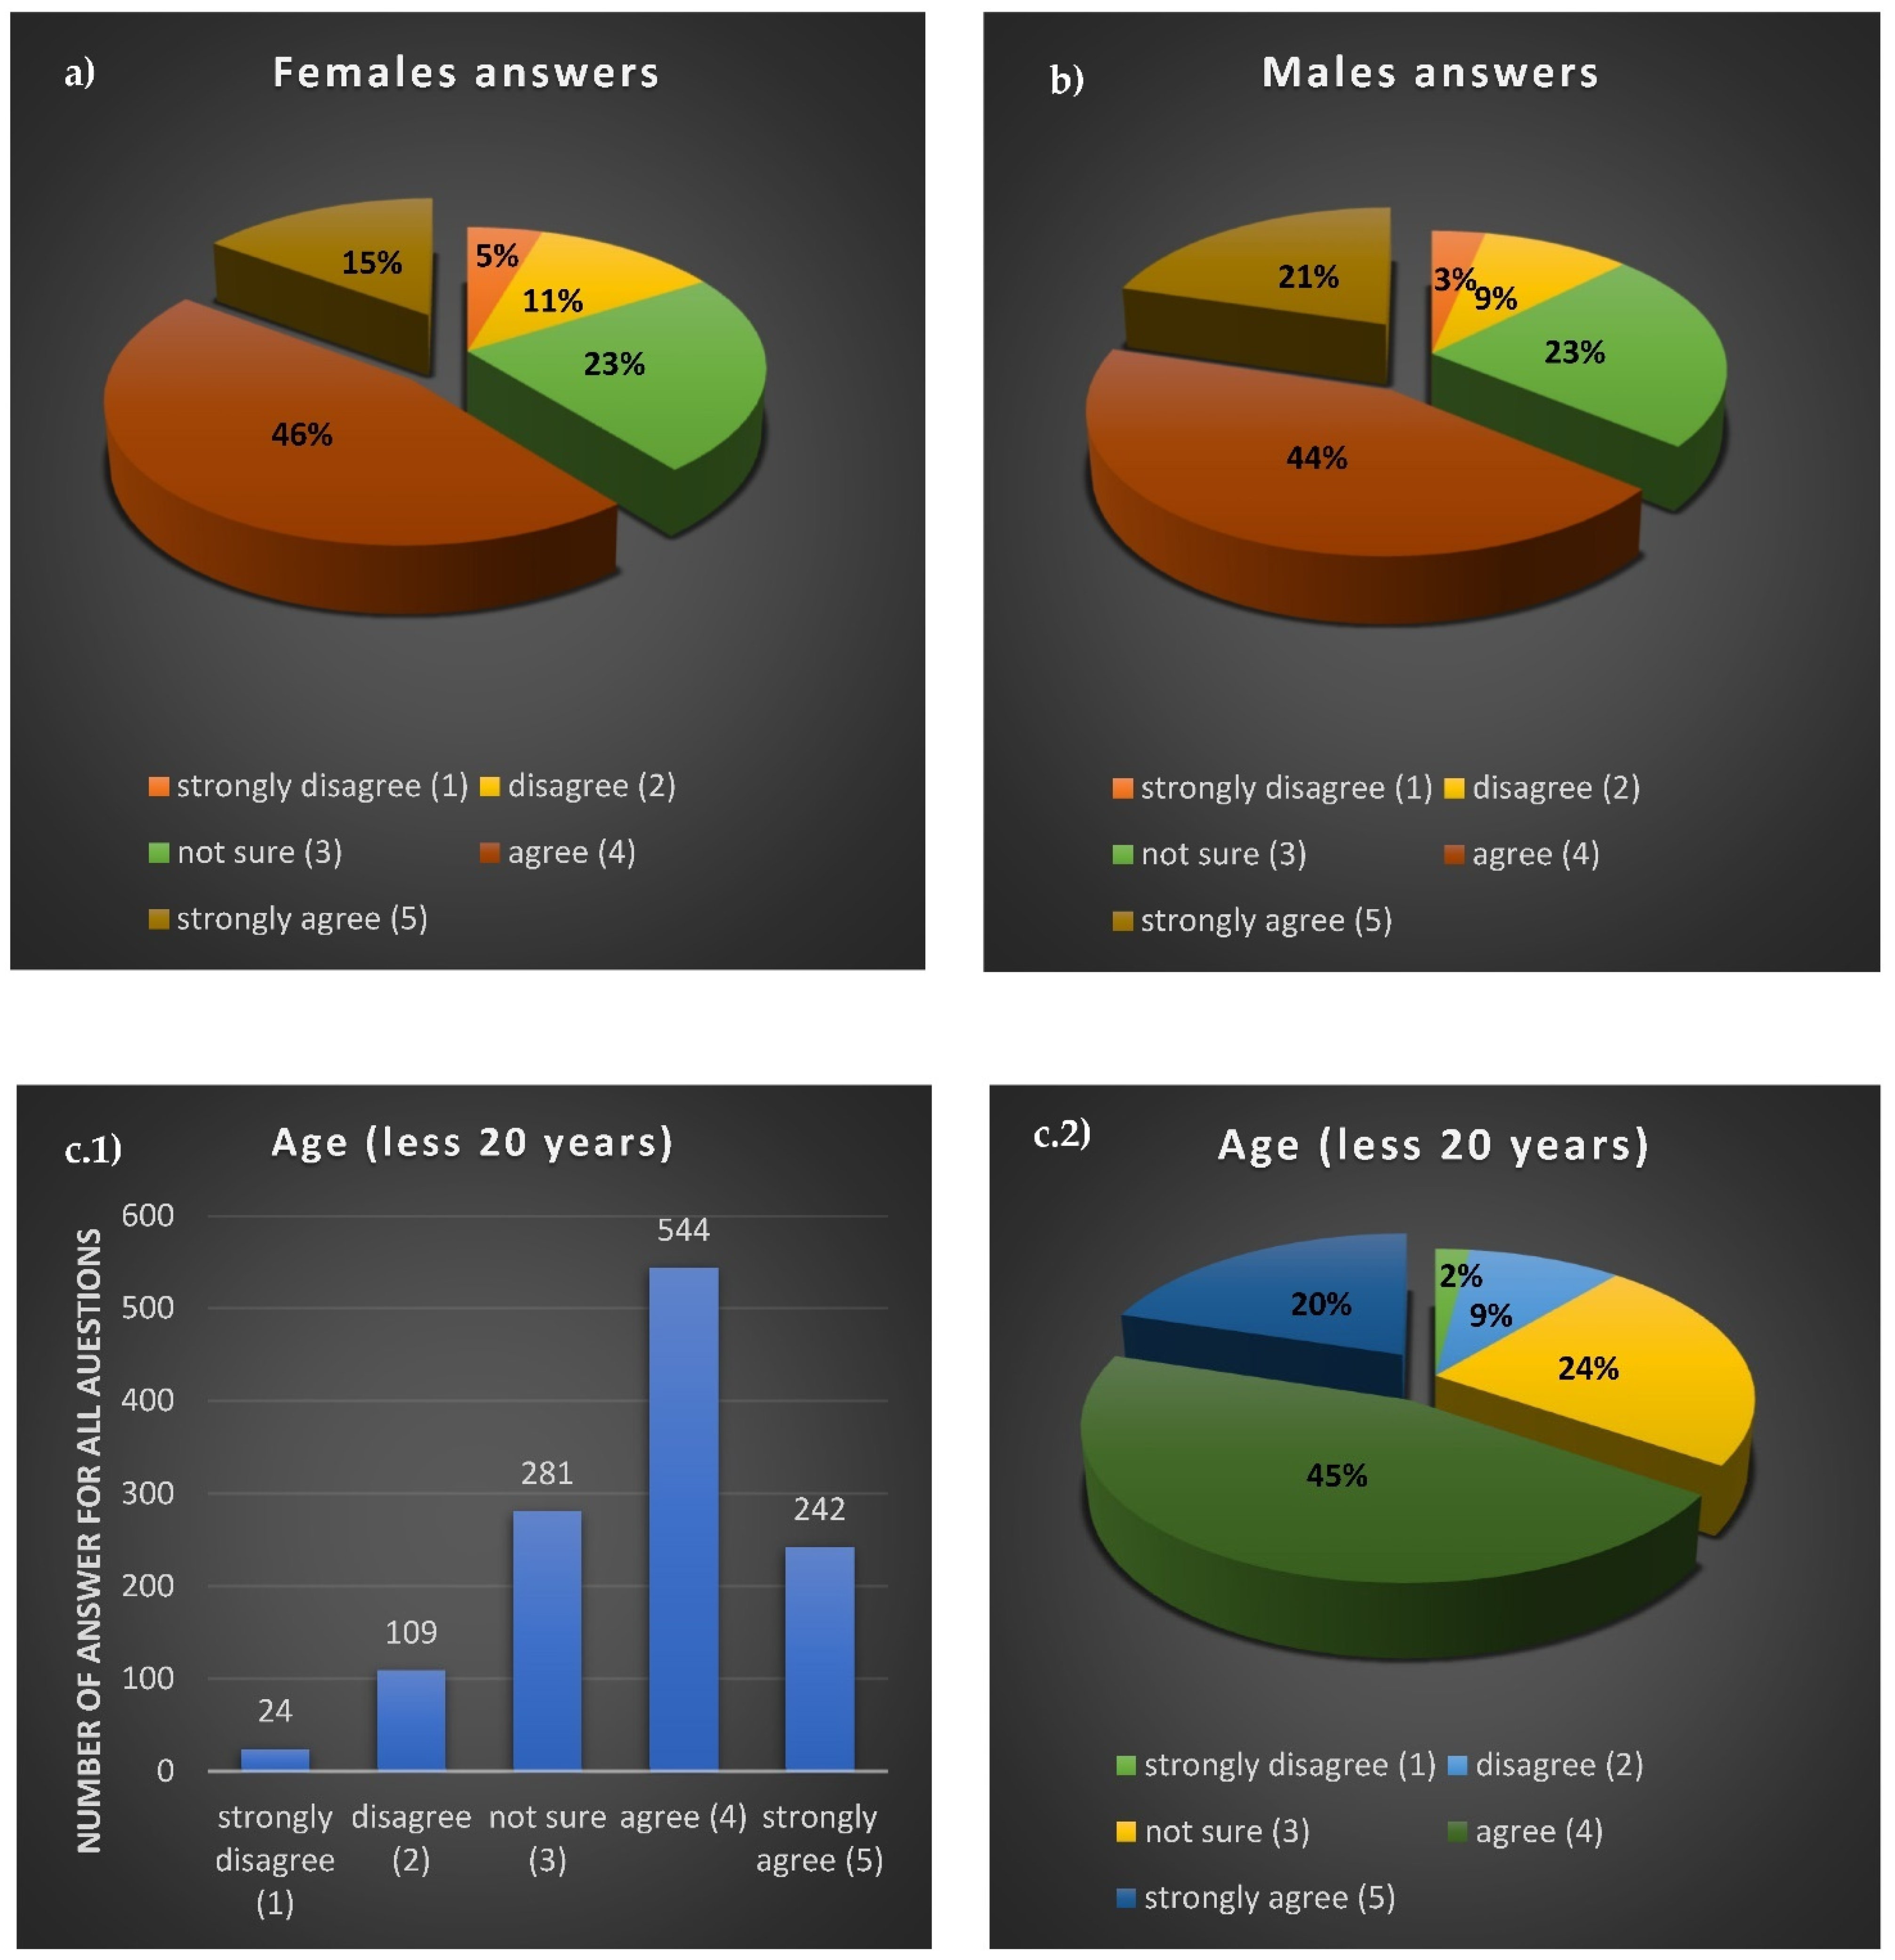
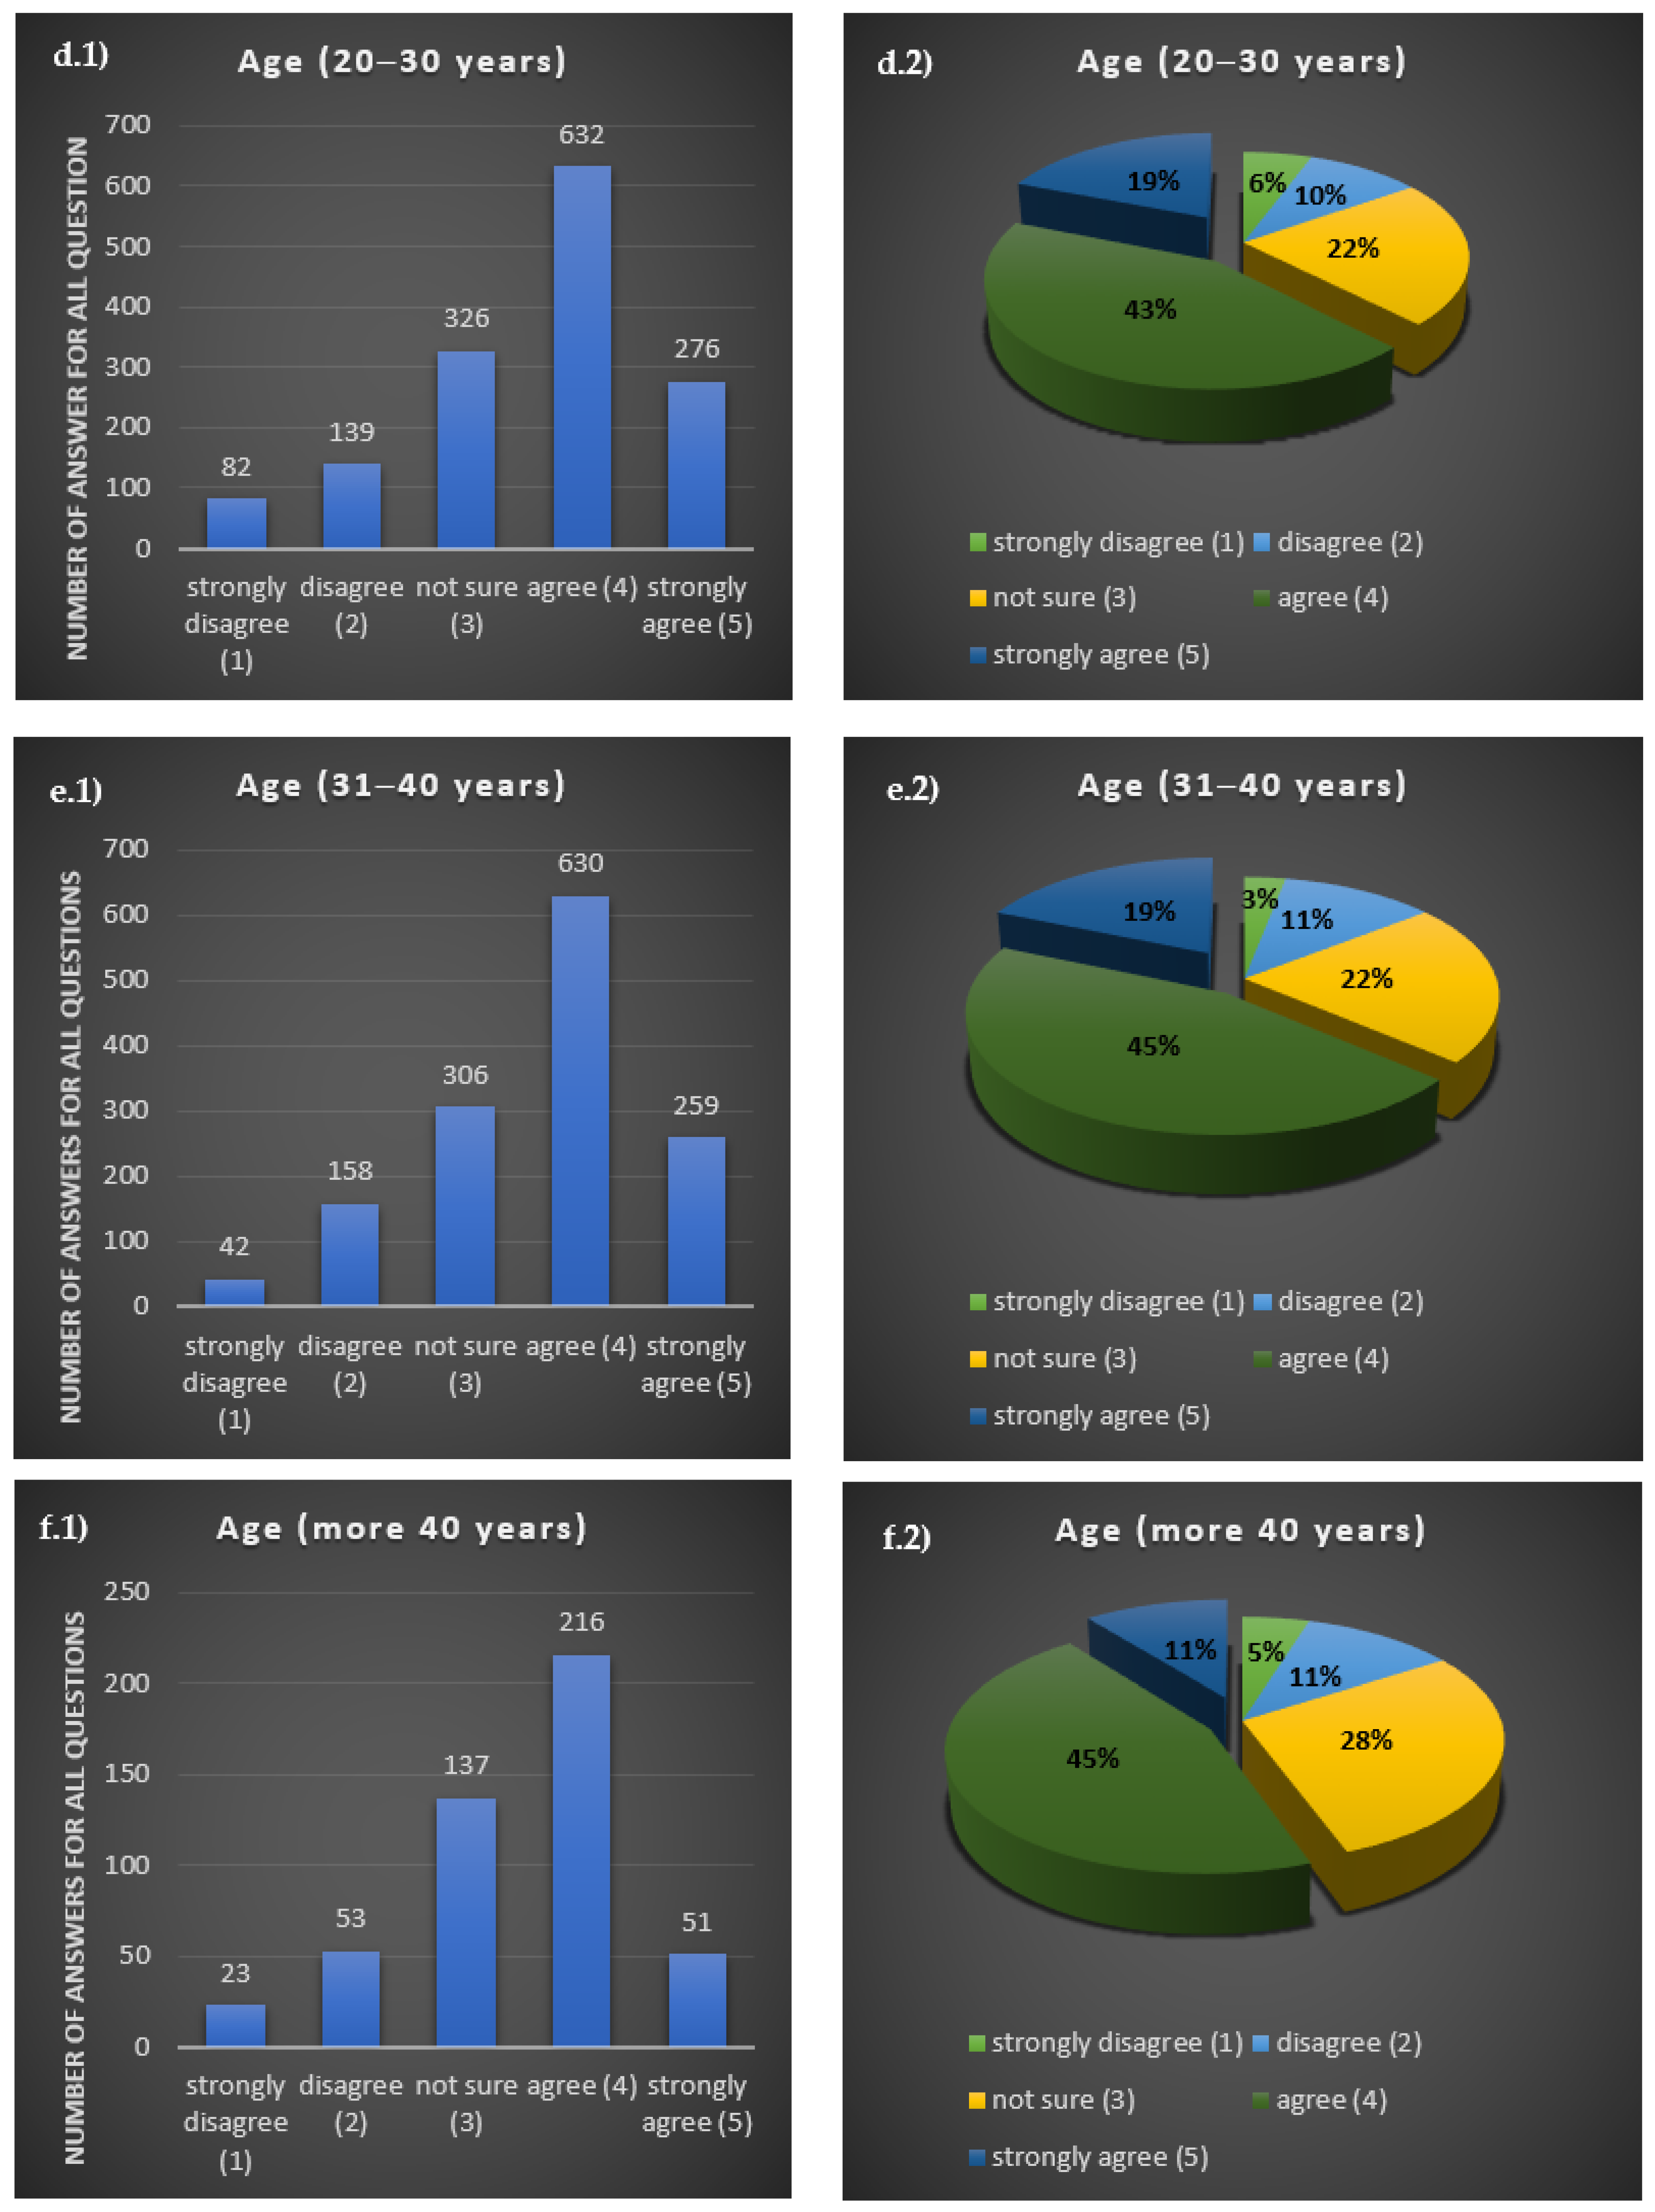
The visualization for all survey questions were implemented using excel 2019, as shown in Figure 9.
From Figure 9, it can be seen that the general indication among participants was positive toward the metaverse use, (a) shows the females answers for all survey questions (46% of answers agree, 15% of answers strongly agree), (b) shows the males answer (44% of answers agree, 21% of answers strongly agree), (c1) shows the answers of the participants with age of less than 20 years (16–20 years) (agree with 544 answers, strongly agree with 242 answers), (c2) shows the percentage of the participants answers with age of less than 20 years (16–20 years) (agree with 45%, strongly agree with 20%), (d1) shows the answers of the participants with age range from 20–30 years (agree with 632 answers, strongly agree with 276 answers), (d2) shows the percent of the participants answers with age range from 20–30 years (agree with 43%, strongly agree with 19%), (e1) shows the answers of the participants with age range from 31–40 years (agree with 630 answers, strongly agree with 259 answers), (e2) shows the percentage of the participants answers with age range from 31–40 years (agree with 45$, strongly agree with 19%), (f1) shows the answers of the participants with age more than 40 years (agree with 216 answers, strongly agree with 51 answers), (f2) shows the percentage of participants answers with age more than 40 years (agree with 45%, strongly agree with 11%).
4. Discussions
Based on the survey questions visualization in Figure 9, we notice that males (65% of answers were agreed and strongly agreed) were more interested in Metaverse technology than females. And the participants with age less than 20 were more interested in Metaverse technology than other age demography.
Perceived curiosity, perceived pleasure, and self-efficiency positively influence perceived ease of use, in other words, when Metaverse technology gives the user the pleasure and curiosity to explore it, that will help feel the ease of use of Metaverse technology.
Perceived pleasure, social norm, and perceived ease of use positively influenced perceived usefulness. In other words, the higher the technology gives the user the pleasure, the higher the user finds it useful, and when the technology is easy to use will improve its usefulness. Like other related studies, these findings suggest that social norm significantly influences perceived usefulness, which means that others’ opinions impact technology engagement.
Perceived usefulness and perceived ease of use positively influence attitude towards Metaverse technology use; this means when the Metaverse technology is useful and easy to use, the user will have a positive attitude towards it, which will positively influence behavioral intention.
Price negatively influences behavioral intention. This means that the Metaverse technology cost must be low and meet users’ expectations to have a positive intention to such new technology.
The relation between variables in the present study is in the same line with other related studies in the field [7,15,21,22,28,32].
In future work, we will consider the following: (1) increasing the sample size as this will give us a better indication of the acceptance of metaverse technology; (2) measuring other factors such as immersion, scalability, and diversity; (3) involve a diverse segment of educated and uneducated volunteers to fill out the questionnaire.
By measuring the previous factors in point 2 and examining the influence relationship between the factors with a large sample of diverse segment of educated and uneducated volunteers, research will bring a more detailed view of the Metaverse technology.
5. Conclusions
This study investigates the variables affecting the acceptance of the Metaverse technology by using extended technology acceptance model to measure different factors that may affect users’ behaviour and the relation between these variables and found that, first, the general indication among participants was positive toward the Metaverse use, and the males were more curious to try the Metaverse technology. Second, the study indicates that there is a significant negative relationship between price and behavioral intention, a significant positive relationship between other variables (social norm, self-efficiency, perceived pleasure, perceived curiosity, perceived usefulness, perceived ease of use, attitude towards Metaverse technology use, and behavioral intention). Finally, the relation between price and attitude towards Metaverse technology use was not significant; the relation between self-efficiency and perceived usefulness was insignificant (hypothesis 5, hypothesis 11 are rejected). In this research quantitative and qualitative research methods were used as well as hologram simulation was conducted to facilitate the understanding of research context. Then, a 5-point Likert-scale survey was deployed for data collection.
Author Contributions
A.M.A. designed and built the model, processed the data, and wrote the first draft of the manuscript; A.Y.O. helped in the interpretation of the results, helped in the data collection and in the data visualisation. A.Y.O. revised and edited the manuscript. M.O. helped in the experimental work and in the data collection. All authors have read and agreed to the published version of the manuscript.
Funding
This research received no external funding.
Institutional Review Board Statement
Not applicable.
Informed Consent Statement
Not applicable.
Data Availability Statement
Data used for this article were collected by the research team and will be given to other researchers upon request.
Conflicts of Interest
The authors declare no conflict of interest.
References
- Mystakidis, S. Metaverse. Encyclopedia 2022, 2, 486–497. [Google Scholar] [CrossRef]
- Kamenov, K. Immersive Experience—The 4th Wave in Tech: Learning the Ropes. 2017. Available online: https://www.accenture.com/gb-en/blogs/blogs-immersive-experience-wave-learning-ropes (accessed on 2 February 2022).
- Sparkes, M. What is a metaverse. New Sci. 2021, 251, 18. [Google Scholar] [CrossRef]
- Loespradit, J. Martechthai; Marketing Technology Trend: Bangkok, Thailand, 2021; Available online: https://www.martechthai.com/technology/what-is-metaverse/ (accessed on 13 February 2022).
- Ju, X.; Chen, V.C.; Rosenberger, J.M.; Liu, F. Fast knot optimization for multivariate adaptive regression splines using hill climbing methods. Expert Syst. Appl. 2021, 171, 114565. [Google Scholar] [CrossRef]
- Ju, X.; Liu, F.; Wang, L.; Lee, W.-J. Wind farm layout optimization based on support vector regression guided genetic algorithm with consideration of participation among landowners. Energy Convers. Manag. 2019, 196, 1267–1281. [Google Scholar] [CrossRef]
- Davis, F.D. Perceived Usefulness, Perceived Ease of Use, and User Acceptance of Information Technology. JSTOR 1989, 13, 319–340. [Google Scholar] [CrossRef] [Green Version]
- Charness, N.; Boot, W.R. Technology, Gaming, and Social Networking. In Handbook of the Psychology of Aging, 8th ed.; Schaie, W.K., Willis, S.L., Eds.; Academic Press: Cambridge, MA, USA, 2016; pp. 389–407. [Google Scholar]
- Masrom, M. Technology Acceptance Model and E-learning. Technology 2007, 21, 81. [Google Scholar]
- Ledere, A.L.; Maupin, D.J.; Sena, M.P.; Zhuang, Y. The technology acceptance model and the World Wide Web. Decis. Support Syst. 2000, 29, 269–282. [Google Scholar] [CrossRef]
- Pai, F.-Y.; Huang, K.I. Applying the Technology Acceptance Model to the introduction of healthcare information systems. Technol. Forecast. Soc. Chang. 2011, 78, 650–660. [Google Scholar] [CrossRef]
- Jaehong, J.; Yujung, K.; Won, S.S.; Insook, H. Augmented Reality and Virtual Reality for Learning: An Examination Using an Extended Technology Acceptance Model. IEEE Access 2021, 9, 6798–6809. [Google Scholar] [CrossRef]
- Fussell, S.G.; Truong, D. Using virtual reality for dynamic learning: An extended technology acceptance model. Virtual Real. 2021, 26, 249–267. [Google Scholar] [CrossRef]
- Lin, P.H.; Yeh, S.C. How Motion-Control Influences a VR-Supported Technology for Mental Rotation Learning: From the Perspectives of Playfulness, Gender Difference and Technology Acceptance Model. Int. J. Hum. Comput. Interact. 2019, 35, 1736–1746. [Google Scholar] [CrossRef]
- Huang, C.-H.; Kao, Y. -H. UTAUT2 Based Predictions of Factors Influencing the Technology Acceptance of Phablets by DNP. Math. Probl. Eng. 2015, 1, 1–23. [Google Scholar] [CrossRef] [Green Version]
- Jiwon, A. Technology acceptance and influencing factor. J. Korea Convvergence Soc. 2019, 10, 487–494. [Google Scholar]
- Pierce, D. Protocol. The People, Power, and Politics of Tech. 2021. Available online: https://www.protocol.com/facebook-meta-metaverse (accessed on 13 February 2022).
- Lee, L.H.; Braud, T.; Zhou, P.; Wang, L.; Xu, D.; Lin, Z.; Kumar, A.; Bermejo, C.; Hui, P. All One Needs to Know about Metaverse: A Complete Survey on Technological Singularity, Virtual Ecosystem, and Research Agenda. arXiv 2021, arXiv:2110.05352. [Google Scholar]
- Ning, H.; Wang, H.; Lin, Y.; Wang, W.; Dhelim, S.; Farha, F.; Ding, J.; Daneshmand, M. A Survey on Metaverse: The State-of-the-art, Technologies, Applications, and Challenges. arXiv 2021, arXiv:2111.09673. [Google Scholar]
- Young, L.J. A Study on Metaverse Hype for Sustainable Growth. Int. J. Adv. Smart Converg. 2021, 10, 72–80. [Google Scholar]
- Kyung, P.S.; Ji, K.Y. A Study on the intentions of early users of metaverse platforms using the Technology Acceptance Model. J. Digit. Converg. 2021, 19, 275–285. [Google Scholar]
- Oh, J.H. A Study on Factors Affecting the Intention to Use the Metaverse by Applying the Extended Technology Acceptance Model(ETAM): Focused on the Virtual World Metaverse. J. Korea Contents Assoc. 2021, 21, 204–216. [Google Scholar]
- Mengqiu, L.; Yun, P.J.; Eun, L.H. Technology Acceptance Model in Live Commerce Context: The Effect of Para-social Interactivity and Source Characteristics on Consumers’ Shopping Intention on Live Commerce Platform. J. Korea Contents Assoc. 2021, 21, 138–154. [Google Scholar]
- Pliatsikas, P.; Economides, A.A. Factors Influencing Intention of Greek Consumers to Use Smart. Appl. Syst. Innov 2022, 5, 26. [Google Scholar] [CrossRef]
- Song, Y.; Yang, Y.; Cheng, P. The Investigation of Adoption of Voice-User Interface (VUI) in Smart Home Systems among Chinese Older Adults. Sensors 2022, 22, 1614. [Google Scholar] [CrossRef]
- Lu, Y.; Deng, Y. What Drives Construction Practitioners’ Acceptance of Intelligent Surveillance Systems? An Extended Technology Acceptance Model. Buildings 2022, 12, 104. [Google Scholar] [CrossRef]
- Debois, S. Surveyanyplace-Blog. 2019. Available online: https://surveyanyplace.com/blog/questionnaire-pros-and-cons/ (accessed on 15 February 2022).
- Manis, K.T.; Choi, D. The virtual reality hardware acceptance model (VR-HAM): Extending and individuating the technology acceptance model (TAM) for virtual reality hardware. J. Bus. Res. 2019, 100, 503–513. [Google Scholar] [CrossRef]
- Chang, C.W.; Heo, J.; Yeh, S.C.; Han, H.Y.; Li, M. The Effects of Immersion and Interactivity on College Students’ Acceptance of a Novel VR-Supported Educational Technology for Mental Rotation. IEEE Access 2018, 6, 66590–66599. [Google Scholar] [CrossRef]
- Moon, J.W.; Kim, Y.G. Extending the TAM for a World-Wide-Web context. Inf. Manag. 2001, 38, 217–230. [Google Scholar] [CrossRef]
- Davis, F.D. A Technology Acceptance Model for Empirically Testing. Ph.D. Thesis, Massachusetts Institute of Technology, Cambridge, MA, USA, 1985. [Google Scholar]
- Lu, J.L.; Chou, H.Y.; Ling, P.C. Investigating passengers’ intentions to use technology-based self check-in services. Transp. Res. Part E: Logist. Transp. Rev. 2009, 45, 345–356. [Google Scholar] [CrossRef]
- Ajzen, I.; Fishbein, M. Attitude-behavior relations: A theoretical analysis and review of empirical research. Psychol. Bull. 1977, 84, 888–918. [Google Scholar] [CrossRef]
- Cheon, J.; Lee, S.; Crooks, S.M.; Song, J. An investigation of mobile learning readiness in higher education based on the theory of planned behavior. Comput. Educ. 2012, 59, 1054–1064. [Google Scholar] [CrossRef]
- Choi, W.S.; Kim, D.; Choi, S. Understanding factors influencing usage and purchase intention of a VR device: An extension of UTAUT2. J. Korea Soc. Comput. Inf. 2017, 18, 173–208. [Google Scholar]
- Litman, J.A.; Spielberger, C.D. Measuring Epistemic Curiosity and Its Diversive and Specific Components. J. Personal. Assess. 2010, 80, 75–86. [Google Scholar] [CrossRef]
- Hill, K.M.; Fombelle, P.W.; Sirianni, N.J. Shopping under the influence of curiosity: How retailers use mystery to drive purchase motivation. J. Bus. Res. 2016, 69, 1028–1034. [Google Scholar] [CrossRef]
- Loewenstein, G. The psychology of curiosity: A review and reinterpretation. Psychol. Bull. 1994, 116, 75–98. [Google Scholar] [CrossRef]
- Webster, J.; Trevino, L.K.; Ryan, L. The dimensionality and correlates of flow in human-computer interactions. Comput. Hum. Behav. 1993, 9, 411–426. [Google Scholar] [CrossRef]
- Abdullah, F.; Ward, R. Developing a General Extended Technology Acceptance Model for E-Learning (GETAMEL) by analysing commonly used external factors. Comput. Hum. Behav. 2016, 56, 238–256. [Google Scholar] [CrossRef]
- Abdullah, F.; Ward, R.; Ejaz, A. Investigating the influence of the most commonly used external variables of TAM on students’ Perceived Ease of Use (PEOU) and Perceived Usefulness (PU) of e-portfolios. Comput. Hum. Behav. 2016, 63, 75–90. [Google Scholar] [CrossRef]
- Bandura, A. Self-efficacy mechanism in human agency. Am. Psychol. 1982, 37, 122–147. [Google Scholar] [CrossRef]
- Venkatesh, V.; Morris, M.G. Why Don’t Men Ever Stop to Ask for Directions? Gender, Social Influence, and Their Role in Technology Acceptance and Usage Behavior. MIS Q. 2000, 24, 115–139. [Google Scholar] [CrossRef]
- Ong, C.S.; Lai, J.Y.; Wang, Y.S. Factors affecting engineers’ acceptance of asynchronous e-learning systems in high-tech compani. Inf. Manag. 2004, 41, 795–804. [Google Scholar] [CrossRef]
- Venkatesh, V.; Davis, F.D. A Theoretical Extension of the Technology Acceptance Model: Four Longitudinal Field Studies. Manag. Sci. 2000, 46, 169–332. [Google Scholar] [CrossRef] [Green Version]
- Jin, C.H.; Hyun, C.Y. Exploring the Acceptance Decision Factors of Social Media: The Relationship Between Self-Efficacy, Self-Assertion, Self-Presence, Social-Cultural-Influences and TAM. J. Ind. Econ. Bus. 2011, 24, 321–1295. [Google Scholar]
- Park, S.Y. An Analysis of the Technology Acceptance Model in Understanding University Students’ Behavioral Intention to Use e-Learning. Educ. Technol. Soc. 2009, 12, 150–163. [Google Scholar]
- Ajzen, I. The theory of planned behavior. Organ. Behav. Hum. Decis. Processes 1991, 50, 179–211. [Google Scholar] [CrossRef]
- Fishbein, M.; Icek, A. Belief, attitude, intention, and behavior: An introduction to theory and research. J. Bus. Ventur. 1977, 5, 177–189. [Google Scholar]
- Schepers, J.; Wetzels, M. A meta-analysis of the technology acceptance model: Investigating subjective norm and moderation effects. Inf. Manag. 2007, 44, 90–103. [Google Scholar] [CrossRef]
- Binyamin, S.S.; Rutter, M.J.; Smith, S. The Influence of Computer Self-efficacy and Subjective Norms on the Students’ Use of Learning Management Systems at King Abdulaziz University. Int. Jpurnal Inf. Educ. Technol. 2018, 8, 693–699. [Google Scholar] [CrossRef] [Green Version]
- Ibili, E.; Resnyansky, D.; Billinghurst, M. Applying the technology acceptance model to understand maths teachers’ perceptions towards an augmented reality tutoring system. Educ. Inf. Technol. 2019, 24, 2653–2675. [Google Scholar] [CrossRef]
- Teo, T. Factors influencing teachers’ intention to use technology: Model development and test. Comput. Educ. 2011, 57, 2432–2440. [Google Scholar] [CrossRef]
- Terzis, V.; Moridis, C.N.; Economides, A.A. The effect of emotional feedback on behavioral intention to use computer based assessment. Comput. Educ. 2012, 59, 710–721. [Google Scholar] [CrossRef]
- Nikou, S.A.; Economides, A.A. Mobile-based assessment: Investigating the factors that influence behavioral intention to use. Comput. Educ. 2017, 109, 56–73. [Google Scholar] [CrossRef]
- Nikou, S.A.; Economides, A.A.A. Factors that influence behavioral intention to use mobile-based assessment: A STEM teachers’. Br. J. Educ. Technol. (BERA) 2019, 50, 587–600. [Google Scholar] [CrossRef]
- Moore, D.S.; Notz, W.I.; Flinger, M.A. The Basic Practice of Statistics (6th ed.) chapter 4. In The Basic Practice of Statistics; W.H. Freeman and Co.: New York, NY, USA, 2013; p. 745. [Google Scholar]
- Glen, S. Cronbach’s Alpha: Definition, Interpretation, SPSS. StatisticsHowTo.com: Elementary Statistics for the Rest of Us! Available online: https://www.statisticshowto.com/probability-and-statistics/statistics-definitions/cronbachs-alpha-spss/ (accessed on 3 March 2022).
- Cortina, J.M. What is coefficient alpha? An examination of theory and applications. J. Appl. Psychol. 1993, 78, 98–104. [Google Scholar] [CrossRef]
Figure 1.
Illustration of Metaverse technology.
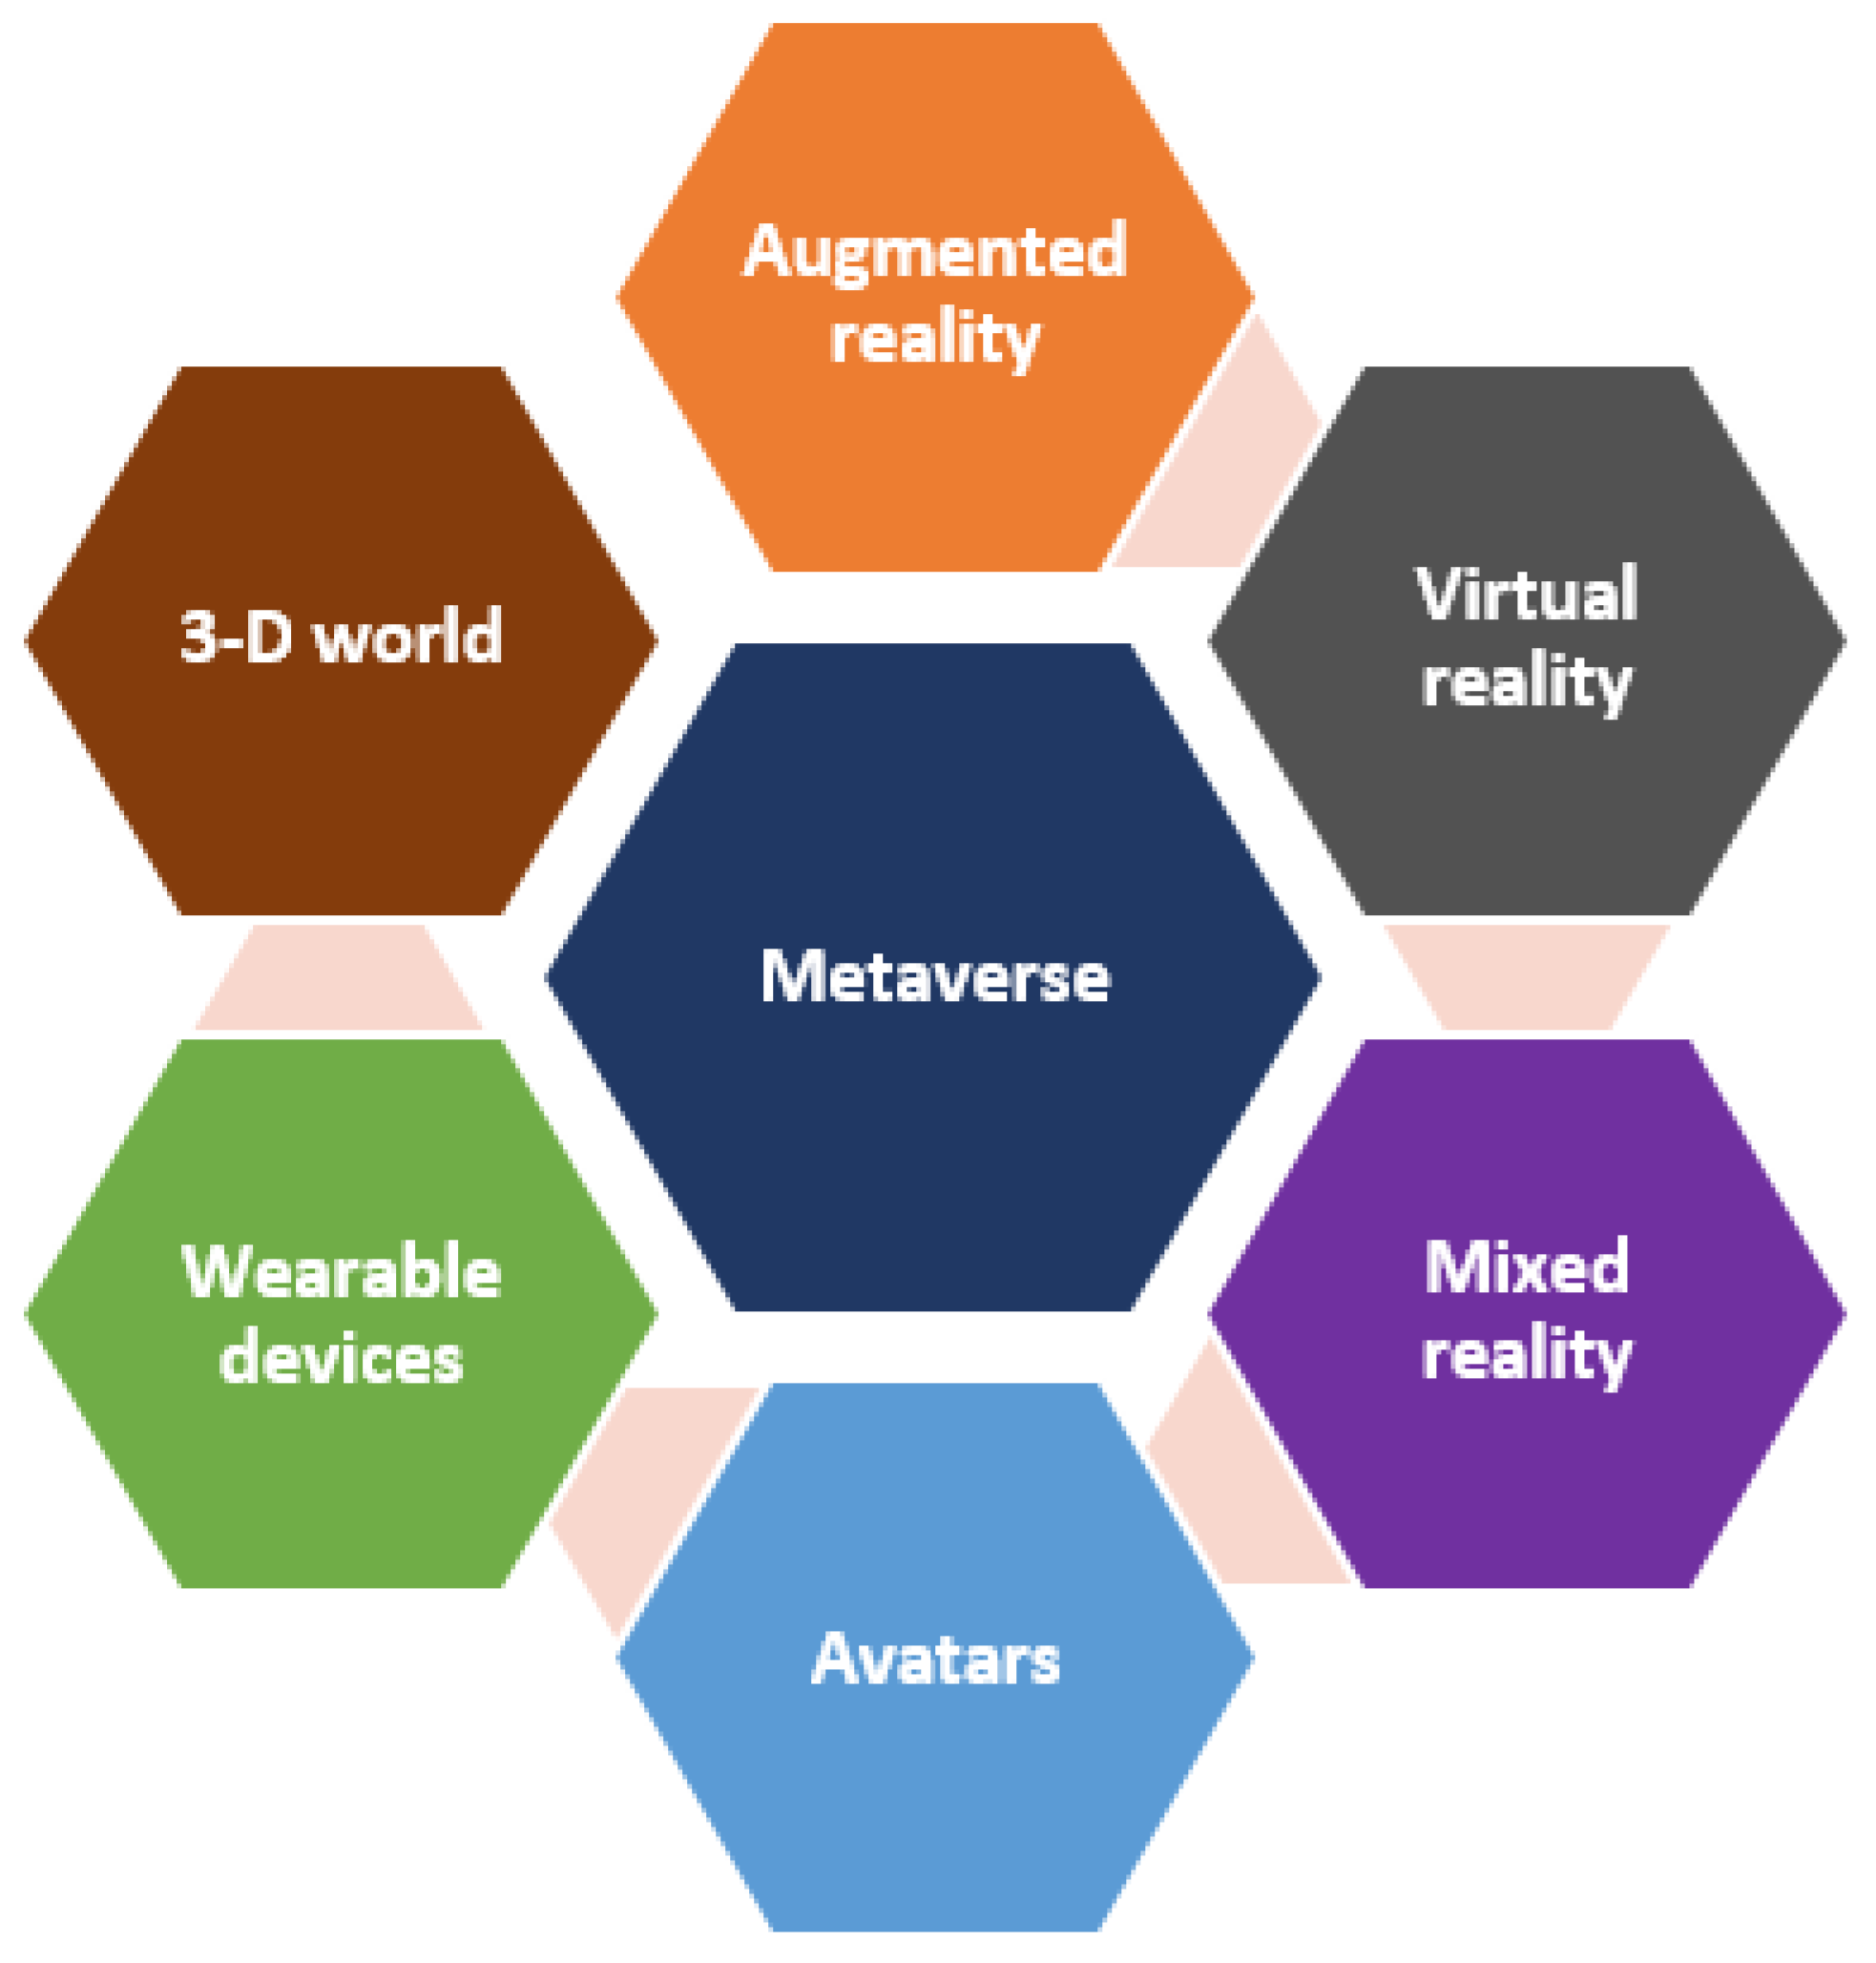
Figure 2.
A five steps research methodology.

Figure 3.
The experimental setup for hologram.
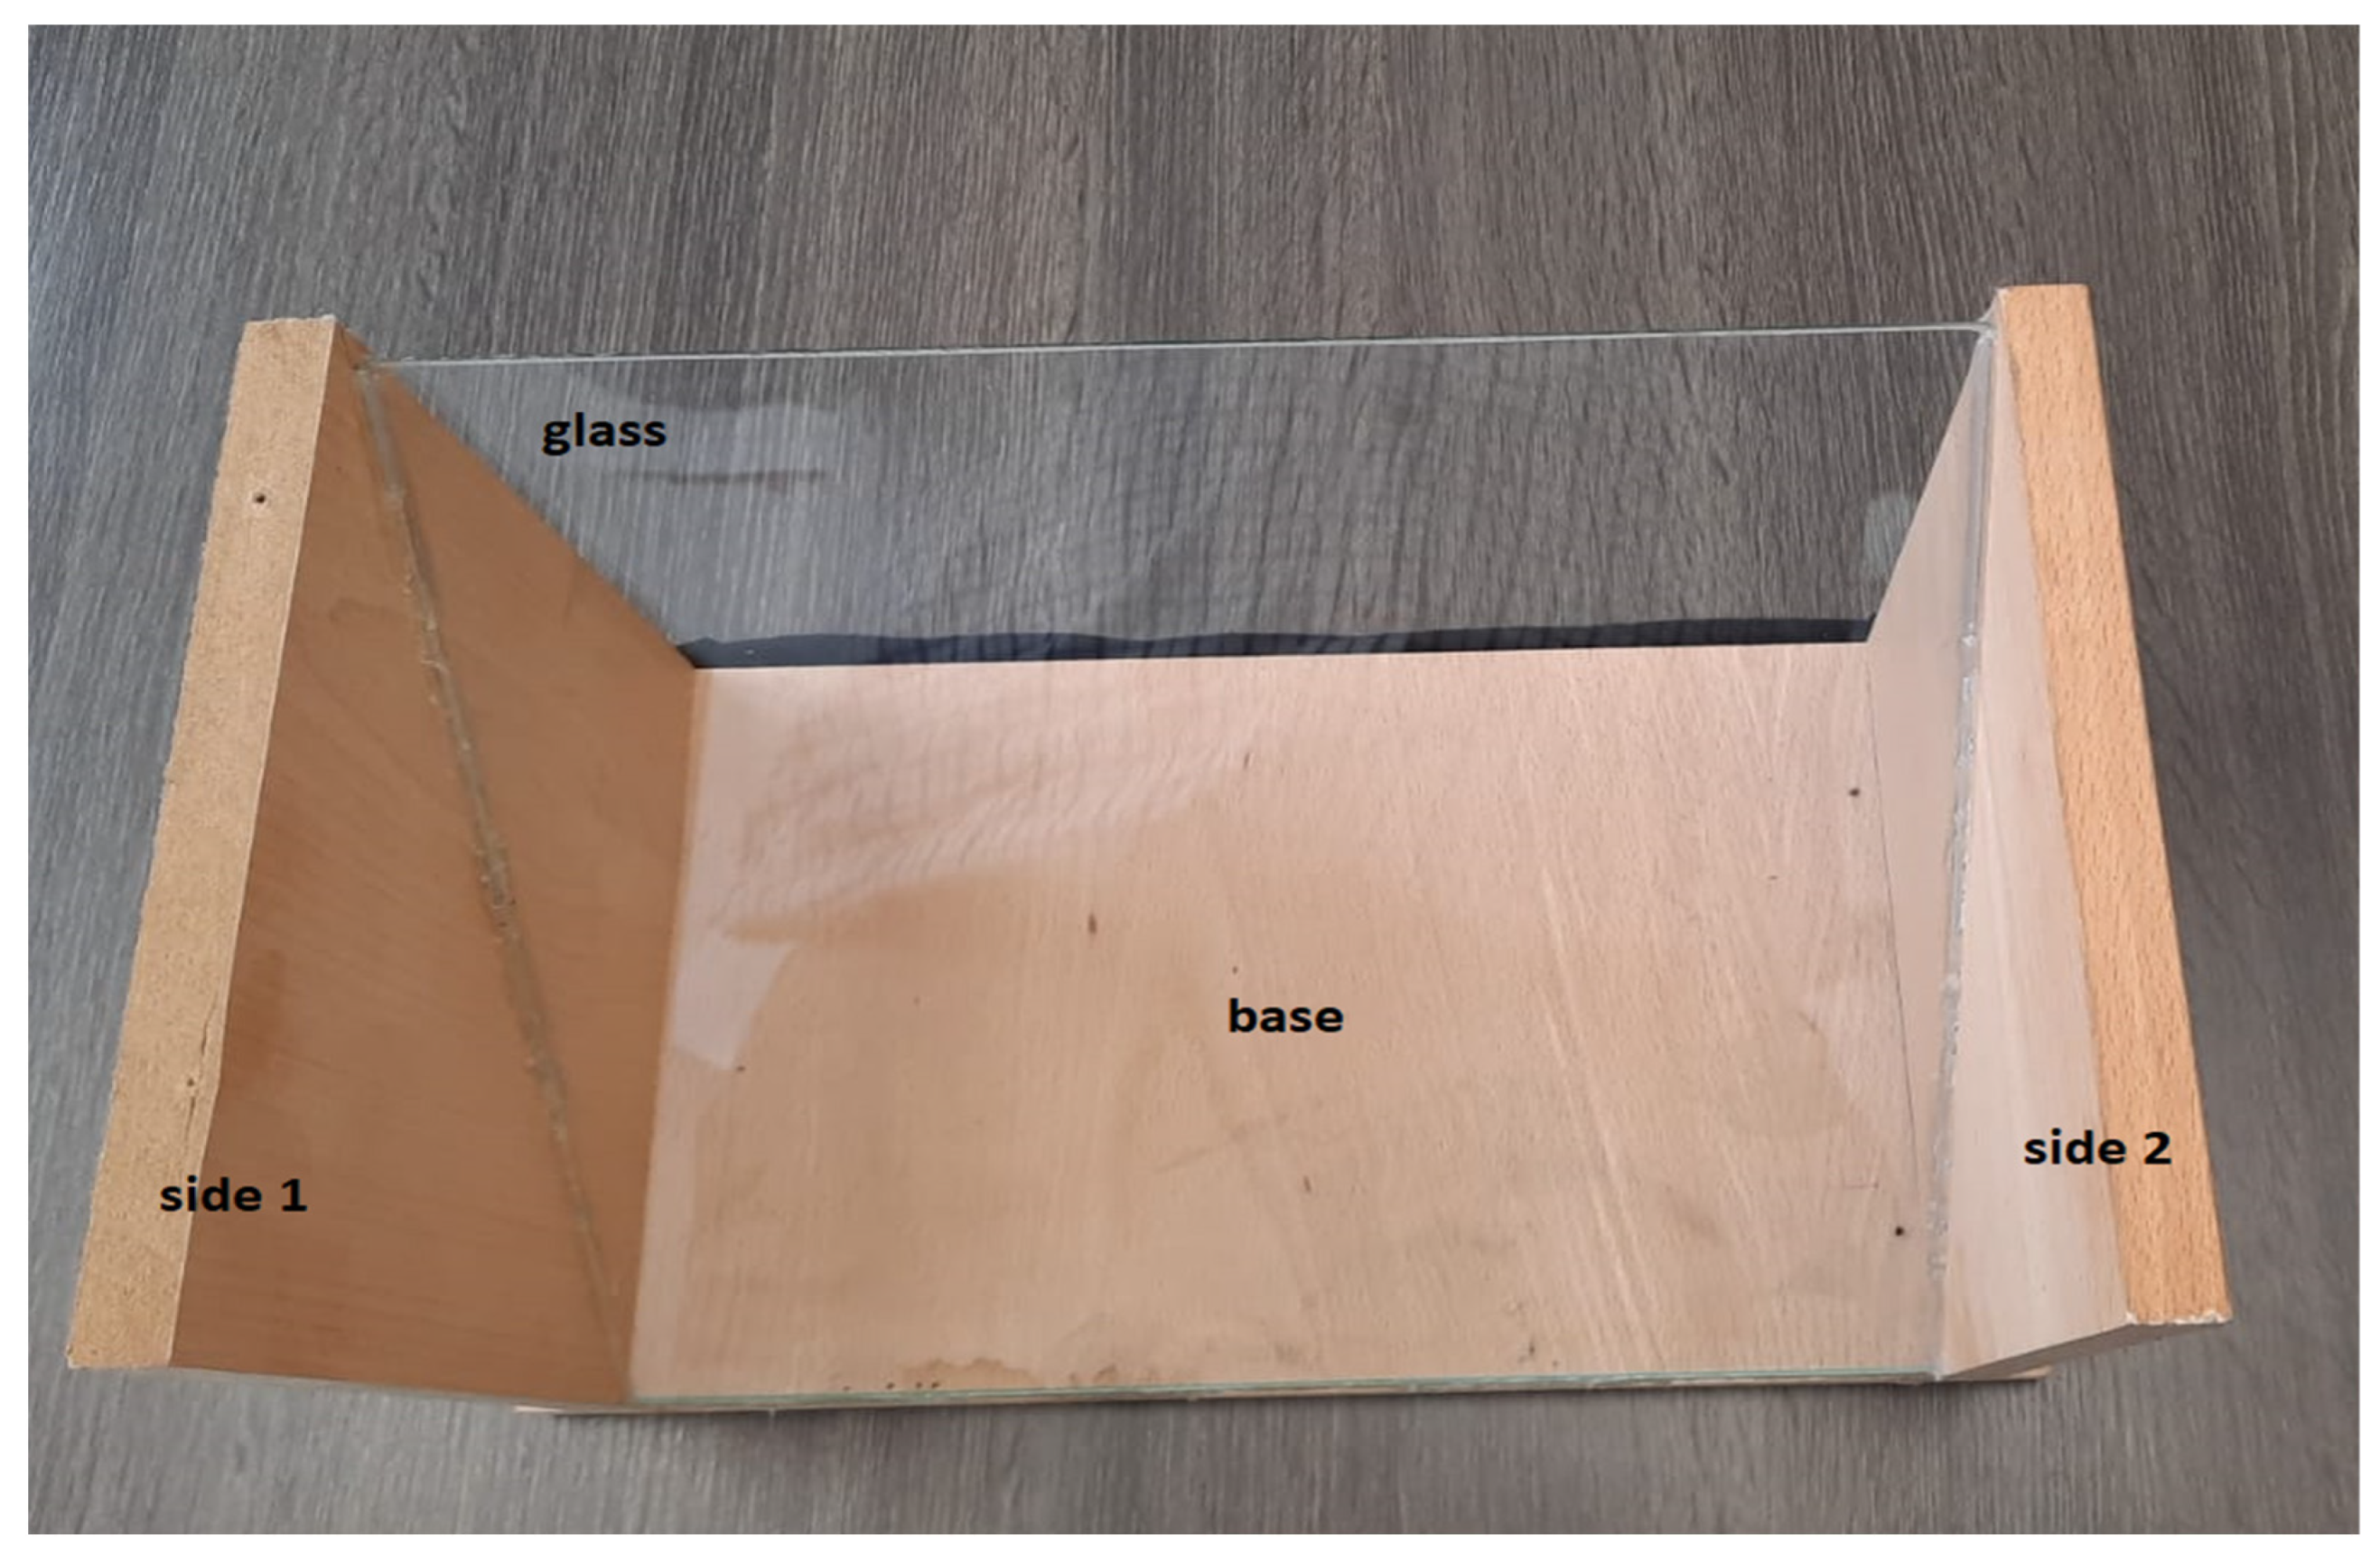
Figure 4.
Demonstration of hologram experiment showing the earth.

Figure 5.
Demonstration of hologram experiment showing a fish.

Figure 6.
Demonstration of hologram experiment showing a bird.

Figure 7.
Demography: (a) gender; (b) age; (c) education.
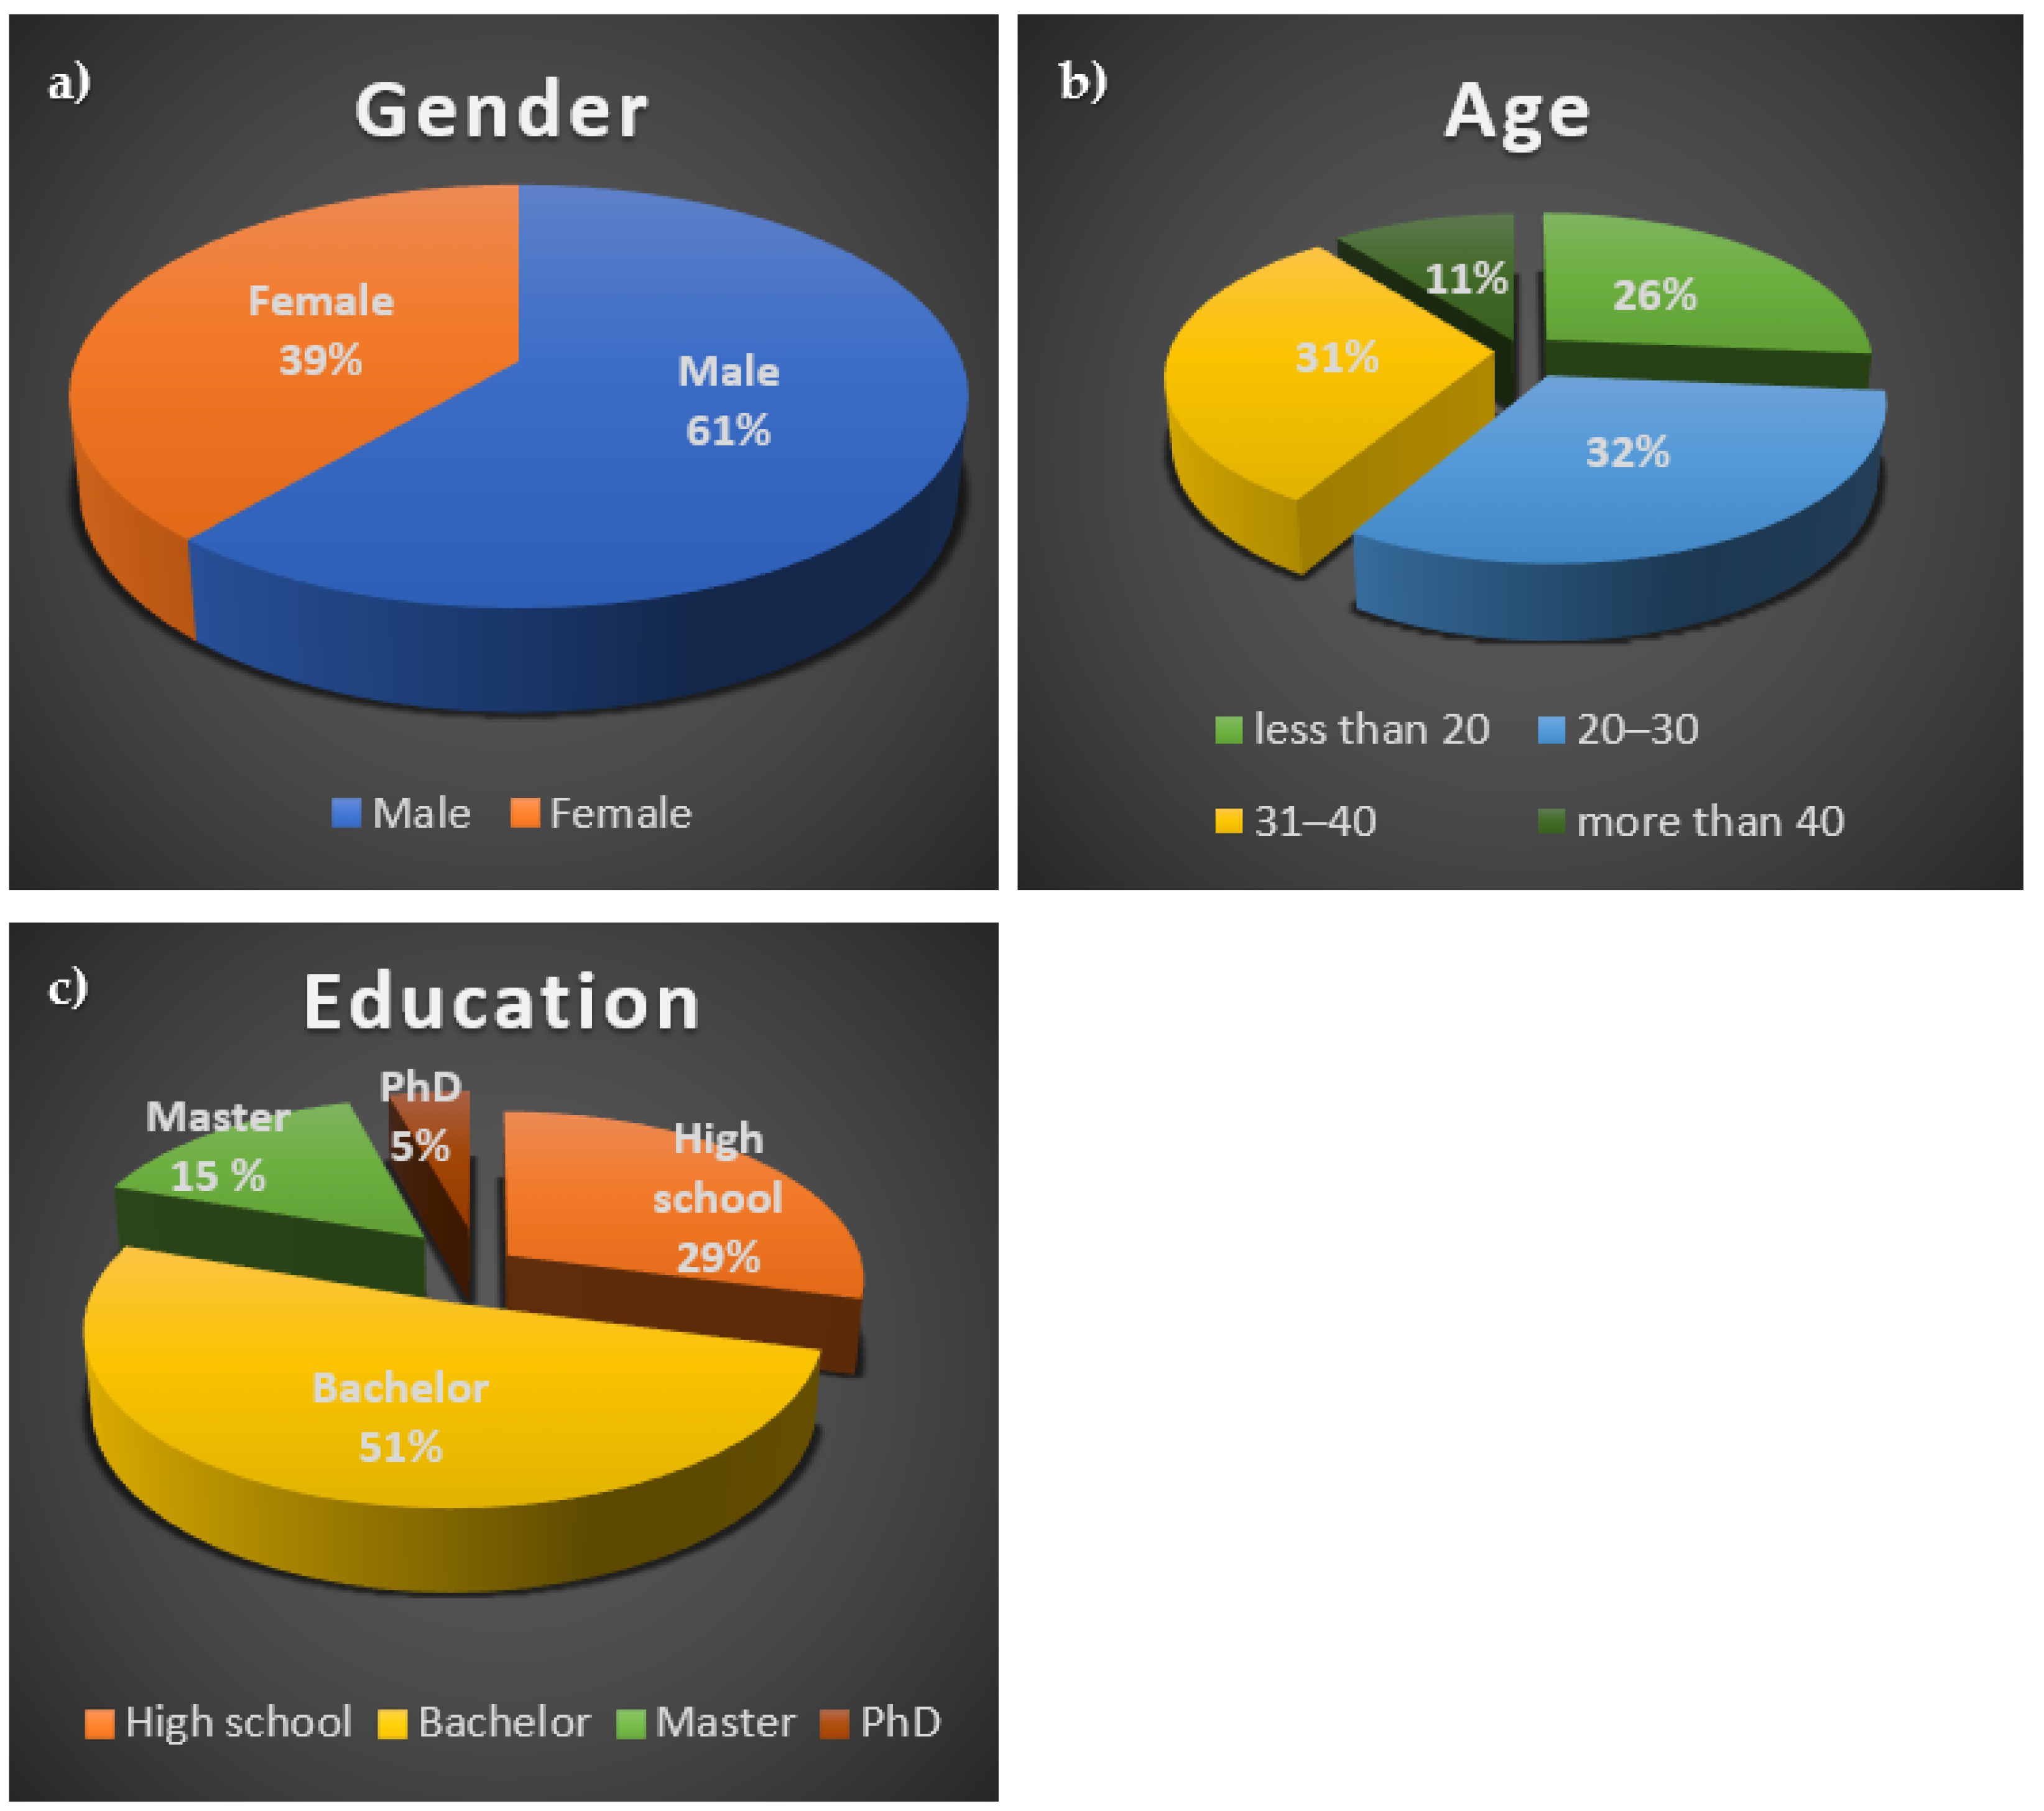
Figure 8.
Variables affected the Metaverse technology and considered in this study.
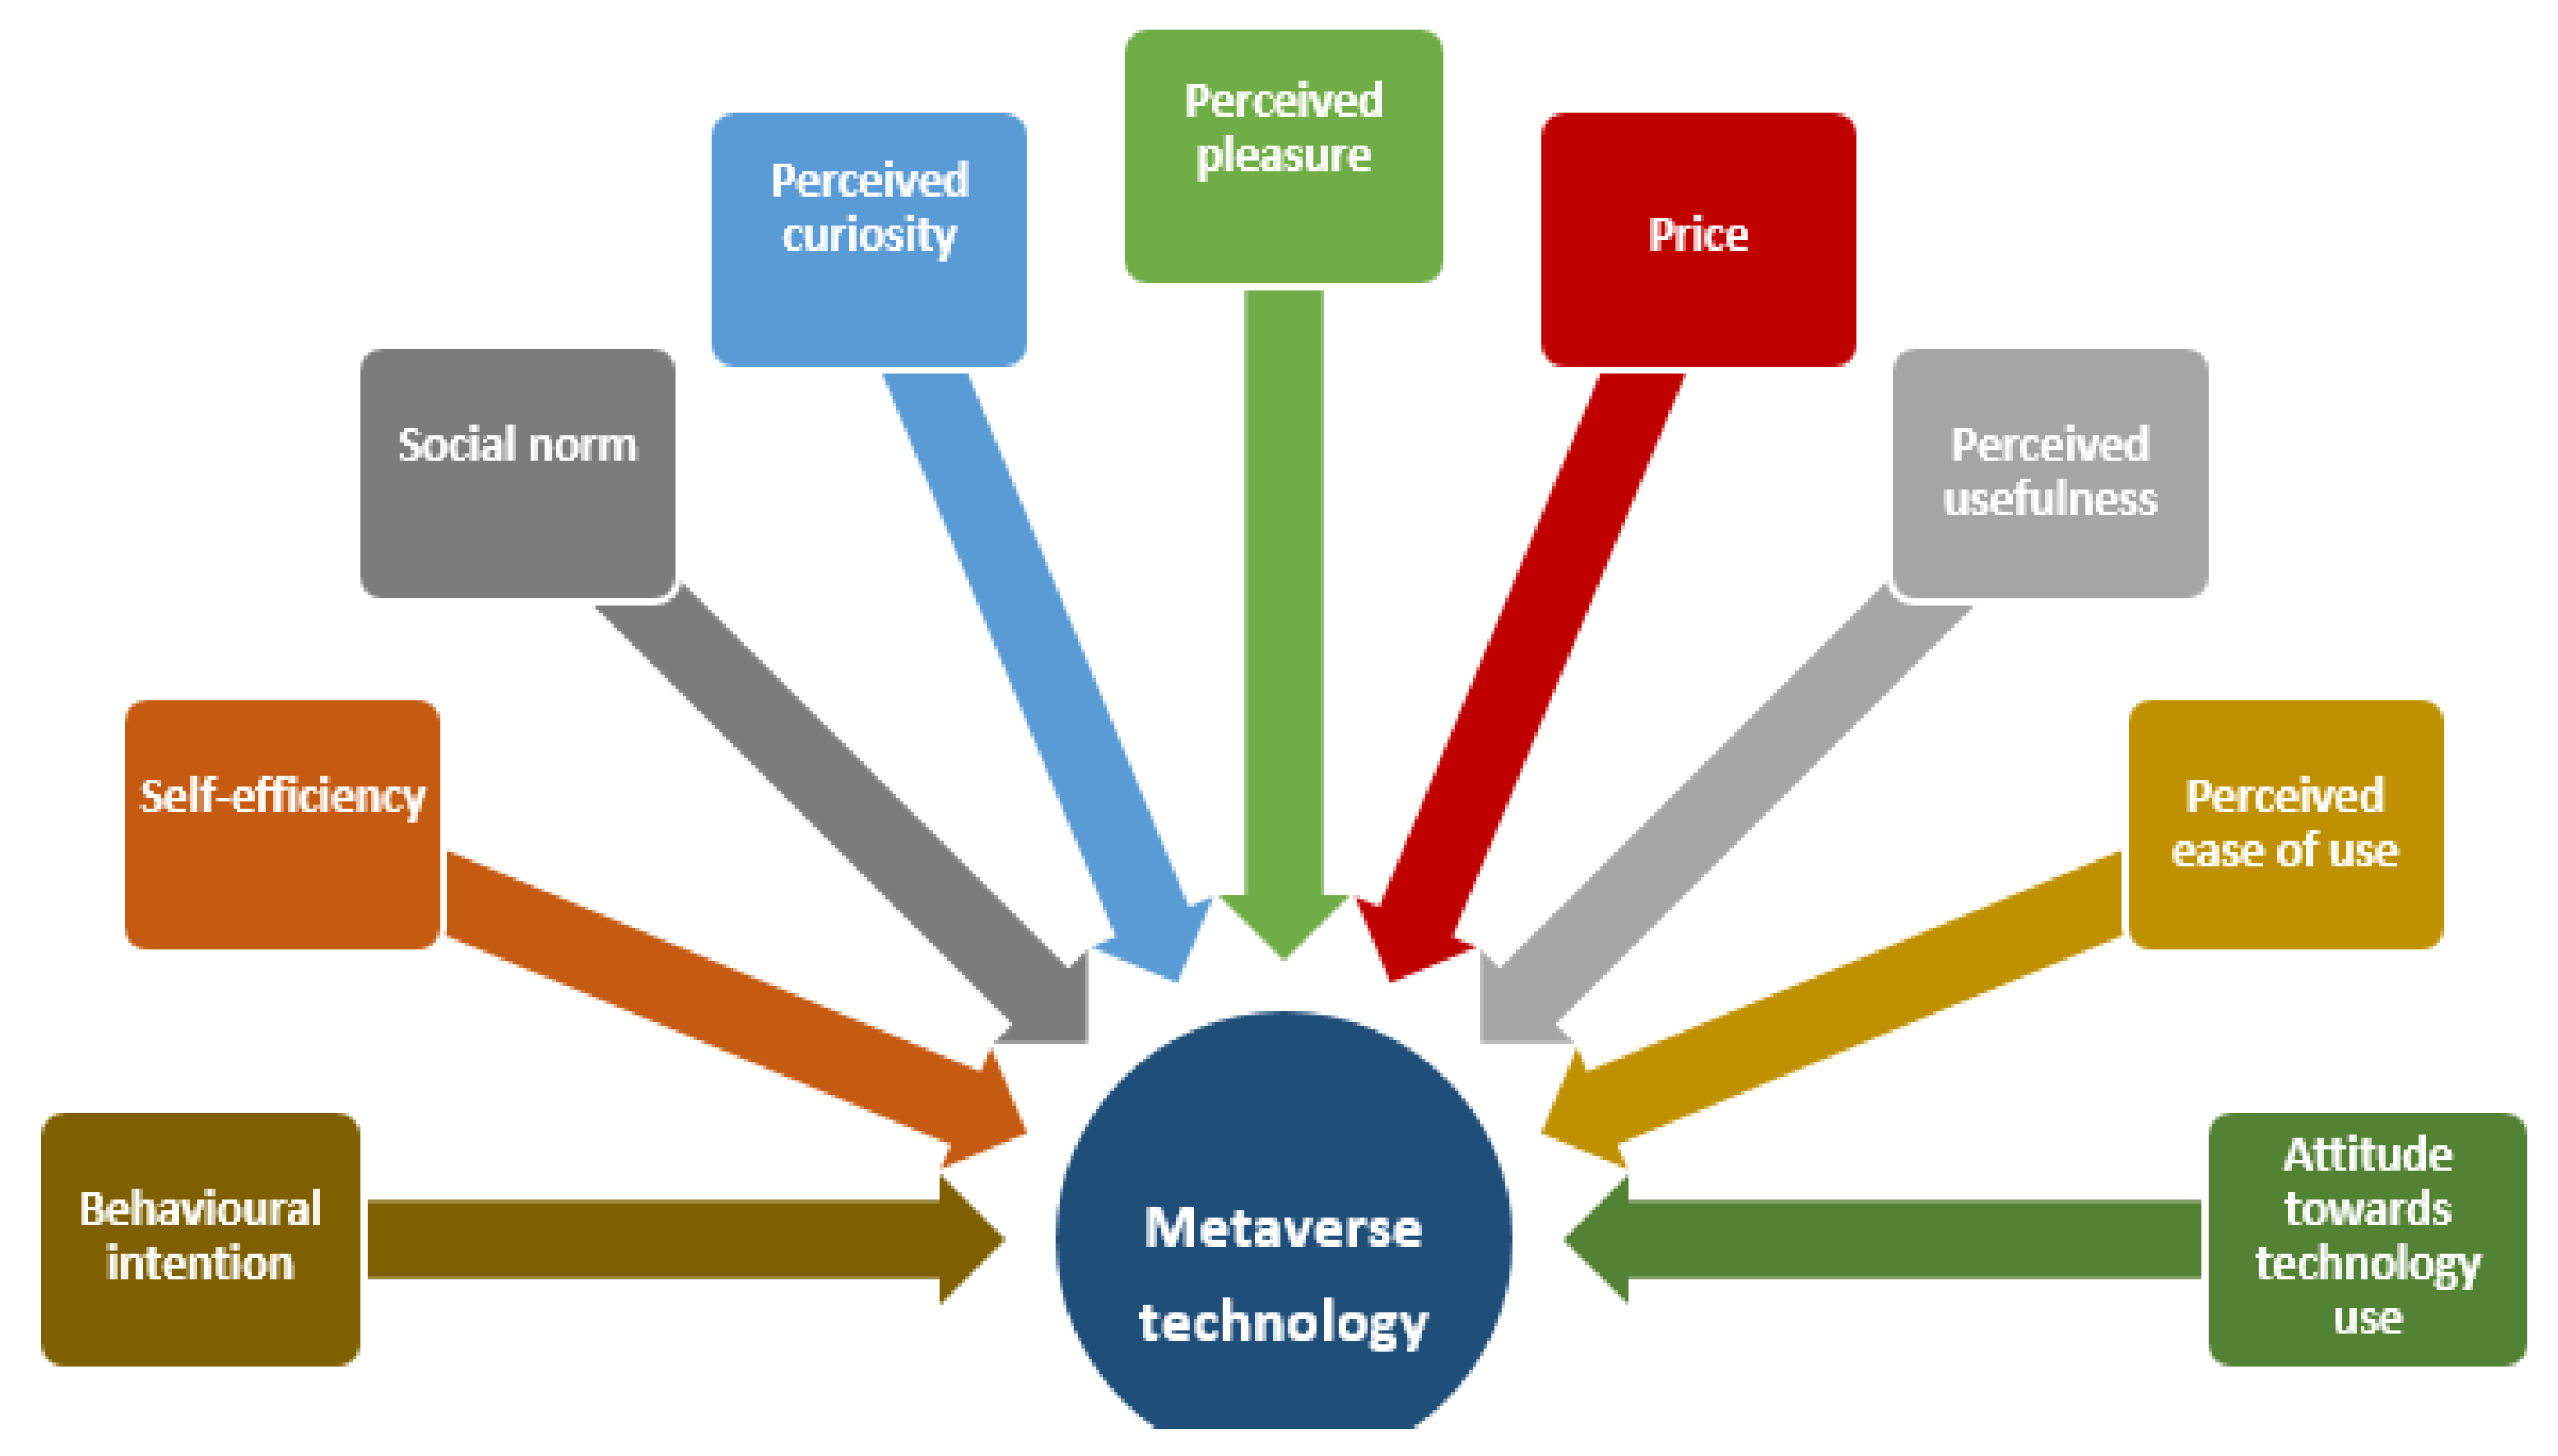
Figure 9.
Survey questions visualization for females (a) and males (b) and all ages groups (c1–f2).

Table 1.
Survey questions.
| Variable No. | Variables | Survey Questions |
|---|---|---|
| 1 | Self-efficiency | Q1. I can use Metaverse platforms skillfully. |
| Q2. I need specialist help to use the Metaverse equipment. | ||
| Q3. I can use the Metaverse equipment by reading the instructions within its box. | ||
| 2 | Social norm | Q4. Others’ opinion about the Metaverse affects my intention to use it. |
| Q5. I want to try Metaverse due to its technology trend. | ||
| 3 | Perceived curiosity | Q6. I follow the news about Metaverse out of curiosity. |
| Q7. I can’t wait to try Metaverse. | ||
| 4 | Perceived pleasure | Q8. The time passed quickly when using VR devices. |
| Q9. The Metaverse experience is exciting. | ||
| 5 | Price | Q10. The price of Metaverse equipment is high; I cant buy it. |
| 6 | Perceived Usefulness | Q11. Using Metaverse will be helpful. |
| Q12. I can go to places using the Metaverse that I can’t go in real life. | ||
| 7 | Perceived ease of use | Q13. Using Metaverse is easy; it depends on using VR devices. |
| 8 | Behavioral intention | Q14. I intend to use Metaverse in the future. |
| 9 | Attitude towards technology use | Q15. Using Metaverse is a good idea. |
Table 2.
Correlation between factors.
| Self-Efficiency | Social Norm | Perceived Curiosity | Perceived Pleasure | Price | Perceived Usefulness | Perceived Ease of Use | Behavioral Intention | Attitude Towards Technology Use | |
|---|---|---|---|---|---|---|---|---|---|
| Self-efficiency | 1 | ||||||||
| Social norm | −0.050 | 1 | |||||||
| Perceived curiosity | 0.110 | 0.422 | 1 | ||||||
| Perceived pleasure | 0.033 | 0.356 | 0.584 | 1 | |||||
| Price | −0.116 | 0.110 | 0.164 | 0.283 | 1 | ||||
| Perceived usefulness | 0.014 | 0.302 | 0.483 | 0.493 | 0.235 | 1 | |||
| Perceived ease of use | 0.181 | 0.284 | 0.358 | 0.360 | 0.091 | 0.504 | 1 | ||
| Behavioral intention | 0.085 | 0.153 | 0.403 | 0.368 | 0.192 | 0.677 | 0.269 | 1 | |
| Attitude towards technology use | 0.297 | 0.120 | 0.266 | 0.274 | −0.009 | 0.380 | 0.780 | 0.352 | 1 |
Table 3.
Descriptive statistics for variables.
| Self-Efficiency | Social Norm | Perceived Curiosity | Perceived Pleasure | Price | Perceived Usefulness | Perceived Ease of Use | Behavioral Intention | Attitude Towards Technology Use | |
|---|---|---|---|---|---|---|---|---|---|
| Mean | 3.505 | 3.596 | 3.306 | 3.594 | 3.675 | 3.939 | 3.606 | 4.053 | 3.808 |
| Standard Deviation | 0.637 | 0.782 | 0.935 | 0.917 | 0.965 | 0.717 | 0.843 | 0.6504.053 | 0.713 |
| Kurtosis | 0.191 | 0.385 | −0.358 | 0.077 | 0.081 | 0.617 | 1.174 | 0.638 | 2.496 |
| Skewness | 0.109 | −0.484 | −0.288 | −0.730 | −0.540 | −0.574 | −0.688 | −0.417 | −0.978 |
Table 4.
Descriptive statistics for survey questions.
| Mean | Std. Deviation | Number | |
|---|---|---|---|
| Question 1 | 3.715 | 0.914 | 302 |
| Question 2 | 2.828 | 1.033 | 302 |
| Question 3 | 3.970 | 0.848 | 302 |
| Question 4 | 3.301 | 1.132 | 302 |
| Question 5 | 3.891 | 0.942 | 302 |
| Question 6 | 3.563 | 1.079 | 302 |
| Question 7 | 3.049 | 1.112 | 302 |
| Question 8 | 3.646 | 1.235 | 302 |
| Question 9 | 3.543 | 0.969 | 302 |
| Question 10 | 3.676 | 0.964 | 302 |
| Question 11 | 3.997 | 0.891 | 302 |
| Question 12 | 3.881 | 0.846 | 302 |
| Question 13 | 3.606 | 0.843 | 302 |
| Question 14 | 4.053 | 0.649 | 302 |
| Question 15 | 3.808 | 0.712 | 302 |
Table 5.
Scale reliability.
| Cronbach’s Alpha | Cronbach’s Alpha Based on Standardized Items | N of Items |
|---|---|---|
| 0.772 | 0.789 | 15 |
Table 6.
Hypothesis testing.
| Hypothesis | Path Coefficients | p-Value | Results |
|---|---|---|---|
| Hypothesis 1 | 0.593 | *** | Supported |
| Hypothesis 2 | 0.923 | *** | Supported |
| Hypothesis 3 | 0.382 | *** | Supported |
| Hypothesis 4 | 0.386 | *** | Supported |
| Hypothesis 5 | −0.006 | 0.879 | Not Supported |
| Hypothesis 6 | 0.129 | *** | Supported |
| Hypothesis 7 | 0.323 | *** | Supported |
| Hypothesis 8 | 0.331 | *** | Supported |
| Hypothesis 9 | 0.385 | *** | Supported |
| Hypothesis 10 | 0.240 | *** | Supported |
| Hypothesis 11 | 0.016 | 0.806 | Not Supported |
| Hypothesis 12 | 0.277 | *** | Supported |
Note *** p < 0.01.
Publisher’s Note: MDPI stays neutral with regard to jurisdictional claims in published maps and institutional affiliations. |
© 2022 by the authors. Licensee MDPI, Basel, Switzerland. This article is an open access article distributed under the terms and conditions of the Creative Commons Attribution (CC BY) license (https://creativecommons.org/licenses/by/4.0/).
Share and Cite
MDPI and ACS Style
Aburbeian, A.M.; Owda, A.Y.; Owda, M. A Technology Acceptance Model Survey of the Metaverse Prospects. AI 2022, 3, 285-302. https://0-doi-org.brum.beds.ac.uk/10.3390/ai3020018
AMA Style
Aburbeian AM, Owda AY, Owda M. A Technology Acceptance Model Survey of the Metaverse Prospects. AI. 2022; 3(2):285-302. https://0-doi-org.brum.beds.ac.uk/10.3390/ai3020018
Chicago/Turabian StyleAburbeian, AlsharifHasan Mohamad, Amani Yousef Owda, and Majdi Owda. 2022. "A Technology Acceptance Model Survey of the Metaverse Prospects" AI 3, no. 2: 285-302. https://0-doi-org.brum.beds.ac.uk/10.3390/ai3020018