Article

Prediction of Tensile Strain Capacity for X52 Steel Pipeline Materials Using the Extended Finite Element Method

1
Department of Mechanical Engineering, University of Alberta, Edmonton, AB T6G 1H9, Canada
2
Department of Civil and Environmental Engineering, University of Alberta, Edmonton, AB T6G 1H9, Canada
3
Enbridge Pipelines Inc., Edmonton, AB T5J 0T6, Canada
*
Author to whom correspondence should be addressed.
Submission received: 4 March 2021 / Revised: 8 April 2021 / Accepted: 12 April 2021 / Published: 15 April 2021
(This article belongs to the Special Issue Damage Sensing in Composites for Structural Health Monitoring)

Abstract

:
Strain-based design (SBD) plays an important role in pipeline design and assessment of pipelines subjected to geo-hazards. Under such hazards, a pipe can be subjected to substantial plastic strains, leading to tensile failure at locations of girth weld flaws. For SBD, the finite element method (FEM) can be a reliable tool to calculate the tensile strain capacity (TSC) for better design in pipelines. This study aims to investigate the ductile fracture properties for specific vintage pipeline steel (API 5L grade of X52) using the extended finite element method (XFEM). Eight full-scale tests were simulated using the commercial finite element analysis software ABAQUS Version 6.17. Maximum principal strain is used to assess the damage initiation using the cohesive zone model (CZM) when the crack evolution is evaluated by fracture energy release. A proper set of damage parameters for the X52 materials was calibrated based on the ability of the model to reproduce the experimental results. These experimental results included the tensile strain, applied load, endplate rotation, and crack mouth opening displacement (CMOD). This study describes a methodology for validation of the XFEM and the proper damage parameters required to model crack initiation and propagation in X52 grades of pipeline.

1. Introduction

With the rapid growth in the pipeline industry, new developments that enable a high operating pressure, long-distance traverses, and a large diameter are essential [1]. Pipeline design, like the majority of structural engineering applications, is a balancing act that aims to maximize the economics and efficiency of a pipeline without sacrificing its safety and reliability. Under the effect of internal pressure, pipeline design is stress-based and acceptable for steel with a well-defined yield ductility, yield point, and strength. However, stress in pipelines can surpass the limit under displacement control loads, such as landslides and earthquakes. In this case, stress-based design can be greatly impractical and inordinately uneconomical [2]. Strain-based design (SBD), on the other hand, is based on displacement-controlled loading and a strain limit state precipitating more practical criteria in designing pipelines subjected to ground movement-induced plastic strains [1,2,3].
The recent pipeline research literature mostly focuses on modern high-grade pipe materials (X60 and above), while there is little research on vintage lower-grade pipes [4]. Wang et al. [5,6,7] developed equations to predict the tensile strain capacity (TSC) of pipelines that do not include the effect of internal pressure and are not applicable to vintage pipelines. Similarly, TSC predictive models developed by ExxonMobil (EM) and Pipeline Research Council International (PRCI) are only applicable to modern high-grade pipelines [8,9,10,11]. However, a high percentage of vintage pipelines are still in service to transport energy resources, thus it is necessary to develop numerical models that can predict the response of such pipelines under complex loading conditions [12].
The finite element method (FEM) is a cost-efficient technique for analyzing pipelines under such loading conditions. The cohesive zone model (CZM) is the applicable numerical tool in FEM used in simulating the propagation of a crack [13]. In CZM, the stress singularity corresponding to linear elastic fracture mechanics at the crack tips is avoided. Complete separation between crack surfaces happens when the cohesive zone stiffness drops to zero [14]. CZM in conjunction with the extended finite element method (XFEM) is widely used in simulating the fracture process [15]. XFEM is an extension to the traditional finite element analysis in which the initiation and propagation of cracks that follow arbitrary paths can be simulated without the need for remeshing [12]. Crack or damage initiation in XFEM occurs when a stress- or strain-based criterion is met, while damage evolution follows the CZM model with fracture energy release (Gc) as the input parameter. Ameli et al. [16] used XFEM to obtain the fracture parameters, maximum principal stress (Maxps) = 1400 MPa for damage initiation and Gc = 200 N/mm for damage evolution, by simulating the single-edge notch tension (SENT) test of X42 vintage pipelines. Similarly, Lin et al. [13] obtained the XFEM set of damage parameters, Maxps = 750 MPa and Gc = 900 N/mm, by simulating the reported eight full-scale tests of an X52 vintage pipe subjected to internal pressure, external tensile stress, and bending. However, the use of a stress-based damage initiation in XFEM is a bit problematic; both Ameli’s and Lin’s simulations reported a maximum principal stress that is higher than the ultimate stress of the material, implying that such damage criterion is impractical and probably not applicable to modeling damage in materials subjected to plastifying crack tips.
In the recent literature, XFEM pipeline modeling approaches have started using a strain-based approach as a damage initiation criterion. Liu et al. [17] used XFEM to obtain an appropriate set of damage parameters, namely, maximum principal strain (Maxpe) for damage initiation and fracture energy release (Gc) for damage evolution, to simulate the crack propagation in beam specimens of X80 pipeline steel. They concluded that Maxpe is a more suitable criterion in comparison with Maxps to simulate the crack propagation. They noticed, however, that the critical strain decreases when the beam specimen thickness increases, suggesting that a fixed criterion might not be suitable for all failure scenarios. Okodi et al. [18] used Maxpe and Gc in XFEM analysis to predict the burst pressure in X70 pipe specimens with dent–crack defects. They investigated the effects of the denting pressure as well as dent and crack sizes on the burst pressure and validated the predicted XFEM results with experiments [18]. Okodi et al. [19] simulated the propagation of cracks in X60 grades of pipeline using the XFEM damage criterion, Maxpe, and Gc and validated their results with small-scale and full-scale tests. They used proposed XFEM models to predict the burst pressure in pipes with external longitudinal rectangular cracks [19]. Agbo et al. [20] predicted the ductile fracture response of an X42 vintage pipe under biaxial loading using Maxpe and Gc and obtained the TSC of this specific grade of pipe. The effects of loading conditions, as well as the geometry of the crack and pipe on the TSC, were also investigated in this research. Agbo et al. [12] calculated the strain-based XFEM damage parameters, Maxpe = 0.013 and Gc = 450 N/mm, and TSC for an X42 vintage pipeline through calibrating numerical results with full-scale test results.
In the present study, a strain-based fracture criterion is used to simulate fracture initiation in full-scale tests of pressurized pipes, and a set of parameters to provide the TSC of X52 steel pipeline material is found. Maxpe is chosen as the damage criterion. In contrast to Maxps, which was used previously by Lin et al. [13] to predict the fracture response of this grade of vintage pipeline, Maxpe critical values are relatable to the physical critical strain values expected in the vicinity of the crack tip [12]. The crack initiation and propagation are numerically predicted through simulating eight published full-scale tests of X52 vintage pipes that are subjected to the combination of internal pressure and external eccentric tension which were reported by Abdulhameed et al. [21]. A proper set of damage parameters for X52 grades of pipes is obtained by calibrating the XFEM model implemented in ABAQUS [22]. The numerical results are compared with data from eight full-scale experimental tests including tensile strain and CMOD at failure, applied force, and rotation at the endplates.

2. Full-Scale Test Experiment

The fracture behavior of vintage API 5L grade X52 steel pipes was investigated experimentally by Abdulhameed et al. [21] and Lin [23]. The experimental work included full-scale and small-scale tests. For the full-scale test, eight pipe specimens were cut out of the vintage X52 pipeline grade with girth welds situated in the middle length of each sample. The pipe specimens had a wall thickness of 6.9 mm and an outer diameter of 324 mm. A circumferential crack-like defect was created in each pipe sample on the outer surface of the pipe close to the girth weld. The circumferential flaw length was 5% or 15% of the pipe circumference, while the flaw depth was 25% or 50% of the pipe wall thickness [21]. For small-scale tests, 25 tension coupon tests were used to obtain the tensile properties of the X52 grade of pipeline. The specimens were machined from different locations of the X52 pipe sample; 13 small round specimens were machined from the circumferential direction, and 12 standard rectangular specimens were machined from the pipe’s longitudinal direction [23]. Additionally, 24 Charpy V-notch (CVN) impact tests were performed by Lin [23] to obtain the fracture properties of X52 vintage pipeline specimens.

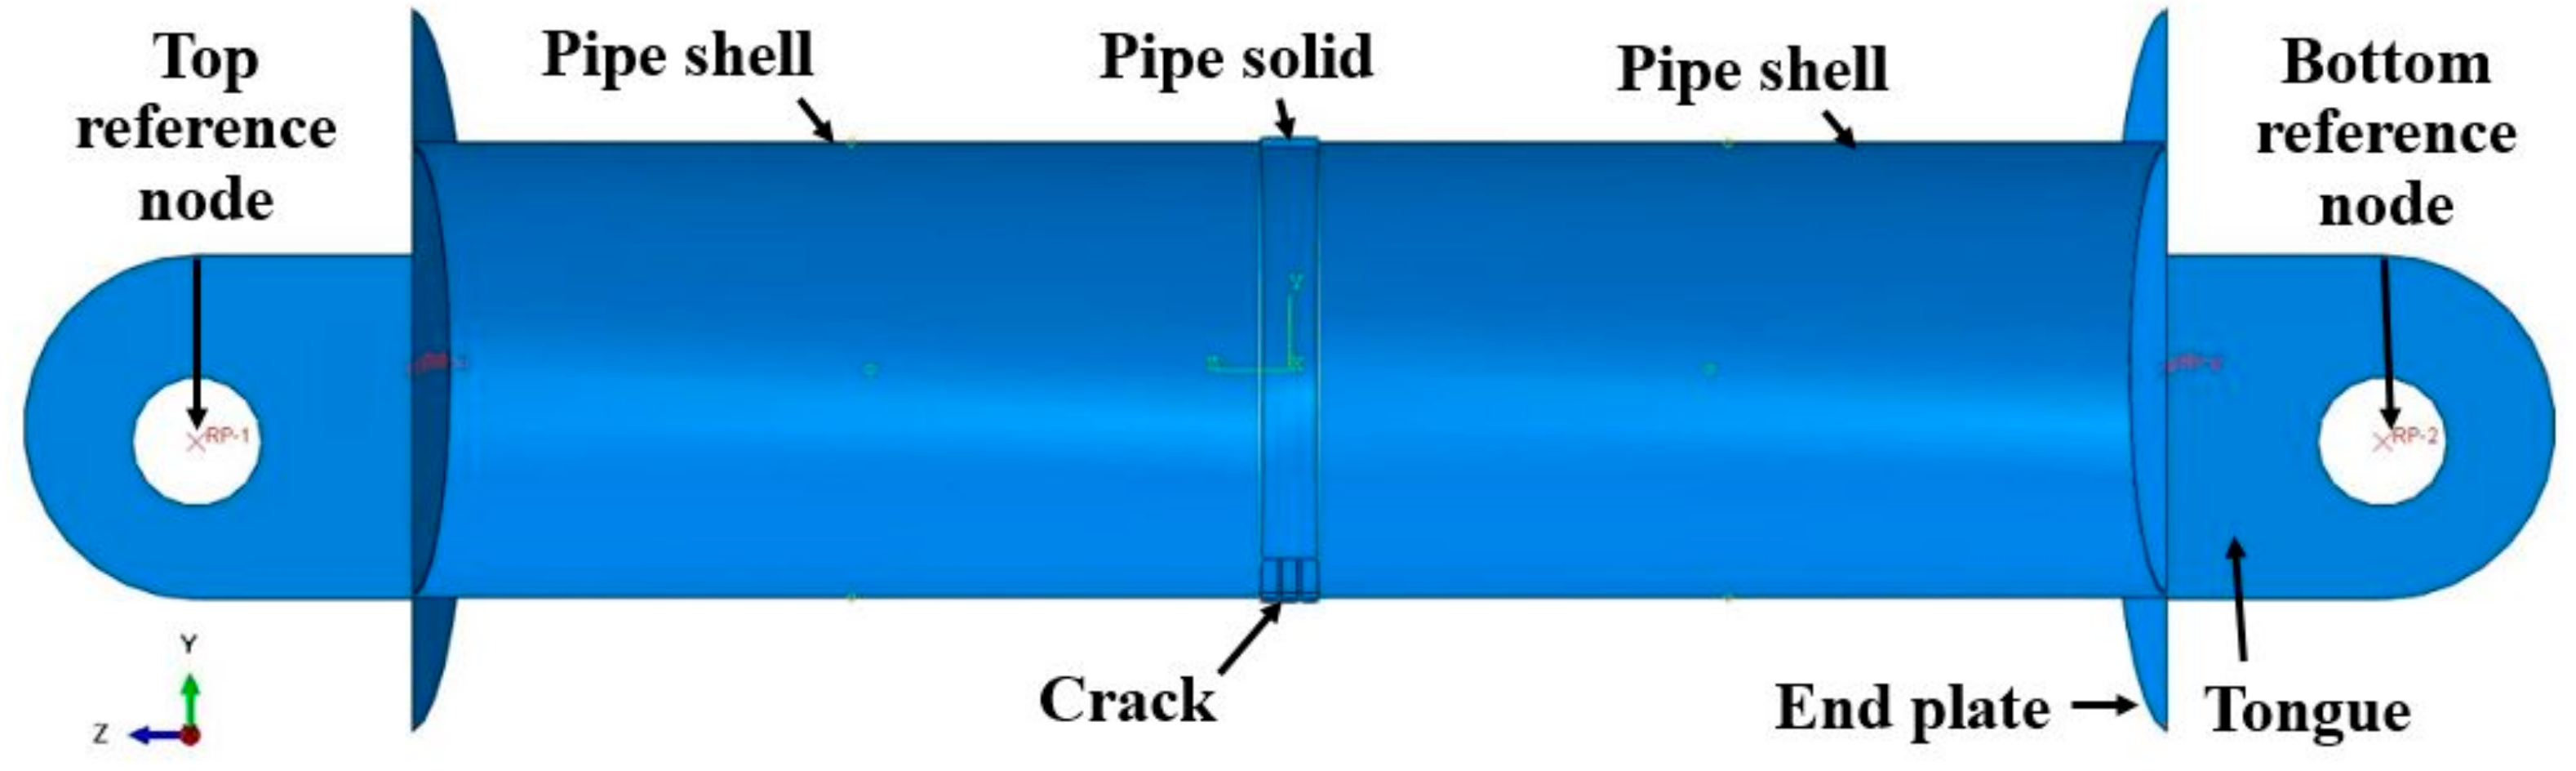
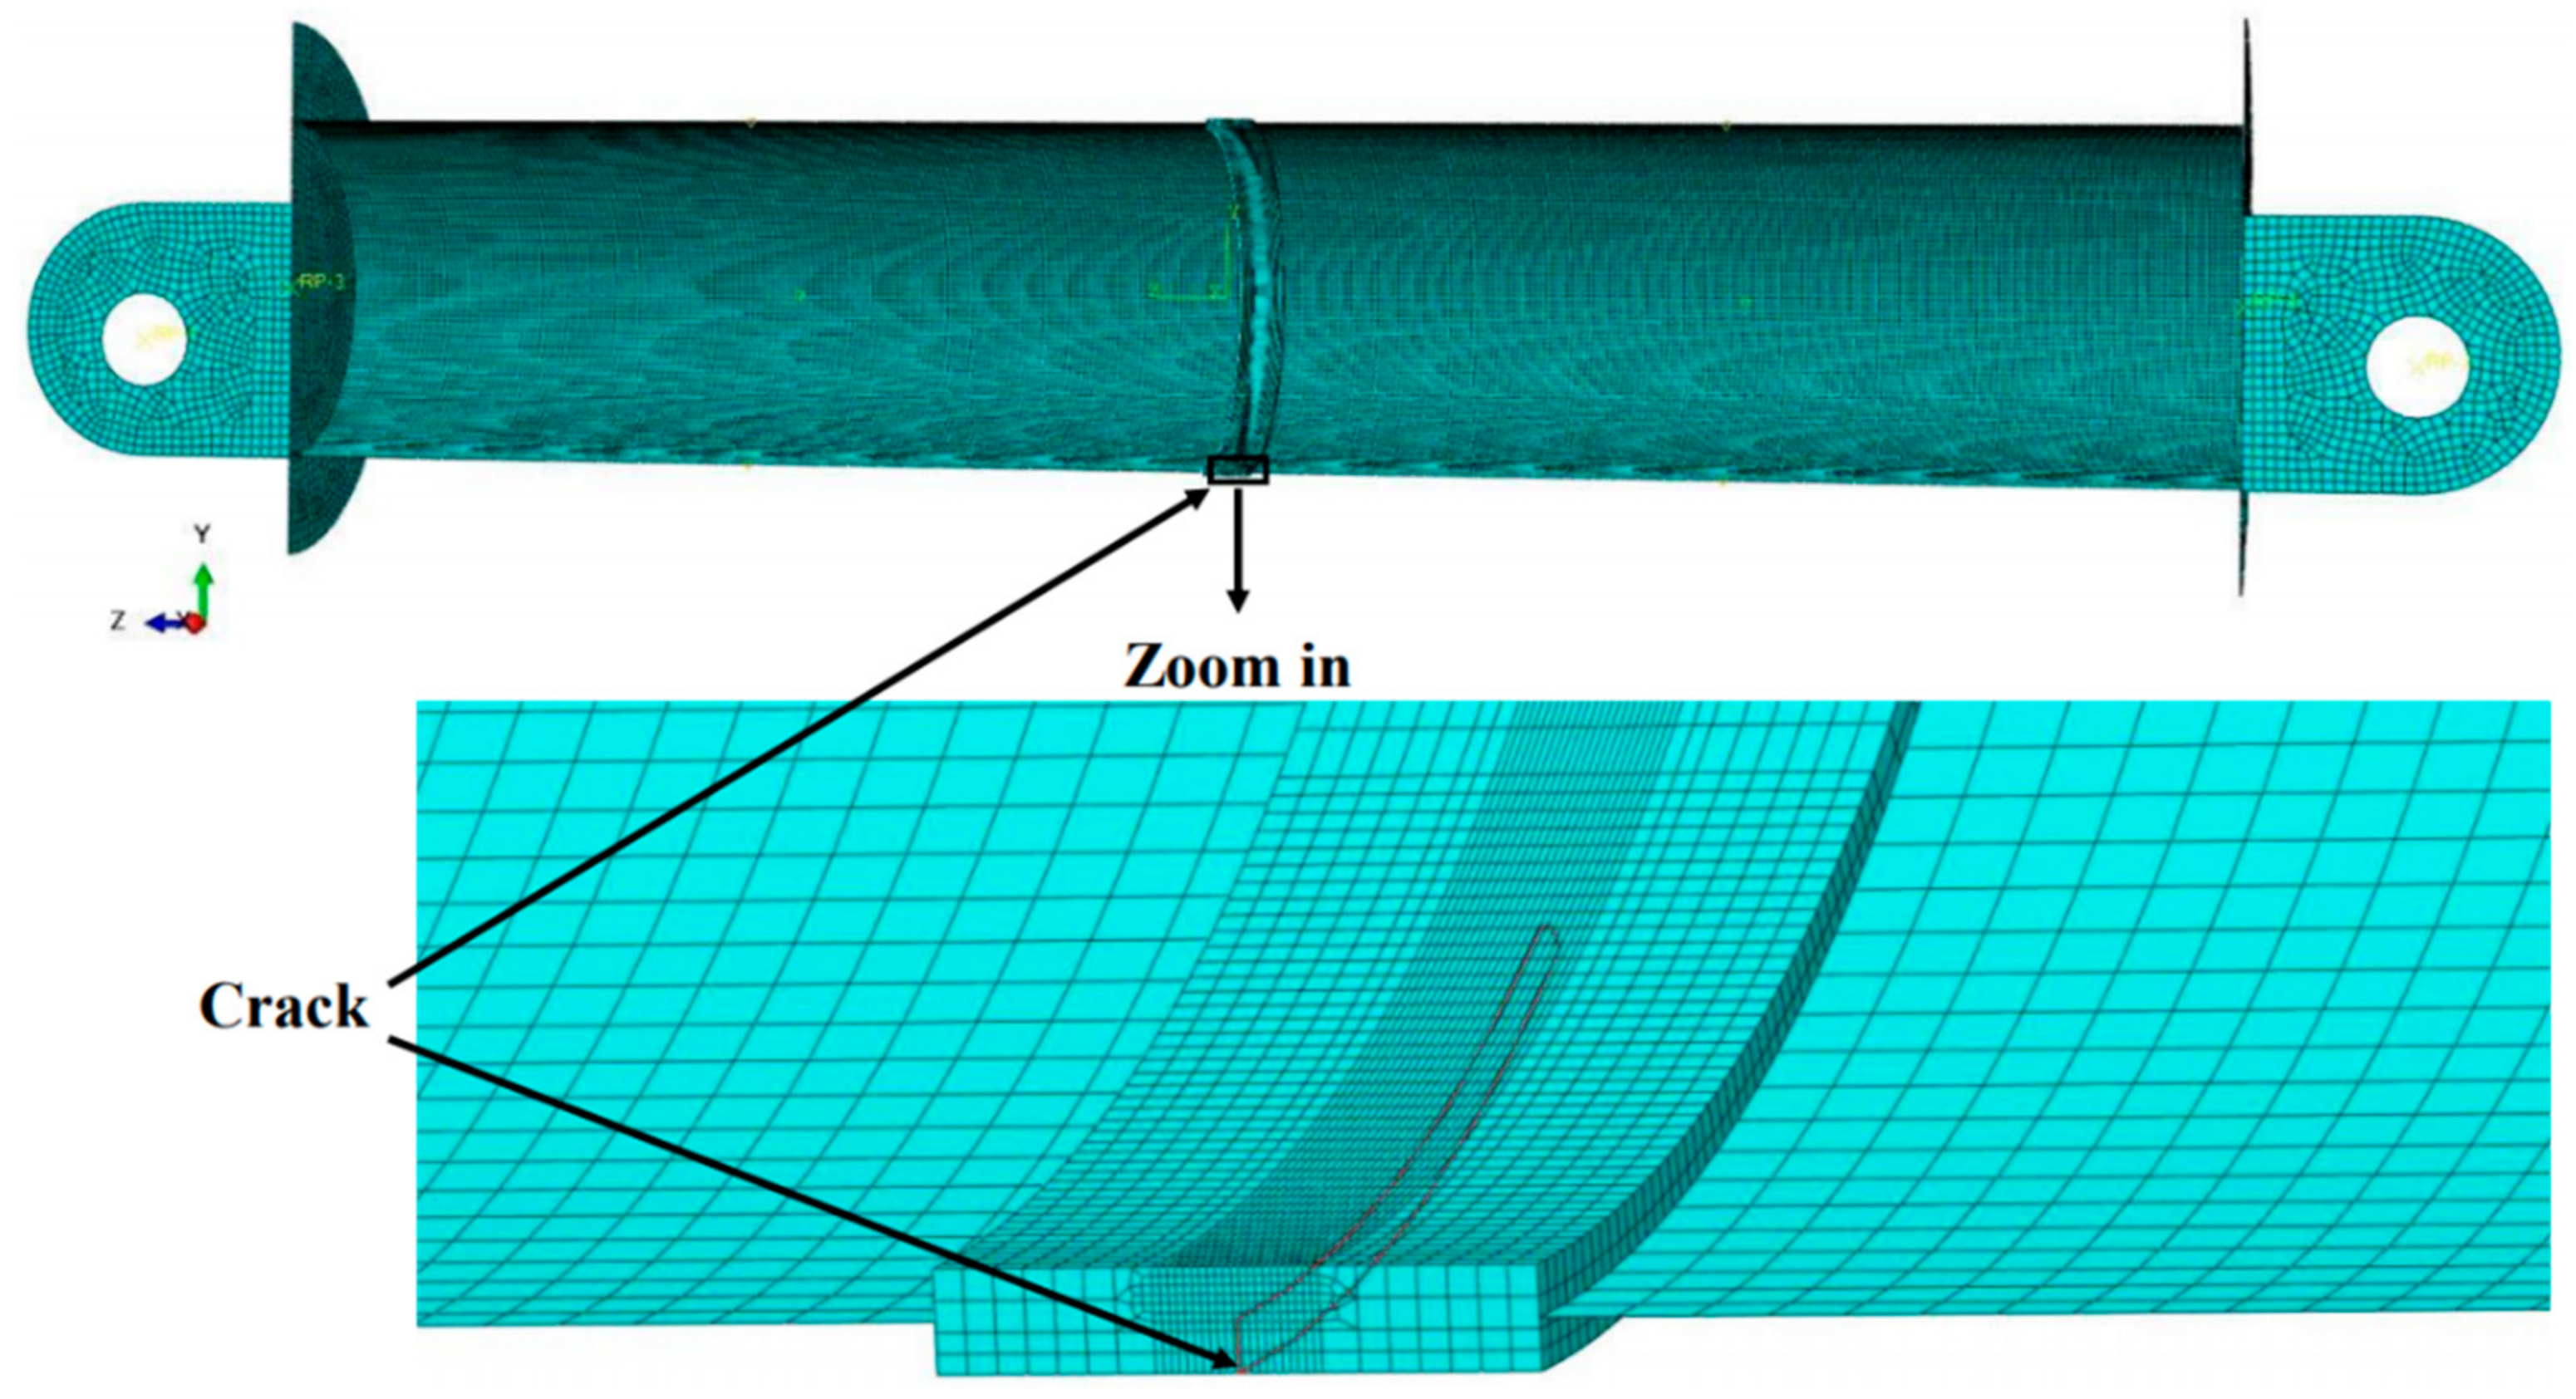
3. Problem Formulation and the XFEM Model

In this study, the strain-based damage parameters Maxpe and Gc were obtained for the X52 pipe XFEM model. Eight 3D XFEM models were developed in ABAQUS software to simulate the experiments. Table 1 presents the dimensions of the full-scale tests and initial cracks as well as the applied internal pressure. Figure 1 and Figure 2 show the schematic and the finite element (FE) configuration of the model, respectively. In order to reduce the analysis time and the computational effort, the center part of the pipe was modeled as a solid part (40 mm long), while the side parts were modeled as shells, as shown in Figure 1. A shell–solid coupling constraint was used at the junction between the shell and solid parts. Additionally, only half of the pipe on the longitudinal side was modeled to take advantage of the symmetry of the pipe around the YZ plane (Figure 1). The pipe model contains two endplates and two loading tongues; both are modeled as shell planar rigid bodies represented by reference nodes with 50 mm eccentricity from the pipe’s longitudinal axis. The tie constraint was used to connect the endplates to the shell parts to simulate the perfectly welded joints. Lastly, a tie constraint connecting the loading tongues to the endplates at an eccentricity of 50 mm was used to model the experimentally applied eccentric loading.
The XFEM circumferential crack was modeled as a shell planar part and located in the middle length of the solid part (Figure 1 and Figure 2). Shell parts, tongues, and endplates were meshed using four-node linear shell elements with reduced integration and hourglass control (S4R). The global mesh size was 5 mm for the shell parts and 10 mm for tongues and endplates. The solid part was meshed with an 8-node linear brick element with reduced integration and hourglass control (C3D8R) as well. Based on mesh convergence analysis performed by Lin et al. [13], a finer mesh (0.5 mm) was used in the partitioned zone near the crack propagation path and a coarser mesh (5 mm) was used in the area far from the crack to guarantee the accuracy of calculation, as displayed in Figure 2. The mesh construction in the solid part was generated with a mesh size between 0.5 and 5 mm. The finer mesh, including elements with a height of 0.5 mm, a thickness of 2 mm, and a length of 0.5 mm, was applied in the partitioned region near the crack propagation line. The element height was in the direction of the crack propagation line, and element thickness and length were parallel and perpendicular to the crack plane, respectively.
The pipe was simulated using the elasto-plastic isotropic hardening material model. The yield stress and plastic strain parameters were taken from the average of true stress–strain curves obtained from the small-scale tension test carried out on X52 pipe specimens by Lin [23]. The true stress–strain curve is shown in Figure 3 and the parameters used as material properties in the XFEM models are shown in Table 2. Maxpe and Gc were selected as two damage criteria to predict the initiation and propagation of the crack in the XFEM model of the X52 vintage pipe, respectively. Failure in the model was defined as the onset of the crack tip (or element damage) reaching the inner edge of the last element of the wall thickness. Since the experimental results from Abdulhameed et al. [21] showed that failure in the X52 occurred in the base metal, the material properties of the base metal were applied for the whole pipe. To compare the predicted XFEM results with experimental results, the ratios of test-to-model predictions and the concomitant coefficient of variation (COV) of the ratios were calculated in the current study, in which COV = the standard deviation/the mean of the ratios of test-to-model predictions of all eight tests.

4. Results and Discussion

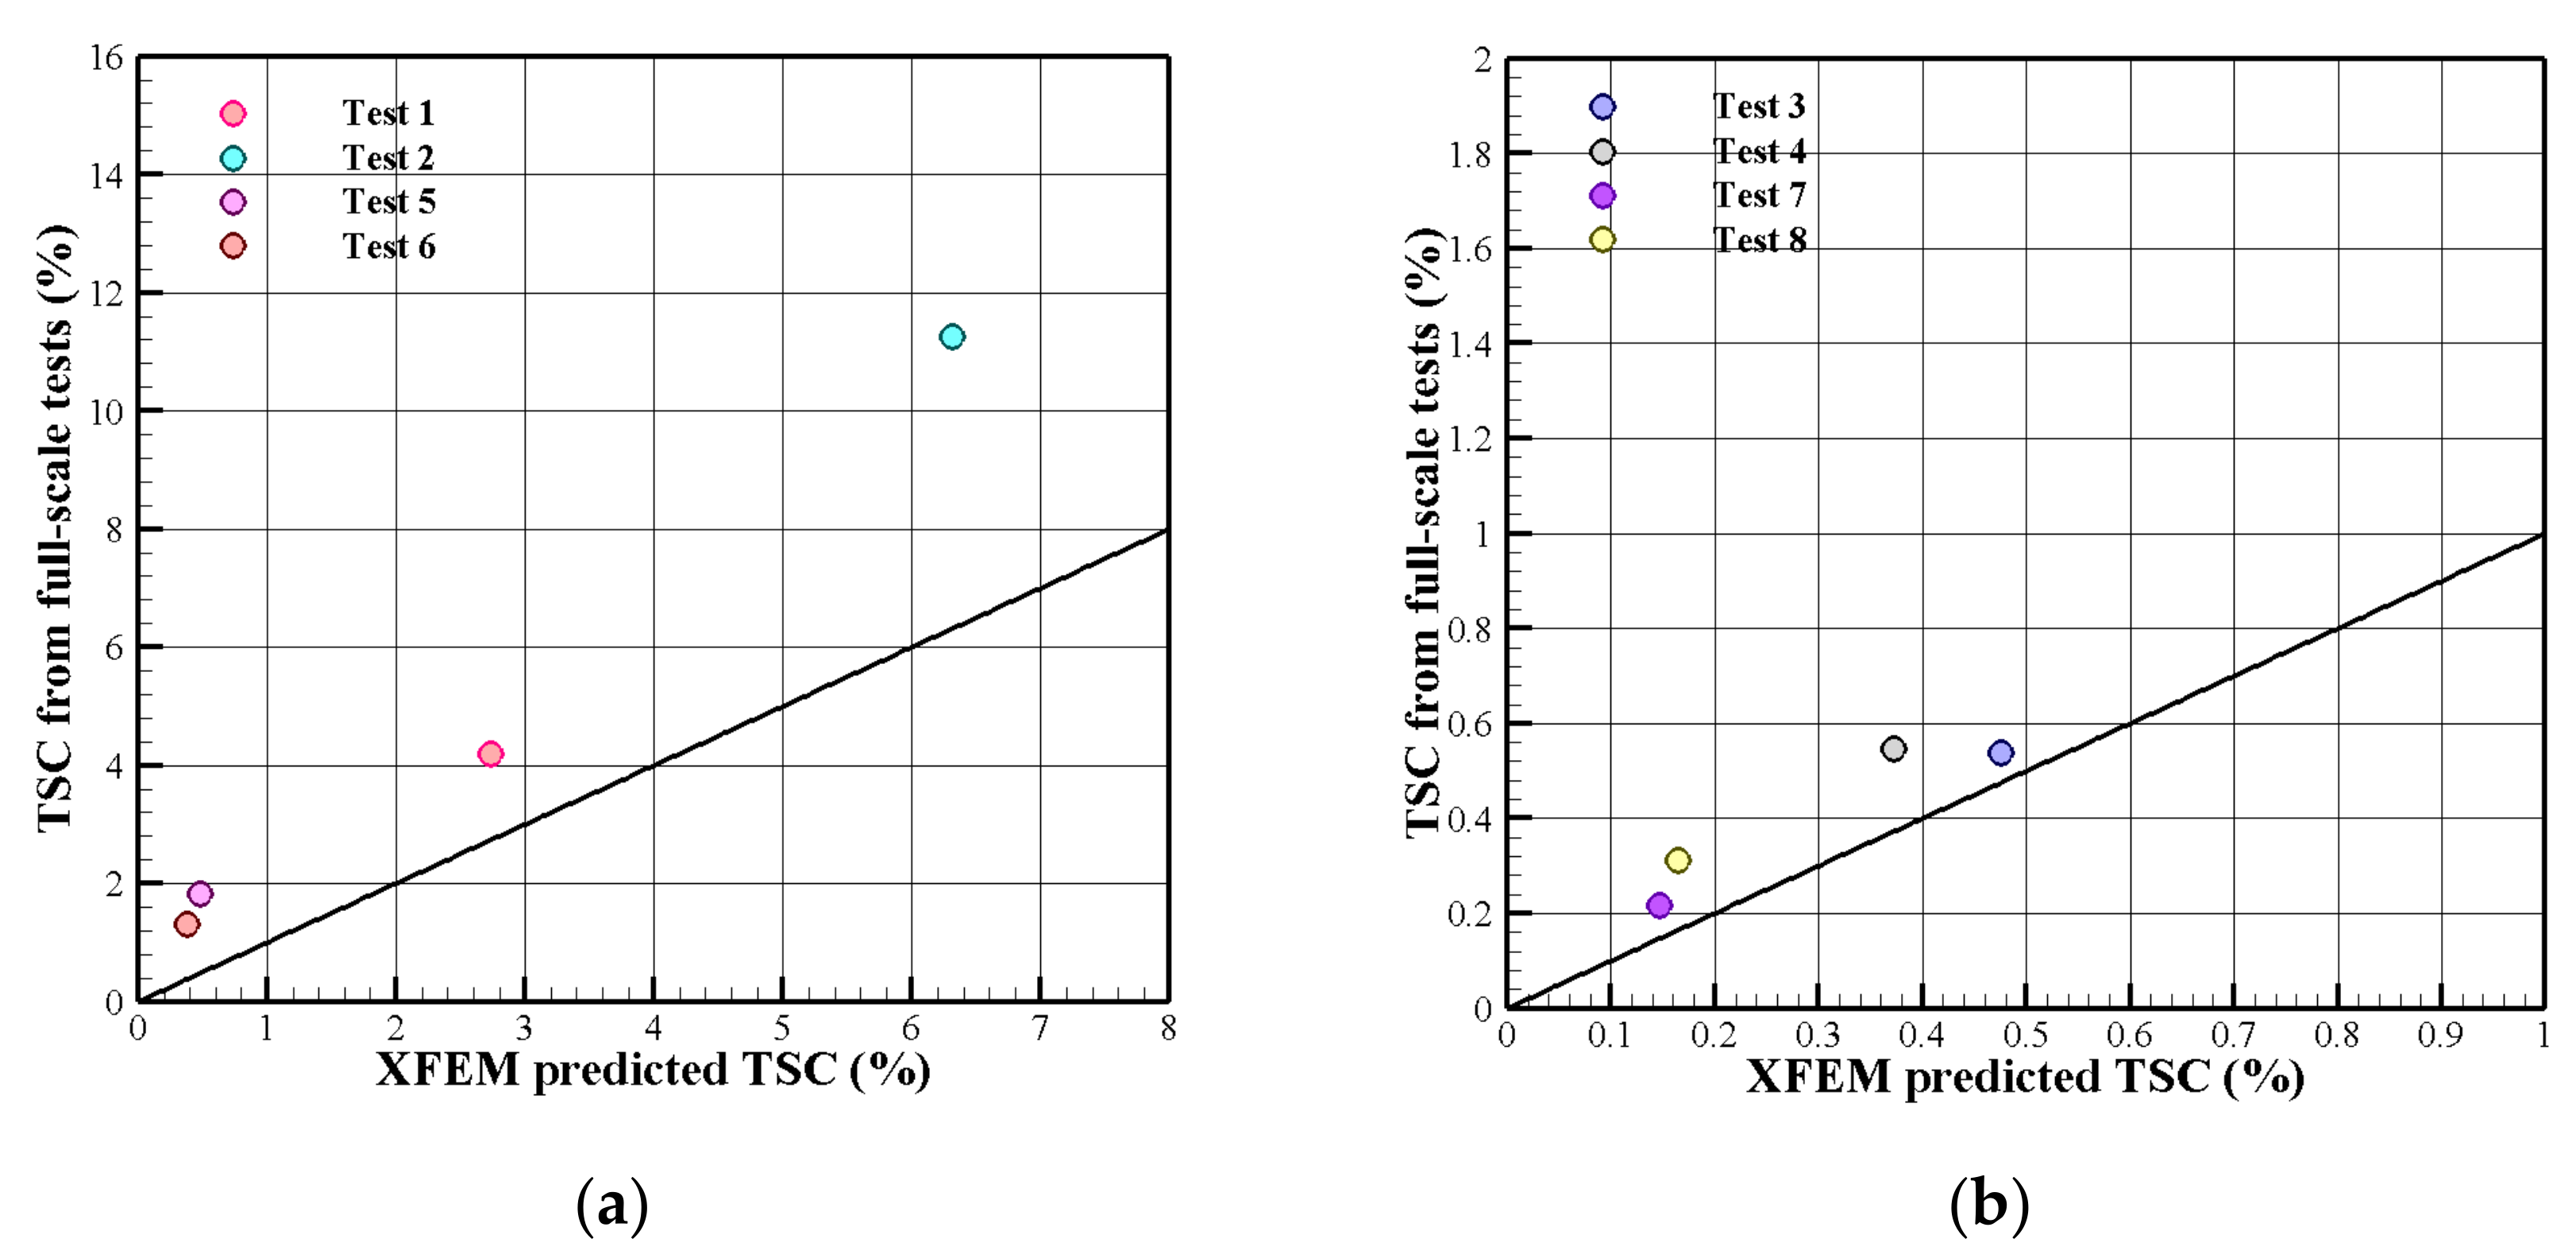
4.1. Tensile Strain Capacity Comparison with Experiments

Two sets of damage parameters are used in the analysis. The first set is obtained through calibration in two steps. First, the damage sets which can accurately predict each of the eight experiments are obtained independently for every model. Then, by obtaining the proper range of Maxpe and Gc for all models, the final set of parameters that can predict all eight models with minimum calibration errors from curve fitting and average TSC are obtained. The final damage parameters (Maxpe = 0.085 mm/mm and Gc = 900 N/mm) are proposed as fracture properties of the X52 vintage pipe. The second set of damage parameters (Maxpe = 0.013 mm/mm and Gc = 450 N/mm) was previously obtained by Agbo et al. [12] in the simulation of the ductile X42 grade of pipeline and applied in the current analysis for comparison.
Figure 4 and Figure 5 represent the XFEM longitudinal tensile strain distribution at the onset of failure and its comparison with longitudinal tensile strains obtained from tests. For each model, the tensile strain values were calculated on the pipe’s outer surface and plotted throughout the pipe length at the tension side. As it can be observed in Figure 4 and Figure 5, generally, a good agreement is obtained between the experiments and the XFEM results. Apart from models 5 and 6, it is seen in these two figures that the damage parameters selected in the XFEM model (Maxpe = 0.085 and Gc = 900 N/mm) are appropriate for the modeled X52 grade. It must be emphasized that the tensile strain capacity is defined as an “average” value of the strain around the flaw since the strain profile is disrupted at the flaw location [21]. The simulation cannot accurately predict the tensile strain results with a distance of less than 20 mm from the crack tip due to the complex stress–strain state near the crack tip. Similar to the observed experimental distribution, the tensile strain increases from the crack location at the pipe center towards the pipe ends.
The TSC is calculated from the XFEM tensile strain values in Figure 4 and Figure 5 and compared with those obtained from full-scale experiments and presented in Figure 6 and Table 3. In this study, the TSC was defined as the average tensile strain at failure. The TSC is obtained by averaging tensile strain values from 10% to 40% of the pipe length on both sides far from the crack, which is in the range of 185–730 mm for tests and models 1–4, and 120–490 mm for tests and models 5–8. Table 3 represents the mean of the ratios (test/model) and COV (%) between XFEM and test results. Additionally, Figure 6 shows the comparisons between two results with a 45-degree line. The comparisons show that XFEM TSC values underestimate the test results. Comparing the results of Figure 4 and Figure 5 with the CMOD–applied load (Figures 8 and 9) and rotation–applied load results (Figures 11 and 12) indicates that using a Maxpe of 0.085 and a Gc of 900 N/mm slightly underestimates the TSC results, but in the CMOD–applied load and rotation–applied load results, higher prediction can be observed in some models in comparison with the test results.
Choosing higher Maxpe values (Maxpe = 0.11 and Gc = 900 N/mm) results in TSC values that better match the experimental results with less variability and percentage differences, as presented in Table 3, but sacrifices the accuracy in the results of CMOD–force (Figures 8 and 9) and rotation–force (Figures 11 and 12). Therefore, the set of Maxpe of 0.085 and Gc of 900 N/mm is chosen to balance the accuracy in all three types of numerical results. Additionally, the percentage differences in Table 3 and Figure 6 are a bit misleading since the distributions shown in Figure 4 and Figure 5 show a good agreement between the numerical and experimental results and indicate the capability of the XFEM model to predict the TSC of X52 vintage pipes.
Models 5 and 6 showed the biggest difference in TSC values between the numerical and test results, as shown in Figure 5a,b and the percentage difference in TSCs in Table 3. One explanation could be the higher material properties of the pipes used in tests 5 and 6 in comparison with other pipes or the different thickness at the location of the flaw, which increases the fracture resistance of the pipe, leading to higher strains. Another possibility could be the higher percentage of multiple notches in the machined flaw observed in the metallurgical study of test 5 in comparison with other tests, leading to higher fracture energy and, eventually, higher strain [21]. Calibration of damage parameters in the XFEM for models 5 and 6 showed that when Maxpe = 0.2 and Gc = 900 N/mm, the XFEM results are in good agreement with the tests (Figure 7).

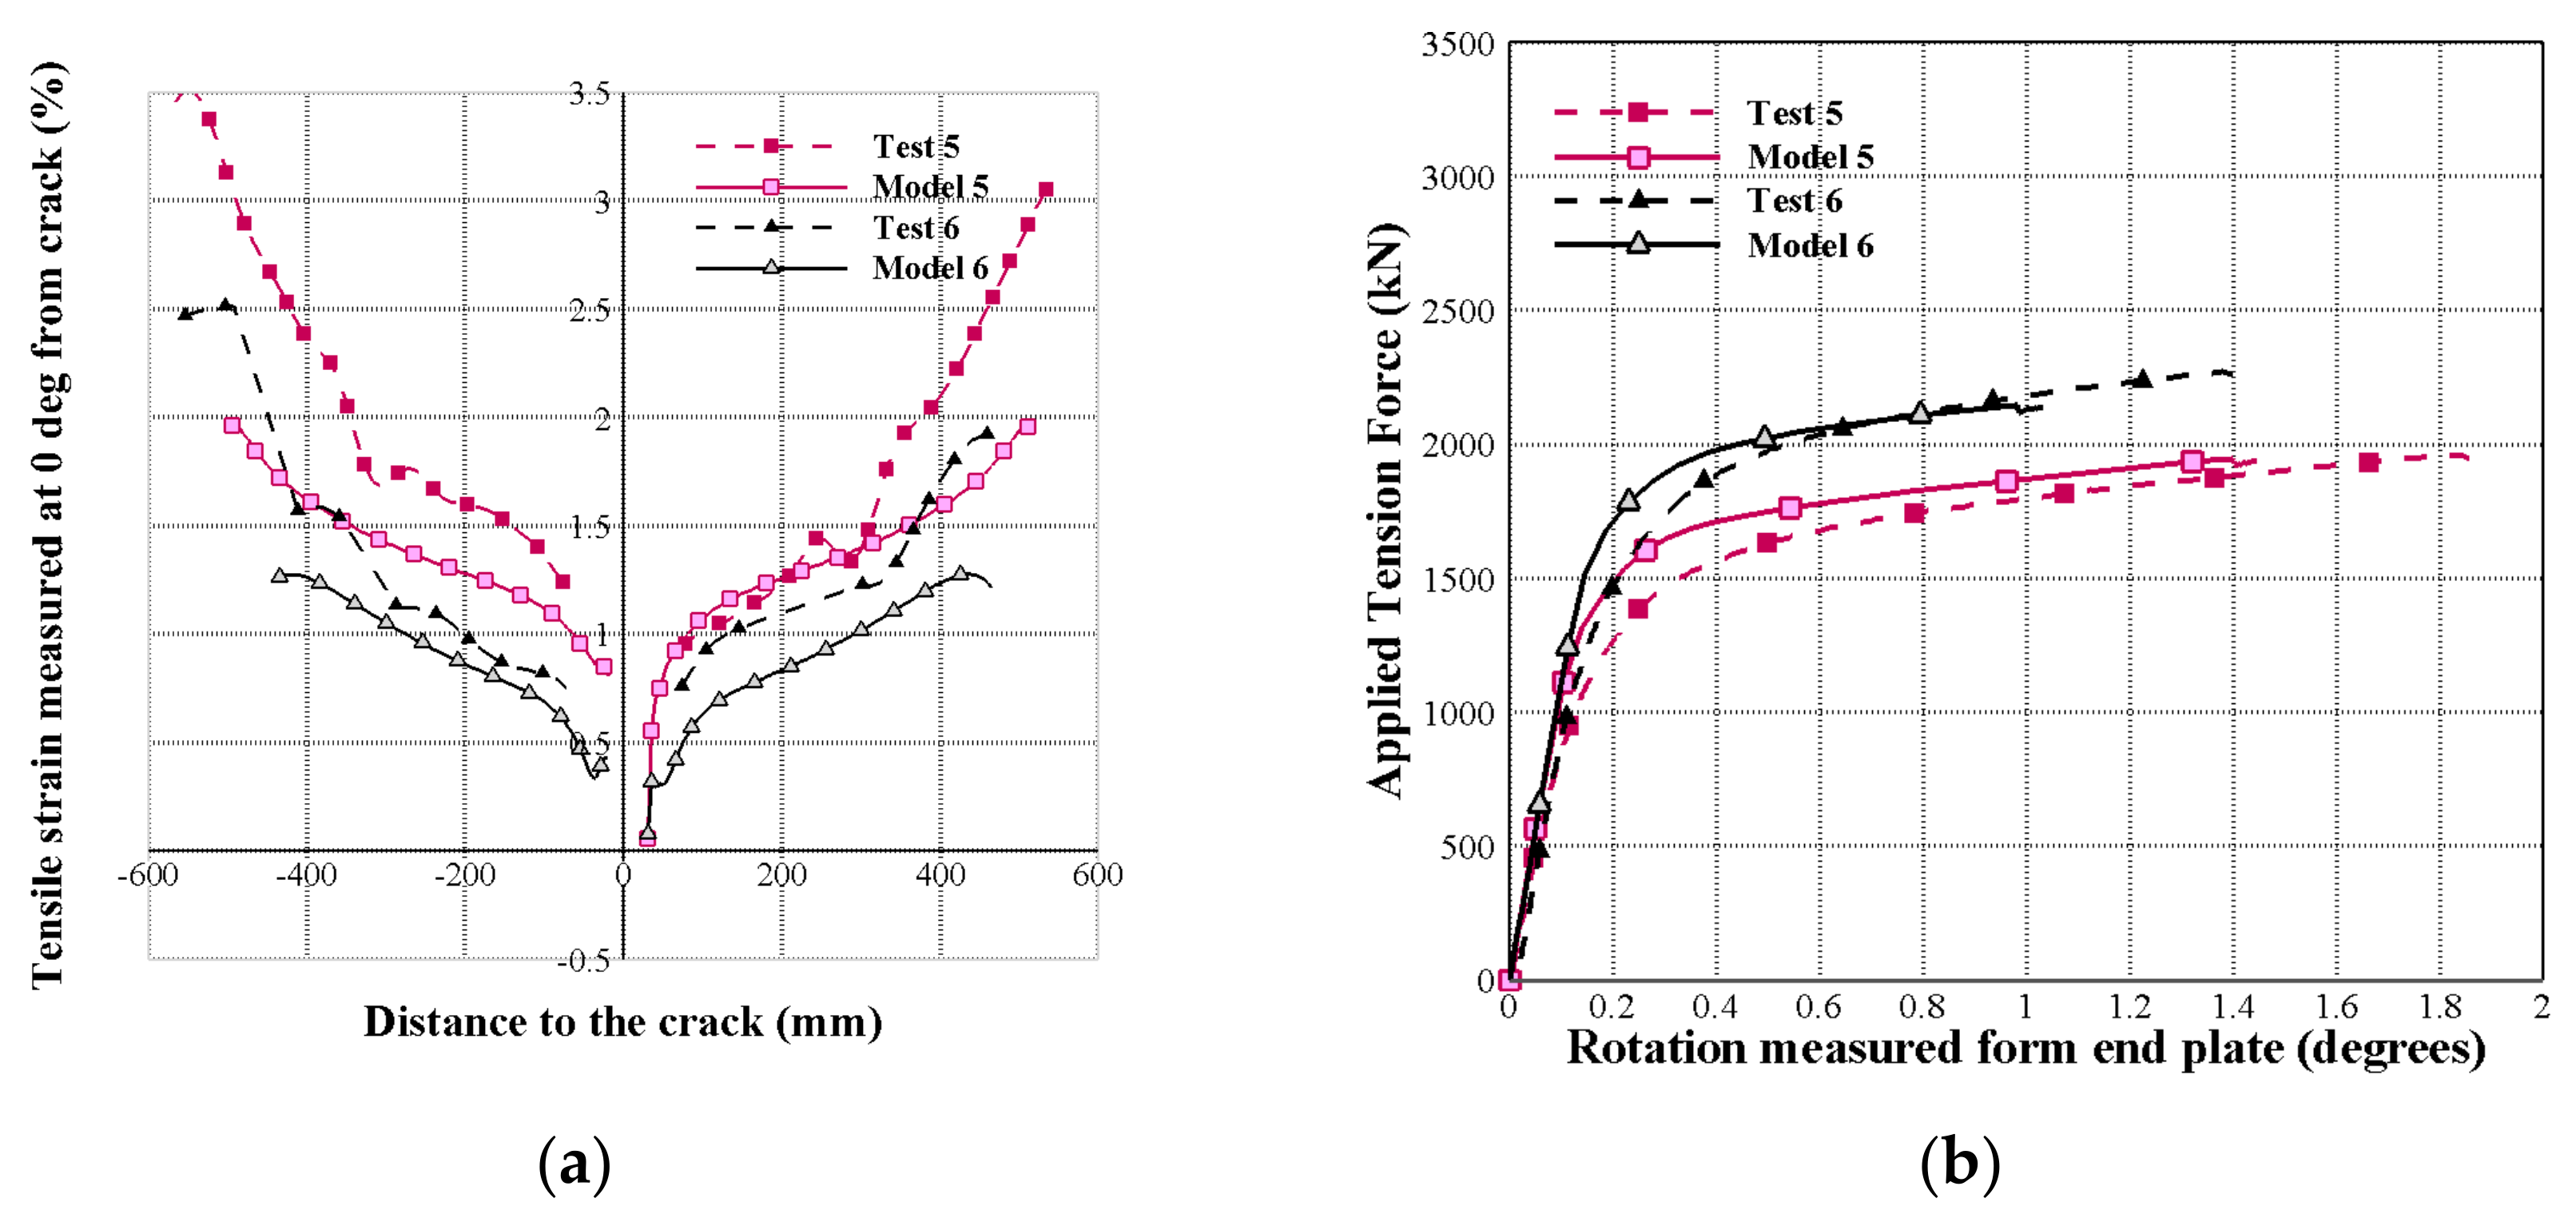
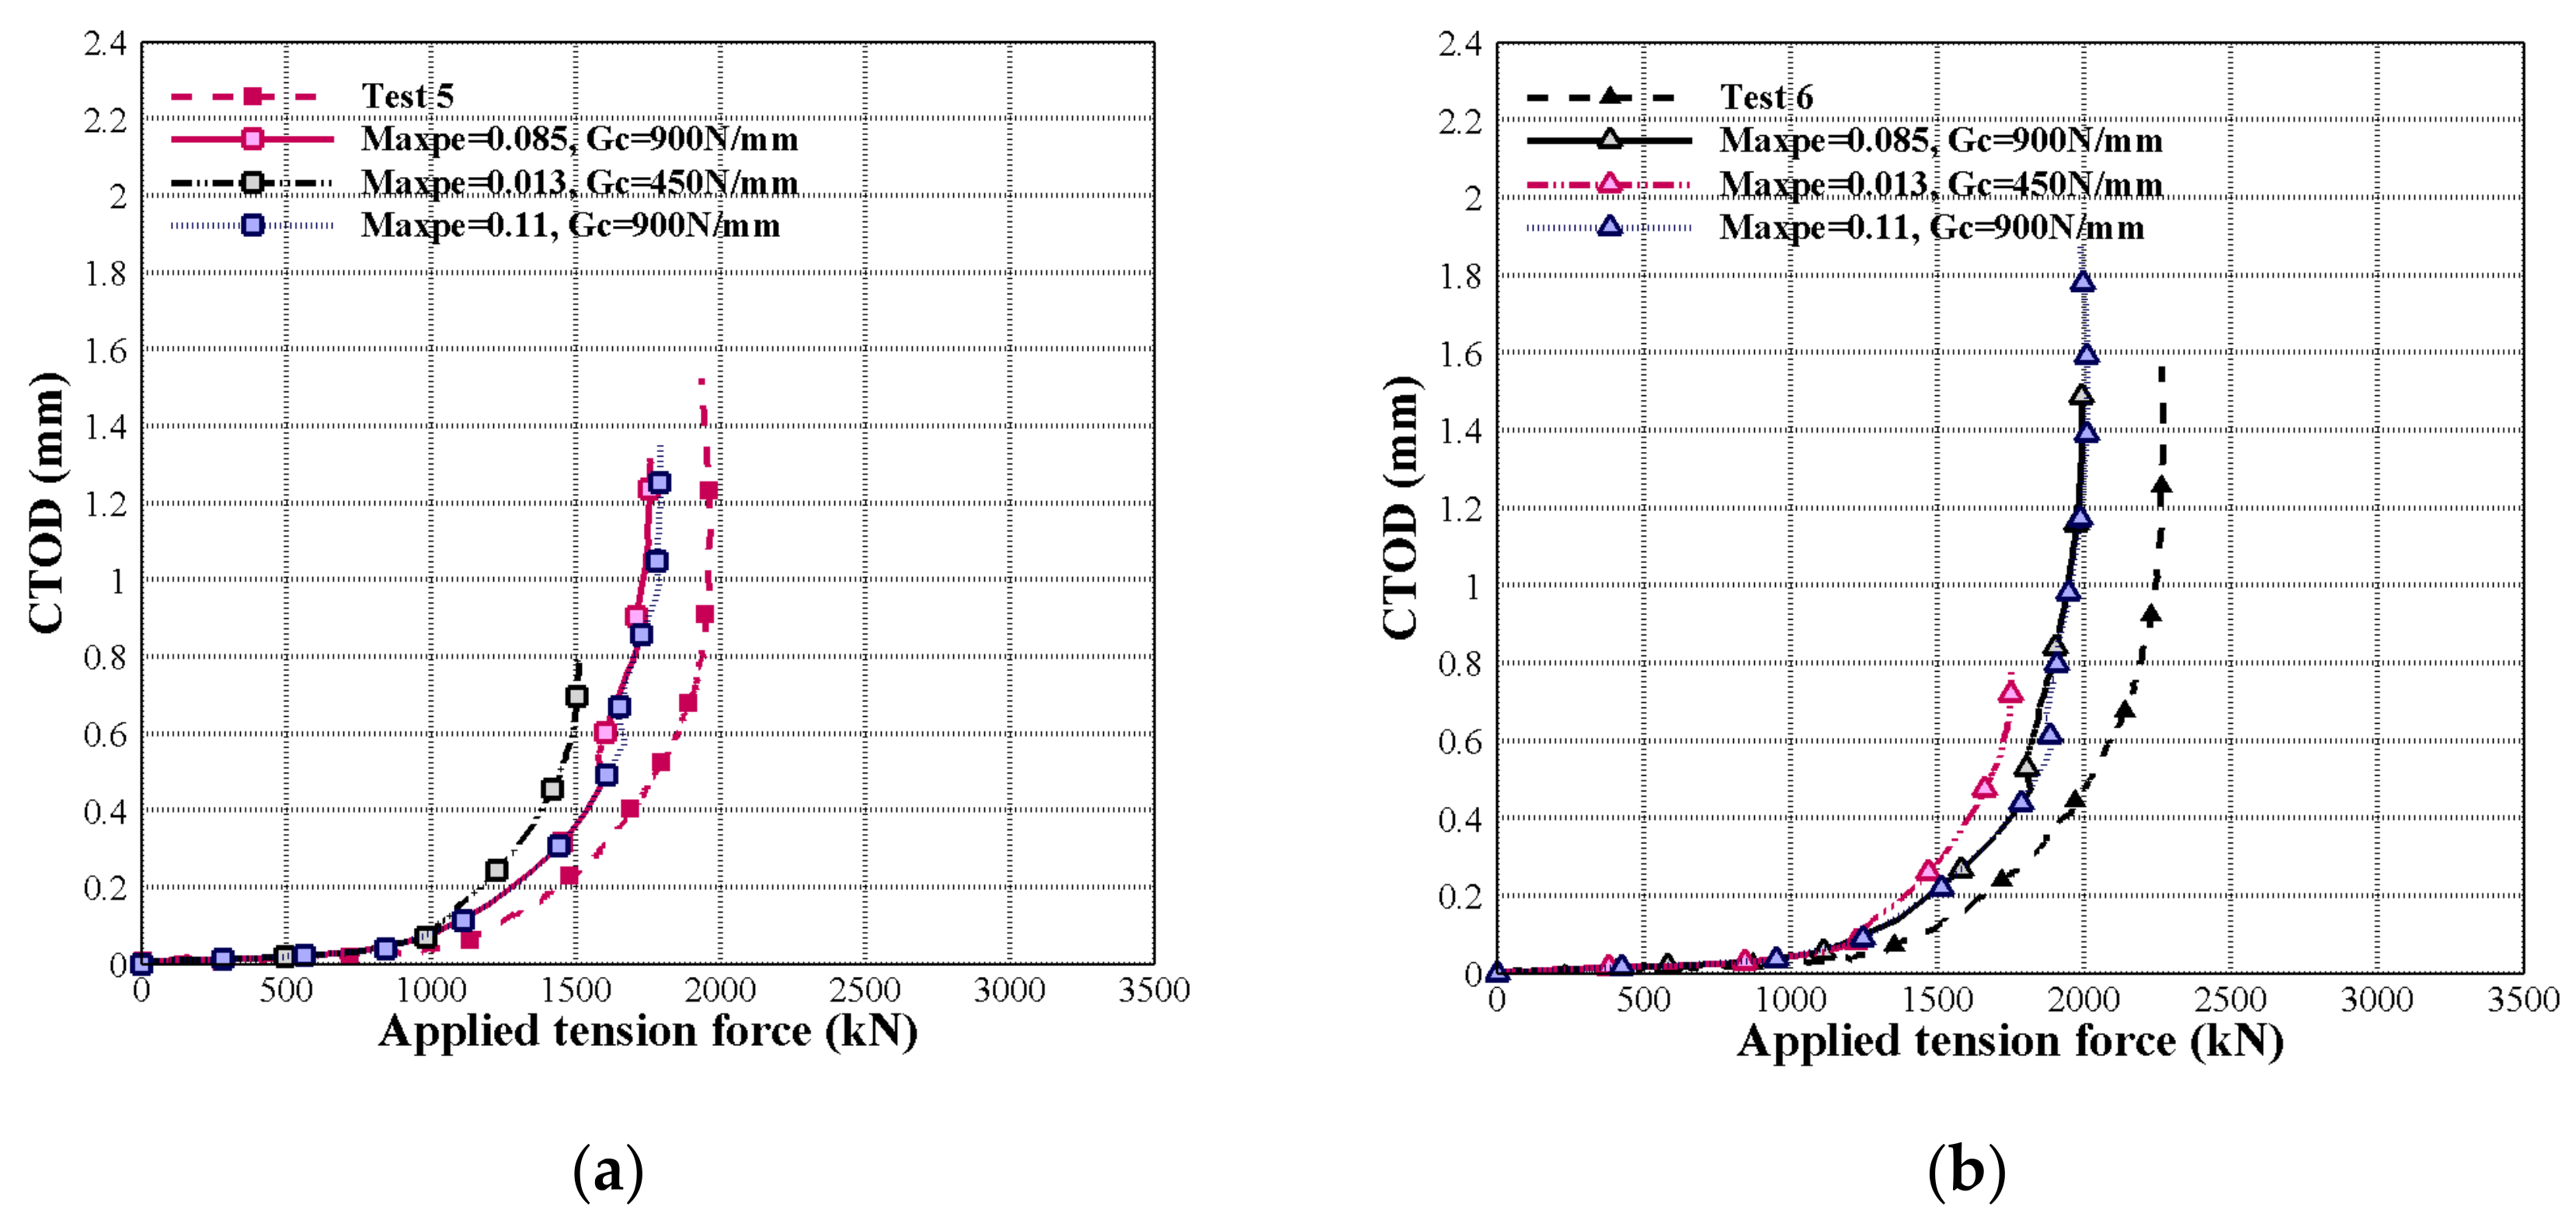
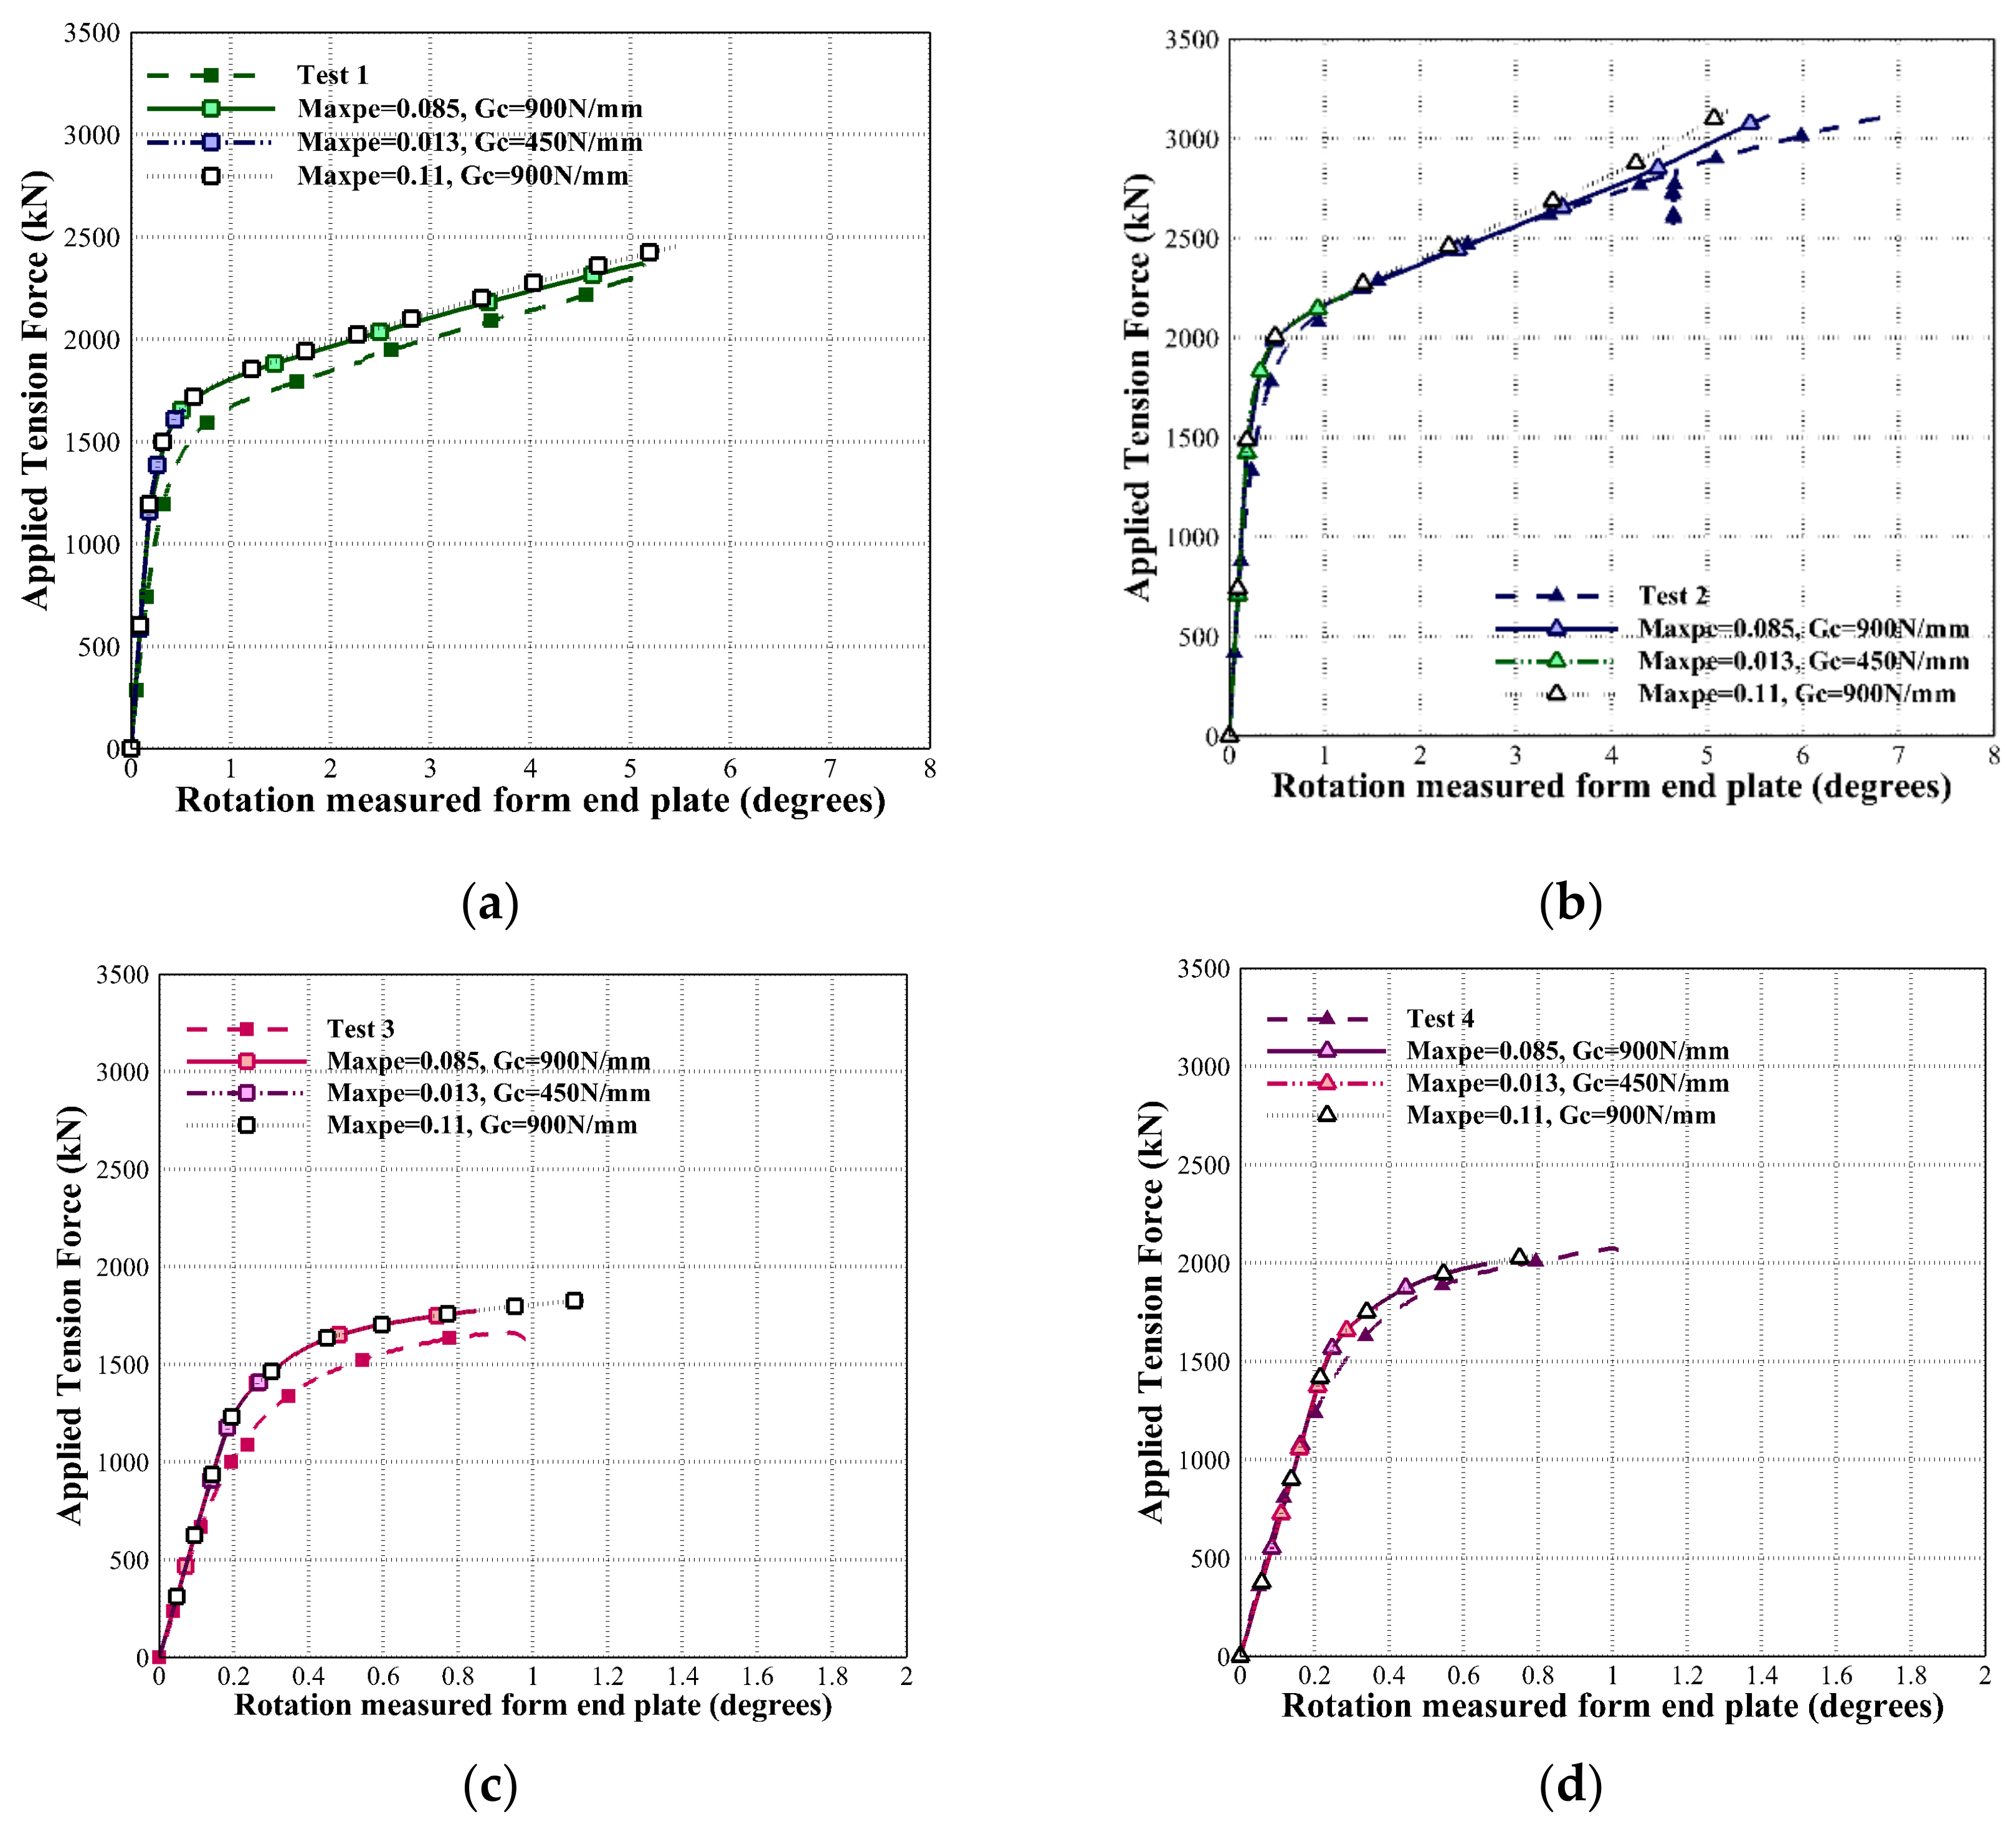
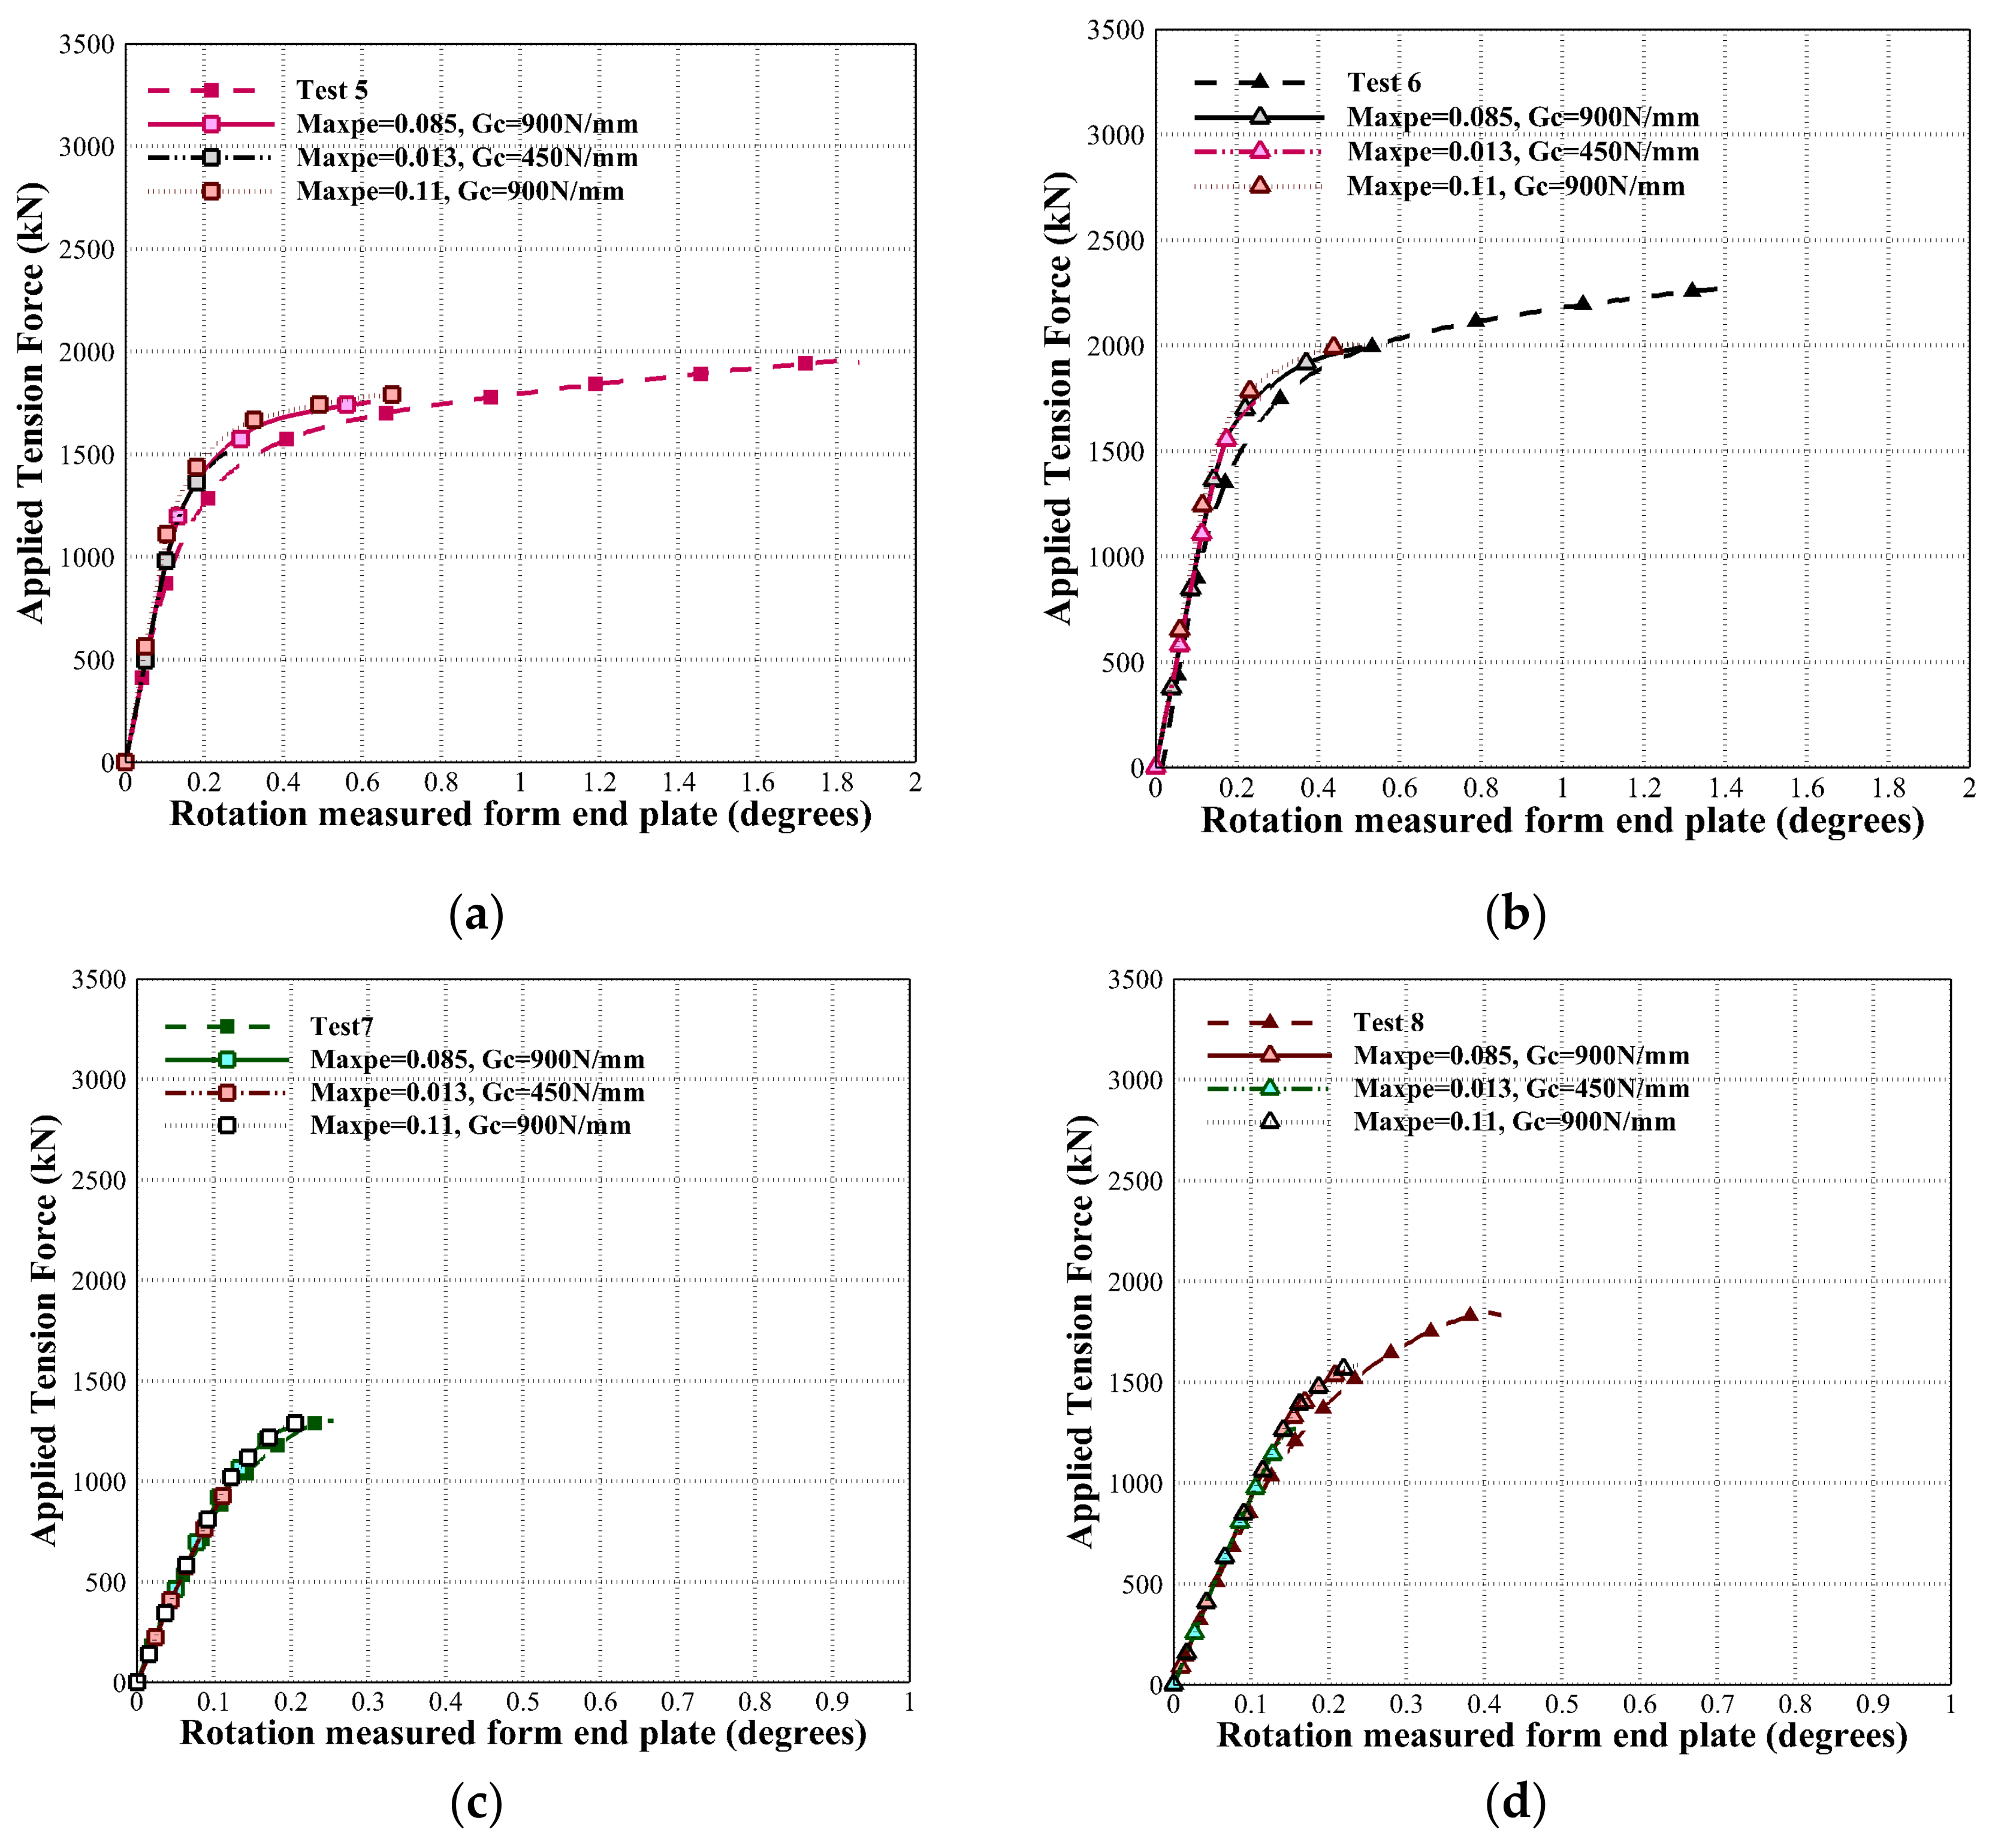
4.2. CMOD, Applied Tension Force, and Endplate Rotation

The CMOD–applied load curves were obtained numerically using the damage parameters Maxpe = 0.085 and Gc = 900 N/mm and compared with the experimental results and are presented in Figure 8 and Figure 9 as well as in Table 4. As it can be observed from Figure 8 and Figure 9, all the obtained curves show the same nonlinearity pattern, similar to that observed in the tests, starting with zero initial slopes with a precipitous rise near failure. CMODcritical was proposed by Abdulhameed et al. [21] and calculated at the point where CMOD rapidly increases and the applied load is almost constant. CMODcritical equals CMOD at 97% of the failure load. In Table 4, the CMODcritical values for all tests and models are compared with the results of CMODfailure, which is the CMOD value when the failure occurs, as described previously and shown in Figure 10. The numerical CMODfailure values were between 33% lower to 12% higher than the experimental CMODfailure. The maximum difference of 0.74 mm was obtained in test and model 3. The endplate rotations obtained from the XFEM are also plotted against the applied load and compared with experiments. The results are shown and summarized in Figure 11 and Figure 12 and Table 4, respectively. A good agreement is observed for all the models and tests. As shown in Table 4, the XFEM results for maximum loads are approximately between 15% lower and 9% higher than the experiments for all tests and models. The maximum difference of 275 kN was obtained between test and model 8. Additionally, it can be seen that the XFEM rotations at failure are roughly from 67% lower to 1% higher than the experiments for all tests and models, with a maximum difference of 1.2 degrees calculated between test and model 5. It is concluded that in tests 5 and 6, using a Maxpe of 0.085 and a Gc of 900 N/mm produces the biggest difference in results, as shown in Figure 9a,b for CMOD–force and Figure 12a,b for rotation–force results. The experimental observations showed higher fracture resistance than the models, as discussed previously. When a Maxpe of 0.2 is chosen for these tests, better predictions can be observed (Figure 7b,c). Future work will attempt to obtain the material damage parameters from small-scale tests and to develop a variable failure criterion that is a function of the crack tip constraints.
The damage parameters (Maxpe = 0.013 and Gc = 450 N/mm) obtained by Agbo et al. [12] for X42 vintage material were used as damage parameters in this study to test whether these parameters can universally be used among different vintage pipelines or not. The results show underestimation of the TSC (Figure 4 and Figure 5), CMOD–applied load (Figure 8 and Figure 9), and rotation–applied load (Figure 11 and Figure 12) for all eight models in comparison with the test results, which shows that Maxpe = 0.013 and Gc = 450 N/mm are not a proper damage set for the X52 vintage pipe. This poor prediction could be attributed to the difference in the location of the cracks in both sets. For Agbo et al.’s tests, the flaws were machined in the reportedly inferior weld material, in contrast with the X52 where failure occurred in the base metal [12,21]. There is a need for a larger set of experimental results to correlate the material damage parameters with the quality of the weld metal and the grade and toughness of the base metal.

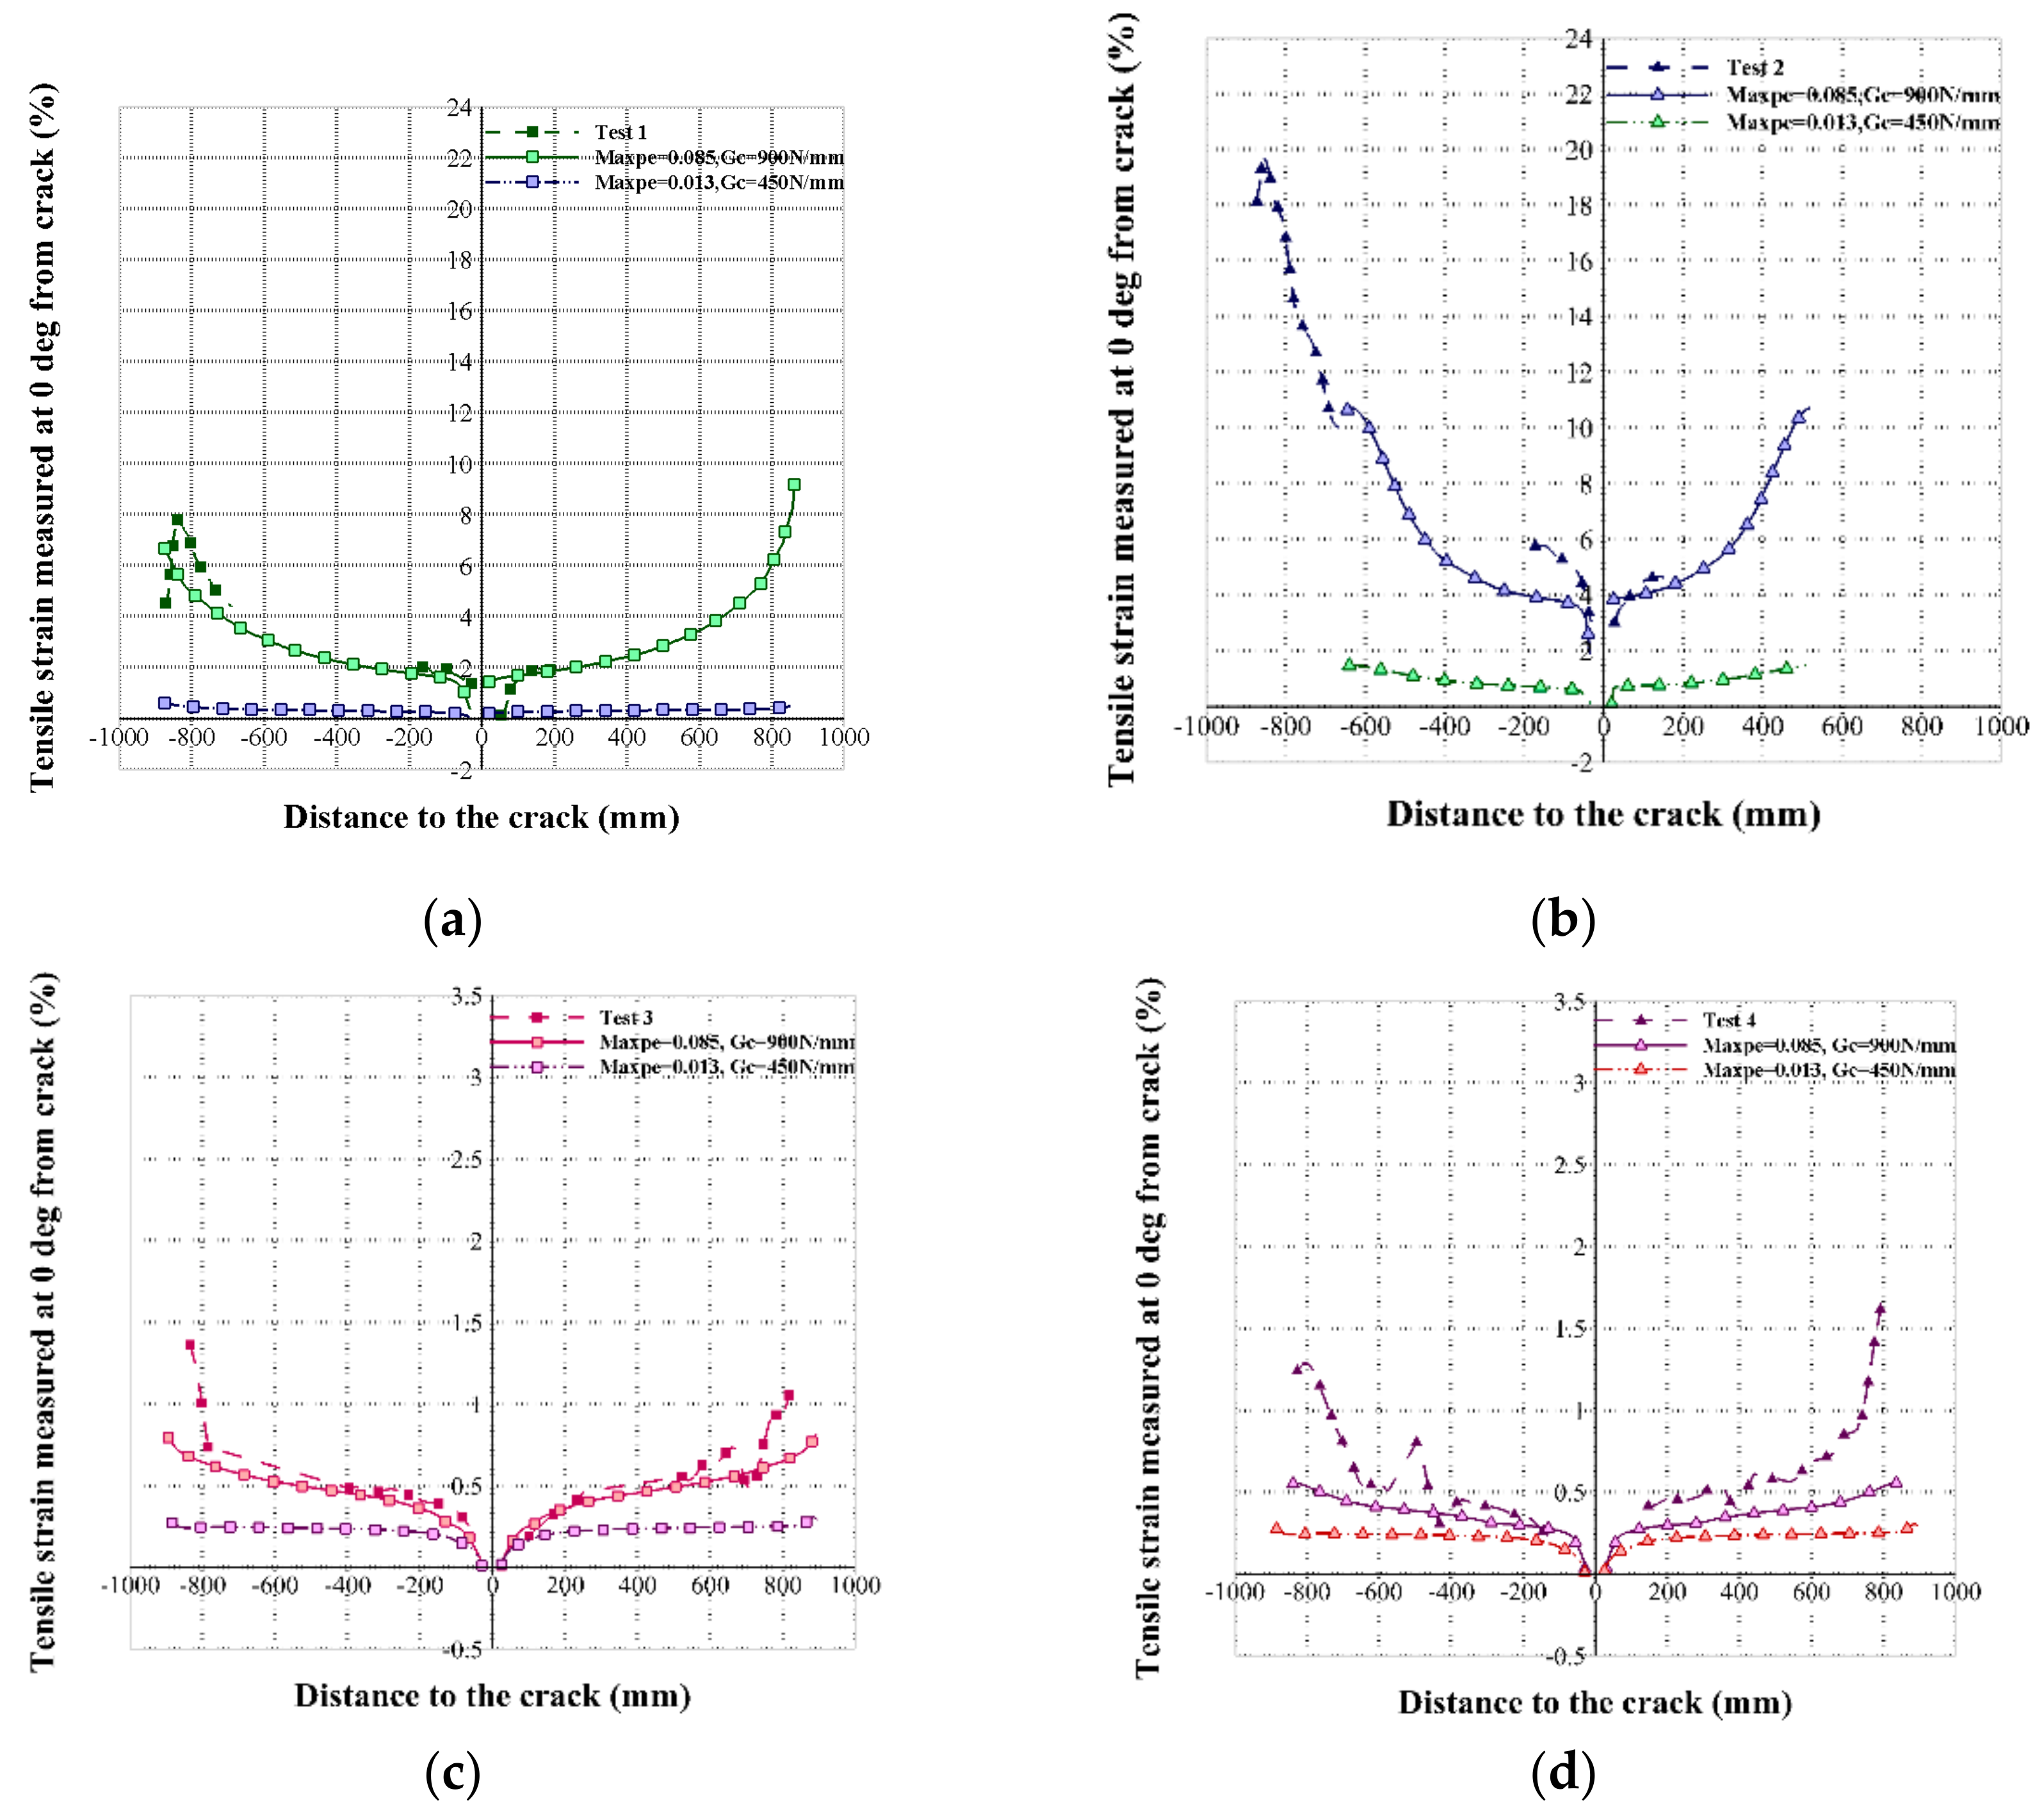
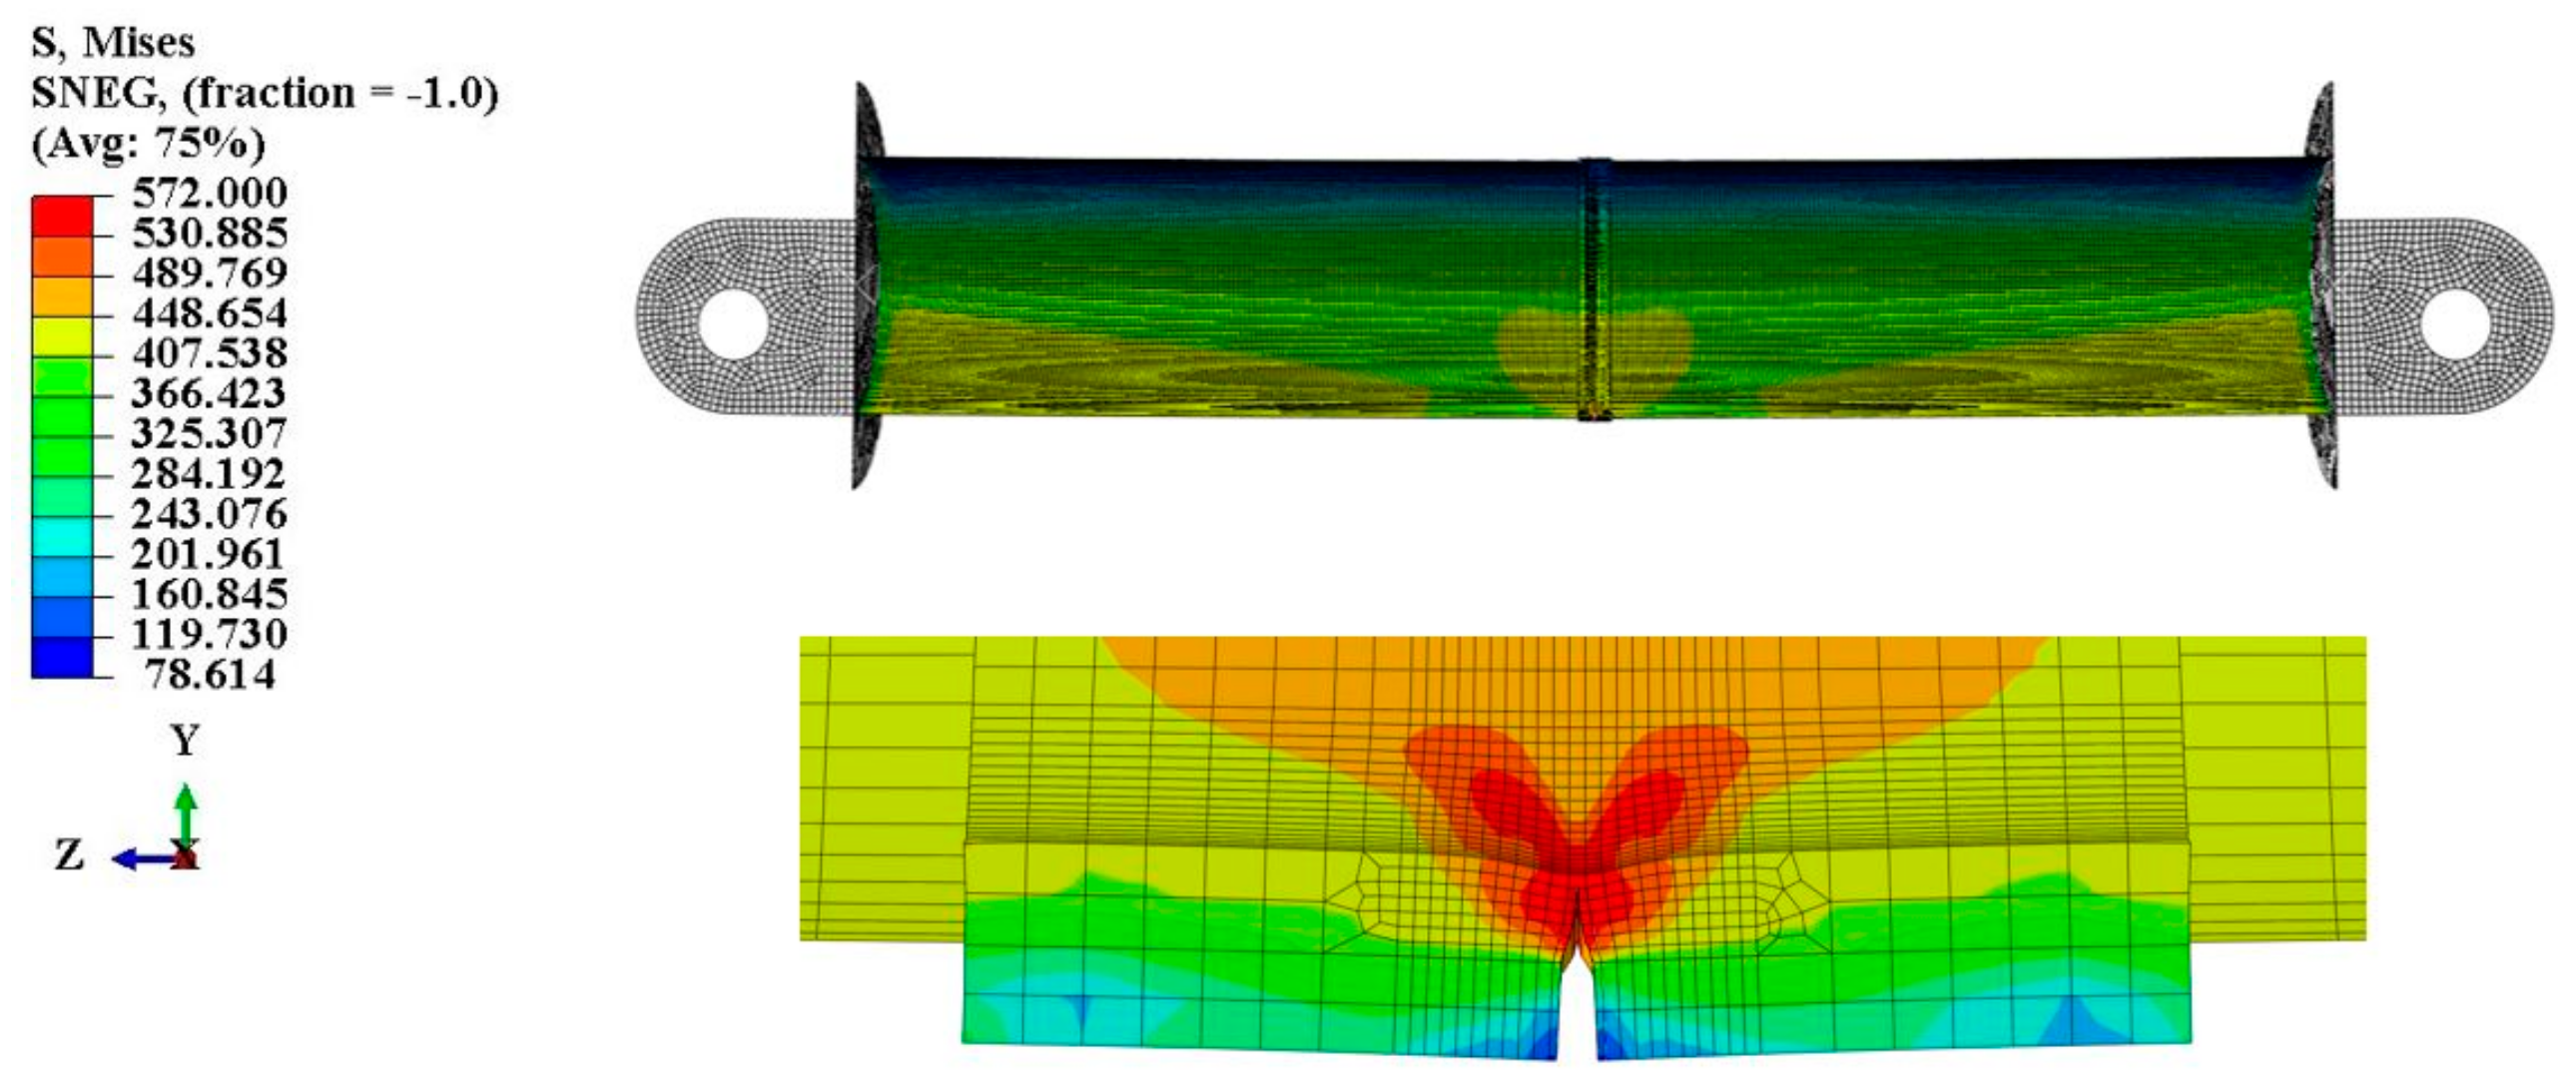
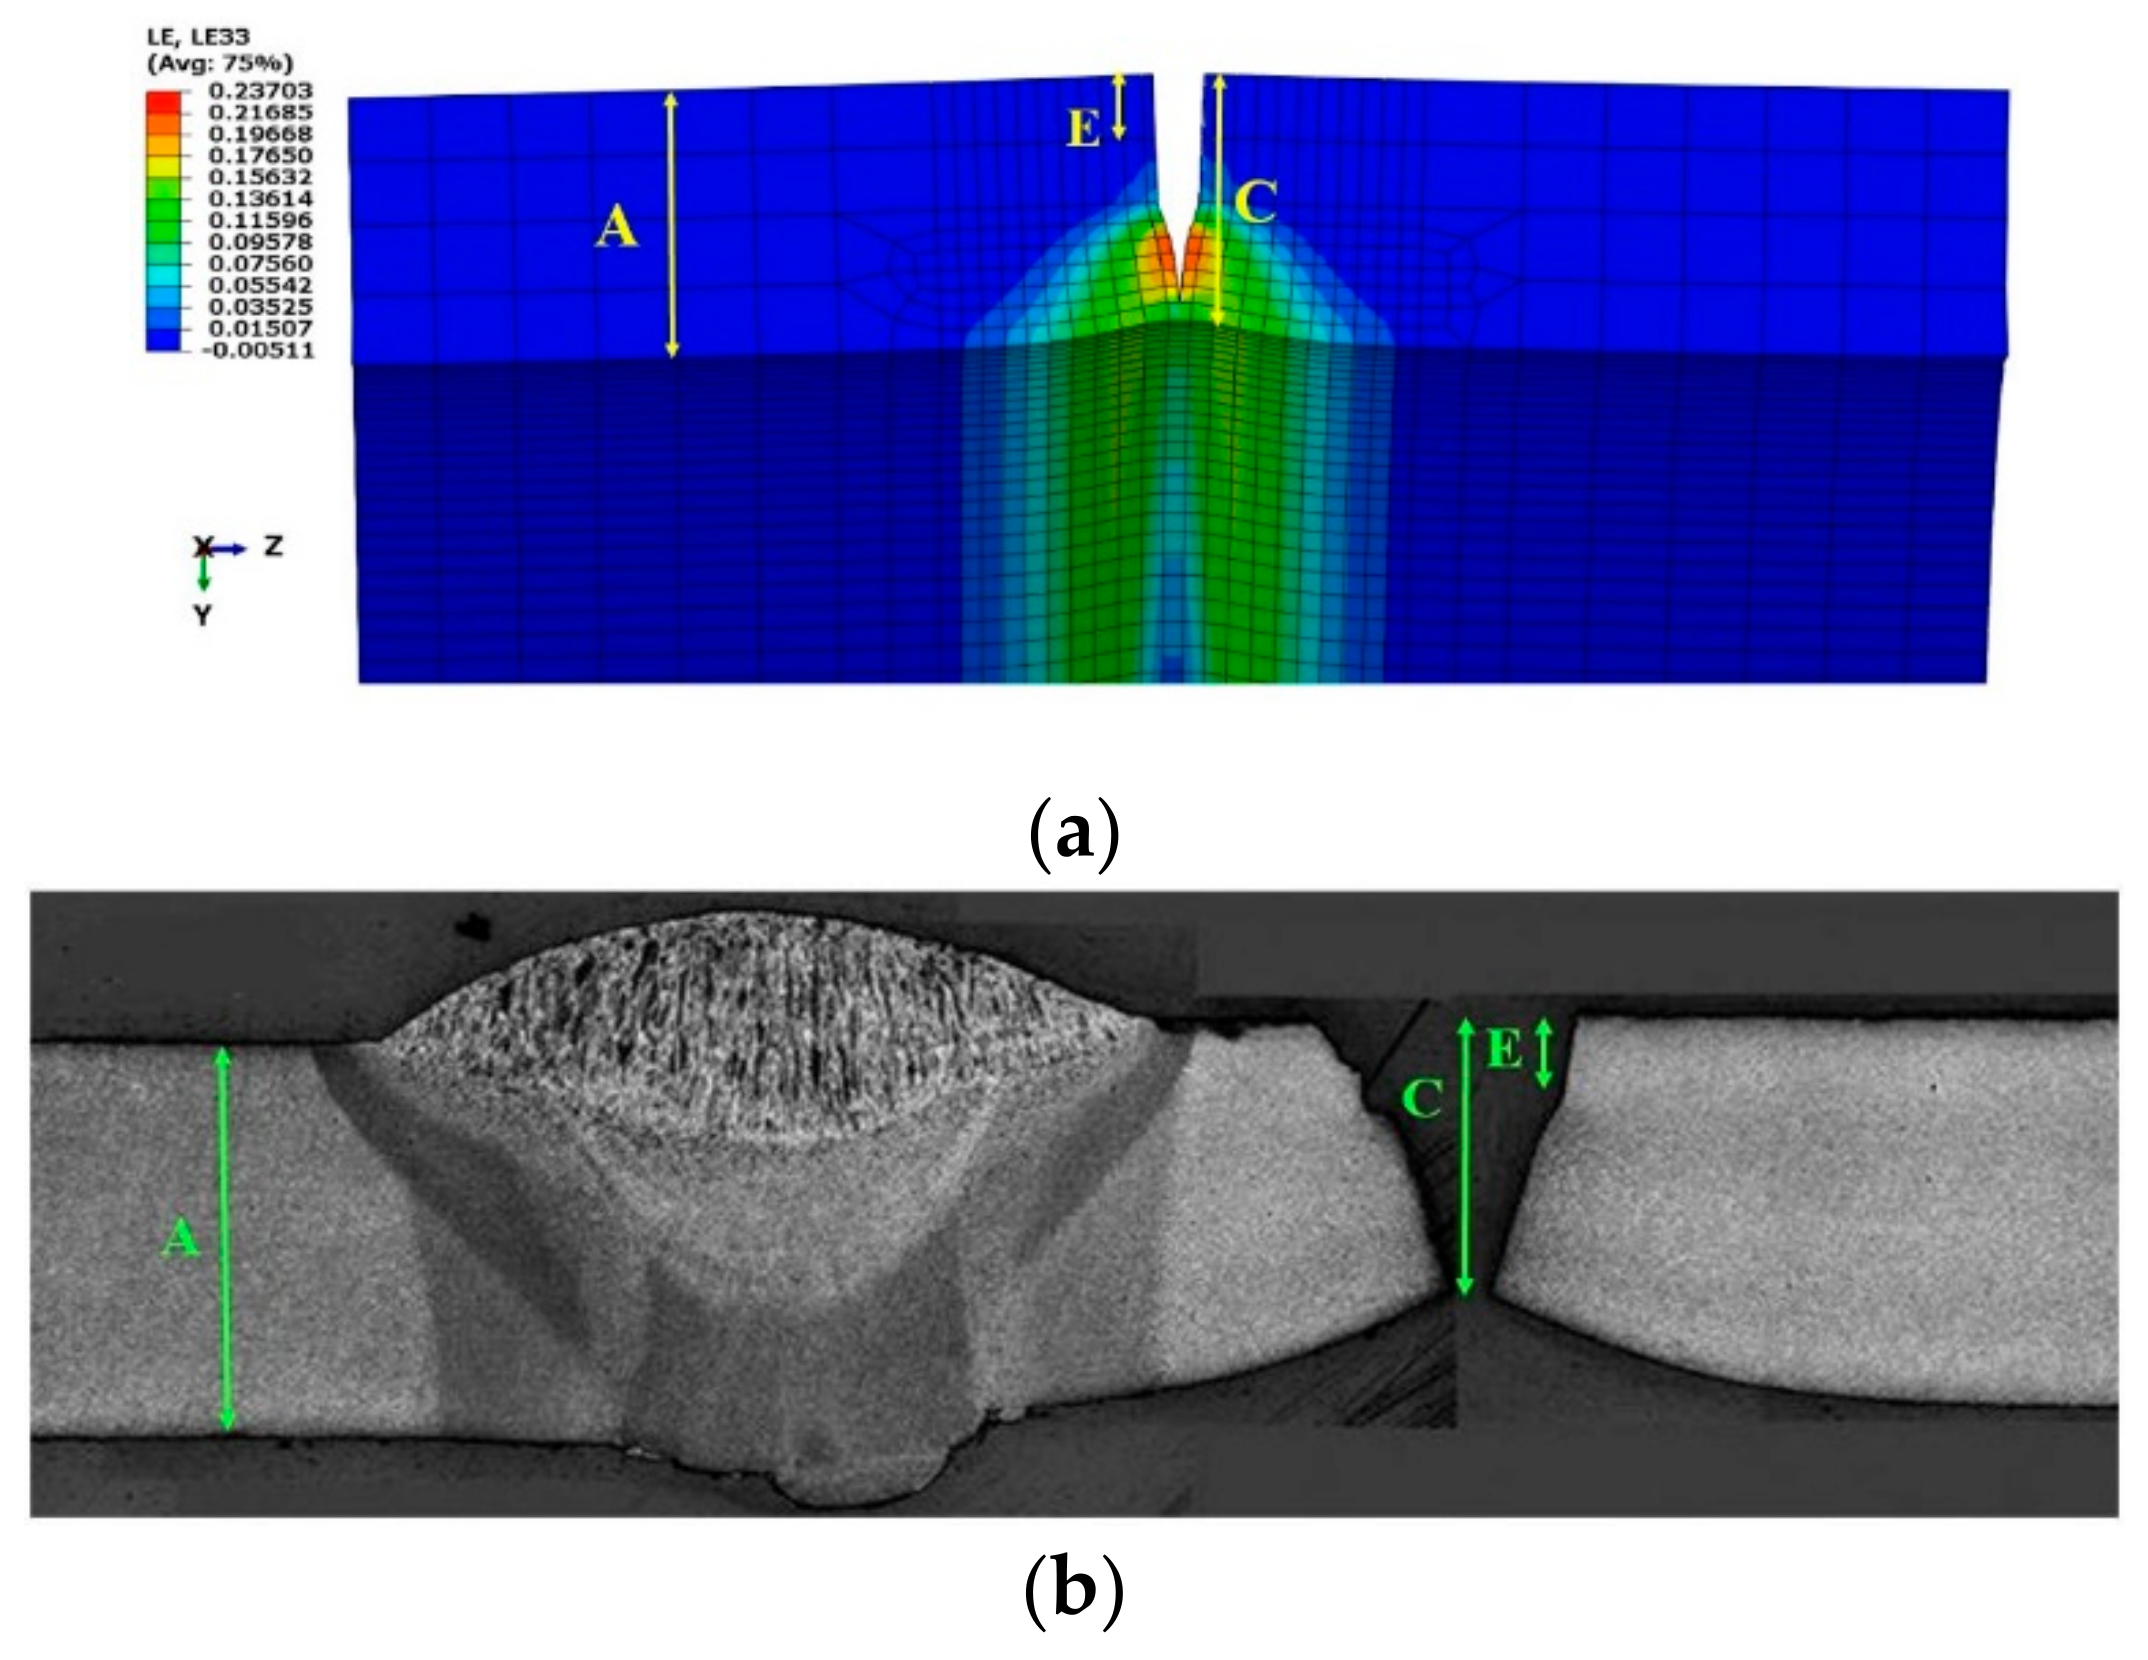
4.3. Geometry of Cracked Pipe in the Vicinity of the Flaw

The numerical fracture surface analysis at failure for the X52 pipe was performed by Lin et al. [13] using the XFEM and damage parameters Maxps = 750 MPa and Gc = 900 N/mm. The fracture surface compared well with experiments presented by Abdulhameed et al. [21]. Figure 13 shows the fracture surface of model 1 when Maxpe = 0.085 and Gc = 900 N/mm and the fracture geometry obtained by fractography of test 1. The parameters A, C, and E represent the original pipe wall thickness, reduced pipe wall thickness, and original crack depth, respectively. The experimental analysis of fracture surfaces revealed that fracture surfaces were flat with no significant ductile dimpling or tearing, suggesting a fracture that is brittle in nature [21]. A comparison of the reduction in wall thickness at failure with the experimentally observed value is presented in Table 4. The results show that the model consistently underestimates the reduction in the wall thickness at the onset of failure (mean = 2.118 and COV = 19.377%). One reason for this discrepancy, as proposed by Lin et al. [13], is the exclusion in the numerical analysis of the mechanical deformation associated with the sudden release of internal pressure at failure [13].

5. Conclusions

This study aimed to use the XFEM to simulate the fracture of API 5L X52 grades of X52 vintage pipes with circumferential flaws under the effect of internal pressure and eccentric tension loading. The maximum principal strain and fracture energy were chosen as the damage parameters in the XFEM simulation. Appropriate values for these damage parameters were obtained by a comprehensive comparison with eight full-scale experimental test results. The comparison included tensile strain, CMOD, applied load, and rotation at endplates. The XFEM results indicated that appropriate damage parameters of maximum principal strain of 0.085 and fracture energy of 900 kN/mm can be used to replicate the experimental results. The comparisons of the numerical and experimental results of tensile strain capacity along the pipe length showed good agreement. The XFEM models satisfactorily predicted the tensile strain along the pipe length using the proposed fracture properties. Regardless of the differences in the pipe and crack dimensions as well as the internal pressure of each model, the XFEM analysis can accurately predict the initiation and propagation of the crack in all eight models. The XFEM predicted results of CMOD–applied force and rotation–force were also compared with the test results and good agreement was observed. Models 5 and 6, characterized by shallow and long cracks, exhibited a slightly more ductile behavior. For these two models, the maximum principal strain of 0.2 and fracture energy of 900 N/mm produced a model with a better match of the experimental results of tests 5 and 6. This difference can be justified due to the existence of multiple crack fronts or the natural variability associated with the fracture, which both lead to higher fracture energy and, eventually, higher tensile strain capacity. Similar to the experimental study of the crack surface, the XFEM analysis of the crack surface suggests a brittle fracture in X52 grades of pipeline. Future work will focus on obtaining the damage parameters of the X52 grade of pipeline in small-scale tests. Analysis of the fracture response in both small-scale and full-scale tests will help to better predict the material damage parameters considering the impact of the base metal fracture toughness and the weld metal structure and will lead to developing a tensile strain equation that can predict the TSC for this grade of vintage pipeline.

Author Contributions

Conceptualization, S.A. and L.W.; writing—original draft preparation, N.E.; supervision, L.W., S.A. and M.S.; writing—review and editing, M.S., M.L. and Y.L.; funding acquisition, M.K. and N.Y.-G. All authors have read and agreed to the published version of the manuscript.

Funding

This research was funded by Enbridge Pipelines Inc., in collaboration with MITACS Canada.

Data Availability Statement

The data presented in this study are available on request from the corresponding author.

Acknowledgments

The authors would like to thank the financial support from Enbridge Pipelines Inc. Edmonton, in collaboration with MITACS Canada.

Conflicts of Interest

The authors declare no conflict of interest.

References

  1. Liu, B.; Liu, X.J.; Zhang, H. Strain-Based Design Criteria of Pipelines. J. Loss Prev. Process. Ind. 2009, 22, 884–888. [Google Scholar] [CrossRef]
  2. Pan, J.H. Several Concernment Task under Development of High Strength Pipeline Steel. Welded Pipe Tube 2005, 28, 1–2. [Google Scholar]
  3. Macia, M.L.; Kibey, S.A.; Arslan, H.; Bardi, F.; Ford, S.J.; Kan, W.C.; Cook, M.F.; Newbury, B. Approaches to Qualify Strain-Based Designed Pipelines. In Biennial International Pipeline Conference; American Society of Mechanical Engineers: Calgary, AB, Canada, 2010; Volume 4, pp. 365–374. [Google Scholar]
  4. Agbo, S.; Lin, M.; Ameli, I.; Imanpour, A.; Duan, D.-M.; Cheng, J.J.R.; Adeeb, S. Experimental Evaluation of the Effect of the Internal Pressure and Flaw Size on the Tensile Strain Capacity of Welded X42 Vintage Pipelines. Int. J. Press. Vessel. Pip. 2019, 173, 55–67. [Google Scholar] [CrossRef]
  5. Wang, Y.Y.; Rudland, D.; Denys, R.; Horsley, D. A Preliminary Strain-Based Design Criterion for Pipeline Girth Welds. In International Pipeline Conference; American Society of Mechanical Engineers: Calgary, AB, Canada, 2002; Volume A, pp. 415–427. [Google Scholar]
  6. Wang, Y.Y.; Cheng, W.; Horsley, D. Tensile Strain Limits of Buried Defects in Pipeline Girth Welds. In Biennial International Pipeline Conference; American Society of Mechanical Engineers: Calgary, AB, Canada, 2004; Volume 2, pp. 1607–1614. [Google Scholar]
  7. Wang, Y.Y.; Horsley, D.; Cheng, W.; Glover, A.; McLamb, M.; Zhou, J.; Denys, R. Tensile Strain Limits of Girth Welds with Surface-Breaking Defects Part II Experimental Correlation and Validation. In Proceedings of the 4th International Conference Pipeline Technology, Calgary, AB, Canada, 30 September–3 October 2002; pp. 251–266. [Google Scholar]
  8. Kibey, S.; Wang, X.; Minnaar, K.; Macia, M.L.; Fairchild, D.P.; Kan, W.C.; Ford, S.J.; Newbury, B. Tensile Strain Capacity Equations for Strain-Based Design of Welded Pipelines. In Proceedings of the 2010 8th International Pipeline Conference, Calgary, AB, Canada, 27 September–1 October 2010; Volume 4, pp. 355–363. [Google Scholar]
  9. Fairchild, D.P.; Kibey, S.A.; Tang, H.; Krishnan, V.R.; Wang, X.; Macia, M.L.; Cheng, W. Continued Advancements Regarding Capacity Prediction of Strain-Based Pipelines. In International Pipeline Conference; American Society of Mechanical Engineers: Calgary, AB, Canada, 2012; Volume 4, pp. 297–305. [Google Scholar]
  10. Tang, H.; Fairchild, D.; Panico, M.; Crapps, J.; Cheng, W. Strain Capacity Prediction of Strain-Based Pipelines. In Proceedings of the 2014 10th International Pipeline Conference, Calgary, AB, Canada, 29 September 2014; p. V004T11A025. [Google Scholar]
  11. Wang, Y.-Y.; Liu, M.; Song, Y.; Stephens, M.; Petersen, R.; Gordon, R. Second Generation Models for Strain-Based Design; Pipeline Research Council International: Houston, TX, USA, 2011. [Google Scholar]
  12. Agbo, S.; Lin, M.; Ameli, I.; Imanpour, A.; Duan, D.M.; Cheng, J.J.R.; Adeeb, S. Evaluation of the Effect of Internal Pressure and Flaw Size on the Tensile Strain Capacity of X42 Vintage Pipeline Using Damage Plasticity Model in Extended Finite Element Method. In Proceedings of the American Society of Mechanical Engineers, Pressure Vessels and Piping Division (Publication) PVP, San Antonio, TX, USA, 14–19 July 2019; American Society of Mechanical Engineers (ASME): San Antonio, TX, USA, 2019; Volume 5, p. PVP2019-94005. [Google Scholar]
  13. Lin, M.; Agbo, S.; Duan, D.-M.; Cheng, J.J.R.; Adeeb, S. Simulation of Crack Propagation in API 5L X52 Pressurized Pipes Using XFEM-Based Cohesive Segment Approach. J. Pipeline Syst. Eng. Pract. 2020, 11, 04020009. [Google Scholar] [CrossRef]
  14. Rashid, F.M.; Banerjee, A. Simulation of Fracture in a Low Ductility Aluminum Alloy Using a Triaxiality Dependent Cohesive Model. Eng. Fract. Mech. 2017, 179, 1–12. [Google Scholar] [CrossRef]
  15. Oh, C.-S.; Kim, N.-H.; Kim, Y.-J.; Baek, J.-H.; Kim, Y.-P.; Kim, W.-S. A Finite Element Ductile Failure Simulation Method Using Stress-Modified Fracture Strain Model. Eng. Fract. Mech. 2011, 78, 124–137. [Google Scholar] [CrossRef]
  16. Ameli, I.; Asgarian, B.; Lin, M.; Agbo, S.; Cheng, R.; Duan, D.M.; Adeeb, S. Estimation of the CTOD-Crack Growth Curves in SENT Specimens Using the EXtended Finite Element Method. Int. J. Press. Vessel. Pip. 2019, 169, 16–25. [Google Scholar] [CrossRef]
  17. Liu, X.; Zhang, H.; Han, Y.; Xia, M.; Ji, Y. Numerical and Experimental Study on Critical Crack Tip Opening Displacement of X80 Pipeline Steel. Mechanika 2017, 23, 204–208. [Google Scholar] [CrossRef] [Green Version]
  18. Okodi, A.; Li, Y.; Cheng, R.; Kainat, M.; Yoosef-Ghodsi, N.; Adeeb, S. Crack Propagation and Burst Pressure of Pipeline with Restrained and Unrestrained Concentric Dent-Crack Defects Using Extended Finite Element Method. Appl. Sci. 2020, 10, 7554. [Google Scholar] [CrossRef]
  19. Okodi, A.; Lin, M.; Yoosef-Ghodsi, N.; Kainat, M.; Hassanien, S.; Adeeb, S. Crack Propagation and Burst Pressure of Longitudinally Cracked Pipelines Using Extended Finite Element Method. Int. J. Press. Vessel. Pip. 2020, 184, 104115. [Google Scholar] [CrossRef]
  20. Agbo, S.; Imanpour, A.; Li, Y.; Kainat, M.; Yoosef-Ghodsi, N.; Cheng, J.J.R.; Adeeb, S. Development of a Tensile Strain Capacity Predictive Model for American Petroleum Institute 5L X42 Welded Vintage Pipelines. J. Press. Vessel Technol. 2020, 142. [Google Scholar] [CrossRef]
  21. Abdulhameed, D.; Cakiroglu, C.; Lin, M.; Cheng, R.; Nychka, J.; Sen, M.; Adeeb, S. The Effect of Internal Pressure on the Tensile Strain Capacity of X52 Pipelines With Circumferential Flaws. J. Press. Vessel Technol. 2016, 138, 61701. [Google Scholar] [CrossRef]
  22. Dassault Systemes. Abaqus 6.17 Documentation; Dassault Systemes: Vélizy-Villacoublay, France, 2017. [Google Scholar]
  23. Lin, M. Characterization of Tensile and Fracture Properties of X52 Steel Pipes and Their Girth Weld. Master’s Thesis, University of Alberta, Edmonton, AB, Canada, 2015. [Google Scholar]
Figure 1. Assembled components of pipeline XFEM model showing the geometry and reference points.
Applmech 02 00013 g001
Figure 2. Mesh pattern of the XFEM model of pipeline and location of the circumferential crack.
Applmech 02 00013 g002
Figure 3. Average true stress–plastic strain curve of the X52 pipe material.
Applmech 02 00013 g003
Figure 4. Comparison of tensile strains measured along the pipe length at failure obtained from models and tests 1–4 (ad), respectively.
Applmech 02 00013 g004
Figure 5. Comparison of tensile strains measured along the pipe length at failure obtained from models and tests 5–8 (ad), respectively.
Applmech 02 00013 g005
Figure 6. Comparison of TSCs obtained from XFEM models and experiments 1–4 (a), and 5–8 (b).
Applmech 02 00013 g006
Figure 7. Comparison of (a) tensile strains measured along the pipe length at failure, (b) rotation–force curves, and (c) force–CMOD curves obtained from models and tests 5 and 6 (Maxpe = 0.2 and Gc = 900 N/mm).
Applmech 02 00013 g007aApplmech 02 00013 g007b
Figure 8. Comparison of force–CMOD curves obtained from models and tests 1–4 (a–d), respectively.
Applmech 02 00013 g008
Figure 9. Comparison of force–CMOD curves obtained from models and tests 5–8 (ad), respectively.
Applmech 02 00013 g009aApplmech 02 00013 g009b
Figure 10. The CMODfailure for model 4.
Applmech 02 00013 g010
Figure 11. Comparison of rotation–force curves obtained from models and tests 1–4 (a–d), respectively.
Applmech 02 00013 g011
Figure 12. Comparison of rotation–force curves obtained from models and tests 5–8 (ad), respectively.
Applmech 02 00013 g012
Figure 13. Geometry of fracture location at failure in the longitudinal direction from (a) model 1 and (b) test 1 [21].
Applmech 02 00013 g013
Table 1. Basic information of tests and models.
Test
/Model
Pipe Specimen
Dimensions
Crack
Dimensions
Internal
Pressure Level
Outer
Diameter
(mm)
Pipe
Length
(mm)
Wall
Thickness
(mm)
Crack
Depth
(mm)
Crack
Length
(mm)
Internal
Pressure
(MPa)
Hoop
Stress/SMYS
(%)
Test 13241828.86.951.75011.6575
Model 13241828.86.81.75011.6577
Test 23241828.86.81.5503.5023
Model 23241828.86.81.5503.5023
Test 33241828.86.83.15011.6777
Model 33241828.86.83.15011.6577
Test 43241828.86.83.3504.7031
Model 43241828.86.83.3504.6531
Test 53241219.26.81.415011.6577
Model 53241219.26.81.415011.6577
Test 63241219.26.81.81504.6031
Model 63241219.26.81.81504.6531
Test 73241219.26.83.515011.6577
Model 73241219.26.83.315011.6577
Test 83241219.26.82.71504.6531
Model 83241219.26.82.71504.6531
Table 2. Material properties of the X52 pipe [23].
Young’s Modulus (GPa)Poisson’s Ratio0.2% Offset Yield Strength (MPa)Ultimate True Plastic Strain
1990.34110.147
Table 3. Tensile strain capacities (TSCs) of XFEM models and full-scale tests.
Model/TestTest TSC (%)XFEM TSC
Maxpe = 0.085
Gc = 900N/mm
(%)
Difference (%)Ratio (Test/Model)XFEM TSC
Maxpe = 0.11
Gc = 900N/mm (%)
Difference (%)Ratio (Test/Model)
14.1872.73034.7981.5343.068026.7261.365
211.256.31043.9111.7837.075037.1001.590
30.5370.47611.3591.1280.600−11.7320.895
40.5460.37231.8681.4680.41523.9921.316
51.8290.47873.8653.8260.62865.6602.912
60.7260.37348.6221.9460.43240.4951.681
70.2170.14632.7191.4860.15130.4141.437
80.3120.16547.1151.8900.17045.5101.835
Mean (Ratios)---1.883- 1.629
COV (%)---44.038- 36.228
Table 4. Comparison between XFEM results and tests at failure.
Model/TestMax Load
(kN)
Rotation at Endplate (Degrees)CMODfailure
(mm)
CMODcritical
(mm)
Reduction in
Pipe Wall
Thickness (%)
Test 122995.0802.1101.19032.400
Model 123605.1351.9101.50816.050
Difference (%)2.6611.093−9.45526.723−50.462
Ratio0.9740.9891.1050.7892.019
Test 231006.8202.1601.09027.900
Model 231125.6342.0601.36714.253
Difference (%)0.415−17.391−4.61125.413−48.914
Ratio0.9961.2111.0490.7971.957
Test 316230.9802.3701.18019.100
Model 317730.8471.6311.30410.032
Difference (%)9.259−13.578−31.16910.508−47.476
Ratio0.91531.1571.4530.9051.904
Test 420611.0402.0501.16020.600
Model 419960.6631.3730.9438.107
Difference (%)−3.145−36.242−33.035−18.707−60.64
Ratio1.0321.5691.4931.2302.541
Test 519341.8601.5200.77026.500
Model 517550.6211.6930.76116.850
Difference (%)−9.218−66.58811.395−1.169−36.415
Ratio1.1022.9950.8981.01191.572
Test 622611.4001.5600.90027.900
Model 619900.5061.7450.87815.325
Difference (%)−11.981−63.82011.829−2.444−45.072
Ratio1.1362.7670.8941.0251.821
Test 713040.2601.3000.90019.100
Model 712750.2041.2730.9988.295
Difference (%)−2.254−21.664−2.06110.888−56.571
Ratio1.0231.2751.0210.9022.303
Test 818310.4201.2700.85020.600
Model 815560.2211.1520.8987.295
Difference (%)−15.018−47.314−9.2745.647−63.146
Ratio1.1771.9001.1020.9472.824
Mean (Ratios)1.0441.7331.1270.9512.118
COV (%)8.39044.08620.28114.95019.377
Publisher’s Note: MDPI stays neutral with regard to jurisdictional claims in published maps and institutional affiliations.

