Buckling Strength Assessment of Composite Patch Repair Used for the Rehabilitation of Corroded Marine Plates


Shipbuilding Technology Laboratory, School of Naval Architecture and Marine Engineering, National Technical University of Athens, Zografos, 15780 Athens, Greece
*
Author to whom correspondence should be addressed.
Appl. Mech. 2021, 2(3), 482-500; https://0-doi-org.brum.beds.ac.uk/10.3390/applmech2030027
Submission received: 1 July 2021
/
Revised: 16 July 2021
/
Accepted: 17 July 2021
/
Published: 20 July 2021
(This article belongs to the Collection Fracture, Fatigue, and Wear)
Abstract
:A common form of damage encountered in marine structures is the accumulation of corrosion in susceptible areas, which leads to material wastage. As a result, the structural strength of the members affected is compromised, endangering their safe operation in design loads. Consequently, structural instabilities may occur, such as buckling due to compressive or/and shear loads. An alternative repair practice for preventing such phenomena, approved for secondary load-carrying members, is the application of composite patches to the damaged area. In this preliminary study, this technique is examined in the scope of developing a framework that can be used to find the optimal solution for restoring the buckling strength of a corroded plate. The methods used to achieve this are based on finite element analysis (FEA) and design of experiments (DoE) to statistically analyze the aforementioned numerical calculations. By introducing the composite patch’s percentage coverage of its metal substrate and number of plies as design parameters, a response surface is generated with respect to the obtained factor of safety (regarding its reference uncorroded buckling strength). This list of data points is then evaluated, and an acceptable surface/list of design parameters’ combinations is generated.
1. Introduction
When designing a structure, adequate strength reserves against probable loads are provided, considering the operating environmental conditions. Regarding marine structures, offshore platforms and ships are designed to function predominantly in the sea for the majority of their intended life, which is a minimum of 25 years. In this timeline, multiple surveys are conducted to ensure smooth and safe operation, with a frequency usually dependent on the structure’s age (preventive maintenance). During these surveys, a common form of damage that the International Association of Classification Societies (IACS) has highlighted is material wastage caused by corrosion.
As noted by IACS [1], there are three types of corrosion: general (usually occurs uniformly on uncoated surfaces), grooving (primarily located in the heat-affected zone), and pitting (due to local coating breakdown). In order to protect against such defects from developing, coating, and other protective measures (e.g., sacrificial anodes) are employed. Some areas are known to be susceptible to this phenomenon due to:
- Water, scale, dirt, or oil remainings due to poor drainage or design flaw.
- High stresses applied to the subject area.
- Coating breakdown usually caused by poor maintenance and the ship’s age.
- Operation in a corrosive enabling environment, such as near high-temperature regions (e.g., heated fuel tanks).
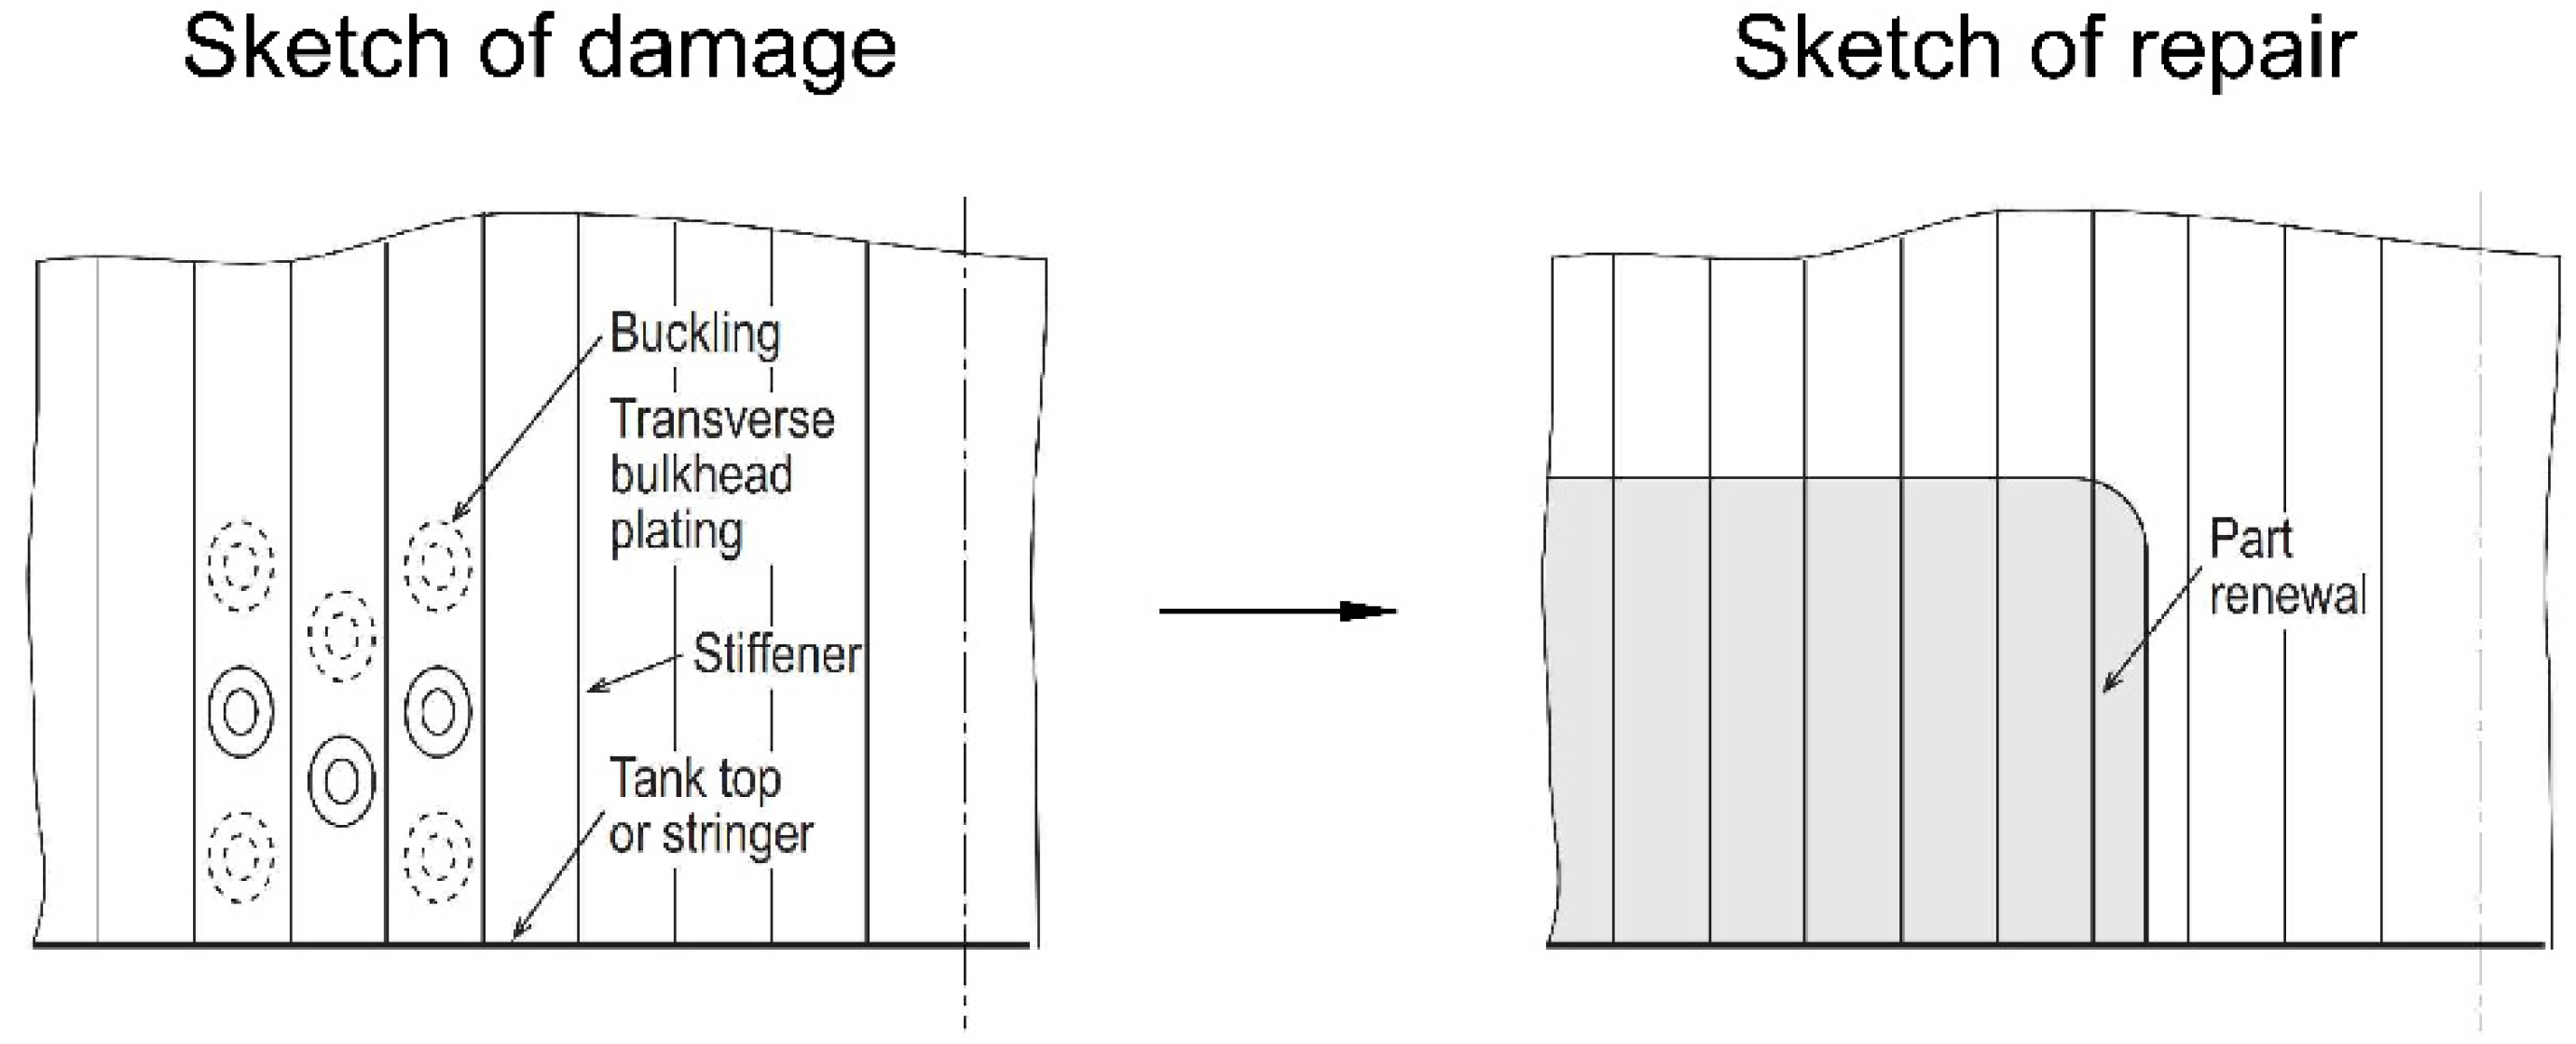
Material wastage is primarily identified in two ways: visually or from thickness measurements. The latter is performed in areas known to be susceptible to corrosion or to measure the defect’s magnitude. Examples of such suspect areas are the double bottom, the transverse bulkheads (Figure 1), the tank top, and spaces adjacent to the hot engine room (IACS [1]).
Corrosion leads to material thickness wastage, which can cause underperformance of the load-bearing capabilities of the structural element at hand. For instance, a transverse plating could succumb to shear buckling and a double bottom plating to compressive buckling. Other unwanted results that may occur are crack initiations or material yielding. In order to prevent such structural failures, IACS [1] has developed repair guidelines in which the above concerns are addressed. In case a plate is at buckling risk (or has slightly buckled), common practice is cropping and renewal (with equal or greater thickness than the original), adding an insert plate of increased thickness, or reinforcing the area with additional stiffeners. All these options are hot-working operations, which means that proper preparation of the affected area should be performed, e.g., scrubbing and degassing. This is extremely important in areas inside or adjacent to flammable environments (e.g., repairing a ballast tank’s plating neighboring with the cargo tank). In offshore platforms, in addition to the area’s preparation, its operation might need to pause during hot work.
Alternative repair techniques have been considered in order to address this problem. A method that has gained attraction over the years is the application of composites to repair or prevent defects that could arise from crack initiation/propagation or material wastage. These fiber-reinforced composites could form stiffeners (Anyfantis [2]) or patches (Karatzas [3]) in order to reinforce the affected area and prevent buckling due to shear or/and compressive loads. Additionally, a similar methodology can be applied to repair cracks in metallic laminates (Karatzas et al. [4]). This topic has also gained the interest of several Classification Societies, such as Bureau Veritas (BV [5]) and Det Norske Veritas (DNV [6]), that propose fiber-reinforced patches to rehabilitate the structural integrity of damaged metallic structures. The American Society of Mechanical Engineers (ASME [7]) has also issued standards for assessing composite patches to repair pipelines. Additionally, the topic of composite patches has also been examined by several EU projects such as Marstruct, Copatch and Ramsses. However, despite interest in the topic (Hashim et al. [8], Aabid et al. [9], Turan [10]), the method has yet to be approved by the International Maritime Organization (IMO) as a valid repair technique for primary supporting members, despite other industries, such as aeronautics, having assessed it as an acceptable practice. The delay in the marine industry is due to the method’s limited applications, lack of on-site service reports, and other factors concerning the composite’s rehabilitation properties—e.g., repair life, the criticality of the defect. Therefore, composite repairs are usually applicable in a case-by-case scenario approved by the Classification Societies for the repair of (usually) non-primary supporting members.
This preliminary study proposes a methodology for the short- or mid-term rehabilitation of corroded marine plates using composite patches to prevent premature buckling. Specifically, the goal is the restoration of the initial elastic compressive and shear buckling strength of a uniformly corroded plate. In order to achieve this, multiple parameters need to be considered based on design and structural criteria. Additionally, buckling calculations are performed with the assistance of computational and statistical mechanics arising from finite element analysis (FEA) and design of experiments (DoE). These tools allow for a preliminary assessment of the proposed methodology without the need for laboratory experiments or extensive computation work. The study’s main purpose is to set up a framework that can be used to choose the optimal design solution for the investigated defect.
2. Design Basis
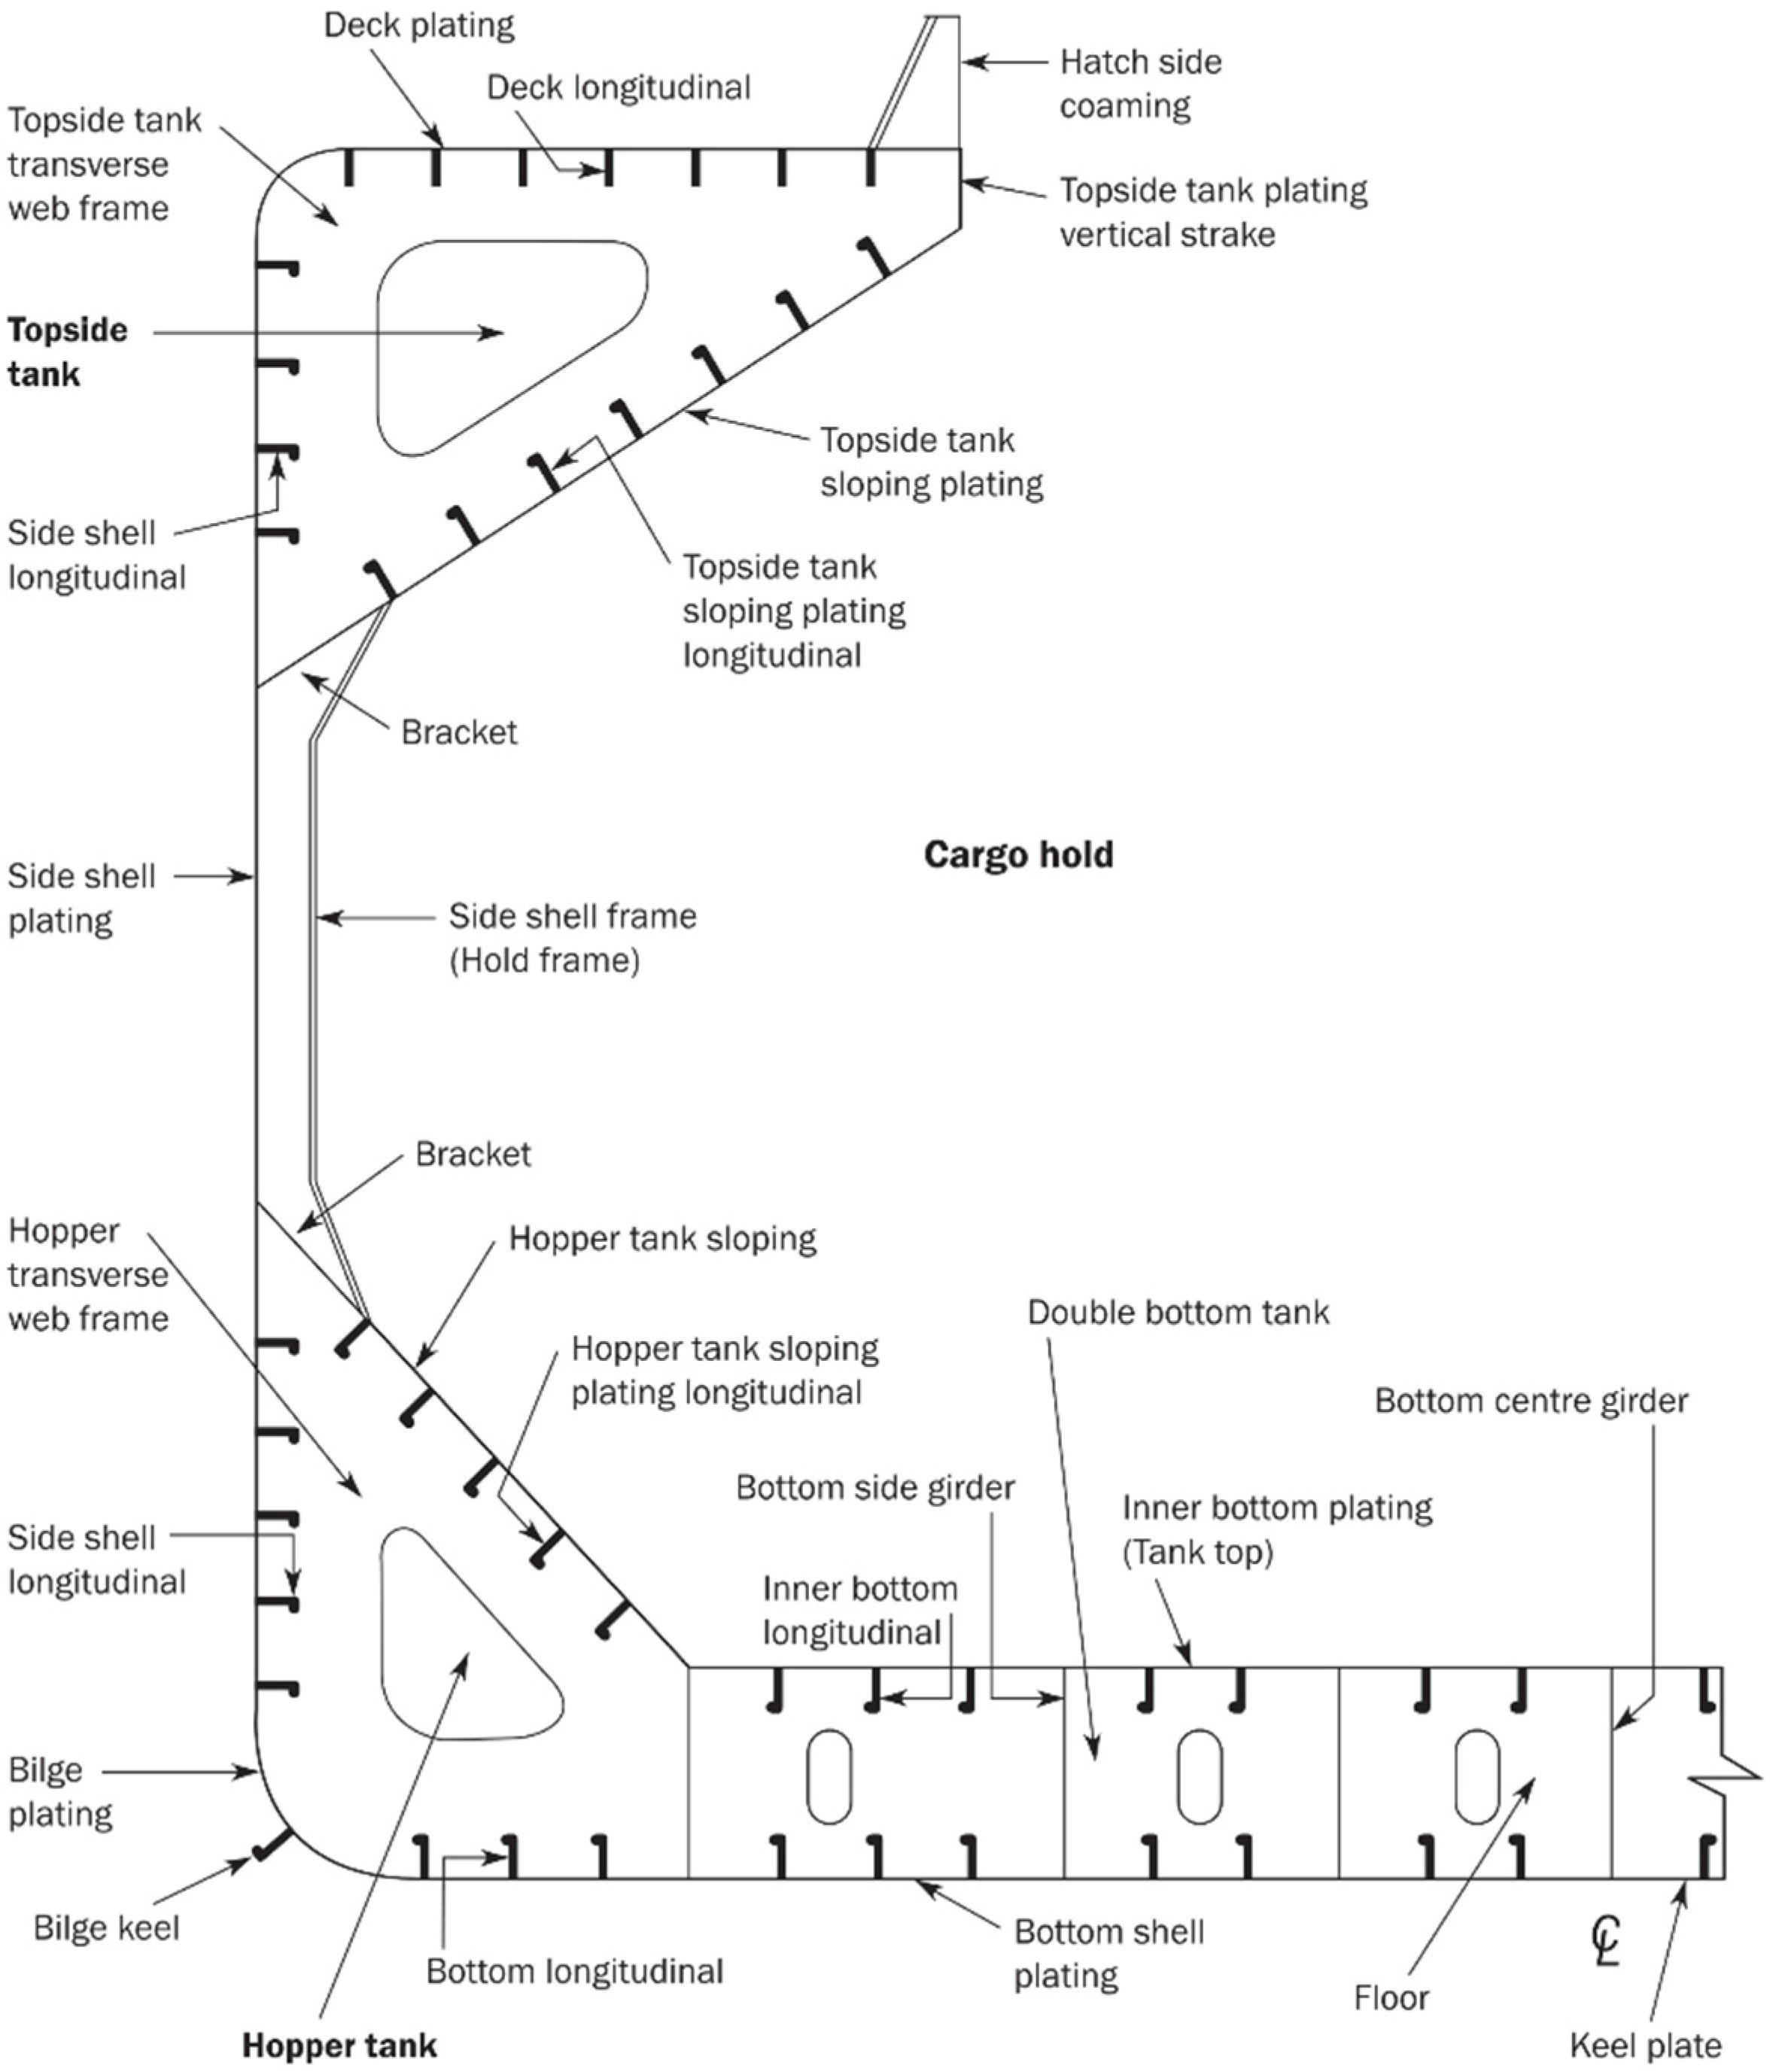
Marine structures are composed of large metal plates reinforced with stiffeners (most common are bulb profiles, L, T profiles, and flat bars). The material used for both plates and stiffeners is usually marine-grade structural steel and specifically mild steel type “A” or higher tensile steel type “AH32” (LR [11]). The applied loads are undertaken by the combined action of beams and plates (stiffened panels). Thus, each rectangular plate between stiffeners can be assumed as isolated and simply supported (worst case scenario), while its boundary beams transfer active loads to it. A schematic of a bulk carrier’s cargo hold compartmentation and some supporting members is shown in Figure 2.
As aforementioned, if a plate is corroded, then its effective thickness is reduced. By subtracting material from it, its load-bearing capabilities are lessened due to a weaker cross-section. The structural member’s cross-section can be stiffened by adding a fiber-reinforced composite patch, which rehabilitates for the material wastage. However, there are a plethora of configurations for the patch that can be applied due to multiple design parameters. The important ones are the fiber’s material, the matrix’s material, the laminate’s stacking sequence, the number of plies used, the patch’s basic dimensions, the repair’s configuration (one or two-sided), and the shape. Finally, several other factors affect the final product: humidity, temperature, curing conditions, the adhesive used, and the application method (hand lay-up, pre-preg, or vacuum infusion), the effect of which is out-of-scope.
Some assumptions are made in order to scale down the multi-parametrical nature of the problem. Let the environmental conditions be optimal for the application and curing of the composite patch. This might not be achievable on ship, but satisfactory conditions can be obtained through proper preparations of the working space. Additionally, perfect bonding is assumed for the adhesion of the composite patch with the metal substrate. This can be enforced without significant deviation from the study’s main goal, which is to develop guidelines for the repair method proposed.
The patch’s properties are also essential since its structural properties are based on its configuration. The proposed patch is a plain weave (cross-ply) fiber-reinforced polymer with a stacking sequence of [0/90]n. Since the fibers’ orientation within the matrix is in two perpendicular directions (bi-directional), the composite can be characterized as orthotropic (Kollar [12]). The patches usually used in the industry are carbon fiber reinforced polymers (CFRP), and glass fiber reinforced polymers (GFRP), whose mechanical properties are listed in Table 1.
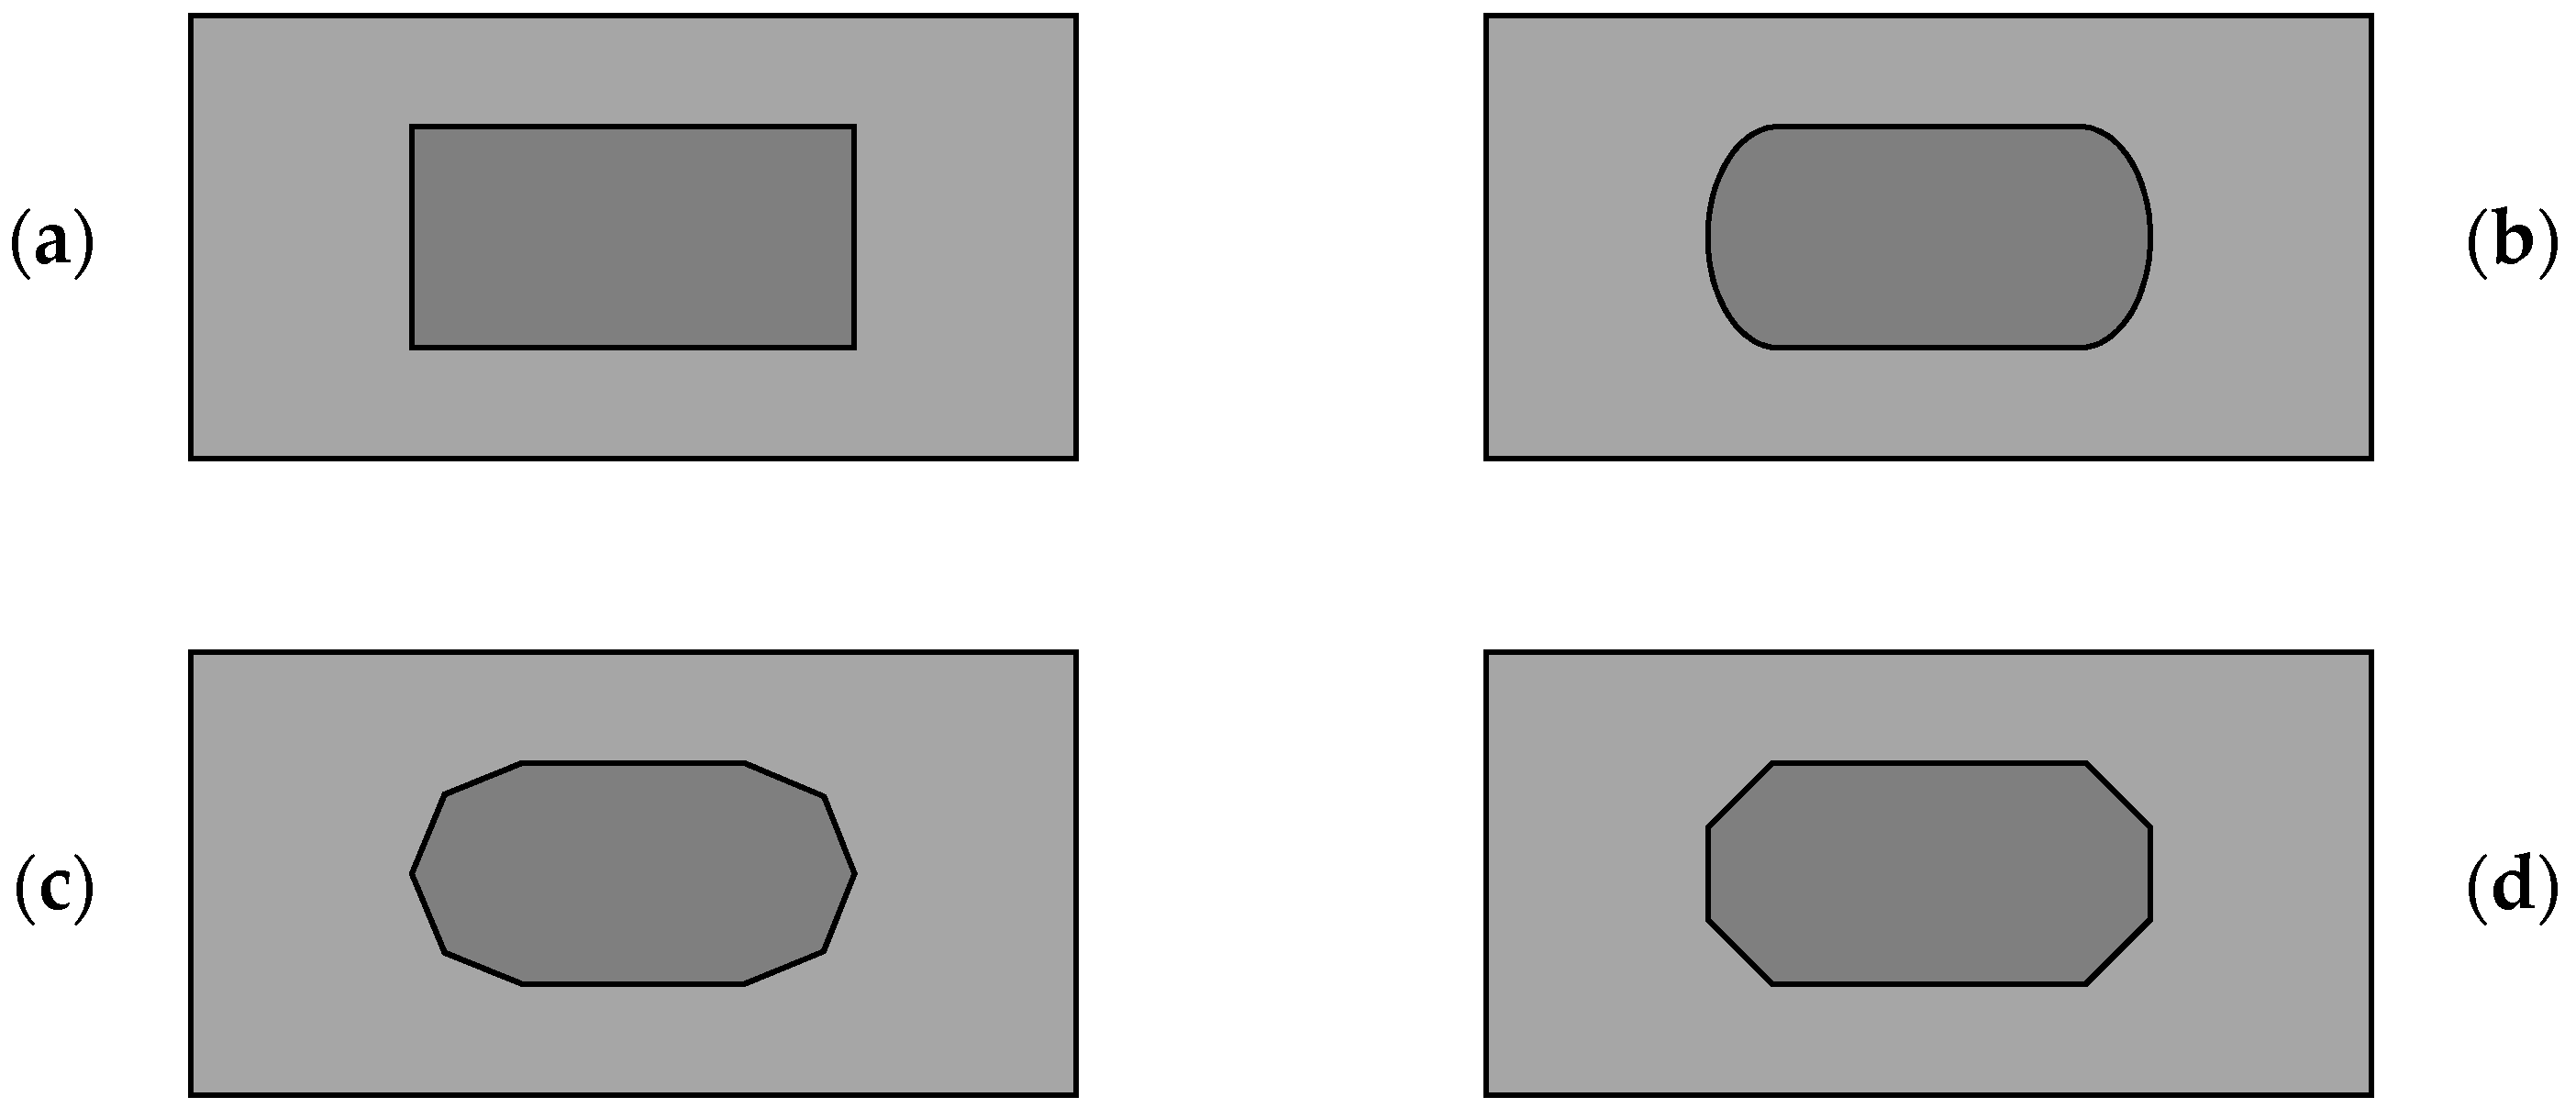
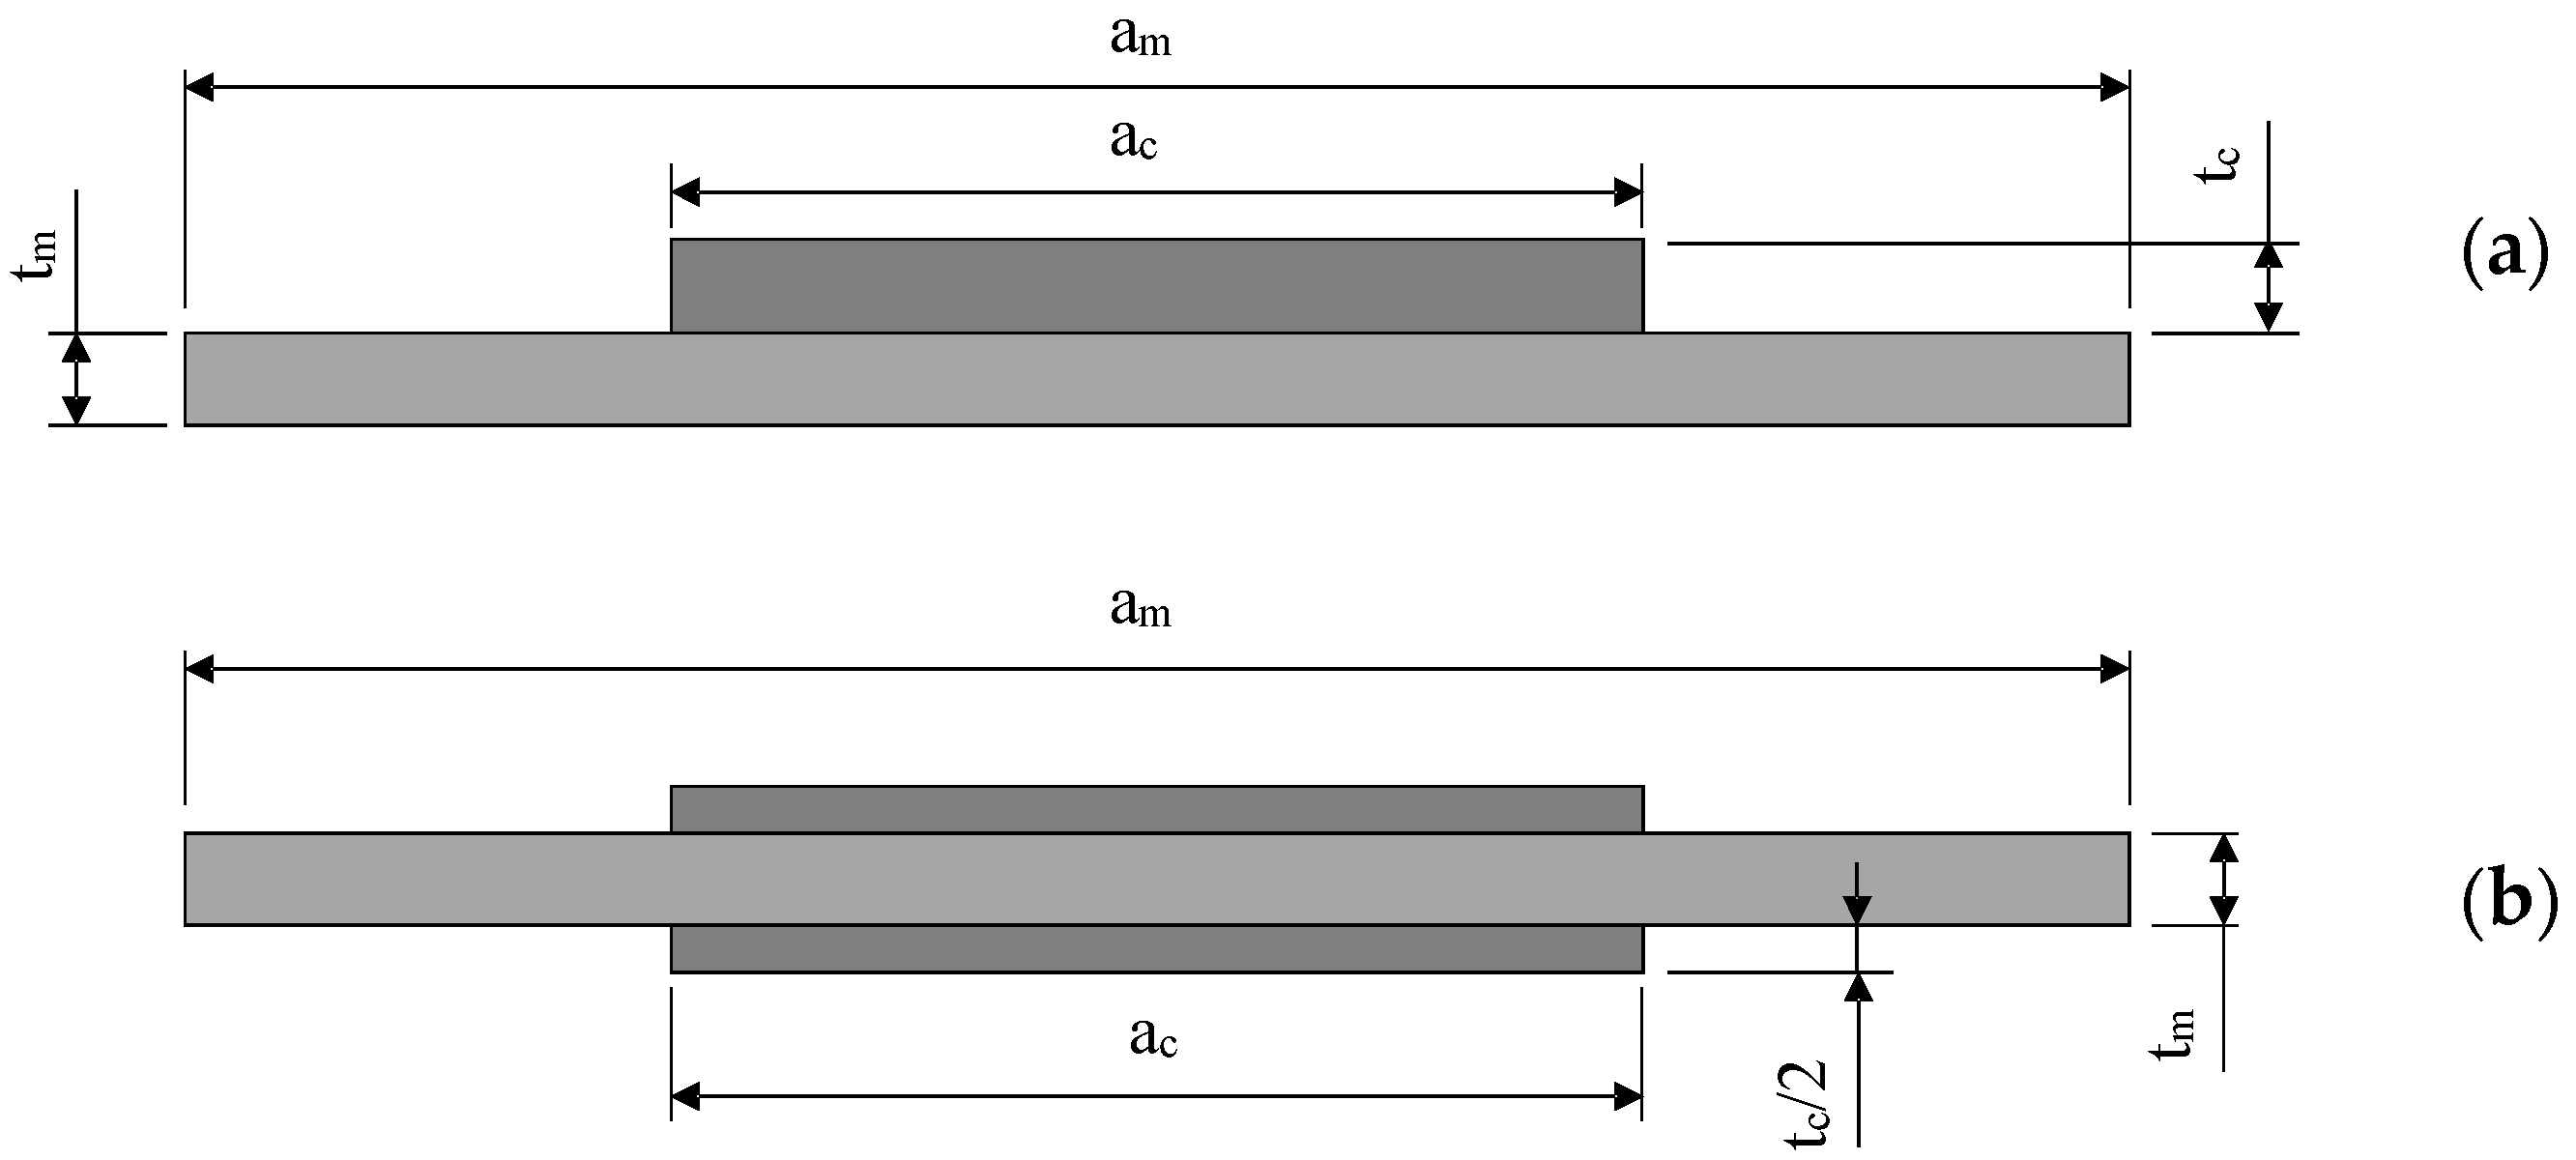
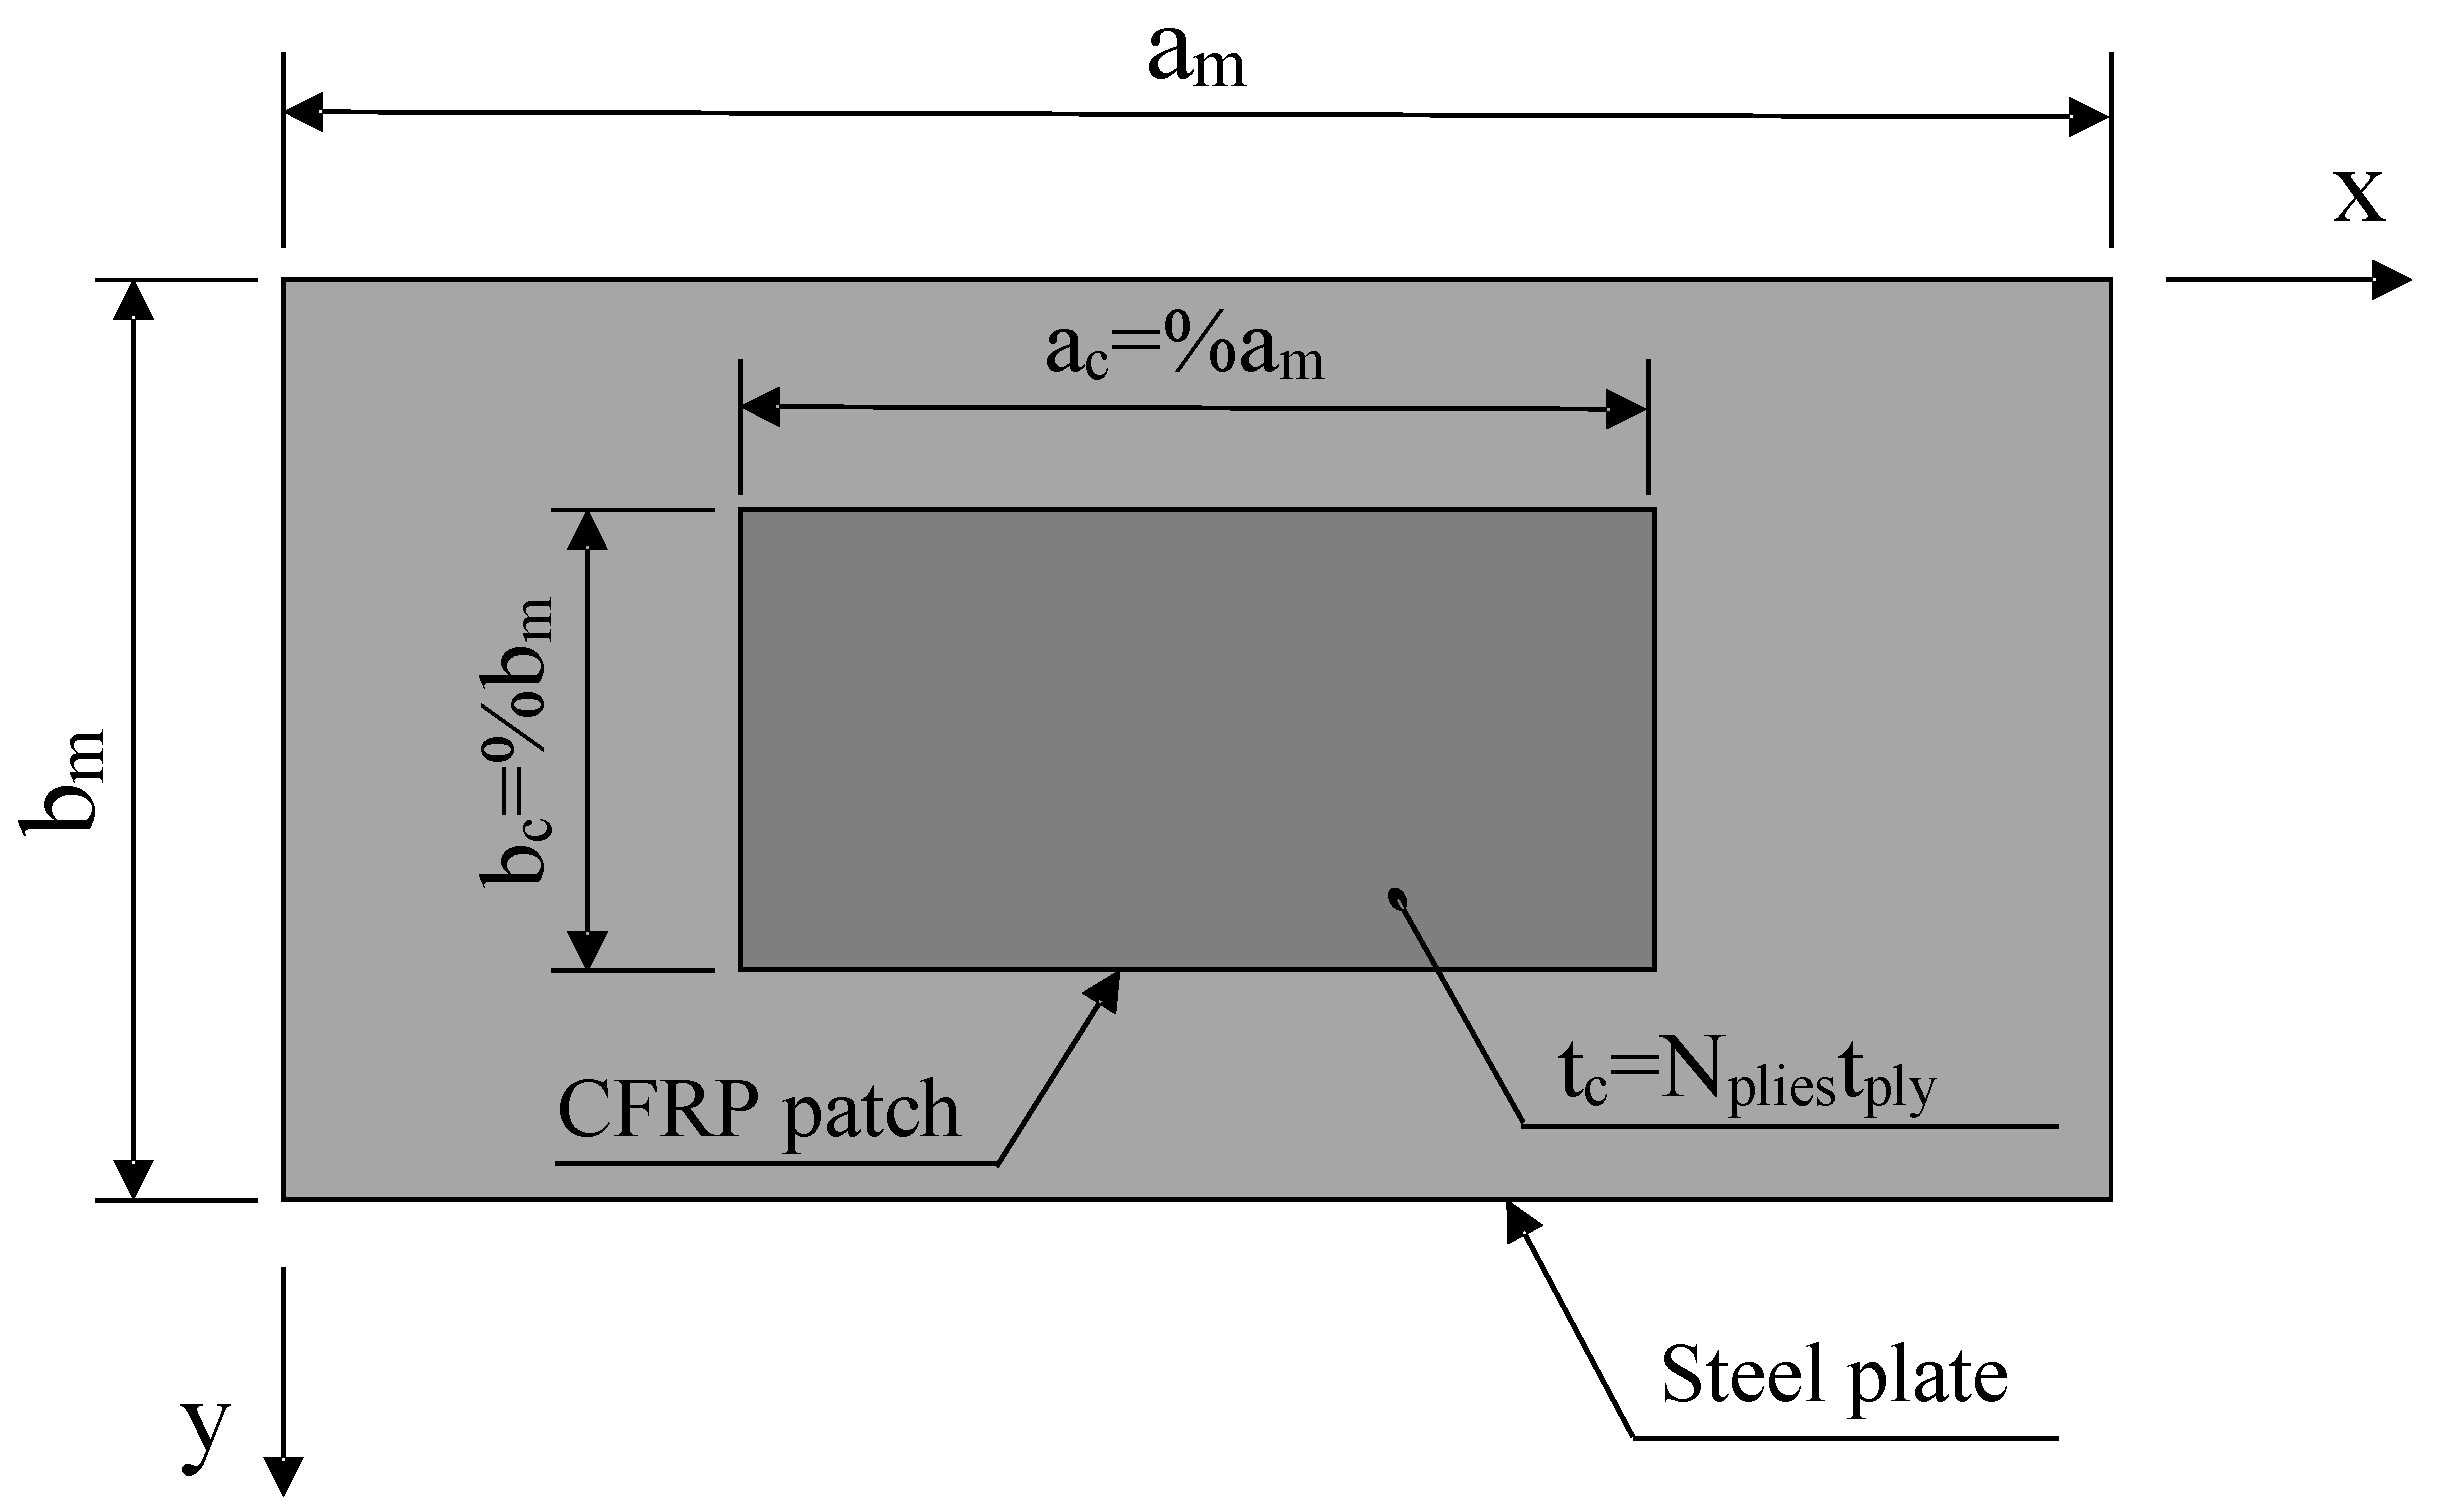
Finally, the repair’s configuration is important as well. Specifically, the patch’s main dimensions (length, width, thickness) are the most influential to the rehabilitation’s effect since the more material is added, the higher the obtained stiffness. The length and width cannot surpass those of the metal substrate’s. Its thickness is dependent on the number of plies since it is a product of each ply’s thickness and the number of plies used. Additionally, the patch’s shape can also have many forms, such as rectangular, ellipsoid, and octagonal (Figure 3), some of which might be more difficult to manufacture than others. The shape’s effects are more important for the adhesion problem and the local stresses developed at its boundaries. However, its effect on buckling restoration is examined in this study. Finally, the patch can be applied to one side of the metal plate or on both of its sides (Figure 4). This particular application is dependent on surrounding equipment, and the feasibility of application on both sides since access to an area might not be possible. It should be noted that in the case of the one-sided patch, a secondary bending moment arises, which should also be taken into account when designing the solution as it asymmetrically loads the structure.
3. Optimal Design Method
3.1. Design of the Repair
As mentioned in the introduction, during a marine structure’s lifetime, several surveys are conducted within the framework of preventive maintenance. During these surveys, its members’ structural condition is inspected to verify their safe operation until the next planned survey or to notify that repair action is needed otherwise. Depending on a case-by-case basis, a repair might be performed while traveling, harboring, or during dry-dock. Usually, smaller-scale operations in an enclosed and accessible space can be conducted while in sea (e.g., tank top, ballast tank), while larger intrusive installations necessitate the need for the ship to be on land (e.g., large composite patch on the upper deck, transverse bulkhead).
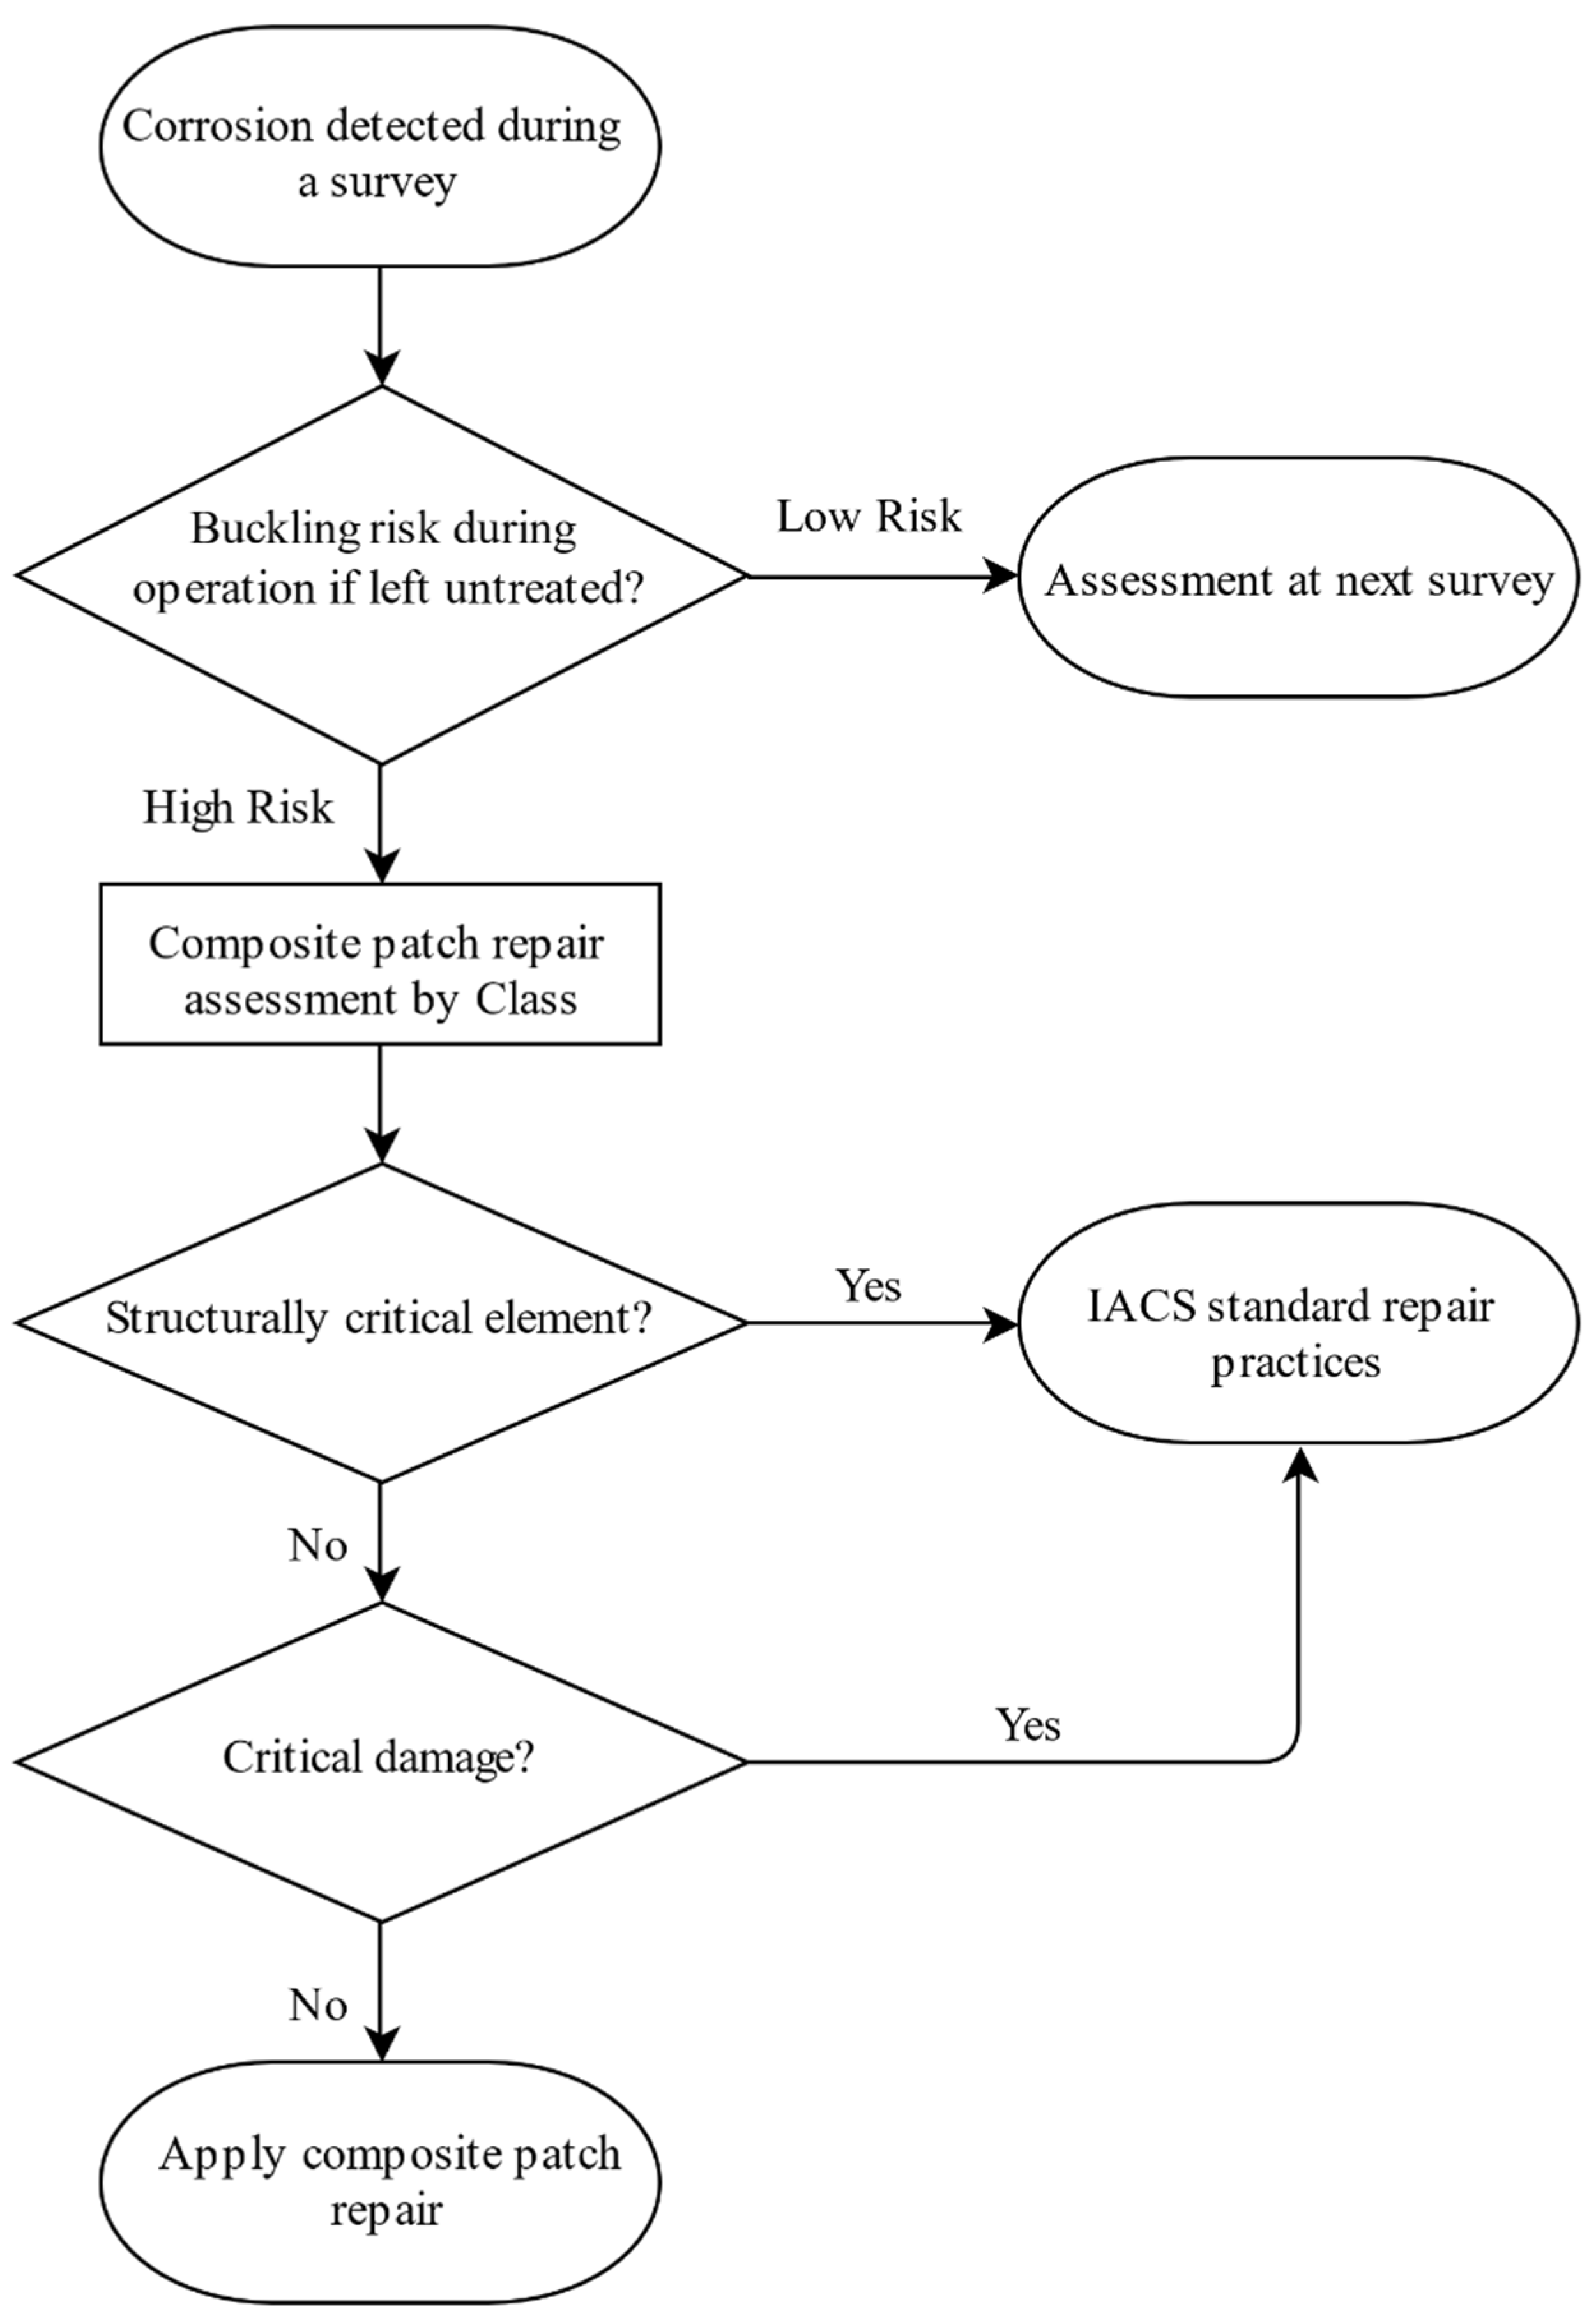
Assume that corrosion is detected during a plate’s inspection and the thickness measurements indicate that the magnitude of material lost sets the structural member at buckling risk if left untreated. Based on recommended practices currently applied in the shipbuilding industry (DNV [6]), if the member is structurally critical, traditional repair methods are used. Additionally, the same repair methods are applied if the defect’s scale is large, and a composite patch would not provide adequate strength. However, if these previous statements do not apply, a composite patch repair could be installed. The decision-making points from the defect detection to the repair method’s application are illustrated in the flowchart in Figure 5.
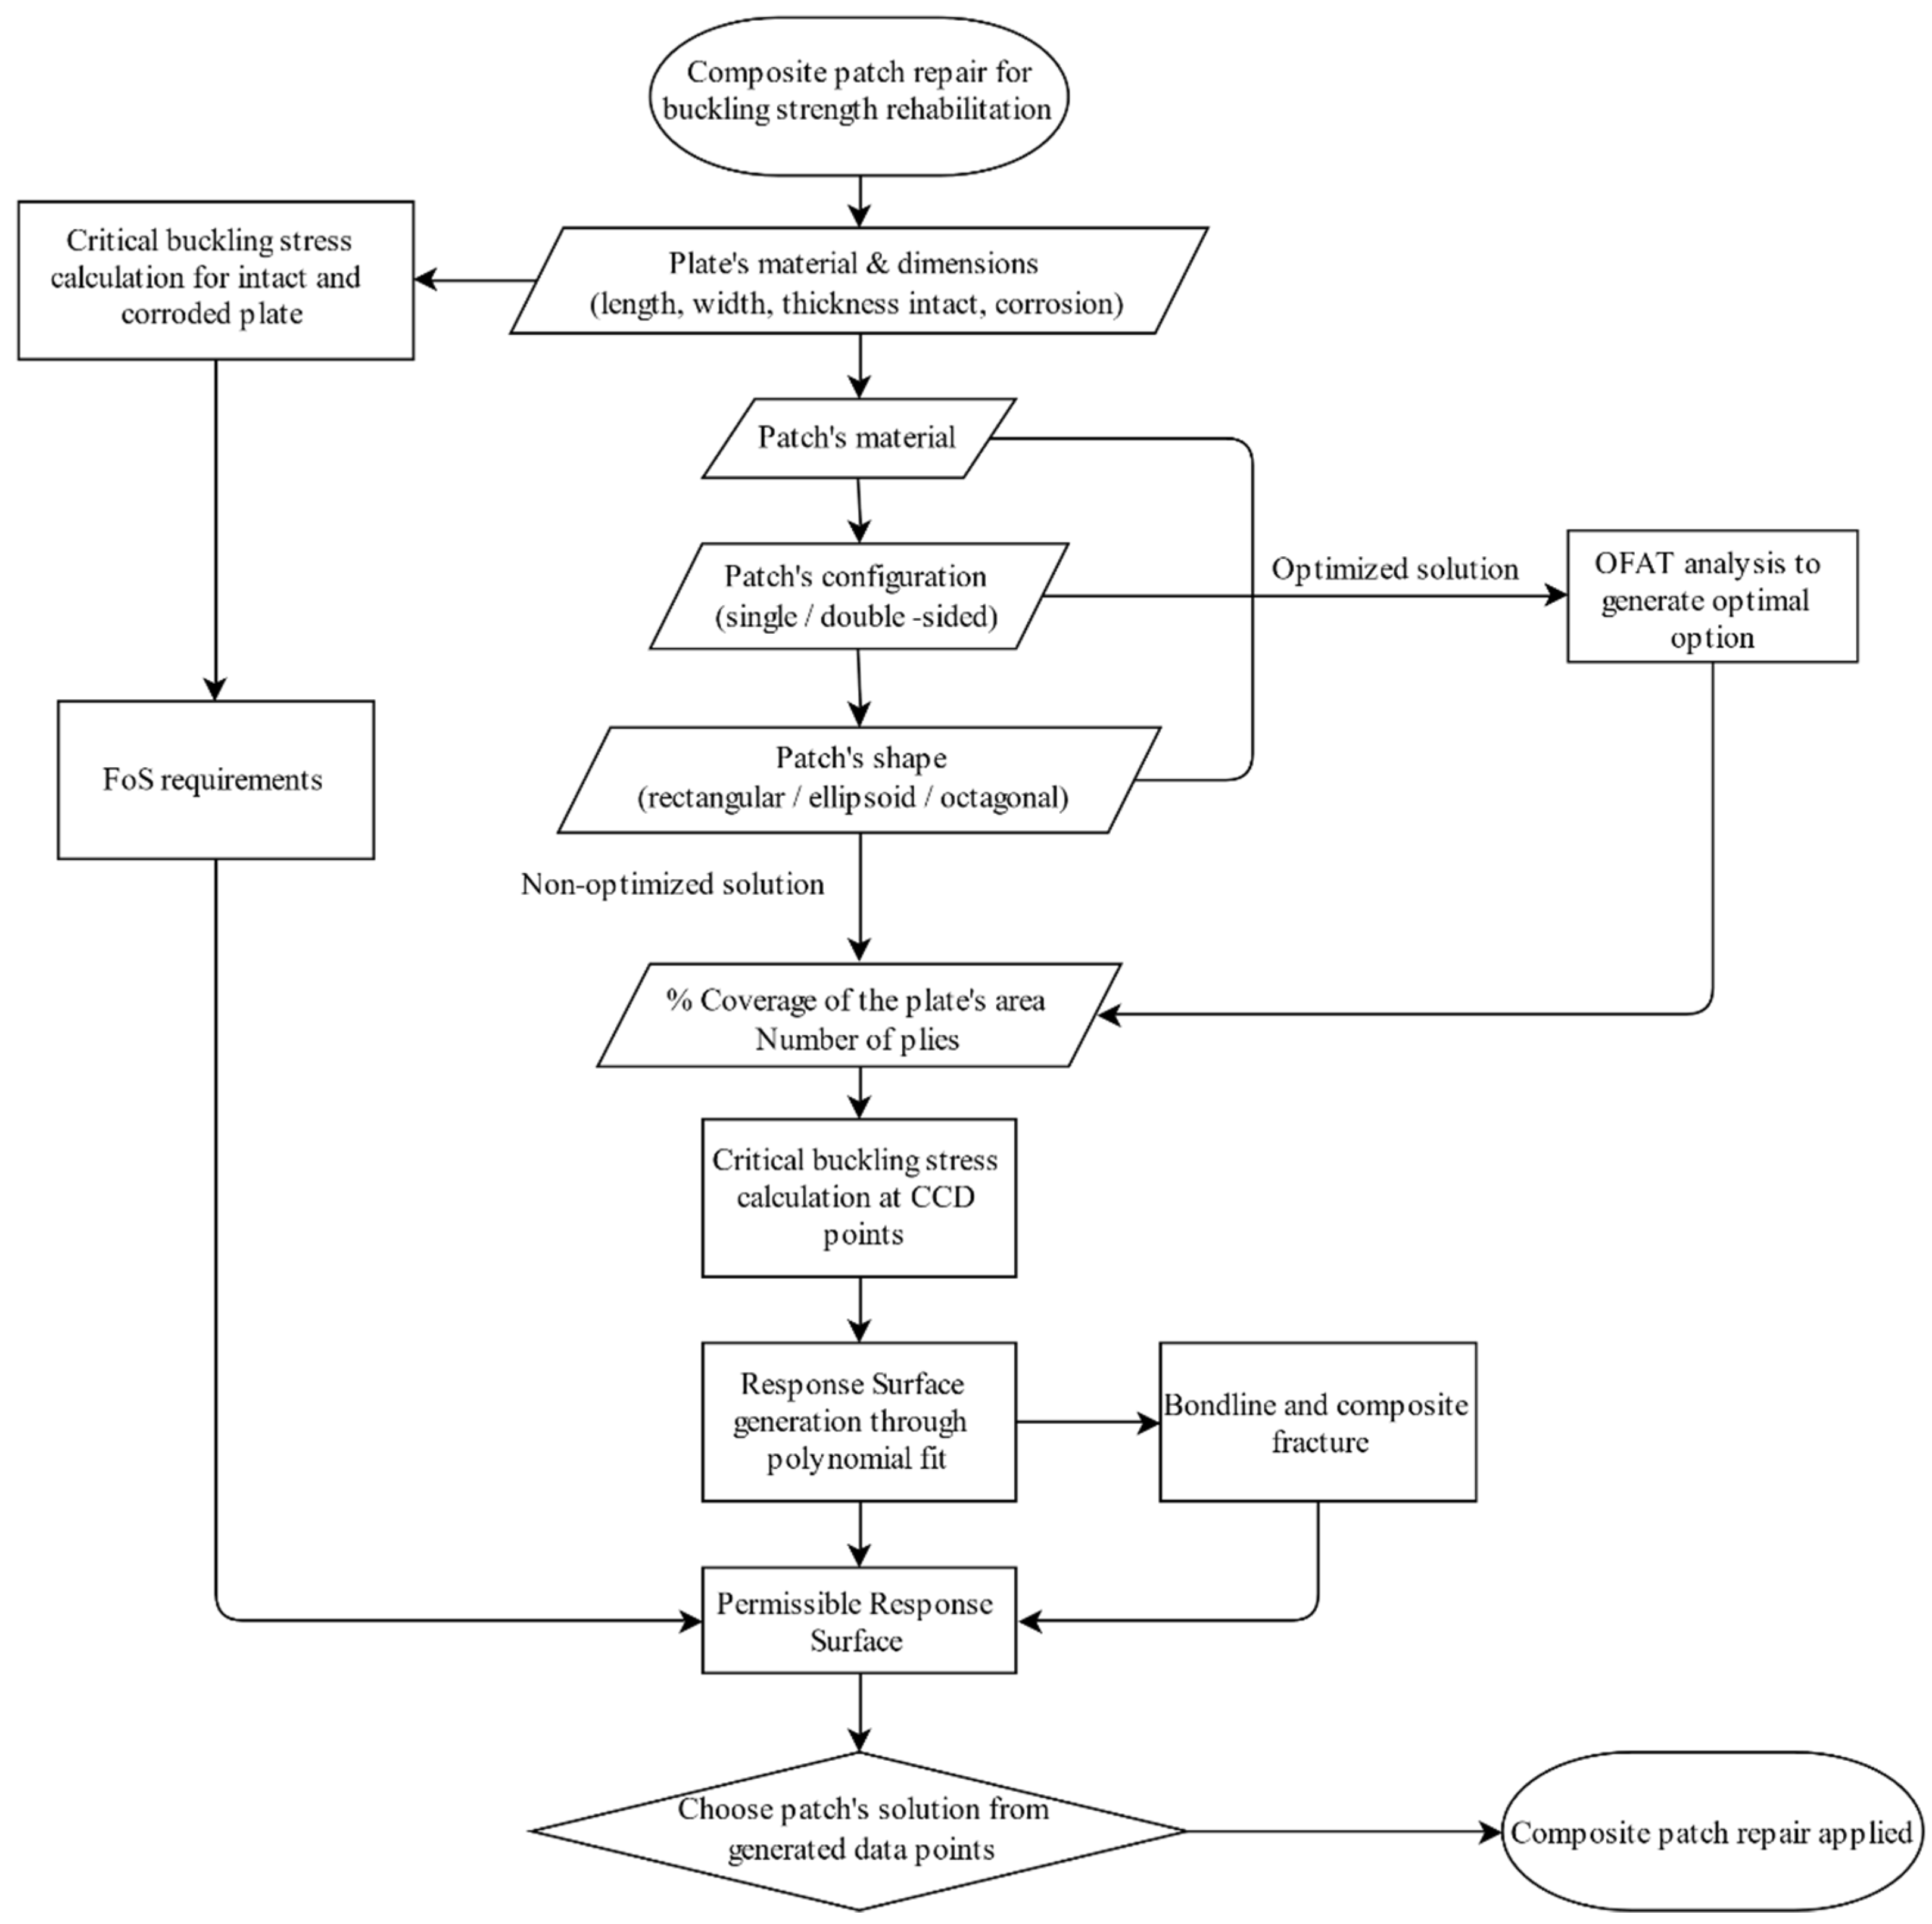
In case the composite repair technique is possible, the patch’s material, configuration (one or double-sided), and shape shall be decided. If there is no preference, then the optimal options can be determined through one-factor-at-a-time (OFAT) analyses. Through these analyses, a design parameter is examined, while all other factors remain fixed. This analysis methodology is followed due to the discrete nature of these parameters—e.g., the patch’s material and configuration is a binary decision—while the shape has four choices as shown later in the study. After setting these parameters, the patch’s main dimensions must be assigned (design parameters). In order to minimize the problem’s complexity, the patch is assumed to have an aspect ratio αc equal to that of the metal substrate αm. Thus, the composite’s length ac and width bc are a product of the plate’s respective values (am and bm) and its aspect ratio, i.e., ac/bc = αc = αm = am/bm. Hence, let these two parameters be replaced by a percentage coverage of the substrate (denoted by c). As a result the following expressions are obtained: c = ac/am = bc/bm.
The final parameter is the patch’s thickness, which can also be replaced by its driving magnitude, i.e., the number of plies (Nplies). Having set the coverage’s and plies’ allowable value range, a DoE statistical analysis is conducted with an additional parameter, the attainable factor of safety (FoS). This last value is calculated using elastic buckling analyses on the data points set by DoE in order to construct a response surface through a response surface methodology (RSM). The final product is a fitted surface (points) that indicates the FoS obtained for various combinations of the patch’s coverage and the number of plies.
For specified values of FoS, respective to the initial buckling strength, the generated surface indicates the allowable combinations of the patch’s design parameters. In order to further validate the method, a fracture check on the patch and the bondline is also conducted. This might result in a possible restriction of the permissible solutions provided by the response surface. This design methodology is visualized in the flowchart shown in Figure 6.
3.2. Theoretical Background
Marine stiffened panels are subjected to external loads applied to their middle plane, such as compressive and shear forces. In its initial state, a panel of length am, width bm, and thickness tm, is in a flatform equilibrium. However, by gradually increasing the applied load, the middle plane becomes unstable and starts to buckle. Moreover, as mentioned in the second section, due to the stiffening system, a plate between stiffeners can be assumed to be simply supported across its edges. By using the energy method, as proposed by Timoshenko [13], the critical elastic buckling stress due to uniform uniaxial compression is calculated as
where
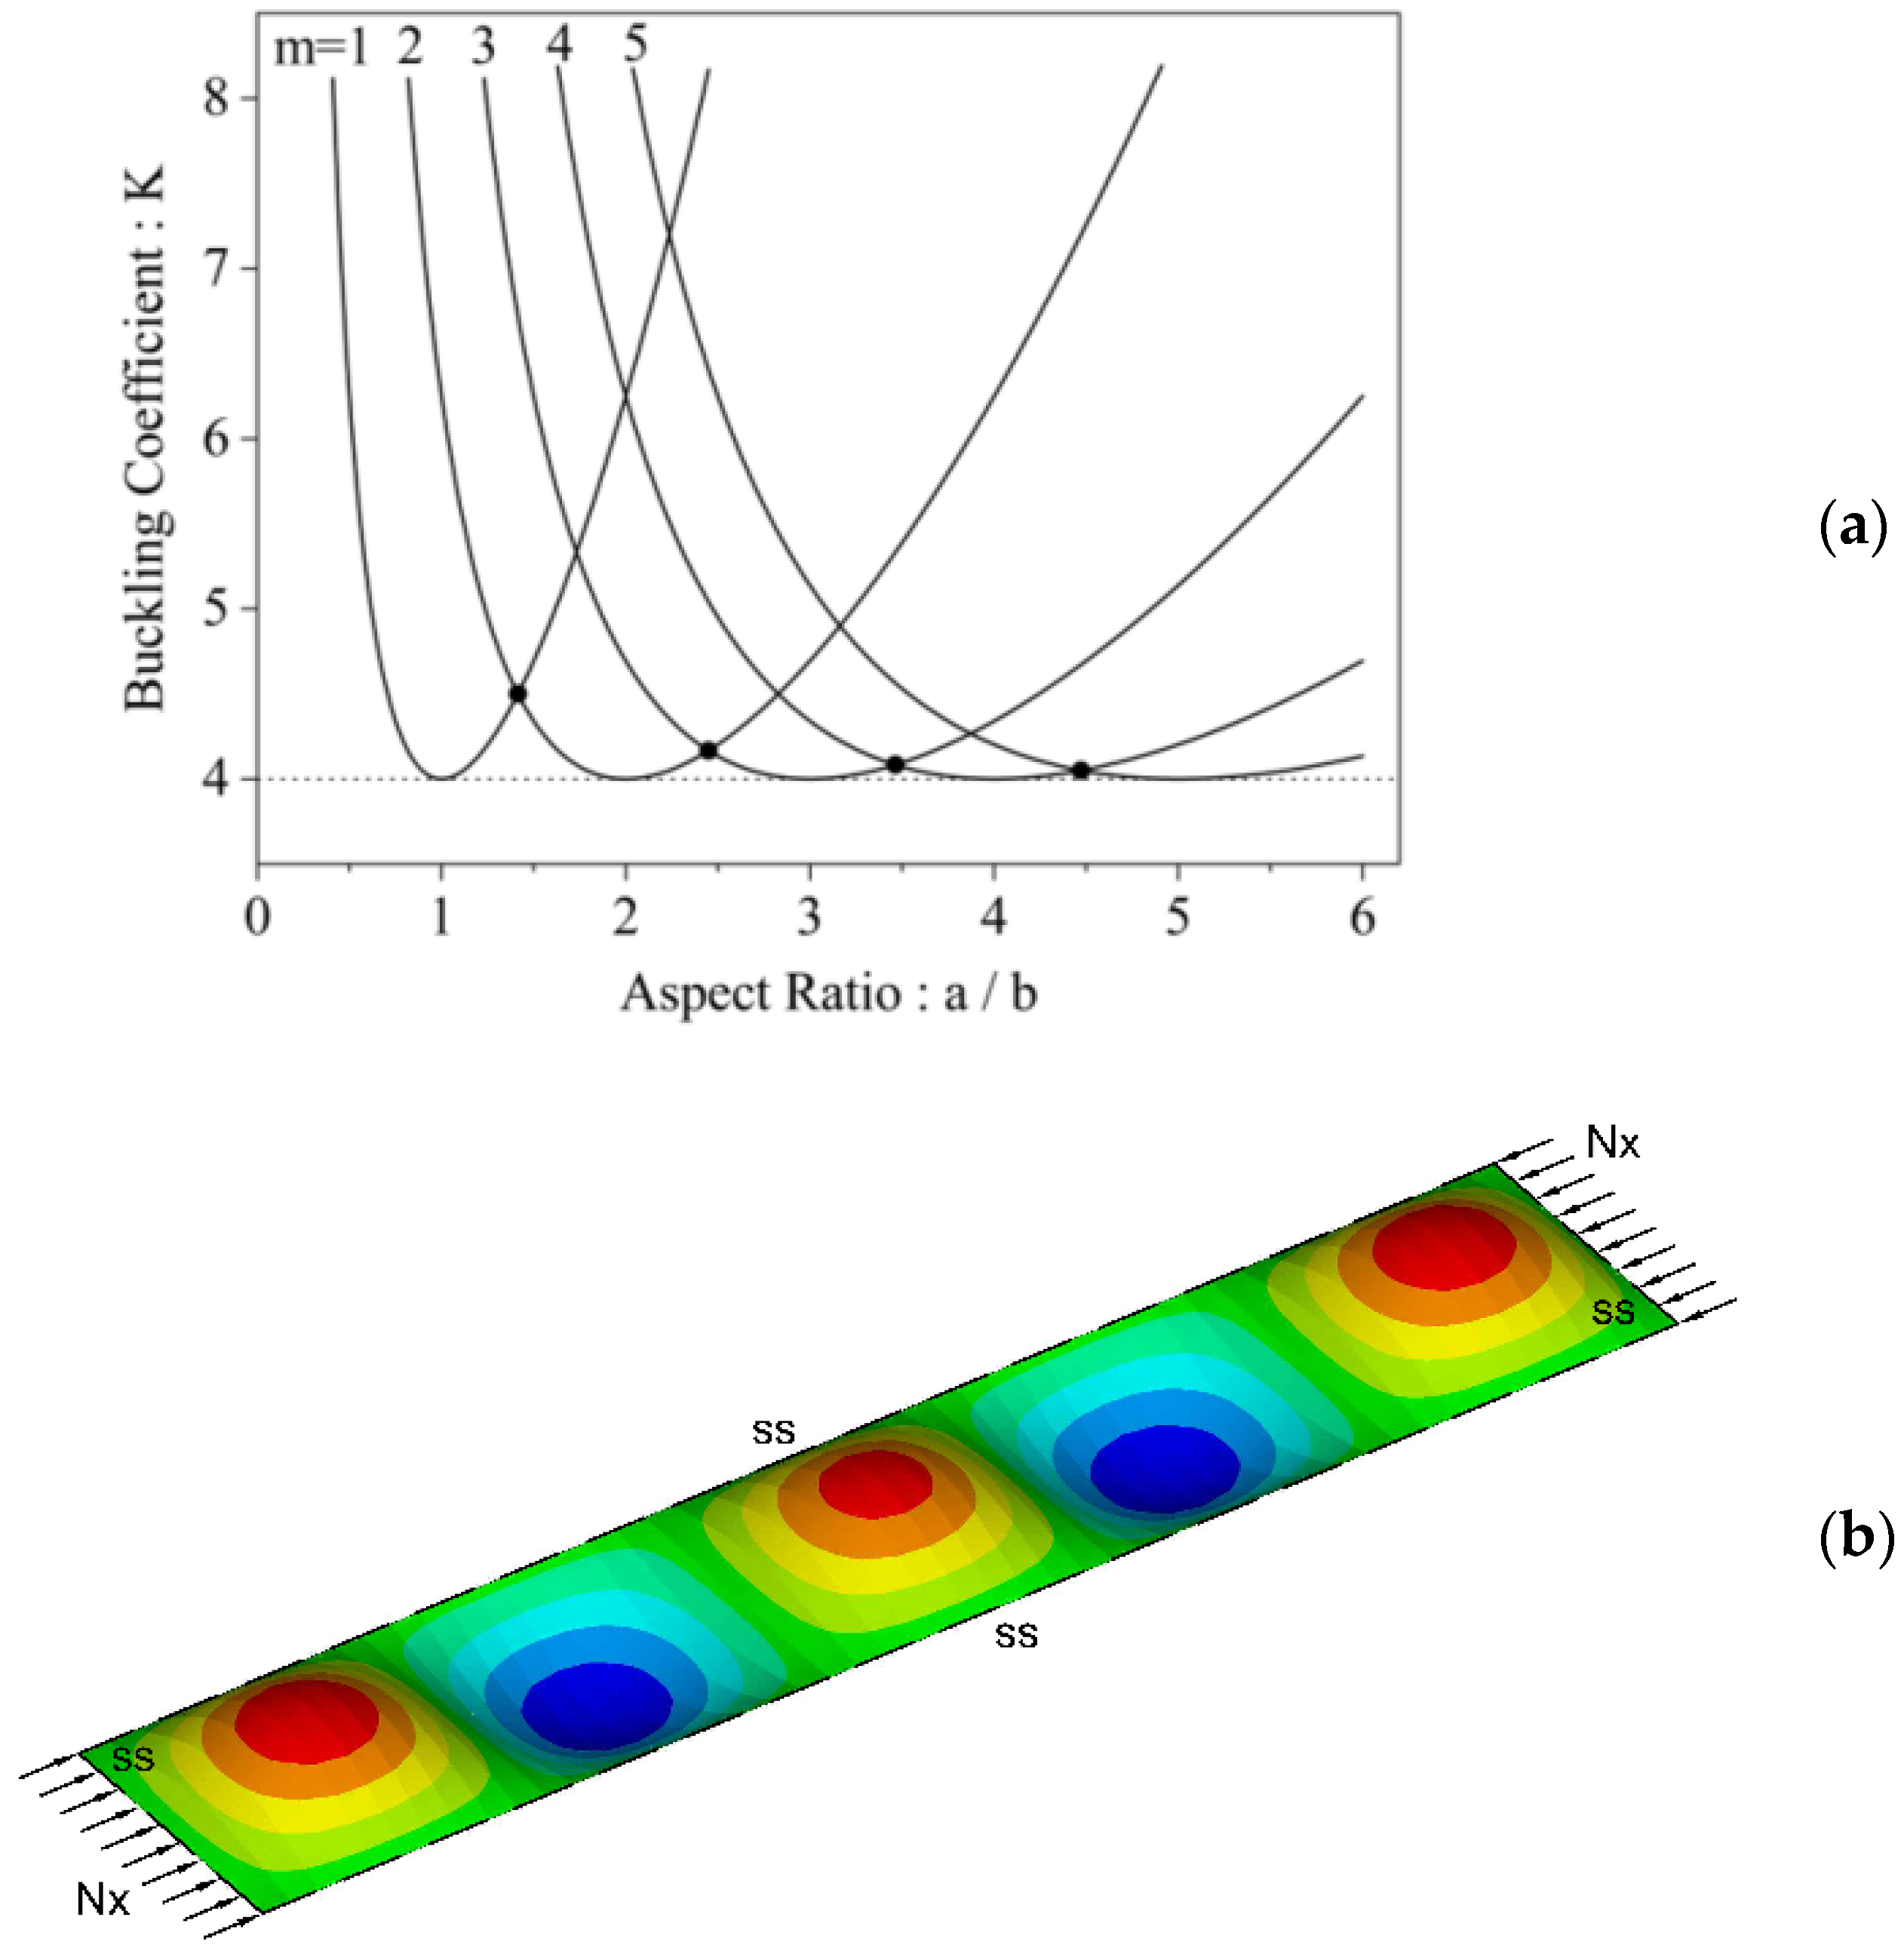
In the above equations, Nx,cr is the critical buckling force per unit width, while Em and νm are the plate’s Young’s modulus of elasticity and Poisson’s ratio, respectively (Table 1). Additionally, Kcr is defined as the critical buckling coefficient and is dependent on the plate’s primary dimensions (length, width) and the values n and m, which are the number of half-waves developed across the plate’s longitudinal and transverse directions. A plate’s deflection (eigenforms) is most probable to appear with one half-wave across its transverse since the obtained stress (eigenvalue) is lower, indicating a lower stable energy state. Thus, the value of n = 1 can be assumed when calculating critical buckling stresses using Equation (1). It should be noted that by studying Equation (2), as the aspect ratio increases—i.e., long plates—the critical buckling coefficient Kcr tends to the value of 4. This effect is visualized in Figure 7a, indicating that a stable energy state is achieved when a long plate buckles forming several half-waves across its length. The number of these half-waves is an integral product of its width (Figure 7b).
In the case of shear buckling, the critical elastic stress is calculated using the following equation, as proposed by Timoshenko [13]
where
In Equation (3), D denotes the plate’s flexural rigidity: .
Both Equations (1) and (3) do not limit the obtained stress values, meaning that they could surpass the material’s yield point. For this reason, the following corrections according to the Johnson–Ostenfeld parabola (Hughes [14]) must be applied to the elastic stresses to calculate their critical values
In the above equations, the material’s yield stress is denoted by the ‘y’ subscript. According to LR [11] the shear yield stress can be calculated from the material’s yield stress as .
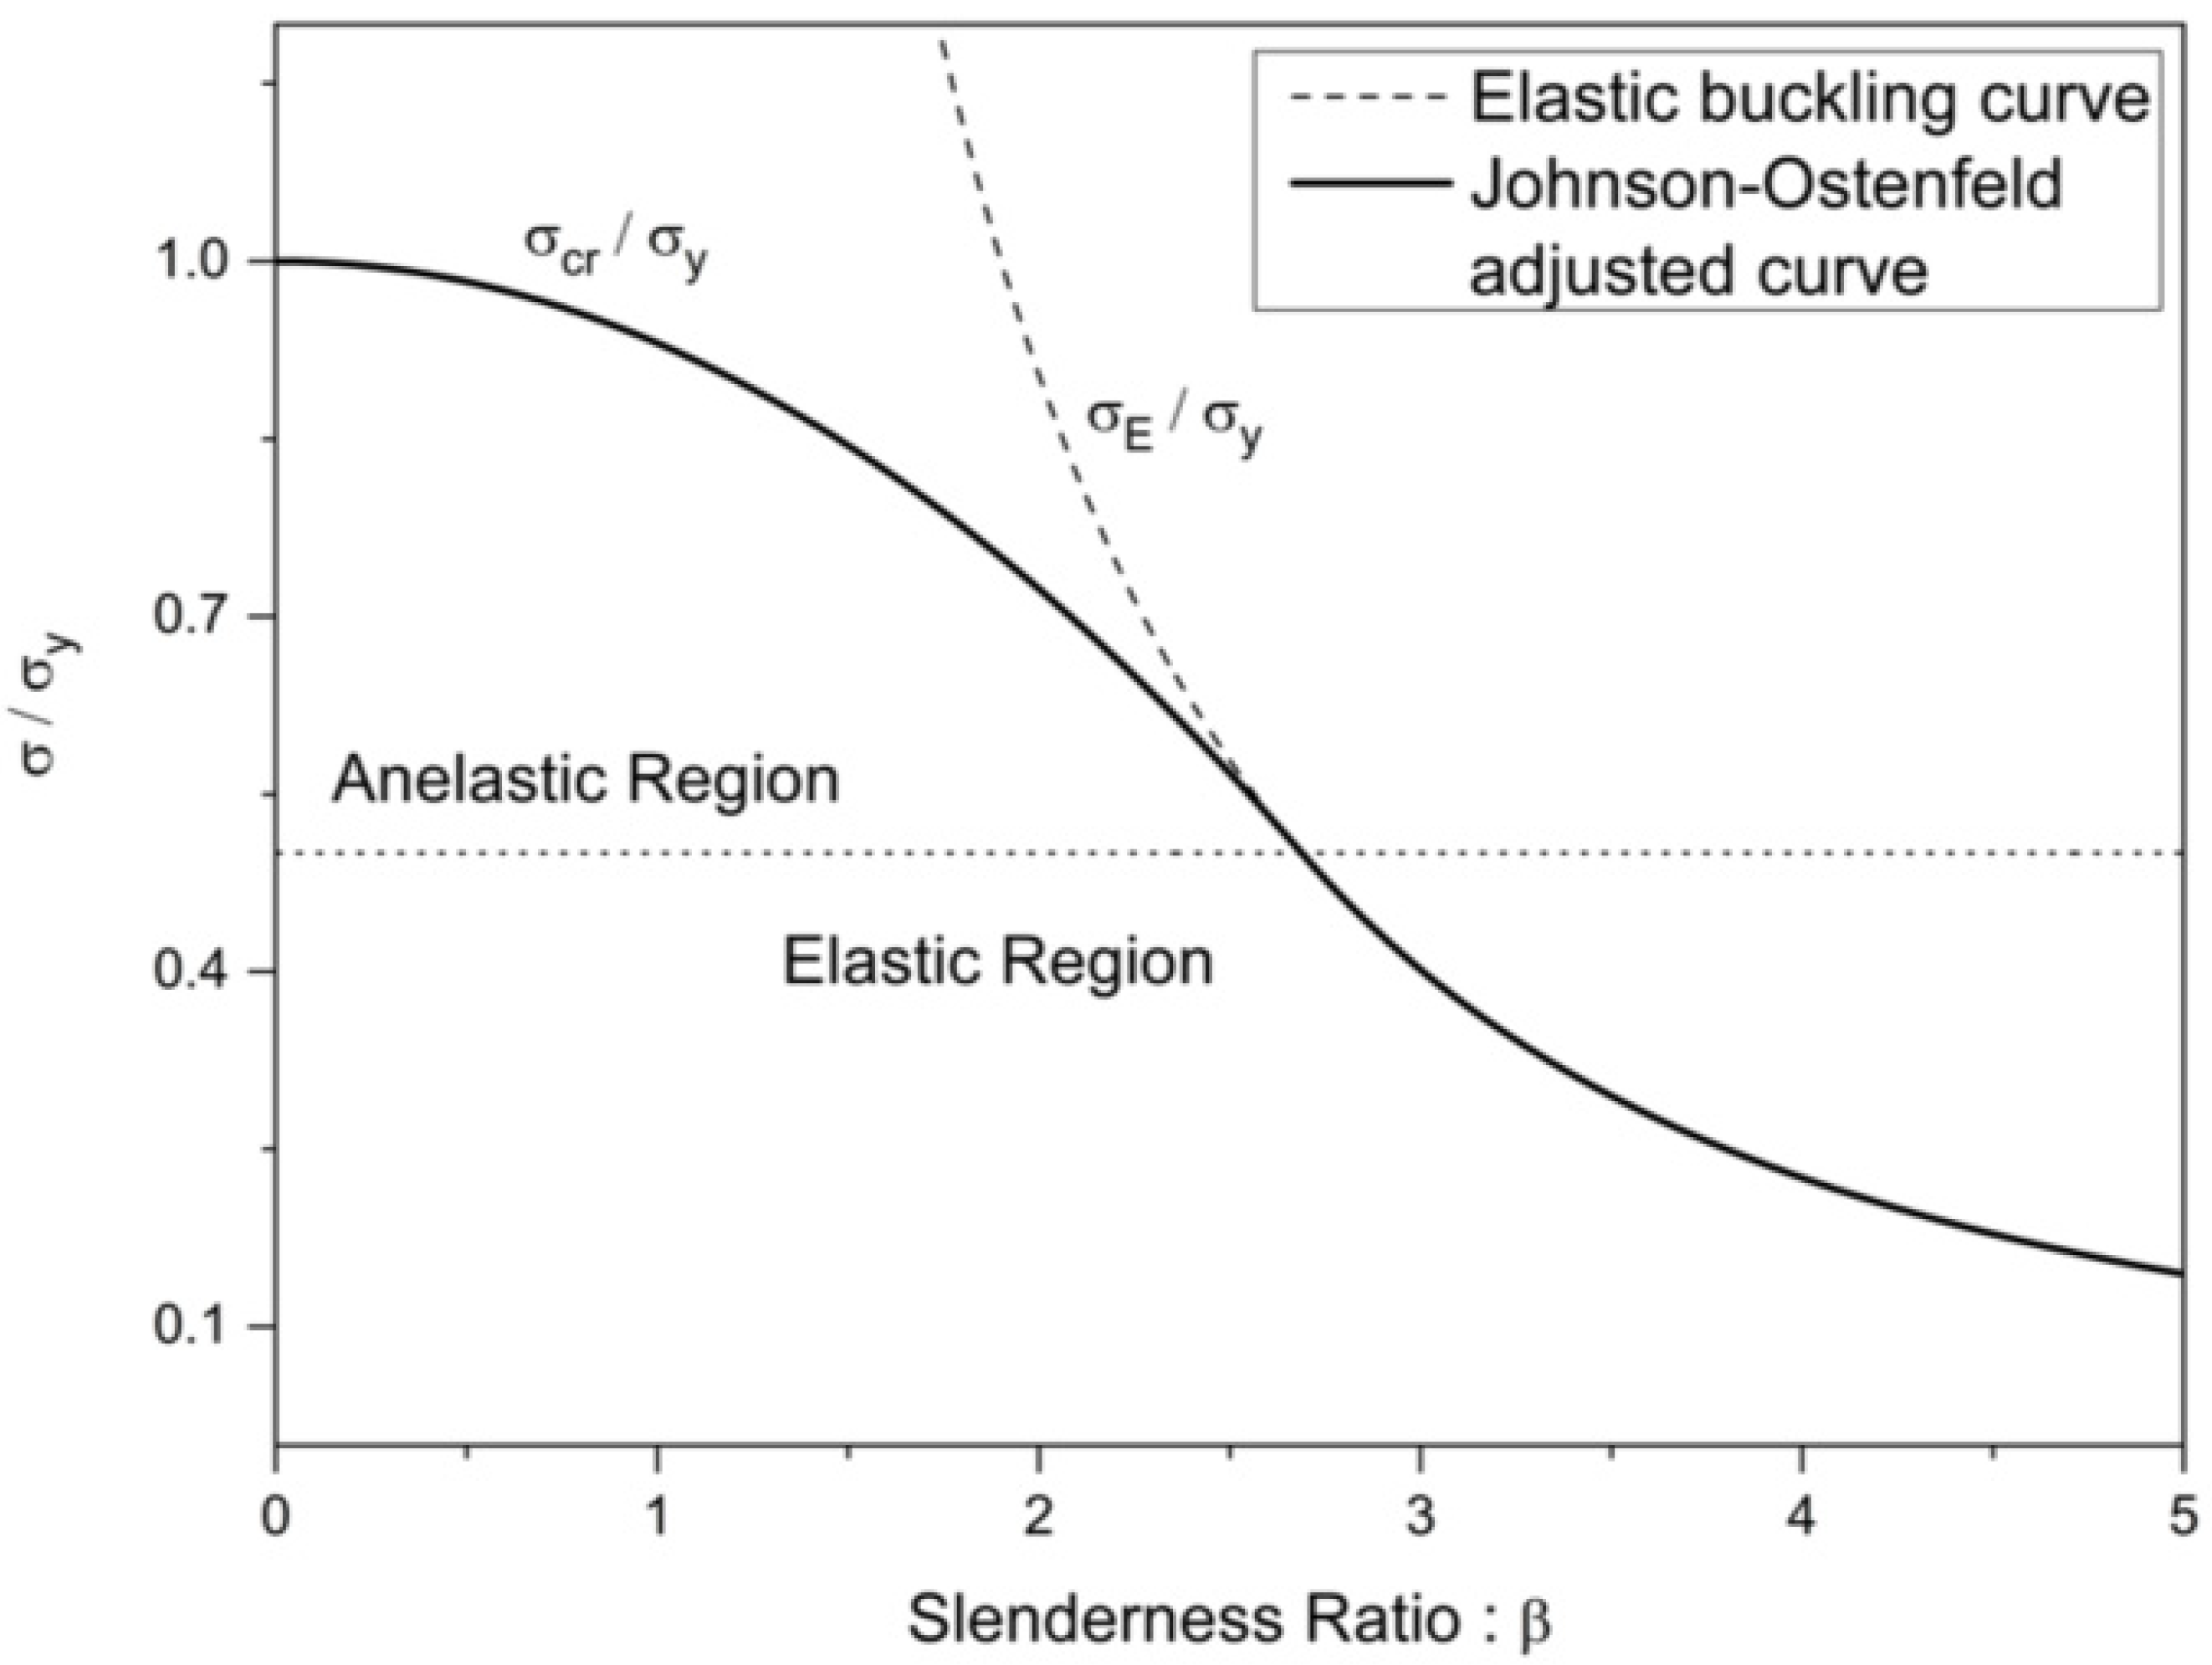
A plate’s behavior can be visualized by plotting the critical buckling values from Equations (5) and (6) with respect to its slenderness ratio β (Figure 8), which is defined as
The proposed method might be criticized for using elastic buckling theory and not introducing non-linearities to make the problem more realistic. However, the former allows for a safe preliminary assessment of the obtained FoS since it underestimates the critical buckling stress. This phenomenon is thoroughly explained by Hughes [14], where it is stated that the stresses do not distribute uniformly internally at a stiffened panel during compression. This occurs because the stiffened edges have higher rigidity than the unsupported center. Thus, the center is the first to buckle, while the former areas buckle at a higher value, demonstrating post-buckling capacity. Hence, by assuming elastic buckling, the proposed method’s real-world application will exhibit a better structural response than the one obtained from numerical calculations.
An additional non-linearity is the existence of the adhesive bondline between the composite patch and the metal plate. According to Anyfantis et al. [15], the cohesive zone might be damaged, which could lead to crack initiation and propagation, resulting in debonding propagation. The latter may develop between the composite and the adhesive, the metal plate and the adhesive, or through a failure of the adhesive itself. In order to avoid non-linear solutions, the following method was proposed for developing an assessment method of the bondline fracture.
During loading, the stresses that develop on the bonded structure’s cross-sections are transferred between the two substrates through the bondline. The latter’s failure conditions can be evaluated using its fracture toughness GC, which is its resistance to a defect’s propagation. In order to evaluate if the bondline fails under a specific load, the acting strain energy release rate G must be known. This strain energy increases as the applied load also increases. According to the energy method, a bondline defect propagates if
The acting strain energy release rate G can be calculated using the steady state’s release rate (SERR) debonding propagation formula
where:
- P is the axial acting force.is the balance moment, with , and .
- and .
- and are the effective plane stress Young’s moduli of the composite and the plate respectively, while Ec and Em are their Young’s moduli of elasticity, and νc and νm their Poisson’s ratio.
For the case being studied, P is replaced by Nx,cr in order to determine whether the proposed patch repair could suffer from bondline fracture. Finally, the maximum stress developed within the metal plate and the composite patch must not exceed the respective material’s yielding/fracture value.
4. Physics and Data-Based Models
4.1. FEA Model
The most efficient way of performing the buckling strength calculations and the statistical analysis is through the application of numerical methods. Thus, for the former case, FEA can be used to obtain accurate stress and displacement results. Furthermore, the problem being examined is a thin plate since am/tm >> 20 is common in tankers and bulk carriers (Zhang [16]); hence, shell elements can be used for representing them in the numerical model. The same theory is valid for the composite patch. The shell elements used are the four-node and eight-node elements, which in ANSYS are represented by SHELL 181 and SHELL281, respectively. Their effectiveness is assessed through a mesh convergence test in order to find the optimal option. The metal’s material is input as an isotropic material, while the composite is an orthotropic one. It should be noted that the analyses are based on a linear elastic foundation and the results are corrected according to Equations (5) and (6) for anelastic buckling.
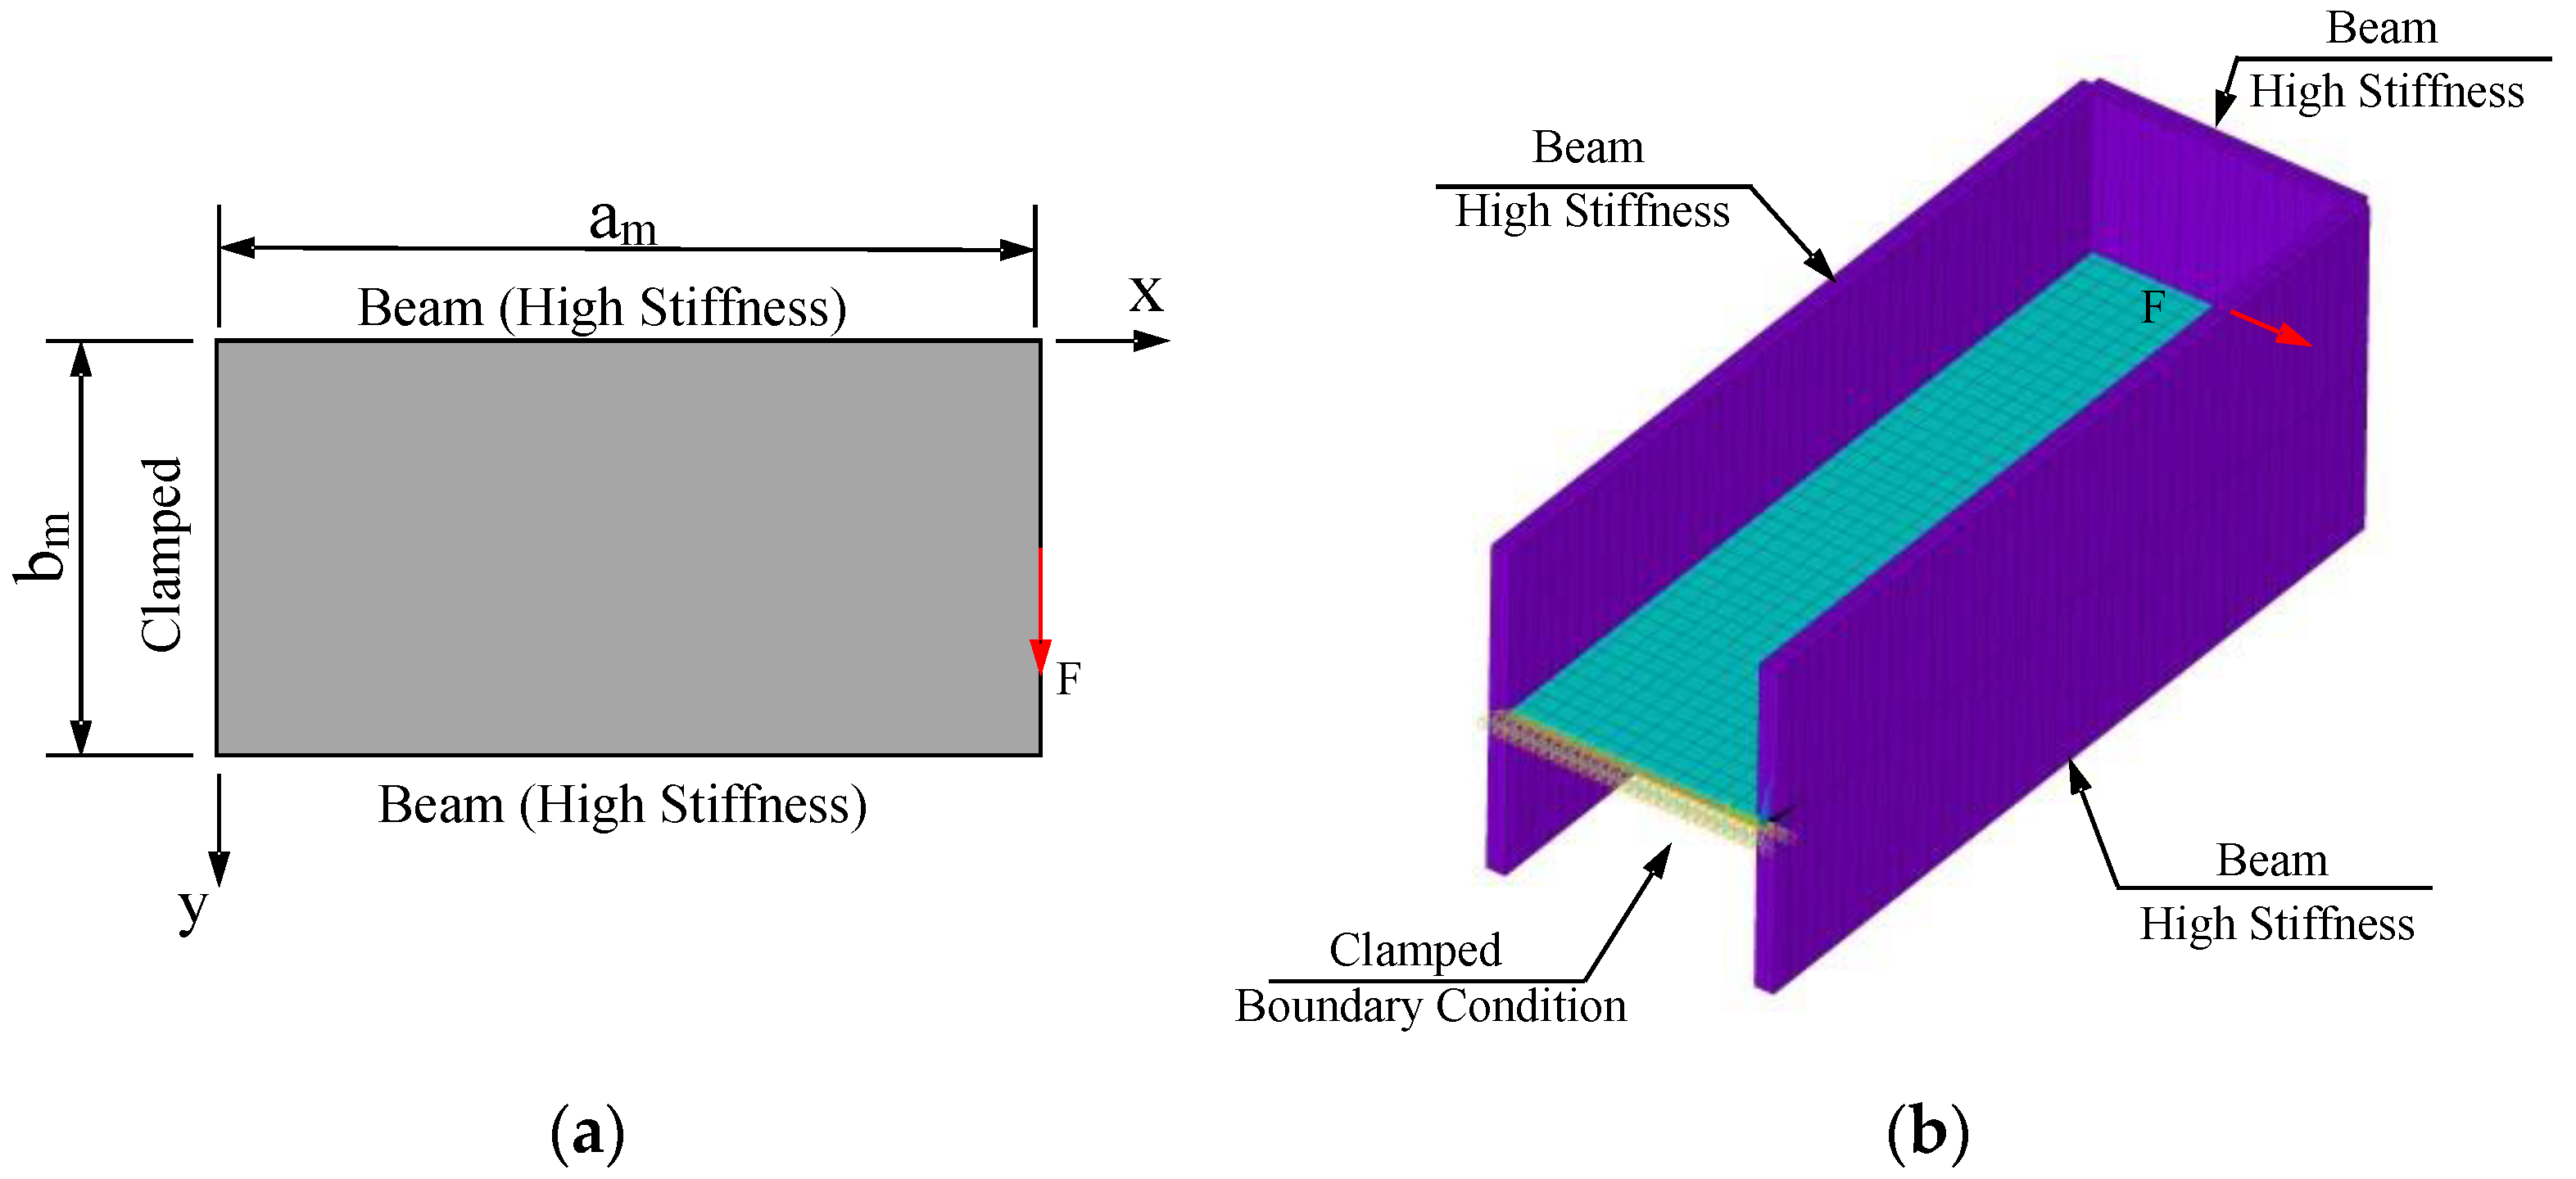
An essential step to successfully model the problem’s geometry is implementing the boundary conditions and loads. As pictured in Figure 9, the geometry is symmetrical to the center of the plate since the patch is centrally placed. This can be utilized for the compression model that can be reduced to its quarter model for the calculations, with symmetry boundary conditions at its edges (Figure 10). Thus, simply supported conditions, i.e., UZ = 0, are applied to the external edges, while UX = ROTY = ROTZ = 0 and UY = ROTX = ROTZ = 0 are applied to the internal transverse and longitudinal symmetry edges, respectively. In order to obtain the critical buckling stress value, a distributed force is applied at the plate’s short edges. By solving an eigenvalue buckling analysis, the critical buckling force Nx,cr is acquired, and by using Equation (1), so is its equivalent stress.
However, the same modeling cannot be applied to the shear buckling problem, since it utilizes a different approach to the problem with respect to the boundary and loading conditions that do not allow for symmetry to be used, hence the geometry is modeled in its entirety (Figure 11). The boundary condition in effect is the restriction of all degrees of freedom at one of the short edges, i.e., clamping conditions. In the rest of the edges, large beams are modeled with substantial stiffness that allows the geometry to be considered a cantilever, thus having low bending effects (Anyfantis [2]). This way, the shear buckling effect is acquired with a good approximation. The load is applied to a pilot node at the free short edge’s center, with a direction parallel to it. Thus, the critical buckling force Nxy,cr is acquired by dividing it by the plate’s thickness (same principle as Equation (1)).
The values obtained from these analyses must be corrected according to Johnson–Ostenfeld’s parabola for anelastic buckling (Hughes [14]). These calculations are performed at the data points specified by the DoE methodology.
4.2. DoE Analysis
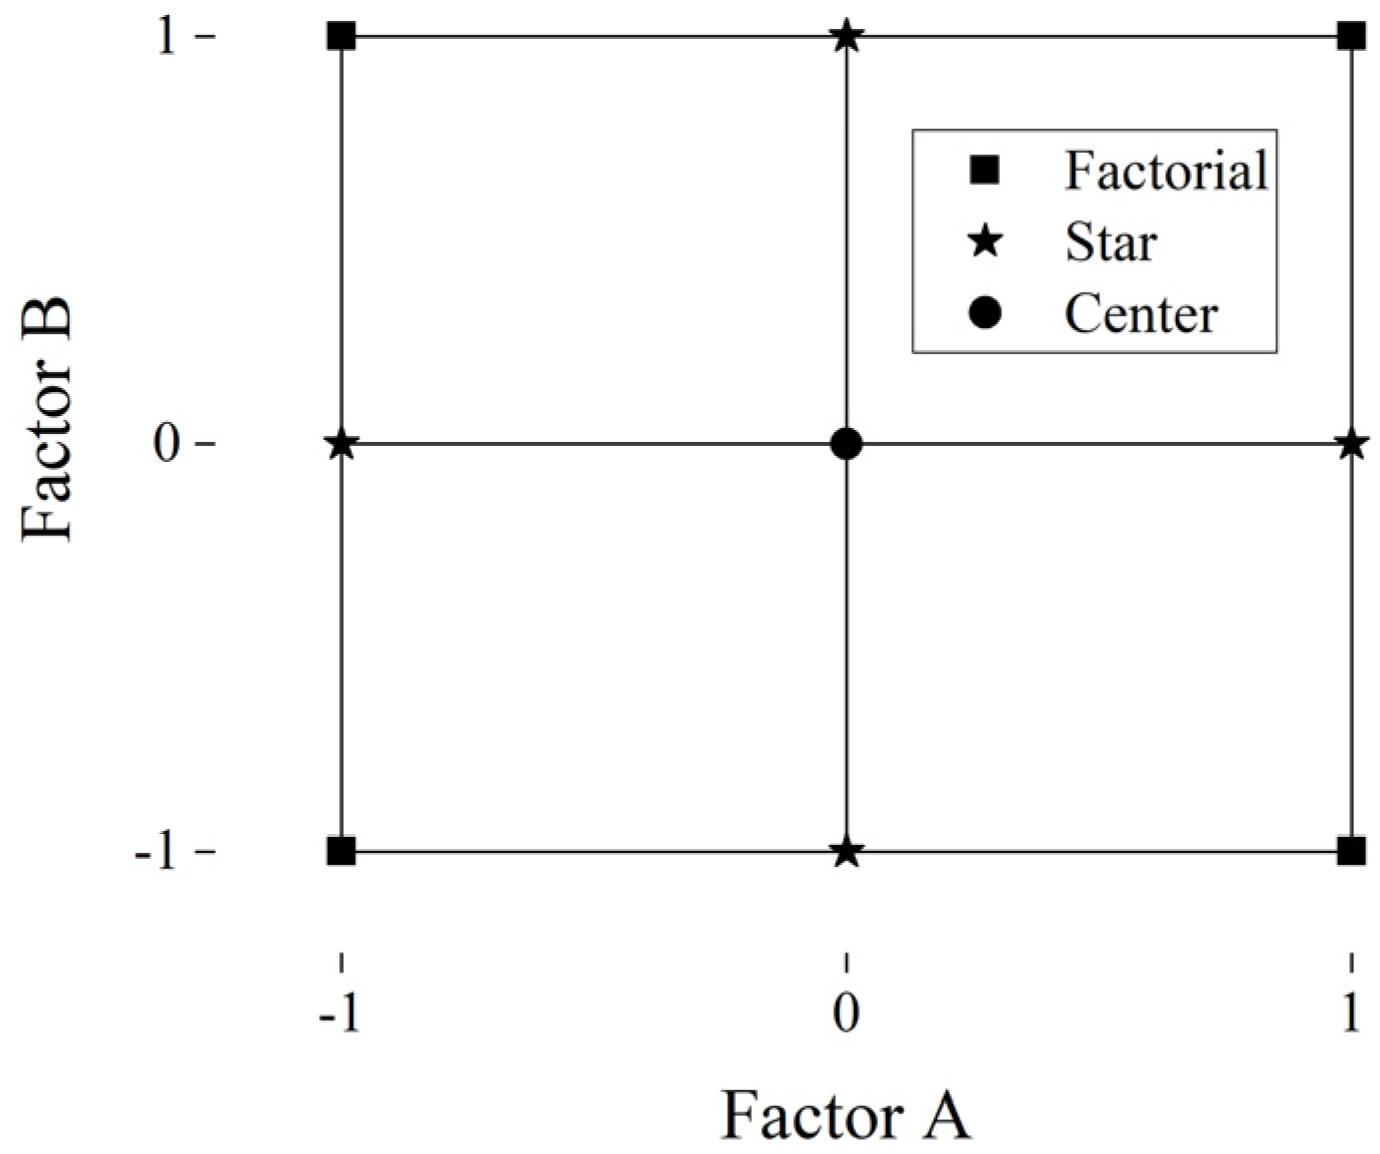
DoE is the design of an experiment based on input parameters and using statistical tools to approximate the output as best as possible. One basic example of a DoE method is an OFAT analysis, in which the output of an experiment is based on one factor at a time (as indicated by the title itself) without implementing possible interactions between input parameters. Another method used for this study’s purposes is an RSM, which is a two-level design. Specifically, two input design parameters are used to define the design space. A central composite design (CCD) then indicates the data points needed for the method to be performed. According to a face-centered CCD (CCF), three point types are used: factorial (shows two-factor interactions), center (shows curvature), and star (shows quadratic effects). At the points of the design space indicated by the CCD (Figure 12), the output is obtained from an experiment. Once these points are specified (known x1, x2, and y), a polynomial surface is best fit to them with the help of statistical tools for its lack-of-fit evaluation.
In the case being studied, the design space consists of the patch’s percentage coverage (denoted by c) and the number of plies (denoted by Nplies). After setting these values’ range, their CCD points are configured at the three levels required, i.e., low level (−1), center (0), and high level (+1). Through numerical calculations using FEA, the experimental outputs for the data points are acquired. Then a quadratic polynomial equation of the form
is fit to these points to construct the response surface. In this case, x1 is the percentage coverage c, x2 is the number of plies Nplies, and y is the obtained FoS. This factor of safety is calculated as
Using the combination of the above methods (FEA and RSM), a list of acceptable design configurations for the requirements set by FoS, bondline fracture, and material yield is created. A significant advantage of this technique is that it does not require lab experiments for this preliminary design as long as the model is as accurate as possible.
5. Case Study
In order to showcase the proposed methodology, a case study is conducted following the techniques mentioned in the previous paragraphs.
5.1. Problem Set-Up
Assume a survey is conducted on a commercial ship that is not newly built. During procedural visual inspections, corrosion is detected on a girder of the double bottom. The plate’s thickness is then measured, indicating that the material wastage realized equals a 5% reduction of its initial thickness. After further assessing the defect and the damaged area according to the proposed flowchart in Figure 6, the Classification Society approves the application of a composite patch to rehabilitate the plate’s initial buckling strength capabilities. The plate’s dimensions and damage are listed in Table 2. After the repair, the plate shall have restored its buckling strength with a FoS equal to 1.0, i.e., its initial value.
The patch’s properties under consideration are its material, its configuration, and its shape (as shown in the flowchart in Figure 6). In order to obtain the optimal combination, OFAT analyses are conducted. The parameters that are listed in Table 3 are examined against an increasing value of the number of plies and evaluated using the obtained FoS. However, before initiating any analysis, the element properties for the numerical calculations shall be defined. Specifically, mesh convergence tests for four- and eight-node elements were conducted for the compression and shear model containing only the intact metal plate. The results are illustrated in Figure 13 where the element size is plotted with respect to the percentage deviation of the obtained buckling stress from the one obtained by the minimum allowed size of 20 mm. The graphs indicate that the eight-node elements, combined with a mesh size of 100 mm, provide sufficient accuracy, with less than 0.2% deviation from the converged value.
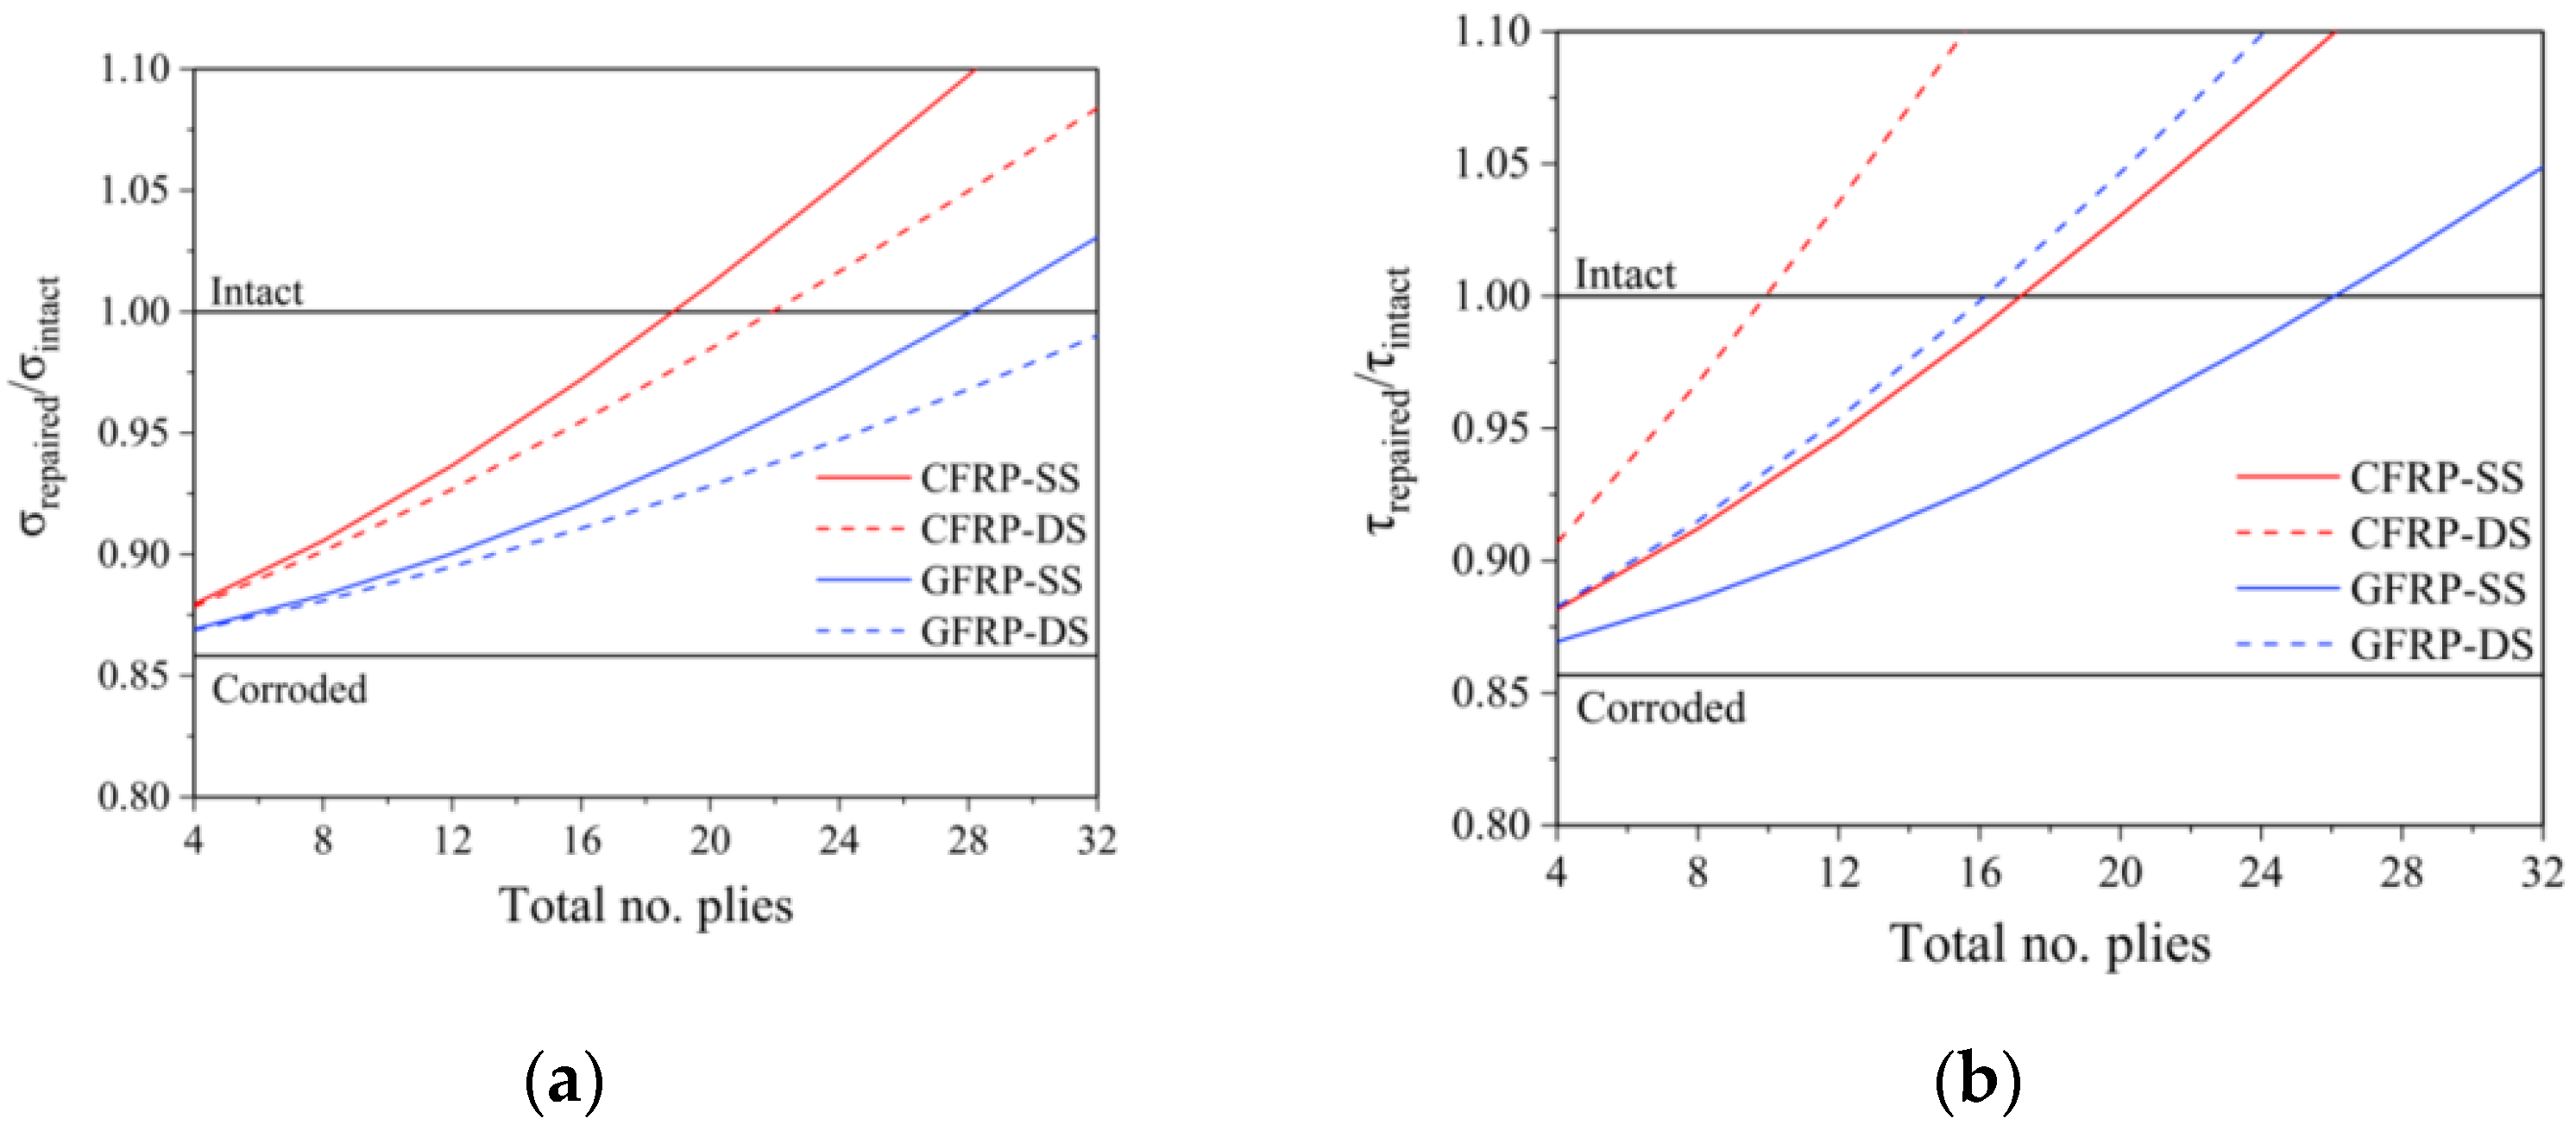
Two OFAT analyses were performed: one for defining the patch’s material and configuration and another for the shape. The former analysis uses a rectangular patch as a typical shape, while the coverage percentage is 75%. The results are shown in Figure 14, where it can be concluded that the CFRP is a better acting material than the GFRP. Additionally, the one-sided patch has faster buckling restoration capabilities against compression, while the two-sided has a similar effect against shear. However, the one-sided CFRP patch is chosen as the most effective since it restores the buckling capacity for a similar number of plies in both compression and shear.
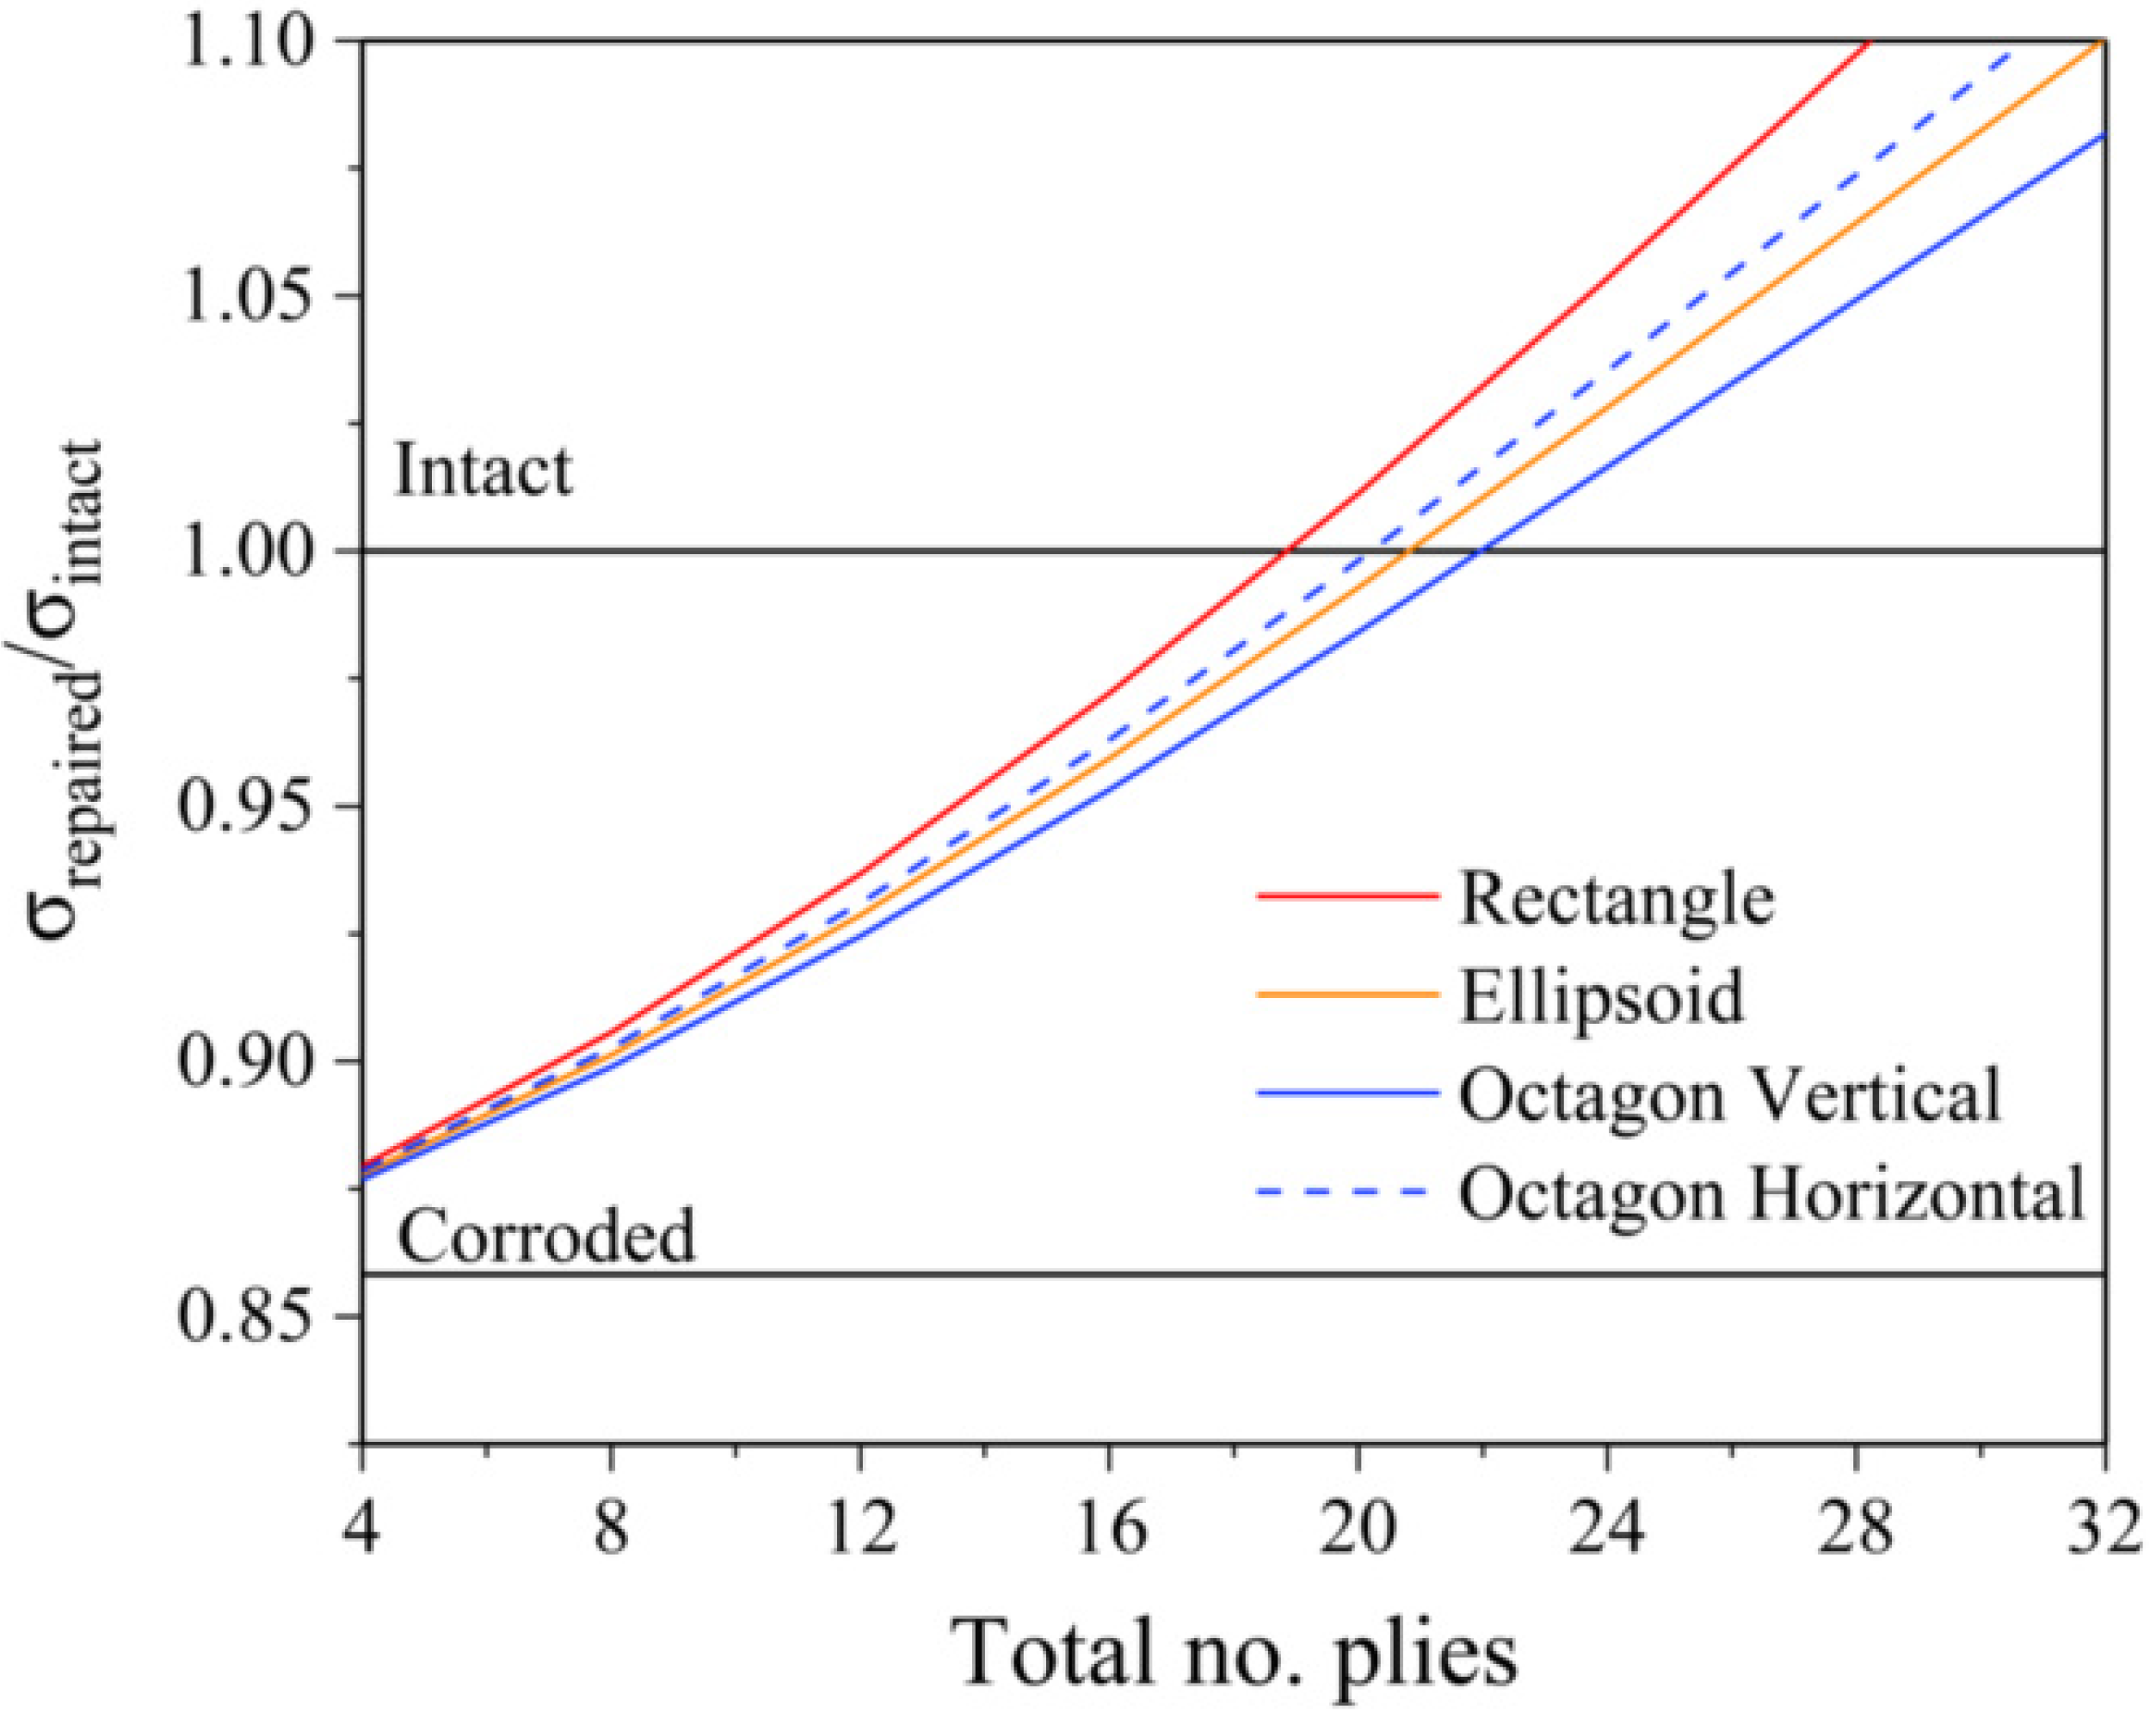
Afterward, using these findings, the possible shapes (Figure 3) were tested against each other. These analyses were carried out on the compression model, and similar results were assumed for the shear equivalent. The shape with the better rehabilitation performance is the rectangular patch (Figure 15). Thus, the optimal option for restoring the corroded plate’s buckling capabilities is a one-sided CFRP rectangular patch.
5.2. Analysis Results
In order to perform the RSM, the CCD points, and consequently the design space, must be defined. The two design parameters, i.e., the patch’s coverage c and the number of plies Nplies, are allowed to take values inside the range specified in Table 4 between the low and high-level indications. The same table specifies the design points using the CCD design space (Figure 12). It should be noted that each ply’s thickness is equal to 0.33125 mm (Karatzas [3]).
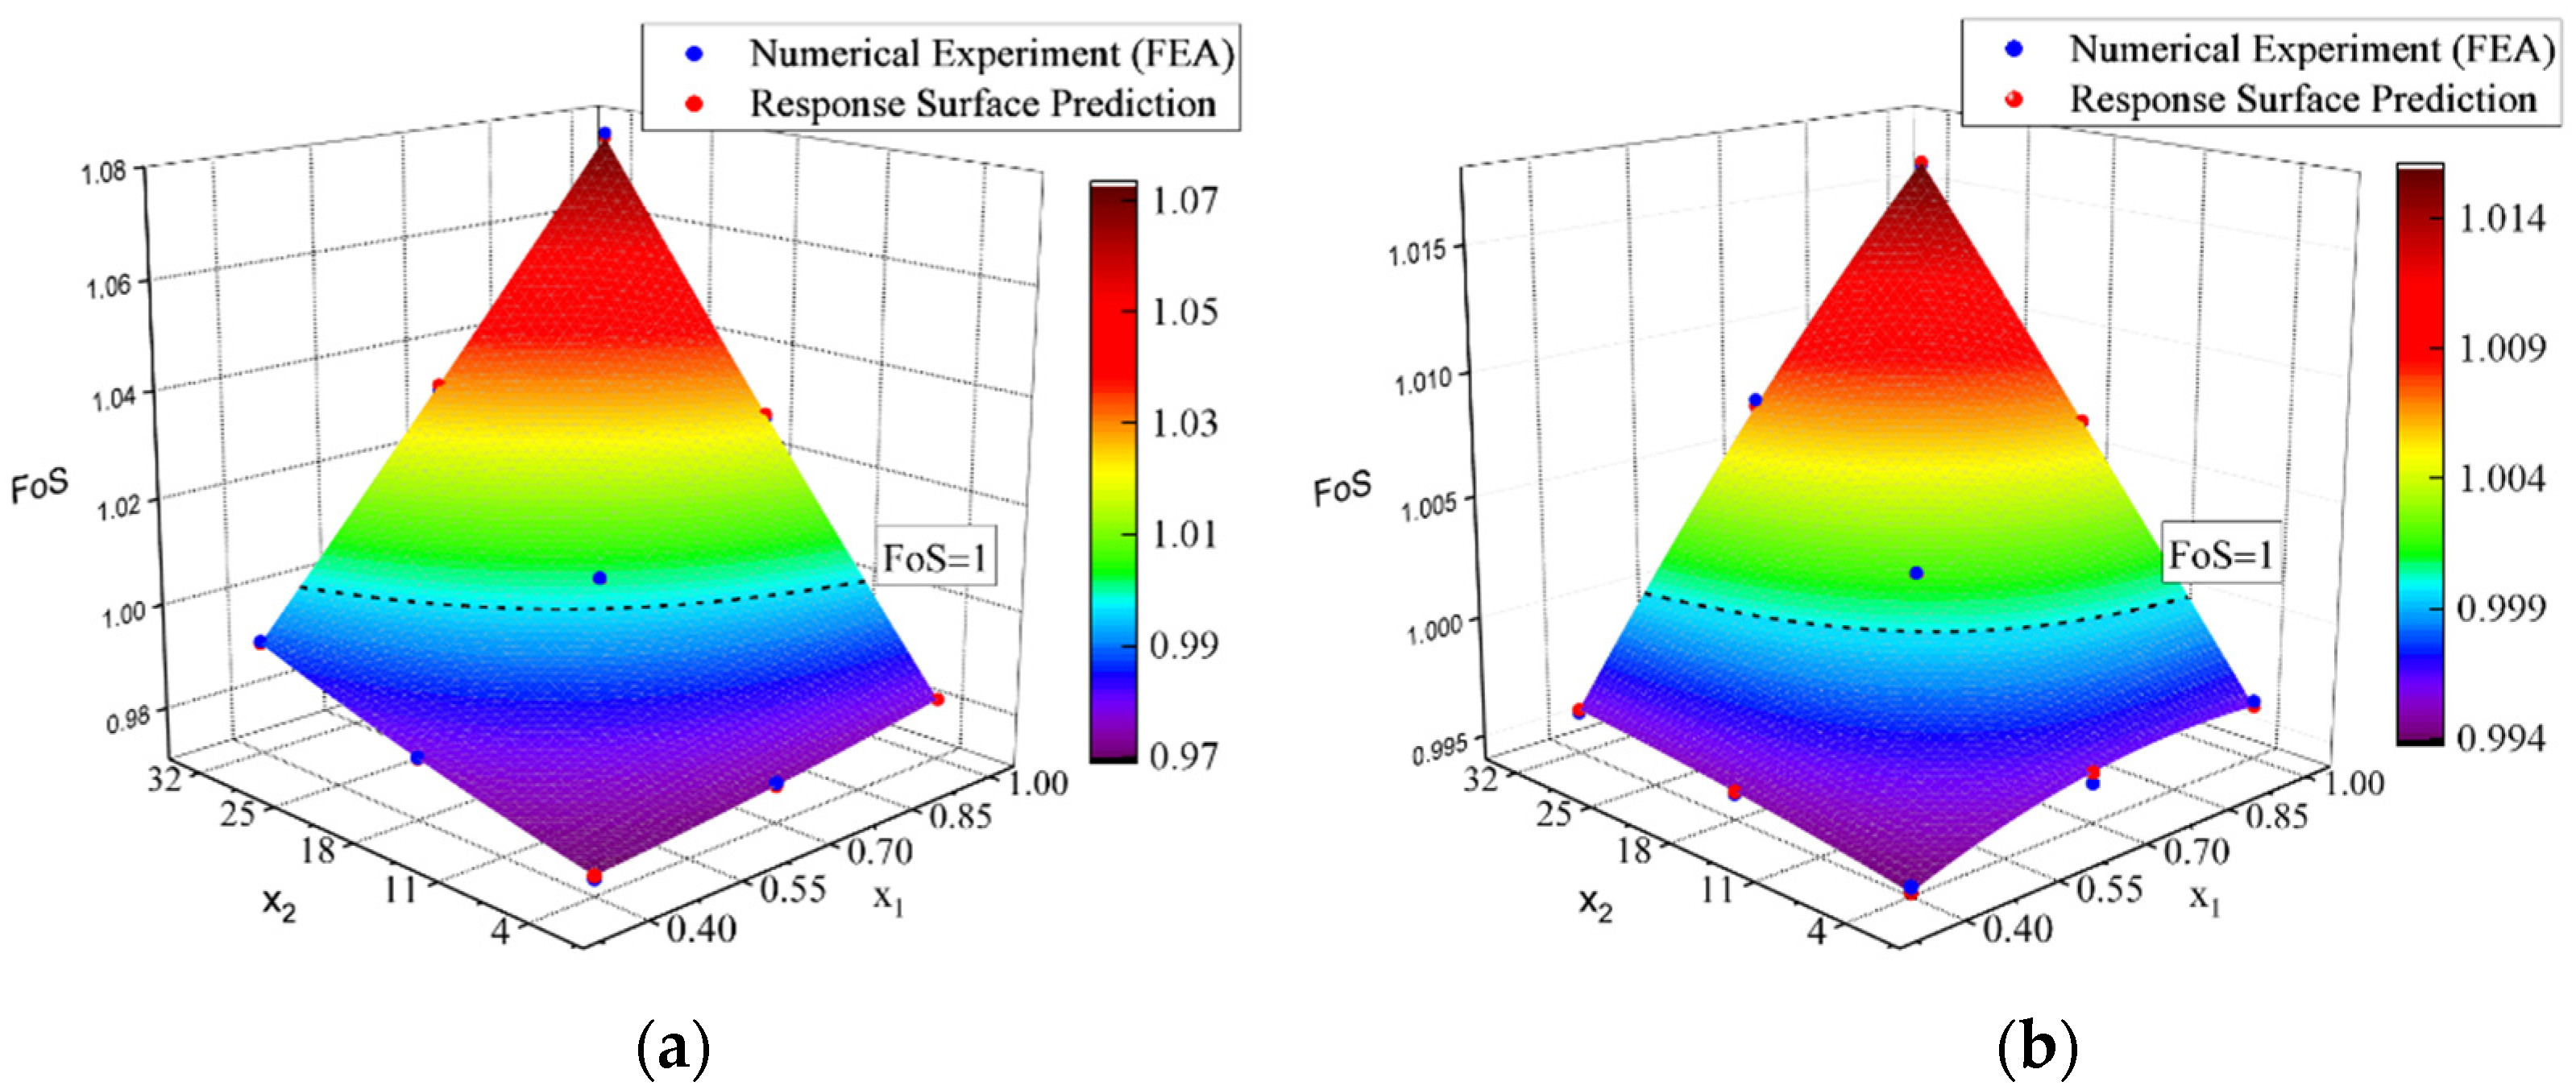
Using the design points, numerical calculations were conducted, and the resultant stresses were corrected for anelastic buckling, if applicable. By fitting a polynomial as expressed in Equation (10), the resultant response surfaces for the compressive (Equation (12a)) and shear (Equation (12b)) buckling problem are defined by
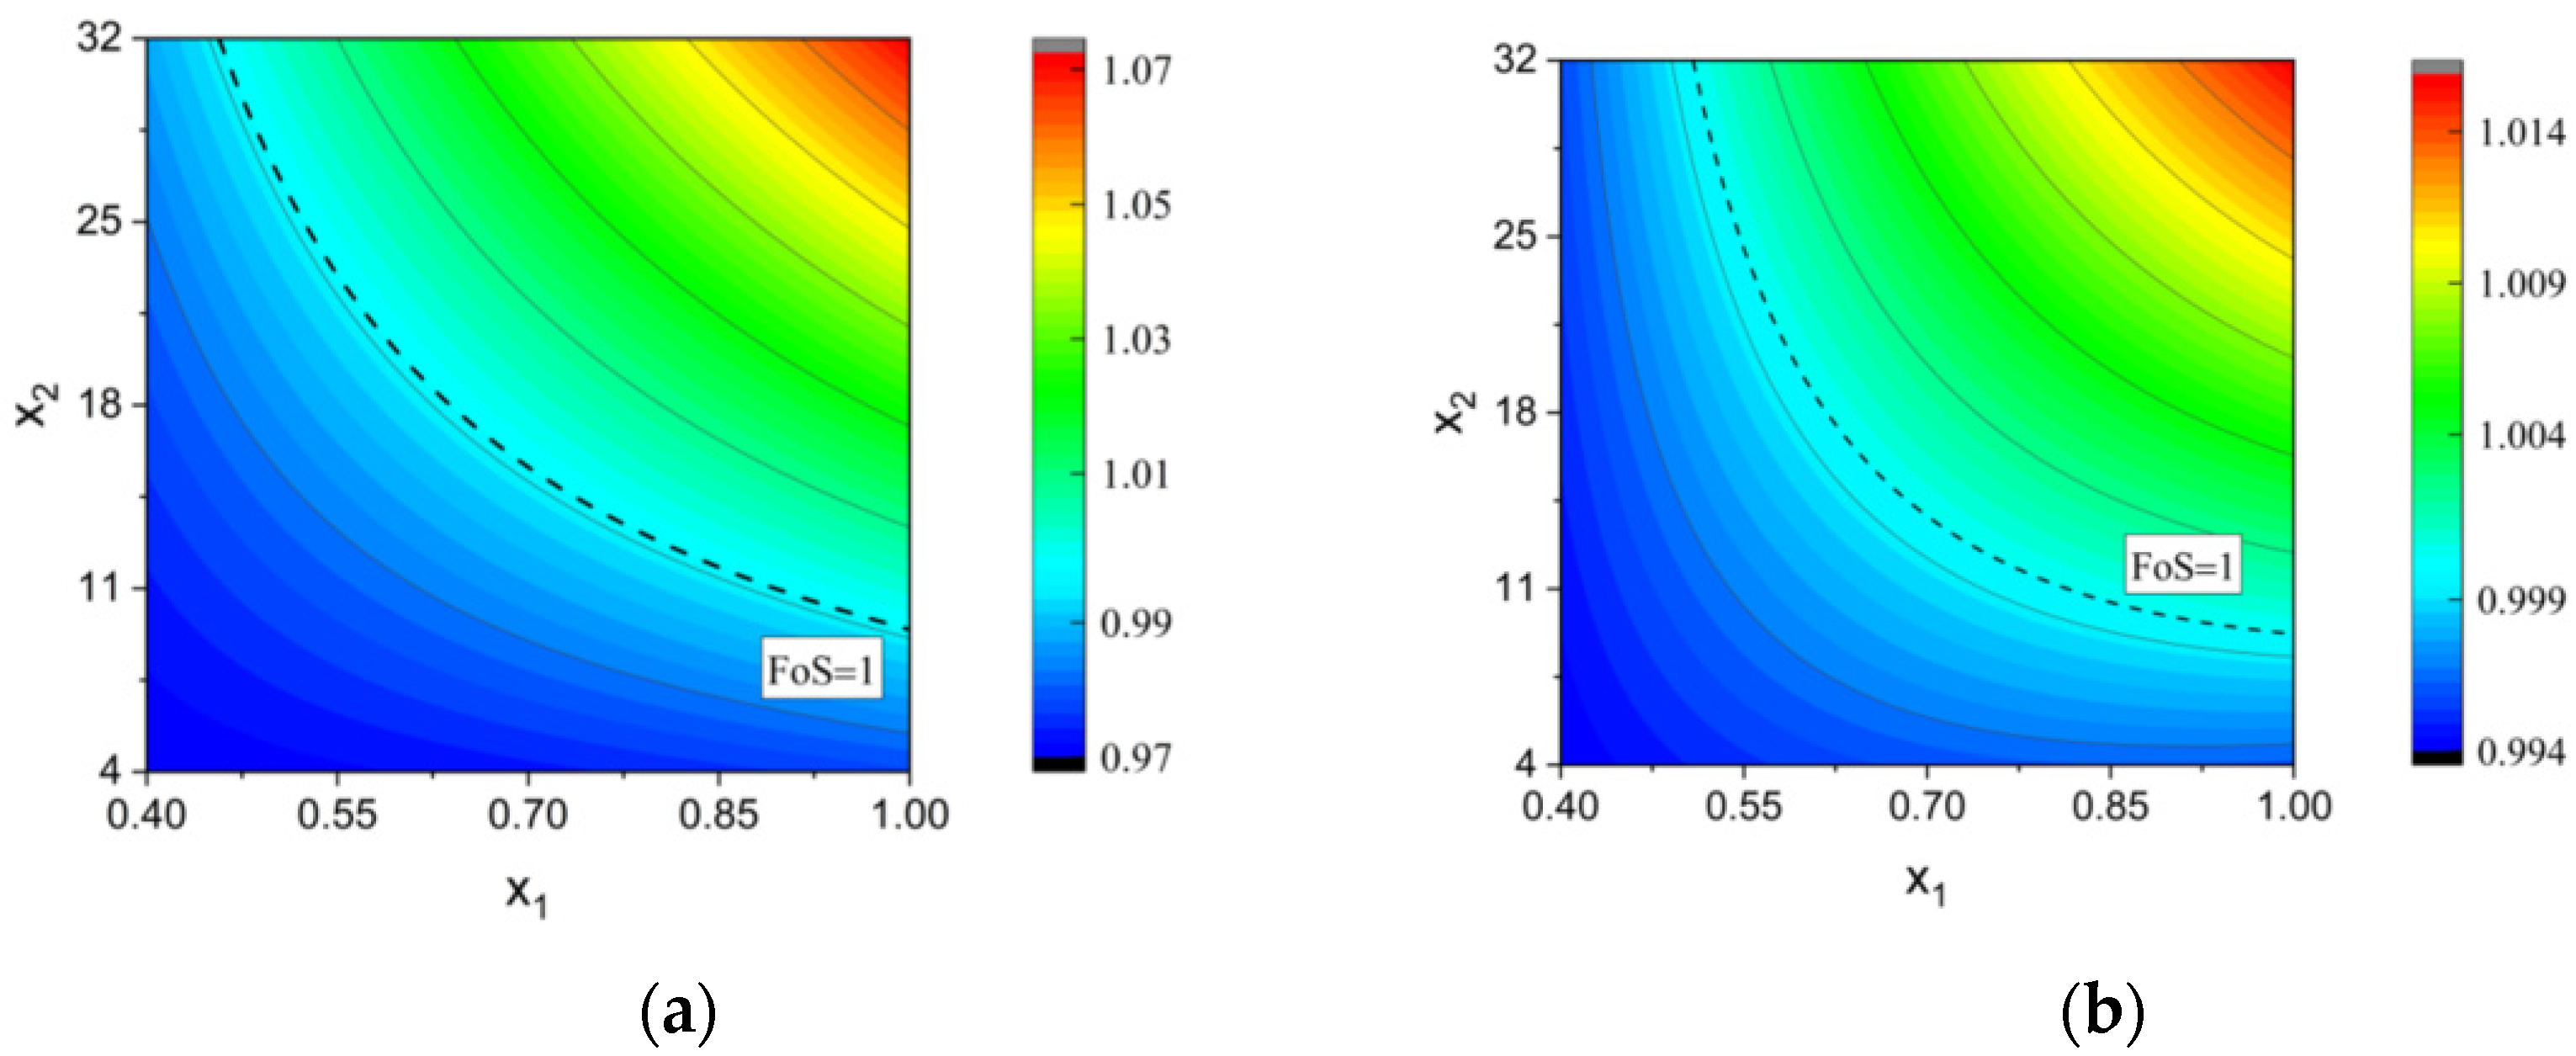
These response surfaces are illustrated in Figure 16a,b, where both the experimental points obtained by the numerical calculations and the predicted points are plotted. Additionally, the FoS requirement is also visible on the surface as a curve. Any design parameters combination with a generated FoS below the indicated requirement curve is not acceptable. In Figure 17a,b, the same surfaces are plotted as a 2D contour for better visualizing the acceptable combinations.
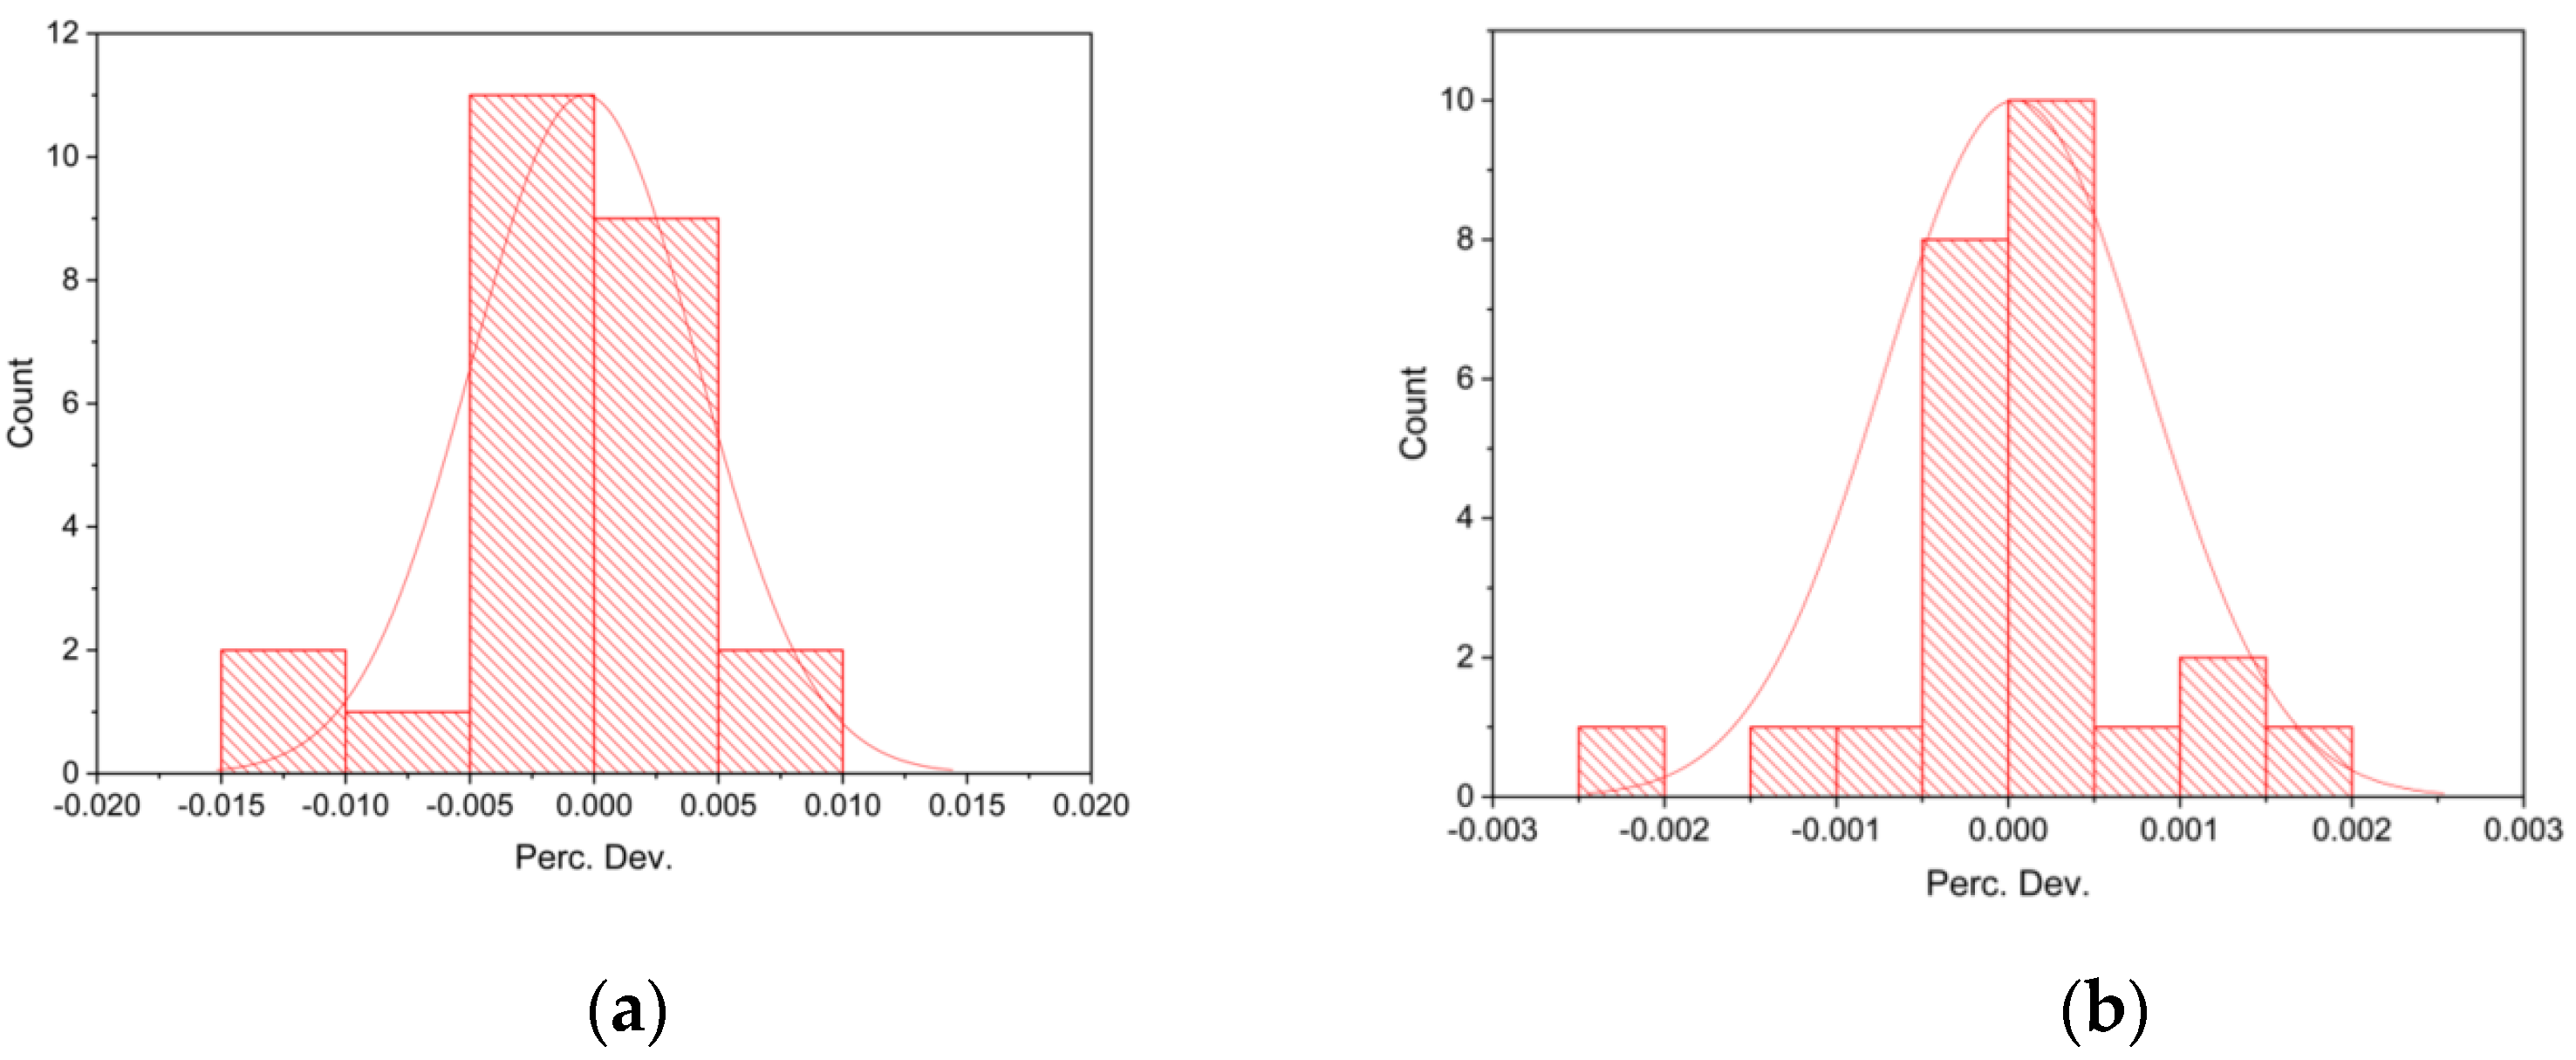
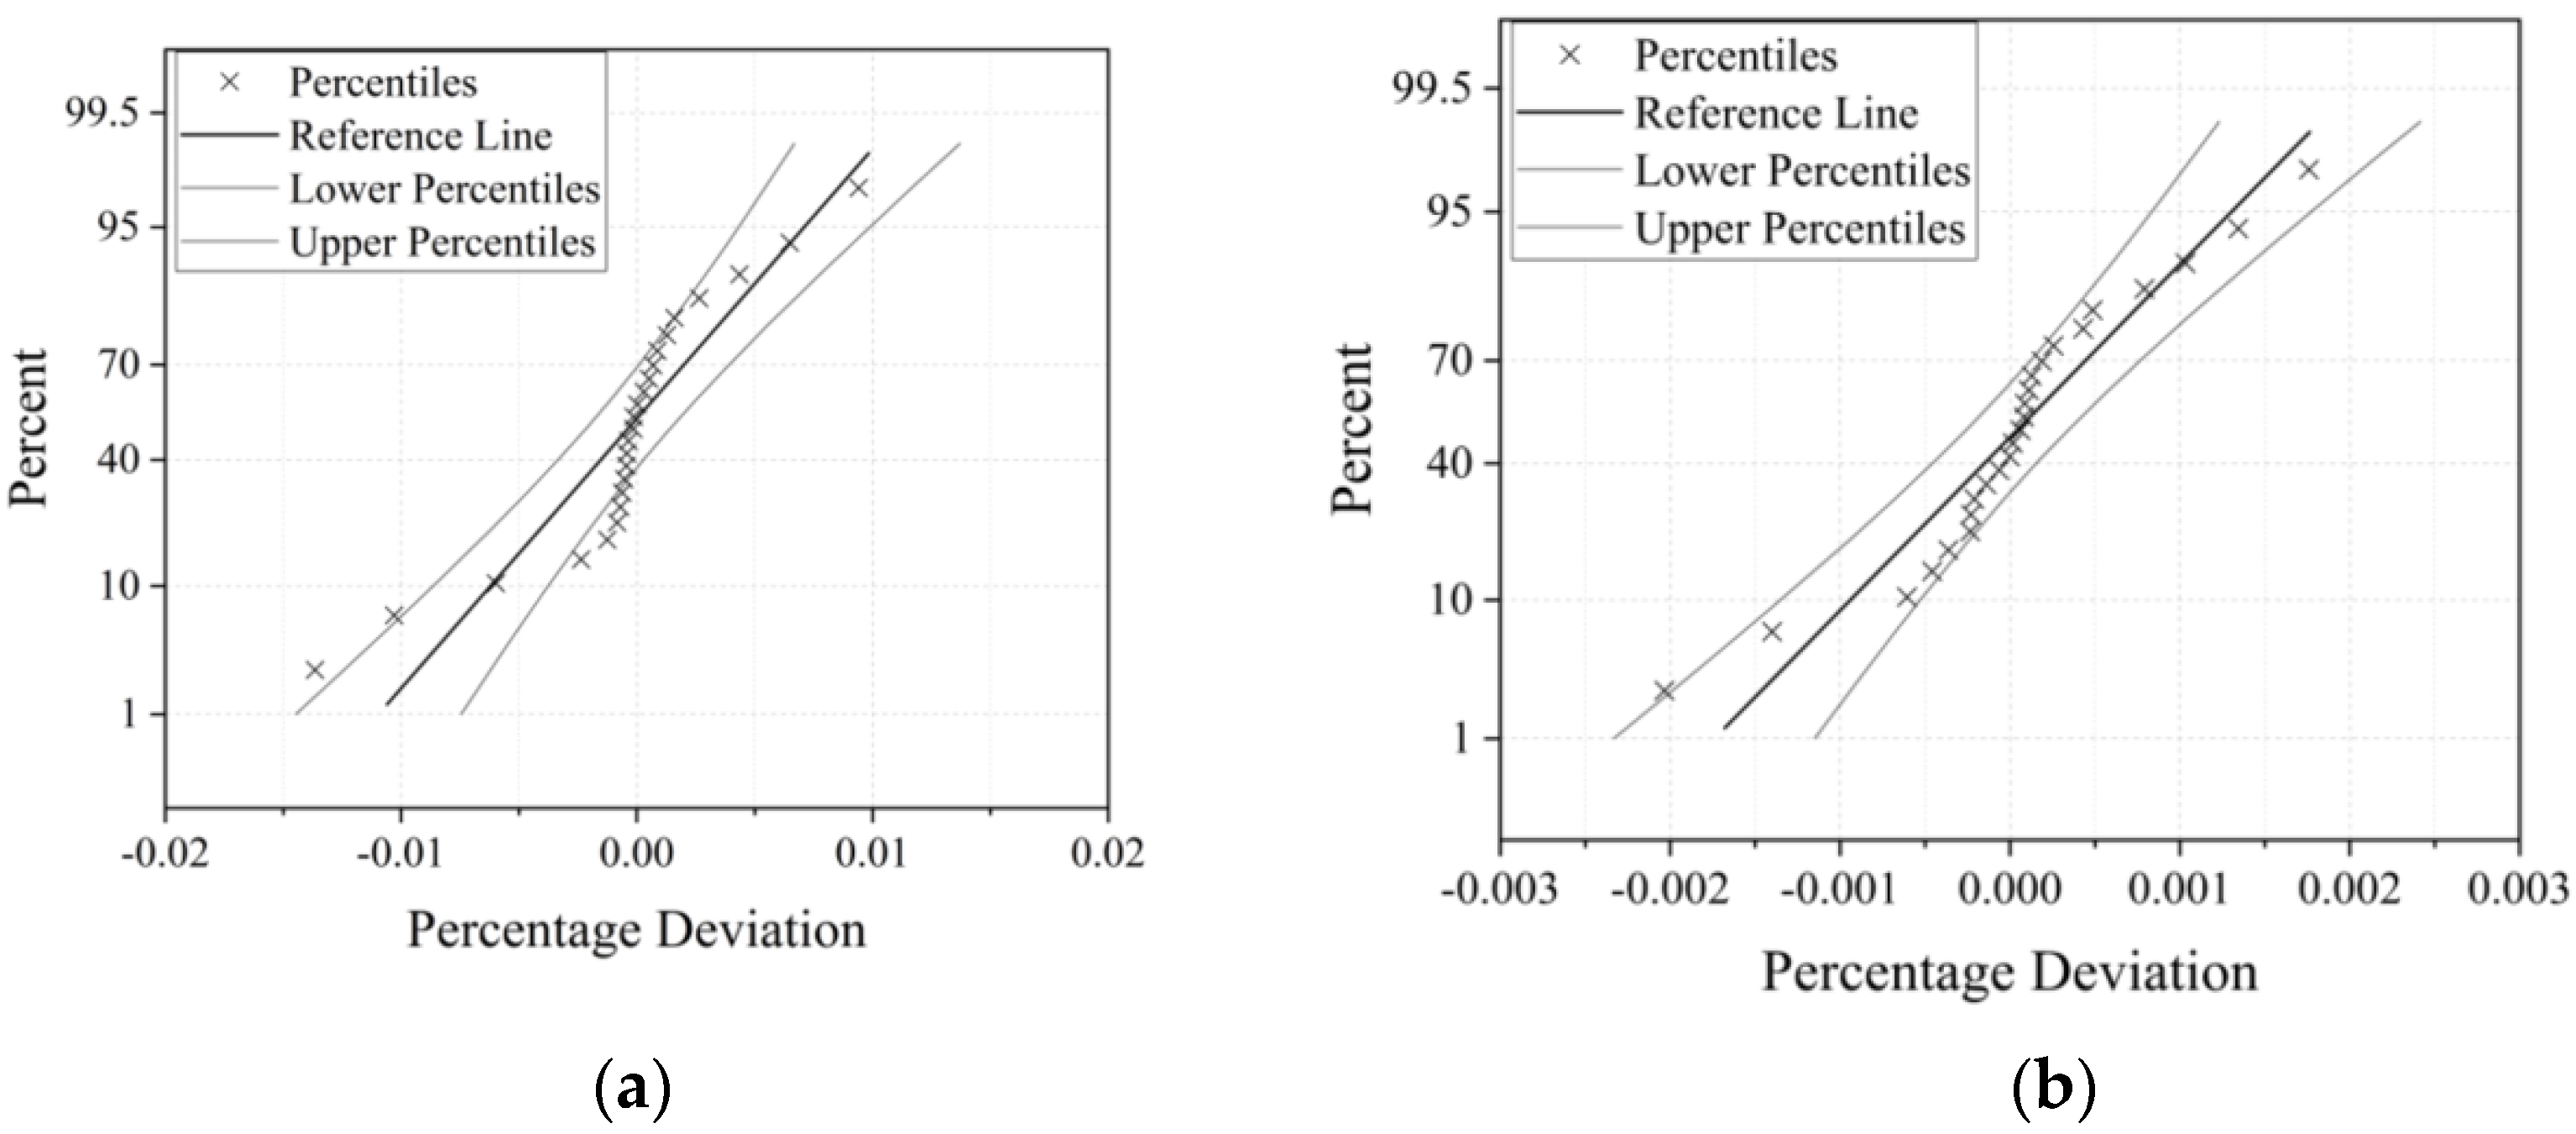
The fitted surfaces are evaluated using statistical tools, such as a histogram and a normal probability plot, using the percentage deviation between calculated and predicted values as indicators. The data points used were the CCD design points with the addition of mid-points to further assess the surface’s lack of fit (evaluation points). A list of all points used for the method’s validation is shown in Table 5. The calculated R-squared value for both surfaces is greater than 0.99, which exhibits a 99% fit. The percentage deviations were plotted in histograms (Figure 18a,b) and normal probability plots (Figure 19a,b), concluding that the prediction model follows a normal distribution and lacks significant statistical noise.
The acceptable design combinations are those that satisfy the FoS requirement for both compressive and shear buckling, as shown in Figure 17a,b respectively.
Having restricted the acceptable design combinations using the FoS requirements, the bondline is also checked. The maximum strain energy release rate from the surface’s data points is equal to 0.185 N/mm and 0.085 N/mm for the compressive and shear problem respectively. The combination in which these values occur corresponds to [c, Nplies] = [1, 32] for both models, outputting FoS~1.08 and FoS~1.02 respectively. According to Lee [17], the resistance release rate for Mode-1 dominant conditions is equal to approximately 0.33 N/mm. Thus, since the acquired G is less than GC, the bondline does not fail under Mode-1 failure conditions. It should be noted that Mode-1 dominant fracture was used since it is most probable of occurring than its Mode-2 equivalent, although further mixed-mode requirements could be used if requested.
Finally, the maximum normal stresses developed on the composite patch are equal to 297.6 MPa and 128 MPa for the compression and shear model respectively. Both values are less than the fracture stress and correspond to the combination [c, Nplies] = [0.7, 32] for both models, outputting FoS~1.03 and FoS~1.01 respectively.
It should be noted that partial safety factors for the assessment of the bondline and composite strength can be defined in addition to the primary FoS for the buckling restoration. These safety margins can be respectively defined as
The safety factors obtained from this case study for the compressive buckling are FoSbondline = 1.78 and FoSfracture = 1.18, and for the shear buckling FoSbondline = 3.87 and FoSfracture = 2.75. If additional requirements for FoSbondline = 2 or FoSfracture = 1.4 were applied, then although the analysis showed adequate buckling restoration, some solutions would not be acceptable under the above evaluation criteria.
6. Concluding Remarks
This study examined the existing problem of material wastage due to corrosion and the risks of buckling it could potentially lead to in the case of a stiffened panel. In order to treat this damage, the alternative repair method of composite patches was proposed. The main goal was to present the theoretical background of the plate’s and patch’s mechanics that could restore the structure’s initial buckling strength, and demonstrate its results through a numerical application. The results proved that such a repair practice is capable of rehabilitating the buckling capacity of a corroded marine plate against compressive and shear loads.
However, assumptions were made in order to minimize the problem’s multi-parametrical nature. Thus, further studies should be made on the proposed methodology, introducing more parameters. For instance, the geometry and the adhesive could be modeled more accurately with solid elements to better capture the results of the applied buckling stress. Furthermore, since the linear analysis conducted over-engineered the problem, due to the post-buckling effect being ignored, a non-linear analysis should be performed to identify this effect. Thus, the proposed methodology would be enriched, and the model would more accurately represent reality.
Finally, it should be understood that even with the actions suggested for further improvement on the problem’s analysis, real-world testing must be conducted. Installation and operating conditions should be accounted for since they also dictate the structural response of the repaired plate under examination. Hence, the next step after developing the analyses should be laboratory testing and then employing the method to existing damages dealt on marine structures. Only after years of monitoring the effects of the repair methodology will the concluding remarks be set, and perhaps will the technique be established as a proposed repair for primary and non-primary supporting members.
Author Contributions
Conceptualization, K.N.A.; Formal analysis, N.K.; Investigation, N.K.; Methodology, K.N.A. and N.K.; Supervision, K.N.A.; Writing–original draft, N.K.; Writing–review & editing, K.N.A. All authors have read and agreed to the published version of the manuscript.
Funding
This research received no external funding.
Conflicts of Interest
The authors declare no conflict of interest.
References
- IACS. Guidelines for Surveys, Assessment and Repair of Hull Structures—Container Ships, Rev.1; Witherbys Publishing: Livingstone, UK, 2018. [Google Scholar]
- Anyfantis, K.N. Preliminary design assessment of an alternative repair method for corroded shear panels in ship hull structures. Ocean Eng. 2019, 188, 106323. [Google Scholar] [CrossRef]
- Karatzas, V.A. Assessment and Design of Composite Patch Repairing in Marine Applications. Ph.D. Thesis, National Technical University of Athens, Athens, Greece, 2016. [Google Scholar]
- Karatzas, V.A.; Kotsidis, E.A.; Tsouvalis, N.G. Experimental fatigue study of composite patch repaired steel plates with cracks. Appl. Compos. Mater. 2015, 22, 507–523. [Google Scholar] [CrossRef]
- BV. Adhesive Joints and Patch Repair; Guidance Note NI613DTR00E; BV: Paris, France, 2015. [Google Scholar]
- DNV. Design, Fabrication, Operation and Qualification of Bonded Repair of Steel Structures; Recommended Practice DNVGL-RP-C301; DNV: Belum, Norwegen, 2015. [Google Scholar]
- ASME. Repair of Pressure Equipment and Piping; ASME PCC-2-2011; The American Society of Mechanical Engineers: New York, NY, USA, 2011. [Google Scholar]
- Hashim, S.; Berggreen, C.; Tsouvalis, N.; McGeorge, D.; Chirica, I.; Moore, P.; Boyd, S.; Nisar, J.; Anyfantis, K.; Misirlis, K.; et al. Fabrication, testing and analysis of steel/composite DLS adhesive joints. Ships Offshore Struct. 2011, 6, 115–126. [Google Scholar] [CrossRef]
- Aabid, A.; Hrairi, M.; Mohamed Ali, J.S. Optimization of composite patch repair for center-cracked rectangular plate using design of experiments method. Mater. Today Proc. 2020, 27, 1713–1719. [Google Scholar] [CrossRef]
- Turan, K. Buckling behavior of adhesively patch-repaired composite plates. J. Compos. Mater. 2013, 48, 3253–3261. [Google Scholar] [CrossRef]
- Lloyd’s Register. Rules and Regulations for the Classification of Ships; Lloyd’s Register: London, UK, 2016. [Google Scholar]
- Kollar, L.; Springer, G. Mechanics of Composite Structures; Cambridge University Press: Cambridge, UK, 2003. [Google Scholar]
- Timoshenko, S.; Gere, J. Theory of elastic stability, International Student Edition, 2nd ed.; McGraw-Hill: New York, NY, USA, 1985. [Google Scholar]
- Hughes, O.; Paik, J. Ship Structural Analysis and Design; SNAME: Jersey City, NJ, USA, 2010. [Google Scholar]
- Anyfantis, K.; Stavropoulos, P.; Chryssolouris, G. Fracture Mechanics Based Assessment of Manufacturing Defects Laying at the Edge of CFRP-Metal Bondlines; CrossMark: Plano, TX, USA, 2018. [Google Scholar]
- Zhang, S. A review and study on ultimate strength of steel plates and stiffened panels in axial compression. Ships Offshore Struct. 2016, 11, 81–91. [Google Scholar] [CrossRef]
- Lee, M.J.; Kim, W.S.; Jang, C.J.; Kim, K.H.; Cho, T.M.; Lee, B.C.; Lee, J.J. Analysis and Simulation of the Failure Characteristic of a Single Leg Bending Joint with a Micro-Patterned Surface. J. Adhes. 2011, 87, 826–841. [Google Scholar] [CrossRef]
Figure 1.
IACS [1] recommended repair practice for buckling caused to a part of a transverse bulkhead (in cargo hold region) possibly caused by heavy general corrosion.
Figure 1.
IACS [1] recommended repair practice for buckling caused to a part of a transverse bulkhead (in cargo hold region) possibly caused by heavy general corrosion.

Figure 2.
Schematic of a cargo hold’s compartments and supporting members (Common Structural Rules for Bulk Carriers and Oil Tankers, January 2019).
Figure 2.
Schematic of a cargo hold’s compartments and supporting members (Common Structural Rules for Bulk Carriers and Oil Tankers, January 2019).

Figure 3.
Possible shape forms that the repair patch can have: (a) rectangular, (b) ellipsoid, (c) octagonal horizontal, (d) octagonal vertical.
Figure 3.
Possible shape forms that the repair patch can have: (a) rectangular, (b) ellipsoid, (c) octagonal horizontal, (d) octagonal vertical.

Figure 4.
Possible patch configurations: (a) one-sided application (single strap joint) and (b) two-sided application (double strap joint).
Figure 4.
Possible patch configurations: (a) one-sided application (single strap joint) and (b) two-sided application (double strap joint).

Figure 5.
Flowchart illustrating the decision points from the defect detection to the approved repair method.
Figure 5.
Flowchart illustrating the decision points from the defect detection to the approved repair method.

Figure 6.
Flowchart of the proposed preliminary design methodology.

Figure 7.
(a) Critical compressive buckling coefficient with respect to an increasing aspect ratio and (b) the first eigenform of a long plate with aspect ratio equal to 5.
Figure 7.
(a) Critical compressive buckling coefficient with respect to an increasing aspect ratio and (b) the first eigenform of a long plate with aspect ratio equal to 5.

Figure 8.
Anelastic buckling corrections for compressive buckling. The same curve applies to shear buckling.
Figure 8.
Anelastic buckling corrections for compressive buckling. The same curve applies to shear buckling.

Figure 9.
Design schematic of a rectangular composite patch applied to a metal plate.

Figure 10.
Two-dimensional sketch of the geometry’s (a) full and (b) quarter model and its boundary conditions for the case of compressive buckling.
Figure 10.
Two-dimensional sketch of the geometry’s (a) full and (b) quarter model and its boundary conditions for the case of compressive buckling.

Figure 11.
(a) Two-dimensional sketch and (b) three-dimensional representation of the geometry’s model and its boundary conditions for the case of shear buckling.
Figure 11.
(a) Two-dimensional sketch and (b) three-dimensional representation of the geometry’s model and its boundary conditions for the case of shear buckling.

Figure 12.
Design points indicated by a CCF.

Figure 13.
Mesh convergence test for the (a) compression and (b) shear buckling model.

Figure 14.
OFAT analysis for determining the repair’s optimal combination of material and configuration (SS: single strap, DS: double strap) for the (a) compression and (b) shear buckling model.
Figure 14.
OFAT analysis for determining the repair’s optimal combination of material and configuration (SS: single strap, DS: double strap) for the (a) compression and (b) shear buckling model.

Figure 15.
OFAT analysis for determining the repair’s optimal shape (compression model).

Figure 16.
Generated response surface from a polynomial fit to the CCD data points for (a) compressive and (b) shear buckling.
Figure 16.
Generated response surface from a polynomial fit to the CCD data points for (a) compressive and (b) shear buckling.

Figure 17.
2D contour plot of the generated response surface for (a) compressive and (b) shear buckling.
Figure 17.
2D contour plot of the generated response surface for (a) compressive and (b) shear buckling.

Figure 18.
Histogram of the percentage deviation between experimental and predicted values for (a) compressive and (b) shear buckling.
Figure 18.
Histogram of the percentage deviation between experimental and predicted values for (a) compressive and (b) shear buckling.

Figure 19.
Normal probability plot, with 95% confidence levels, of the percentage deviation between experimental and predicted values for (a) compressive and (b) shear buckling.
Figure 19.
Normal probability plot, with 95% confidence levels, of the percentage deviation between experimental and predicted values for (a) compressive and (b) shear buckling.


Table 1.
Material properties for steel, CFRP, and GFRP.
| Property | Steel Grade ‘AH32′ 1 | CFRP 2,3 | GFRP 3 |
|---|---|---|---|
| Young’s modulus of elasticity | 206 GPa | 42.95 GPa | 213.4 GPa |
| Poisson’s ratio | 0.3 | 0.3 | 0.3 |
| Yield/Fracture Stress | 315 MPa | 352 MPa | 549 MPa |
Table 2.
Metallic damaged plate’s properties.
| Plate’s Property | Symbol | Value | Unit |
|---|---|---|---|
| Material | - | Grade ‘AH32’ Steel | - |
| Length | am | 2250 | mm |
| Width | bm | 900 | mm |
| Intact thickness | tm,intact | 20 | mm |
| Corrosion | - | 5 | % |
| Corroded thickness | tm,corroded | 19 | mm |
| FoS requirement | FoSreq | 1.0 | - |
Table 3.
Patch’s properties evaluated through OFAT analyses.
| Patch’s Property | Options | x | y |
|---|---|---|---|
| Material | CFRP/GFRP | No. Plies | FoS |
| Configuration | One-Sided/Two-Sided | ||
| Shape | Rectangular/Ellipsoid/Octagonal |
Table 4.
CCD design points.
| Factor | Name | Low Level (−) | Center (0) | High Level (+) |
|---|---|---|---|---|
| x1 | Coverage (c) | 40% | 70% | 100% |
| x2 | No. Plies (Nplies) | 4 | 18 | 32 |
Table 5.
Design and evaluation points used in the response surface.
| Factor | Name | D + E 1 | E 2 | D + E 1 | E 2 | D + E 1 |
|---|---|---|---|---|---|---|
| x1 | Coverage (c) | 40% | 55% | 70% | 85% | 100% |
| x2 | No. Plies (Nplies) | 4 | 11 | 18 | 25 | 32 |
1 Design and evaluation point, 2 Evaluation point.
Publisher’s Note: MDPI stays neutral with regard to jurisdictional claims in published maps and institutional affiliations. |
© 2021 by the authors. Licensee MDPI, Basel, Switzerland. This article is an open access article distributed under the terms and conditions of the Creative Commons Attribution (CC BY) license (https://creativecommons.org/licenses/by/4.0/).
Share and Cite
MDPI and ACS Style
Kallitsis, N.; Anyfantis, K.N. Buckling Strength Assessment of Composite Patch Repair Used for the Rehabilitation of Corroded Marine Plates. Appl. Mech. 2021, 2, 482-500. https://0-doi-org.brum.beds.ac.uk/10.3390/applmech2030027
AMA Style
Kallitsis N, Anyfantis KN. Buckling Strength Assessment of Composite Patch Repair Used for the Rehabilitation of Corroded Marine Plates. Applied Mechanics. 2021; 2(3):482-500. https://0-doi-org.brum.beds.ac.uk/10.3390/applmech2030027
Chicago/Turabian StyleKallitsis, Nikos, and Konstantinos N. Anyfantis. 2021. "Buckling Strength Assessment of Composite Patch Repair Used for the Rehabilitation of Corroded Marine Plates" Applied Mechanics 2, no. 3: 482-500. https://0-doi-org.brum.beds.ac.uk/10.3390/applmech2030027