1. Introduction
Heart rate and its variations are directly controlled by the autonomic nervous system (ANS). Sympathetic and parasympathetic activity regulates baseline heart rate and the differences between subsequent beats. Differences in beat-to-beat intervals may be detected and quantified with the measurement of heart rate variability (HRV) [
1]. Thus, HRV reflects cardiac autonomic regulation and provides accurate evaluation of functioning and balance of the ANS.
One of the first clinical applications of HRV was, 30 years ago, the non-invasive risk stratification after acute myocardial infarction, based on the evidence that depressed HRV was a predictor of mortality and arrhythmic complications [
2,
3]. In the 1990s, HRV was also used as an assessment of diabetic neuropathy, as early subclinical autonomic dysfunction could be detected by HRV measurement [
4,
5]. At present, cardiology and diabetology rely on different kinds of tests but HRV is widely used in sport physiology. In practice, HRV represents a tool for the monitoring of individual response to physical exercise in sport medicine and finds large application in professional athletes [
6]. Applications of HRV include the assessment of individual response to physical exercise (adaptation/maladaptation), evaluation of training efficacy, evaluation of recovery after activities and rest periods and programming of training and target workload [
7]. A role of HRV in the prevention of muscle injuries has been proposed for its capacity to identify overtraining conditions. In this setting, HRV is used to monitor training loads and guide coaches to individually prescribe training sessions and rest periods [
8].
Soccer is one of the major fields of application for HRV. Previous studies which have specifically targeted professional soccer players have shown that HRV discriminates athlete’s level, reflects adaptation to training and matches and may be used to guide physical exercise [
9,
10,
11,
12,
13,
14].
The relationship between HRV in professional soccer players and individual performance during competitive matches is yet to be investigated.
1.1. HRV Analysis
HRV can be assessed using a number of methods [
1]. The simplest method to perform are the time domain measures, in which either the instantaneous heart rate at any point in time or the intervals between consecutive QRS complexes (normal-to-normal, NN) are analysed. The most frequently used time domain parameters are:
- -
Standard deviation of all NN intervals (SDNN),
- -
Standard deviation of the averages of NN intervals in all 5 min segments of the entire recording (SDANN) and
- -
Square root of the mean of the sum of the squares of differences between adjacent NN intervals (rMSSD).
The complete formula for rMSSD is:
where
RR represents the interval between two subsequent QRS complexes.
The other possible methods to assess HRV are the frequency domain, which uses a power spectral density analysis of tachogram (with nonparametric or parametric methods), and nonlinear dynamics, which uses different and complex analyses, including Poincarè sections, low-dimensions attractor plots and singular value decomposition. However, the application of nonlinear techniques to biomedical data is actually very limited as standards are lacking, and the full scope of these methods cannot be assessed [
1]. Over decades of investigations, a number of new methodologies have been proposed and tested but their success has been rather limited [
15].
The most commonly used HRV parameter in sport physiology is rMSSD or its natural logarithm as it is the method with the most solid evidence from literature and offers the advantages of ease of use and interpretation [
10,
11,
13,
14].
1.2. Devices
The practical assessment of HRV relies on ECG recording over time. For decades, 12-lead ECG-Holter monitoring was the preferred source of data. Commonly available software for ECG-Holter analysis provide an automated analysis of time domain and frequency domain parameters. Furthermore, standard devices for arrhythmia detection, such as external loop recorders, mobile cardiac telemetry and patch/vest/belt recorders, can easily provide HRV analyses [
16]. The only requirement for these devices is that they allow continuous monitoring and not a simple registration of “spot” alarm events. With progressive technologic advancement and growing interest, several novel devices specifically focused on HRV have now become available, and 12-, 3- or single-lead ECG recordings can be obtained with these dedicated portable devices. Furthermore, because of the strict association between electrical and contractile function in physiological condition, for the purpose of HRV analysis, photoplethysmography reflects cardiac activity as well as electrocardiography. Therefore, fingertip devices with photo diode sensors for blood flow are reliable [
17]. Wearable wrist bands providing continuous monitoring are also available [
18]. One of the latest novelties is a wearable ring with a photoplethysmogram, which integrates daily physical activity and nocturnal cardiovascular measurements, assessing heart rate and HRV [
19]. On the same basis of plethysmography reliability, smartwatches are effective in HRV assessment as well as single-lead recordings [
20]. Theoretically, commonly available new-generation smartphones could provide similar analyses.
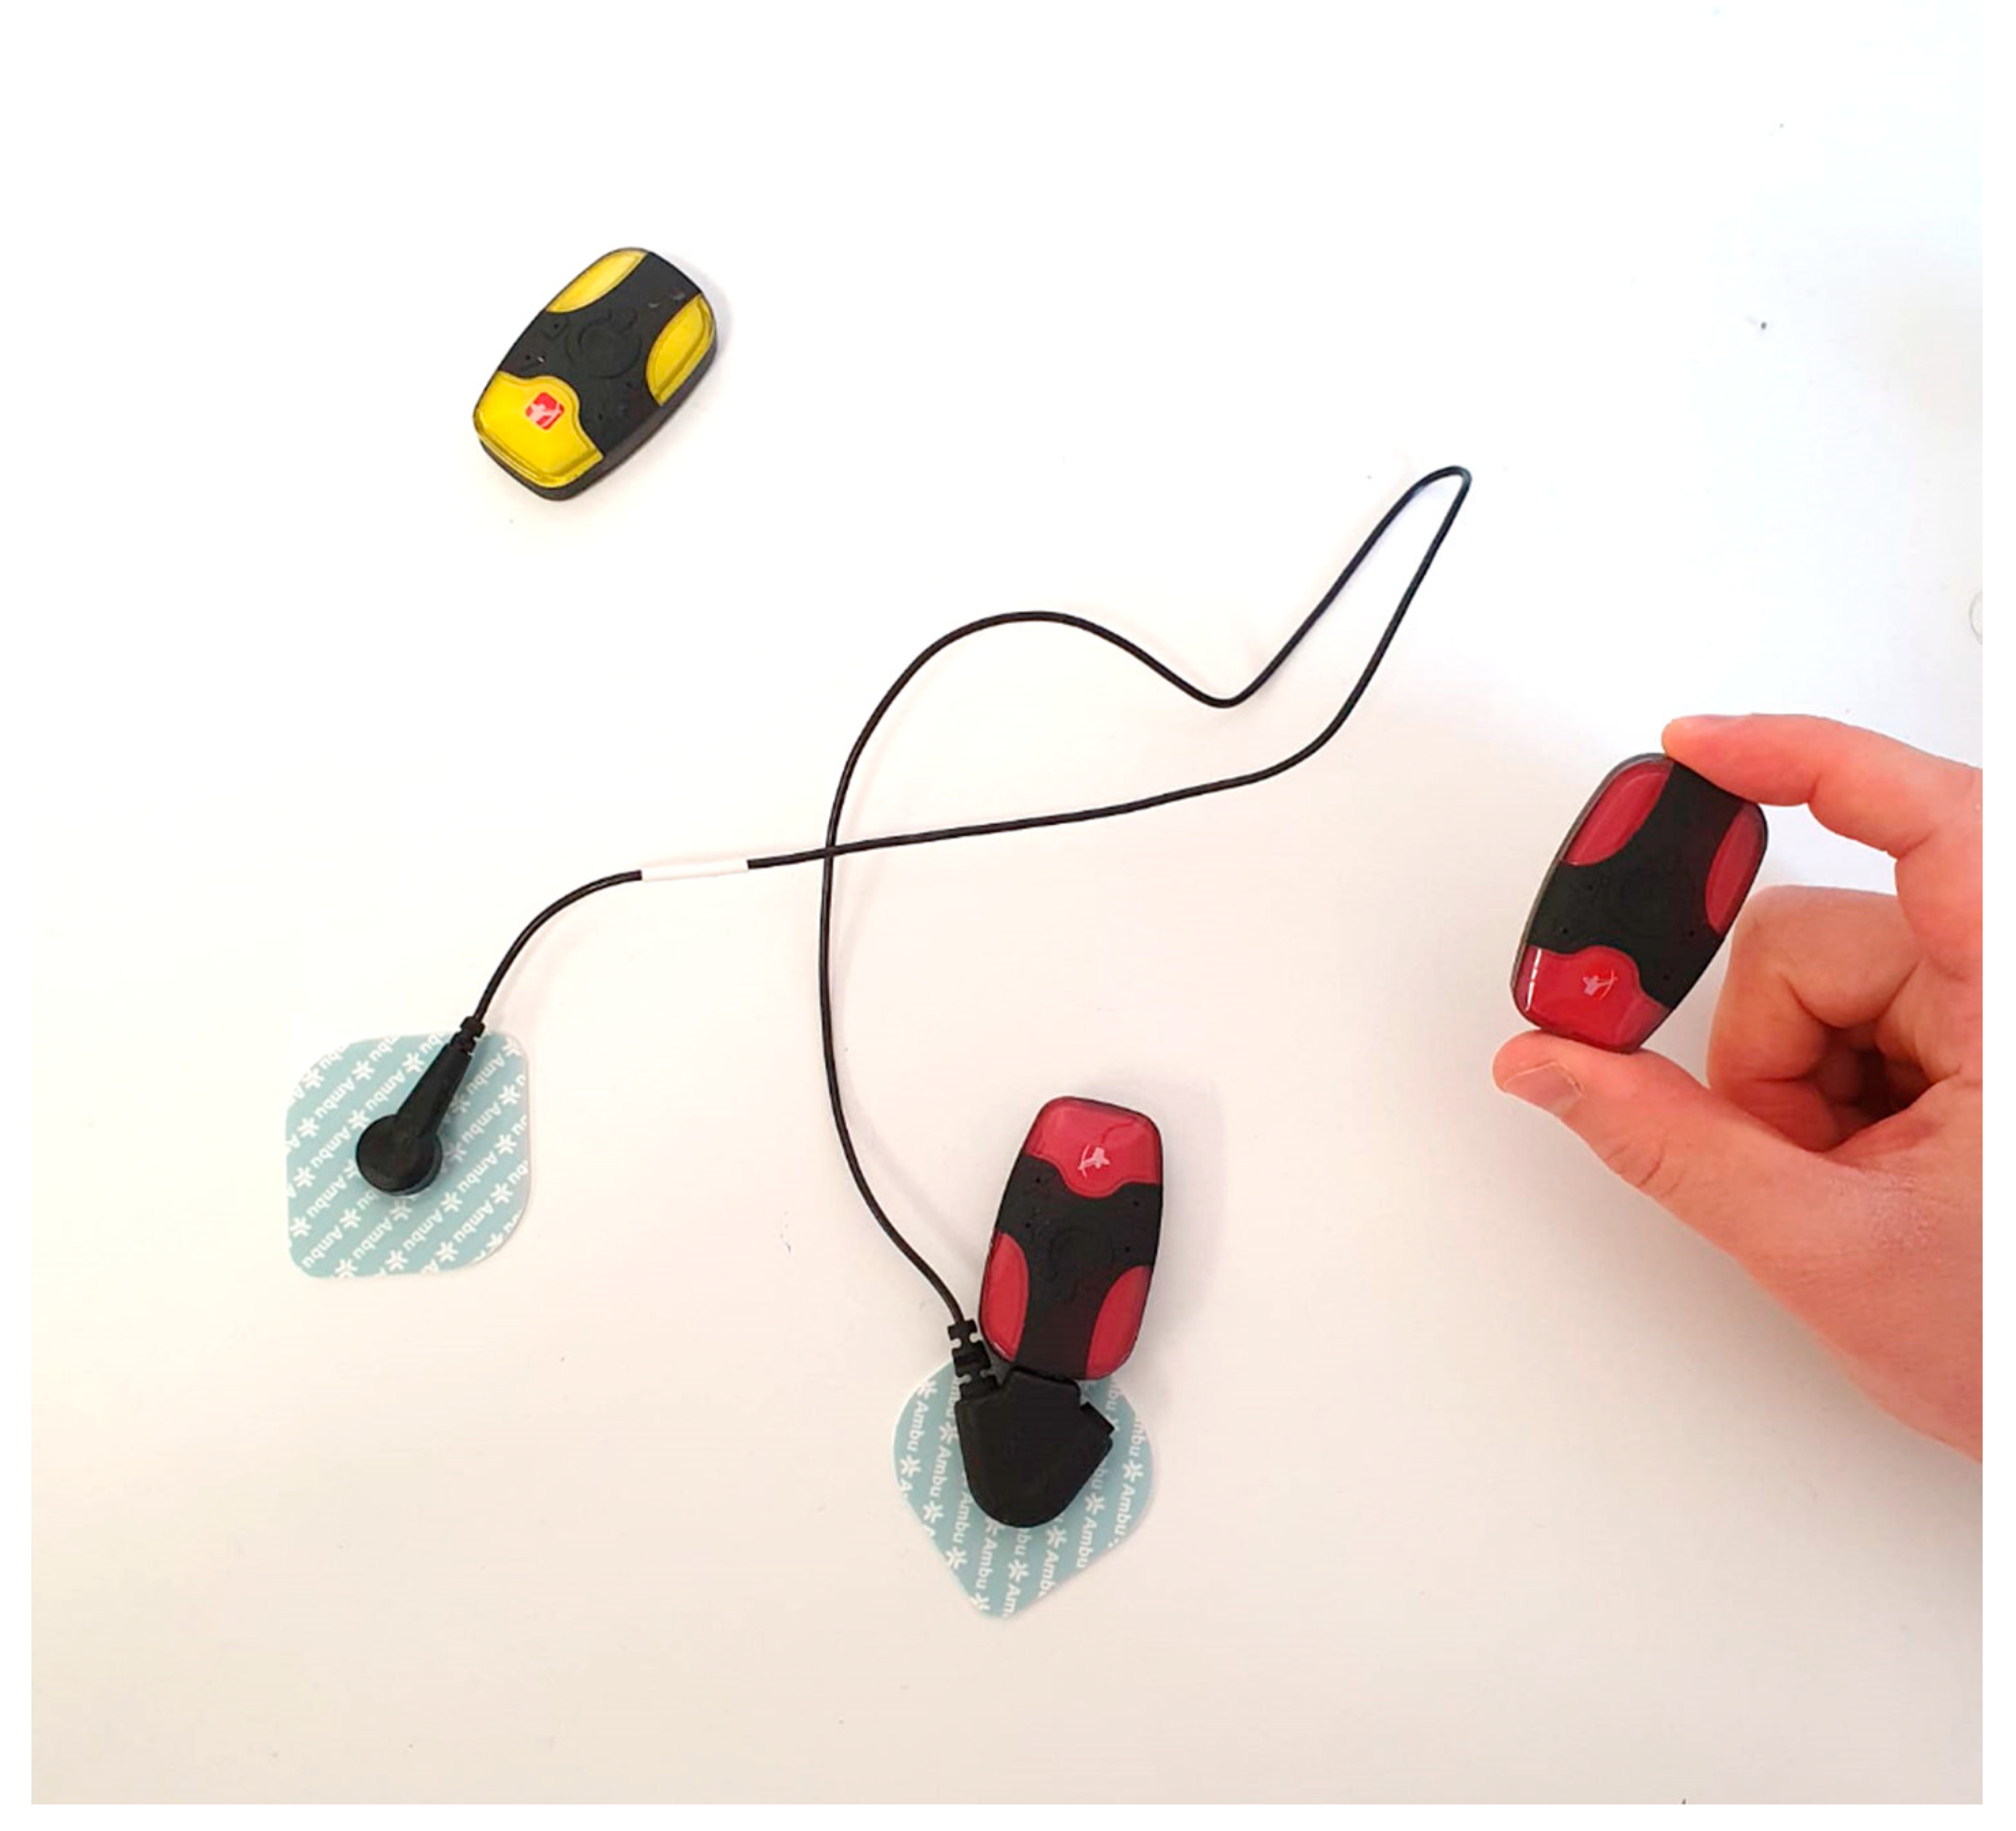
The Bittium Faros
TM device (Bittium Corporation, Finland) is an innovative tool for ECG monitoring and has been specifically proposed for HRV assessment (
Figure 1). Its advantages are its ease of use, small dimensions and light weight. Two models are available: The Bittium Faros
TM 180, which provides a single-lead recording, and the Bittium Faros
TM 360, which provides three-lead recording. However, for the assessment of HRV, there is no difference in traces obtained with single- or three-lead ECG.
In terms of recording duration, several different methods and several monitoring schemes have been proposed in different fields of application. Full 24 h monitoring presented better accuracy, but shorter durations also showed good reliability [
21]. In a setting of professional sportsmen, wearable devices providing continuous monitoring are usually not accepted by athletes as they could potentially be hampered during physical exercises. Another concern is that the wearable device may affect sleep quality with consequences during daily physical activity. For obvious reasons, implantable devices are not an option. As a result, in the field of exercise performance, the standard duration of analysis is 5 min. Short 5 min sessions of monitoring are well accepted by athletes and trainers and do not impact physical exercise or rest. The accuracy of short monitoring session analyses is confirmed by evidence that, for example, even when recording duration is longer, a reliable method to assess HRV is to select short segments of few minutes from which the analysis is made [
21]. Ultrashort duration of recording (up to 30 s) has also been proposed and tested, showing good reliability to obtain time domain measures of SDNN and rMSSD [
22]. In professional soccer players, 5 min or 10 min registrations are the preferred source of data for HRV analysis [
9,
11,
13,
14].
The present study aimed to evaluate the relationship between HRV assessed with the Bittium FarosTM device and match performance in a cohort of professional soccer players.
2. Methods
Professional soccer players from one team of the Italian first national league, Serie A, were monitored throughout a period of one season. We performed weekly sessions of HRV monitoring at the time of the beginning of training session. We also collected data of player individual performance during competitive matches.
The purpose of the empirical analysis was to investigate whether or not the individual level of rMSSD was associated to the performance variables.
2.1. HRV Recordings
HRV was recorded in sessions of 6 min (the first minute of recording was discarded in order to eliminate possible artifacts and the 5 consecutive minutes were used for the analysis). Recordings were obtained once per week, 2 days before the weekly match. Usually, the match day was on Sunday and the recordings were performed on Friday, while Wednesday was the only day in which training sessions were doubled (morning and afternoon). In the case of a different match day, ECG recordings were always obtained 2 days before the match.
ECG recordings were obtained in the morning, after breakfast and immediately before the start of the training session. Players were asked to remain silent, seated and at rest in a quiet room without any source of distraction. Players were not allowed to use mobile phones during the recordings.
Recordings were obtained with the Bittium Faros
TM 180 and Bittium Faros
TM 360 devices (
Figure 1). Analyses of ECG traces were performed by one physician immediately after the recordings to obtain HRV values. Analyses were made with the software Kubios HRV Premium 3.0.2 (Kubios Oy, Finland).
2.2. Questionnaire
A simple two-item questionnaire was administered weekly at the time of HRV measurement. The questions were:
- (1)
“How sleepy do you feel?”
- (2)
“How tired do you feel?”
Athletes were asked to answer each of these questions with a score ranging from 1 to 5, where 1 meant they felt the worst (maximum sleepiness and maximum tiredness) and 5 meant they feel the best (total absence of sleepiness and tiredness).
2.3. Competition Performance
Data regarding competitive matches were collected. For every game played in Italian Serie A, an individual report was officially released by competition organization. In particular, for every player involved in a single match, the available data were the time of game (minutes), total distance covered during game (meters), distance in sprint >25 km/h (meters), distance in high-speed run 20–25 km/h (meters), distance in run 15–20 km/h (meters), distance in jog 6–15 km/h (meters), distance in walk 1–6 km/h (meters), distance in standing 0–1 km/h (meters), number of sprints >25 km/h (number), high-intensity activities >15 km/h (number), high-intensity distance >15 km/h (meters), distance per minute (meters/minute), high-intensity activity >15 km/h per minute (number/minute) and ratio between high- and low-intensity activity (ratio).
2.4. Statistical Analysis
Baseline data were indicated as mean ± standard deviation in the case of continuous variables and as number and percentage in the case of categorical variables.
Person’s r correlation was calculated to measure the association between continuous variables (HRV parameters and questionnaire results).
To relate HRV with performance, we estimated the following model:
where
was our measure of performance: distance covered (at different run velocities) for individual
i at game
t. α was the intercept, which corresponded to the expected value of
Y when
X was 0.
was the rMSSD recorded for each individual
i before game
t, and
was our main parameter of interest. In order to exploit the longitudinal nature of our dataset, we included individual-level fixed effects
, which captured time-invariant personal characteristics of individuals, such as height, age, mass, etc. We also included game-fixed effects
, which accounted for unobserved heterogeneity that varied from game to game but was constant across players, such as the weather during the game, rival teams differences, being home or away and so on. The relationship was therefore studied by means of the Ordinary Least Squares (OLS) method with the fixed-effects method.
To exclude potential confounding factors, we did not include players with less than 45 min of game time and with less than 9 matches played in the analysis.
Statistical analysis was made with Stata 16.1 (StataCorp).
3. Results
During the study period, 27 players were monitored. They were all professional soccer players of the same team, belonging to the first national league of Italy (Serie A).
The mean age was 26.4 years (range 20–36, standard deviation 4.8 years). The mean height was 185.2 ± 7.7 cm and mean weight was 76.5 ± 8.3 kg (
Table 1).
The Bittium FarosTM devices were reliable and easy to use. Any device malfunction was reported. ECG recordings had good quality without artifacts. HRV parameters were quickly available after an analysis requiring few minutes.
Competition data were available for 20 matches during study period. Competition performance parameter that matched with same-week HRV measurements were available for 14 games. The analysed sample was composed of 10 players that played for at least 45 min in at least 9 games out of 14 total games. Overall, the dataset with which the analyses were conducted represented unbalanced panel data, with 121 individual-game observations.
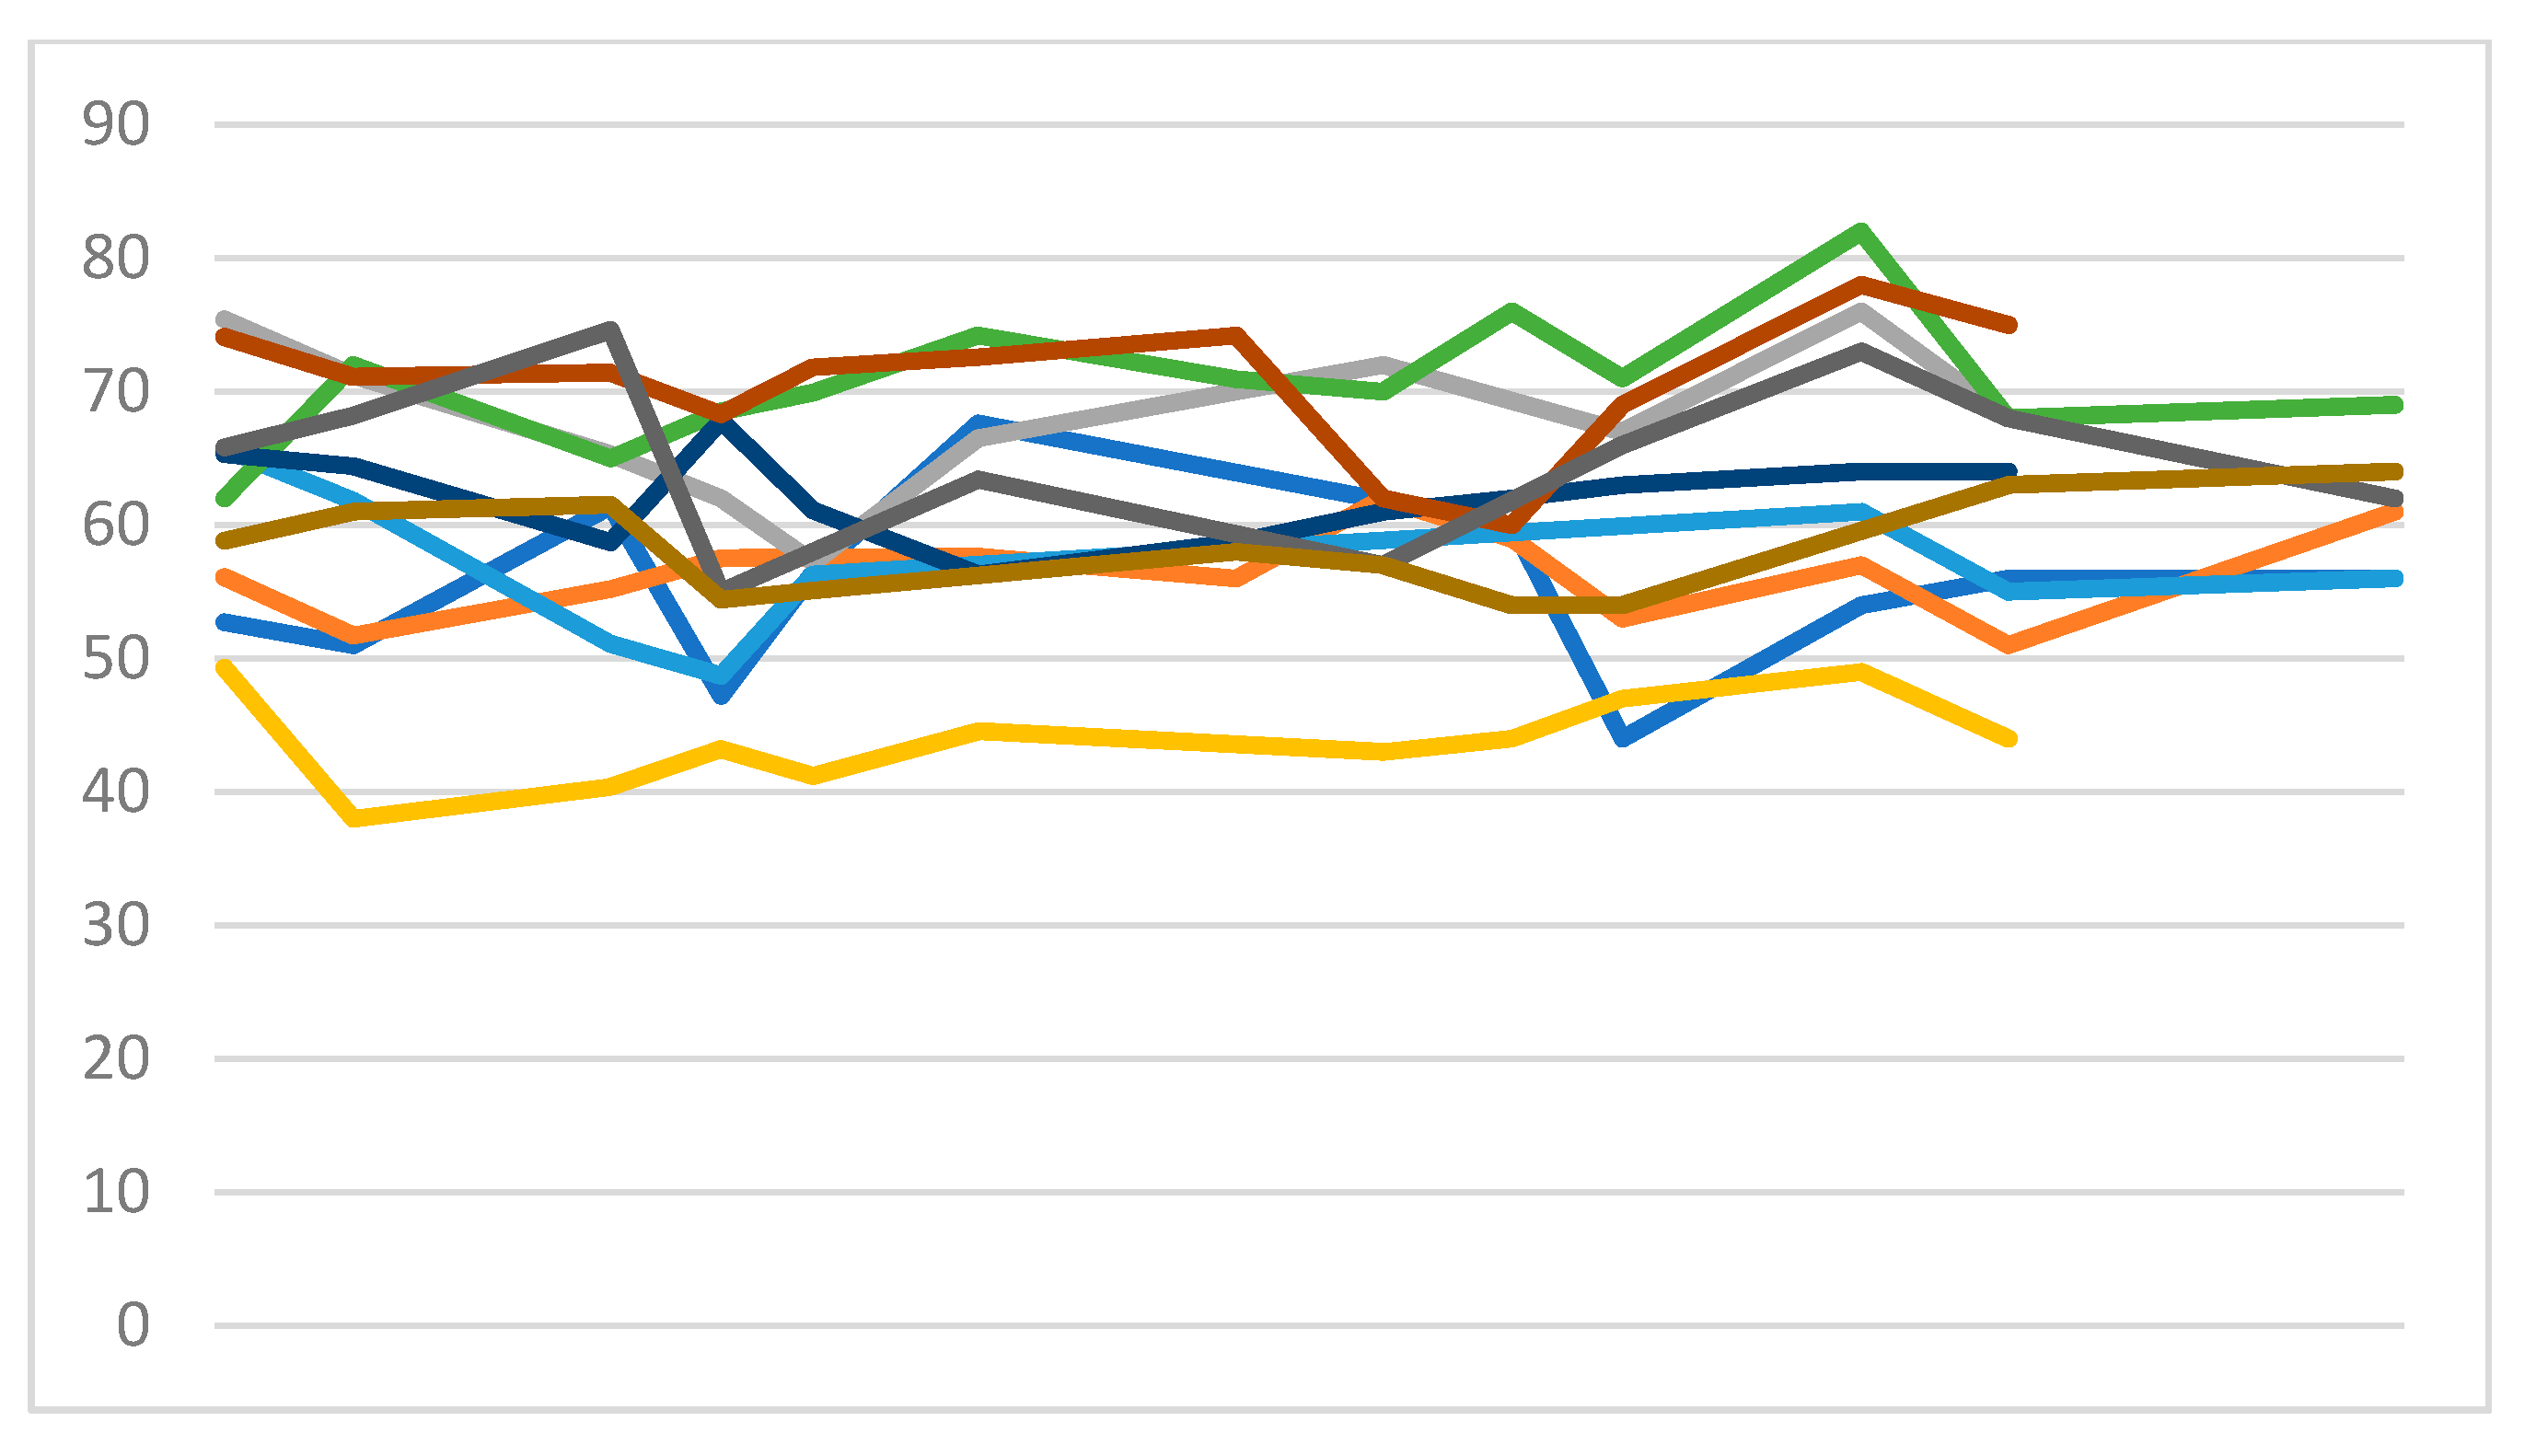
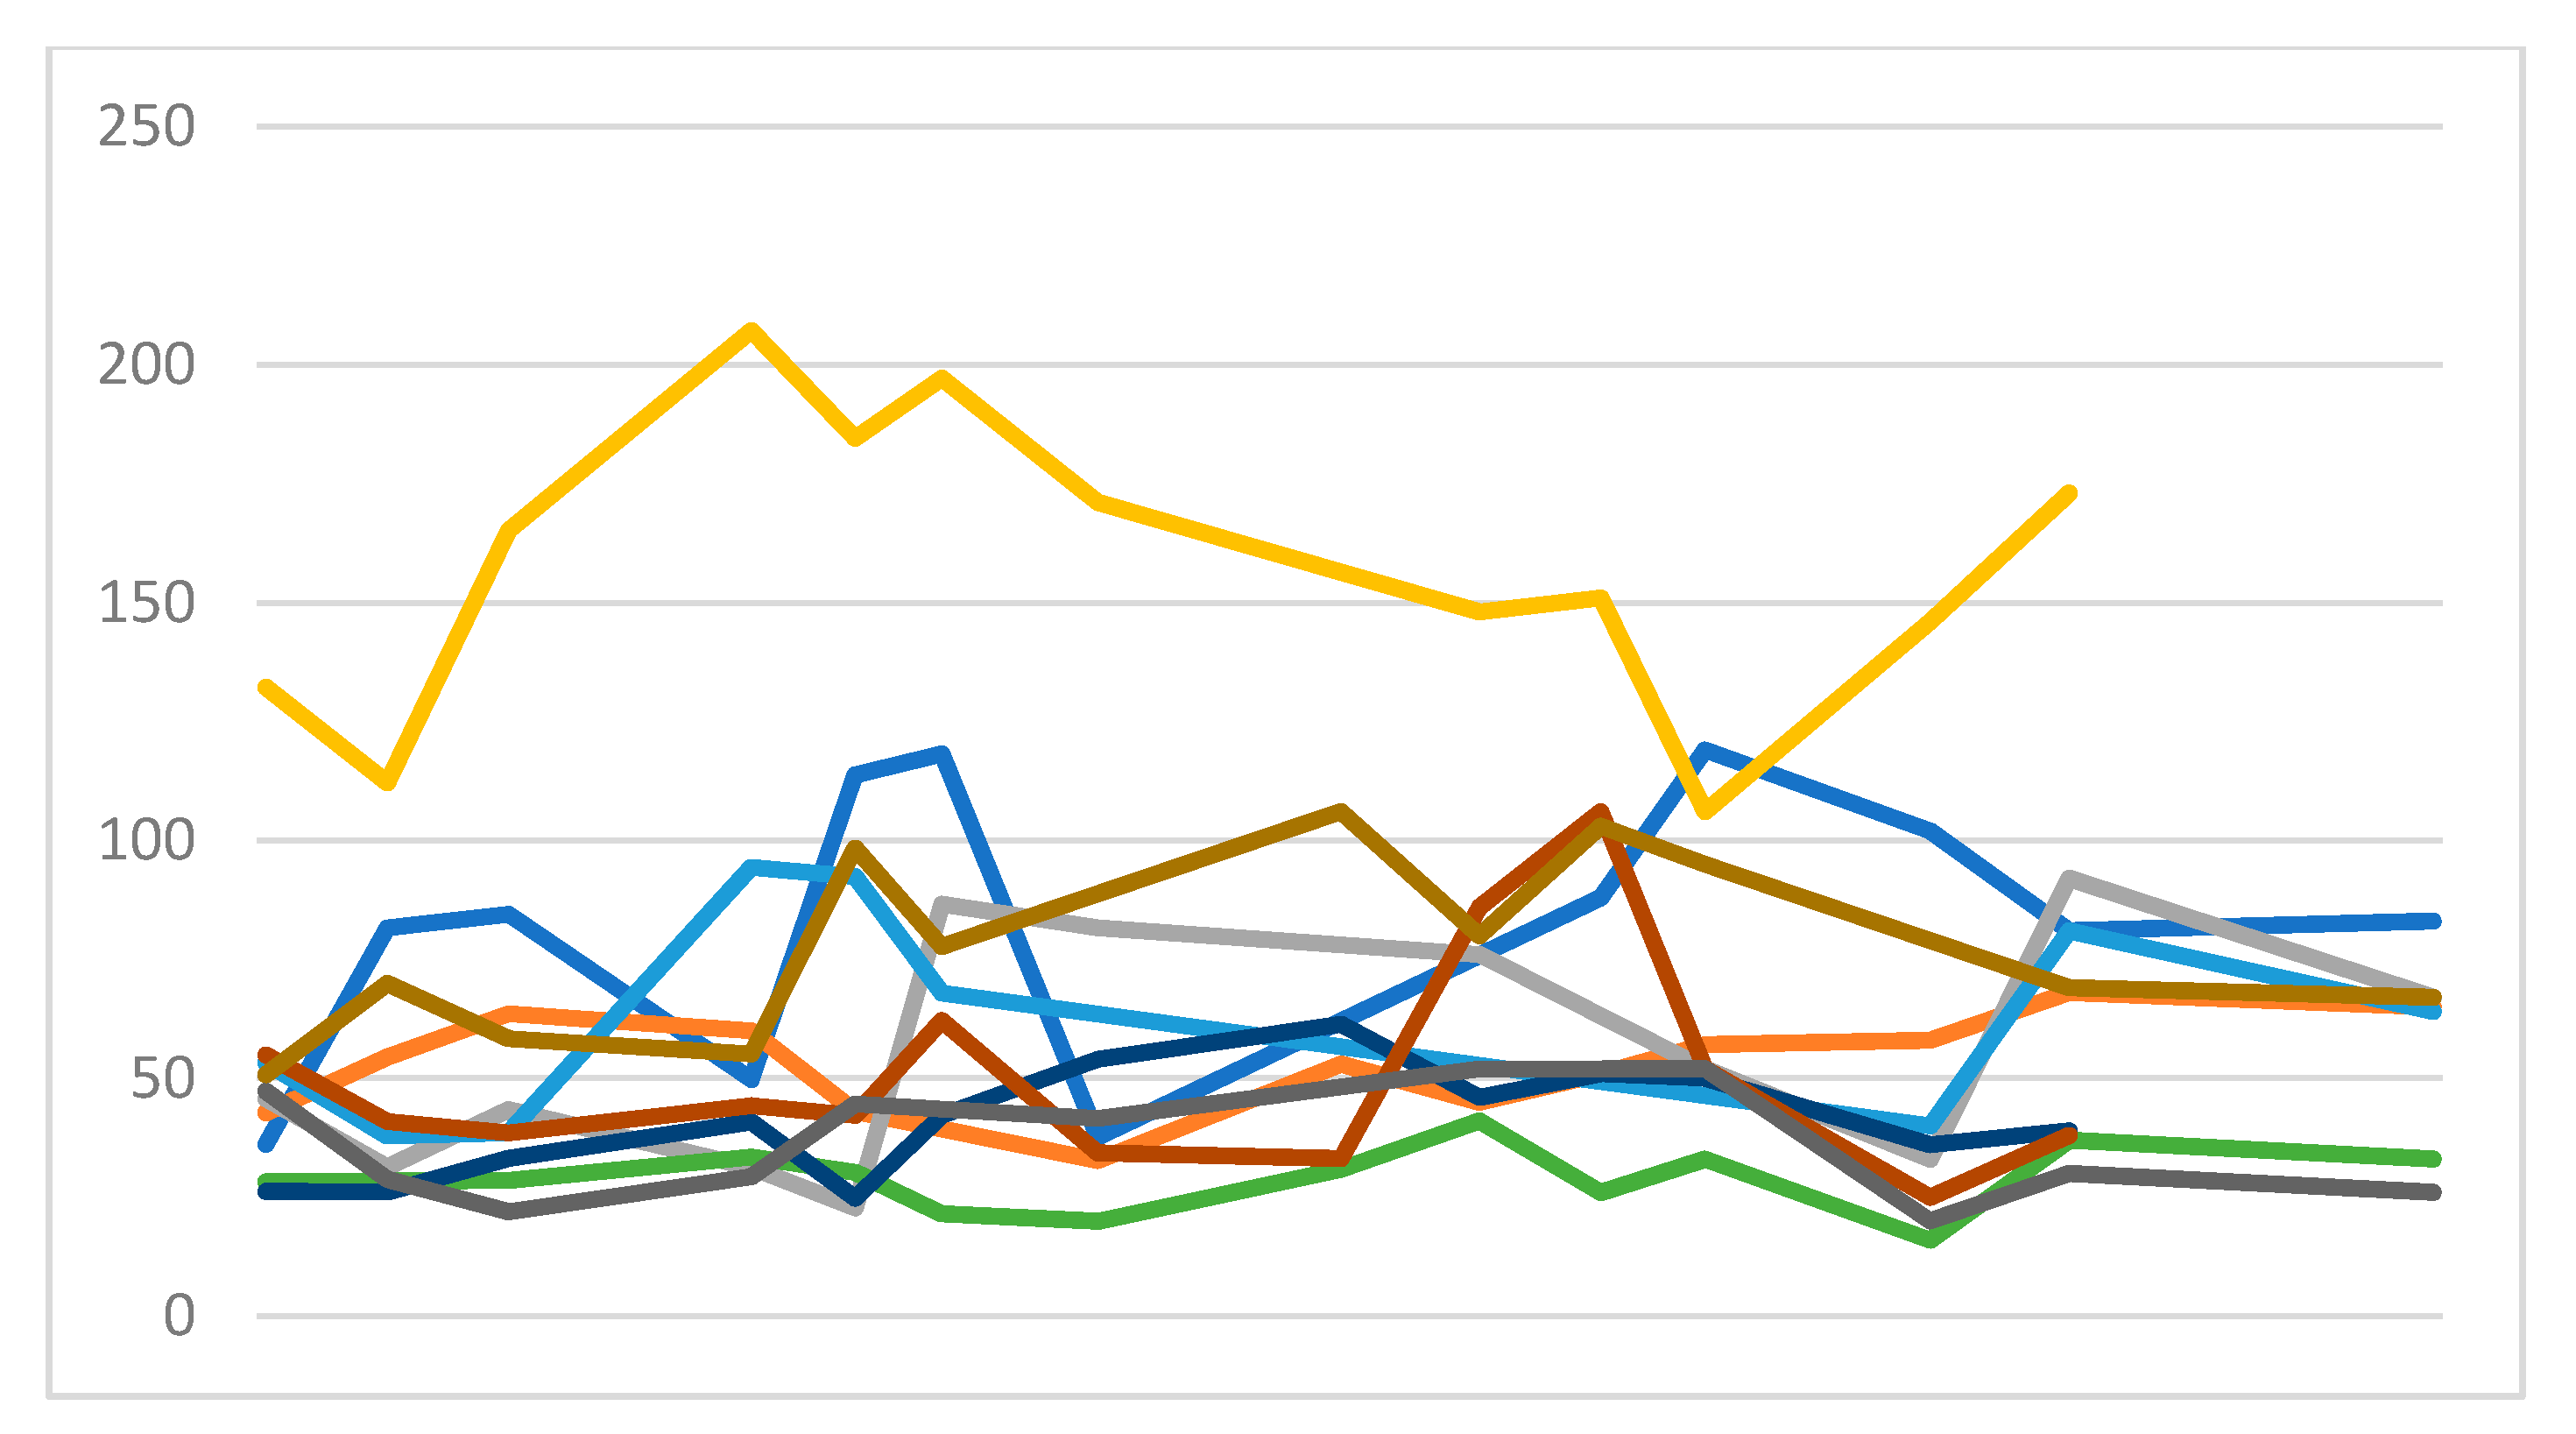
Heart rate data are graphed in
Figure 2, while rMSSD data are graphed in
Figure 3.
Results of the questionnaire about individual perception of sleepiness and tiredness were compared with rMSSD values, showing a low correlation. The r coefficient was −0.14 for sleepiness and 0.12 for tiredness, respectively.
Sport performance data during games are summarized in
Table 2.
Table 3 reports the result of the regression for dependent variables of interest. The rMSSD showed a statistically significant relation with the total distance covered during the game (
p = 0.036). Furthermore, a significant association was also present between rMSSD and distance covered at >15 km/h (
p = 0.039). Conversely, the coefficient of rMSSD did not reach statistical significance when put in relation with the other run parameters, while distance at 20–25 km/h and 15–20 km/h showed
p values < 0.1. Distance per minute and ratio between activities in high- and low-intensity showed no statistically significant correlation with rMSSD.
4. Discussion
Our results show that HRV assessed with a portable device relates with competition performance in professional soccer players. In detail, rMSSD measured 2 days before the match showed an association with the total distance covered during the game and the distance covered in high-intensity run (>15 km/h). To the best of our knowledge, this is the first study showing a relationship between rMSSD and competitive performance during a game in soccer players.
Our findings lead to several potential applications. For example, rMSSD could help to assess if a player is in good or bad physical state in a particular moment. In this setting, rMSSD could also predict if the athlete will do a good physical performance or not. Previous studies have shown the utility of HRV to evaluate overtraining and its practical application in scheduling the training loads [
7,
8]. Our kind of approach could also be useful to identify conditions of overtraining that are at higher risk for muscle injuries and lead to preventive interventions, such as light training loads or rest waiting to recover.
When we considered the distances covered at different speeds, we found that the relationship with rMSSD was not homogeneous. This result should not be surprising. In a setting of a competitive match in a sport like soccer, the speed of run may vary depending on different match conditions, such as the setting of the game (home/away), opponents, partial result, tactics, weather and moment of the season. In our cohort, statistical significance was reached for total distance (p = 0.036) and distance at a speed >15 km/h (p = 0.039). Distances at 15–20 km/h and 20–25 km/h were not significantly related with rMSSD but presented a p < 0.1. We can conclude that, considering our result, there is an evident relationship between rMSSD and run performance.
The device that was used in this analysis was effective and functional. There were no malfunctions in the recordings of ECG traces. We found that HRV assessment in this setting and with this device was reliable. Thank to this device, we can overcome the limitation of the 12-lead ECG, which involves recording times that are too short. We can also overcome the limitation of ECG-Holter monitoring, which is much more invasive in terms of preparation and time of recording. In a setting of professional soccer players, we needed to obtain reliable data with the least invasive method possible. With monitoring sessions of few minutes, there was no impact on physical exercise or rest quality, and the athletes were totally compliant. Considering the plenty of devices available for HRV analysis and the lack of studies comparing different kind of devices, at the present, no conclusions can be drawn as to whether one device is better than another. For example, devices based on photoplethysmography have been proven equally accurate to those based on ECG monitoring and represent a potential alternative [
17,
18,
19]. Further studies in the setting of competitive sports could assess possible discrepancies. However, based on the currently available literature, significant differences are unlikely.
rMSSD values presented interindividual variability, as shown in
Figure 3. This finding is not surprising as the difference between subjects is well known. For a correct interpretation of HRV, one single index in a specific moment has limited value, its variation over time for a single individual according to his personal range is more important. This result confirms that a systematic approach to HRV should rely on measures repeated over time.
We administered a questionnaire at the time of HRV assessment to explore a possible relationship between subjective well-being and rMSSD. The resulting relationship was minimal, if not absent. On this basis, we can affirm that, in such a population, individual subjective perception does not relate with their objectively documented physical state. This evidence further strengthens the role of HRV assessment, which is clearly objective.
5. Limitations
The only HRV parameter that we considered for our analysis was rMSSD. Several other different parameters are available, for example standard deviation of all NN intervals (SDNN) and standard deviation of the averages of NN intervals in all 5-minute segments of the entire recording (SDANN), and their roles in this kind of setting have not been explored. However, in sport physiology, rMSSD (or its natural logarithm) is the most used parameter and the one with the most literature data. Further studies could investigate the other HRV parameters and evaluate whether or not they relate with competitive sport performance.
Our sample size was small, with a total of 121 observations. However, these numbers are consistent with a setting of professional soccer team, are similar to those of other sport physiology studies and, above all, are sufficient to show statistical significance.
An important limitation of this study that requires further research is the lack of an appropriate investigation of the causal relation between rMSSD and performance. Further research should account more precisely for unobserved heterogeneity and omitted variables bias, which goes beyond the time-invariant and cross-unit heterogeneity that we controlled with our methodological framework.
6. Conclusions
In a setting of professional soccer players, rMSSD measured 2 days before the weekly game predicted physical competitive performance and was related to the total distance and distance of high-intensity running covered during the game.
Author Contributions
Conception and design of the work: M.M., F.V., A.B., M.B. Data collection: M.M., F.V., A.B., O.Z., F.M.V. Data analysis and interpretation: M.M., U.R., M.B. Original draft preparation: M.M. Critical revision: M.B., G.G. Supervision: M.B., G.G. All authors have read and agreed to the published version of the manuscript.
Funding
This research did not receive any specific grant from funding agencies in the public, commercial, or not-for-profit sectors.
Institutional Review Board Statement
The study was approved by internal review board.
Acknowledgments
The authors would like to thank Società Polisportiva Ars et Labor (SPAL), the technical staff, the medical staff and all the players of season 2018/2019 for support and participation in this study.
Conflicts of Interest
The authors declare no conflict of interest.
References
- Electrophysiology TF of the ES. Heart Rate Variability. Circulation 1996, 93, 1043–1065. [Google Scholar] [CrossRef] [Green Version]
- Casolo, G.C.; Stroder, P.; Signorini, C.; Calzolari, F.; Zucchini, M.; Balli, E.; Sulla, A.; Lazzerini, S. Heart rate variability during the acute phase of myocardial infarction. Circulation 1992, 85, 2073–2079. [Google Scholar] [CrossRef] [PubMed] [Green Version]
- Bigger, J.T.; Fleiss, J.L.; Rolnitzky, L.M.; Steinman, R.C. Frequency domain measures of heart period variability to assess risk late after myocardial infarction. J. Am. Coll. Cardiol. 1993, 21, 729–736. [Google Scholar] [CrossRef] [Green Version]
- Malpas, S.C.; Maling, T.J.B. Heart-rate variability and cardiac autonomic function in diabetes. Diabetes 1990, 39, 1177–1181. [Google Scholar] [CrossRef]
- Bellavere, F.; Balzani, I.; De Masi, G.; Carraro, M.; Carenza, P.; Cobelli, C.; Thomaseth, K. Power spectral analysis of heart-rate variations improves assessment of diabetic cardiac autonomic neuropathy. Diabetes 1992, 41, 633–640. [Google Scholar] [CrossRef]
- Plews, D.J.; Laursen, P.B.; Stanley, J.; Kilding, A.E.; Buchheit, M. Training adaptation and heart rate variability in elite endurance athletes: Opening the door to effective monitoring. Sports Med. 2013, 43, 773–781. [Google Scholar] [CrossRef]
- Dong, J.G. The role of heart rate variability in sports physiology (Review). Exp. Ther. Med. 2016, 11, 1531–1536. [Google Scholar] [CrossRef] [Green Version]
- Djaoui, L.; Haddad, M.; Chamari, K.; Dellal, A. Monitoring training load and fatigue in soccer players with physiological markers. Physiol. Behav. 2017, 181, 86–94. [Google Scholar] [CrossRef]
- Ravé, G.; Fortrat, J.O. Heart rate variability in the standing position reflects training adaptation in professional soccer players. Eur. J. Appl. Physiol. 2016, 116, 1575–1582. [Google Scholar] [CrossRef]
- Boullosa, D.A.; Abreu, L.; Nakamura, F.Y.; Muñoz, V.E.; Domínguez, E.; Leicht, A.S. Cardiac autonomic adaptations in elite spanish soccer players during preseason. Int. J. Sports Physiol. Perform. 2013, 8, 400–409. [Google Scholar] [CrossRef]
- Thorpe, R.T.; Strudwick, A.J.; Buchheit, M.; Atkinson, G.; Drust, B.; Gregson, W. Monitoring fatigue during the in-season competitive phase in elite soccer players. Int. J. Sports Physiol. Perform. 2015, 10, 958–964. [Google Scholar] [CrossRef] [PubMed] [Green Version]
- Naranjo, J.; De La Cruz, B.; Sarabia, E.; De Hoyo, M.; Domínguez-Cobo, S. Heart Rate Variability: A Follow-up in Elite Soccer Players Throughout the Season. Int. J. Sports Med. 2015, 36, 881–886. [Google Scholar] [CrossRef] [PubMed]
- Muñoz-López, A.; Nakamura, F.; Naranjo Orellana, J. Soccer Matches but Not Training Sessions Disturb Cardiac-Autonomic Regulation During National Soccer Team Training Camps. Res. Q Exerc. Sport 2020, 1–9. [Google Scholar] [CrossRef] [PubMed]
- Proietti, R.; di Fronso, S.; Pereira, L.A.; Bortoli, L.; Robazza, C.; Nakamura, F.Y.; Bertollo, M. Heart rate variability discriminates competitive levels in professional soccer players. J. Strength Cond. Res. 2017, 31, 1719–1725. [Google Scholar] [CrossRef] [PubMed]
- Sassi, R.; Cerutti, S.; Lombardi, F.; Malik, M.; Huikuri, H.V.; Peng, C.K.; Schmidt, G.; Yamamoto, Y. Advances in heart rate variability signal analysis: Joint position statement by the e-Cardiology ESC Working Group and the European Heart Rhythm Association co-endorsed by the Asia Pacific Heart Rhythm Society. Europace 2015, 17, 1341–1353. [Google Scholar] [CrossRef]
- Steinberg, J.S.; Varma, N.; Cygankiewicz, I.; Aziz, P.; Balsam, P.; Baranchuk, A.; Cantillon, D.J.; Dilaveris, P.; Dubner, S.J.; El-Sherif, N.; et al. 2017 ISHNE-HRS expert consensus statement on ambulatory ECG and external cardiac monitoring/telemetry. Heart Rhythm. 2017, 14, e55–e96. [Google Scholar] [CrossRef] [PubMed] [Green Version]
- Selvaraj, N.; Jaryal, A.; Santhosh, J.; Deepak, K.K.; Anand, S. Assessment of heart rate variability derived from finger-tip photoplethysmography as compared to electrocardiography. J. Med. Eng. Technol. 2008, 32, 479–484. [Google Scholar] [CrossRef]
- Coutts, L.V.; Plans, D.; Brown, A.W.; Collomosse, J. Deep learning with wearable based heart rate variability for prediction of mental and general health. J. Biomed. Inform. 2020, 112, 103610. [Google Scholar] [CrossRef] [PubMed]
- Kinnunen, H.; Rantanen, A.; Kentt, T.; Koskimäki, H. Feasible assessment of recovery and cardiovascular health: Accuracy of nocturnal HR and HRV assessed via ring PPG in comparison to medical grade ECG. Physiol. Meas. 2020, 41. [Google Scholar] [CrossRef]
- Carpenter, A.; Frontera, A. Smart-watches: A potential challenger to the implantable loop recorder? Europace 2016, 18, 791–793. [Google Scholar] [CrossRef] [Green Version]
- Brown, S.B.R.E.; Brosschot, J.F.; Versluis, A.; Thayer, J.F.; Verkuil, B. Assessing New Methods to Optimally Detect Episodes of Non-metabolic Heart Rate Variability Reduction as an Indicator of Psychological Stress in Everyday Life: A Thorough Evaluation of Six Methods. Front. Neurosci. 2020, 14, 1118. [Google Scholar] [CrossRef] [PubMed]
- Wu, L.; Shi, P.; Yu, H.; Liu, Y. An optimization study of the ultra-short period for HRV analysis at rest and post-exercise. J. Electrocardiol. 2020, 63, 57–63. [Google Scholar] [CrossRef] [PubMed]
| Publisher’s Note: MDPI stays neutral with regard to jurisdictional claims in published maps and institutional affiliations. |
© 2021 by the authors. Licensee MDPI, Basel, Switzerland. This article is an open access article distributed under the terms and conditions of the Creative Commons Attribution (CC BY) license (http://creativecommons.org/licenses/by/4.0/).

 ,
, 

