Pro- and Anti-Angiogenic Markers as Clinical Tools for Suspected Preeclampsia with and without FGR near Delivery—A Secondary Analysis

 ,
,
Abstract
:1. Introduction
2. Sample and Methods
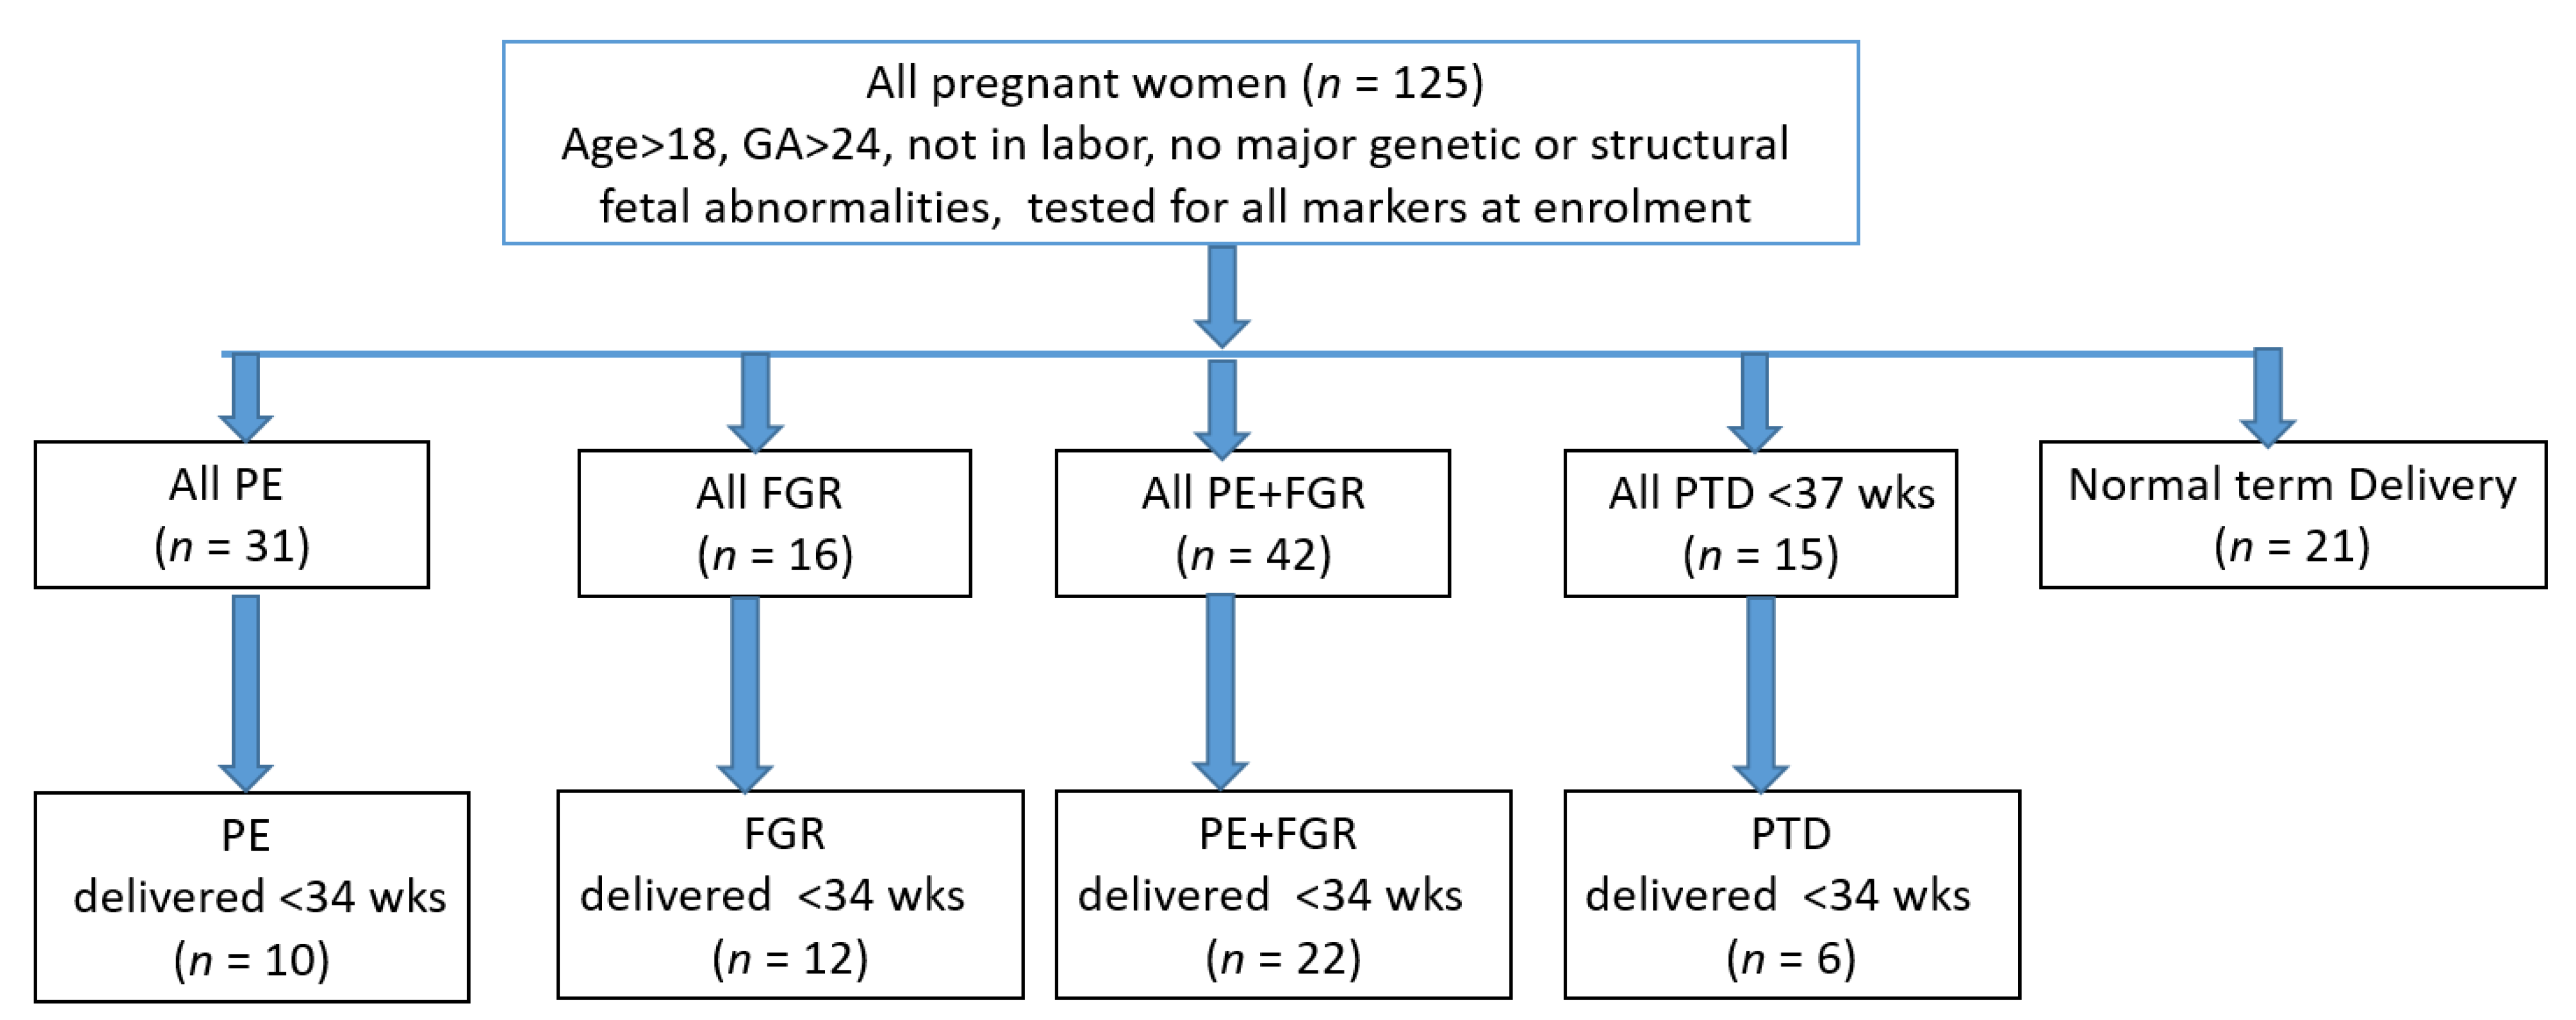
2.1. Sample
2.2. Preeclampsia (PE), Fetal Growth Restriction (FGR) and Preterm Delivery (PTD)
2.3. Immunodiagnostic Test of Angiogenic Markers
2.4. Biophysical Markers
2.5. Statistical Analyses
3. Results
3.1. Cohort Characteristics
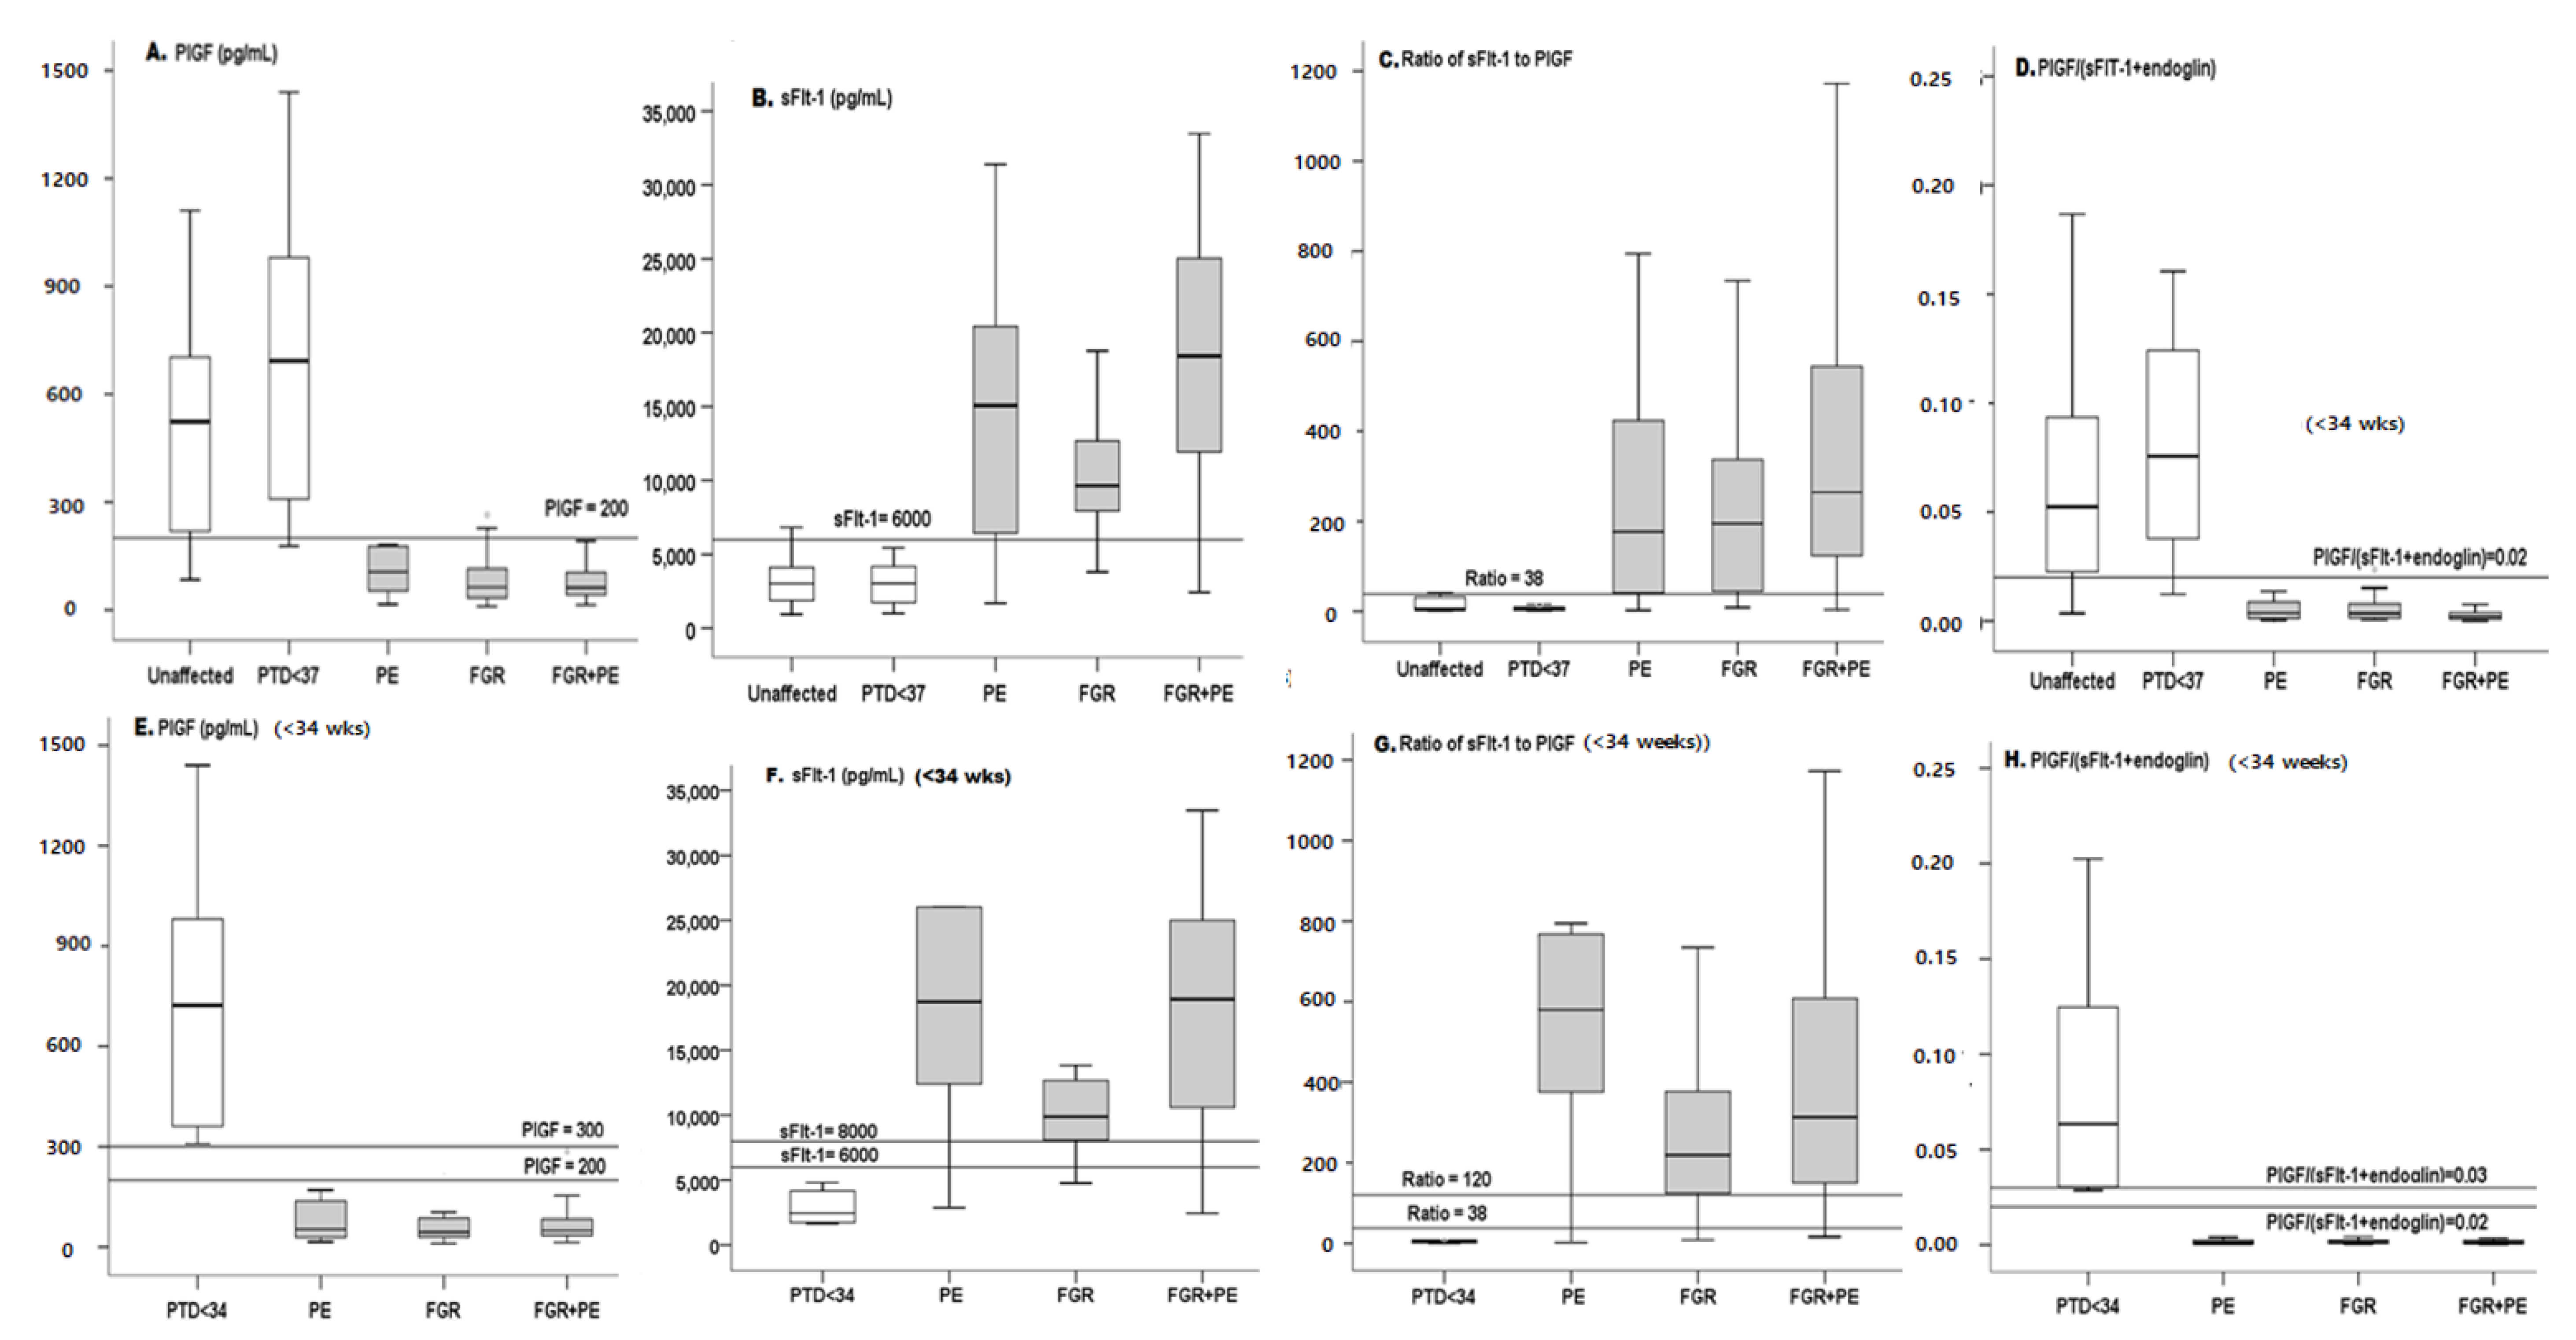
3.2. Marker Levels
3.2.1. PlGF
3.2.2. sFlt-1
3.2.3. Anti-Angiogenic Ratio of sFlt-1/PlGF
3.2.4. Pro-Angiogenic Ratio of PlGF/(sFlt-1 + Eng)
4. Discussion
5. Strengths and Weaknesses
6. Conclusions
Author Contributions
Funding
Institutional Review Board Statement
Informed Consent Statement
Data Availability Statement
Conflicts of Interest
Abbreviations
| BMI | Body mass Index |
| BP | Blood pressure |
| dBP | diastolic blood pressure |
| DR | detection rate (sensitivity) |
| FGR | Fetal growth restriction |
| FPR | False Positive rate (1-specificity) |
| ISSHP | International Society for the study of hypertension disorder in pregnancy |
| ISUOG | International society for the ultrasound in obstetrics and gynecology |
| IVF | In-vitro fertilization |
| MAP | Mean arterial blood pressure |
| MCA | Middle Cerebral artery |
| NPV | Negative predictive value |
| PE | Preeclampsia |
| PPV | positive predictive value |
| PSF | Peak systolic flow |
| PlGF | Placenta growth factor |
| PTD | Preterm delivery |
| UTPI | Uterine artery pulsatility index |
| sBP | systolic blood pressure |
| sFlt-1 | soluble Fms like-tyrosine kinase 1 |
| VEGF | Vascular endothelial growth factor |
| 95% CI | 95% Confidence Interval |
References
- Brown, M.A.; Magee, L.A.; Kenny, L.C.; Karumanchi, S.A.; McCarthy, F.P.; Saito, S.; Hall, D.R.; Warren, C.E.; Adoyi, G.; Ishaku, S. The hypertensive disorders of pregnancy: ISSHP classification, diagnosis & management recommendations for international practice. Pregnancy Hypertens. 2018, 13, 291–310. [Google Scholar] [CrossRef]
- WHO Managing Complications in Pregnancy and Childbirth: A Guide for Midwives and Doctors. 2019. Available online: http://apps.who.int/iris/bitstream/handle/10665/255760/9789241565493-eng.pdf;jsessionid=2BF1F3D8022566FA91FE021D76D50256?sequence=1 (accessed on 1 July 2019).
- American College of Obstetricians and Gynecologists. Gestational Hypertension and Preeclampsia: ACOG Practice Bulletin, Number 222. Obstet. Gynecol. 2020, 135, e237–e260. [Google Scholar] [CrossRef]
- NICE Guidelines, Hypertension in Pregnancy. 2010. Available online: https://www.nice.org.uk/guidance/cg107/resources/hypertension-in-pregnancy-diagnosis-and-management-pdf-35109334011877 (accessed on 25 June 2019).
- Poon, L.; Kametas, N.A.; Valencia, C.; Chelemen, T.; Nicolaides, K.H. Hypertensive disorders in pregnancy: Screening by systolic diastolic and mean arterial pressure at 11–13 weeks. Hypertens. Pregnancy 2010, 30, 93–107. [Google Scholar] [CrossRef] [PubMed]
- Jodkowska, A.; Martynowicz, H.; Kaczmarek-Wdowiak, B.; Mazur, G. Thrombocytopenia in pregnancy - pathogenesis and diagnostic approach. Postepy Hig. Med. Dosw. 2015, 12, 1215–1221. [Google Scholar] [CrossRef] [PubMed]
- Arnaldo Cassia, M.; Daminelli, G.; Zambon, M.; Cardellicchio, M.; Cetin, I.; Gallieni, M. Proteinuria in pregnancy: Clinically driven considerations. Nephrol. Point of Care 2008, 4, 1–5. [Google Scholar]
- Burwick, R.M.; Rincon, M.; Beeraka, S.S.; Gupta, M.; Feinberg, B.B. Evaluation of hemolysis as a severe feature of preeclampsia. Hypertension 2018, 72, 460–465. [Google Scholar] [CrossRef]
- Ekun, O.A.; Olawumi, O.M.; Makwe, C.C.; Ogidi, N.O. Biochemical assessment of renal and liver function among preeclamptics in lagos metropolis. Int. J. Reprod. Med. 2018, 2018, 1–6. [Google Scholar] [CrossRef] [Green Version]
- Saleh, L.; Vergouwe, Y.; van den Meiracker, A.H.; Verdonk, K.; Russcher, H.; Bremer, H.A.; Versendaal, H.J.; Steegers, E.A.P.; Danser, J.A.H.; Visser, W. Angiogenic markers predict pregnancy complications and prolongation in preeclampsia continuous versus cut-off values. Hypertension 2017, 70, 1–9. [Google Scholar] [CrossRef] [Green Version]
- Levine, R.J.; Maynard, S.E.; Qian, C.; Lim, K.-H.; England, L.J.; Yu, K.F.; Schisterman, E.F.; Thadhani, R.; Sachs, B.P.; Epstein, F.H.; et al. Circulating angiogenic factors and the risk of preeclampsia. N. Engl. J. Med. 2004, 350, 672–683. [Google Scholar] [CrossRef] [Green Version]
- Levine, R.J.; Lam, C.; Qian, C.; Yu, K.F.; Maynard, S.E.; Sachs, B.P.; Sibai, B.M.; Epstein, F.H.; Romero, R.; Thadhani, R.; et al. Soluble endoglin and other circulating antiangiogenic factors in preeclampsia. N. Engl. J. Med. 2006, 355, 992–1005. [Google Scholar] [CrossRef]
- Engels, T.; Pape, J.; Schoofs, K.; Henrich, W.; Verlohren, S. Automated measurement of sFlt1, PlGF and sFlt1/PlGF ratio in differential diagnosis of hypertensive pregnancy disorders. Hypertens. Pregnancy 2013, 32, 459–473. [Google Scholar] [CrossRef] [PubMed]
- Stubert, J.; Ullmann, S.; Bolz, M.; Külz, T.; Dieterich, M.; Richter, D.-U.; Reimer, T. Prediction of preeclampsia and induced delivery at <34 weeks gestation by sFlt-1 and PlGF in patients with abnormal mid trimester uterine Doppler velocimetry: A prospective cohort analysis. BMC Pregnancy Childbirth 2014, 14, 292. [Google Scholar] [CrossRef] [PubMed] [Green Version]
- Zeisler, J.; Lurba, E.; Chantraine, F.; Vatish, M.; Phil, D.; Staff, A.D.; Sennström, M.; Olovsson, M.; Brennecke, S.P.; Stepan, H. Predictive value of the sFlt-1:PlGF ratio in women with suspected preeclampsia. N. Engl. J. Med. 2016, 374, 13–22. [Google Scholar] [CrossRef]
- Schlembach, D.; Hund, M.; Schroer, A.; Wolf, C. Affiliations expand economic assessment of the use of the sFlt-1/PlGF ratio test to predict preeclampsia in Germany. BMC Health Serv. Res. 2018, 18, 1–11. [Google Scholar] [CrossRef] [PubMed] [Green Version]
- St Pierre, A.; Zaharatos, J.; Goodman, D.; Callaghan, W.M. Challenges and opportunities in identifying, reviewing, and preventing maternal deaths. Obstet. Gynecol. 2018, 131, 138–142. [Google Scholar] [CrossRef]
- Salomon, L.; Alfirevic, Z.; Costa, F.D.S.; Deter, R.; Figueras, F.; Ghi, T.; Glanc, P.; Khalil, A.; Lee, W.; Napolitano, R.; et al. ISUOG practice guidelines: Ultrasound assessment of fetal biometry and growth. Ultrasound Obstet. Gynecol. 2019, 53, 715–723. [Google Scholar] [CrossRef]
- Khalil, A.; Gordijn, S.J.; Beune, I.M.; Wynia, K.; Ganzevoort, W.; Figueras, F.; Kingdom, J.; Marlow, N.; Papageorghiou, A.; Sebire, N.; et al. Essential variables for reporting research studies on fetal growth restriction: A Delphi consensus. Ultrasound Obstet. Gynecol. 2019, 53, 609–614. [Google Scholar] [CrossRef] [Green Version]
- Figueras, F.; Gratacos, E. An integrated approach to fetal growth restriction. Best Pract. Res. Clin. Obstet. Gynaecol. 2017, 38, 48–58. [Google Scholar] [CrossRef] [PubMed]
- Sharabi-Nov, A.; Kumar, K.; Vodušek, V.F.; Sršen, T.P.; Tul, N.; Fabjan, T.; Meiri, H.; Nicolaides, K.H.; Osredkar, J. Establishing a differential marker profile for pregnancy complications near delivery. Fetal Diagn. Ther. 2019, 47, 471–484. [Google Scholar] [CrossRef]
- Molvarec, A.; Szarka, A.; Walentin, S.; Szűcs, E.; Nagy, B.; Rigó, J. Circulating angiogenic factors determined by electrochemiluminescence immunoassay in relation to the clinical features and laboratory parameters in women with pre-eclampsia. Hypertens. Res. 2010, 33, 892–898. [Google Scholar] [CrossRef] [Green Version]
- Kumer, K.; Premru-Srsen, T.; Fabjan-Vodušek, V.; Tul, N.; Fabjan, T.; Osredkar, J. Peripheral arterial tonometry and angiogenic biomarkers in preeclampsia. Hypertens. Pregnancy 2018, 37, 197–203. [Google Scholar] [CrossRef] [PubMed]
- Hadlock, F.P.; Shah, Y.P.; Kanon, D.J.; Lindsey, J.V. Fetal crown-rump length: Reevaluation of relation to menstrual age (5–18 weeks) with high-resolution real-time US. Radiology 1992, 182, 501–505. [Google Scholar] [CrossRef] [PubMed]
- Goldenberg, R.L.; Culhane, J.F.; Iams, J.D.; Romero, R. Epidemiology and causes of preterm birth. Lancet 2008, 371, 75–84. [Google Scholar] [CrossRef]
- Meertens, L.J.; Van Montfort, P.; Scheepers, H.C.; Van Kuijk, S.M.; Aardenburg, R.; Langenveld, J.; Van Dooren, I.M.; Zwaan, I.M.; Spaanderman, M.E.; Smits, L.J. Prediction models for the risk of spontaneous preterm birth based on maternal characteristics: A systematic review and independent external validation. Acta Obstet. Gynecol. Scand. 2018, 97, 907–920. [Google Scholar] [CrossRef]
- Hadlock, F.P.; Harrist, R.B.; Martinez-Poyer, J. In utero analysis of fetal growth: A sonographic weight standard. Radiology 1991, 181, 129–133. [Google Scholar] [CrossRef]
- Rolnik, D.L.O.D.; Wright, D.; Poon, L.L.; O’Gorman, N.N.; Syngelaki, A.A.; Matallana, C.C.D.P.; Akolekar, R.R.; Cicero, S.S.; Janga, D.D.; Singh, M.M.; et al. Aspirin versus placebo in pregnancies at high risk for preterm preeclampsia. N. Engl. J. Med. 2017, 377, 613–622. [Google Scholar] [CrossRef] [PubMed]
- Tan, M.Y.; Poon, L.C.; Rolnik, D.L.; Syngelaki, A.; de Paco Matallana, C.; Akolekar, R.; Cicero, S.; Janga, D.; Singh, M.; Molina, F.S.; et al. Prediction and prevention of small-for-gestational-age neonates: Evidence from SPREE and ASPRE. Ultrasound Obstet. Gynecol. 2018, 52, 52–59. [Google Scholar] [CrossRef] [Green Version]
- Poon, L.C.; Wright, D.; Rolnik, D.L.; Syngelaki, A.; Delgado, J.L.; Tsokaki, T.; Leipold, G.; Akolekar, R.; Shearing, S.; De Stefani, L.; et al. Aspirin for evidence-based preeclampsia prevention trial: Effect of aspirin in prevention of preterm preeclampsia in subgroups of women according to their characteristics and medical and obstetrical history. Am. J. Obstet. Gynecol. 2017, 217, 585.e1–585.e5. [Google Scholar] [CrossRef] [Green Version]
- Zhong, Y.; Zhu, F.; Ding, Y. Serum screening in first trimester to predict pre-eclampsia, small for gestational age and preterm delivery: Systematic review and meta-analysis. BMC Pregnancy Childbirth 2015, 15, 1–10. [Google Scholar] [CrossRef] [Green Version]
- Rana, S.; Burke, S.D.; Karumanchi, S.A. Imbalances in circulating angiogenic factors in the pathophysiology of preeclampsia and related disorders. Am. J. Obstet. Gynecol. 2020, 20. [Google Scholar] [CrossRef]
- Verlohren, S.; Dröge, L.-A. The diagnostic value of angiogenic and antiangiogenic factors in differential diagnosis of preeclampsia. Am. J. Obstet. Gynecol. 2020, 28. [Google Scholar] [CrossRef]
- Suresh, S.; Mueller, A.; Salahuddin, S.; Naseem, H.; Dhir, R.; Rana, S. Evaluation of angiogenic factors in the decision to admit women with suspected preeclampsia. Pregnancy Hypertens. 2020, 21, 124–131. [Google Scholar] [CrossRef]
- Agrawal, S.; Shinar, S.; Cerdeira, A.S.; Redman, C.; Vatish, M. Predictive performance of PlGF (placental growth factor) for screening preeclampsia in asymptomatic women: A systematic review and meta-analysis. Hypertension 2019, 74, 1124–1135. [Google Scholar] [CrossRef] [PubMed]
- Barton, J.R.; Woelkers, D.A.; Newman, R.B.; Combs, C.A.; How, H.Y.; Boggess, K.A.; Martin, J.N.; Kupfer, K.; Sibai, B.M.; PETRA (Preeclampsia Triage by Rapid Assay) Trial. Placental growth factor predicts time to delivery in women with signs or symptoms of early preterm preeclampsia: A prospective multicenter study. Am. J. Obstet. Gynecol. 2020, 222, 259.e1–259.e11. [Google Scholar] [CrossRef] [PubMed]
- Dymara-Konopka, W.; Laskowska, M.; Błażewicz, A. Angiogenic imbalance as a contributor of preeclampsia. Curr. Pharm. Biotechnol. 2018, 19, 797–815. [Google Scholar] [CrossRef]
- Stott, D.; Papastefanou, I.; Paraschiv, D.; Clark, K.; Kametas, N.A. Longitudinal maternal hemodynamics in pregnancies affected by fetal growth restriction. Ultrasound Obstet. Gynecol. 2017, 49, 761–768. [Google Scholar] [CrossRef] [Green Version]
- Stott, D.; Nzelu, O.; Nicolaides, K.H.; Kametas, N.A. Maternal haemodynamics in normal pregnancies and in pregnancies affected by pre-eclampsia. Ultrasound Obstet Gynecol. 2018, 52, 359–364. [Google Scholar] [CrossRef] [Green Version]
- Ferrazzi, E.; Stampalija, T.; Monasta, L.; Di Martino, D.; Vonck, S.; Gyselaers, W. Maternal hemodynamics: A method to classify hypertensive disorders of pregnancy. Am. J. Obstet. Gynecol. 2018, 218, 124.e1–124.e11. [Google Scholar] [CrossRef]
- Benton, S.J.; Leavey, K.; Grynspan, D.; Cox, B.J.; Bainbridge, S.A. The clinical heterogeneity of preeclampsia is related to both placental gene expression and placental histopathology. Am. J. Obstet. Gynecol. 2018, 219, 604.e1–604.e25. [Google Scholar] [CrossRef] [Green Version]
- Baschat, A.A.; Dewberry, D.; Seravalli, V.; Miller, J.L.; Block-Abraham, D.; Blitzer, M.G. Maternal blood-pressure trends throughout pregnancy and development of pre-eclampsia in women receiving first-trimester aspirin prophylaxis. Ultrasound Obstet. Gynecol. 2018, 52, 728–733. [Google Scholar] [CrossRef] [Green Version]
- Kwiatkowska, E.; Stefańska, K.; Zieliński, M.; Sakowska, J.; Jankowiak, M.; Trzonkowski, P.; Marek-Trzonkowska, N.; Kwiatkowski, S. Podocytes—The most vulnerable renal cells in preeclampsia. Int. J. Mol. Sci. 2020, 21, 5051. [Google Scholar] [CrossRef] [PubMed]
- Molvarec, A.; Fügedi, G.; Szabó, E.; Stenczer, B.; Walentin, S.; Rigó, J.J. Decreased circulating anandamide levels in preeclampsia. Hypertens. Res. 2015, 38, 413–418. [Google Scholar] [CrossRef] [Green Version]
- Lees, C.C.; Stampalija, T.; Baschat, A.; Costa, F.; Ferrazzi, E.; Figueras, F.; Hecher, K.; Kingdom, J.; Poon, L.C.; Salomon, L.J.; et al. ISUOG practice guidelines: Diagnosis and management of small-for-gestational-age fetus and fetal growth restriction. Ultrasound Obstet. Gynecol. 2020, 56, 298–312. [Google Scholar] [CrossRef] [PubMed]
- Guedes-Martins, L. Superimposed preeclampsia. Adv. Exp. Med. Biol. 2016, 956, 409–417. [Google Scholar] [CrossRef]
- Özalp, M.; Demir, Ö.; Akbas, H.; Kaya, E.; Celik, C.; Osmanağaoğlu, M.A. Effect of COVID-19 pandemic process on prenatal diagnostic procedures. J. Matern. Fetal. Neonatal. Med. 2020, 1, 1–6. [Google Scholar] [CrossRef] [PubMed]
- Tsviban, A.; Maymon, R.; Meiri, H.; Wiener, Y. Using maternal serum placental growth factor (PlGF) for ruling out preeclampsia near delivery: Preliminary results and economic implications in Israel. Harefuah 2020, 159, 492–497. [Google Scholar]
- Lai, J.; Syngelaki, A.; Nicolaides, K.H.; Von Dadelszen, P.; Magee, L.A. Impact of new definitions of preeclampsia at term on identification of adverse maternal and perinatal outcomes. Am. J. Obstet. Gynecol. 2020. [Google Scholar] [CrossRef] [PubMed]


| Unaffected | PTD (<37 wks) | PE | FGR | FGR + PE | p | |
|---|---|---|---|---|---|---|
| All Participants | ||||||
| (n = 21) | (n = 15) | (n = 31) | (n = 16) | (n = 42) | ||
| Enrollment | ||||||
| GA at enrollment (wks) | 34.0 [32.0–35.9] | 31.2 [29.4–32.9] * | 33.9 [32.3–35.6] | 31.4 [29.1–33.6] * | 31.8 [30.7–32.8] * | 0.027 |
| Maternal age (years) | 31.6 [29.5–33.8] | 31.3 [29.7–32.9] | 32.0 [29.9–34.1] | 31.7 [29.7–33.7] | 32.9 [31.1–34.7] | 0.792 |
| BMI (kg/h2)) | 25.8 [23.7–27.9] | 24.6 [22.9–26.4] | 29.5 [26.5–32.6] | 27.6 [24.2–31.0] | 29.6 [26.9–32.4] | 0.011 |
| Parity | 1.7 [1.3–2.0] | 1.6 [1.2–2.1] | 1.4 [1.0–1.8] | 1.5 [1.1–1.9] | 1.5 [ 1.2–1.8] | 0.806 |
| IVF (%) | 4.8 | 0 | 6.5 | 0 | 11.9 * | 0.361 |
| MAP (mm HG) | 85 [80–90] | 90 [82–98] | 113 [109–116] ** | 97 [93–101] * | 113 [109–116] ** | <0.001 |
| UTPI | 0.68 [0.66–0.70] | 0.70 [0.64–0.61] | 0.80 [0.60–1.17] * | 1.35 [1.05–1.66] ** | 1.42 [1.25–1.56] ** | <0.001 |
| Previous PE (%) | 4.8 | 6.7 | 6.5 | 6.3 | 9.5 | 0.965 |
| Chronic Hypertension (%) | 0 | 0 | 19.4 * | 0 | 16.7 * | 0.032 |
| Diabetes (%) | 0 | 0 | 3.2 | 0 | 4.8 | 0.787 |
| Polycystic Ovary (%) | 0 | 0 | 0 | 0 | 7.1* | 0.204 |
| Delivery | ||||||
| Gestational age at birth(wks) | 39.1 [38.5–39.7] | 33.8 [32.1–35.5] * | 34.2 [32.6–35.9] * | 31.7 [29.4–34.0] ** | 32.0 [31.0–33.1] ** | <0.001 |
| Vaginal delivery (%) | 76.2 | 69.2 | 45.2 ** | 40.0 * | 14.6 ** | <0.001 |
| Baby′s birthweight (grams) | 3330 [3133–3528] | 2207 [1872–2542] * | 2306 [1906–2705] * | 1306 [834–1778] ** | 1449 [1247–1651] ** | <0.001 |
| sFlt-1 (ng/mL) | 3.00 [1.89–4.1] | 3.30 [1.75–4.17] | 15.21 [9.6–18.02] | 9.43 [7.38–12.33] | 18.15 [13.13–21.81] | <0.001 |
| PlGF (pg/mL) | 524 [223–681] | 693 [308–980] | 101 [69–153] * | 76 [43–117] * | 62 [48–87] * | <0.001 |
| sFlt-1/PlGF | 5 [3–31] | 6 [2–9[ | 177 [106–301] * | 195 [55–310] * | 265 [168–382] * | <0.001 |
| PlGF/(sFlt-1 + sEng) | 0.033 [0.011–0.077] | 0.056 [0.029–0.111] | 0.002 [0.001–0.005] * | 0.002 [0.001–0.004] * | 0.003 [0.0–0.005] ** | <0.001 |
| Delivery <34 wks | ||||||
| (n = 6) | (n = 10) | (n = 12) | (n = 28) | |||
| Enrollment | ||||||
| GA at enrollment (wks) | 29.2 [26.8–31.6] | 29.9 [27.5–32.3] | 29.3 [27.7–30.8] | 29.9 [28.9–30.9] | 0.805 | |
| Maternal age (years) | 31.3 [27.8–34.8] | 33.8 [33.0–37.7] | 31.5 [29.2–33.8] | 33.1 [30.7–35.5] | 0.668 | |
| BMI (kg/meter2) | 24.7 [21.0–28.4] | 30.7 [26.2–35.2] | 26.3 [23.9–28.8] | 29.7 [26.1–33.4] | 0.123 | |
| Parity | 1.8 [1.0–2.6] | 1.5 [0.7–2.4] | 1.3 [0.9–1.7] | 1.6 [1.2–2.0] | 0.807 | |
| IVF (%) | 0 | 15.4 * | 0 | 10.7 | 0.498 | |
| MAP (mmHg) | 87 [70–103] | 114 [107–121] | 96 [91–101] | 115 [110–119] * | <0.001 | |
| UTPI | 0.69 [0.57–0.80] | 1.20 [0.83–1.57] * | 1.62 [1.35–1.90] ** | 1.43 [ 1.27–1.58] ** | 0.003 | |
| Previous PE (%) | 0 | 0 | 0 | 7.1 | 0.591 | |
| Chronic Hypertension (%) | 0 | 7.7 | 0 | 21.4 * | 0.146 | |
| Diabetes (%) | 0 | 0 | 0 | 3.6 | 0.771 | |
| Polycystic Ovary (%) | 0 | 0 | 0 | 3.6 | 0.771 | |
| Delivery | ||||||
| GA at delivery (wks) | 31.0 [28.0–34.0] | 30.2 [27.8–32.6] | 29.5 [28.0–31.1] | 30.2 [29.2–31.2] | 0.805 | |
| Vaginal delivery (%) | 80.0 | 23.1 * | 27.3 * | 7.4 ** | 0.003 | |
| Baby birthweight (grams) | 1669 [1318–2020] | 1276 [923–1628 ] * | 874 [627–1121] ** | 1171 [995–1346] * | 0.018 | |
| sFlt-1 (ng/mL) | 2.97 [1.18–4.76] | 25.7 [8.98–42.41] ** | 11.8 [7.5–16.26] * | 19.87 [15.13–24.6] ** | 0.009 | |
| PlGF (pg/mL) | 762 [182–1343] | 215 [0–479] * | 70 [27–113] * | 103 [39–167] * | <0.001 | |
| sFlt-1/PlGF | 6 [0–13] | 521 [246–796] * | 307 [174–439] * | 460 [273–647] * | 0.050 | |
| PlGF/(sFlt-1 + sEng) | 0.090 [0–0.182] | 0.009 [0–0.025] ** | 0.002 [0–0.004] ** | 0.003 [0–0.005] ** | <0.001 | |
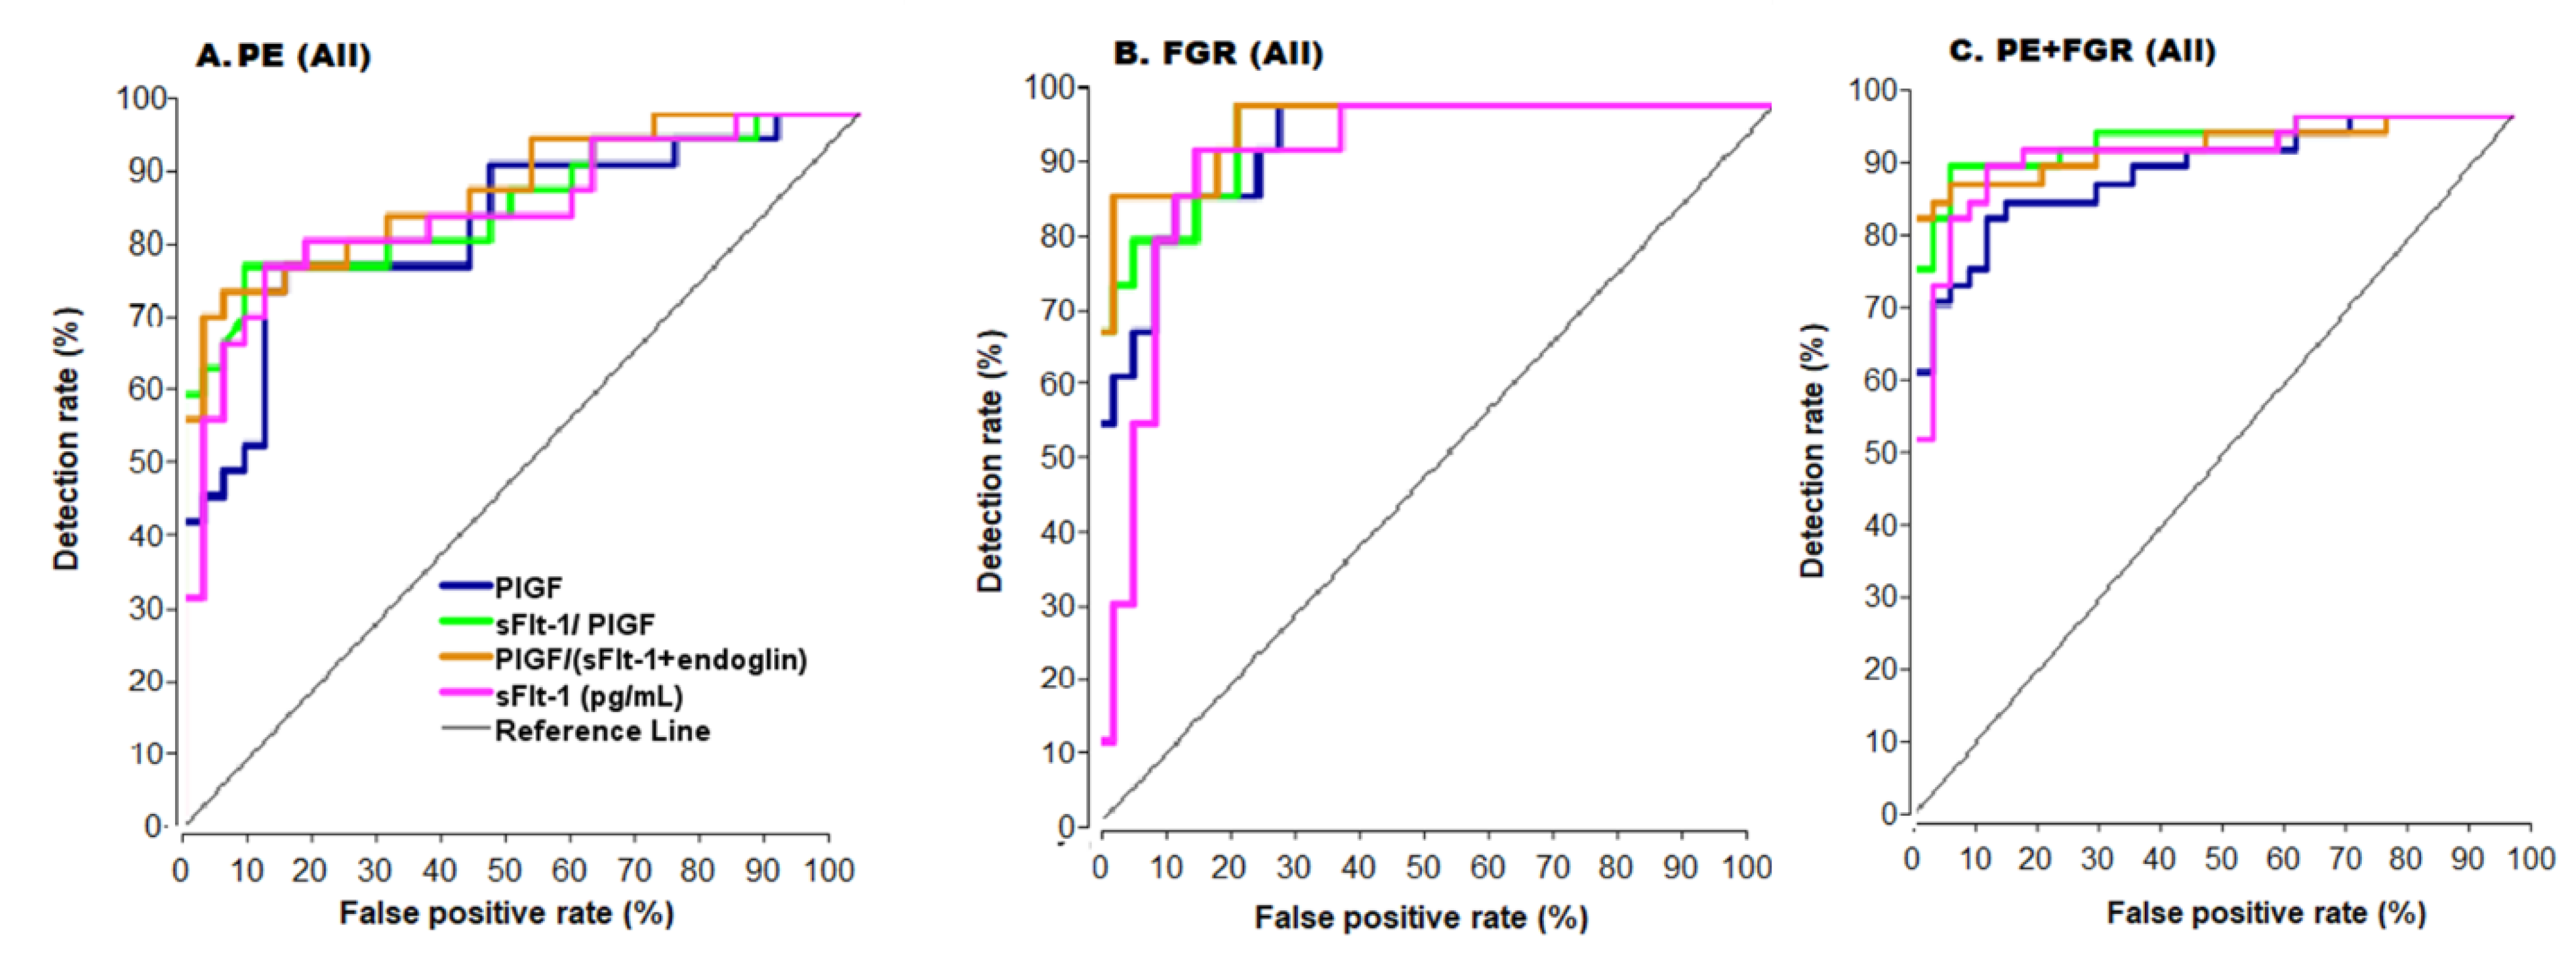
| Condition | Marker | Continuous Model | Cutoff Model | |||||
|---|---|---|---|---|---|---|---|---|
| AUC (95% CI) | DR at 10% FPR | CutOff | AUC (95% CI) | DR at 10% FPR | PPV | NPV | ||
| All PE (n = 31) | PlGF | 0.85 (0.75–0.95) | 53 | 200 pg/mL | 0.82 (0.71–0.93) | 43 | 82 | 83 |
| sFlt-1 | 0.87 (0.78–0.96) | 73 | 6000 pg/mL | 0.82(0.71–0.93 | 67 | 85 | 81 | |
| sFlt-1/PlGF | 0.88 (0.80–0.97) | 79 | 38 | 0.84 (0.73–0.95) | 68 | 85 | 83 | |
| PlGF/(sFlt1 + sEng) | 0.89 (0.81–0.97) | 82 | 0.02 | 0.79 (0.67–0.91) | 44 | 74 | 83 | |
| All FGR (n = 16) | PlGF | 0.95 (0.89–1.00) | 77 | 200 pg/mL | 0.86 (0.75–0.98) | 68 | 74 | 94 |
| sFlt-1 | 0.92 (0.84–1.00) | 81 | 6000 pg/mL | 0.88(0.77–0.99) | 74 | 78 | 94 | |
| sFlt-1/PlGF | 0.96 (0.91–1.00) | 81 | 38 | 0.85 (0.72–0.98) | 69 | 76 | 91 | |
| PlGF/(sFlt1 + sEng) | 0.97 (0.93–1.00) | 82 | 0.02 | 0.88 (0.78–0.97) | 78 | 67 | 100 | |
| All PE + FGR (n = 42) | PlGF | 0.92 (0.86–0.98) | 71 | 200 pg/mL | 0.87 (0.78–0.96) | 71 | 88 | 85 |
| sFlt-1 | 0.95 (0.90–1.00) | 88 | 6000 pg/mL | 0.89 (0.81–098) | 76 | 90 | 88 | |
| sFlt-1/PlGF | 0.97 (0.93–1.00) | 93 | 38 | 0.91 (0.83–0.98) | 80 | 90 | 91 | |
| PlGF/(sFlt1 + sEng) | 0.95 (0.91–1.00) | 79 | 0.02 | 0.84 (0.75–0.94) | 77 | 83 | 89 | |
| PE < 34 w (n = 10) | PlGF | 0.89 (0.73–1.00) | 60 | 300 pg/mL | 0.91 (0.76–1.00) | 53 | 100 | 71 |
| sFlt-1 | 0.95 (0.83–1.00) | 82 | 8000 pg/mL | 0.91 (0.76–1.00) | 84 | 100 | 71 | |
| sFlt-1/PlGF | 0.93 (0.80–1.00) | 82 | 120 | 0.91 (0.76–1.00) | 82 | 100 | 71 | |
| PlGF/(sFlt1 + sEng) | 0.95 (0.83–1.00 | 80 | 0.03 | 0.86 (0.62–1.00) | 80 | 91 | 80 | |
| FGR < 34 w (n = 12) | PlGF | 1.00 (1.00–1.00) | 100 | 300 pg/mL | 1.00 (1.00–1.00) | 100 | 100 | 100 |
| sFlt-1 | 1.00 (1.00–1.00) | 100 | 8000 pg/mL | 0.92 (0.78–1.00) | 85 | 100 | 71 | |
| sFlt-1/PlGF | 1.00 (1.00–1.00) | 100 | 120 | 0.92 (0.78–1.00) | 85 | 100 | 71 | |
| PlGF/(sFlt1 + sEng) | 1.00 (1.00–1.00) | 100 | 0.03 | 0.90 (0.68–1.00) | 82 | 92 | 100 | |
| PE + FGR < 34 w (n = 28) | PlGF | 0.96 (0.90–1.00) | 100 | 300 pg/mL | 0.96 (0.90–1.00) | 100 | 100 | 71 |
| sFlt-1 | 0.98 (0.93–1.00) | 96 | 8000 pg/mL | 0.94 (0.87–1.00) | 90 | 100 | 63 | |
| sFlt-1/PlGF | 1.00 (1.00–1.00) | 100 | 120 | 0.91 (0.81–1.00) | 83 | 100 | 50 | |
| PlGF/(sFlt1 + sEng) | 1.00 (1.00–1.00) | 100 | 0.03 | 0.90 ( 0.69–1.00) | 82 | 96 | 100 | |
Publisher’s Note: MDPI stays neutral with regard to jurisdictional claims in published maps and institutional affiliations. |
© 2021 by the authors. Licensee MDPI, Basel, Switzerland. This article is an open access article distributed under the terms and conditions of the Creative Commons Attribution (CC BY) license (http://creativecommons.org/licenses/by/4.0/).
Share and Cite
Kumer, K.; Sharabi-Nov, A.; Fabjan Vodušek, V.; Premru Sršen, T.; Tul, N.; Fabjan, T.; Meiri, H.; Nicolaides, K.H.; Osredkar, J. Pro- and Anti-Angiogenic Markers as Clinical Tools for Suspected Preeclampsia with and without FGR near Delivery—A Secondary Analysis. Reprod. Med. 2021, 2, 12-25. https://0-doi-org.brum.beds.ac.uk/10.3390/reprodmed2010003
Kumer K, Sharabi-Nov A, Fabjan Vodušek V, Premru Sršen T, Tul N, Fabjan T, Meiri H, Nicolaides KH, Osredkar J. Pro- and Anti-Angiogenic Markers as Clinical Tools for Suspected Preeclampsia with and without FGR near Delivery—A Secondary Analysis. Reproductive Medicine. 2021; 2(1):12-25. https://0-doi-org.brum.beds.ac.uk/10.3390/reprodmed2010003
Chicago/Turabian StyleKumer, Kristina, Adi Sharabi-Nov, Vesna Fabjan Vodušek, Tanja Premru Sršen, Nataša Tul, Teja Fabjan, Hamutal Meiri, Kypros Herodotos Nicolaides, and Joško Osredkar. 2021. "Pro- and Anti-Angiogenic Markers as Clinical Tools for Suspected Preeclampsia with and without FGR near Delivery—A Secondary Analysis" Reproductive Medicine 2, no. 1: 12-25. https://0-doi-org.brum.beds.ac.uk/10.3390/reprodmed2010003