
Blood Oxygen Level-Dependent (BOLD) MRI in Glomerular Disease


1
School of Medicine and Health Sciences, The George Washington University, Washington, DC 20037, USA
2
Perelman School of Medicine, University of Pennsylvania, Philadelphia, PA 19104, USA
3
Interventional Regenerative Medicine and Imaging Laboratory, Department of Radiology, Stanford University, Palo Alto, CA 94305, USA
4
Department of Cell and Molecular Biology, University of South Florida, Tampa, FL 33620, USA
*
Author to whom correspondence should be addressed.
Transplantology 2021, 2(2), 109-117; https://0-doi-org.brum.beds.ac.uk/10.3390/transplantology2020011
Submission received: 10 February 2021
/
Revised: 15 March 2021
/
Accepted: 30 March 2021
/
Published: 2 April 2021
(This article belongs to the Special Issue Immunity and Inflammatory Processes in Renal Diseases)
Abstract
:Renal hypoxia has recently been implicated as a key contributor and indicator of various glomerular diseases. As such, monitoring changes in renal oxygenation in these disorders may provide an early diagnostic advantage that could prevent potential adverse outcomes. Blood oxygen level-dependent magnetic resonance imaging (BOLD MRI) is an emerging noninvasive technique for assessing renal oxygenation in glomerular disease. Although BOLD MRI has produced promising initial results for the use in certain renal pathologies, the use of BOLD imaging in glomerular diseases, including primary and secondary nephrotic and nephritic syndromes, is relatively unexplored. Early BOLD studies on primary nephrotic syndrome, nephrotic syndrome secondary to diabetes mellitus, and nephritic syndrome secondary to systemic lupus erythematosus have shown promising results to support its future clinical utility. In this review, we outline the advancements made in understanding the use of BOLD MRI for the assessment, diagnosis, and screening of these pathologies.
1. Introduction
Glomerular disease continues to be a large health burden worldwide, often occurring as a primary process or as secondary to systemic inflammatory conditions, infections, and diabetes mellitus [1]. In the past 10 years, multiple studies have implicated renal hypoxia in glomerular disease [2,3,4]. These studies indicate that patients with glomerular disease exhibit significant decreases in both renal blood flow and oxygenation, possibly due to basement membrane thickening and extracellular collagen deposition in the mesangium [5]. In order to reduce potential adverse outcomes, monitoring renal hypoxia may establish an early diagnosis and even help monitor disease progression. A novel noninvasive method currently being investigated for such purposes is blood oxygenation level-dependent magnetic resonance imaging (BOLD MRI), a functional MRI (fMRI) technique that can evaluate organ function on the basis of differences in the magnetic properties of deoxyhemoglobin and hemoglobin. BOLD MRI operates by detecting the differing paramagnetic spin states of deoxyhemoglobin versus oxyhemoglobin. Increasing amounts of deoxyhemoglobin induce an internal magnetic field and phase dispersions of neighboring spin states, which ultimately distorts the MRI signal. These results are reported as the R2* (sec−1) value, which is the apparent relaxation rate and indicates the relative content of deoxyhemoglobin. Higher R2* values are inversely correlated with tissue oxygenation and vice versa. For example, tissue areas receiving increased blood flow have a decreased proportion of deoxygenated hemoglobin, and thus, a lower apparent relaxation rate R2*.
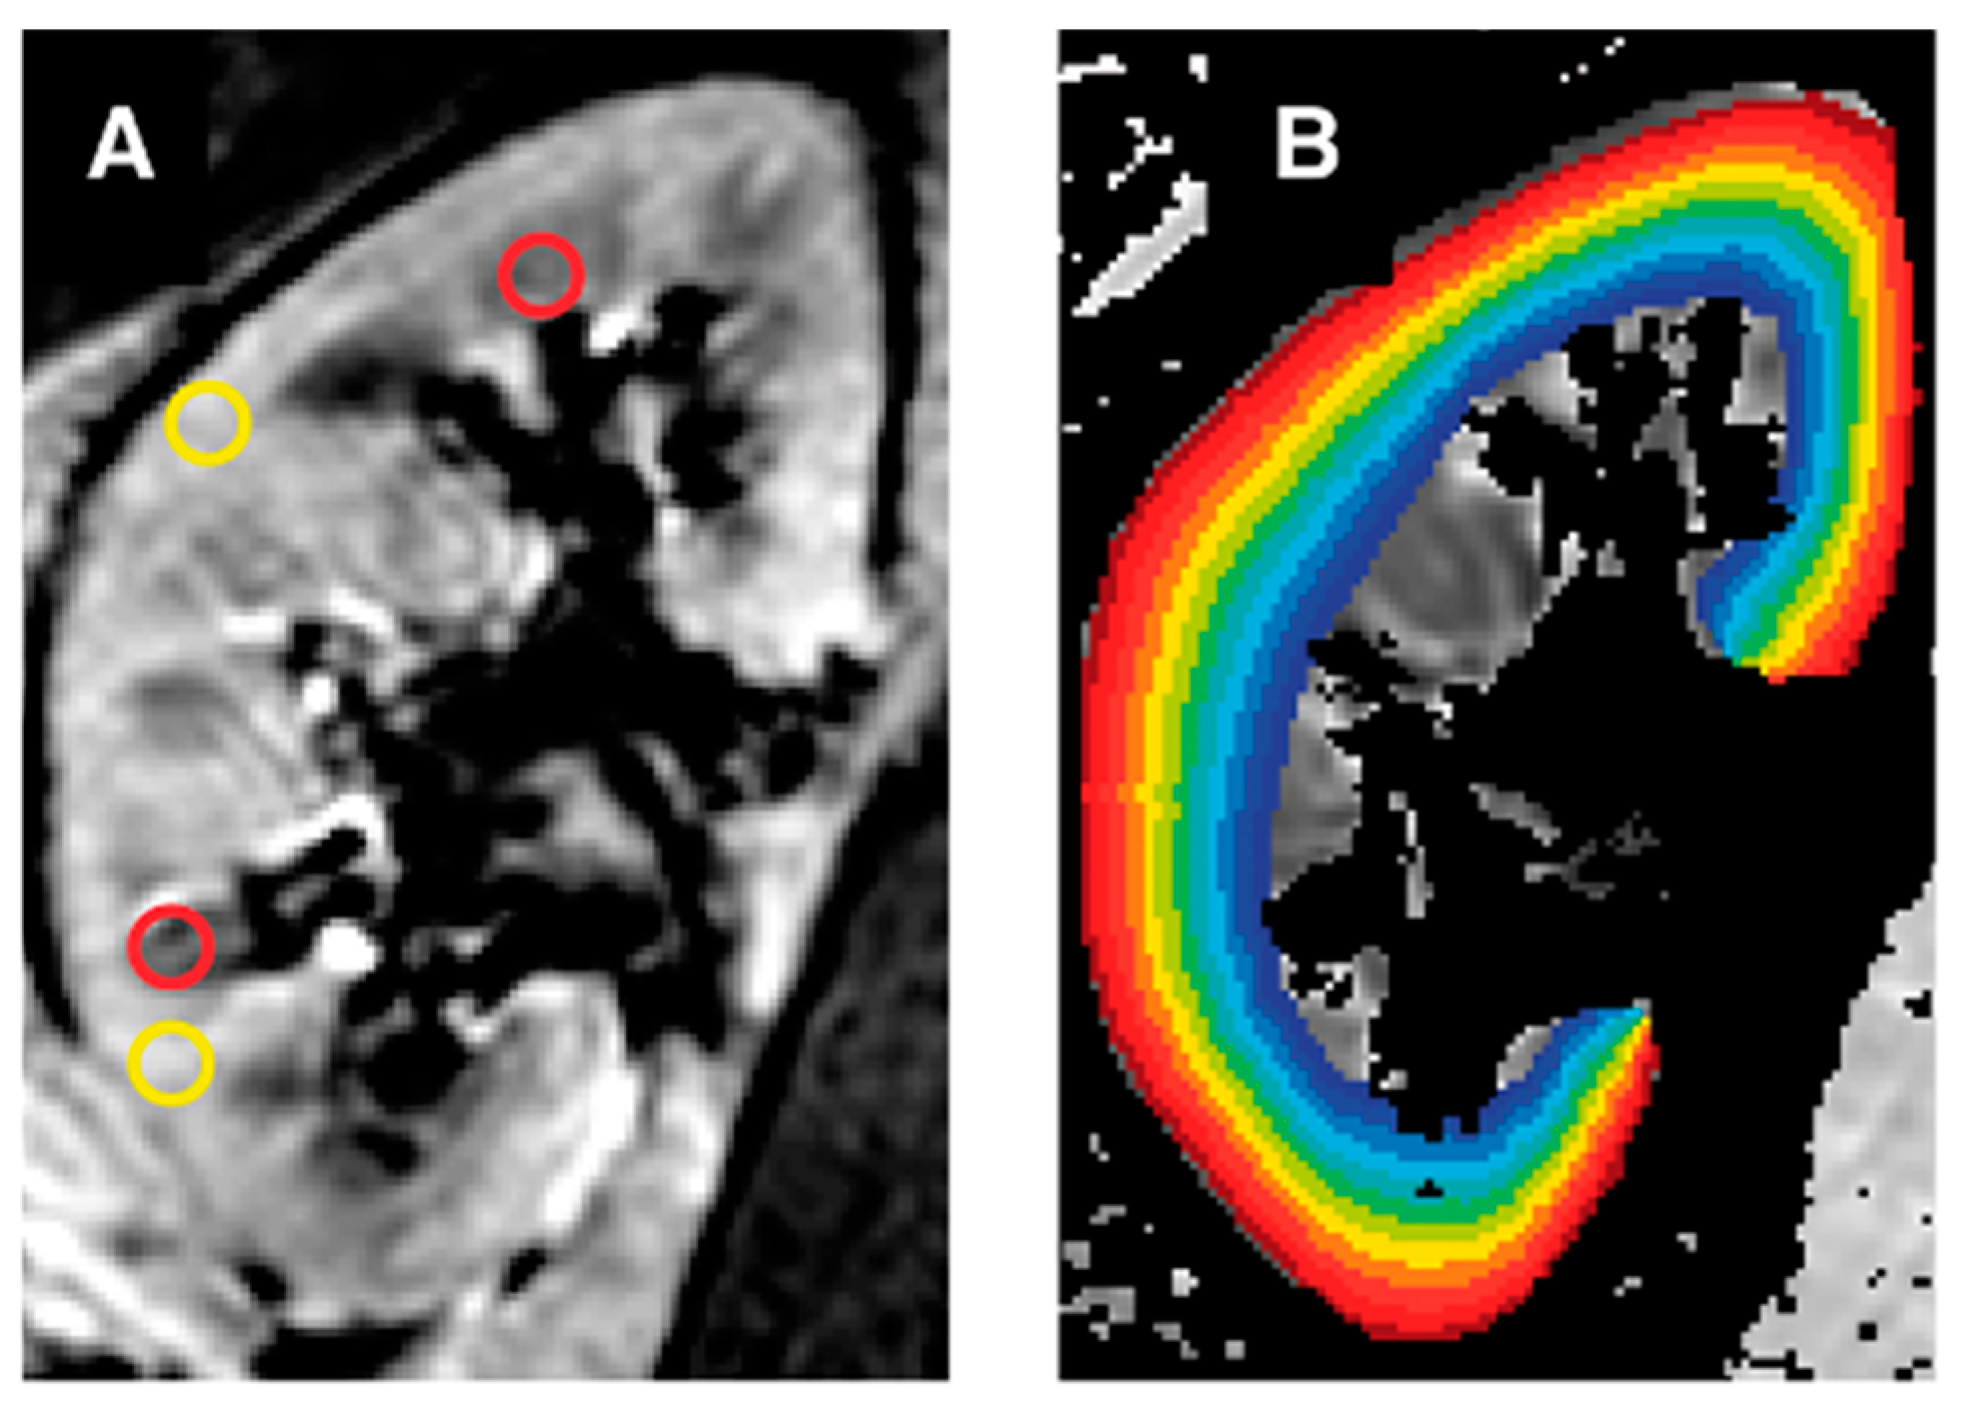
BOLD MRI has been a cornerstone in neuroimaging since the early 1990s, giving clinicians the ability to measure areas of the brain affected by ischemia [6]. Neurologists and neurosurgeons consistently employ BOLD as a primary fMRI technique, often using it for pre-operative analysis as well as other applications such as seizure tracking [7]. Such extensive use in neurology clinics, as well as in research, is responsible for most of our current understanding of the best data acquisition methods for BOLD MRI. However, this technological and scientific understanding is relatively specific to cerebrovascular imaging. With the clear physiological differences between the brain and kidney, specific techniques and settings for renal imaging are needed. This has led to the investigation of BOLD MRI’s utility in renal disease, especially chronic kidney disease (CKD) and renal artery stenosis. As both pathologies involve hypoxia, BOLD MRI may be an effective tool to track disease progression [8]. Furthermore, these studies have found that for renal BOLD imaging, a multiple gradient-recalled-echo (mGRE) sequence has a superior signal-to-noise ratio and resolution compared to a spin-echo sequence [9]. These BOLD MRI results are commonly analyzed using region of interest (ROI) analysis to assess medullary R2* (mR2*) and cortical R2* (cR2*) values, giving physicians important insights into the respective oxygenation of the kidney. Another method being investigated is the twelve-layer concentric objects (TLCO) technique, which may have better accuracy than ROI analysis in advanced disease (Figure 1) [10].
Interestingly, emerging literature now indicates that BOLD MRI can also be used for glomerular disease diagnosis and management. In contrast to anatomical methods such as sonography, BOLD MRI provides clinicians with a more effective ability to functionally evaluate early changes in nephrotic and nephritic syndromes, encompassing both primary and secondary etiologies. The capability to noninvasively assess renal oxygenation makes it a highly attractive option for use in the clinical setting. Given that renal tissue hypoxia plays a major role in the development of primary and secondary glomerular disease, BOLD MRI could play an important role by allowing for earlier identification and initiation of treatment. As imaging does not currently play a significant role in the diagnosis or management of such diseases, BOLD MRI has the potential to change current clinical guidelines. Here, we review recent advances made in BOLD MRI’s use in primary nephrotic syndrome, secondary nephrotic syndrome due to diabetes mellitus, and secondary nephritic syndrome due to systemic lupus erythematosus (SLE).
2. Primary Nephrotic Syndrome
Primary nephrotic syndrome (PNS) is a collection of symptoms that result from glomerular basement membrane damage, leading to shared features of proteinuria, hyperlipidemia, hypercoagulability, hypogammaglobulinemia, and hypoalbuminemia. Causes of PNS include minimal change disease (MCD), membranous glomerulonephritis (MGN), and focal segmental glomerulosclerosis (FSGS). Abnormal intrarenal oxygenation patterns and consequent hypoxia associated with primary nephrotic syndrome have spurred investigations into BOLD MRI’s use in these disorders.
As mentioned, medullary R2* values in BOLD MRI are used as a marker for medullary oxygen concentration, with several studies correlating lower mR2* values with primary nephrotic syndrome progression. Recent research showed that patients with various causes of primary nephrotic syndrome had significantly lower mR2* values compared to controls. Their mR2* values were also negatively correlated with estimated glomerular filtration rate (eGFR) and positively correlated with tubulointerstitial lesions [11]. The significantly lower mR2* seen in PNS patients may be secondary to reduced sodium reabsorption, and thus, reduced oxygen consumption, as well as enhanced oxyhemoglobin concentrations within inflammatory and immune-mediated kidney injuries [11,12,13]. Furthermore, correlations of mR2* with eGFR highlight the potential for BOLD MRI to be used clinically in PNS patients to evaluate their kidney function and prognosis [11,14].
Another recent study showed that higher cR2* values correlated positively with hypoxia and renal impairment in a sample of 29 patients with CKD, 9 of whom had underlying membranous glomerulonephritis [5]. Given that these findings were in CKD patients, of whom a large proportion had membranous glomerulonephritis, further investigation into an isolated patient population of those with MGN or other PNS is warranted. Such studies would help to support the use of BOLD MRI in the clinical setting for monitoring renal function in patients with PNS.
3. Nephrotic Syndrome Secondary to Diabetes Mellitus
Uncontrolled diabetes mellitus can lead to diabetic nephropathy (DN), which can later present as a secondary nephrotic syndrome. Development of nephrotic syndrome in diabetic patients involves multiple mechanisms and signaling pathways, including increased extracellular matrix deposition at the glomerular basement membrane. Longstanding diabetic nephropathy can lead to persistent albuminuria that depletes serum albumin, leading to edema and other classical symptoms of nephrotic syndrome [15]. The increased prevalence of secondary nephrotic syndrome due to diabetes has made screening for DN imperative. Testing for microalbuminuria has been a commonly used screening test in diabetic patients, but several studies have demonstrated that microalbuminuria often resolves in early stage DN patients and may not be an accurate biomarker [16,17,18]. While the introduction of contiguous tests, such as albumin to creatinine ratios, has attempted to increase the accuracy of screening and diagnosis, there is still room for innovation in this constantly developing area. Such potential makes BOLD MRI a highly attractive noninvasive alternative to evaluate DN progression.
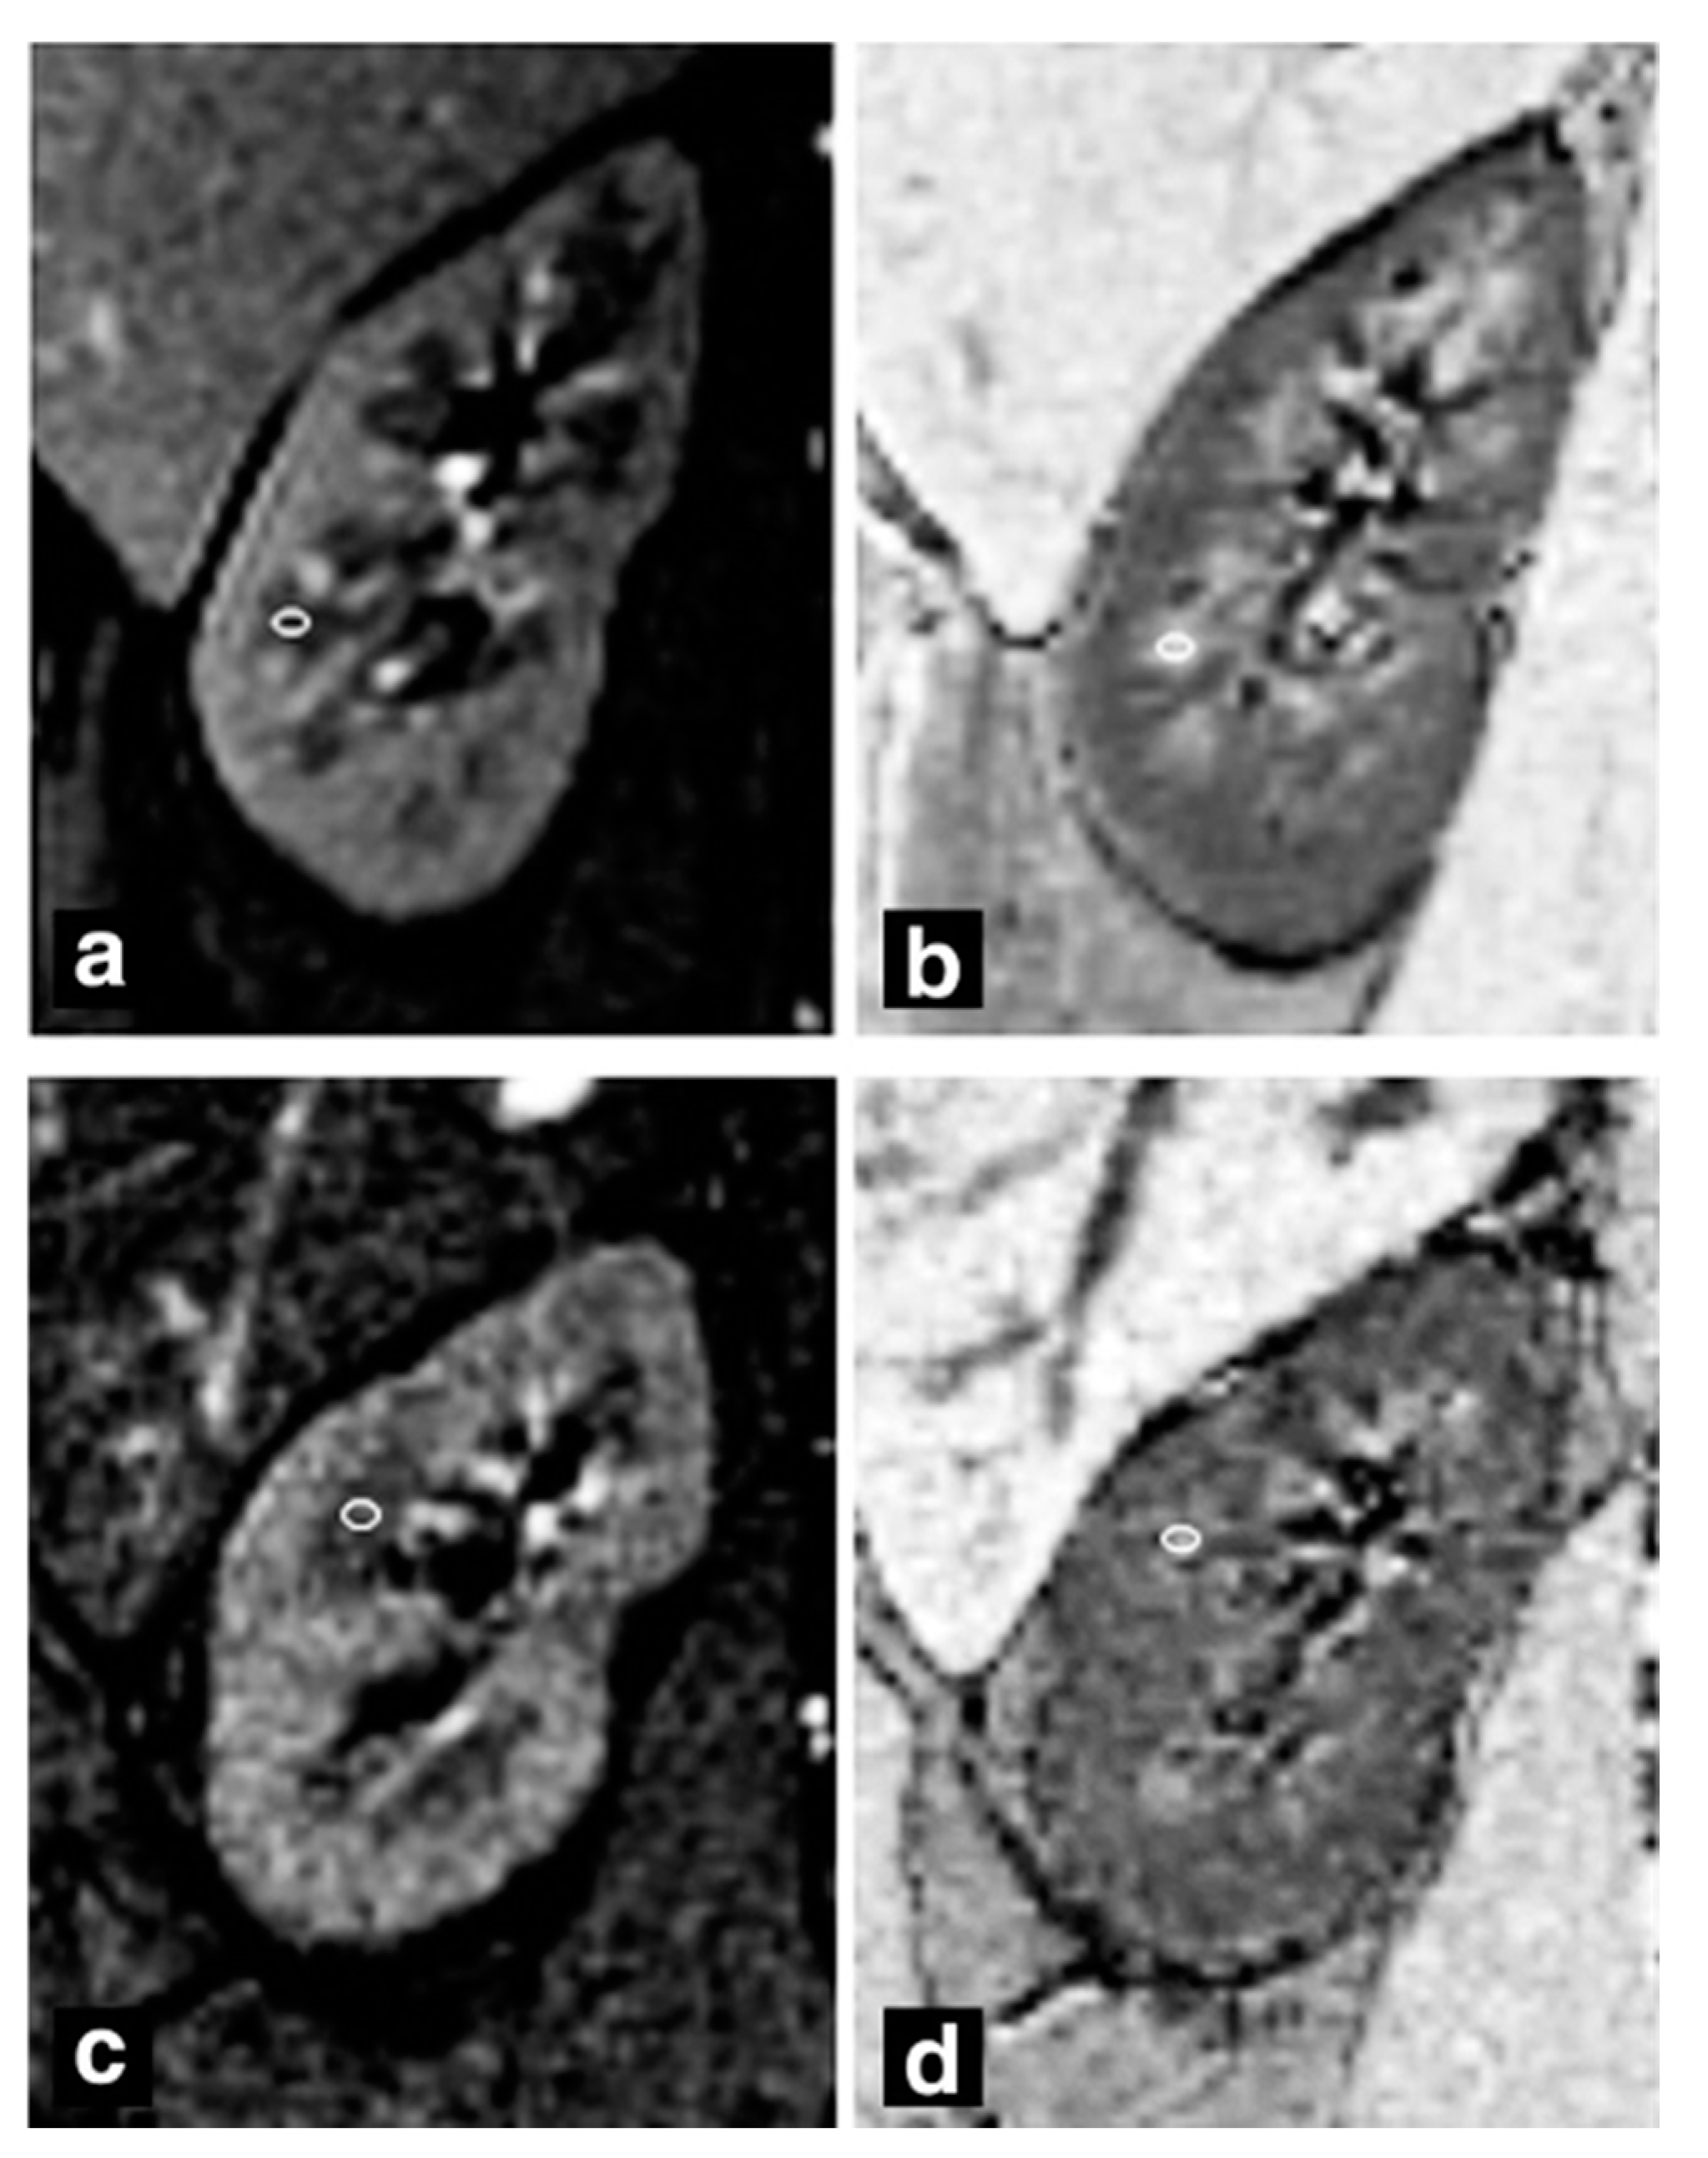
To this end, several studies have attempted to correlate BOLD MRI results with DN progression in order to monitor the disease before its development to nephrotic syndrome (Figure 2). One BOLD MRI study found that mR2* values were highest in diabetic patients with normoalbuminuria when compared to healthy patients and diabetic patients with microalbuminuria, suggesting that medullary hypoxia may resolve with DN progression [19]. These results are in contrast to another study by Wang et al., which found that mR2* values in DN patients were significantly lower than those in healthy patients (Figure 2) [20]. This discrepancy may be explained by the fact that advanced DN reduces the glomerular filtration rate, in turn decreasing sodium transport and renal oxygen usage [20]. A higher kidney oxygenation (lower mR2* values) occurs as a result, which may reconcile with the lower mR2* values found in Feng et al.’s moderately microalbuminuric patients.
However, other studies that examine the impact of drugs on DN patients still use lower mR2* values as an indicator of success. One study found that DN patients who received lipo-prostaglandin E1 had significant decreases in mR2* values due to a reduction in tissue hypoxia following 14 days of treatment, compared to no significant differences in non-diabetic CKD patients [21]. Pruijm et al. administered angiotensin-converting enzyme inhibitors and angiotensin II receptor blockers to patients with diabetic kidney disease to explore the utility of BOLD MRI [22]. Unlike Li et al., they found that a renin–angiotensin–aldosterone system (RAAS) blockade did not induce significant change in R2* values [22]. The authors suggested that hypoxia is not involved in early diabetic nephropathy, which is in direct contrast to Feng et al.’s conclusions. Given the heterogeneity of results, more studies are needed in order to fully explore the clinical use of BOLD MRI in assessment of diabetic nephropathy progression.
4. Nephritic Syndrome Secondary to Systemic Lupus Erythematosus
Systemic lupus erythematosus (SLE) is a complex disease that can affect nearly every organ system in the body. One of the deadliest manifestations is lupus nephritis (LN), a secondary glomerular disease that affects more than 60,000 Americans and is seen in more than 30% of SLE patients [23,24]. SLE patients often undergo frequent urinalysis, including urine protein excretion and sedimentation, in order to detect early manifestations of nephritis. An abnormal urinalysis raises suspicion for LN and may guide a physician’s decision to pursue a biopsy. Diagnosis and personalized treatment are often guided by biopsy, which classifies renal involvement using the International Society of Nephrology and the Renal Pathology Society (ISN/RPS) guidelines (Figure 3). LN can present as several different subtypes of both nephrotic and nephritic syndromes, and most commonly presents as diffuse proliferative nephritis, a type of nephritic syndrome. For simplicity’s sake, we grouped LN under secondary nephritic syndrome, as its most common manifestation is diffuse proliferative glomerulonephritis, a nephritic syndrome. It is worth acknowledging that LN can present as a nephrotic syndrome, and some of the following studies use a patient sample that has a mixed population of LN subtypes.
Unfortunately, many patients undergo multiple biopsies in the years after diagnosis in order to track the disease progression and monitor the response to treatment, increasing both the cost and inconvenience to the patient. This has driven the investigation into BOLD MRI’s potential use for diagnosis and monitoring of lupus nephritis. Several early landmark studies have shown promising results. Li et al. demonstrated that cR2* and mR2* values were significantly lower in LN patients than in healthy controls [25]. In contrast, two recent studies by Rapacci et al. and Shi et al. did not find significant associations between cortical or medullary R2* values and the disease state [26,27]. This contrast may be due to sample population differences, as a majority of Li et al.’s patients were ISN/RPS Class III and above. Nonetheless, both Shi et al. and Li et al. found that the degree of tubulointerstitial lesions was negatively correlated with mR2* [25,27]. Given this association and the fact that the degree of tubulointerstitial nephritis in LN is predictive of poor outcomes, mR2* values from BOLD MRI could serve a clinical role in LN patients [28].
5. Discussion
Although BOLD MRI was initially used for cerebrovascular imaging, its use in other organ systems is being increasingly explored. Recent literature demonstrates that BOLD MRI of the kidney has significant potential for clinical and research use (Table 1). Not only is the technology noninvasive, but it also allows clinicians to image and functionally understand renal blood flow and oxygenation without using contrast or radiation. Here, we explored advances made in understanding the technology underlying BOLD MRI for renal studies as well as for its potential diagnostic and clinical role in several nephrotic and nephritic syndromes. For diabetic patients, several studies used BOLD MRI to evaluate diabetic nephropathy progression, but the correlation of R2* values with DN stages yielded mixed results. Two studies that evaluated the effect of diabetic nephropathy treatment on BOLD MRI values differed, finding that lipo-prostaglandin E1 decreased mR2* levels, but that RAAS-modulating drugs did not [21,22]. These inconclusive results demonstrate that more BOLD MRI studies on diabetic nephropathy are needed. In regard to primary nephrotic syndrome, early research is supportive of BOLD MRI’s clinical use, although further research that evaluates each nephrotic syndrome individually (e.g., MGN) is needed, rather than summative analyses. Given the association of nephrotic syndrome with renal hypoxia and BOLD MRI’s utility in assessing intrarenal oxygenation, this technology may serve a role in determining a patient-specific prognosis as well as evaluating progression for those with PNS. Investigations into the utility of using BOLD MRI in nephritic syndrome secondary to lupus nephritis showed promise, as two recent studies found consistent and statistically significant correlations in the ability of BOLD MRI to detect tubulointerstitial pathology in LN patients. This raises the possibility of using the technology to track progression of tubulointerstitial lesions, or even playing a role in establishing the diagnosis. As prognosis and disease physiology in LN can widely differ based on ISN/RPS classification, studies with samples that are more proportionally balanced in terms of disease histopathology are needed to increase validity.
Considering that lesions in the glomeruli are primarily in the renal cortex, monitoring changes in cR2* values may appear more appropriate for BOLD imaging of glomerular diseases. However, most studies report a greater statistical significance between mR2* values and disease state compared to cR2* values and disease state. This may be explained by two reasons: The renal medulla receives less blood perfusion compared to the renal cortex, and sodium transporters in the renal medulla exert a high metabolic demand. Pathologic decreases in blood perfusion may result in a lower blood oxygen content, which is exacerbated by high oxygen consumption occurring in the medullary collecting ducts. While the lesions in nephrotic and nephritic syndrome are primarily in the cortex, there may be a pathologic downstream translation to the medulla, which could explain the high medullary signal in the presented data.
Although many of the reported studies are promising, it is important to address several limitations. First, BOLD MRI signals can be affected by factors such as temperature and pH. For example, increased temperature increases oxygen offloading, shifting the oxygenation dissociation curve to the right and causing changes in BOLD signal intensity, independent of perfusion. These distinct influences on oxygen offloading can complicate attempts to associate renal perfusion and BOLD MRI signals [9]. Furthermore, oxygenation, blood flow, sodium transport, and hydration status are all interdependent and any external or internal factors that influence those variables can create noise that interferes with BOLD signals. It is important that these variables are controlled as best as possible prior to proceeding with BOLD MRI, in both research studies and the clinic, for the standardization of results [8,29,30]. Non-oxygenation-related interference factors within BOLD MRI must also be addressed. For example, BOLD signal loss has been documented in neuroimaging, stemming from metal implants such as intracortical electrodes [31]. In renal imaging, the presence of nephrolithiasis or hip arthroplasty can limit visualization of target lesions. Additionally, motion artifacts such as body movement, physiologic noise (such as pulsatile cerebrospinal fluid and arterial blood), and instrumentation noise from scanners can cause interference with BOLD signals [31,32].
MRIs are also expensive and time consuming, limiting the number of participants enrolled in studies [5,11,26,27,29,33,34]. Larger sample sizes are necessary to validate whether BOLD MRI is truly effective in the clinical assessment of renal function in patients with glomerular disease; one study also recommended the use of multicenter randomized controlled trials for external validity of the usage of BOLD MRI [33]. Variability and limitations in imaging techniques within BOLD MRI also limit the internal validity. For example, ROI analysis is commonly used, but is known to have relatively poor levels of inter-observer reliability. Furthermore, in advanced stages of glomerular diseases, the renal cortex and medulla are often difficult to visually distinguish, impairing visualization of the ROI. The use of the TLCO technique has been shown to produce a higher sensitivity and specificity for BOLD imaging in advanced kidney diseases compared to ROI [35].
In conclusion, BOLD MRI has shown promising early results for potential use in clinical practice. While the technology has significant limitations that must be considered, numerous studies have shown encouraging findings that should be further investigated. These advancements in BOLD MRI have the potential to significantly change diagnosis, monitoring, and long-term outcomes of patients with glomerular disease.
Author Contributions
D.R.N., P.G., S.H., R.W. and A.S.T. conceived and outlined the study. D.R.N., P.G., S.H., R.W. and A.S.T. performed a literature search and analyzed the data. D.R.N., P.G., S.H., R.W. and A.S.T. contributed to preparing the manuscript draft. All authors have read and agreed to the published version of the manuscript.
Funding
The authors received no financial support for the research, authorship, or publication of this article.
Institutional Review Board Statement
Not applicable.
Informed Consent Statement
Not applicable.
Data Availability
Sourced data is publicly available in online repositories.
Conflicts of Interest
The authors declare no conflict of interest.
Abbreviations
| BOLD MRI | Blood oxygen level-dependent magnetic resonance imaging |
| CKD | Chronic kidney disease |
| DN | Diabetic nephropathy |
| eGFR | Estimated glomerular filtration rate |
| ISN/RPS | International Society of Nephrology/Renal Pathology Society |
| LN | Lupus nephritis |
| mGRE | Multiple gradient-recalled-echo |
| PNS | Primary nephrotic syndrome |
| ROI | Region of interest |
| TLCO | Twelve-layer concentric objects |
References
- Zech, P.; Colon, S.; Pointet, P.; Deteix, P.; Labeeuw, M.; Leitienne, P. The nephrotic syndrome in adults aged over 60: Etiology, evolution and treatment of 76 cases. Clin. Nephrol. 1982, 17, 232–236. [Google Scholar]
- Eckardt, K.-U.; Rosenberger, C.; Jürgensen, J.S.; Wiesener, M.S. Role of hypoxia in the pathogenesis of renal disease. Blood Purif. 2003. [Google Scholar] [CrossRef]
- Shu, S.; Wang, Y.; Zheng, M.; Liu, Z.; Cai, J.; Tang, C.; Dong, Z. Hypoxia and hypoxia-inducible factors in kidney injury and repair. Cells 2019, 8, 207. [Google Scholar] [CrossRef] [PubMed] [Green Version]
- Wang, J.; Zhong, J.; Yang, H.C.; Fogo, A.B. Cross talk from tubules to glomeruli. Toxicol. Pathol. 2018. [Google Scholar] [CrossRef] [PubMed]
- Li, C.; Liu, H.; Li, X.; Zhou, L.; Wang, R.; Zhang, Y. Application of BOLD-MRI in the classification of renal function in chronic kidney disease. Abdom. Radiol. 2019, 44, 604–611. [Google Scholar] [CrossRef] [PubMed] [Green Version]
- Raichle, M.E. Behind the scenes of functional brain imaging: A historical and physiological perspective. Proc. Natl. Acad. Sci. USA 1998. [Google Scholar] [CrossRef] [PubMed] [Green Version]
- Chaudhary, U.J.; Duncan, J.S.; Lemieux, L. Mapping hemodynamic correlates of seizures using fMRI: A review. Hum. Brain Mapp. 2013. [Google Scholar] [CrossRef]
- Pruijm, M.; Mendichovszky, I.A.; Liss, P.; Van Der Niepen, P.; Textor, S.C.; Lerman, L.O.; Krediet, C.T.P.; Caroli, A.; Burnier, M.; Prasad, P.V. Renal blood oxygenation level-dependent magnetic resonance imaging to measure renal tissue oxygenation: A statement paper and systematic review. Nephrol. Dial. Transpl. 2018. [Google Scholar] [CrossRef] [Green Version]
- Li, L.-P.; Halter, S.; Prasad, P. Blood oxygen level-dependent MR imaging of the kidneys. Magn. Reson. Imaging Clin. N. Am. 2008. [Google Scholar] [CrossRef] [Green Version]
- Pruijm, M.; Milani, B.; Burnier, M. Blood oxygenation level-dependent mri to assess renal oxygenation in renal diseases: Progresses and challenges. Front. Physiol. 2017. [Google Scholar] [CrossRef] [Green Version]
- Zhang, R.; Wang, Y.; Chen, F.; Wang, Q.; Wang, Z.; Chen, Y.; Xiao, W. Noninvasive evaluation of renal oxygenation in primary nephrotic syndrome with blood oxygen level dependent magnetic resonance imaging: Initial experience. J. Int. Med. Res. 2015, 43, 356–363. [Google Scholar] [CrossRef] [PubMed] [Green Version]
- Brezis, M.; Agmon, Y.; Epstein, F.H. Determinants of intrarenal oxygenation I. Effects of diuretics. Am. J. Physiol. Ren. Fluid Electrolyte Physiol. 1994, 267, F1059–F1062. [Google Scholar] [CrossRef]
- Djamali, A.; Sadowski, E.A.; Samaniego-Picota, M.; Fain, S.B.; Muehrer, R.J.; Alford, S.K.; Grist, T.M.; Becker, B.N. Noninvasive assessment of early kidney allograft dysfunction by blood oxygen level-dependent magnetic resonance imaging. Transplantation 2006, 82, 621–628. [Google Scholar] [CrossRef]
- Inoue, T.; Kozawa, E.; Okada, H.; Inukai, K.; Watanabe, S.; Kikuta, T.; Watanabe, Y.; Takenaka, T.; Katayama, S.; Tanaka, J.; et al. Noninvasive evaluation of kidney hypoxia and fibrosis using magnetic resonance imaging. J. Am. Soc. Nephrol. 2011, 22, 1429–1434. [Google Scholar] [CrossRef] [PubMed] [Green Version]
- Satirapoj, B.; Adler, S.G. Comprehensive approach to diabetic nephropathy. Kidney Res. Clin. Pract. 2014, 33, 121–131. [Google Scholar] [CrossRef] [PubMed] [Green Version]
- Kim, S.S.; Kim, J.H.; Kim, I.J. Current challenges in diabetic nephropathy: Early diagnosis and ways to improve outcomes. Endocrinol. Metab. 2016, 31, 245–253. [Google Scholar] [CrossRef] [PubMed] [Green Version]
- Caramori, M.L.; Fioretto, P.; Mauer, M. The need for early predictors of diabetic nephropathy risk is albumin excretion rate sufficient? Diabetes 2000, 49, 1399–1408. Available online: https://diabetes.diabetesjournals.org/content/49/9/1399.short (accessed on 14 August 2020). [CrossRef] [PubMed] [Green Version]
- Gross, J.L.; de Azevedo, M.J.; Silveiro, S.P.; Canani, L.H.; Caramori, M.L.; Zelmanovitz, T. Diabetic nephropathy: Diagnosis, prevention, and treatment. Diabetes Care 2005, 28, 164–176. [Google Scholar] [CrossRef] [Green Version]
- Feng, Y.-Z.; Ye, Y.-J.; Cheng, Z.-Y.; Hu, J.-J.; Zhang, C.-B.; Qian, L.; Lu, X.-H.; Cai, X.-R.; Cai, X.-H. Non-invasive assessment of early stage diabetic nephropathy by DTI and BOLD MRI. Br. J. Radiol. 2020, 93, 20190562. [Google Scholar] [CrossRef]
- Wang, Z.J.; Kumar, R.; Banerjee, S.; Hsu, C. Blood oxygen level-dependent (BOLD) MRI of diabetic nephropathy: Preliminary experience. J. Magn. Reson. Imaging 2011, 33, 655–660. [Google Scholar] [CrossRef] [Green Version]
- Li, Z.C.; Cai, Y.Z.; Tang, Z.G.; Zuo, P.L.; Liu, R.B.; Liu, F. Lipo-prostaglandin E1 improves renal hypoxia evaluated by BOLD-MRI in patients with diabetic kidney disease. Clin. Imaging 2018, 50, 239–242. [Google Scholar] [CrossRef] [PubMed]
- Pruijm, M.; Hofmann, L.; Zanchi, A.; Maillard, M.; Forni, V.; Muller, M.-E.; Wuerzner, G.; Vogt, B.; Stuber, M.; Burnier, M. Blockade of the renin-angiotensin system and renal tissue oxygenation as measured with BOLD-MRI in patients with type 2 diabetes. Diabetes Res. Clin. Pract. 2013, 99, 136–144. [Google Scholar] [CrossRef] [PubMed]
- Kasitanon, N.; Magder, L.S.; Petri, M. Predictors of survival in systemic lupus erythematosus. Medicine 2006. [Google Scholar] [CrossRef] [PubMed]
- Gandhi, K.; Alemao, E.; Kawabata, H.; Hillson, J.L. Prevalence of systemic lupus erythematosus and lupus nephritis in the United States: Analysis of commercial and public insurance billing data. Arthritis Rheum. 2013. [Google Scholar] [CrossRef]
- Li, X.; Xu, X.; Zhang, Q.; Ren, H.; Zhang, W.; Liu, Y.; Yan, F.; Chen, N. Diffusion weighted imaging and blood oxygen level-dependent MR imaging of kidneys in patients with lupus nephritis. J. Transl. Med. 2014. [Google Scholar] [CrossRef]
- Rapacchi, S.; Smith, R.X.; Wang, Y.; Yan, L.; Sigalov, V.; Krasileva, K.E.; Karpouzas, G.; Plotnik, A.; Sayre, J.; Hernandez, E.; et al. Towards the identification of multi-parametric quantitative MRI biomarkers in lupus nephritis. Magn. Reson. Imaging 2015, 33, 1066–1074. [Google Scholar] [CrossRef] [Green Version]
- Shi, H.; Yan, T.; Li, N.; Jia, J.; Shang, W.; Wei, L.; Zheng, Z. Detection of renal hypoxia in lupus nephritis using blood oxygen level-dependent MR imaging: A multiple correspondence analysis. Kidney Blood Press. Res. 2017, 42, 123–135. [Google Scholar] [CrossRef] [Green Version]
- Yu, F.; Wu, L.-H.; Tan, Y.; Li, L.-H.; Wang, C.-L.; Wang, W.-K.; Qu, Z.; Chen, M.-H.; Gao, J.-J.; Li, Z.-Y.; et al. Tubulointerstitial lesions of patients with lupus nephritis classified by the 2003 International Society of Nephrology and Renal Pathology Society system. Kidney Int. 2010. [Google Scholar] [CrossRef] [Green Version]
- Prasad, P.V.; Thacker, J.; Li, L.-P.; Haque, M.; Li, W.; Koenigs, H.; Zhou, Y.; Sprague, S.M. Multi-Parametric evaluation of chronic kidney disease by MRI: A preliminary cross-sectional study. PLoS ONE 2015, 10, e0139661. [Google Scholar] [CrossRef] [Green Version]
- Bane, O.; Mendichovszky, I.A.; Milani, B.; Dekkers, I.A.; Deux, J.-F.; Eckerbom, P.; Grenier, N.; Hall, M.E.; Inoue, T.; Laustsen, C.; et al. Consensus-based technical recommendations for clinical translation of renal BOLD MRI. Magn. Reson. Mater. Phys. Biol. Med. 2020. [Google Scholar] [CrossRef] [Green Version]
- Khalid, M.U.; Shah, A.; Seghouane, A.K. Adaptive 2DCCA based approach for improving spatial specificity of activation detection in functional MRI. In Proceedings of the 2012 International Conference on Digital Image Computing Techniques and Applications (DICTA), Fremantle, WA, Australia, 3–5 December 2012. [Google Scholar] [CrossRef]
- Brooks, J.C.W.; Faull, O.K.; Pattinson, K.T.S.; Jenkinson, M. Physiological noise in brainstem fMRI. Front. Hum. Neurosci. 2013. [Google Scholar] [CrossRef] [PubMed] [Green Version]
- Luo, F.; Liao, Y.; Cui, K.; Tao, Y. Noninvasive evaluation of renal oxygenation in children with chronic kidney disease using blood-oxygen-level-dependent magnetic resonance imaging. Pediatr. Radiol. 2020, 50, 848–854. [Google Scholar] [CrossRef] [Green Version]
- Xin-Long, P.; Jing-Xia, X.; Jian-Yu, L.; Song, W.; Xin-Kui, T. A preliminary study of blood-oxygen-level-dependent MRI in patients with chronic kidney disease. Magn. Reson. Imaging 2012, 30, 330–335. [Google Scholar] [CrossRef] [PubMed]
- Milani, B.; Ansaloni, A.; Sousa-Guimaraes, S.; Vakilzadeh, N.; Piskunowicz, M.; Vogt, B.; Stuber, M.; Burnier, M.; Pruijm, M. Reduction of cortical oxygenation in chronic kidney disease: Evidence obtained with a new analysis method of blood oxygenation level-dependent magnetic resonance imaging. Nephrol. Dial. Transpl. 2017, 32, 2097–2105. [Google Scholar] [CrossRef] [PubMed] [Green Version]
Figure 1.
Demonstration of blood oxygenation level-dependent magnetic resonance imaging (BOLD MRI) kidney visualization. (A) Region of interest (ROI) technique with circles demonstrating ROIs, and (B) Twelve-layer concentric objects (TLCO) technique. (Figure reprinted with permission from Oxford Academic, from Prujim et al., 2018).

Figure 2.
Representative BOLD MRI images of healthy and diabetic nephropathy patients. (a,b) Gradient-recalled-echo maps and R2* maps of a healthy patient, respectively. (c,d) Gradient-recalled-echo maps and R2* maps of a patient with diabetic nephropathy, respectively. There is a greater degree of contrast between the cortex and medulla of the healthy patient compared to the diabetic patient, indicating decreased mR2* values that result in reduced contrast. (Figure reprinted with permission from Wiley, from Wang et al., 2011).

Figure 3.
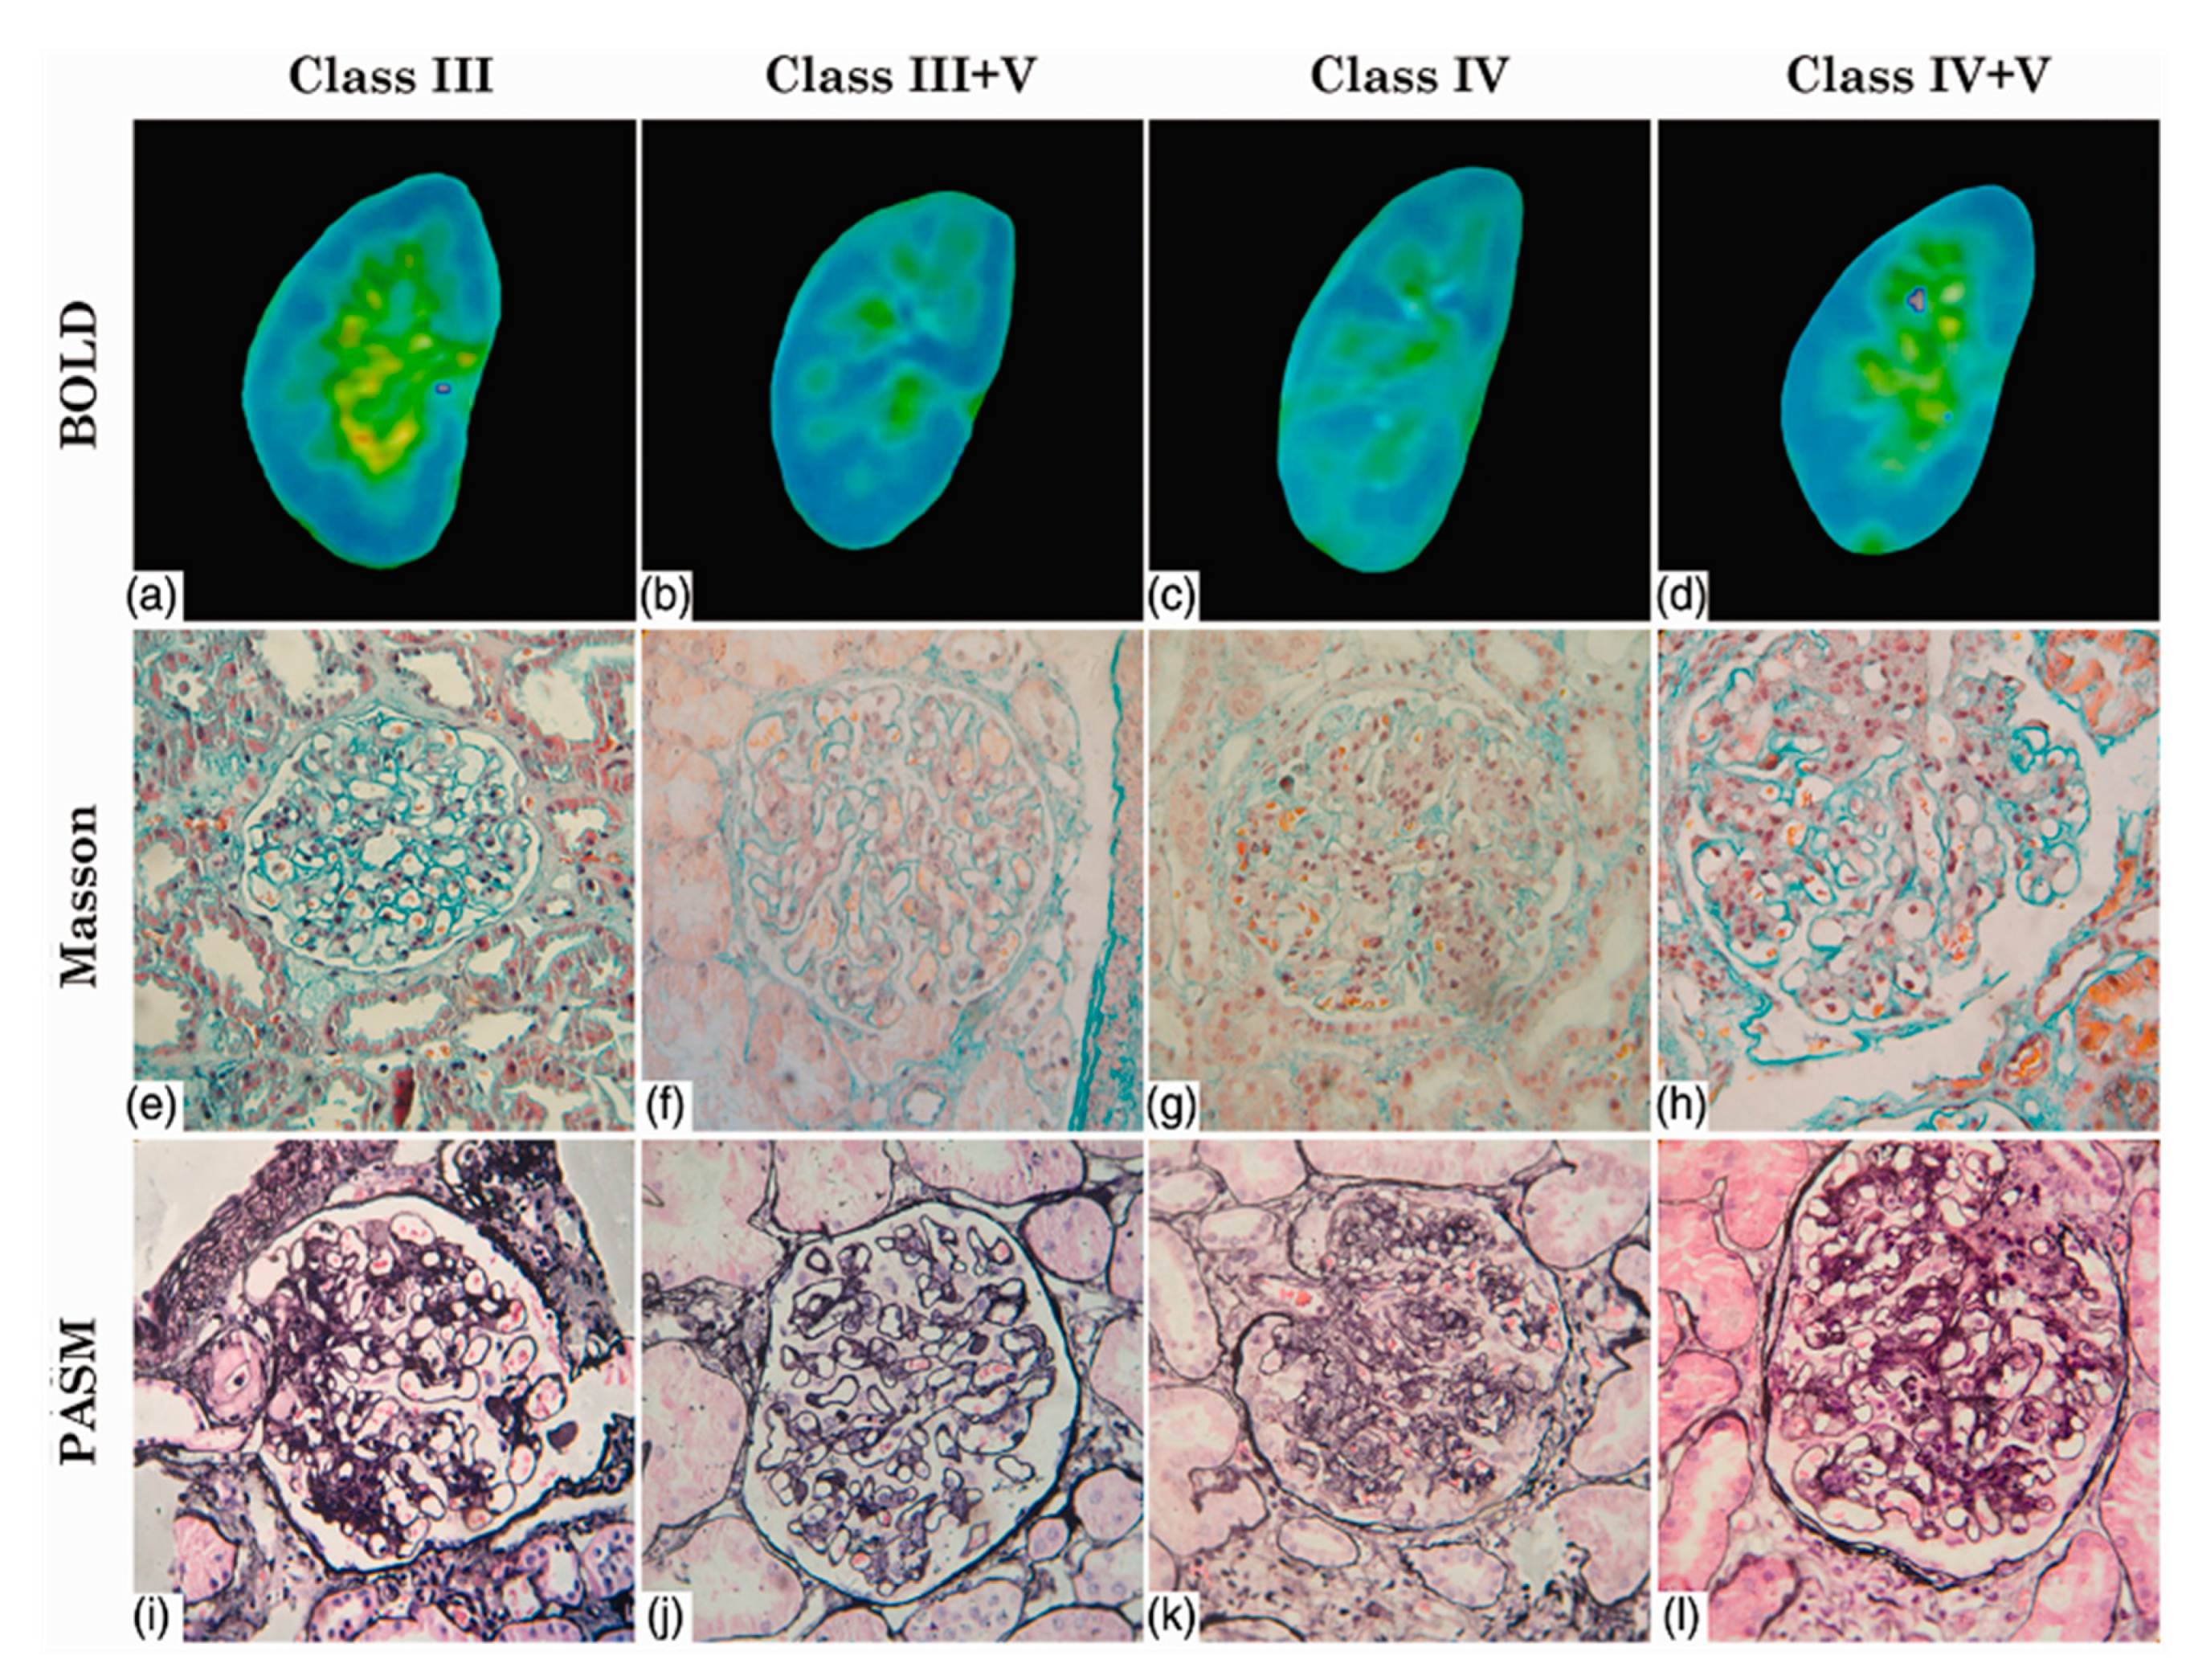
Use of blood oxygen level-dependent (BOLD) MRI to visualize lupus nephritis lesions with corresponding biopsy pathology specimens categorized by the International Society of Nephrology and the Renal Pathology Society (ISN/RPS) classes. (a,e,i) Class III; (b,f,j) Class III + V; (c,g,k) Class IV; (d,h,l) Class IV + V. Blue areas in (a–d) indicate low R2* values and oxyhemoglobin levels, with green, yellow, and red areas representing increases in both, in that respective order. Staining in (e–h) was done using Masson’s trichome, and staining in (i–l) was done using Periodic acid-Schiff-methenamine silver. (Figure reprinted with permission from SAGE publishers, from Shi et al., 2018).
Figure 3.
Use of blood oxygen level-dependent (BOLD) MRI to visualize lupus nephritis lesions with corresponding biopsy pathology specimens categorized by the International Society of Nephrology and the Renal Pathology Society (ISN/RPS) classes. (a,e,i) Class III; (b,f,j) Class III + V; (c,g,k) Class IV; (d,h,l) Class IV + V. Blue areas in (a–d) indicate low R2* values and oxyhemoglobin levels, with green, yellow, and red areas representing increases in both, in that respective order. Staining in (e–h) was done using Masson’s trichome, and staining in (i–l) was done using Periodic acid-Schiff-methenamine silver. (Figure reprinted with permission from SAGE publishers, from Shi et al., 2018).


Table 1.
Summary of BOLD MRI studies. MG = membranous glomerulonephritis, PNS = primary nephrotic syndrome, DN = diabetic nephropathy, LN = lupus nephritis, NAU = normal to mildly increased albuminuria, MAU = moderately increased albuminuria, TR = repetition time, TE = echo time.
Table 1.
Summary of BOLD MRI studies. MG = membranous glomerulonephritis, PNS = primary nephrotic syndrome, DN = diabetic nephropathy, LN = lupus nephritis, NAU = normal to mildly increased albuminuria, MAU = moderately increased albuminuria, TR = repetition time, TE = echo time.
| Author | Year | Design | Population | TR (ms)/ TE (ms) | Disease Stage | eGFR (mL/min/1.73 m2) (Patients, Volunteers) | cR2* (sec−1) (Patients, Volunteers) | mR2 * (sec−1) (Patients, Volunteers) | Statistical Analysis |
|---|---|---|---|---|---|---|---|---|---|
| Li et al. [5] | 2018 | Prospective case-control | 9 MG patients, 27 healthy volunteers | 100/1.76–18.68 | -- | --, 110.8 ± 11.2 | -- | -- | Pearson correlation, ANOVA |
| Zhang et al. [11] | 2015 | Prospective case-control | 20 PNS patients, 18 healthy volunteers | 150/1.6–77.5 | -- | -- | 20.4 ± 3.9, 19.7 ± 0.7 | 24.0 ± 5.9, 36.5 ± 1.3 | Spearman’s correlation coefficient, t-test |
| Feng et al. [19] | 2020 | Retrospective case-control | 30 DN patients, 15 healthy volunteers | 150/3.4–27.8 | NAU, MAU | 97.9 ± 8.8, 103.7 ± 11.9 a | 17.0 ± 1.9, 16.7 ± 1.6 a,b | 28.1 ± 3.8, 28.9 ± 3.8 a,b | Pearson correlation, ANOVA |
| Wang et al. [20] | 2011 | Prospective non-randomized trial | 20 DN patients, 7 healthy volunteers | 65/7–53 | Mild, moderate-severe | -- | 13.8 ± 2.4, 19.3 ± 1.2 | 11.1 ± 0.9, 11.5 ± 0.7 | Multiple logistic regression, t-test |
| Li et al. [21] | 2018 | Prospective case-control | 16 DN patients | 90/3.29–40.22 | Class II–IV | 28.4 ± 25.1, -- | 23.3 ± 6.5, -b | 29.4 ± 6.7, --b | t-test, ANOVA |
| Pruijm et al. [22] | 2013 | Prospective randomized two-way crossover study | 12 DN patients | 68/6–52.2 | -- | 62.0 ± 22.0, -- | 17.9 ± 1.5, -- | 28.7 ± 1.3, -- | Spearman’s rank test, ANOVA |
| Li et al. [25] | 2014 | Retrospective case-control | 65 LN patients, 16 healthy volunteers | 110/2.2–27.5 | Class I–V | -- | 11.0 ± 1.6, 12.6 ± 1.4 | 14.1 ± 3.4, 18.1 ± 2.5 | Pearson correlation, t-test |
| Rapacchi et al. [26] | 2015 | Retrospective case-control | 10 LN patients, 10 healthy volunteers | 187/2.2–43.7 | Class III–V | 104.7 ± 38.3, 88.3 ± 13.1 | -- | -- | Stepwise logistic regression, unpaired t-test |
| Shi et al. [27] | 2017 | Retrospective case-control | 23 LN patients, 10 healthy volunteers | 100/2.4–29 | Class III–V | 102.7 ± 24.8, 112.2 ± 18.8 | -- | -- | Multiple correspondence, ANOVA |
a MAU values. NAU values are as follows: estimated glomerular filtration rate (eGFR) 102.02 ± 17.80 (mL/min/1.73m2), cR2* 16.43 ± 2.12 (msec−1), mR2 * 34.61 ± 3.39 (msec−1). b (msec−1).
Publisher’s Note: MDPI stays neutral with regard to jurisdictional claims in published maps and institutional affiliations. |
© 2021 by the authors. Licensee MDPI, Basel, Switzerland. This article is an open access article distributed under the terms and conditions of the Creative Commons Attribution (CC BY) license (https://creativecommons.org/licenses/by/4.0/).
Share and Cite
MDPI and ACS Style
Nemirovsky, D.R.; Gupta, P.; Hu, S.; Wong, R.; Thakor, A.S. Blood Oxygen Level-Dependent (BOLD) MRI in Glomerular Disease. Transplantology 2021, 2, 109-117. https://0-doi-org.brum.beds.ac.uk/10.3390/transplantology2020011
AMA Style
Nemirovsky DR, Gupta P, Hu S, Wong R, Thakor AS. Blood Oxygen Level-Dependent (BOLD) MRI in Glomerular Disease. Transplantology. 2021; 2(2):109-117. https://0-doi-org.brum.beds.ac.uk/10.3390/transplantology2020011
Chicago/Turabian StyleNemirovsky, Daniel R., Puneet Gupta, Sophia Hu, Raymond Wong, and Avnesh S. Thakor. 2021. "Blood Oxygen Level-Dependent (BOLD) MRI in Glomerular Disease" Transplantology 2, no. 2: 109-117. https://0-doi-org.brum.beds.ac.uk/10.3390/transplantology2020011