A New Approach to Exploring the Relationship between Weather Phenomenon and Truck Traffic Volume in the Cold Region Highway Network


Abstract
:1. Introduction
2. Literature Review
3. MIC, MINE Concept
4. Data
5. Methodology
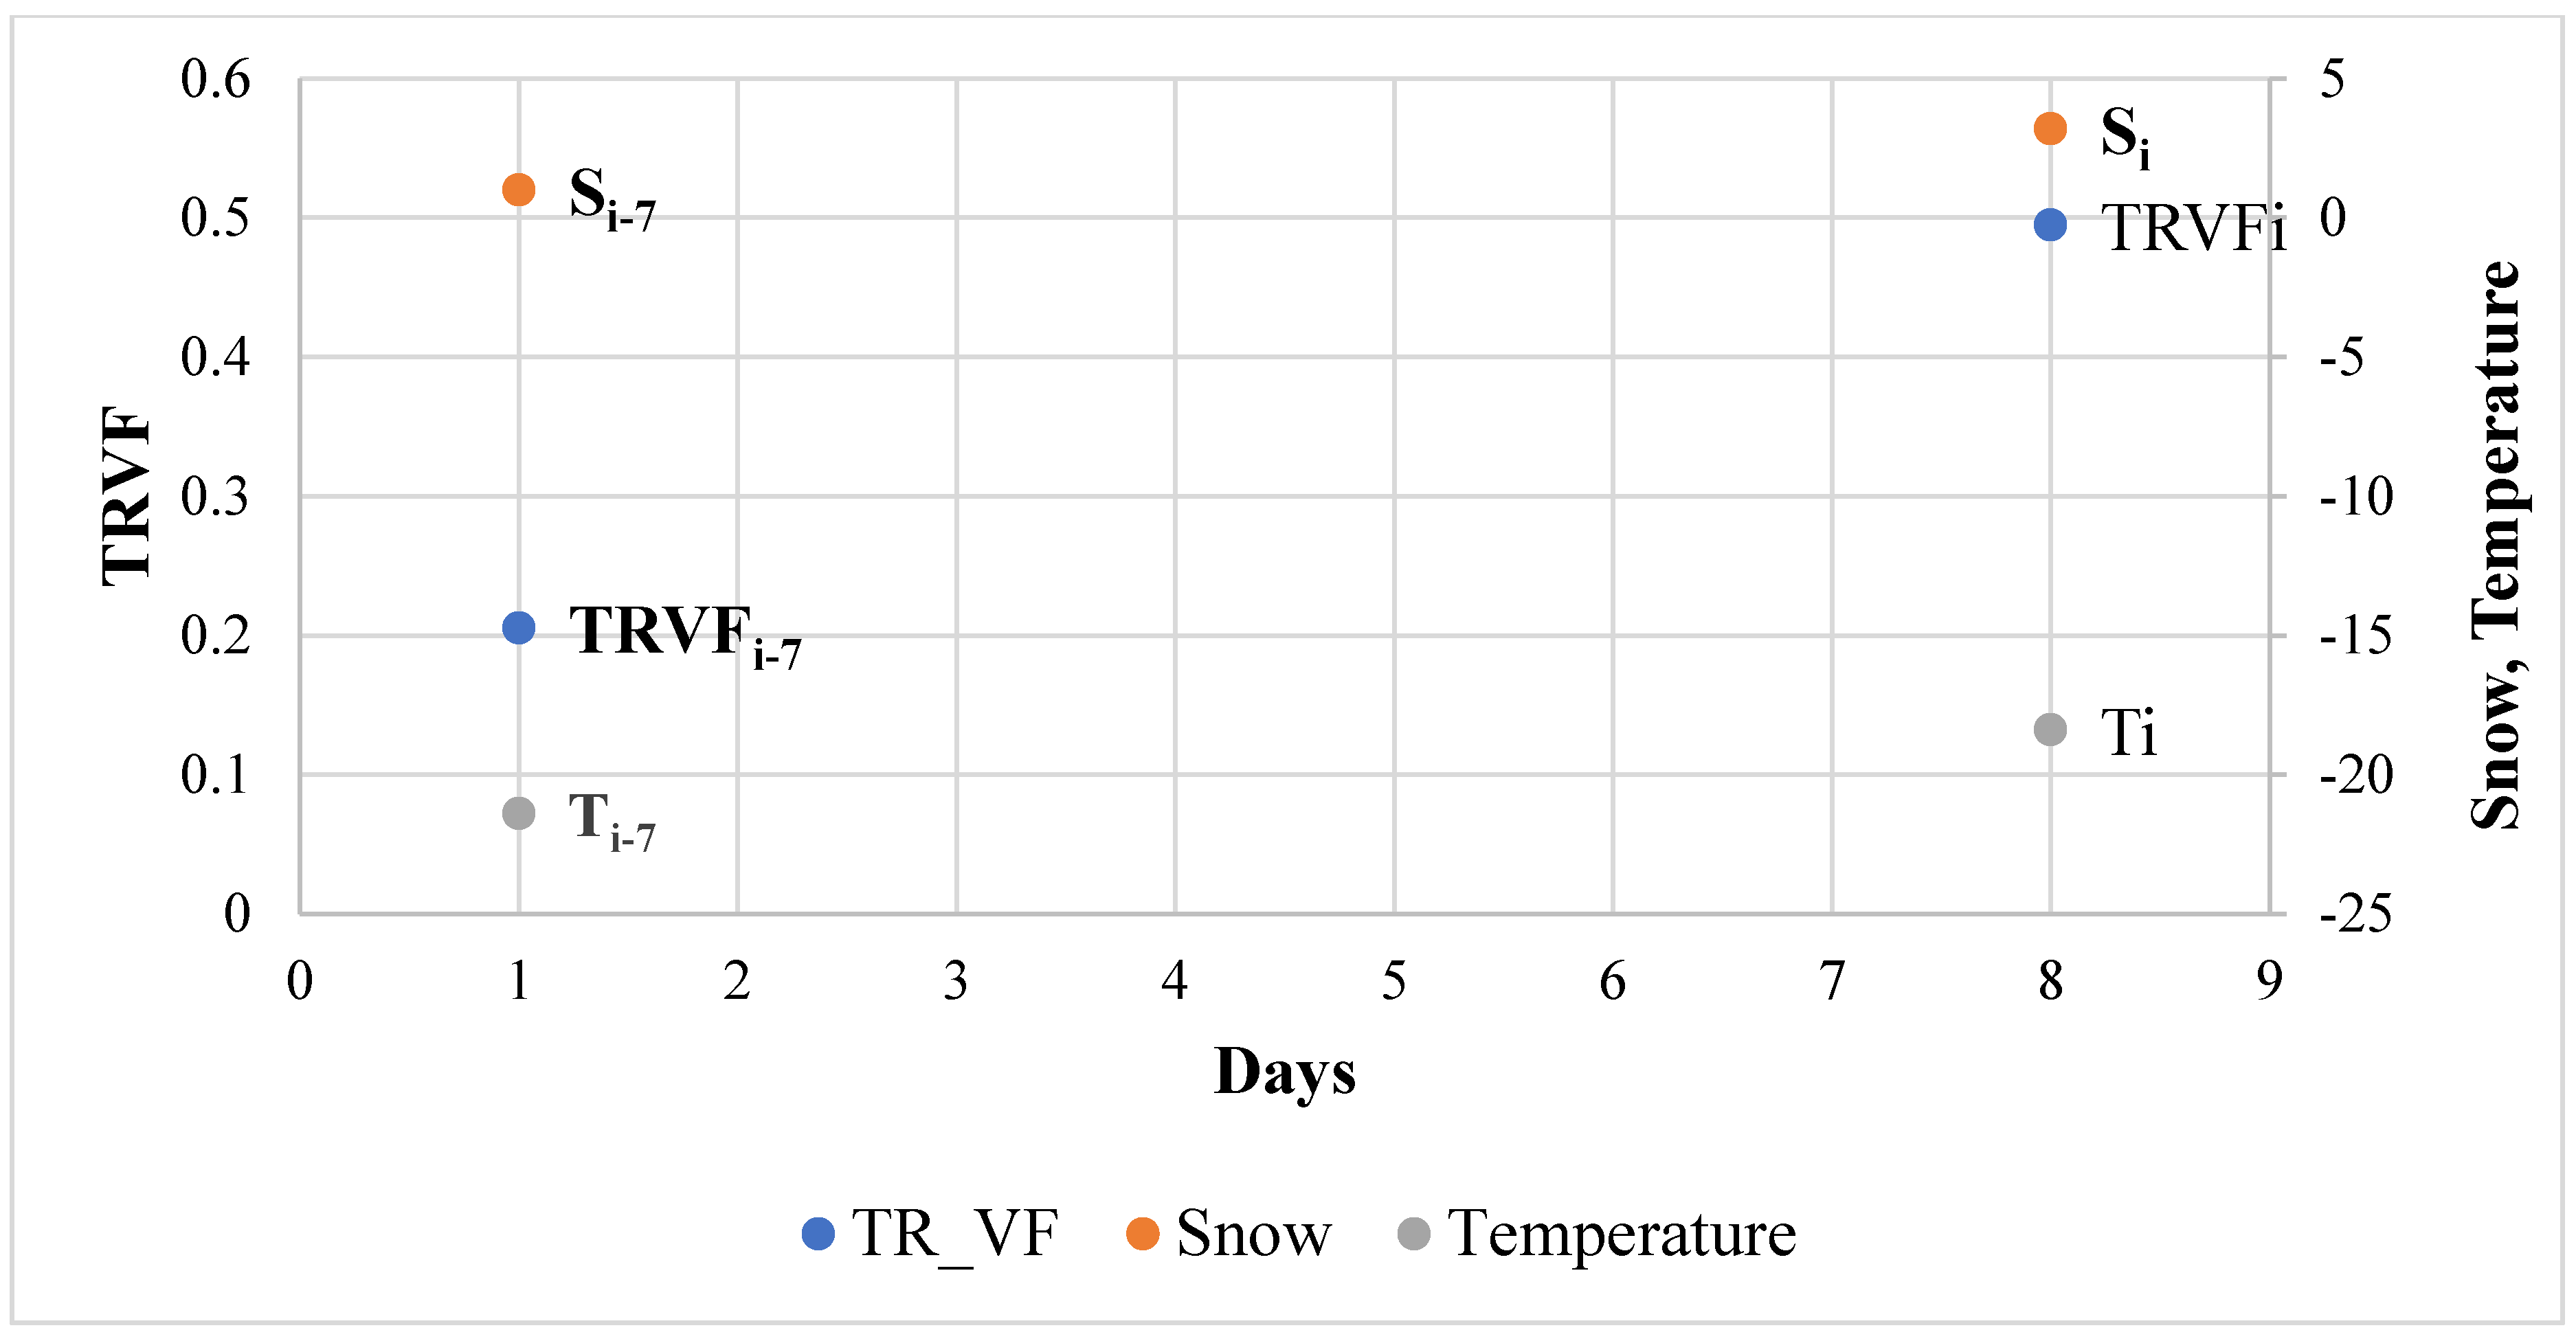
- Classification of snowy days based on changes in weather conditions from the same weekday in the previous week.
- MINE analysis on the obtained classified data.
- 1.
- Snow Difference:
- 2.
- Temperature Difference:
- 3.
- TRVF Difference:
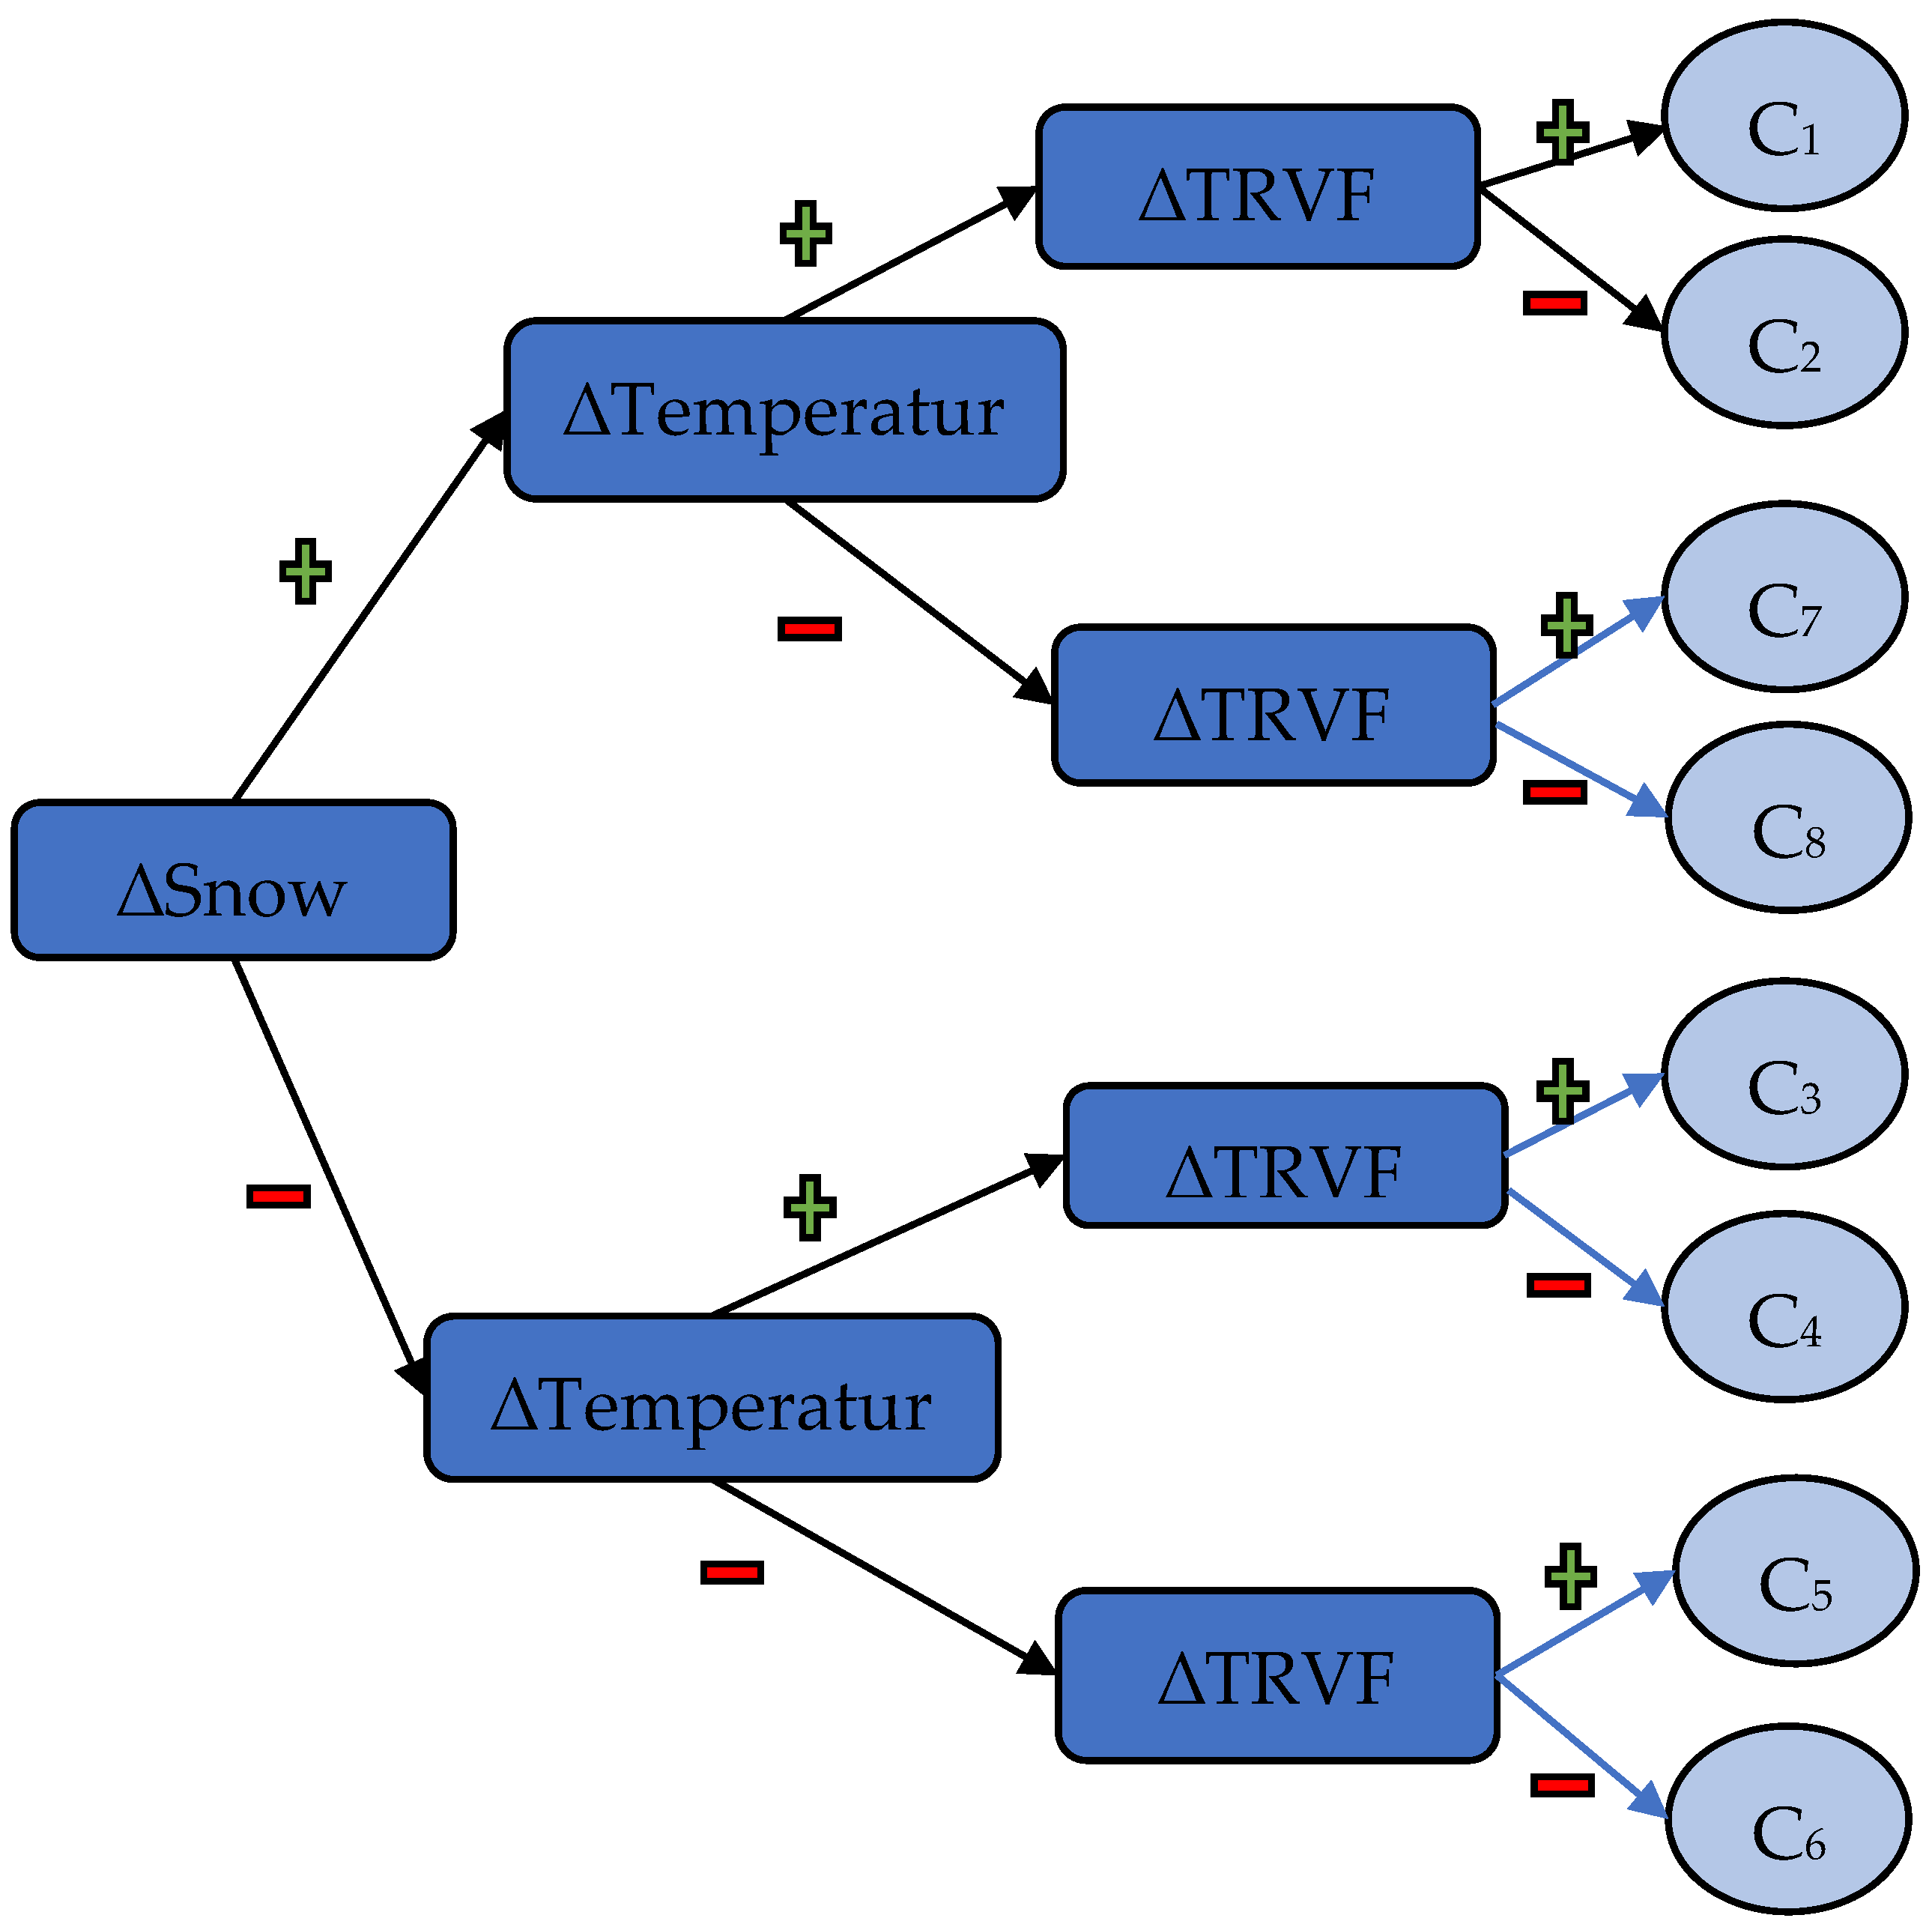
- C1Number of cases (days on which) when ∆Si > 0 (snowfall increases), ∆Ti > 0 (temperature increases) and ∆TRVFi > 0 (traffic count increases)
- C2Number of cases (days on which) when ∆Si > 0 (snowfall increases), ∆Ti > 0 (temperature increases) and ∆TRVFi < 0 (traffic count decreases)
- C3Number of cases (days on which) when ∆Si < 0 (snowfall decreases), ∆Ti > 0(temperature increases) and ∆TRVFi > 0 (traffic count increases)
- C4Number of cases (days on which) when ∆Si < 0 (snowfall decreases), ∆Ti > 0 (temperature increases) and ∆TRVFi < 0 (traffic count decreases)
- C5Number of cases (days on which) when ∆Si < 0 (snowfall decreases), ∆Ti < 0(temperature decreases) and ∆TRVFi > 0 (traffic count increases)
- C6Number of cases (days on which) when ∆Si < 0 (snowfall decreases), ∆Ti < 0 (temperature decreases) and ∆TRVFi < 0 (traffic decrease)
- C7Number of cases (days on which) when ∆Si > 0 (snowfall increases), ∆Ti < 0 (temperature decreases) and ∆TRVFi > 0 (traffic count increases)
- C8Number of cases (days on which) when ∆Si > 0 (snowfall increases), ∆Ti < 0 (temperature decreases) and ∆TRVFi < 0 (traffic count decreases)
- C9Number of cases for which, ∆Si = 0 or ∆Ti = 0
6. Results and Analysis
7. Discussion and Conclusions
Author Contributions
Funding
Conflicts of Interest
References
- Hassan, Y.A.; Barker, J.J. The impact of unseasonable or extreme weather on traffic activity within Lothian region, Scotland. J. Transp. Geogr. 1999, 7, 209–213. [Google Scholar] [CrossRef]
- Angel, M.; Sando, M.; Chimba, D.; Kwigizile, V. Effects of rain on traffic operations on florida freeways. J. Transp. Res. Board 2014, 2440. [Google Scholar] [CrossRef]
- Singhal, A.; Kamga, C. Impact of weather on urban transit ridership. Transp. Res. Part A Policy Pract. 2014, 69, 379–391. [Google Scholar] [CrossRef]
- Datla, S.; Sharma, S. Impact of cold and snow on temporal and spatial variations of highway traffic volumes. J. Transp. Geogr. 2008, 16, 358–372. [Google Scholar] [CrossRef]
- Knapp, K.K.; Smithson, L.D. Winter storm event volume impact analysis using multiple-source archived monitoring data. Transp. Res. Record 2000, 1700, 10–16. [Google Scholar] [CrossRef]
- Maze, T.H.; Crum, M.R.; Burchett, G. An Investigation of User Costs and Benefits of Winter Road Closures. 2005. Available online: http://lib.dr.iastate.edu/intrans_reports/21 (accessed on 20 October 2019).
- Pierce, D.; Short, J. Road closures and freight diversion: Analysis with empirical data. Transp. Res. Record 2012, 2269, 51–57. [Google Scholar] [CrossRef]
- Datla, S.; Sahu, P.; Roh, H.-J.; Sharma, S. A comprehensive analysis of the association of highway traffic with winter weather conditions. Procedia Soc. Behav. Sci. 2013, 104, 497–506. [Google Scholar] [CrossRef] [Green Version]
- Bardal, K.G. Impacts of adverse weather on arctic road transport. J. Transp. Geogr. 2017, 59, 49–58. [Google Scholar] [CrossRef]
- Roh, H.J.; Sharma, S.; Sahu, P.; Datla, S. Analysis and modeling of highway truck traffic volume variations during severe winter weather conditions in Canada. J. Mod. Transp. 2015, 23, 228–239. [Google Scholar] [CrossRef] [Green Version]
- Roh, H.J.; Sahu, P.; Sharma, S.; Datla, S.; Mehran, B. Statistical investigations of snowfall and temperature interaction with passenger car and truck traffic on primary highways in Canada. J. Cold Reg. Eng. 2016, 30. [Google Scholar] [CrossRef]
- Reshef, D.N.; Reshef, Y.A.; Finucane, H.K.; Grossman, S.R.; McVean, G.; Turnbaugh, P.J.; Lander, E.S.; Mitzenmacher, M.; Sabeti, P.C. Detecting novel associations in large data sets. Science 2011, 334, 1518–1524. [Google Scholar] [CrossRef] [PubMed] [Green Version]
- Keay, K.; Simmonds, I. The association of rainfall and other weather variables with road traffic volume in Melbourne, Australia. Accid. Anal. Prev. 2005, 37, 109–124. [Google Scholar] [CrossRef] [PubMed]
- Samba, D.; Park, B. Incorporating inclement weather impacts on traffic estimation and prediction. In Proceedings of the 18th ITS World Congress on Intelligent Transportation Systems, Orlando, FL, USA, 16–20 October 2011. [Google Scholar]
- Hanbali, R.M.; Kuemmel, D.A. Traffic Volume Reduction Due to Winter Storm Conditions; Transportation Research Record, No. 1387; Transportation Research Board of the National Academies: Washington, DC, USA, 1993; pp. 159–164. [Google Scholar]
- Maze, T.H.; Agarwal, M.; Burchett, G.D. Whether Weather Matters to Traffic Demand, Traffic Safety, and Traffic Operations and Flow; Transportation Research Record, No. 1948; Transportation Research Board of the National Academies: Washington, DC, USA, 2006; pp. 170–176. [Google Scholar] [CrossRef]
- Roh, H.J. Impacts of Snowfall, Low Temperatures, and Their Interaction on Passenger Car and Truck Traffic. Ph.D. Thesis, Department of Environmental Systems, University of Regina, Regina, SK, Canada, 2015. [Google Scholar]
- Omar, A.M.S.; Narula, S.; Rahman, M.A.A.; Pedrizzetti, G.; Raslan, H.; Rifaie, O.; Narula, J.; Sengupta, P.P. Precision phenotyping in heart failure and pattern clustering of ultrasound data for the assessment of diastolic dysfunction. JACC Cardiovasc. Imaging 2017, 2157. [Google Scholar] [CrossRef]
- Valenza, G.; Greco, A.; Gentili, C.; Lanata, A.; Sebastiani, L.; Menicucci, D.; Gemignani, A.; Scilingo, E.P. Combining electroencephalographic activity and instantaneous heart rate for assessing brain–heart dynamics during visual emotional elicitation in healthy subjects. Philos. Trans. R. Soc. Lond. A 2016, 374. [Google Scholar] [CrossRef] [Green Version]
- Zhouzhou, S.; Wei, Y. Creating and improving a closed loop: Design optimization and knowledge discovery in architecture. Int. J. Archit. Comput. 2015, 13, 123–142. [Google Scholar] [CrossRef]
- Available online: http://www.exploredata.net/Downloads/MINE-Application (accessed on 6 January 2017).
- Environment Canada (EC) (2010) Weather Office, Gatineau, Quebec, Canada. Available online: www.climate.weatheroffice.gc.ca/climateData/canada_e.html (accessed on 20 October 2016).
- Andrey, J.; Olley, R. Relationships between weather and road safety, past and future directions. Climatol. Bull. 1990, 24, 123–137. [Google Scholar]
- Environmental System Research Institute Inc. (ESRI) (2010) ArcGIS 10 Help Library: Geographic Information System (GIS); ArcGIS 10: Redlands, CA, USA, 2010. [Google Scholar]
- Roh, H.J. Developing cold region winter-weather traffic models and testing their temporal transferability and model specification. J. Cold Reg. Eng. 2019, 33. [Google Scholar] [CrossRef]
- Roh, H.J. Modelling chronic winter hazards as a function of precipitation and Temperature. Nat. Hazards 2020, 104. [Google Scholar] [CrossRef]
- Roh, H.J. Spatial transferability testing of dummy variable winter-weather model using traffic data collected from five geographically dispersed weigh-in-motion sites in Alberta highway networks. J. Transp. Eng. A Syst. 2020, 146. [Google Scholar] [CrossRef]
- Roh, H.J. Development of winter climatic hazard models on traffic volume and assessment of their performance with four types of model structures. Nat. Hazards Rev. 2020, 21. [Google Scholar] [CrossRef]
- Roh, H.J. Assessing the effect of snowfall and cold temperature on a commuter highway traffic volume using several layers of statistical methods. Transp. Eng. 2020, 2. [Google Scholar] [CrossRef]


| Researcher | Location | Year | Traffic Reduction Due to Rainfall | Traffic Reduction Due to Snow |
|---|---|---|---|---|
| Hassan and Barker [1] | Scotland | 1999 | 3% | 10% |
| Angel and Sando [2] | Florida | 2014 | 5.5–12.5% per hour along I-295 segment, 2.5–10.7% per hour along I-95 segment | -- |
| Datla and Sharma [4] | Alberta | 2008 | -- | Commuter roads—14%, Recreational roads—31% |
| Knapp and Smithson [5] | Iowa | 2000 | -- | 16% to 47% for different winter storms |
| Roh et al. [10] | Alberta | 2015–2020 | Average snowfall (<15cm) and Temperature greater than 25 °C do not affect truck traffic | |
| Keay and Simmonds [13] | Melbourne | 2005 | 1.35%—Winter, 2.11%—Spring | -- |
| Samba and Park [14] | Virginia, Minnesota | 2011 | 20% | 70% |
| Hanbali and Kuemmel [15] | Illinois, Minnesota, New York, Wisconsin | 1993 | -- | Light snow: 12%—Weekday, 25%—Weekends, Heavy Snow: 53%—Weekday, 56%—Weekends |
| Maze [16] | Iowa | 2006 | -- | Low wind speed and good visibility: 20%, High wind speed and poor visibility: 80% |
| Maximal Correlation Coefficient (MIC) | ||||
|---|---|---|---|---|
| 0.88 | 0.62 | 0.56 | 0.48 | |
| Relationship Type |  Added Noise Added Noise  | |||
| Line and Parabola |  |  |  |  |
| Two Lines |  |  |  |  |
| X |  |  |  |  |
| Ellipse |  |  |  |  |
| Sinusoid (Mixture of 3 signals) |  |  |  |  |
| Non co-existence |  |  |  |  |
| Site Name | Lanes | TAADT | Passenger Cars (%) | Trucks (%) | No. of Vehicle Records |
|---|---|---|---|---|---|
| Red Deer on Hwy 2—RD 3 | 4 | 4976 | 84 | 16 | 57,080,185 |
| Leduc on Hwy 2—LV 4 | 4 | 3964 | 83 | 17 | 44,386,644 |
| Leduc on Hwy 2A—LE 5 | 2 | 592 | 92 | 8 | 13,807,011 |
| Fort MacLeod on Hwy 3—FM 6 | 4 | 1075 | 85 | 15 | 12,835,403 |
| Edson Hwy on Hwy 16—ED 7 | 4 | 2358 | 68 | 32 | 13,350,824 |
| Villeneuve on Hwy 44—VI 8 | 2 | 2044 | 73 | 27 | 12,673,164 |
| Total Records | 154,133,231 | ||||
| Case | ∆Si | ∆Ti | ∆TRVFi |
|---|---|---|---|
| C1 | Increase | Increase | Increase |
| C2 | Increase | Increase | Decrease |
| C3 | Decrease | Increase | Increase |
| C4 | Decrease | Increase | Decrease |
| C5 | Decrease | Decrease | Increase |
| C6 | Decrease | Decrease | Decrease |
| C7 | Increase | Decrease | Increase |
| C8 | Increase | Decrease | Decrease |
| Highway | C1 | C2 | C3 | C4 | C5 | C6 | C7 | C8 | C9 |
|---|---|---|---|---|---|---|---|---|---|
| ED7 | 9 | 8 | 1 | 0 | 1 | 1 | 16 | 27 | 3 |
| FM6 | 20 | 10 | 1 | 1 | 6 | 4 | 45 | 41 | 2 |
| LE5 | 38 | 31 | 5 | 5 | 9 | 7 | 41 | 53 | 6 |
| LV4 | 36 | 33 | 7 | 3 | 9 | 7 | 31 | 63 | 6 |
| RD3 | 27 | 27 | 4 | 2 | 5 | 4 | 37 | 68 | 3 |
| VI8 | 33 | 21 | 5 | 4 | 6 | 6 | 25 | 59 | 7 |
| MIC (Strength) | MIC- ρ2 (Nonlinearity) | MAS (Non-Monotonicity) | MEV (Functionality) | MCN (Complexity) | Pearson Correlation (ρ) | Highway |
|---|---|---|---|---|---|---|
| 0.325 | 0.318 | 0.148 | 0.325 | 2.585 | 0.084 | ED7 |
| 0.300 | 0.287 | 0.091 | 0.300 | 3.000 | −0.115 | FM6 |
| 0.318 | 0.247 | 0.080 | 0.279 | 3.322 | −0.267 | LE5 |
| 0.412 | 0.147 | 0.072 | 0.367 | 3.585 | −0.515 | LV4 |
| 0.346 | 0.295 | 0.165 | 0.305 | 3.585 | −0.226 | RD3 |
| 0.266 | 0.206 | 0.042 | 0.238 | 3.585 | −0.245 | VI8 |
Publisher’s Note: MDPI stays neutral with regard to jurisdictional claims in published maps and institutional affiliations. |
© 2020 by the authors. Licensee MDPI, Basel, Switzerland. This article is an open access article distributed under the terms and conditions of the Creative Commons Attribution (CC BY) license (http://creativecommons.org/licenses/by/4.0/).
Share and Cite
Sahu, P.K.; Bayireddy, L.M.; Roh, H.-J. A New Approach to Exploring the Relationship between Weather Phenomenon and Truck Traffic Volume in the Cold Region Highway Network. Modelling 2020, 1, 122-133. https://0-doi-org.brum.beds.ac.uk/10.3390/modelling1020008
Sahu PK, Bayireddy LM, Roh H-J. A New Approach to Exploring the Relationship between Weather Phenomenon and Truck Traffic Volume in the Cold Region Highway Network. Modelling. 2020; 1(2):122-133. https://0-doi-org.brum.beds.ac.uk/10.3390/modelling1020008
Chicago/Turabian StyleSahu, Prasanta K., Leela Manas Bayireddy, and Hyuk-Jae Roh. 2020. "A New Approach to Exploring the Relationship between Weather Phenomenon and Truck Traffic Volume in the Cold Region Highway Network" Modelling 1, no. 2: 122-133. https://0-doi-org.brum.beds.ac.uk/10.3390/modelling1020008