
Reliability and Inspection Modelling of Railway Signalling Systems


1
Department of Mechanical Engineering, Institute of Engineering & Management, West Bengal 700091, India
2
School of Engineering, University of Greenwich, Kent ME4 4TB, UK
*
Author to whom correspondence should be addressed.
Modelling 2021, 2(3), 344-354; https://0-doi-org.brum.beds.ac.uk/10.3390/modelling2030018
Submission received: 15 April 2021
/
Revised: 20 July 2021
/
Accepted: 22 July 2021
/
Published: 26 July 2021
(This article belongs to the Special Issue Modelling for Reliability and Maintenance Engineering)
Abstract
:The railway is one of the most prominent models of transportation across the globe and it carries a large number of people, thus requiring high reliability, maintainability and safety. The reliability of railways mostly depends on an effective signalling system, making it one of the critical parts of railway operation. A signalling system is part of a large array of systems with interconnected components and subcomponents. Therefore, there is a need to make the signalling system more reliable and optimised with enhanced fault detection. Proper inspection and maintenance are required to make the signalling system reliable and safe. In this study, different inspection modelling techniques are applied to find the reliability of the signalling system. The signalling system has been divided into subsystems (signal unit, track unit, point-and-point machine) considering their importance and their effects on the failure rate of the entire signalling system. Inspection modelling of each subsystem has been conducted to provide the basis for the entire signalling system. A case study has been investigated to validate the model developed in one of the busiest tracks in eastern India. The obtained data thus are used to analyse the inspection pattern of signalling subsystems. Special attention to maintenance for inspection activities and logistics support has been taken into consideration, which is required to improve the reliability and maintainability of signalling subsystems and systems to make the railway signalling system sustainable in the long run.
1. Introduction
Due to the continuous increase in the speed and requirement of traffic, the challenge of highway and railway systems in the different parts of the world is increasing day by day [1,2]. The huge frequency of trains on any track is affecting the railway infrastructure and worsening the performance of the entire railway system. For proper operation, railways are highly dependent on signalling systems. The failure of a railway signalling system may result in tremendous economic losses and service interruptions [3]. In addition to the above, there is also lots of effect on safety and operations of railway systems, especially in developing countries where there is lack of funds, and the failure of railway infrastructure is very difficult to tackle [4].
For proper maintenance, inspection at a proper time interval is required. Inspections form an important part of the integrity management process as a means of monitoring the performance of signalling systems to ensure their safety and serviceability [5,6,7]. Special attention to maintenance and inspection activities and logistics support is required to be taken to improve the reliability and maintainability of the signalling system [8,9,10,11]. Many works have been performed to improve the reliability of the railway signalling system by modelling the inspection and maintenance process of a railway system. Sysyn et al. outlined and analysed the problem of a scheduled inspections system for common crossings [10]. Pascale et al. used failure to statistically model the basic event of fault-tree analysis, to fulfil the safety target for the system that has been designed [12].
Shafiullah et al. [13] surveyed existing wireless techniques used in the railway industry for both communications and signalling purposes and presented work on low-cost, low-power wireless sensor networking architecture to monitor the health of railway wagons attached to a moving locomotive. Rahouma et al. [14] performed the modelling of an electrical system so that trains can be stopped safely from a larger distance by detecting cracks to guarantee the availability and safety of the train for security reasons. Kumar and Chandra [11] observed that the reliabilities of the subsystems are decreasing over time. The reliability of the track circuit, signal unit and the point-and-point machine will be 40–60% after 50 h and, similarly, maintainability of the track circuit, signal unit and the point-and-point machine will be 50–70% after 10 h [15,16,17].
Ten-Wolde et al. [18] combined failure and repair data with the signalling system availability and optimised inspection intervals by keeping costs of the system in mind. Carretero et al. [19] used the reliability-centred maintenance concept to find out the optimum inspection for the entire railway infrastructure. Hwang et al. [20] used the automated testing tool to check software used in signalling systems so that the safety and reliability of the system can be increased in the entire operation. Volk et al. conducted the reliability assessment in terms of train routability with special attention to field elements including signals and track occupation detection systems [21]. From the literature review, it is concluded that many works have been conducted to improve the reliability and performance of the signalling system. In recent years, there have been significant developments in the area of reliability-based inspection planning [22,23,24]. Different methods are used for developing optimum inspection plans for individual structures but very few works have been performed to improve the reliability of signalling systems keeping inspection intervals in mind. Inspection work has not been conducted previously, especially at the component level, therefore work in this area is needed to find the inspection modelling of railway signalling subsystems and their components.
The railway signalling system is made of different sub-components where there is a need for a proper understanding of its failure rate and its effect on the entire signalling system and system downtime. There is no specific model for inspection of the signalling system and its components. Complete failure can lead to system downtime for a longer period and periodic inspection is required so that failure can be detected at an early stage and complete failure of the system and its components can be prevented. In the current work, failure rates of different components and signalling systems are analysed, and inspection modelling of railway signalling has been performed using analytical methods. With the help of mathematical modelling, the effect of the inspection sequence is also analysed so that the optimum inspection interval can be decided for different signalling system components.
2. Methodology
A signal is a mechanical and electrical device erected beside a railway line to pass information relating to the state of the line ahead to the train. As per the indications of the signal, the driver stops, runs and controls the speed of the train, which is very important for the safety of railways. The main signalling subsystem which plays a very crucial role is the track circuit, signal unit and point-and-point machine [10]. The first component track circuit is one of the most common ways to determine whether a section of line is occupied by using short-circuiting in the electric circuit. Every part of the train is to be detected by the track circuit. The second component is the point-and-point machine. The mechanism is normally divided into three main components: (i) the motor unit, which may include a contactor control arrangement and a terminal area; (ii) a gearbox comprising spur-gears and a worm reduction unit with overload clutch; and (iii) the dual control mechanism, as well as a controller subsystem with motor cut-off and detection contacts.
It is a complex electromechanical device with many potential failure modes of the machine housing. The third component, the signal unit, consists of one arm, red and green glasses, crank rod etc., which is used for proper guiding of trains on the tracks. A signal helps to inform the driver about the speed at which the train may safely proceed, or it may instruct the driver to stop. It is observed that the reliability of the signalling system is decreasing over time, and it mostly depends on the reliability of the different components of signalling subsystems [15]. Proper performance and efficiency of signalling systems are extremely important for not only the proper functioning of entire railways but also for safety reasons. From the literature review, it was concluded that three main subsystems, viz. track circuit, signal unit and point-and-point machine, play an important role to control and monitor the train movement. Railway signals are used to indicate different aspects and indications, such as red, yellow, double yellow, proceed, proceed with attention and stop signalling subsystems, as per their importance in the functioning of the entire signalling system. The number of failures of signalling subsystems was found with data collected by Indian Railways. The average failure rates of different subsystems were compared with the failure rate of the entire signalling system so that the effectiveness of each component can be compared with the entire signalling system. The number of failures of the entire signalling system and the number of failures of the subsystem have been compared. The failures of the system lead to a reduction of system downtime and idling of the entire system. To reduce the performance of the signalling system, inspection modelling of the entire railway signalling system has been performed to estimate the number of inspections in unit time required for different signalling subsystems with different models.
The methodology used in the current study can be divided into the following steps: Firstly, a literature review has been carried out to investigate the issues for a practical application of inspection modelling and strategic managerial requirements. Secondly, with the reference to the railway logbook, the critical parts (which play a vital role in the proper functioning of the signalling system) of the signalling system were determined and the applicable methods for the entire railway signalling system were also determined. Thirdly, the failure data of 5 years of signalling system from Kharagpur to Bali Chalk were taken as the maintenance and inspection study. Total numbers of failures from January 2005 to 2010 were taken for the analysis. Most of the failure data were taken from the maintenance logbook managed by different sections of the local stations. Fourthly, a proposed model was developed based on different inspection methods.
Three models were selected for the analysis of railway signalling subsystems and reliability. The use of these inspection models enables the inspection findings to be incorporated in the planning and decision model to optimise subsequent actions. Finally, the effect of these inspection frequencies on the reliability of the signalling system has been found with the relationship between reliability and inspection. Effects of inspections on system downtime and effectiveness were also analysed.
2.1. Inspection Model
Signalling systems are in continuous operation and there is a huge chance of breakdown. Therefore, inspection plays a very important role because inspection not only can reduce system downtime but also can increase system reliability [25,26]. In this paper, two main methods are recommended. In the first, an inspection effect function is introduced which modifies the traditional system failure rate distribution. In this study, one of the assumptions is that multi-defects may occur at any point in time in any component of signalling subsystems. The time interval between the occurring of the defects is referred to as decay time. Every defect is independent of each other, and delay time is independent of its origin. The lifetime of the signalling system is assumed not homogeneous. The remaining life of signalling subsystems in the defective state is a random variable from a mixed distribution. The cost of maintenance of signalling systems is generally determined in such a way that the cost of maintenance cannot be justified by its efficacy when there is a possibility that replacement is poorly executed considering the inspection to be imperfect. Every identified inspection is assumed to be repaired immediately and it is considered to be restored to the defect rate it had when the defect occurred. Under these assumptions, the inspections of the Indian Railways signalling system, following inspection models were used.
2.1.1. Model 1
Inspections are disruptive but they are also very helpful in reducing downtime of a system by reducing the frequency of failures. Total downtime of a signalling system and subsystems is a function of downtime due to breakdown at the component level and downtime at the system level, hence total downtime of the signalling system and its components can be represented by
where Td is the total downtime per unit of time for a component, A is a constant associated with a particular component of signalling system, Tb is the signalling system and its component downtime per breakdown or failure, Ti is the component downtime per inspection and y is the number of inspections per unit of time.
Td = yTi + ATb/y
By differentiating Equation (1) with respect to yi,
DTd/dy = Ti − cTb/y2
By setting Equation (2) equal to zero and then rearranging, the following is obtained:
where y* is the optimum number of inspections of each signalling system component per unit of time.
Substituting Equation (3) into Equation (1) yields
where Td* is the total optimal downtime per unit of time for components of the signalling system.
2.1.2. Model 2
This model can be used to determine optimum inspection frequency in order to minimise the downtime of the signalling subsystem per unit of time. Here, total downtime is only the function of inspection frequency, which can be mathematically expressed as
where Tdt (n) is the total component downtime per unit of time, Dtr is the component downtime due to per unit of time for repairs, Dti is the component downtime due to per unit of time for inspection, n is inspection frequency, λ(n) is the component failure rate, μ is the component repair rate and 1/θ is the mean of the exponentially distributed inspection time.
By differentiating Equation (1) with respect to n,
Setting Equation (6) equal to zero and rearranging it yields
The value of n will be optimum when the left and right sides of Equation (3) are equal. At this point, the component of total downtime will be minimal.
From the reliability and failure rate theory, the failure rate of any system can be defined by
When n = 0, the system failure rate can be represented by f.
To obtain a mathematical expression for the optimum value of inspection frequency (n), Equation (8) is divided with respect to n and is then substituted into Equation (7).
After rearranging Equation (9), the value of the optimum frequency interval can be obtained.
where n* is the optimal inspection frequency.
2.1.3. Model 3
This mathematical model is used to calculate optimum inspection frequencies so that profit can be maximised. If the inspection is performed many times, then it leads to losses due to interruption. The following assumptions are made before applying this model: The equipment failure rate is a fraction of inspections, time to inspections is exponentially distributed and equipment failure rate and repair rate are constant. The following symbols are used to develop equations for the model: n is the number of inspections performed per unit of time, 1/θ is the mean of exponentially distributed inspection times, P is the profit at no downtime losses, Ci is the average inspection cost per uninterrupted unit of time, Cr is the average cost of repairs per uninterrupted unit of time, λ is the equipment failure rate and μ is the equipment repair rate.
Profit per unit time is expressed by
where PLI is the production output value loss per unit of time due to inspections of signalling subsystems, PLr is the production output value loss per unit of time due to repairs, IC is the inspection cost per unit of time and RC is the repair cost per unit of time.
By differentiating Equation (11) with respect to n and then equating it to zero,
By rearranging Equation (12),
The value of n will be optimal when the left and right side of Equation (13) is equal because at this point there will be maximum profit.
Assume that the failure rate of a manufacturing system is defined by
Substituting Equation (14) into Equation (13) yields
By rearranging Equation (15),
where n* is the optimal inspection frequency of the manufacturing system.
2.2. Reliability Model
Inspection and maintenance play a very crucial role in improving the efficiency of the signalling system by reducing its downtime of the system. To understand the effect of inspection frequency on the reliability of the signalling system, the following model can be used. Defects in any interval of any of the signalling systems lead to failures.
Any interval (tk−1, tk) (1 < k < j) could lead to failure between tj−1 and tj. Therefore, the expected number of failures between tj−1, tj can be given by
Note that G(y) is the cumulative distribution function (CDF) of delay time Y where Y ≥ 0 and (y) = 0 for Y and λ(τ) is the rate of defect occurrence at time τ.
The expected number of failures over the inspection interval (tj−1, tj) with the detection rate β; Equation (17) can be rewritten as
The arrival of failures under inspection can still be considered as a Non-Homogeneous Poisson Process (NHPP). For an NHPP, based on the reliability theory, the reliability of a component at time t can be given as
For simplicity, let t = , then the reliability can be expressed as
By combining Equations (18) and (19), then
Thus, the reliability of an imperfect inspection strategy can be evaluated. In addition, with Equation (20), the derivation of the reliability at any time x is proposed, where (0:
where n satisfies .
Equation (21) explains the relationship between reliability and different inspection intervals under different detection rates.
3. Results and Discussion
The signalling system is at present mostly affected by a limited number of causes, such as ‘heavy’ lightning, insulation failure due to passenger interference, interference by lizards, scrap material falling between the stock and tongue rails and cables being chewed by rats. The function of the railway signalling system basically depends on the different components of the signalling system. In this study, the failure data of the railway signalling system from Kharagpur to Balichak have been taken into consideration. The number of failures of different signalling systems and subsystems has been collected. As shown in Figure 1, the number of failures of the signalling system has been plotted from 2005 to 2010.
Moreover, based on Figure 1, it is concluded that failures have been happening sporadically over 72 months (2005–2010). It is also concluded that the number of failures of the entire signalling system is approximately 4.5% of the failures at component levels and more than 80% of failures are happening at the component level because the system configuration of the point-and-point machine, signal unit and track circuit is very complex in terms of the number and types of joints and connections. Figure 1 also shows the breakup of component and system failures against each occurrence of point-and-point machine failure (during 2005–2010, out of the 200 point-and-point machine failures considered in the Kharagpur to Balichak section, only 64 failures occurred at the system level). There is a possibility of occurrence of component and system failure at the same point in time. The significance of system failure may be assessed in terms of its effect on the component failure and vice versa. If the failure rate at the component level can be reduced by inspection, then it will lead to a fewer number of failures at the system level. Therefore, reliability modelling at the component or subsystem level is a priority to improve the performance in a particular section.
Due to frequent failures of the signalling system, downtime of the signalling system increases, which affects the performance of the signalling system negatively by increasing the idle time of the system. After comparing the downtime ratio of the signalling system before and after the proper inspection, it is concluded that the downtime ratio of the entire signalling system will improve because of the reduction of system idling time. It will increase the efficiency of the entire signalling system. Keeping this in mind, reliability, availability and maintainability of signalling systems and subsystems may be considered as key issues for the safe operation of trains and hence minimise the downtime of the entire system; therefore, proper maintenance and inspection of these subsystems are highly recommended. These three models were used to find the optimum inspection of railway signalling systems.
Model 1 was applied on three subsystems of signalling systems and the number of inspections was calculated for optimum reliability of different signalling systems, which is shown in Table 1. From Table 1, it has been concluded that the signalling unit requires more inspections per month with respect to the signal unit and track circuit. The signal unit comes at the second level in this category. The optimum number of inspections per subsystem per unit of time were calculated for different signalling subsystems by Model 1 and it was concluded that the signal unit requires the highest number of inspections per month and the track circuit requires the least number of inspections per month. These inspections can reduce downtime by decreasing the total number of failures and can make the signalling system more reliable.
Model 2 was applied on three subsystems of the signalling system and the number of inspections was calculated for optimum reliability of different signalling systems, which is shown in Table 2. Based on Table 2, it is concluded that point-and-point machines require a greater number of inspections per month with respect to the signal unit and track circuit. The track circuit comes at the second level in this category and the point-and-point machine requires fewer numbers of inspections per month. The optimum numbers of inspections per facility per unit of time were calculated for different signalling subsystems by Model 2.
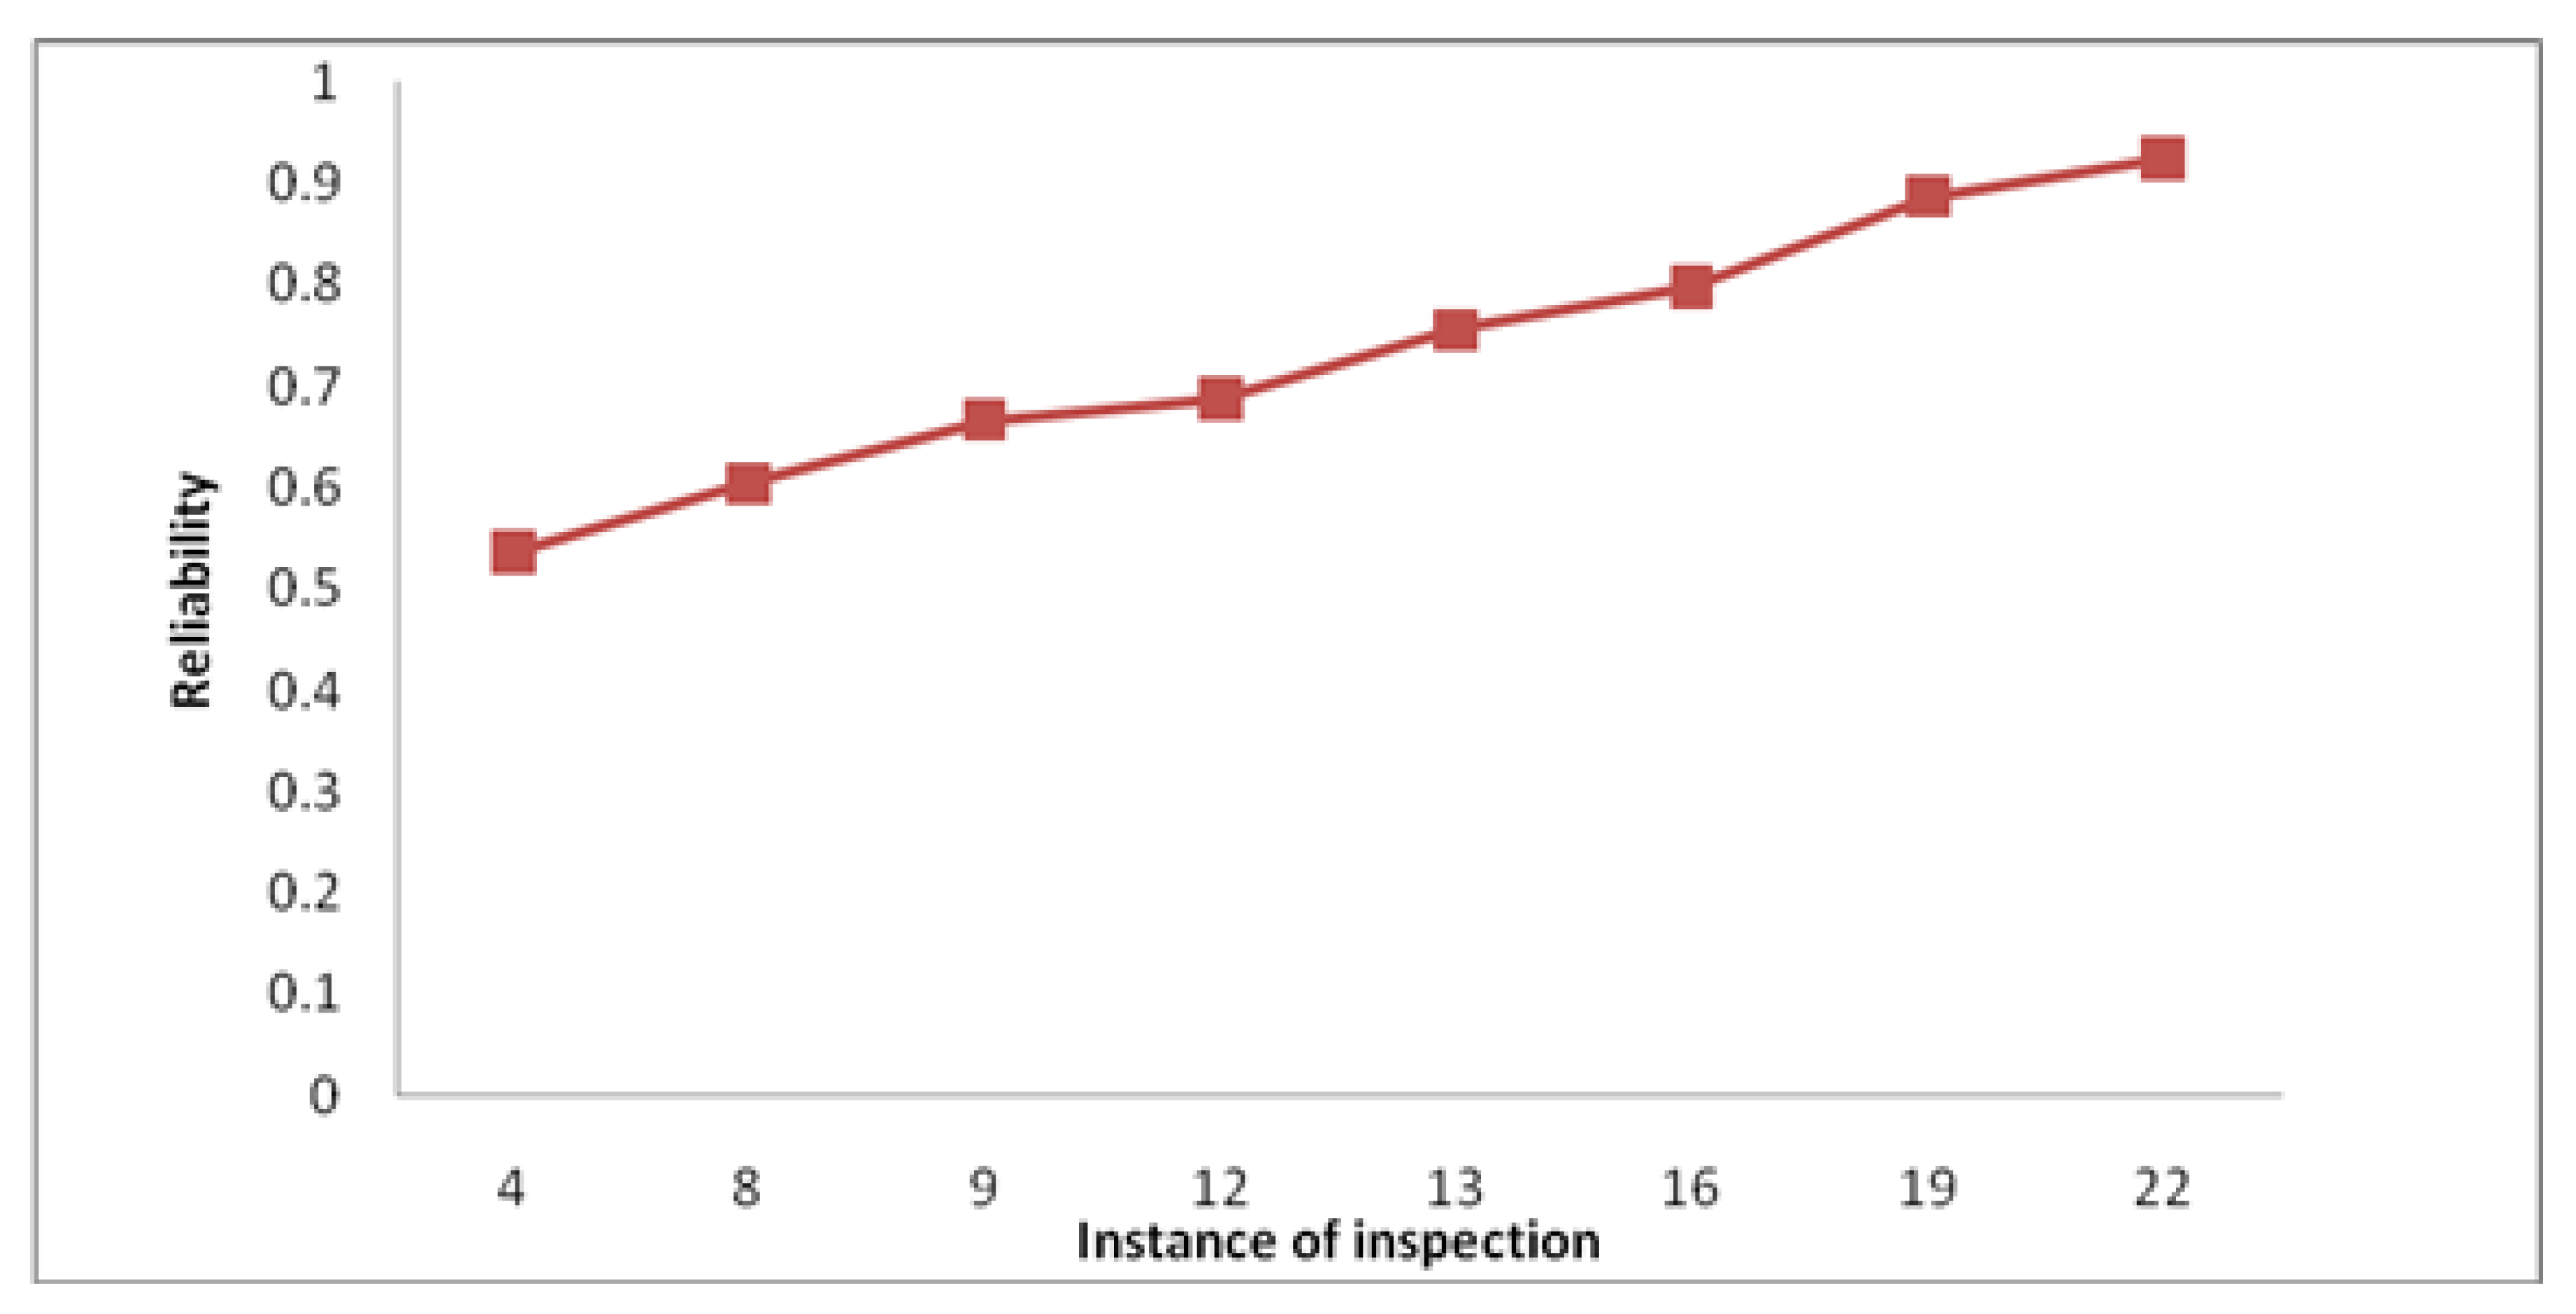
Similarly, Model 3 was applied on three subsystems of the signalling system and the number of inspections was calculated for optimum reliability of different signalling systems. Based on Model 3, the number of optimal inspections of the three signalling subsystems has been identified and it is concluded that the signal unit requires a greater number of inspections per month (approximately 6) with respect to the track circuit (approximately 4) and point-and-point machine (approximately 3). Track circuit comes at the second level in this category and the point-and-point machine requires fewer inspections per month for keeping the maximum profit. The reliability of the signalling system for different intervals can be calculated for several numbers of inspections. It can be concluded that the minimum number of inspections should be eight to satisfy the requirement of reliability of approximately 50%. In addition, it can also be observed from Table 3 that reliability can be greatly improved by increasing the number of inspections. However, the amount of improvement reduces as the inspections are performed more frequently. A plot has been drawn to understand the relationship between reliability and inspection interval in Figure 2. Based on Figure 2, it can be observed that the minimum number of inspections is required to obtain the desired amount of reliability. For example, for 50% reliability, the recommended number of inspections is 8, whereas, for 70% inspection, the recommended number of inspections is 16.
4. Conclusions
In this paper, an analysis of the signalling system and subsystems has been performed. The failure data of a point-and-point machine, track circuit and signal unit of the signalling system have been collected. The subsystem failure rate was compared with the entire signalling system failure rate, and it was concluded that the failure rate due to system level is much lesser than the failure rate due to subsystem or component level. Thus, component level inspection is required to improve the performance of the entire signalling system. It was also concluded, that out of the three signalling subsystems, which one was most affecting the performance of the railway signalling system. In the current work, three models have been used to find the optimal inspection intervals of signalling subsystems (point-and-point machine, track circuit and signal unit). The inspection priorities of three signalling subsystems have been decided by keeping different parameters in mind. It was also concluded that the optimum number of inspection frequencies can minimise the system’s total downtime, which will increase system availability by reducing the idle period. The effect of these inspection frequencies on the reliability of the signalling system has been also determined and it was concluded that sequenced inspection is required to increase the reliability of the signalling system and subsystems. In future, these inspection models can be further used for the cost optimisation of the entire railway signalling system.
Author Contributions
Conceptualization, K.F.T. and N.K.; formal analysis, N.K.; investigation, K.F.T. and N.K.; writing-original draft preparation, N.K.; writing-review and editing, K.F.T.; supervision, K.F.T. All authors have read and agreed to the published version of the manuscript.
Funding
This research received no external funding.
Institutional Review Board Statement
Not applicable.
Informed Consent Statement
Not applicable.
Data Availability Statement
Not applicable.
Conflicts of Interest
The authors declare no conflict of interest.
References
- Tee, K.F.; Ekpiwhre, E.O. Reliability-based Preventive Maintenance Strategies of Road Junction Systems. Int. J. Qual. Reliab. Manag. 2019, 36, 752–781. [Google Scholar] [CrossRef]
- Ekpiwhre, E.O.; Tee, K.F. Reliability based maintenance methodology for sustainable transport asset management. Pollack Period. 2018, 13, 99–112. [Google Scholar] [CrossRef]
- European Union. Directive 2001/12/EC of the European Parliament and of the Council of 26 February 2001 amending Council Directive 91/440/EEC on the development of the Community’s railways official; SIN 1012-9200; L75 of 15 March 2001; European Union: Maastricht, The Netherlands, 2001. [Google Scholar]
- Kumas, K.; Chandra, V. A fail safe node using transputers for railway signalling applications. In TENCON’92—Technology Enabling Tomorrow; Institute of Electrical and Electronics Engineers (IEEE): Piscataway, NJ, USA, 2003. [Google Scholar]
- Ekpiwhre, E.; Tee, K.F.; Aghagba, S.; Bishop, K. Risk-based inspection on highway assets with category 2 defects. Int. J. Saf. Secur. Eng. 2016, 6, 372–382. [Google Scholar] [CrossRef]
- Tee, K.F.; Ekpiwhre, E.; Yi, Z. Degradation modelling and life expectancy using Markov chain model for carriageway. Int. J. Qual. Reliab. Manag. 2018, 35, 1268–1288. [Google Scholar] [CrossRef]
- Tee, K.F.; Ekpiwhre, E.O. Reliability Analysis and Growth Curves Modelling of Fielded Road Systems. World Rev. Intermodal Transp. Res. 2018, 7, 168–194. [Google Scholar]
- Kumar, K.V.; Chandra, V. Simulation of Multi-Transputer Fault Tolerant System for Railway Safety Applications; European Simulation Multiconference: Lyon, France, 1993. [Google Scholar]
- Panja, S.C.; Ray, P.K. Reliability analysis of a ‘point-and-point machine’ of the Indian railway signaling system. Qual. Reliab. Eng. Int. 2007, 23, 833–848. [Google Scholar]
- Sysyn, M.; Nabochenko, O.; Kovalchuk, V.; Gruen, D.; Pentsak, A. Improvement of inspection system for common crossings by track side monitoring and prognostics. Struct. Monit. Maint. 2019, 6, 219–235. [Google Scholar]
- Kumar, K.V.; Chandra, V. Transputer-based fault-tolerant and fail-safe node for dual ring distributed railway signalling systems. Microprocess. Microsyst. 1994, 18, 141–150. [Google Scholar] [CrossRef]
- Pascale, E.; Bouillaut, L.; Freneaux, T.; Sista, R.; Sannino, P.; Marmo, P. A Weibull Approach for Enabling Safety-Oriented Decision-Making for Electronic Railway Signaling Systems. Safety 2018, 4, 17. [Google Scholar] [CrossRef]
- Shafiullah, G.; Gyasi-Agyei, A.; Wolfs, P. Survey of Wireless Communications Applications in the Railway Industry. In Proceedings of the 2nd International Conference on Wireless Broadband and Ultra Wideband Communications (AusWireless 2007), Sydney, Australia, 27–30 August 2007; Institute of Electrical and Electronics Engineers (IEEE): Piscataway, NJ, USA, 2007; p. 65. [Google Scholar]
- Rahouma, K.H.; Mohammad, S.A.; Hameed, N.S.A. A mathematical model for detection of railway track cracks based on the track signalling system. Egypt. Comput. Sci. J. 2020, 44, 32–50. [Google Scholar]
- Rahman, M.S.A.; Mukhopadhyay, S.C.; Yu, P.-L. Novel Sensors for Food Inspection: Modelling, Fabrication and Experimentation; Springer Science and Business Media LLC: Berlin/Heidelberg, Germany, 2014; pp. 11–13. [Google Scholar]
- Washer, G.; Nasrollahi, M.; Applebury, C.; Connor, R.; Ciolko, A.; Kogler, R.; Forsyth, D. Proposed Guideline for Reliability-Based Bridge Inspection Practices; (No. Project 12-82 (01)); The National Academies Press: Washington, DC, USA, 2014. [Google Scholar]
- Sheils, E.; O’Connor, A.; Schoefs, F.; Breysse, D. Investigation of the effect of the quality of inspection techniques on the optimal inspection interval for structures. Struct. Infrastruct. Eng. 2012, 8, 557–568. [Google Scholar] [CrossRef] [Green Version]
- Wolde, M.T.; Ghobbar, A. Optimizing inspection intervals—Reliability and availability in terms of a cost model: A case study on railway carriers. Reliab. Eng. Syst. Saf. 2013, 114, 137–147. [Google Scholar] [CrossRef]
- Carretero, J.; Pérez, J.M.; García-Carballeira, F.; Calderón, A.; Fernández, J.; García, J.D.; Lozano, A.; Cardona, L.; Cotaina, N.; Prete, P. Applying RCM in large scale systems: A case study with railway networks. Reliab. Eng. Syst. Saf. 2003, 82, 257–273. [Google Scholar] [CrossRef]
- Hwang, J.-G.; Jo, H.-J.; Maroulis, G.; Simos, T.E. Development of Automatic Testing Tool for ‘Design & Coding Standard’ for Railway Signaling Software. Comput. Methods Sci. Eng. 2009, 1148, 137–141. [Google Scholar] [CrossRef]
- Volk, M.; Weik, N.; Katoen, J.-P.; Nießen, N. A DFT Modeling Approach for Infrastructure Reliability Analysis of Railway Station Areas. In Transactions on Petri Nets and Other Models of Concurrency XV; Springer Science and Business Media LLC: Berlin/Heidelberg, Germany, 2019; pp. 40–58. [Google Scholar]
- Ebenuwa, A.U.; Tee, K.F. Fuzzy Reliability and Risk-based Maintenance of Buried Pipelines Using Multiobjective Optimisation. J. Infrastruct. Syst. 2020, 26. [Google Scholar] [CrossRef]
- Karevan, A.; Tee, K.F.; Vasili, M. A reliability-based and sustainability-informed maintenance optimization considering risk attitudes for telecommunications equipment. Int. J. Qual. Reliab. Manag. 2020, 38, 873–891. [Google Scholar] [CrossRef]
- Tee, K.F.; Ekpiwhre, E. Strategic cost modelling and optimisation for highway asset maintenance. J. Qual. Maint. Eng. 2019, 26, 198–212. [Google Scholar] [CrossRef]
- Tee, K.F.; Khan, L.R. Risk-Cost Optimization and Reliability Analysis of Underground Pipelines. In Proceedings of the 6th International Asranet Conference, London, UK, 2–4 July 2012; p. 49. [Google Scholar]
- Fang, Y.; Tao, W.; Tee, K.F. A new computational method for structural reliability with Big Data. Ekspolatacja i Niezawodn. Maint. Reliab. 2018, 21, 159–163. [Google Scholar] [CrossRef]
Figure 1.
Comparison of failures of signalling subsystem and signalling system.

Figure 2.
Relationship between expected reliability and number of inspections.


Table 1.
The number of inspections of different signalling subsystems by Model 1.
| Track Circuit | Signal Unit | Point Machine | |
|---|---|---|---|
| Tb | 0.1 | 0.4 | 0.2 |
| Ti | 0.04 | 0.03 | 0.02 |
| n | 3 | 7 | 5 |
Table 2.
Numbers of inspections of different signalling subsystems by Model 2.
| Track Circuit | Signal Unit | Point Machine | |
|---|---|---|---|
| 1/μ | 0.0232 | 0.00693 | 0.0079 |
| 1/θ | 0.08 | 0.003 | 0.006 |
| n | 5.06 | 1.9 | 2.9 |
Table 3.
Relationship between expected reliability and number of inspections.
| Inspection Number | Instance of Inspection | Reliability | Expected Number of Failures |
|---|---|---|---|
| 1 | 4 | 0.436 | 0.489 |
| 2 | 8 | 0.504 | 0.417 |
| 3 | 9 | 0.567 | 0.391 |
| 4 | 12 | 0.588 | 0.326 |
| 5 | 13 | 0.656 | 0.311 |
| 6 | 16 | 0.698 | 0.299 |
| 7 | 19 | 0.788 | 0.266 |
| 8 | 22 | 0.826 | 0.206 |
Publisher’s Note: MDPI stays neutral with regard to jurisdictional claims in published maps and institutional affiliations. |
© 2021 by the authors. Licensee MDPI, Basel, Switzerland. This article is an open access article distributed under the terms and conditions of the Creative Commons Attribution (CC BY) license (https://creativecommons.org/licenses/by/4.0/).
Share and Cite
MDPI and ACS Style
Kumar, N.; Tee, K.F. Reliability and Inspection Modelling of Railway Signalling Systems. Modelling 2021, 2, 344-354. https://0-doi-org.brum.beds.ac.uk/10.3390/modelling2030018
AMA Style
Kumar N, Tee KF. Reliability and Inspection Modelling of Railway Signalling Systems. Modelling. 2021; 2(3):344-354. https://0-doi-org.brum.beds.ac.uk/10.3390/modelling2030018
Chicago/Turabian StyleKumar, Nikesh, and Kong Fah Tee. 2021. "Reliability and Inspection Modelling of Railway Signalling Systems" Modelling 2, no. 3: 344-354. https://0-doi-org.brum.beds.ac.uk/10.3390/modelling2030018