Article

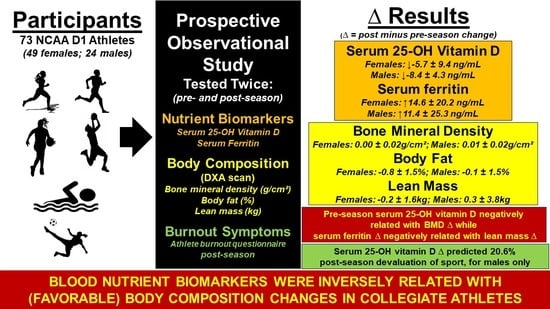
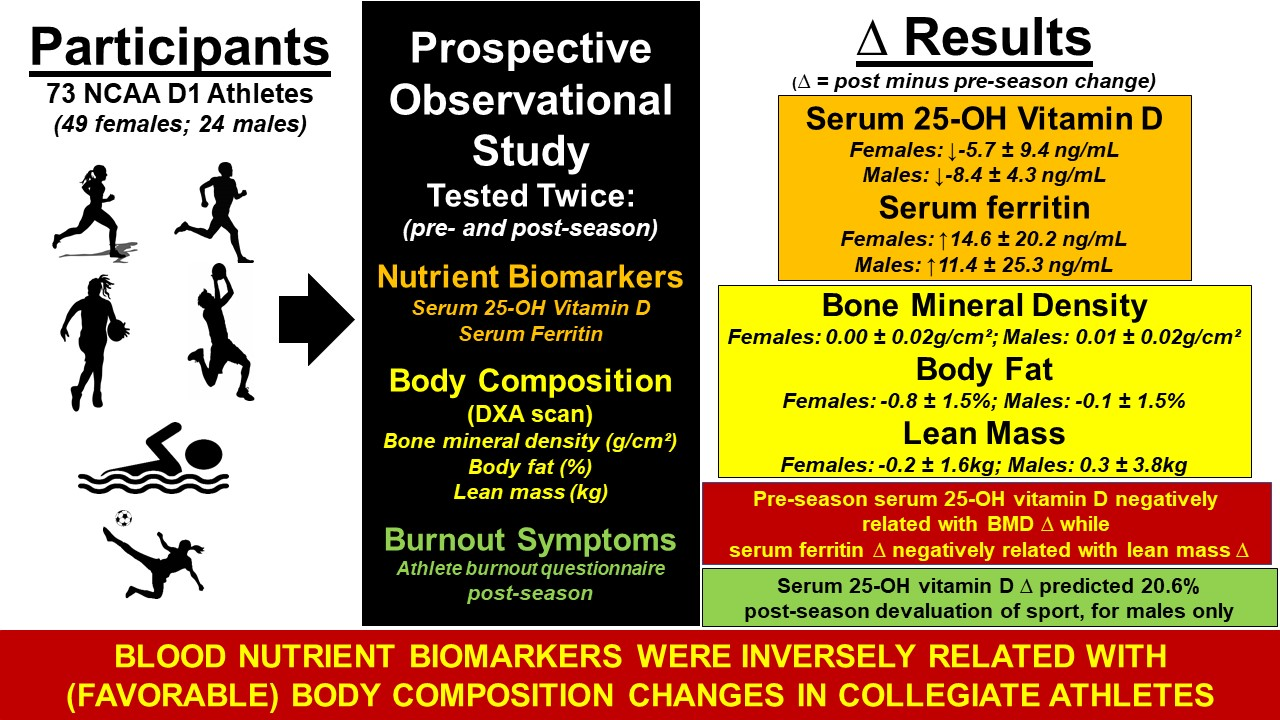
Paradoxical Relationships between Serum 25(OH)D and Ferritin with Body Composition and Burnout: Variation by Sex and Sports Team

1
Kinesiology, Health and Sport Studies, Wayne State University, Detroit, MI 48202, USA
2
School of Health Sciences, Oakland University, Rochester, MI 48309, USA
3
Athletics Department, Oakland University Rochester, Rochester, MI 48309, USA
4
Internal Medicine Department, Mission Health, Asheville, NC 28801, USA
*
Author to whom correspondence should be addressed.
Submission received: 3 July 2021 / Revised: 15 August 2021 / Accepted: 26 August 2021 / Published: 3 September 2021
(This article belongs to the Section Exercise Endocrinology)

Abstract

:
Adequate serum vitamin D and iron levels are thought to influence physical training adaptations and mood positively. The primary purpose of this prospective, observational study was to investigate relationships between serum 25-OH vitamin D/25(OH)D and serum ferritin levels with body composition and athlete burnout symptoms. Seventy-three collegiate athletes (female: n = 49; male: n = 24) from indoor (swimming, basketball) and outdoor (soccer, cross-country) sports were tested pre-season and post-season for serum 25(OH)D and serum ferritin (nutrient biomarkers) via venipuncture; body composition (total lean mass, bone mineral density/BMD, and % body fat) via dual energy X-ray absorptiometry (DXA) scans; and athlete burnout symptoms (post-season) via the athlete burnout questionnaire (ABQ). When male and female cohorts were combined, significant correlations (Pearson’s r) were noted between pre-season serum 25(OH)D versus the change (∆: post-season minus pre-season) in both BMD (r = −0.34; p = 0.0003) and % body fat (r = −0.28; p = 0.015). Serum ferritin ∆ was significantly associated with lean mass ∆ (r = −0.34; p = 0.003). For burnout symptoms, serum 25(OH)D ∆ significantly explained 20.6% of the variance for devaluation of the sport in the male cohort only. Across time, serum 25(OH)D levels decreased while serum ferritin levels increased, non-significantly, in both males and females. Relationships between nutrient biomarkers and body composition were opposite of physiological expectations.

Graphical Abstract

1. Introduction

The trend towards precision medicine [1] has fueled a more individualized approach towards precision athletic health and training. Measurement of endocrine and nutrient biomarkers which may enhance favorable adaptations in muscle strength [2], performance [3], and mood [4] are fast becoming standardized practice in elite athlete screenings [5,6,7]. However, the development of normative values which promote health and peak performance, in the context of both sex and sport, remains to be elucidated [8].
Serum vitamin D [6,9,10,11,12,13,14] and ferritin [3,5,7,15,16,17] are commonly measured in athletes, particularly collegiate athletes [6,7,10,11,12,13,15]. Vitamin D (typically assessed as serum 25-OH vitamin D, or 25(OH)D for short) has emerged as a potential ergogenic aid [2], reducing muscle damage [18], stress fractures [19], and frequent illness [14]. Similarly, correction of low iron levels (typically assessed as serum ferritin measurement) has been shown to improve endurance performance [3], subjective measures of performance [20], and fatigue [17] in female athletes. The downside of blood biomarker measurement, however, is cost. For example, the average annual cost to screen athletes at one National Collegiate Athletic Association Division 1 (NCAA D1) Institution for serum 25(OH)D was estimated at USD 7250 (average cost USD 51–100 per laboratory draw) [6] while the estimated cost for serum ferritin measurement was USD 4248 (USD 32 per laboratory draw) [7].
Another commonly utilized training outcome measure is body composition. Favorable training adaptations include increasing lean [21] and bone [22] mass while decreasing fat mass [21] across a competitive season. Unhealthy adaptations in response to over-training, inadequate nutrition, or relative energy deficiency in the sport (RED-S) often manifest as decreased lean [23] or bone [24] mass which, in turn, precedes injury and illness [23,24,25,26]. Favorable relationships between nutrient blood biomarkers (such as vitamin D and iron) and body composition variables would thereby underscore the importance of nutrient screening and supplementation, in collegiate athletes, in the future.
In addition to markers of physical health, relationships between serum 25(OH)D and ferritin on athlete mental health remain underexplored. Evidence suggests that low serum 25-OH vitamin D and ferritin levels are inversely related to depression scores [27,28] in university students. However, relationships between serum 25(OH)D and ferritin with burnout symptoms in athletes have yet to be examined.
Therefore, the primary aim of these preliminary and limited pilot data was to investigate prospectively (pre- and post-season) relationships between serum 25(OH)D and serum ferritin levels with body composition variables in a cohort of indoor and outdoor NCAA D1 collegiate athletes. A secondary aim was to explore relationships between serum 25(OH)D and ferritin levels with athletic burnout symptoms.

2. Materials and Methods

Student-athletes from a midwestern National Collegiate Athletic Association Division 1 (NCAA D1) University (latitude 42.7° N) were recruited to participate in this prospective, observational study conducted in 2016–2017. Participants, identified by their respective sport coaches from their team roster, from seven different fall and winter sports teams (men and women’s cross country/XC, swimming, and basketball plus women’s soccer) were recruited by the principal investigator (THB) at a voluntary team meeting. Eligible participants were given the Informed Consent form to peruse, and were free to ask any and all questions. All participants signed written informed consent before participating in this Institutional Review Board (IRB) approved study (Oakland University IRB#778936). Athletes presented to the lab both pre-season (September/Autumn season) and post-season (men and women’s XC in December/Winter season; women’s soccer in January/Winter season; men and women’s basketball and swimming teams in April/Spring season). Athletes were asked to refrain from exercise and eating (other than water, when thirsty) for 4 h prior to each laboratory visit. Athletes were also instructed to wear compression shorts (plus sport bras for females), without any metal, for the dual energy X-ray absorptiometry (DXA) scans. The following procedures were performed:
Blood biomarkers: Serum 25(OH)D and serum ferritin were assessed by a local hospital laboratory (Cobas E Immunoassay, Ascension-Crittenton Hospital, Rochester, MI, USA), following venipuncture in a supine position. All separated serum specimens were sent to the hospital laboratory within 12 h of venipuncture. The repeatability coefficient of variation (%CV) for serum 25(OH)D ranged between 1.9% (54.0 mg/mL) and 6% (11.6 ng/mL), while the %CV for ferritin ranged between 2.1% (392 ng/mL) and 3.8% (12.3 ng/mL) for human serum samples. The diagnostic threshold for serum 25(OH)D insufficiency was ≤30 ng/mL [9,29] while serum ferritin insufficiency was defined as any value ≤35 ng/mL [30].
Total body composition: Height and weight were measured in compression clothes, without shoes or socks, on a stadiometer with a weight beam scale. Total body lean, fat, and bone mass were measured using a whole-body DXA scan (Horizon A, software version 13.6.0.5, TBAR102 NHANES BCA calibration, Hologic, Bedford, MA, USA). All DXA scans were performed following standardized protocols, outlined in the product user manual [31]. Athletes who were taller than the scan table parameters were positioned with their feet outside of the scan area, both times (standardized). We chose to report total bone mass as bone mineral density (BMD in g/cm2) plus T or Z-score (when available; n = 69) as well as total fat mass as a percentage (body fat %) to standardize these variables across sex, sport, and body weight. However, we reported total lean mass in kilograms to reflect size and metabolic demand differences. The percent coefficient of variation (CV%) of the Horizon A device, obtained from scanning the whole-body calibration phantom (from Hologic) 20 times (calculated as Standard Deviation/Average value × 100 = CV%) for each tissue compartment was calculated as follows: total mass = 0.10%; fat mass = 0.46%; lean mass = 0.49%; bone mineral content (BMC) = 0.86%; and body fat % = 0.43%. Bone mineral density (BMD) precision is listed by the manufacturer as <1.0% [31].
Post-season burnout assessment: A 15-question athlete burnout questionnaire (ABQ) was completed, in the laboratory, at the post-competitive season timepoint only [32]. Each question was measured on a 5-point Likert scale, with 1 representing “almost never” and 5 representing “almost always”. Subscales of the ABQ include devaluation of sport, emotional and physical exhaustion, and reduced sense of accomplishment which have been previously validated in a cohort of collegiate athletes [32]
Statistical analyses: All serum biomarker and body composition data presented represent the raw clinical values directly obtained from diagnostic laboratory equipment and typically utilized for medical purposes. Data were analyzed using Statistica software (TIBCO, version 13.5.0.17, Palo Alto, CA, USA). Parametric data were tested for normality, using the Kolmogorov–Smirnoz test. Pre-season and post-season serum ferritin and lean mass did not meet the assumptions of normality (p < 0.10). However, due to our large sample size (>30) and biologically-relevant data, we did not alter these data (ferritin or lean mass), in our statistical analyses, to accommodate mathematical assumptions of normality [33]. As such, paired t-tests were utilized to compare pre-season to post-season changes in anthropometric, body composition, and blood biomarker variables. Repeated-measures ANOVA analyses were utilized to assess time (pre- to post-season) and team (sports) differences, plus possible interactions between time vs. team (F-value). Linear relationships between variables were assessed using Pearson’s r for continuous variables (blood biomarkers and body composition) and Spearman’s rank-order correlations for categorical variables (ABQ). The effect size for each correlation coefficient (r) was also interpreted using Cohen’s d where: r = 0.2 represented a small effect; r = 0.5 represented a medium effect; and r = 0.8 represented a large effect [34].
The pre-season to post-season change for all continuous variables was denoted by the symbol “∆”, which reflected the mathematical calculation of “post-season minus pre-season”. Therefore, any positive ∆ value represented an increase, while any negative ∆ value represented a decrease in the stated variable across time. All data are expressed as mean ± SD, with statistical significance set a priori at p < 0.05.

3. Results

Seventy-three student-athletes (female: n = 49; male: n = 24) completed both pre-season and post-season testing. Pre-season demographic and anthropometric data for both male and female cohorts, separated further into sports teams, are reported in Table 1.
The pre-season and ∆ in body composition variables for both male and female cohorts, separated further by sports team, are reported in Table 2. No statistically significant differences (pre-season vs. post-season; paired t-test analyses) were noted for any body composition measure across time for any team. Repeated measures ANOVA analyses did not detect any significant interactions between time vs. team for any body composition variable.
Pre-season and post-season biomarker measurements for serum 25(OH)D in males (1a) and females (1b) and serum ferritin concentrations in males (1c) and females (1d) are depicted in Figure 1. No statistically significant differences (pre-season vs. post-season; paired t-test analyses) were noted for any biomarker measure for any team. Repeated measures ANOVA analyses detected a significant interaction between time vs. team for serum ferritin in the female cohort only (F = 4.2; p = 0.03).
With specific regards to biomarker changes in male participants, the mean serum 25(OH)D levels in the male basketball team were significantly lower than the mean value for male cross country (XC) and swim teams both pre- and post-season (Figure 1a). Thirty-eight percent of all male athletes were 25(OH)D insufficient pre-season increasing to 50% at post-season. Two male athletes (8%) were diagnosed with serum ferritin insufficiency pre-season, while only one male athlete demonstrated serum ferritin insufficiency post-season (4%).
With specific regards to biomarker changes in female participants, no significant time or team differences in mean 25(OH)D levels were observed (Figure 1b). Twenty-four percent of female athletes were 25(OH)D insufficient pre-season increasing to 35% at post-season. A significant interaction effect (time versus team) was noted for serum ferritin for females, with the female soccer players demonstrating lower pre- to post-season changes compared with the XC, swim, and basketball teams (Figure 1d). Fifty-seven percent of all female participants were diagnosed with serum ferritin insufficiency pre-season which improved to 31% post-season.
With regards to correlation analyses, when both male and female student-athletes were combined (N = 73), significant negative correlations were observed between pre-season 25(OH)D levels with both BMD ∆ (Figure 2a) and % body fat ∆ (Figure 2b). Weak significant negative correlations were also demonstrated between T or Z-scores with both pre-season 25(OH)D (r = −0.24; p = 0.04) and post-season 25(OH)D (r = −0.26; p = 0.03) but not with 25(OH)D ∆ (r = 0.01; p = 0.94) (data not shown). Serum ferritin ∆ was also inversely related with lean mass ∆, across the competitive season (Figure 2c). All three correlation coefficients (~r = 0.3) suggest that the effect sizes of these relationships were small, despite meeting the criteria for statistical significance [34]. No other significant correlations were noted between serum 25(OH)D ∆ vs. lean mass ∆ (r = −0.00; p = 0.94), BMD ∆ (r = 0.04; p = 0.74), or % body fat ∆ (r = −0.03; p = 0.80), or between serum ferritin ∆ vs. BMD ∆ (r = 0.06; p = 0.63) or % body fat ∆ (r = 0.17; p = 0.13).
When the male cohort (n = 24) was analyzed separately, stronger negative correlations were noted between pre-season 25(OH)D versus all three major body composition variables, pre-season (Figure 3a–c) and with BMD ∆ (Figure 3d). The correlation coefficients suggested a moderate effect [34] among 25(OH)D levels versus body composition variables. Of particular note, male basketball players paradoxically demonstrated the lowest 25(OH)D blood biomarker levels, of all athletes tested, but had the most favorable body composition parameters recorded (i.e., highest BMD and lean mass, with the lowest body fat percentage).
When the female cohort (n = 49) was analyzed separately, serum ferritin ∆ was negatively correlated with lean mass ∆ (Figure 4a) and positively correlated with % body fat ∆ (Figure 4b). The correlation coefficients suggested small-to-moderate effect sizes [33].
For the athlete burnout symptoms analyses, we conducted three linear regression analyses using the entire cohort (N = 72; one athlete did not complete the post-season ABQ). None of the three equations were significant, using either serum 25(OH)D ∆ (p = 0.78) or serum ferritin ∆ (p = 0.69) to predict each ABQ subscale. When analyses were separated by sex, neither serum 25(OH)D ∆ (p = 0.57) nor serum ferritin ∆ (p = 0.57) predicted athlete burnout symptoms in females.
However, a significant decrease in serum 25(OH)D ∆ (−8.4 ± 4.3 ng/mL) did significantly predict and explain 20.6% of the variance of male athlete perceptions of devaluation of the sport (p < 0.05). Additionally, pre-season serum ferritin levels (68.5 ± 31.4 ng/mL) explained 16% of the variance of male athlete perceptions of physical and emotional exhaustion from the sport (p ≤ 0.05). Additionally, pre-season serum ferritin and athlete burnout (r = 0.41: p < 0.05), post-season serum ferritin levels and athlete burnout (r = 0.36; NS), and 25(OH)D ∆ and athlete burnout (r = 0.41; p < 0.05) were significant.

4. Discussion

These preliminary data suggest that 25(OH)D levels demonstrate stronger relationships with body composition variables in male athletes, while ferritin levels are associated more strongly with body composition changes in female athletes. The influence of sex hormones and vitamin D on body composition changes in males remains unclear, as a 12-week randomized-control vitamin D supplement trial (20,000 IU/week) performed in healthy men demonstrated no differences in testosterone levels [35]. Similarly, an observational study performed on elite track and field athletes demonstrated no relationship between testosterone and 25(OH)D [36]. Thus, the potential interaction between sex steroid hormones, vitamin D status, and body composition changes warrant further investigation.
Conversely, in collegiate female athletes, significant relationships between serum ferritin levels and body composition were physiologically expected, as the prevalence of iron depletion in menstruating female athletes can be high (typically ranging between 16 and 57%) [7]. Females are at increased risk for iron deficiency anemia (over males), largely due to monthly menstrual blood losses typically between 60 and 100 mL [37] which are negatively related to ferritin and hemoglobin levels [20]. Low ferritin levels, with or without iron deficiency anemia, contribute to decreased endurance performance [3] and performance perception [20]. Although females clearly had lower serum ferritin levels compared with male athletes in the present study, the relationships between serum ferritin with body composition were opposite of physiological expectations following hard training and competition (i.e., increased ferritin was associated with decreased lean mass and increased fat mass, and not vice versa).
Overall, serum 25(OH)D levels decreased in our cohort of male and female student-athletes, in both indoor (swimming, basketball) and outdoor (XC and soccer) sports (Figure 1a,b). A similar seasonal decline was documented in 47 indoor and outdoor University athletes, living in the United Kingdom (51.2°2′ N), tested in Fall (pre-season) and Spring (post-season) [38]. Although serum 25(OH)D ∆ was not statistically significant in the overall cohort in the present study, post-season 25(OH)D levels were lower in male vs. female athletes (27.8 ± 12.4 ng/mL vs. 35.7 ± 13.1 ng/mL; p = 0.01). This sex difference has been verified in NCAA D1 athletes tested elsewhere [10] and of unclear biological or performance significance.
The low serum 25(OH)D levels seen in our male athletes were largely driven by the male basketball players, all of which were classified as vitamin D insufficient post-season (Figure 1a). Low 25(OH)D levels in male basketball players have been verified in the literature [9,11,39], with dark skin color [10,11,40] and limited sunlight exposure [41,42] being the most biologically plausible explanation for this sports-specific finding.
Paradoxically, those student-athletes with the lowest serum 25(OH)D levels demonstrated the largest BMD increases across the season (Figure 2a). This significant inverse relationship between pre-season 25(OH)D and BMD ∆ was physiologically unexpected, given the interactive role vitamin D plays in enabling calcium mobilization and subsequent bone mineralization [29,43]. However, an inverse relationship between 25(OH)D versus BMD has been documented previously in collegiate basketball players [11], which suggests that physical training may play a larger stimulatory role in bone formation [22] than isolated serum 25(OH)D levels which warrants further scientific and temporal clarification.
Our investigation also demonstrated a significant inverse relationship between pre-season 25(OH)D and % body fat ∆ (Figure 2b). This negative relationship has been previously documented in a cross-sectional investigation of 42 collegiate athletes tested in the Fall [44]. In that study, the authors hypothesized that increased fat stores sequestered vitamin D away from the circulation [44]. Although vitamin D is a fat soluble vitamin, other cross-sectional studies performed on collegiate female indoor athletes [12], or a longitudinal (pre- to post) study performed on collegiate basketball players, found no significant correlations between 25(OH)D and body fat [11].
Of note, significant relationships between serum 25(OH)D and body composition variables were largely present in our male, but not female, cohort (Figure 3). Fifty percent of male athletes and 35% of female athletes, in the present study, were vitamin D insufficient post-season. No significant relationships were noted between any body composition variable and serum 25(OH)D in our female cohort. This lack of relationship between body composition and serum 25(OH)D levels in females has been demonstrated previously in a cohort of 36 collegiate female athletes [12] and of unclear physiological relevance.
The male cross country (XC) runners in the current study tended to have the highest serum 25(OH)D levels, presumably from enhanced sunlight exposure during outdoor training and competition compared with indoor sport athletes such as swimmers and basketball players [14]. However, the higher absolute serum 25(OH)D levels were not associated with higher BMD (Figure 3c,d), lean mass (Figure 3a), or fat percentage (Figure 3b) compared with swimmers or basketball players. These cross-sectional relationships highlight the complexity of assigning “peak” performance serum 25(OH)D thresholds, such as the 40 ng/mL threshold proposed for athletes [2], across a variety of sports. For example, male basketball players may function optimally within the 12–20 ng/mL normal range threshold recommended for bone health by the National Academy of Medicine [45], while other athletes may not [2]. Although screening for serum 25(OH)D remains popularized in elite athletes [6,9,13], evidence to support general population screening for vitamin D deficiency remains inconclusive [46].
In contrast to the pre- to post-season decreases in serum 25(OH)D seen in the present study, increases in serum ferritin levels were seen across the season for all sports teams. Serum ferritin levels were significantly lower in female vs. male athletes both pre-season (38.5 ± 3.0 vs. 68.5 ± 31.5 ng/mL; p = 0.0002) and post-season (53.1 ± 35.0 vs. 79.9 ± 35.8 ng/mL; p = 0.003), due to increased blood losses (menses) in pre-menopausal females [3,47]. Student-athletes meeting the threshold for serum ferritin insufficiency (≤35 ng/mL) pre-season (57% of females and 8% of males) were counseled by the team nutritionist to increase iron ingestion through diet and self-supplementation, as supplements were not provided (or prescribed) by the Athletic department. With that said, it was interesting to note that serum ferritin levels increased across time in the male cohort who were not counseled to increase iron intake. This unexpected increase in serum ferritin across both time and sport highlights the complexity of utilizing serum ferritin as a singular marker of tissue (mainly liver) iron stores, as serum ferritin is also an acute phase inflammatory marker [48]. Thus, increases in serum ferritin, as a measure of tissue iron stores across a competitive season, may be confounded by training or competition-induced inflammation, as previously verified in athletes after endurance races [30,49]. The contributions of inflammation to increased serum ferritin levels (non-related to iron storage levels) thereby warrant further investigation using additional inflammatory markers such as hepcidin [3], C-reactive protein, and interleukin-6 [49] in future athlete studies.
Serum ferritin ∆ levels were inversely related to lean mass ∆ when all athletes were combined (Figure 2c). The negative direction of this relationship suggests that those athletes who gained the most lean mass over the season demonstrated the steepest declines in serum ferritin levels. A 12-week strength training intervention performed on 40 non-athlete college students demonstrated similar increases in fat-free mass, with decreases in serum ferritin levels, in male subjects who started the training regimen with normal serum ferritin levels [50]. The authors of that training study suggested that the increase in training had depleted iron stores, although this finding did not apply to their female athletes or participants (male or female) with low baseline serum ferritin levels [50].
Unlike serum 25(OH)D, only the female athletes in the present study demonstrated significant relationships between serum ferritin ∆ versus body composition variables (Figure 4). The directionality of these associations was also paradoxical, as increased serum ferritin levels across the competitive season were associated with decreased lean mass (Figure 4a) and increased body fat percent (Figure 4b). Decreased muscle mass and increased fat usually represent unfavorable training adaptations which signify overtraining, undertraining, under-recovery, or even under-nutrition with or without RED-S [21,23,24,25]. Although published studies clearly suggest that increased serum ferritin levels (from iron supplementation) enhance both endurance performance [3,17] and strength gains [3], the physiological effects of serum ferritin levels on body composition markers require more controlled investigations—including dietary and caloric intake data—particularly in female athletes participating in aesthetic and gravitational sports.
Preliminary associations between post-season athlete burnout with either serum 25(OH)D or serum ferritin levels (pre-season, post-season, or ∆) were not significantly correlated when all athletes were combined. However, when separated by sex, devaluation of the sport (as a subscale) was negatively related to serum 25(OH)D ∆, while pre-season serum ferritin was positively related to physical and emotional exhaustion in male athletes only. Previous studies have shown that 5 days of vitamin D3 enhance mood, when compared to placebo supplementation [4]. Similarly, a significant inverse relationship was documented between serum 25(OH)D and depression scores in 615 healthy male and female University students (45.5° S) [27]. Collectively, these studies suggest the possibility of a biopsychological link between mood and vitamin D. With regards to serum ferritin, a cross-sectional study performed on 192 female medical students found that serum ferritin levels were lower in depressed compared with non-depressed students [28]. Thus, a possible interplay between nutrient biochemistry and athlete burnout appears plausible and worthy of more critical follow-up in the future, especially amongst male athletes.
Limitations: Changes in body composition (Table 2) and blood nutrient biomarkers (Figure 1) were perhaps too small (i.e., statistically and clinically insignificant) to make meaningful conclusions regarding optimal performance “thresholds” for serum 25(OH)D and ferritin levels in athletes. Athletes with insufficient serum 25(OH)D or ferritin at baseline (pre-season) were encouraged to ingest supplements at the counseling and recommendation of the team nutritionist (CA), but supplementation was never recorded. This lack of dietary evaluation, dietary supplement control, quantification of skin color, and/or sunlight exposure compromised our ability to interpret the paradoxical relationships demonstrated between serum 25(OH)D and ferritin markers with body composition changes properly. Lastly, we were unable to quantify sun exposure, which would significantly impact serum 25(OH)D levels [42]. As such, the staggered endpoint for each sport (i.e., post-season testing) offered additional confounding variables in interpreting relationships between nutrient biomarkers and body composition changes. For example, the highest expected 25(OH)D values would be expected during pre-season testing (after summer), followed by Winter season testing and then Spring season testing [38,51]. Additionally, serum 25(OH) would be expected to be lower for athletes participating in indoor sports (basketball and swimming) compared with outdoor ports (XC and soccer) [14,51]. Nonetheless, despite these limitations, the current preliminary results do provide pilot data to launch more carefully controlled—and targeted—studies regarding the predictive utility of serum 25(OH)D and serum ferritin measurement on body composition and mood changes across a longer timeframe.

5. Conclusions

Serum 25(OH)D levels declined in all athletes, regardless of indoor or outdoor sport, across the competitive season. The male athletes had lower 25(OH)D levels and increased burnout symptoms compared with female athletes. Conversely, serum ferritin levels increased across the season in both male and female athletes, with female athletes having lower serum ferritin levels compared with male athletes. The directionality of relationships between 25(OH)D levels and total fat, lean, and bone in male athletes were opposite of what was physiologically expected and largely driven by very low 25(OH)D levels in the male basketball players. Similarly, the directionality of relationships between serum ferritin levels and lean mass and fat percentage in female athletes was opposite of expected and paradoxically reflects a deleterious training response. Collectively, these results highlight the difficulties in creating “blanket” threshold recommendations for serum 25(OH)D and ferritin levels which maximize body composition and mood changes across a variety seasons, sex, and sports. We thereby hypothesize that skin color and sun exposure (i.e., indoor versus outdoor) more strongly influence serum 25(OH)D levels, while sex and training exposure (i.e., endurance versus strength) more strongly influence serum ferritin levels. Larger cohorts of athletes are required to re-assess “normal” nutrient biomarker ranges per sex, sport, ethnicity, and environment which would maximize favorable body composition and improve precision nutrition.
Our results also add caution to the utilization of single biomarkers—and nutrients—to predict complex training outcomes favoring peak athlete health and performance. Additionally, the results from the present study question the current trend towards “biomarker creep” in sports performance. For example, the normal cut-off threshold for serum 25(OH)D in healthy individuals is 12 ng/mL, while a threshold of 40 ng/mL is recommended for athletes seeking peak performance [2]. Similarly, the normal cut-off threshold for serum ferritin for healthy individuals is 12 ng/mL [20], while thresholds as high as 50 ng/mL have been recommended for male endurance athletes [16]. These elevated blood nutrient biomarker recommendations for athletes exist without compelling evidence, from randomized-control trials, which support enhanced physical or mental performance. Thus, elevated “athlete specific” thresholds for both serum 25(OH)D and serum ferritin require further recalibration.

Author Contributions

All authors were involved with the development of this article and contributed to the following: Conceptualization, T.H.-B., K.L.-P., C.A., B.B. and J.M.; Methodology, T.H.-B., K.L.-P., C.A., B.B. and G.B.; Formal Analysis, T.H.-B., J.S., M.V., V.S.-H., B.B. and J.M.; Investigation, T.H.-B., K.L.-P., C.A., B.B. and G.B.; Data Curation, T.H.-B., K.L.-P., C.A., B.B. and G.B.; Writing—Original Draft Presentation, T.H.-B., V.S.-H., M.V. and J.S.; Funding Acquisition, T.H.-B.; Project Administration, T.H.-B., K.L.-P., C.A. and B.B.; Writing—Review and Editing, T.H.-B., C.A., B.B., J.S., M.V., V.S.-H., K.L.-P., G.B. and J.M. All authors have read and agreed to the published version of the manuscript.

Funding

This research was funded by an internal Oakland University Prevention Research Center grant (T.H.-B.).

Institutional Review Board Statement

The study was conducted according to the guidelines of the Declaration of Helsinki and approved by the Institutional Review Board (or Ethics Committee) of Oakland University (IRB#778936, approval granted 10 August 2016).

Informed Consent Statement

Informed consent was obtained from all subjects involved in the study.

Data Availability Statement

All data will be available on request to the corresponding author (T.H.-B.).

Acknowledgments

We wish to thank Barbara Ledin for laboratory assistance with biomarker analyses at Ascension/Crittendon Hospital and Lisa DeCeuninck, Christopher Ryan, and Justin Wight for lab assistance. We sincerely appreciate support from the cross country, swimming, basketball, and soccer coaches, staff, and players whose tenacity and enthusiasm inspired us both on and off the court.

Conflicts of Interest

The authors declare no conflict of interest.

References

  1. Schork, N.J. Personalized medicine: Time for one-person trials. Nature 2015, 520, 609–611. [Google Scholar] [CrossRef]
  2. Dahlquist, D.T.; Dieter, B.P.; Koehle, M.S. Plausible ergogenic effects of vitamin D on athletic performance and recovery. J. Int. Soc. Sports Nutr. 2015, 12, 33. [Google Scholar] [CrossRef] [Green Version]
  3. Pasricha, S.R.; Low, M.; Thompson, J.; Farrell, A.; De-Regil, L.M. Iron supplementation benefits physical performance in women of reproductive age: A systematic review and meta-analysis. J. Nutr. 2014, 144, 906–914. [Google Scholar] [CrossRef] [PubMed]
  4. Lansdowne, A.T.; Provost, S.C. Vitamin D3 enhances mood in healthy subjects during winter. Psychopharmacology 1998, 135, 319–323. [Google Scholar] [CrossRef] [PubMed]
  5. Ljungqvist, A.; Jenoure, P.J.; Engebretsen, L.; Alonso, J.M.; Bahr, R.; Clough, A.F.; de Bondt, G.; Dvorak, J.; Maloley, R.; Matheson, G.; et al. The International Olympic Committee (IOC) consensus statement on periodic health evaluation of elite athletes, March 2009. Clin. J. Sport Med. 2009, 19, 347–365. [Google Scholar] [CrossRef] [Green Version]
  6. Rockwell, M.; Hulver, M.; Eugene, E. Vitamin D Practice Patterns in National Collegiate Athletic Association Division I Collegiate Athletics Programs. J. Athl. Train. 2020, 55, 65–70. [Google Scholar] [CrossRef] [PubMed]
  7. Parks, R.B.; Hetzel, S.J.; Brooks, M.A. Iron Deficiency and Anemia among Collegiate Athletes: A Retrospective Chart Review. Med. Sci. Sports Exerc. 2017, 49, 1711–1715. [Google Scholar] [CrossRef]
  8. Hackney, A.C.; Elliott-Sale, K.J. Exercise Endocrinology: “What Comes Next?”. Endocrines 2021, 2, 17. [Google Scholar] [CrossRef]
  9. Grieshober, J.A.; Mehran, N.; Photopolous, C.; Fishman, M.; Lombardo, S.J.; Kharrazi, F.D. Vitamin D Insufficiency Among Professional Basketball Players: A Relationship to Fracture Risk and Athletic Performance. Orthop. J. Sports Med. 2018, 6, 2325967118774329. [Google Scholar] [CrossRef] [Green Version]
  10. Villacis, D.; Yi, A.; Jahn, R.; Kephart, C.J.; Charlton, T.; Gamradt, S.C.; Romano, R.; Tibone, J.E.; Hatch, G.F., 3rd. Prevalence of Abnormal Vitamin D Levels Among Division I NCAA Athletes. Sports Health 2014, 6, 340–347. [Google Scholar] [CrossRef] [PubMed]
  11. Fields, J.B.; Payne, D.C.; Gallo, S.; Busteed, D.R.; Jones, M.T. Vitamin D Status Differs by Sex, Sport-Season, and Skin Pigmentation among Elite Collegiate Basketball Players. Sports 2019, 7, 239. [Google Scholar] [CrossRef] [PubMed] [Green Version]
  12. Fields, J.B.; Gallo, S.; Worswick, J.M.; Busteed, D.R.; Jones, M.T. 25-Hydroxyvitamin D, Vitamin D Binding Protein, Bioavailable 25-Hydroxyvitamin D, and Body Composition in a Diverse Sample of Women Collegiate Indoor Athletes. J. Funct. Morphol. Kinesiol. 2020, 5, 32. [Google Scholar] [CrossRef] [PubMed]
  13. Weber, A.E.; Bolia, I.K.; Korber, S.; Mayfield, C.K.; Lindsay, A.; Rosen, J.; McMannes, S.; Romano, R.; Tibone, J.E.; Gamradt, S.C. Five-Year Surveillance of Vitamin D Levels in NCAA Division I Football Players: Risk Factors for Failed Supplementation. Orthop J. Sports Med. 2021, 9, 2325967120975100. [Google Scholar] [CrossRef] [PubMed]
  14. Halliday, T.M.; Peterson, N.J.; Thomas, J.J.; Kleppinger, K.; Hollis, B.W.; Larson-Meyer, D.E. Vitamin D status relative to diet, lifestyle, injury, and illness in college athletes. Med. Sci. Sports Exerc. 2011, 43, 335–343. [Google Scholar] [CrossRef] [Green Version]
  15. Cowell, B.S.; Rosenbloom, C.A.; Skinner, R.; Summers, S.H. Policies on screening female athletes for iron deficiency in NCAA division I-A institutions. Int. J. Sport Nutr. Exerc. Metab. 2003, 13, 277–285. [Google Scholar] [CrossRef]
  16. Cook, J.D.; Skikne, B.S. Iron deficiency: Definition and diagnosis. J. Intern. Med. 1989, 226, 349–355. [Google Scholar] [CrossRef]
  17. Eichner, E.R. Perennial questions: On fatigue, on iron, and on anemia. Curr Sports Med. Rep. 2012, 11, 274–275. [Google Scholar] [CrossRef]
  18. Pilch, W.; Kita, B.; Piotrowska, A.; Tota, Ł.; Maciejczyk, M.; Czerwińska-Ledwig, O.; Sadowska-Krepa, E.; Kita, S.; Pałka, T. The effect of vitamin D supplementation on the muscle damage after eccentric exercise in young men: A randomized, control trial. J. Int. Soc. Sports Nutr. 2020, 17, 53. [Google Scholar] [CrossRef]
  19. Miller, J.R.; Dunn, K.W.; Ciliberti, L.J., Jr.; Patel, R.D.; Swanson, B.A. Association of Vitamin D With Stress Fractures: A Retrospective Cohort Study. J. Foot Ankle Surg. 2016, 55, 117–120. [Google Scholar] [CrossRef]
  20. Risser, W.L.; Lee, E.J.; Poindexter, H.B.; West, M.S.; Pivarnik, J.M.; Risser, J.M.; Hickson, J.F. Iron deficiency in female athletes: Its prevalence and impact on performance. Med. Sci. Sports Exerc. 1988, 20, 116–121. [Google Scholar] [CrossRef]
  21. Barakat, C.; Pearson, J.; Escalante, G.; Campbell, B.; De Souza, E.O. Body Recomposition: Can Trained Individuals Build Muscle and Lose Fat at the Same Time? Strength Cond. J. 2020, 42, 7–21. [Google Scholar] [CrossRef]
  22. Bennell, K.L.; Malcolm, S.A.; Khan, K.M.; Thomas, S.A.; Reid, S.J.; Brukner, P.D.; Ebeling, P.R.; Wark, J.D. Bone mass and bone turnover in power athletes, endurance athletes, and controls: A 12-month longitudinal study. Bone 1997, 20, 477–484. [Google Scholar] [CrossRef]
  23. Stanfa, M.R.; Silles, N.N.; Cooper, A.; Arena, S.; Landis-Piwowar, K.; Aprik, C.; Hew-Butler, T. Risk Factors for Collegiate Swimmers Hospitalized With Exertional Rhabdomyolysis. Clin. J. Sport Med. 2017, 27, 37–45. [Google Scholar] [CrossRef]
  24. Mountjoy, M.; Sundgot-Borgen, J.; Burke, L.; Carter, S.; Constantini, N.; Lebrun, C.; Meyer, N.; Sherman, R.; Steffen, K.; Budgett, R.; et al. The IOC consensus statement: Beyond the Female Athlete Triad--Relative Energy Deficiency in Sport (RED-S). Br. J. Sports Med. 2014, 48, 491–497. [Google Scholar] [CrossRef]
  25. Tenforde, A.S.; Carlson, J.L.; Chang, A.; Sainani, K.L.; Shultz, R.; Kim, J.H.; Cutti, P.; Golden, N.H.; Fredericson, M. Association of the Female Athlete Triad Risk Assessment Stratification to the Development of Bone Stress Injuries in Collegiate Athletes. Am. J. Sports Med. 2017, 45, 302–310. [Google Scholar] [CrossRef]
  26. Scheid, J.L.; Stefanik, M.E. Drive for Thinness Predicts Musculoskeletal Injuries in Division II NCAA Female Athletes. J. Funct. Morphol. Kinesiol. 2019, 4, 52. [Google Scholar] [CrossRef] [PubMed] [Green Version]
  27. Polak, M.A.; Houghton, L.A.; Reeder, A.I.; Harper, M.J.; Conner, T.S. Serum 25-hydroxyvitamin D concentrations and depressive symptoms among young adult men and women. Nutrients 2014, 6, 4720–4730. [Google Scholar] [CrossRef] [PubMed] [Green Version]
  28. Vahdat Shariatpanaahi, M.; Vahdat Shariatpanaahi, Z.; Moshtaaghi, M.; Shahbaazi, S.H.; Abadi, A. The relationship between depression and serum ferritin level. Eur. J. Clin. Nutr. 2007, 61, 532–535. [Google Scholar] [CrossRef] [Green Version]
  29. Holick, M.F.; Binkley, N.C.; Bischoff-Ferrari, H.A.; Gordon, C.M.; Hanley, D.A.; Heaney, R.P.; Murad, M.H.; Weaver, C.M. Evaluation, treatment, and prevention of vitamin D deficiency: An Endocrine Society clinical practice guideline. J. Clin. Endocrinol. Metab. 2011, 96, 1911–1930. [Google Scholar] [CrossRef] [Green Version]
  30. Nielsen, P.; Nachtigall, D. Iron supplementation in athletes. Current recommendations. Sports Med. 1998, 26, 207–216. [Google Scholar] [CrossRef]
  31. Hologic. QDR Reference Manual, 2nd ed.; MAN-00732; Hologic, Inc.: Bedford, MA, USA, 2007. [Google Scholar]
  32. Raedeke, T.D.; Smith, A.L. Development and Preliminary Validation of an Athlete Burnout Measure. J. Sport Exerc. Psychol. 2001, 23, 281–306. [Google Scholar] [CrossRef] [PubMed]
  33. Ghasemi, A.; Zahediasl, S. Normality tests for statistical analysis: A guide for non-statisticians. Int. J. Endocrinol. Metab. 2012, 10, 486–489. [Google Scholar] [CrossRef] [PubMed] [Green Version]
  34. Sullivan, G.M.; Feinn, R. Using Effect Size-or Why the P Value Is Not Enough. J. Grad. Med. Educ. 2012, 4, 279–282. [Google Scholar] [CrossRef] [Green Version]
  35. Lerchbaum, E.; Pilz, S.; Trummer, C.; Schwetz, V.; Pachernegg, O.; Heijboer, A.C.; Obermayer-Pietsch, B. Vitamin D and Testosterone in Healthy Men: A Randomized Controlled Trial. J. Clin. Endocrinol. Metab. 2017, 102, 4292–4302. [Google Scholar] [CrossRef]
  36. Krzywański, J.; Pokrywka, A.; Młyńczak, M.; Mikulski, T. Is vitamin D status reflected by testosterone concentration in elite athletes? Biol. Sport 2020, 37, 229–237. [Google Scholar] [CrossRef]
  37. Fraser, I.S.; Warner, P.; Marantos, P.A. Estimating menstrual blood loss in women with normal and excessive menstrual fluid volume. Obstet. Gynecol. 2001, 98, 806–814. [Google Scholar] [CrossRef]
  38. Wilson-Barnes, S.L.; Hunt, J.E.A.; Williams, E.L.; Allison, S.J.; Wild, J.J.; Wainwright, J.; Lanham-New, S.A.; Manders, R.J.F. Seasonal variation in vitamin D status, bone health and athletic performance in competitive university student athletes: A longitudinal study. J. Nutr. Sci. 2020, 9, e8. [Google Scholar] [CrossRef] [Green Version]
  39. Constantini, N.W.; Arieli, R.; Chodick, G.; Dubnov-Raz, G. High prevalence of vitamin D insufficiency in athletes and dancers. Clin. J. Sport Med. 2010, 20, 368–371. [Google Scholar] [CrossRef] [PubMed] [Green Version]
  40. Powe, C.E.; Evans, M.K.; Wenger, J.; Zonderman, A.B.; Berg, A.H.; Nalls, M.; Tamez, H.; Zhang, D.; Bhan, I.; Karumanchi, S.A.; et al. Vitamin D-binding protein and vitamin D status of black Americans and white Americans. N. Engl. J. Med. 2013, 369, 1991–2000. [Google Scholar] [CrossRef] [PubMed] [Green Version]
  41. Lewis, R.M.; Redzic, M.; Thomas, D.T. The effects of season-long vitamin D supplementation on collegiate swimmers and divers. Int J. Sport Nutr. Exerc. Metab. 2013, 23, 431–440. [Google Scholar] [CrossRef] [Green Version]
  42. Webb, A.R.; Kline, L.; Holick, M.F. Influence of season and latitude on the cutaneous synthesis of vitamin D3: Exposure to winter sunlight in Boston and Edmonton will not promote vitamin D3 synthesis in human skin. J. Clin. Endocrinol. Metab. 1988, 67, 373–378. [Google Scholar] [CrossRef] [PubMed] [Green Version]
  43. Klesges, R.C.; Ward, K.D.; Shelton, M.L.; Applegate, W.B.; Cantler, E.D.; Palmieri, G.M.; Harmon, K.; Davis, J. Changes in bone mineral content in male athletes. Mechanisms of action and intervention effects. JAMA 1996, 276, 226–230. [Google Scholar] [CrossRef]
  44. Heller, J.E.; Thomas, J.J.; Hollis, B.W.; Larson-Meyer, D.E. Relation between vitamin D status and body composition in collegiate athletes. Int. J. Sport Nutr. Exerc. Metab. 2015, 25, 128–135. [Google Scholar] [CrossRef]
  45. LeFevre, M.L.; LeFevre, N.M. Vitamin D Screening and Supplementation in Community-Dwelling Adults: Common Questions and Answers. Am. Fam. Physician 2018, 97, 254–260. [Google Scholar]
  46. Jin, J. Screening for Vitamin D Deficiency in Adults. JAMA 2021, 325, 1480. [Google Scholar] [CrossRef] [PubMed]
  47. Camaschella, C. Iron deficiency. Blood 2019, 133, 30–39. [Google Scholar] [CrossRef] [Green Version]
  48. Kell, D.B.; Pretorius, E. Serum ferritin is an important inflammatory disease marker, as it is mainly a leakage product from damaged cells. Metallomics 2014, 6, 748–773. [Google Scholar] [CrossRef] [PubMed] [Green Version]
  49. Comassi, M.; Vitolo, E.; Pratali, L.; Del Turco, S.; Dellanoce, C.; Rossi, C.; Santini, E.; Solini, A. Acute effects of different degrees of ultra-endurance exercise on systemic inflammatory responses. Intern. Med. J. 2015, 45, 74–79. [Google Scholar] [CrossRef]
  50. Deruisseau, K.C.; Roberts, L.M.; Kushnick, M.R.; Evans, A.M.; Austin, K.; Haymes, E.M. Iron status of young males and females performing weight-training exercise. Med. Sci. Sports Exerc. 2004, 36, 241–248. [Google Scholar] [CrossRef] [PubMed] [Green Version]
  51. Zürcher, S.J.; Quadri, A.; Huber, A.; Thomas, L.; Close, G.L.; Brunner, S.; Noack, P.; Gojanovic, B.; Kriemler, S. Predictive Factors for Vitamin D Concentrations in Swiss Athletes: A Cross-sectional Study. Sports Med. Int. Open 2018, 2, E148–E156. [Google Scholar] [CrossRef] [Green Version]
Figure 1. Pre-season to post-season changes in serum 25-OH Vitamin D and serum ferritin concentrations by sex (males (a) and (c); females (b) and (d)) and by sports team. *** p < 0.001 between Basketball vs. XC and Swim, both pre-season and post-season (a) p < 0.05 between Soccer vs. Swim and Basketball for ∆ serum ferritin (d).
Endocrines 02 00030 g001
Figure 2. Statistically significant correlations between pre-season serum 25-OH-Vitamin D and changes (∆: post- minus pre-season change) in bone mineral density (BMD) (a) and total body fat % (b) as well as between changes in serum ferritin and changes in total body lean mass (c) when all athletes were combined (N = 73).
Endocrines 02 00030 g002
Figure 3. Statistically significant correlations between pre-season 25-OH-Vitamin D and pre-season total body lean mass (a), body fat % (b), bone mineral density (BMD) (c), and changes in BMD (d) for the male cohort only (n = 24).
Endocrines 02 00030 g003
Figure 4. Statistically significant correlations between changes (∆: post- minus pre-season change) in serum ferritin concentration and changes in total body lean mass (a) and changes in total body fat % (b) for the female cohort only (n = 49).
Endocrines 02 00030 g004
Table 1. Student-athlete demographics by sex and sports team. All data reported as means ± SD.
Team
(N = 73)
Age
(years)
Height
(m)
Weight
(kg)
BMI
(kg/m2)
♀XC
(n = 16)
19.4 ± 1.51.64 ± 0.156.6 ± 4.920.8 ± 1.8
♂XC
(n = 9)
20.3 ± 0.91.80 ± 0.168.8 ± 6.921.3 ± 0.9
♀Swim
(n-12)
19.6 ± 1.11.70 ± 0.167.2 ± 5.823.2 ± 2.1
♂Swim
(n = 6)
20.7 ± 1.21.84 ± 0.178.5 ± 5.223.3 ± 1.6
♀Basketball
(n = 10)
19.7 ± 1.41.76 ± 0.175.1 ± 12.024.3 ± 3.4
♂Basketball
(n = 9)
20.1 ± 1.51.96 ± 0.194.5 ± 14.324.6 ± 2.8
♀Soccer
(n = 11)
19.5 ± 1.21.69 ± 0.164.9 ± 14.422.6 ± 3.6
♀COMBINED
(n = 49)
19.5 ± 1.31.69 ± 0.164.8 ± 11.522.6 ± 2.0
♂COMBINED
(n = 24)
20.3 ± 0.11.87 ± 0.180.9 ± 15.023.0 ± 2.4
XC = cross country; BMI = body mass index; ♀ = female; ♂ = male.
Table 2. Pre-season and change (∆: post-season minus pre-season) in total body fat (%), bone mineral density (BMD), and lean mass in student-athletes by sex and sports team. All data reported as means ± SD.
Team
(N = 73)
Pre
Body Fat
(%)

Body Fat
(%)
Pre
BMD
(g/cm2)

BMD
(g/cm2)
Pre
Lean Mass
(kg)

Lean Mass
(kg)
T or Z-Score
XC
(n = 16)
18.7 ± 3.1−0.8 ± 1.11.08 ± 0.06−0.00 ± 0.0243.7 ± 4.3−0.4 ± 0.9−0.34 ± 0.82
XC
(n = 9)
8.5 ± 1.1−0.1 ± 0.81.22 ± 0.05−0.01 ± 0.0159.4 ± 6.1−0.3 ± 0.9−0.19 ± 0.46
Swim
(n-12)
21.2 ± 3.8−1.7 ± 1.81.08 ± 0.070.00 ± 0.0249.0 ± 3.01.8 ± 1.3−0.22 ± 0.76
Swim
(n = 6)
12.0 ± 2.4−1.3 ± 1.71.17 ± 0.070.00 ± 0.0166.0 ± 5.50.5 ± 2.1−0.57 ± 0.75
Basketball
(n = 10)
18.2 ± 5.1−0.7 ± 1.11.19 ± 0.090.01 ± 0.0256.1 ± 5.9−0.6 ± 1.91.10 ± 0.55
Basketball
(n = 9)
10.7 ± 3.00.8 ± 1.41.37 ± 0.090.02 ± 0.0277.8 ± 9.1−1.3 ± 1.41.14 ± 0.79
Soccer
(n = 11)
19.9 ± 5.00.2 ± 1.51.09 ± 0.070.01 ± 0.0148.7 ± 6.5−0.8 ± 1.50.76 ± 0.43
COMBINED
(n = 49)
19.5 ± 4.2−0.8 ± 1.51.10 ± 0.080.00 ± 0.0248.7 ± 6.6−0.2 ± 1.60.18 ± 0.90
COMBINED
(n = 24)
10.2 ± 2.6−0.1 ± 1.51.27 ± 0.110.01 ± 0.0267.9 ± 10.80.3 ± 3.80.17 ± 0.97
XC = cross country; BMD = bone mineral density; ♀ = female; ♂ = male.
Publisher’s Note: MDPI stays neutral with regard to jurisdictional claims in published maps and institutional affiliations.

