Article

Porous Polymer Gel Electrolytes Influence Lithium Transference Number and Cycling in Lithium-Ion Batteries

1
Department of Chemical and Biomolecular Engineering, University of Notre Dame, Notre Dame, IN 46556, USA
2
Department of Mechanical and Industrial Engineering, University of Brescia, 38 Via Branze, 25123 Brescia, Italy
*
Author to whom correspondence should be addressed.
Submission received: 27 April 2021 / Revised: 15 May 2021 / Accepted: 19 May 2021 / Published: 27 May 2021
(This article belongs to the Special Issue Feature Papers of Electronic Materials)

Abstract

:
To improve the energy density of lithium-ion batteries, the development of advanced electrolytes with enhanced transport properties is highly important. Here, we show that by confining the conventional electrolyte (1 M LiPF6 in EC-DEC) in a microporous polymer network, the cation transference number increases to 0.79 while maintaining an ionic conductivity on the order of 10 3 S cm−1. By comparison, a non-porous, condensed polymer electrolyte of the same chemistry has a lower transference number and conductivity, of 0.65 and 7.6 × 10⁻⁴ S cm−1, respectively. Within Li-metal/LiFePO4 cells, the improved transport properties of the porous polymer electrolyte enable substantial performance enhancements compared to a commercial separator in terms of rate capability, capacity retention, active material utilization, and efficiency. These results highlight the importance of polymer electrolyte structure–performance property relationships and help guide the future engineering of better materials.

1. Introduction

The development of next-generation batteries with high energy density is important because of the growing requirement for portable devices, renewable energy, and electric vehicles [1,2]. The implementation of these batteries is highly dependent on novel electrolyte materials with excellent transport properties, low interfacial resistance, and good mechanical strength. Solid-state polymer electrolytes (SPEs), a specific class of polymer electrolytes, are considered as promising candidates to replace current organic liquid electrolytes due to their mechanical properties and electrochemical stability against lithium metal. However, current SPEs suffer from low ionic conductivity at room temperature applications and high contact resistance [3]. In order to overcome these issues, there is a particular interest in gel polymer electrolytes. These systems, which contain liquid plasticizers, have attracted great attention in the field of energy storage device systems due to their specific features, reasonably high ionic conductivity, and enhanced interfacial charge transfer [4,5]. In terms of transport properties, along with the ionic conductivity transference number, which is simply defined as the fraction of the total ionic conductivity that is carried by Li+, is profoundly critical. Single-ion-conducting polymer electrolytes are known for providing a high cation transference number due to the presence of anchored anions in the polymer network [6,7]. Unfortunately, Li+ being the only mobile species in the electrolyte, results in lower-than-desirable ionic conductivity [8,9]. Developing an electrolyte system that possesses high ionic conductivity and a high cation transference number to avoid concentration gradients in the cell is still challenging.
There are a few recent studies that show that utilizing a liquid electrolyte in conjunction with a porous polymer structure can provide desirable transport properties and cycling performance in different lithium battery configurations [10,11,12,13,14]. Helms and colleagues reported a cation transference number of 0.72 for a nanoconfined polymer electrolyte based on a polymer of intrinsic microporosity (PIM) coated on lithium metal in 1 M LiTFSI and 0.2 M LiNO3 (DOL-DME 1:1 v%) electrolyte [10]. Archer and colleagues reported a gel polymer electrolyte with enhanced transport properties which consisted of a crosslinked polyethylene glycol-based network with covalently tethered sulfonate groups [11]. In the 1 M LiTFSI (DOL-DME) and 0.5 M LiPS electrolyte, the transference number was reported as 0.98, which may be the highest transference number ever reported for a gel polymer electrolyte containing free salt, along with 1.14 × 10 3 S cm−1 ionic conductivity. The porous polymer electrolyte was used in the Li/S configuration, and the cell displayed over 98% Coulombic efficiency over 100 cycles. Wang and colleagues used a similar crosslinked polymer as a coating on a polyethylene separator, in the presence of 1 M LiPF6 (EC-EMC-DEC) [13]. The transference number was 0.72 along with 10 4 S cm−1 ionic conductivity at room temperature.
Here, by direct comparison of a condensed, non-porous, crosslinked polyethylene dimethacrylate (PEGDMA) network and a porous PEGDMA network, we show that the polymer structure is a powerful tool for influencing polymer gel electrolyte transport properties. PEGDMA films with varying macrostructure but identical chemistry were synthesized inadvertently when vinyl sulfonate (VS) was included in the prepolymer solutions. In some cases, VS acted as a structure-directing agent that resulted in porous morphology [15,16,17], and in all cases, the VS failed to polymerize into the network to a measurable extent. The structure of PEGDMA films is was also highly impacted by additional water in the prepolymer solution. Surprisingly, we found that the confinement of a conventional Li-ion battery electrolyte in the porous PEGDMA network results in an increase of the lithium transference number to 0.79 while maintaining the ionic conductivity in the order of 10 3 S cm−1. Application of the porous network to Li/LiFePO4 cells results in improved rate capability when compared to cells containing conventional separators at comparable interelectrode distances.

2. Materials and Methods

2.1. Vinyl Sulfonate Salt Preparation

80 mL of ethanol (Sigma Aldrich, Milwaukee, WI, USA) was added gradually to 40 g of vinyl sulfonic acid sodium salt solution (25% wt Sigma Aldrich) precipitating solid salt. The salt was precipitated in ethanol to minimize the water content in the vinyl sulfonate salt. The mixture was transferred to a Buchner funnel with the flask connected to a vacuum line in a fume hood and was filtered. The filtration was repeated twice to collect a larger fraction of salt. The filtrated salt was put in 150 mL flask glassware and placed in a vacuum oven. The salt was dried under vacuum for 24 h at 100 °C. The dried salt was transferred to a vial and dried for 12 h under a high vacuum on a Schlenk line.

2.2. Synthesis of Condensed, Transparent Membrane PEGDMA-VS-0

Vinyl sulfonate salt was dissolved in anhydrous dimethyl sulfoxide (DMSO, Sigma Aldrich). The dissolution process was supported by the use of a heat gun (Master Appliance Corp., Racine, WI, USA (Model EC-100)). The exact amount of poly(ethylene glycol) dimethacrylate, (PEGDMA, 750 g/mol, Sigma-Aldrich) was added to the VS-DMSO solution and dissolved. The solution was stirred until fully mixed. After stirring for 10 min, a small amount of metastable gel phase became visible at the bottom of the vial. In order to mix it well, the visible gel pieces were squished with a spatula and the solids dissolved back into the liquid. To this monomer solution, photoinitiator 2-hydroxy-4’-(2-hydroxyethoxy)-2-methyl propiophenone (Sigma-Aldrich) was added and dissolved. The monomer solution was sandwiched between two 1⁄4 in. thick borosilicate glass plates (McMaster Carr, Elmhurst, IL, USA) separated by 200   μ m thick glass microscope slides (VWR, West Chester, PA, USA). This was then placed in a UVC-515 Ultraviolet Multilinker 254 nm UV oven. The plates were flipped every 2 min to ensure both sides of the solution received equal UV radiation. The monomer solutions were photo-crosslinked for a total of 45 min. The resultant polymers were washed with DMSO to remove any unreacted material. The films were rinsed with deionized water. The membranes went through the ionic exchange process as explained below. After the ionic exchange process, the films were air-dried for 2 days and then brought into an argon-filled glovebox (<10 ppm O2, <0.1 ppm water) and vacuum dried for 16 h at 80 °C to remove residual solvent. The abbreviation of this membrane for the rest of the study is T-PEGDMA-VS-0. The “VS” stands for vinyl sulfonate salt. “VS-0” indicates that the prepolymer solutions contain VS salt whereas, as we show later, the VS does not polymerize into the network. Therefore, to emphasize the fact that both membranes do not contain any VS, we use “VS-0”.

2.3. Synthesis of Porous, Opaque Membrane PEGDMA-VS-0

The appropriate amount of dry VS was dissolved in anhydrous dimethyl sulfoxide (DMSO, Sigma Aldrich). The dissolution process was sped up through the use of a heat gun. The proper amount of PEGDMA (poly(ethylene glycol) dimethacrylate, 750 g/mol) was added to the VS-DMSO mixture and dissolved. After dissolving, the suitable amount of deionized water was added by micropipette to the solution to change the degree of VS dissolving. To this monomer solution, photoinitiator 2-hydroxy-4’-(2- hydroxyethoxy)-2-methyl propiophenone (Sigma-Aldrich) was added and dissolved. The monomer solution was sandwiched between two 1⁄4 in. thick borosilicate glass plates (McMaster Carr) separated by 200   μ m thick glass microscope slides (VWR), which were then placed in a UVC-515 Ultraviolet Multilinker 254 nm UV oven (Ultra-Lum, Carson, CA, USA). The plates were flipped every 2 min to ensure both sides of the solution received equal UV radiation. The monomer solutions were photo-crosslinked for a total of 45 min. The films were first rinsed with DMSO and deionized water. After washing the translucent films with deionized water, their appearance became opaque. The rest of the process was exactly the same as the T-PEGDMA-VS-0 preparation. The details of the synthesis protocol are described in Table 1. “O-PEGDMA-VS-0” is the abbreviation for “opaque-PEGDMA-VS-0”. “T and O” in T-PEGDMA-VS-0 and O-PEGDMA-VS-0 stand for “Transparent” and “Opaque” respectively. These abbreviations are used to indicate the difference between the chemically identical but visually different membranes.

2.4. Synthesis of Opaque and Condensed Membrane PEGDMA

The proper amount of PEGDMA (poly(ethylene glycol) dimethacrylate, 750 g/mol) was mixed with DMSO in a vial. The solution was stirred until PEGDMA was fully dissolved. After dissolving, a suitable amount of deionized water was added to the prepolymer solution. Photoinitiator (2-hydroxy-4’-(2- hydroxyethoxy)-2-methyl propiophenone) was added to the monomer solution and dissolved. The prepolymer solution was sandwiched between two 1⁄4 in. thick borosilicate glass plates (McMaster Carr) separated by 200 μ m thick glass microscope slides (VWR), which were then placed in a UVC-515 Ultraviolet Multilinker 254 nm UV oven. The glass plates were flipped over every 2 min to ensure both sides of the prepolymer solution receive equal radiation for 45 min. The films were first rinsed with DMSO and deionized water afterward. After washing the films with deionized water, the films turned from translucent to opaque in appearance. It was noted that the amount of water necessary to add to the monomer solution to produce the desired visual appeared was only determined as a range due to the changing humidity of the environment.
To prepare condensed homopolymer PEGDMA, a similar procedure was followed. The proper amount of PEGDMA (poly(ethylene glycol) dimethacrylate, 750 g/mol) was mixed with DMSO in a vial. The solution was stirred until PEGDMA was fully dissolved. A free-radical photoinitiator (2-hydroxy-4’-(2- hydroxyethoxy)-2-methyl propiophenone) was added to the monomer solution and dissolved. The same crosslinking procedure was applied. After rinsing the films with DMSO and deionized water, the films remained translucent.

2.5. Ion Exchange Process

Lithiation of the sulfonated O-PEGDMA-VS-0 and T-PEGDMA-VS-0 polymers was attempted by placing the polymer in a glass petri dish and soaking it in 0.5 M lithium chloride (LiCl) in a deionized water solution for 2 days. Every 24 h, the solution was changed. After 2 days, the polymer was washed with pure deionized water and soaked in deionized water for another 2 days. Alternatively, 2 M lithium hydroxide (LiOH) and 1 M lithium bis(trifluoromethanesulfonyl)imide (LiTFSI) (1,3-dioxolane-1,2-dimethoxyethane (DOL-DME 1:1 v%) were used as ion-exchange solutions with the same procedure. Lithium content following ion exchange was measured by Inductively Coupled Plasma-Optical Emission Spectroscopy (ICP-OES) at the Notre Dame Center for Environmental Science and Technology (CEST).

2.6. Solvent and Salt Drying

The electrolyte salts and the following solvents, 1,3-dioxolane (DOL, anhydrous), 1,2-dimethoxyethane (DME, anhydrous), ethylene carbonate (EC,) and diethyl carbonate (DEC), used in electrolyte preparation, conductivity, transference number measurements, and coin cells, were obtained from Sigma Aldrich and stored over 3 Å molecular sieves for at least 4 days to ensure low moisture content.

2.7. Electrolyte Preparation

The first electrolyte, 1 M lithium bis(trifluoromethanesulfonyl)imide (LiTFSI) in DOL (1,3-dioxolane, anhydrous) and DME (1,2-dimethoxyethane, anhydrous) mixture (1:1 volume%) was prepared. In an argon-filled glovebox, LiTFSI salt was dried under vacuum at 120 °C for 12 h. LiTFSI was added to the DOL-DME mixture and dissolved to reach the desired concentration. The electrolyte was kept and used in an argon-filled glovebox.
The second electrolyte, 1 M lithium hexafluorophosphate (LiPF6) EC-DEC (50:50 volume%), was purchased from Sigma Aldrich and used as received.

2.8. Electrolyte Uptake Test

Uniform 1⁄2 in. diameter samples of polymer films were cut from a larger piece of dry membrane using a hole punch in the dry state. Before the membranes were swelled in electrolyte, each sample was weighed and the dimensions (thickness and diameter) were measured with a micrometer (Mitutoyo, Aurora, IL, USA, No. 293-349-30). It was found previously that for similar polymer samples which swelled in solvents, equilibrium was reached in 4 h [18]. Each of the samples was placed in a vial and parafilm was used to prevent the uptake of moisture. The polymers were submerged in the electrolyte for 24 h. The excess electrolyte was removed from the polymer surface with a Kimwipe tissue, and the dimensions (diameter, thickness) and mass after swelling were measured.

2.9. Elemental Analysis

Inductively Coupled Plasma–Optical Emission Spectroscopy (ICP-OES) was used to analyze the cation concentration in polymer films. A Perkin Elmer Optima 800 ICP-OES (Waltham, WA, USA) was used for the measurements. A similar approach was followed as reported in our group’s previous study [18]. Prior to the experiment, volumetric pipets and volumetric flasks used in this process were washed with 5% nitric acid (HNO3) and rinsed with deionized water three times. Lithium standards for ICP-OES calibration were prepared in the range of 0.16 ppm, 0.4 ppm, 0.8 ppm, 1.6 ppm, and 2 ppm. Polymer samples were digested in concentrated (70%) HNO3 by refluxing for a minimum of 16 h at 250 °C and then were diluted to 100 mL. An objective of 1 ppm concentration of cation was targeted for each sample. The calculated and measured values were compared.

2.10. Cathode Preparation—LiFePO4

LiFePO4 powder (MTI Corporation, Richmond, CA, USA) was mixed with Carbon Black (MTI Batch No. 0011512) and polyethylene oxide (PEO, 100 kg/mol, Sigma Aldrich, Milwaukee, WI, USA) with a mass ratio of 60:20:20. Then, acetonitrile (CH3CN) was added to the mixture and stirred overnight. The cathode slurry was coated on aluminum foil with a doctor blade to a thickness of 200 micrometers. The cathode sheet was transferred to the glovebox and dried at 90 °C under a high vacuum for 12 h to remove any residual CH3CN and water. After the drying process, the prepared cathode sheet was punched with a 3/8 in. diameter hole punch into circular pieces to be used for coin cells. The mass loading of LiFePO4 was 0.90 mg cm−2. The total mass loading of the cathode was 1.49 mg cm−2.

2.11. Conductivity Measurement

Uniform 1⁄2 in. diameter samples of polymer films were cut from a larger piece of dry membrane using a hole punch in the dry state. Each polymer piece was swelled in either 1 M LiTFSI (DOL-DME 1:1 v%), 1 M LiFF6 (EC-DEC 50:50 v%) electrolyte, DOL-DME (1:1 v%) solvent mixture, or EC-DEC (1:1 v%) solvent mixture at least 4 h prior to the conductivity measurement. The polymer membranes were taken out from the electrolyte and the excess amount of liquid was removed with a Kimwipe tissue before measurement of the thickness. After, the membranes were rinsed with electrolyte or solvent and sandwiched between brass electrodes within the glovebox, then the Novocontrol Turnkey Broadband Dielectric Spectrometer (Montabaur, Germany) was used to measure conductivity in intervals of 15 °C cover a temperature range of −20 °C to 85 °C from cold to hot. The σ DC  was extracted as the region over which a plateau in the σ AC vs. frequency is observed.

2.12. Fourier-Transform Infrared Spectroscopy (FTIR)

Dry opaque and transparent PEGDMA-VS-0 membranes were cut into disks with diameters of approximately 1⁄4 in. and put into the vials within the glovebox. The vials were sealed with parafilm to prevent contamination during transport and were removed from the glovebox for transport to the spectrometer. Each sample was removed from its vial and quickly screwed down under the Attenuated Total Reflection (ATR) crystal of the Jasco 6300 Fourier Transform Infrared (FTIR) spectrometer (Easton, MD, USA) that was used for analysis to avoid water uptake from the atmosphere. Each membrane sample was scanned 25 times per measurement over a range of wavenumbers from 650 cm−1 to 3500 cm−1.

2.13. Scanning Electron Microscope (SEM)

Transparent and opaque PEGDMA-VS-0 membranes were cut from a larger piece of dry membrane in 1⁄2 in. diameter disks and put into vials within the glovebox. The vials were sealed with parafilm to prevent contamination during transport to the instrument. Prior to imaging, samples were sputter-coated with 2 nm of iridium to help prevent charging. A Magellan 400 Scanning Electron Microscope (SEM) (FEI, Hillsboro, OR, USA) was used for surface characterization of the membranes. SEM micrographs were obtained using a current of 13 pA and an accelerating voltage of 5 kV with a working distance of 5 mm.

2.14. Lithium Symmetric Cells—Electrochemical Impedance Spectroscopy

In the glovebox, lithium metal (Alfa Aesar, Tewksbury, MA, USA, 0.75 mm thick, 99.9%) was polished to remove the oxide layer. Two 3/8 in. diameter lithium pieces were punched from the polished lithium metal. Beforehand, 1⁄2 in. diameter size GPEs were swelled in electrolyte until reaching equilibrium. Within 2032 type coin cells (MTI Corp., Richmond, CA, USA), lithium metal was wetted with 20 microliters of electrolyte to increase the contact between the metal and the GPE. The swelled GPE was placed between two lithium metal pieces in contact with both polished sides. Two stainless steel spacers (15.5 mm diameter × 0.2 mm thick) and one wave spring were used, and the coin cell was sealed with an electronic crimper. An Ametek Princeton Applied Research Parstat MC (Berwyn, PA, USA) was used for the impedance spectroscopy and transference number ( t Li + ) measurements.

2.15. Li/LiFePO4 Cells—Galvanostatic Cycling

In the glovebox, lithium metal (Alfa Aesar, 0.75 mm thick, 99.9%) was polished to remove the oxide layer. One 3/8 in. diameter lithium piece was punched from the polished lithium metal. With the same diameter punch, one piece of LiFePO4 (thickness of 40–50 micrometer) was punched from the dried cathode sheet. A 1⁄2 in. diameter size of polymer membrane was swelled in electrolyte until it reached equilibrium. Inside 2032 type coin cells (MTI Corp), the LiFePO4 cathode was wetted with 20 microliters of electrolytes to increase the contact with the gel polymer electrolyte (GPE). Before placing the lithium metal, an additional 10 microliter electrolyte was added to the GPE. Two stainless steel spacers (15.5 mm diameter × 0.2 mm thick) and one wave spring were used, and the coin cell was sealed with an electronic crimper. A Neware Battery Systems Battery Tester (Shenzhen, China) was used for galvanostatic cycling.

3. Results and Discussion

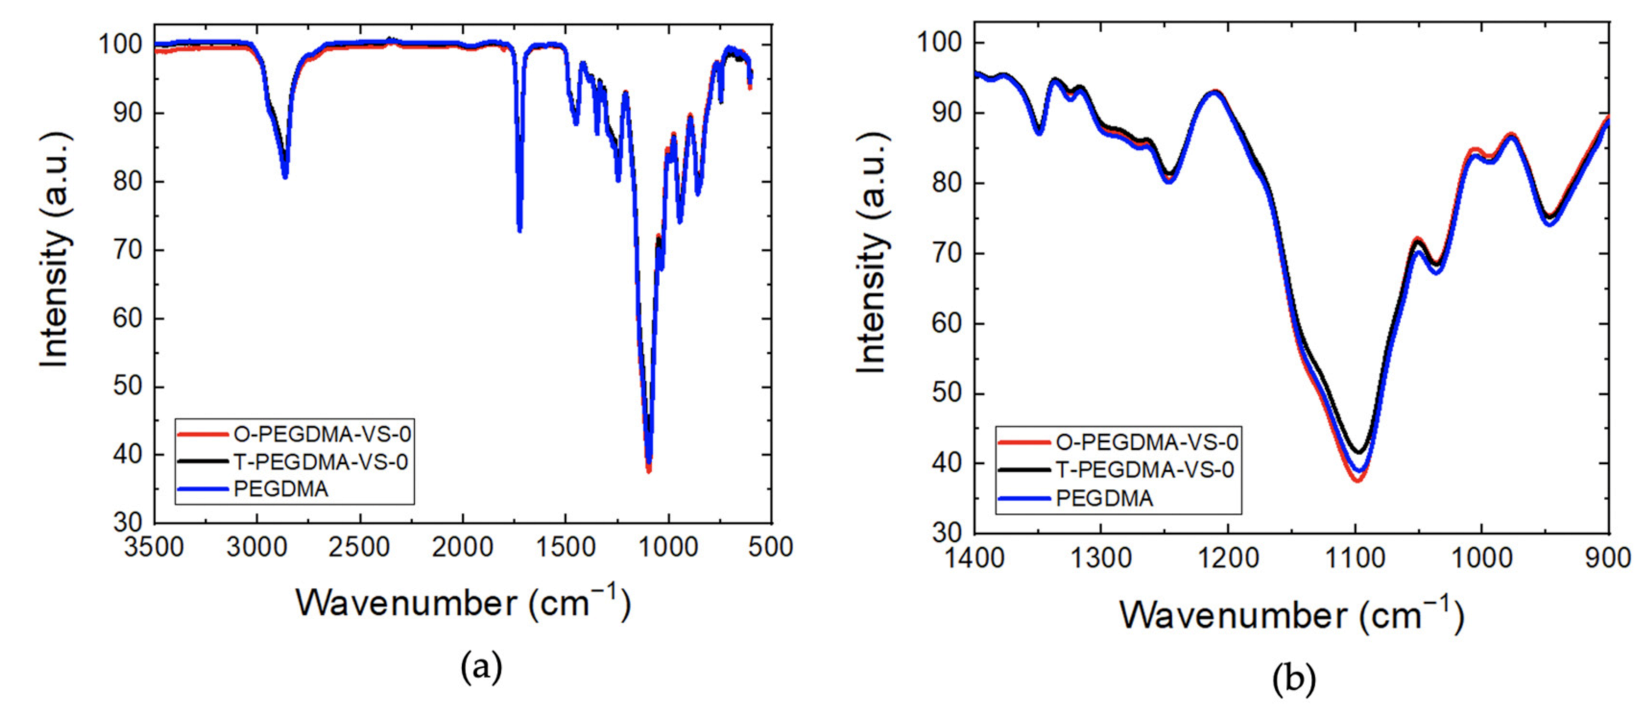
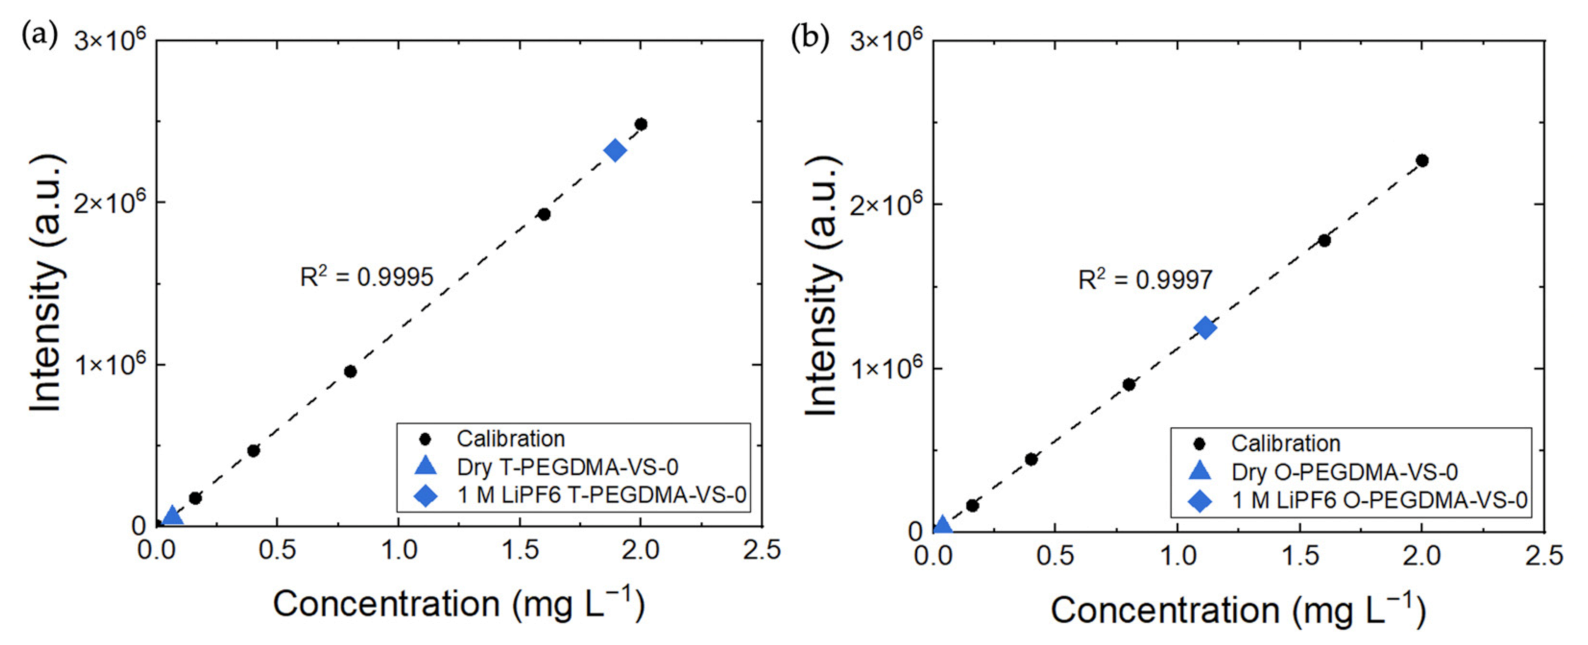
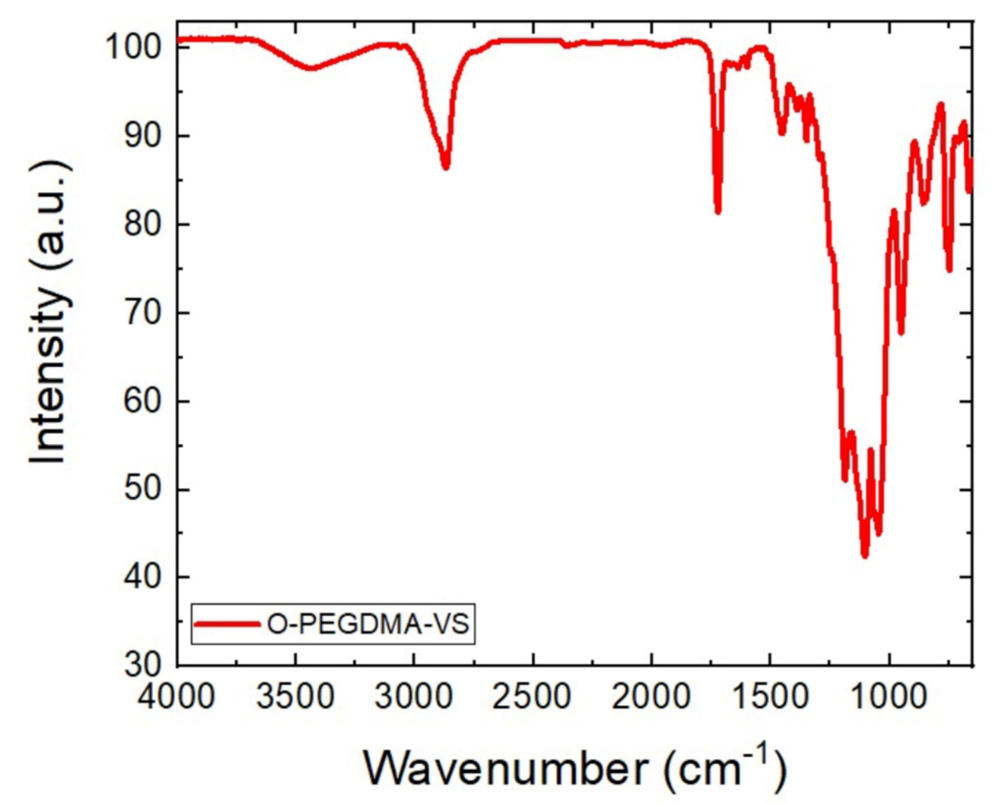
3.1. FTIR (Fourier Transform Infrared Spectroscopy) and ICP-OES (Inductively Coupled Plasma-Optical Emission Spectroscopy) Analysis

FTIR measurements were performed to identify the extent of crosslinking of PEGDMA and the incorporation of sulfonate groups through vinyl sulfonate (VS). Figure 1a compares the FTIR spectra of the T-PEGDMA-VS-0, O-PEGDMA-VS-0, and opaque homopolymer PEGDMA membranes in which the three membranes are chemically identical to each other. The major peaks in the FTIR spectra of the three films are essentially identical and may be attributed to specific functional groups as follows. The three crosslinked membranes show a peak at 1725 cm−1 which is due to C=O in the polymerized methacrylate group. For the PEGDMA monomer, the C=O peak is expected to be at 1716 cm−1. The shifting of this peak to 1725 cm−1 and no residual peak remaining at 1716 cm−1 is due to the successful crosslinking with the UV process and no remaining monomers following the washing process. The peaks at 1102 cm−1 and 1246 cm−1 are attributed to C-O in the PEG chains. The peak at 1450 cm−1 is from stretching of the C–H bond of the methyl groups. Finally, the broad peak between 2800 cm−1 and 3000 cm−1 is assigned to C-H stretching of alkene groups. The expected sulfonate peak to confirm the VS presence in the PEGDMA-VS network is at 1175 cm−1 [11]. However, Figure 1b clearly shows that there is no sulfonate stretch in the expected range. Thus, we can say that the VS does not polymerize into the network. In light of the reported results from the Archer group using similar monomer solutions where the sulfonate is clearly incorporated into the network [11], it is a very surprising outcome.
In addition to FTIR measurements, an inductively coupled plasma atomic emission spectroscopy (ICP-OES) experiment was performed to identify the number of charges present in the membranes both after the ionic exchange process and swelling in electrolyte. The detailed results of the experiments are presented in Appendix A, Figure A1. In the dry state (after the ionic exchange procedure with different solutions) for both O-PEGDMA-VS-0 and T-PEGDMA-VS-0, negligible Li+ cations were detected (Table A1 and Table A2). Only Li+ cations are present in the polymer network after swelling in 1 M LiPF6 (EC-DEC) electrolyte (Table A3). Consequently, FTIR and ICP-OES measurements are in agreement that in neither opaque nor transparent membranes does the vinyl sulfonate (VS) covalently anchor to the polymer network. By taking into consideration that the membranes are chemically identical and lacking sulfonate, in this particular membrane synthesis VS can be referred to as a structure-directing agent or porogen.
We altered the polymerization procedure to further test the effects on the propensity of VS incorporation into the networks, and the detailed discussion concerning these additional experiments can be found in Appendix B. No changes to the polymerization method resulted in the incorporation of VS into the polymer network.

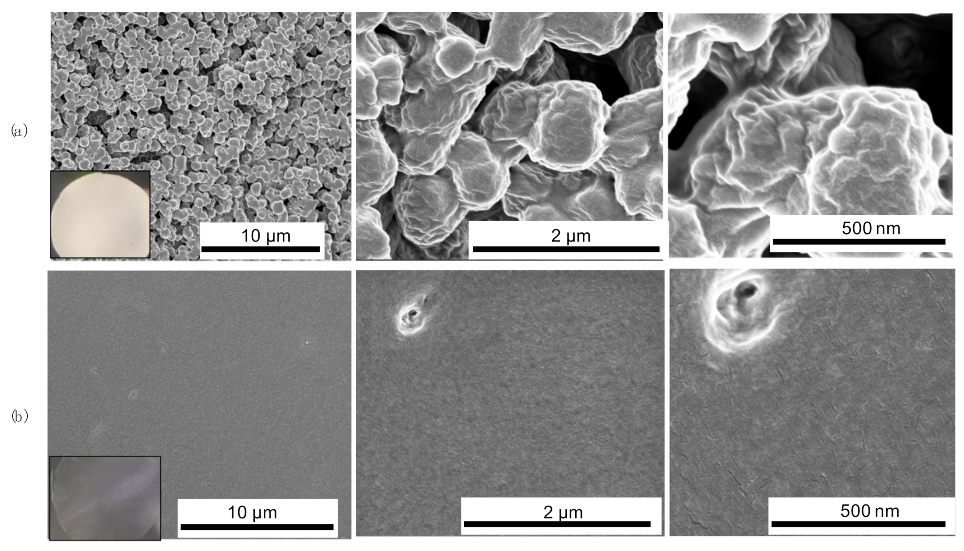
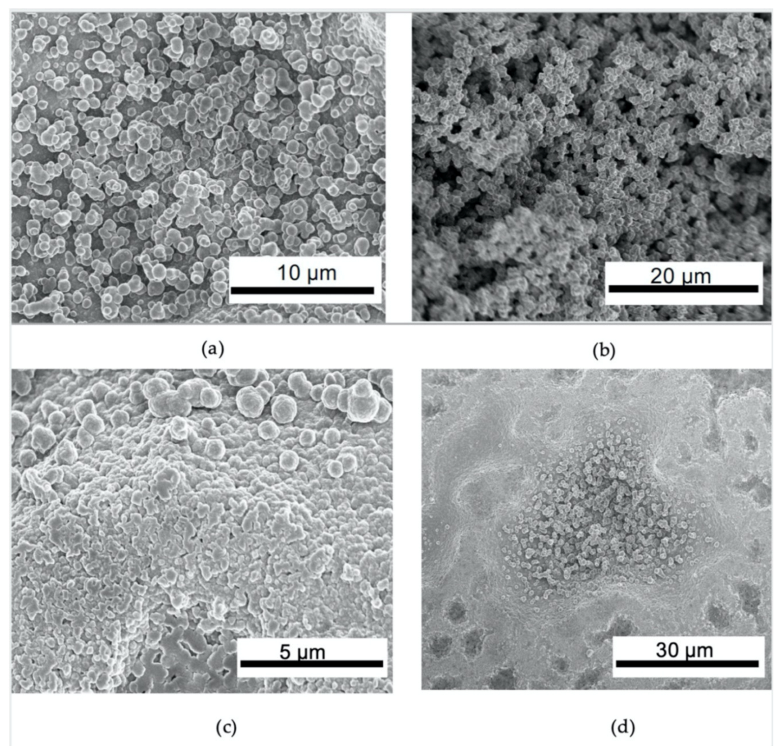
3.2. Structure Analysis of O-PEGDMA-VS-0 and T-PEGDMA-VS-0

Scanning Electron Microscopy (SEM) imaging was utilized to examine the structure of the opaque and transparent PEGDMA-VS-0 membranes at three different magnification scales. The opaque membrane has a uniform microporous structure as shown in Figure 2a, while in contrast, T-PEGDMA-VS-0 is a condensed membrane as shown in Figure 2b, despite also having VS in pre-polymer solution.
It is hypothesized that the microporous structure forms due to phase segregation in the prepolymer solution [15,16]. We find that a similar porous structure can be formed by solely using PEGDMA, DMSO, and the right amount of water without any VS in the pre-polymer solution (Figure A3). However, the microporous structure is not as uniform as O-PEGDMA-VS-0, and the phase window for producing the porous structure with regard to water content is narrower than when VS is in the prepolymer solution. Thus, having VS in the prepolymer solution helps to create a wider composition window for the monomer solution to result in a uniformly porous film. We hypothesize that in the prepolymer solution, the acrylate end groups separate from the main chain and there is water in the DMSO emulsion, where likely the PEG main chain is in the water phase and the acrylate group is at the water/DMSO interface. With the addition of VS to the solution, it is likely that the vinyl group is in the DMSO phase and the sulfonate is in the water phase, with the VS monomer acting as an effective emulsion stabilizer. These micelle-like structures form in the prepolymer solution and are then made permanent during polymerization.
Evidently, the polymerization continues after the initial polymer microsphere formation as the individual particles partly fuse. The correct amount of water added to the prepolymer solution results in a porous polymer. Without any additional water in the pre-polymer solution, the condensed films are formed. The presence of VS helps to form a much more uniform, porous structure even though VS does not polymerize in the network.
Archer’s group displayed a similar microporous structure with an opaque membrane PEGDMA-VS in which VS polymerized into the network [11]. In Archer’s group study, in the prepolymer solution, there was no extra water added. However, in their study, the VS salt was dried directly from the commercially obtained aqueous solution in a vacuum oven. Thus, we hypothesized that the drying procedure impacted the amount of residual water carried with VS into the prepolymer solution, which then impacted the polymer morphology. In our lab, we compared the residual water content of VS salt isolated via the two different methods by Karl Fisher titration measurements: the VS salt dried via direct vacuum had 155 ppm water while VS which was precipitated with organic solvent had 129.3 ppm water. Thus, the dried salt obtained by direct vacuum used in Archer’s group study likely contained enough water to directly produce a microporous structure. In contrast, when the salt is obtained via precipitation with ethanol then drying under a high vacuum, as per our procedure, the residual water content with the salt is low enough to avoid the opaque porous polymer without the addition of water to the prepolymer solution.

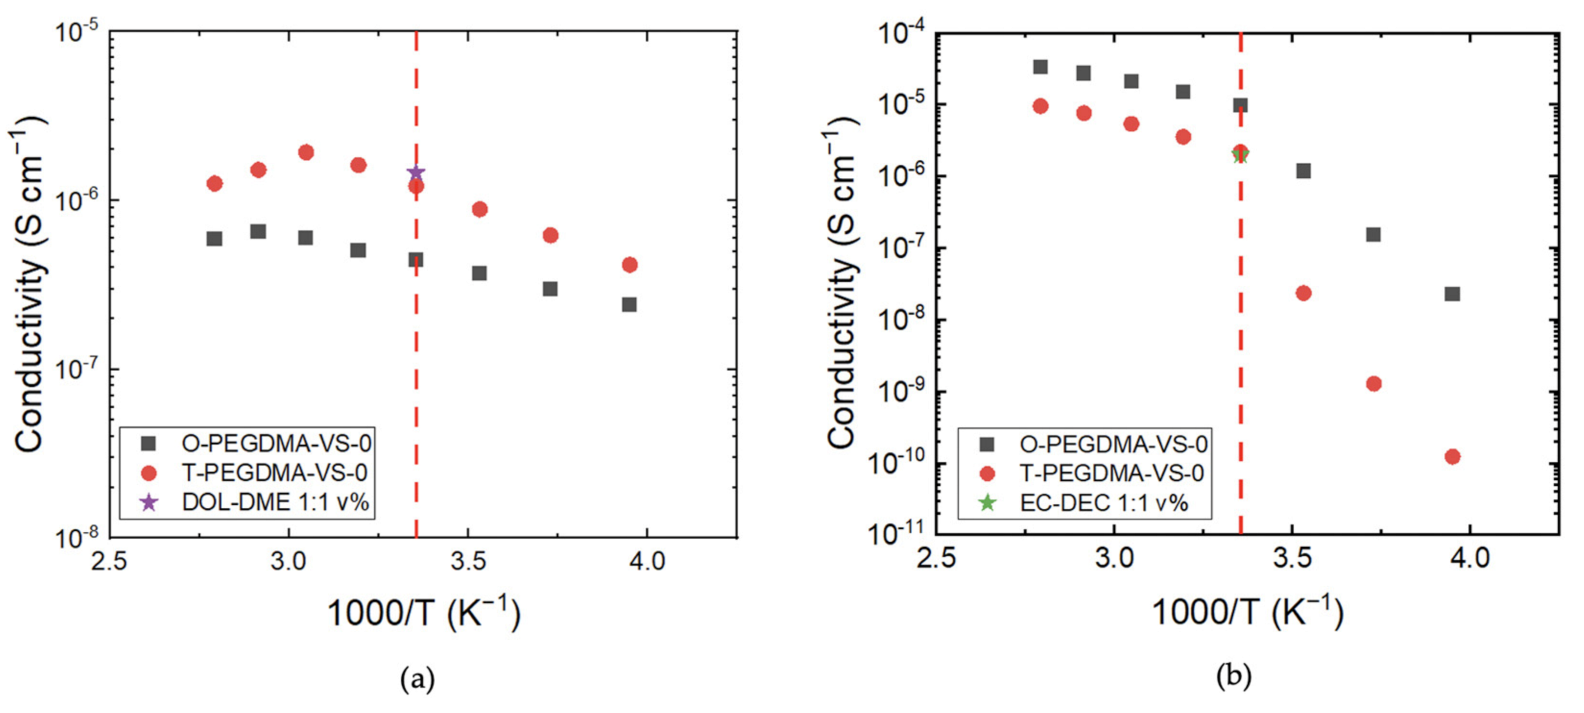
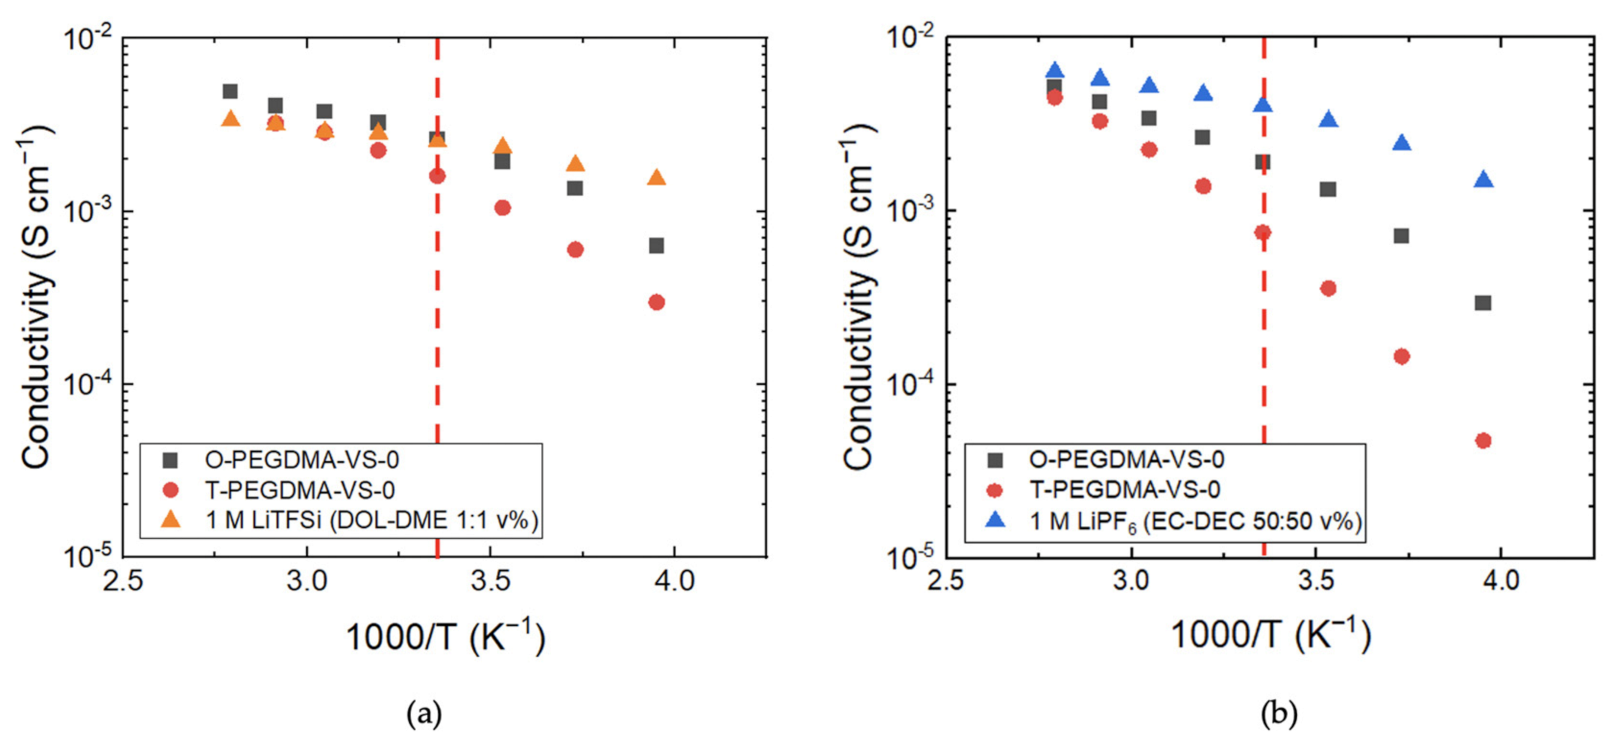
3.3. Conductivity Comparison of O-PEGDMA-VS-0 and T-PEGDMA-VS-0

Conductivities of O-PEGDMA-VS-0 and T-PEGDMA-VS-0 in the gel state when swollen in DOL-DME (1:1 v%) and EC-DEC (1:1 v%) solvents are presented in Figure 3. The conductivities of transparent and opaque PEGDMA-VS-0 films in 1 M LiTFSI (DOL-DME (1:1 v%) and 1 M LiPF6 (EC-DEC 50:50 v%) are presented in Figure 4, respectively.
The ionic conductivities of O-PEGDMA-VS-0 and T-PEGDMA-VS-0 in DOL-DME (1:1 v%) solvent are 4.4 × 10 7   S cm−1 and 1.2 × 10 6   S cm−1 at 25 °C, respectively, as shown in Figure 3a. In EC-DEC solvent, the opaque membrane and transparent PEGDMA-VS-0 exhibit 9.7 × 10 6   S cm−1  2.2 × 10 6   S cm−1 ionic conductivity, respectively. These conductivity values are in the same order of magnitude of the solvent mixtures’ ionic conductivity at room temperature (DOL-DME 1.5 × 10 6   S cm−1; EC-DEC 2 × 10 6   S cm−1). The ionic conductivity in the solvents is due to ionic impurities introduced in the synthesis/manufacturing and/or drying over molecular sieves. This measurement is therefore another indication that there are negligible ionic monomers covalently incorporated into the polymer network.
Figure 4a,b depict the conductivity comparison of opaque and transparent PEGDMA-VS-0 swollen in 1 M LiTFSI (DOL-DME 1:1 v%) and 1 M LiPF6 (EC-DEC 50:50 v%). As shown in Figure 4a, at 25 °C, the opaque PEGDMA-VS-0 and transparent PEGDMA-VS-0 films swollen in 1 M LiTFSI (DOL-DME) exhibit ionic conductivities of 2.6 × 10 3   S cm−1 and 1.6 × 10 3   S cm−1, respectively. When 1 M LiPF6 (EC-DEC) electrolyte is confined in both polymer networks, opaque PEGDMA-VS-0 shows 1.9 × 10 3   S cm−1 at room temperature, and T-PEGDMA-VS-0 displays 7.6 × 10 4   S cm−1 ionic conductivity. These conductivity values are orders of magnitude higher than the conductivities observed when the membranes are swelled in solvents alone. Upon the formation of the PEGDMA-based gel polymer electrolytes with either ether or organic carbonate-based liquid electrolytes, the porous O-PEGDMA-VS-0 always results in higher ionic conductivity and reduced activation energy for ionic conduction compared to condensed T-PEGDMA-VS-0. The microporous structure of O-PEGDMA-VS-0 allows the Li+ ions to transport more similar to the pure liquid electrolyte, which results in high ionic conductivity.
It is also noted that both of the gel polymer electrolytes have a higher lithium concentration than 1 M, as determined via elemental analysis and shown in Table A3. This means that upon swelling, the crosslinked polymer networks preferentially uptake the salt over the solvent mixture. The gravimetric and volumetric swelling data is shown in Table A4. Interestingly, the porous membrane exhibits higher gravimetric and volumetric swelling as well as relatively higher lithium uptake from 1 M LiPF6 (EC-DEC) electrolyte than the condensed membrane. Organic electrolytes with lithium concentrations substantially higher than 1 M are expected to have reduced ionic conductivity due to the enhanced electrostatic interactions that slow mobility.

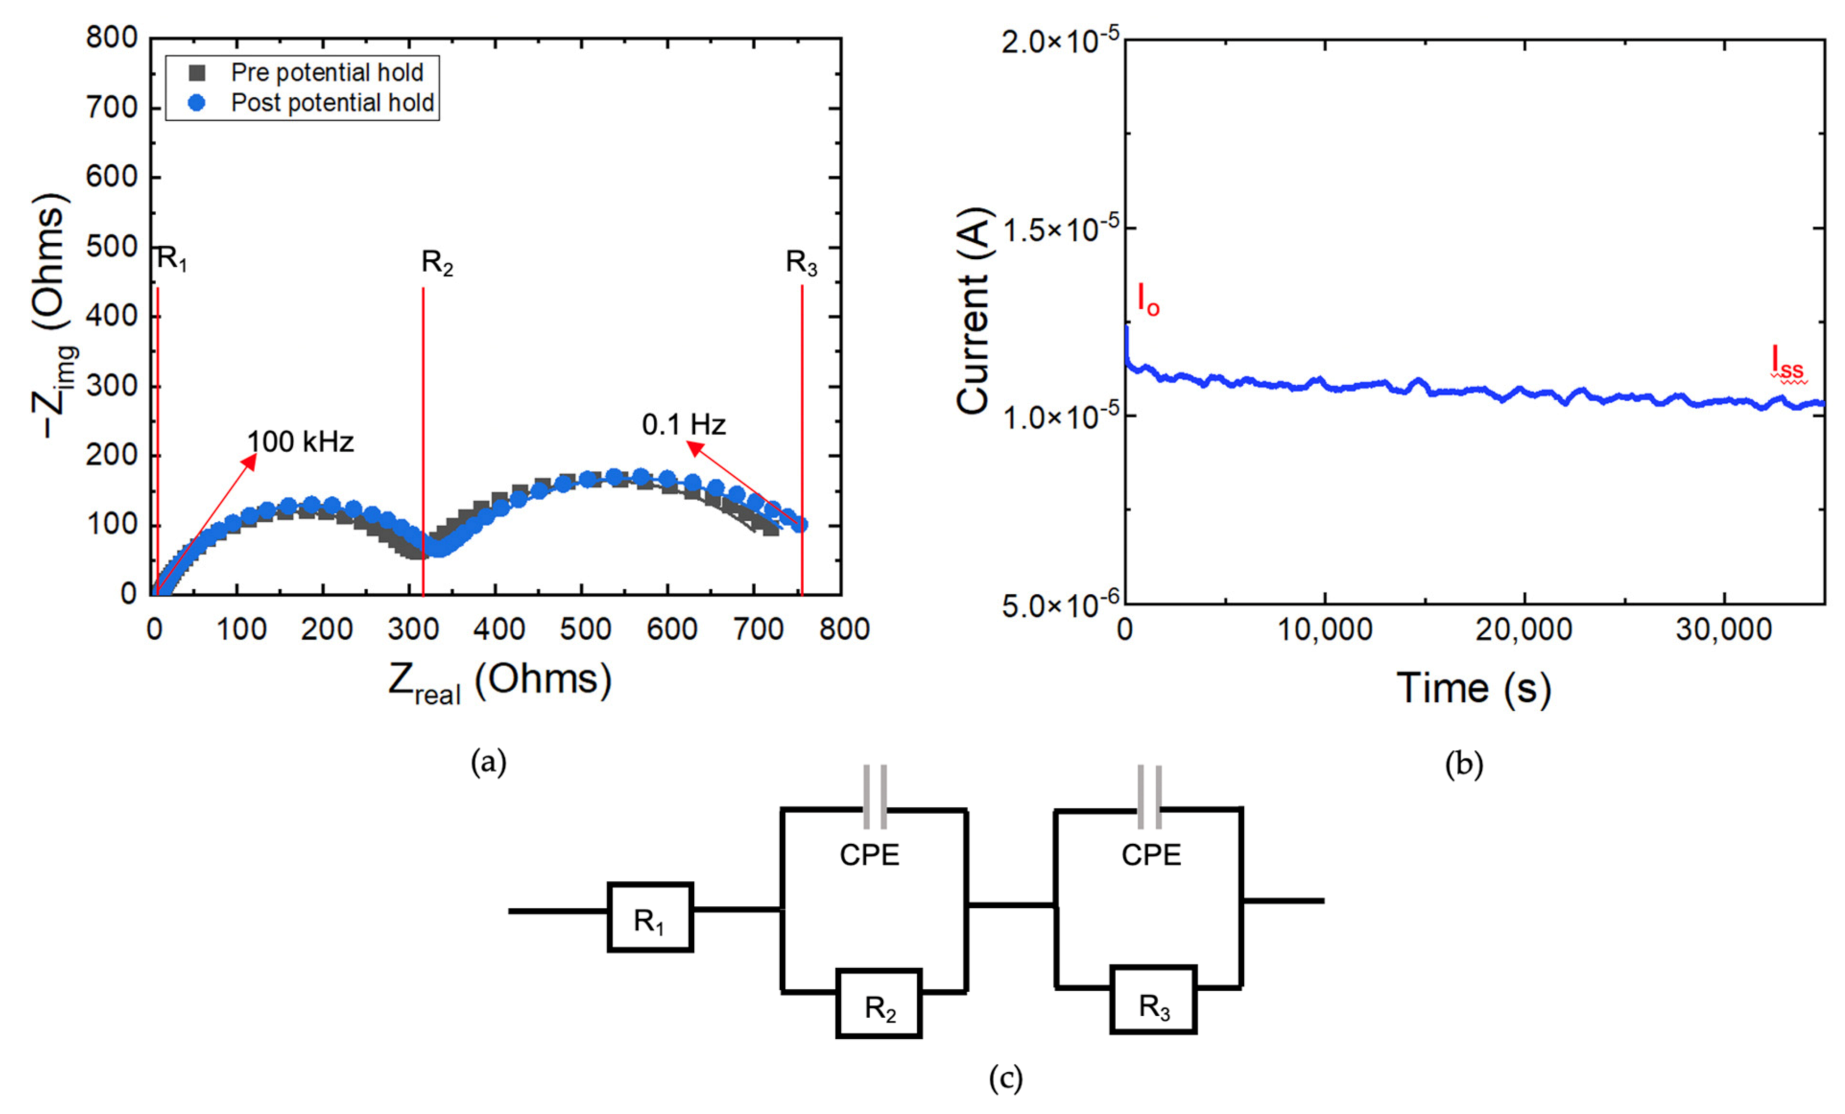
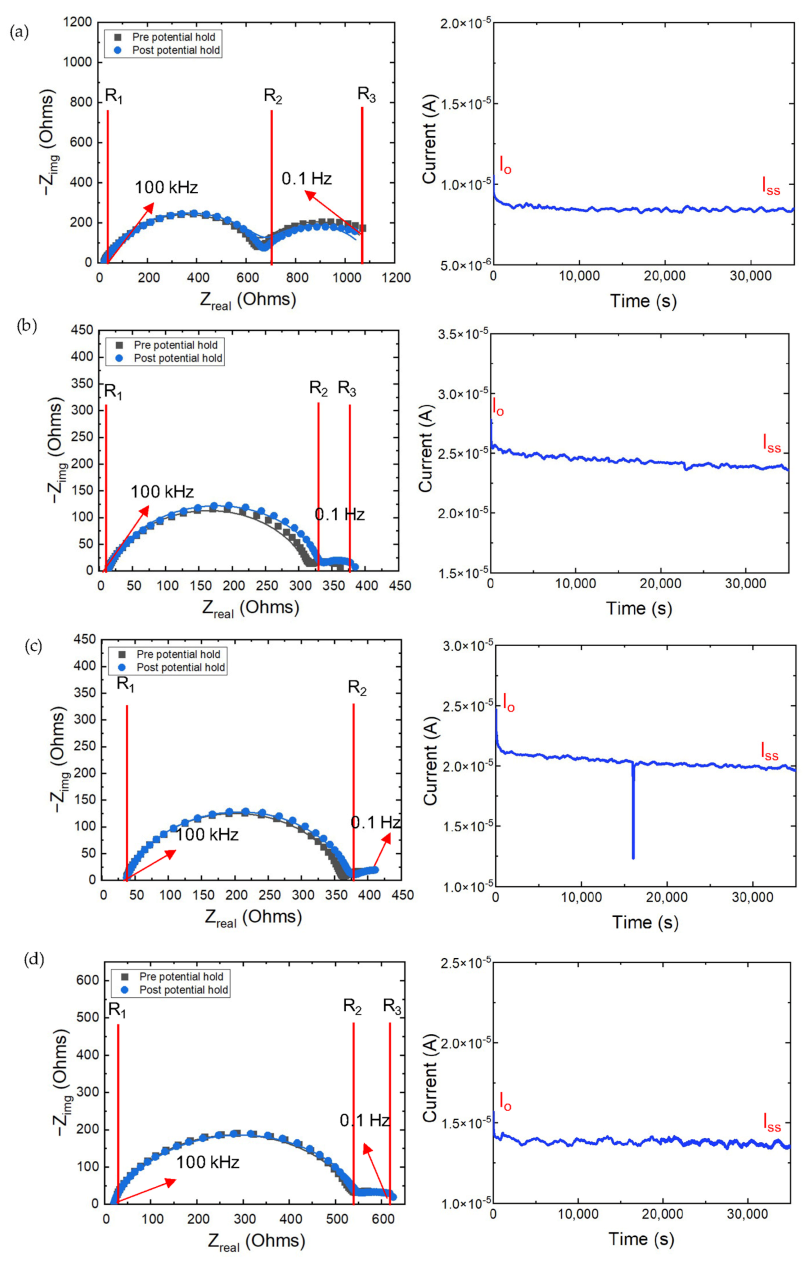
3.4. Electrochemical Impedance Spectroscopy—Transference Number Measurements

To measure the t Li + , opaque and transparent PEGDMA-VS-0 membranes swollen in 1 M LiPF6 (EC-DEC) were used as the electrolytes in symmetric lithium metal cells. t Li + is estimated by the conventional Bruce-Vincent method [19]:
t + = I ss Δ V I 0 R 0 I 0 Δ V I ss R ss
where ΔV is the potential applied across the cell, Ro and Rss are the initial and steady-state resistances of the passivating layers as measured by impedance spectroscopy, and Io and Iss are the initial and steady-state currents during the polarization, respectively.
Figure 5 shows the impedance before and after polarization and the current profile during the polarization with O-PEGDMA-VS-0 swollen in 1 M LiPF6 (EC-DEC). The estimated t Li + is 0.78, based on measurements on three different coin cells. This value implies that ion conduction is mostly via Li+ despite the presence of mobile anions; the Li+ are preferentially transported relative to the anions through the swelled porous gels. For a polymer swollen in dual electrolyte systems, it is typically expected that t Li + is less than 0.5 due to the presence of the free anions unless the polymer influences the ion transport processes [8,20,21].
The membrane before it is swollen in electrolyte is microporous, and pores of micron scale are not anticipated to influence ion transport. We hypothesize that once the opaque film is swelled, the channels reduce to nanoscale diameter on the order of the Debye length. This results in a diffuse electrolyte double layer at the electrolyte–polymer interface in which the anions may be rejected due to partial dipoles at the interface [22,23]. Due to the large volume expansion of O-PEGDMA-VS-0 swollen in 1 M LiPF6 (EC-DEC) (Table A4), it can be assumed that the pore size shrinks in the presence of electrolyte [22]. To determine exactly the size of the nanopores upon electrolyte swelling, more structural experiments are needed. We found that sufficient contrast was not available to achieve the relevant structural information via small-angle X-ray scattering, and for future efforts, small-angle neutron scattering may be targeted.
Table A5 summarizes the resistance and current values extracted from the polarization and impedance experiments that are used in Equation (1) to estimate t Li + of transparent and opaque PEGDMA-VS-0 in different electrolytes. R1 is assigned as the bulk resistance through the gel polymer electrolyte swollen in electrolyte. The resistance is low in comparison to some of the other gel polymer electrolytes (on the order of 10 ohms) due to the high lithium-ion conductivity on the order of 10 3   S cm−1 of this electrolyte. R2 is assigned as the charge-transfer resistance, which increases after the potential hold as a result of decomposition on the lithium metal. As clearly seen on the Nyquist plots, there is another resistance (R3) that occurs at lower polarization frequency. This behavior was observed previously with a single-ion-conducting gel polymer electrolyte with magnesium-symmetric cells [18]. If the electrolyte thickness is infinite as in pure liquid electrolyte, observation of the classical 45° Warburg diffusion is expected. However, when the diffusion layer is not “infinite” i.e., is bounded, then R3 resistance is observed, especially if the frequency is low enough. We would like to highlight that if the polarization frequency is not low enough, the R3 bounded resistance can look similar to 45° finite-length Warburg. Hypothetically, this behavior can occur due to a small layer that likely exists between the lithium metal and the gel polymer electrolyte, a product of a reaction between the lithium metal and the gel polymer electrolyte which is an effective solid electrolyte interface (SEI). The exact identification of the R3 resistance and investigation of SEI are out of the scope of this study and are part of ongoing work. In the calculations, R1 and R2 are taken into consideration.
In order to compare the difference between O-PEGDMA-VS-0 and T-PEGDMA-VS-0 under the same conditions, the transference number of T-PEGDMA-VS-0 swollen in 1 M LiPF6 (EC-DEC) was measured. Based on Equation (1), the transference number is acquired as 0.65. Due to its condensed structure, the transference number is lower than O-PEGDMA-VS-0. Li+ cations must diffuse in the polymer phase in order to transport through the membrane, which decreases the mobility of Li+. Still, the transference number of 0.65 is significantly higher than the value of 0.47 that we measured for 1 M LiPF6 in EC-DEC confined to a Celgard separator (Figure A2). The mechanism by which the condensed membrane improves the transference number is not yet understood.
In addition to a carbonate-based electrolyte, a transference number measurements were conducted by confining 1 M LiTFSI (DOL-DME) in opaque and transparent PEGDMA-VS-0. As shown in Table 2, carbonate-based electrolyte confined in the PEGDMA-VS-0 network is more favorable for Li+ transport relative to the ethereal electrolyte. The main reasons behind this are not understood fully yet. However, it could be due to the differences in pore size or pore wall interaction in different electrolytes. The pore size might be affected by the swelling of different solvents. The better coordination of Li+ with EC-DEC might push the PF 6 into the secondary coordination shell or even fully separated ion pairing. In the DOL-DME case, there might be more Li+ coordinated with TFSI solvent-separated ion pairs which can decrease the t Li + . In both cases, O-PEGDMA-VS-0 displays higher t Li + , which shows that the microporous structure is the paramount factor for enhanced transport properties.
It is also noted that these results differ from the Archer’s group’s study where the transference number of 1 M LiTFSI (DOL-DME) electrolyte confined in PEGDMA-VS, in which the sulfonate groups were tethered in the polymer network, was calculated as 0.98 [11]. In our study, without the strong electrostatic influence of covalently bonded sulfonate groups in the polymer, the t Li + is remarkably lower in the ethereal electrolyte.

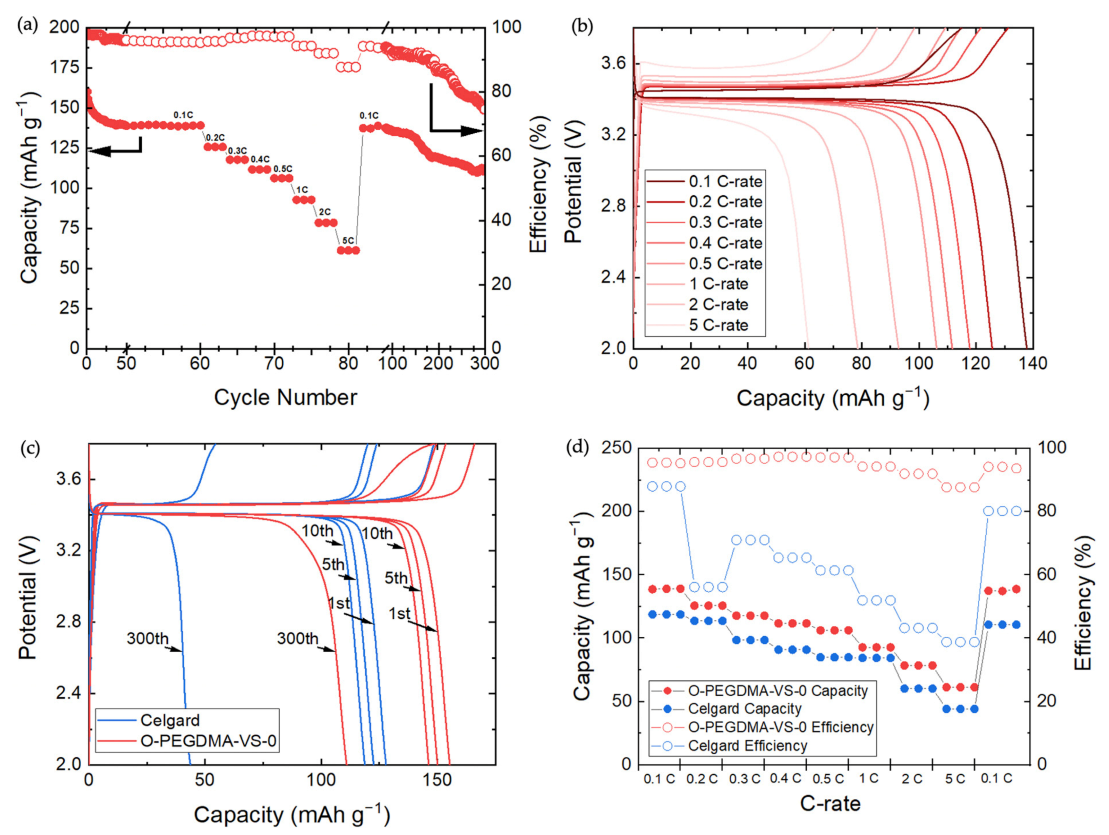
3.5. Li/LiFePO4 Cycling Performance

To investigate the influence of the transport properties of the porous electrolyte membrane on Li-ion battery cycling, a comparison was made with a conventional battery configuration. However, due to the thickness difference between the Celgard separator and opaque membrane (190 µm thick when it is swollen in 1 M LiPF6 in EC-DEC electrolyte), four Celgard films were used in the control Li/LiFePO4 cell (total 100 μ m thickness). Figure 6 summarizes the charge/discharge cycling results. The first discharge capacity with the opaque membrane is 154.1 mAh g−1 at 0.1 C-rate (0.015 mA cm−2), whereas Celgard results in around 130 mAh g−1 despite the smaller interelectrode distance and lower electrolyte total and ionic conductivity. These cells completed 300 full cycles including the C-rate test. At the three-hundredth cycle, the opaque membrane has a capacity of 111.1 mAh g−1 at 0.1 C-rate while the conventional cell’s capacity is 47.1 mAh g−1. The cell with O-PEGDMA-VS-0 swollen in 1 M LiPF6 (EC-DEC) was able to cycle at 5 C-rate with 63.1 mAh g−1 capacity, whereas the cell with the Celgard separator was able to deliver 52.1 mAh g−1 capacity. Despite the thickness of O-PEGDMA-VS-0, this outcome proves that the bulk electrolyte transference number has a strong impact on rate performance in Li-ion batteries.
Unfortunately, we were unable to directly investigate the structural and chemical effects by comparison of cycling of cells containing the T-PEGDMA-VS-0 and O-PEGDMA-VS-0 films. Cells prepared with the T-PEGDMA-VS-0 membranes were consistently short-circuited in the first few cycles due to Li dendrite growth. The fragile nature of the film allowed for crack formation upon dendrite nucleation. Discussion of this phenomenon is outside of the scope of this current investigation, and it is the subject of forthcoming studies.
It is also noted that carbonate-based liquid electrolytes are not electrochemically stable at lithium electrodeposition potentials, and therefore they are inappropriate for pairing with Li metal anodes in the absence of advanced anode protection and/or engineering [24,25]. Here, the half-cell configuration with the Li metal anode is used for simplicity. The lithium metal anode is known to be chemically reactive with the organic carbonate liquid electrolyte and we employed no anode coatings or surface–electrolyte-interface (SEI) formation additives, and thus Coulombic efficiencies that are much lower than in conventional Li-ion batteries are to be anticipated. However, it is also noted that the Li/LiFePO4 cell containing O-PEGDMA-VS-0 swollen in 1 M LiPF6 (EC-DEC) cycles with substantially higher Coulombic efficiency than the cell containing Celgard with 1 M LiPF6 (EC-DEC), as shown in Figure 6d. It may be that the higher transference number achieved with O-PEGDMA-VS-0 resulted in more uniform current distribution at the anode and thus higher efficiency Li plating and stripping [10].
Our results of enhanced rate capability due to an enhanced transference number across the interelectrode space are extendable to other battery configurations. It is also noted that integration of these effects within porous electrodes is a target for the improvement of cells with practical (thick) porous, active layers, and this will be the focus of our future work.

4. Conclusions

The impact of a microporous polymer host in gel polymer electrolytes containing organic liquid electrolyte was investigated with various polymer networks based on polymerized PEGDMA. We found that the polymer morphology is highly sensitive to the presence of vinyl sulfonate and the amount of water in the prepolymer solution. With regard to a unique microporous structure, the gel electrolyte composed of O-PEGDMA-VS-0 microporous polymer network in 1 M LiPF6 (EC-DEC) resulted in a lithium transference number of 0.78 while maintaining 1.9 × 10 3   S cm−1 ionic conductivity at 25 °C. Based on the high transference number results, we claim that the structurally rigid polymer swollen in liquid electrolyte must produce pores of similar length scale to the Debye screening length which allows Li+ to be preferentially transported relative to the counter-anions. The impact of enhanced transport properties on the cycling performance in the Li/LiFePO4 cell configuration is observed, in which the battery delivers 63.1 mAh g−1 capacity at 5 C-rate while less capacity is obtained with thinner, conventional separators. This work provides experimental evidence for the impact of polymer gel morphology on ion-transport properties and the impact of lithium transference number of rate capability of lithium-ion batteries.

Author Contributions

Conceptualization, B.B., H.O.F., and J.L.S.; methodology, B.B. and H.O.F.; validation, B.B. and H.O.F.; formal analysis, B.B.; investigation, B.B. and H.O.F.; data curation, B.B.; writing—original draft preparation, B.B.; writing—review and editing, B.B., H.O.F., A.S. and J.L.S.; visualization, B.B.; supervision, J.L.S.; project administration, J.L.S.; funding acquisition, A.S. and J.L.S. All authors have read and agreed to the published version of the manuscript.

Funding

The authors are appreciative of the funding for this work from the National Science Foundation via award number CBET-1706370 and Università degli Studi di Brescia, research grant “Models for gel electrolyte polymers” CUP: D79C20000560007. HOF gratefully acknowledges the following sources of additional financial support: The Society of Schmitt Fellows, the Notre Dame CEST Predoctoral Fellowship, and the Patrick and Jana Eilers Fellowship. B.B. also gratefully acknowledges financial support from the University of Notre Dame College of Engineering.

Data Availability Statement

Raw datasets are available from the corresponding author upon request.

Acknowledgments

The authors gratefully acknowledge the Notre Dame Materials Characterization Facility for FTIR measurements, the Notre Dame Integrated Imaging Facility for SEM measurements, and the Notre Dame Center for Environmental Science and Technology for ICP-OES measurements.

Conflicts of Interest

The authors declare no conflict of interest. The funders had no role in the design of the study; in the collection, analyses, or interpretation of data; in the writing of the manuscript; or in the decision to publish the results.

Appendix A

Figure A1. ICP-OES results, including calibration results, for (a) Dry T-PEGDMA-VS-0 crosslinked membrane (after ion exchange process with 0.5 M LiCl ionic exchange solution) and 1 M LiPF6 (EC-DEC 1:1 v%) swelled T-PEGDMA-VS-0 crosslinked membrane and (b) O-PEGDMA-VS-0 crosslinked membranes in 1 M LiPF6 (EC-DEC 1:1 v%) electrolyte-swelled and dry states.
Electronicmat 02 00013 g0a1
Table A1. Elemental analysis results of O-PEGDMA-VS-0 and T-PEGDMA-VS-0 after an ionic exchange in 0.5 M LiCl in water, as extracted from fits shown in Figure A1. The “Expected Li+ Concentration (mol mg−1)” is the Li+ concentration in the polymer sample that would result if all of the vinyl sulfonate monomers covalently attached into the polymer network and exchanged to the lithium form upon the ion-exchange step.
Sample NameExpected Li+ Concentration (mol mg−1)Measured Li+ Concentration (mol/mg) C L i + m e a s u r e d C L i + e x p e c t e d
T-PEGDMA-VS-0 2.2 × 10 6 8.1 × 10 8 4%
O-PEGDMA-VS-0 3.4 × 10 6 1.2 × 10 7 3%
In addition to 0.5 M LiCl in water solution, the ionic exchange process was repeated with 1 M LiTFSI (DOL-DME) electrolyte and 2 M LiOH in water solution. The same method was followed as explained previously in the Methods section. As shown in Table A3, only small amounts of Li+ were detected after the deionized water wash step.
Table A2. Elemental analysis results of O-PEGDMA-VS-0 in different ionic exchange solutions, 1 M LiTFSI (DOL-DME 1:1 v%) and 2 M LiOH in water. The “Expected Li+ Concentration (mol mg−1)” is the Li+ concentration in the polymer sample that would result if all of the vinyl sulfonate monomers covalently attached into the polymer network and exchanged to the lithium form upon the ion-exchange step.
Sample NameExpected Li+ Concentration (mol mg−1)Measured Li+ Concentration (mol mg−1) C L i + m e a s u r e d C L i + e s t i m a t e d
O-PEGDMA-VS-0 in 1 M LiTFSI (DOL-DME) 2.2 × 10 6 1.7 × 10 7 8%
O-PEGDMA-VS-0 in 2 M LiOH 2.2 × 10 6 7.4 × 10 8 3%
Table A3. Elemental analysis results of O-PEGDMA-VS-0 and T-PEGDMA-VS-0 after swelling in 1 M LiPF6 (EC-DEC 1:1 v%).
Sample NameMeasured Li+ Concentration (mol mg−1) C L i + m e a s u r e d C L i + 1   M   L i P F 6   E C D E C
T-PEGDMA-VS-0 in 1 M LiPF6 (EC-DEC) 2.1 × 10 6 265%
O-PEGDMA-VS-0 in 1 M LiPF6 (EC-DEC) 4.2 × 10 6 531%
Table A4. O-PEGDMA-VS-0 and T-PEGDMA-VS-0 swollen in 1 M LiPF6 (EC-DEC 1:1%) uptake data, by mass and volume, after 4 h of swelling. The volume change was calculated by measuring the change in both thickness and diameter. The error represents the standard deviation of three measurements.
Sample NameMass Increase %Volume Increase %
O-PEGDMA-VS-0329 ±   33 166 ±   8
T-PEGDMA-VS-0245 ±   21 155 ±   9
Table A5. Extracted resistance and current values from impedance and polarization measurements of Li-symmetric cells with O-PEGDMA-VS-0 (3 different trials), T-PEGDMA-VS-0 in 1 M LiPF6 (EC-DEC), and 1 M LiTFSI (DOL-DME) and Celgard separator in 1 M LiPF6 (EC-DEC). EIS1 indicates the impedance measurement before polarization, whereas EIS2 indicates the impedance measurement post-polarization.
Sample NameR1,EIS1
(Ohms)
R2,EIS1
(Ohms)
R1,EIS2
(Ohms)
R2,EIS2
(Ohms)
Ri,EIS2 = R2,EIS1 − R1,EIS1
(Ohms)
Rss,EIS2 = R2,EIS2 − R1, EIS2
(Ohms)
Iss (A)Io (A) Δ V   ( V ) t L i +
O-PEGDMA-VS-0 in 1 M LiPF6 (EC-DEC)
(1st trial)
1431214336298322 1.0 × 10 5 1.2 × 10 5 0.00980.79
O-PEGDMA-VS-0 in 1 M LiPF6 (EC-DEC)
(2nd trial)
1838218405364387 1.3 × 10 5 1.1 × 10 5 0.0110.78
O-PEGDMA-VS-0 in 1 M LiPF6 (EC-DEC)
(3rd trial)
1355113555538542 5.7 × 10 5 5.0 × 10 5 0.00980.79
T-PEGDMA-VS-0 in 1 M LiPF6 (EC-DEC)2967129691642662 8.4 × 10 6 1.0 × 10 5 0.0110.65
O-PEGDMA-VS-0 in 1 M LiTFSI (DOL-DME)1331713332304318 2.8 × 10 5 2.4 × 10 5 0.00980.51
T-PEGDMA-VS-0 in 1 M LiTFSI (DOL-DME)3736337377326340 2.5 × 10 5 2.0 × 10 5 0.00980.47
Celgard in 1 M LiPF6 (EC-DEC)265524590526586 2.6 × 10 5 1.3 × 10 5 0.0100.47
Figure A2. (a) Impedance response pre- and post-hold of Li-symmetric cell with T-PEGDMA-VS-0 swollen in 1 M LiPF6 (EC-DEC) and polarization curve. (b) Impedance response pre- and post-hold of Li-symmetric cell with O-PEGDMA-VS-0 in 1 M LiTFSI (DOL-DME) and polarization curve. (c) Impedance response pre- and post-hold of Li-symmetric cell with T-PEGDMA-VS-0 in 1 M LiTFSI (DOL-DME) and polarization curve. (d) Impedance response pre- and post-hold of Li-symmetric cell with Celgard separator in 1 M LiPF6 (EC-DEC) and polarization curve. The lines on the impedance plots represent the equivalent circuit fits.
Electronicmat 02 00013 g0a2
Figure A3. SEM images of control opaque homopolymer PEGDMA. (a) The surface of control opaque homopolymer PEGDMA. (b) The cross-section image of opaque homopolymer PEGDMA film. (c,d) The different length-scale SEM images of opaque homopolymer PEGDMA.
Electronicmat 02 00013 g0a3

Appendix B. The Discussion on the Impacts of the Crosslinking Procedure

The polymerization procedure was altered in different ways to try to polymerize VS in the polymer network. As stated previously, none of the methods were successful.
First, the monomer solution was prepared exactly the same as it was explained in the Methods section. Then, the prepolymer solution was dropped uniform onto only one glass plate (open surface with no top plate) and the crosslinking took place in a nitrogen environment in the UVC-515 Ultraviolet Multilinker 254 nm UV oven for 60 min. Then, the films were rinsed with deionized water and the ionic exchange process was carried out. The films were prepared for ICP-OES measurement as described in the Methods section. As shown in Table A6, there is no Li+ in the dry polymer network. The results indicate that again, VS failed to attach into the polymer network to a high extent.
Second, the procedure as described in the Methods section was tried with a prepolymer solution containing VS salt that was dried directly from a commercial aqueous solution. As shown in Table A6, there is no Li+ in the dry polymer network. Likewise, the same result was acquired where the FTIR (Figure A4) had no sulfonate peak.
Table A6. Elemental Analysis Results for O-PEGDMA-VS in a dry state (after an ion-exchange process using 2 M LiOH in water). The C Li + estimated is the Li concentration in the polymer sample that would result if all of the vinyl sulfonate monomers covalently attached into the polymer network and exchanged to the lithium form upon the ion-exchange step. * The VS monomer was precipitated in organic solvent and dried in a high vacuum. ** The VS monomer was directly dried from an aqueous solution.
SchemeMeasured Li+ Concentration (mol mg−1) C L i + m e a s u r e d C L i + e s t i m a t e d
* O-PEGDMA-VS-0 7.4 × 10 8 3%
** O-PEGDMA-VS (wet) 9.0 × 10 8 4%
Figure A4. FTIR spectrum of the opaque PEGDMA-VS (wet) membrane in which VS directly dried from aqueous solution was used in the prepolymer solution.
Electronicmat 02 00013 g0a4
Finally, thick borosilicate glass plates are known as being capable of absorbing UV light. Thus, Teflon plates were used during the polymerization process, but the result still did not change.
In addition to the aforementioned tests, the same prepolymer solution was prepared which yielded the opaque film. The crosslinked membrane was cut into three pieces. To the first piece, the washing was applied as described in the Methods section. The second piece was rinsed with acetone and the membrane appeared as an opaque film after drying. To the last piece, no ion exchange or washing was carried out and the film remained translucent. With regard to FTIR results, the first piece was the same as the reported O-PEGDMA-VS-0; no sulfonate stretch was detected. The second piece rinsed in acetone showed a sulfonate peak in FTIR. The unprocessed membrane film displayed both sulfonate and DMSO peaks. However, after rinsing the second and third films with water, the VS washed away. Even though various techniques were attempted to covalently tether the VS in the polymer network, it was not achieved.

References

  1. Cano, Z.P.; Banham, D.; Ye, S.; Hintennach, A.; Lu, J.; Fowler, M.; Chen, Z. Batteries and fuel cells for emerging electric vehicle markets. Nat. Energy 2018, 3, 279–289. [Google Scholar] [CrossRef]
  2. Schmuch, R.; Wagner, R.; Hörpel, G.; Placke, T.; Winter, M. Performance and cost of materials for lithium-based rechargeable automotive batteries. Nat. Energy 2018, 3, 267–278. [Google Scholar] [CrossRef]
  3. Zhang, Z.; Shao, Y.; Lotsch, B.; Hu, Y.-S.; Li, H.; Janek, J.; Nazar, L.F.; Nan, C.; Maier, J.; Armand, M.; et al. New horizons for inorganic solid state ion conductors. Energy Envrion. Sci. 2018, 11, 1945–1976. [Google Scholar] [CrossRef] [Green Version]
  4. Xu, K. Electrolytes and interphases in li-Ion batteries and beyond. Chem. Rev. 2014, 114, 11503–11618. [Google Scholar] [CrossRef] [PubMed]
  5. Baik, J.-H.; Kim, S.; Hong, D.G.; Lee, J.-C. Gel Polymer electrolytes based on polymerizable lithium salt and poly(ethylene glycol) for lithium battery applications. ACS Appl. Mater. Interfaces 2019, 11, 29718–29724. [Google Scholar] [CrossRef]
  6. Ford, H.O.; Park, B.; Jiang, J.; Seidler, M.E.; Schaefer, J.L. Enhanced Li+ conduction within single-son conducting polymer gel electrolytes via reduced cation-polymer interaction. ACS Mater. Lett. 2020, 2, 272–279. [Google Scholar] [CrossRef]
  7. Deng, K.; Wang, S.; Ren, S.; Han, D.; Xiao, M.; Meng, Y. Network type sp3 boron-based single-ion conducting polymer electrolytes for lithium ion batteries. J. Power Sources 2017, 360, 98–105. [Google Scholar] [CrossRef]
  8. Zhang, H.; Li, C.; Piszcz, M.; Coya, E.; Rojo, T.; Rodriguez-Martinez, L.M.; Armand, M.; Zhou, Z. Single lithium-ion conducting solid polymer electrolytes: Advances and perspectives. Chem. Soc. Rev. 2017, 46, 797–815. [Google Scholar] [CrossRef]
  9. Bouchet, R.; Maria, S.; Meziane, R.; Aboulaich, A.; Lienafa, L.; Bonnet, J.-P.; Phan, T.T.N.; Bertin, D.; Gigmes, D.; Devaux, D.; et al. Single-ion BAB triblock copolymers as highly efficient electrolytes for lithium-metal batteries. Nat. Mater. 2013, 12, 452–457. [Google Scholar] [CrossRef]
  10. Lin, M.; Fu, C.; Li, L.; Mayilvahanan, K.S.; Watkins, T.; Perdue, B.R.; Zavadil, K.R.; Helms, B.A. Nanoporous polymer films with a high cation transference number stabilize lithium metal anodes in light-weight batteries for electrified transportation. Nano Lett. 2019, 19, 1387–1394. [Google Scholar] [CrossRef]
  11. Ma, L.; Nath, P.; Tu, Z.; Tikekar, M.; Archer, L.A. Highly conductive, sulfonated, UV-Cross-Linked separators for Li–S batteries. Chem. Mater. 2016, 28, 5147–5154. [Google Scholar] [CrossRef]
  12. Li, L.; Wang, M.; Wang, J.; Ye, F.; Wang, S.; Xu, Y.; Liu, J.; Xu, G.; Zhang, Y.; Zhang, Y.; et al. Asymmetric gel polymer electrolyte with high lithium ion conductivity for dendrite-free lithium metal batteries. J. Mater. Chem. A 2020, 8, 8033–8040. [Google Scholar] [CrossRef]
  13. Wang, Y.; Fu, L.; Shi, L.; Wang, Z.; Zhu, J.; Zhao, Y.; Yuan, S. Gel polymer electrolyte with high li transference number enhancing the cycling stability of lithium anodes. ACS Appl. Mater. Interfaces 2019, 11, 5168–5175. [Google Scholar] [CrossRef]
  14. Baran, M.J.; Carrington, M.E.; Sahu, S.; Baskin, A.; Song, J.; Baird, M.A.; Teat, S.J.; Meckler, S.M.; Fu, C.; Prendergast, D.; et al. Diversity-oriented synthesis of polymers of intrinsic microporosity with explicit solid solvation cages for lithium ions. Nature 2021, 592, 225–233. [Google Scholar] [CrossRef]
  15. Du, H.; Shi, S.; Liu, W.; Che, G.; Piao, M. Hydrophobic-force-driven adsorption of bisphenol A from aqueous solution by polyethylene glycol diacrylate hydrogel microsphere. Environ. Sci. Pollut. Res. 2019, 26, 22362–22371. [Google Scholar] [CrossRef]
  16. Aydın, D.; Kızılel, S. Water-in-water emulsion based synthesis of hydrogel nanospheres with tunable release kinetics. Jom 2017, 69, 1185–1194. [Google Scholar] [CrossRef]
  17. Nam, C.; Yoon, J.; Ryu, S.A.; Choi, C.-H.; Lee, H. Water and oil insoluble PEGDA-based microcapsule: Biocompatible and multicomponent encapsulation. ACS Appl. Mater. Interfaces 2018, 10, 40366–40371. [Google Scholar] [CrossRef]
  18. Merrill, L.C.; Ford, H.O.; Schaefer, J.L. Application of single-ion conducting gel polymer electrolytes in magnesium batteries. ACS Appl. Energy Mater. 2019, 2, 6355–6363. [Google Scholar] [CrossRef]
  19. Bruce, P.G.; Evans, J.; Vincent, C.A. Conductivity and transference number measurements on polymer electrolytes. Solid State Ion. 1988, 28, 918–922. [Google Scholar] [CrossRef]
  20. Diederichsen, K.M.; McShane, E.J.; McCloskey, B.D. Promising routes to a high Li + transference number electrolyte for lithium ion batteries. ACS Energy Lett. 2017, 2, 2563–2575. [Google Scholar] [CrossRef]
  21. Strauss, E.; Menkin, S.; Golodnitsky, D. On the way to high-conductivity single lithium-ion conductors. J. Solid State Electrochem. 2017, 21, 1879–1905. [Google Scholar] [CrossRef]
  22. Zaleski, R.; Krasucka, P.; Skrzypiec, K.; Goworek, J. Macro- and nanoscopic studies of porous polymer swelling. Macromolecules 2017, 50, 5080–5089. [Google Scholar] [CrossRef]
  23. Sienkiewicz, A.; Krasucka, P.; Charmas, B.; Stefaniak, W.; Goworek, J. Swelling effects in cross-linked polymers by thermogravimetry. J. Therm. Anal. Calorim. 2017, 130, 85–93. [Google Scholar] [CrossRef] [Green Version]
  24. Markevich, E.; Salitra, G.; Chesneau, F.; Schmidt, M.; Aurbach, D. Very stable lithium metal stripping–plating at a high rate and high areal capacity in fluoroethylene carbonate-based organic electrolyte solution. ACS Energy Lett. 2017, 2, 1321–1326. [Google Scholar] [CrossRef]
  25. Liu, Y.; Lin, D.; Yuen, P.Y.; Liu, K.; Xie, J.; Dauskardt, R.H.; Cui, Y. An artificial solid electrolyte interphase with high Li-ion conductivity, mechanical strength, and flexibility for stable lithium metal anodes. Adv. Mater. 2017, 29, 1605531. [Google Scholar] [CrossRef]
Figure 1. (a) Compares the pure PEGDMA membrane to transparent and opaque PEGDMA-VS-0. (b) Shows the expected sulfonate stretch region to indicate there is no S=O stretch in opaque and transparent PEGDMA-VS-0 films.
Electronicmat 02 00013 g001
Figure 2. SEM images of (a) O-PEGDMA-VS-0 and (b) T-PEGDMA-VS-0, in the dry state.
Electronicmat 02 00013 g002
Figure 3. Ionic conductivity with respect to temperature for the transparent and opaque PEGDMA-VS-0 in (a) a DOL-DME (1:1 v%) and (b) EC-DEC (1:1 v%) solvent mixtures. The ionic conductivity of each solvent mixture is reported at room temperature. The red dotted lines indicate 25 °C.
Electronicmat 02 00013 g003
Figure 4. Ionic conductivity with respect to temperature for the transparent and opaque PEGDMA-VS-0 in (a) 1 M LiTFSI (DOL-DME 1:1 v%) and (b) 1 M LiPF6 (EC-DEC 50:50 v%). Glass fiber separators were used for 1 M LiTFSI (DOL-DME) and 1 M LiPF6 (EC-DEC) measurements. The red dotted lines indicate 25 °C.
Electronicmat 02 00013 g004
Figure 5. Experimental data and analysis on a Li symmetric cell to determine lithium transference number for O-PEGDMA-VS-0 in 1 M LiPF6 (EC-DEC 1:1 v%): (a) Impedance response pre- and post-potentiostatic hold, (b) Current response during the potentiostatic hold, (c) The equivalent circuit that is used for the fitting of impedance data throughout the study.
Electronicmat 02 00013 g005
Figure 6. (a) Capacity fade and efficiency for Li/LiFePO4 with O-PEGDMA-VS-0 for 300 cycles. (b) The potential profiles of the Li/O-PEGDMA-VS-0/LiFePO4 cell during the C-rate test. (c) Galvanostatic charge and discharge curves at 0.1 C-rate at select cycles for Li/LiFePO4 cells with either O-PEGDMA-VS-0 and Celgard separators. (d) The C-rate performance comparison of O-PEGDMA-VS-0 and Celgard separator in the range of 0.1 to 5 C-rate.
Electronicmat 02 00013 g006
Table 1. Compositions of monomer solutions for T-PEGDMA-VS-0 and O-PEGDMA-VS-0. * denotes that the VS monomer was precipitated in organic solvent and dried under high vacuum.
Sample NameCrosslinkerCrosslinker Mass (g)* VS (g)Anhydrous DMSO (g)Photoinitiator (g)Water (µL)
T-PEGDMA-VS-0PEGDMA
750 g/mol
0.5360.2140.8500.0075-
O-PEGDMA-VS-0PEGDMA
750 g/mol
0.5360.2140.7990.007551.4
Table 2. The t Li + outcomes of O-PEGDMA-VS-0 and T-PEGDMA-VS-0 membranes swollen in 1 M LiPF6 (EC-DEC 50:50 v%) and 1 M LiTFSI (DOL-DME 1:1 v%) electrolytes.
Sample Name/Electrolyte t L i +
O-PEGDMA-VS-0 in 1 M LiPF6 (EC-DEC)0.78
T-PEGDMA-VS-0 in 1 M LiPF6 (EC-DEC)0.65
O-PEGDMA-VS-0 in 1 M LiTFSI (DOL-DME)0.51
T-PEGDMA-VS-0 in 1 M LiTFSI (DOL-DME)0.47
Publisher’s Note: MDPI stays neutral with regard to jurisdictional claims in published maps and institutional affiliations.

