Article

Calibration Method for the Determination of the FAME and HVO Contents in Fossil Diesel Blends Using NIR Spectroscopy

1
RISE Research Institutes of Sweden, 941 38 Piteå, Sweden
2
School of Technology and Innovations, University of Vaasa, 65101 Vaasa, Finland
3
Etteplan, 02150 Espoo, Finland
*
Author to whom correspondence should be addressed.
Submission received: 7 April 2021 / Revised: 29 April 2021 / Accepted: 4 May 2021 / Published: 7 May 2021

Abstract

:
The European diesel fuel standard, EN590, allows a 7% (V/V) biodiesel (FAME) addition to automotive diesel fuel. The allowed addition of renewable diesel (HVO) to fossil diesel is not defined, as long as the properties of the fuel blend still meet the requirements of the standard. However, it is important to analyze the biofuels’ content in diesel fuel blends. In this article, a development procedure of a calibration method for quantification of the HVO and FAME contents in fossil diesel blends using near-infrared (NIR) spectroscopy is presented. The analytical range of quantification of biodiesel content is from 0 to 10% (V/V) and of renewable diesel content from 0 to 20% (V/V). The partial least squares (PLS) regression method for multivariable data analysis and construction of the calibration models were used to create the calibration method. The constructed PLS models obtained prediction results for all diesel fuel blends with root mean square error of prediction (RMSEP) values of 2.66% (V/V) for the HVO content quantification and 0.18% (V/V) for quantification of the FAME content. This article concludes that the calibration method is acceptable for laboratory applications in practice.

1. Introduction

The European diesel standard EN 590 for automotive fuels allows using additives in automotive diesel fuel [1]. As long as the fuel properties fulfill the requirements of the standard, alternative, renewable or also nonrenewable, fuels are allowed to be added to the diesel fuel. Nowadays, the major alternative fuel options derived from renewable feedstock are biodiesels and renewable diesels. The properties and composition of these fuels differ, due to the difference in processes of fuels’ production, even if the used raw material is the same [2].
Biodiesels are produced from oils and fats through the transesterification process. They are also called fatty acid methyl ester (FAME) fuels. In transesterification, the feedstock reacts with alcohols in the presence of a catalyst to produce fatty acid alkyl esters. In Europe, the most common used raw material for biodiesel production is rapeseed oil, from which rapeseed methyl ester (RME) fuel is derived. Additionally, other sources, e.g., sunflower oil, soybean oil and palm oil, as well as algae and animal fat are used to produce biodiesel [3]. The standard EN590 allows a 7% (V/V) biodiesel addition to automotive diesel fuel. Added FAME must comply with the standard EN 14214. The EN 14214 is the standard that describes requirements, test methods and threshold values of FAME for automotive diesel engines [4].
Renewable diesels are petrol-like fuels derived from biological renewable sources. Unlike the FAME fuels, the renewable diesels’ chemical structure is long-chain alkanes, which is why renewable diesels are characterized as petrol-like. The renewable diesels’ production process is based on the hydrogen treatment of biological feedstock, such as vegetable oils and animal fats. In this process, hydrogen reacts with the source material in the presence of a catalyst in order to saturate double bonds and replace oxygen. Renewable diesel is commonly called HVO, hydrotreated vegetable oil, due to the initially used feedstock. Therefore, even if the renewable diesel is produced from waste fat fractions or vegetable oil fractions, including wood origins, the fuels will still be referred to as HVO [2]. According to standard EN 590, renewable diesel is allowed to blend with fossil diesel fuel without limitation for automotive diesel fuel.
For all the automotive diesel fuels available on the market that fit fuel property requirements of standard EN 590, no additional labeling is required. Moreover, no labeling of the bio content is required either, which means that the potential HVO and FAME blending ratios are unknown independent of, whether HVO is used as such or in addition to FAME, with a max limited content of 7% (V/V) [5]. Nevertheless, the knowledge about the biofuel content in diesel fuel blends is essential for research purposes. The fuel capacity is evaluated depending on the fuel’s technical properties, which determine the compatibility of fuel with engines. The presence of the biofuels additives in diesel fuel blends affects both the fuel properties, such as exposure to oxidative degradation, and performance as well as exhaust emissions of a diesel engine during the fuel utilization [6,7,8].
Standardization takes into account the differences between biodiesel and HVO quality. As said, the standard EN 14214 presents the requirements set for biodiesels. HVO fuel used as automotive fuel should fulfill the same requirements set for fossil diesel. EN 590 presents these limitations. As an example, the viscosity of biodiesel is set to the range between 3.50–5.00 mm2/s and the viscosity of HVO should stay between 2.00–4.50 mm2/s. The viscosity of a biodiesel–diesel blend is usually slightly higher than it is for neat DFO or HVO–DFO blend. The cold performance of biodiesel is poorer than it is for the HVO. Nevertheless, the mentioned standards have the same requirements for cold filter plugging point (CFPP) of these fuels. Generally, adding biodiesel to fossil diesel weakens the blends’ cold properties, unless additives to enhance the cold properties are used. Adding HVO to DFO has no significant change in the fuel’s cold performance. The oxidation stability of biodiesels and biodiesel–diesel blends is also poorer than it is for HVO, fossil fuels or their blends. The oxidation stability varies due to the differences in chemical structure. The methods to measure this property of these fuels vary even though they both base on exposing the fuel to aging conditions [1,4]. In engine experiments, HVO usually shows lower NOx emissions than biodiesel does [9].
NIR spectroscopy together with chemometrics are widely used in biodiesel analytics. Câmara et al. (2017) have studied adulteration of fuel blends with cheaper raw materials. They found that spectroscopic analysis MCR-ALS used together with PLS chemometric methods was a good way to identify and quantify diesel fuel blend adulteration. According to them, FT-NIR and FT-MIR spectroscopies are feasible methods to measure adulteration in diesel blends [10]. Palou et al. (2017) studied how to select calibration sets for the development of PLS models for prediction of diesel and biodiesel blends physico-chemical properties using NIR spectroscopy. FAME content in diesel fuel was one of these parameters. In their study, the target parameters were determined accurately according the PLS models. NIR spectra for the models was recorded on-line. Their models were feasible to analyze high variability of refinery samples [11]. Cunha et al. (2020) used NIR data to predict physical properties of biodiesel and biodiesel blends. The properties they evaluated were cold filter plugging point (CFPP) and kinematic viscosity at 40 °C. According to them, multivariate calibration based on partial least squares (PLS), random forest (RF) and support vector machine (SVM) methods combined with variable selections tools were feasible in predicting the mentioned properties [12].
HVO NIR studies are rarer than NIR analytics in biodiesel studies. However, Vrtiška & Šimáček (2016) studied how to predict the HVO content in the concentration range of 0–100% in petroleum diesel/HVO blends using chemometric processing of FTIR spectra. They used partial least squares regression (PLS) and principal component regression (PCR) to construct the predictive models. According to them, their model worked well for the validation samples, but the model needed preprocessing and the prediction of unknown HVO blends may be incorrect [13]. Nevertheless, research papers that have studied both biodiesel and HVO content in fuel blends are rare.
The main aim of this work was to develop a calibration method for the near infrared Parafuel Quantum 1800 spectrometer. The spectrometer should be able to recognize and quantify the biofuels contents in a diesel fuel sample, depending on the type of biofuels, such as FAME or HVO within the analytical range of 0–10% (V/V) and 0–20% (V/V), respectively. The analytical ranges for calibration method, 10% (V/V) for FAME and 20% (V/V) for HVO, were chosen based on the EN590 standard fuel requirements and previously measured common diesel fuel additives’ ratios. In order to determine the share of different biofuels in the diesel blend sample, a multivariable partial least squares (PLS) regression method was used for constructing the calibration model.

2. Materials and Methods
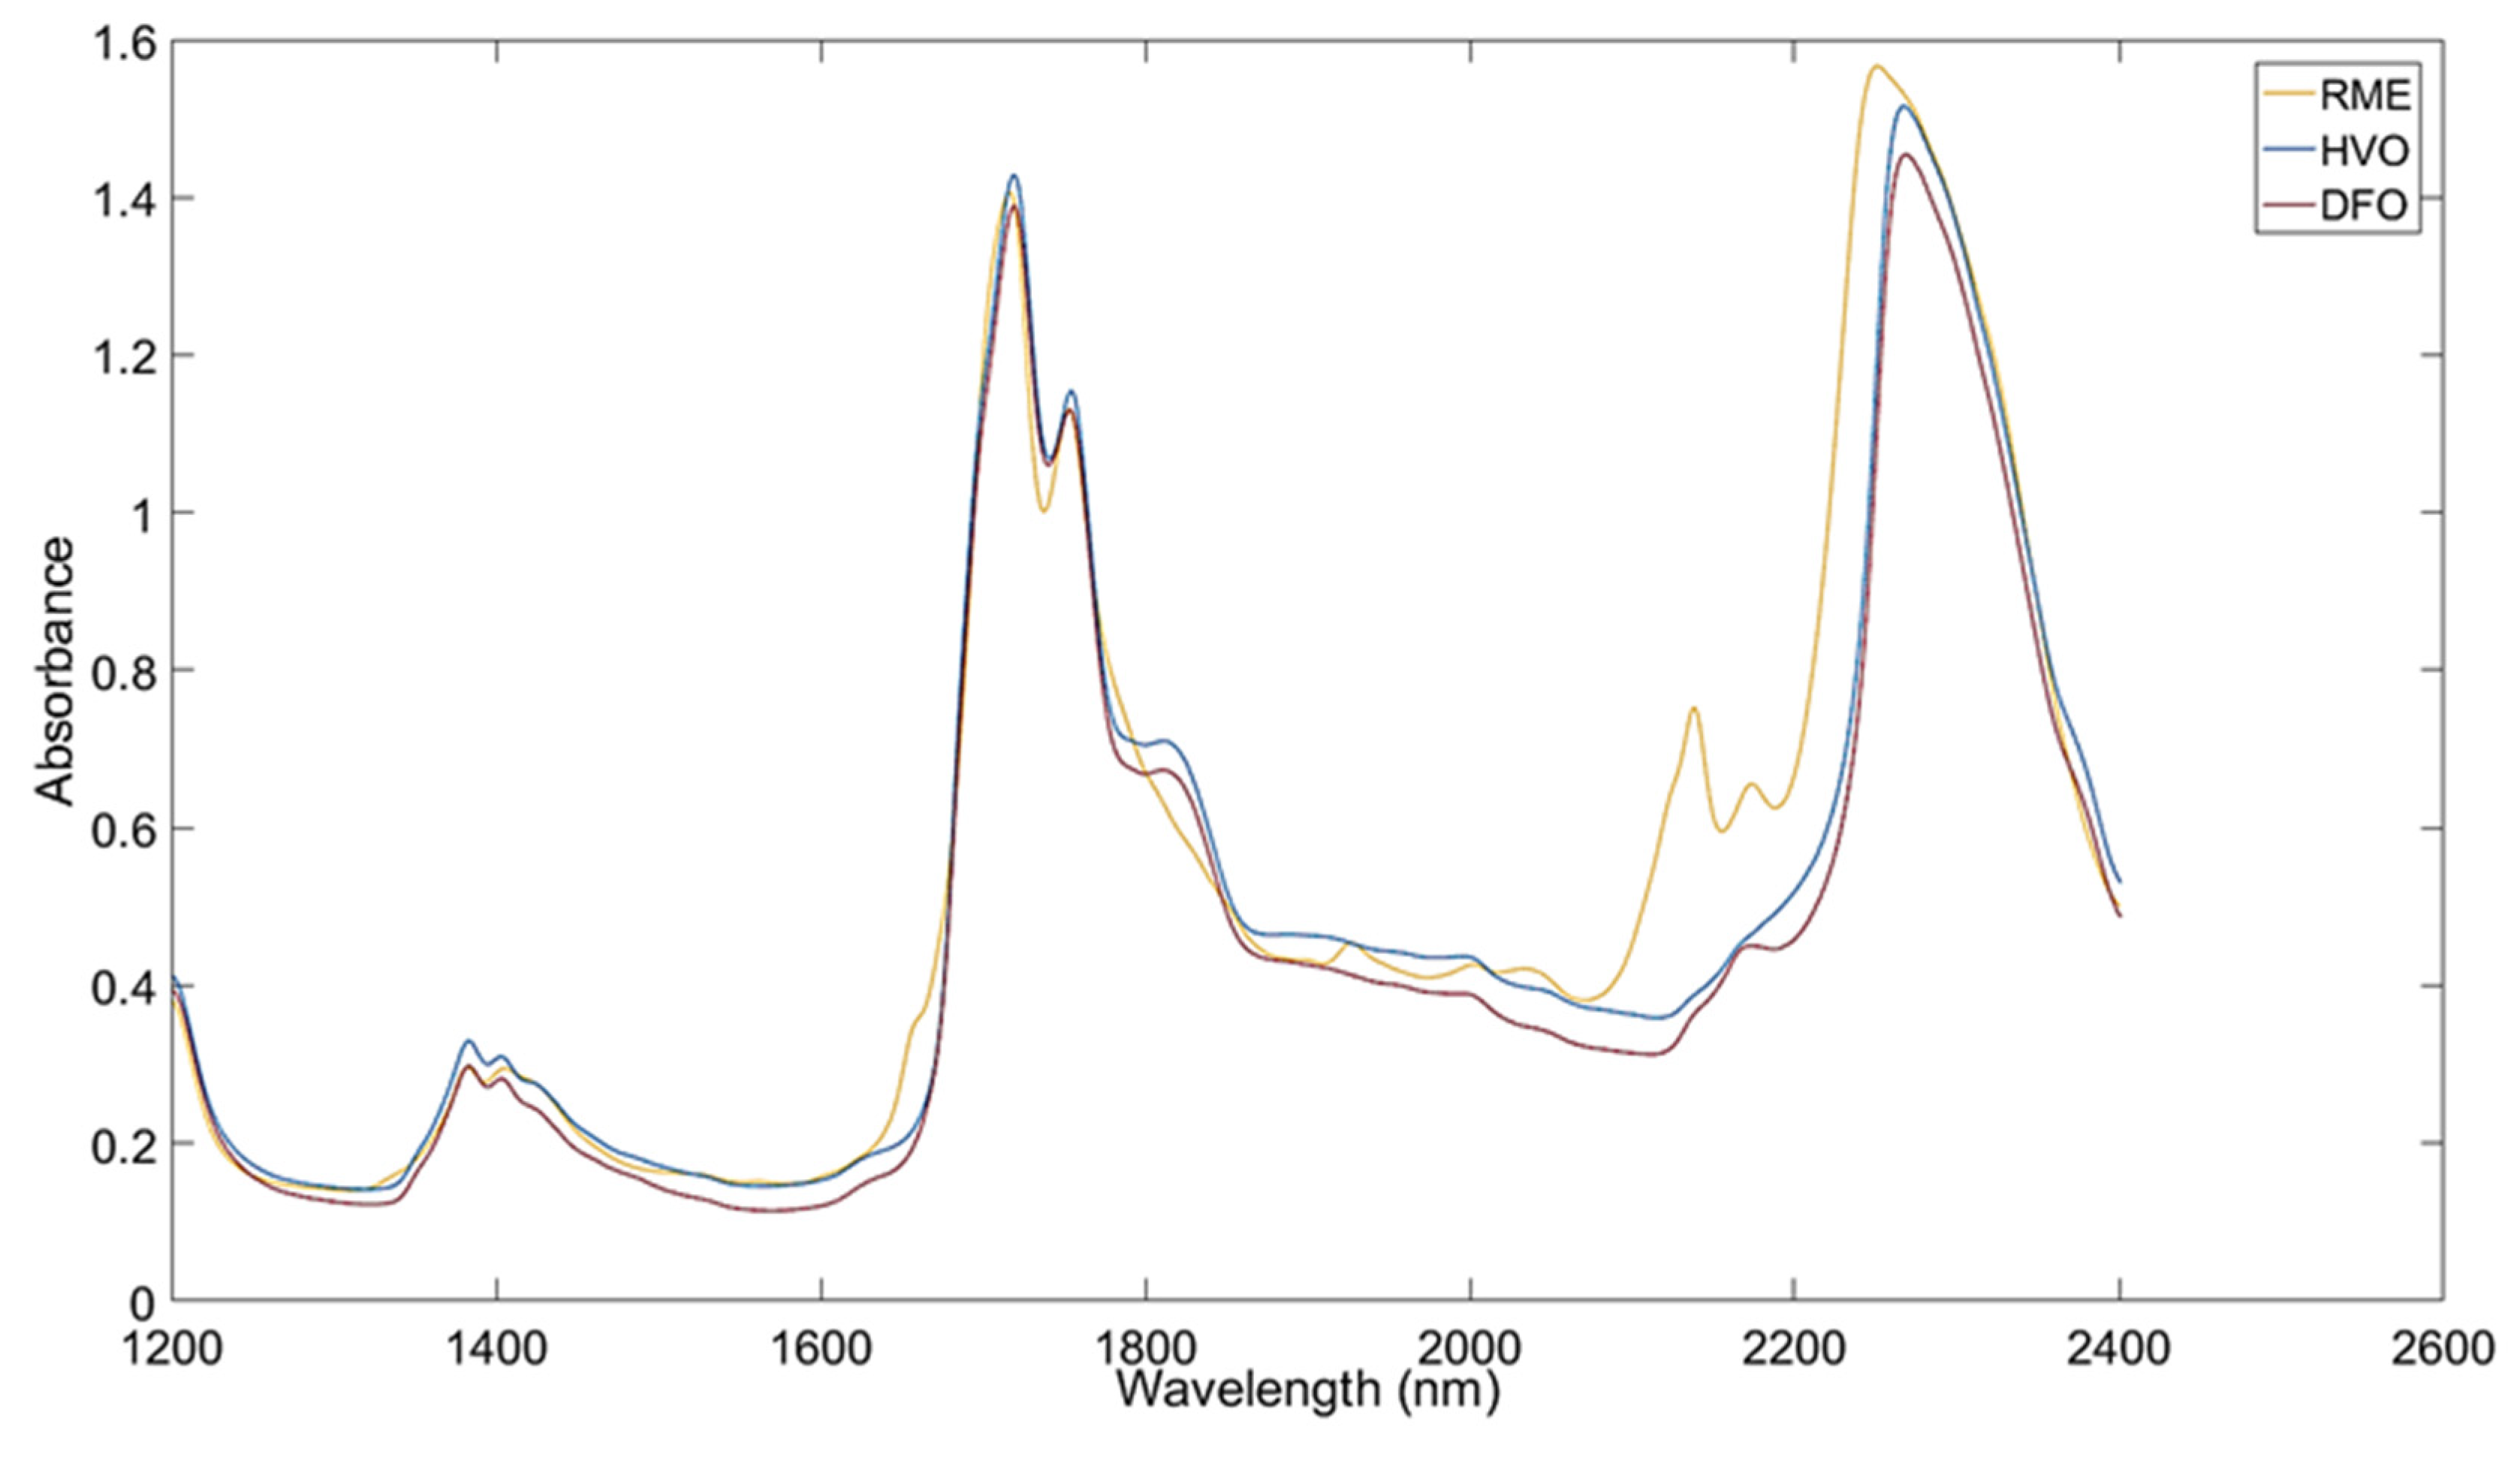
2.1. Materials

In this work, several types of biofuels were used to create both calibration and validation data sets of diesel fuel blend samples. One of the used biodiesels was RME, rapeseed oil methyl ester, which was a product of ASG Analytik-Service Gesellschaft mbH, Germany. Biodiesels are produced from oils and fats through transesterification process. In transesterification, the feedstock reacts with alcohols in the presence of a catalyst to produce fatty acid alkyl esters. RME is produced through alkali catalyzed reaction [2].
Another used biodiesel was AFME, animal fat methyl ester, produced by Feora Oy, Finland. AFME production process is a two-step alkalitransesterification in which triglycerides are turned into biodiesel. After that, biodiesel is refined using neutralization [14].
There were also two types of renewable diesel used during blend samples preparation. One was UPM Bioverno diesel, a diesel type fraction of renewable hydrocarbons of wood origin, referred as HVO (Bioverno) in this work, supplied by UPM-Kymmene Oyj, Finland. Bioverno is produced from crude tall oil via hydrotreatment in the UPM biorefinery in Lappeenranta. CTO is a residue of chemical pulping process that contains natural extractive components of wood [8].
The other was NEXBTL renewable diesel derived from the organic biomass, such as vegetable oil and various waste and residue. NEXBTL is a product of Neste Renewable Fuels Oy, Finland. In NExBTL production, impurities are removed from the renewable feedstock. The raw material goes through hydrodeoxygenation where oxygen atoms are removed catalytically, and pure hydrocarbons are formed. After that, hydrocarbons are isomerized [15].
The fossil diesel (DFO) used for blending was Neste Diesel −0/−10 produced by Neste Oyj in Finland. This low-sulfur fuel fulfilled the requirements of EN590 standard and was bio content free.
The properties of the studied fuels are presented in Table 1.
The NIR spectra was collected using the near infrared Parafuel Quantum 1800 spectrometer within the 1200–2400 nm range. The calibration method was developed using programing scripts for constructing the PLS calibration model in the MATLAB program, based on P. Geladi PLS Tutorial [16,17].

2.2. Calibration Method Procedure
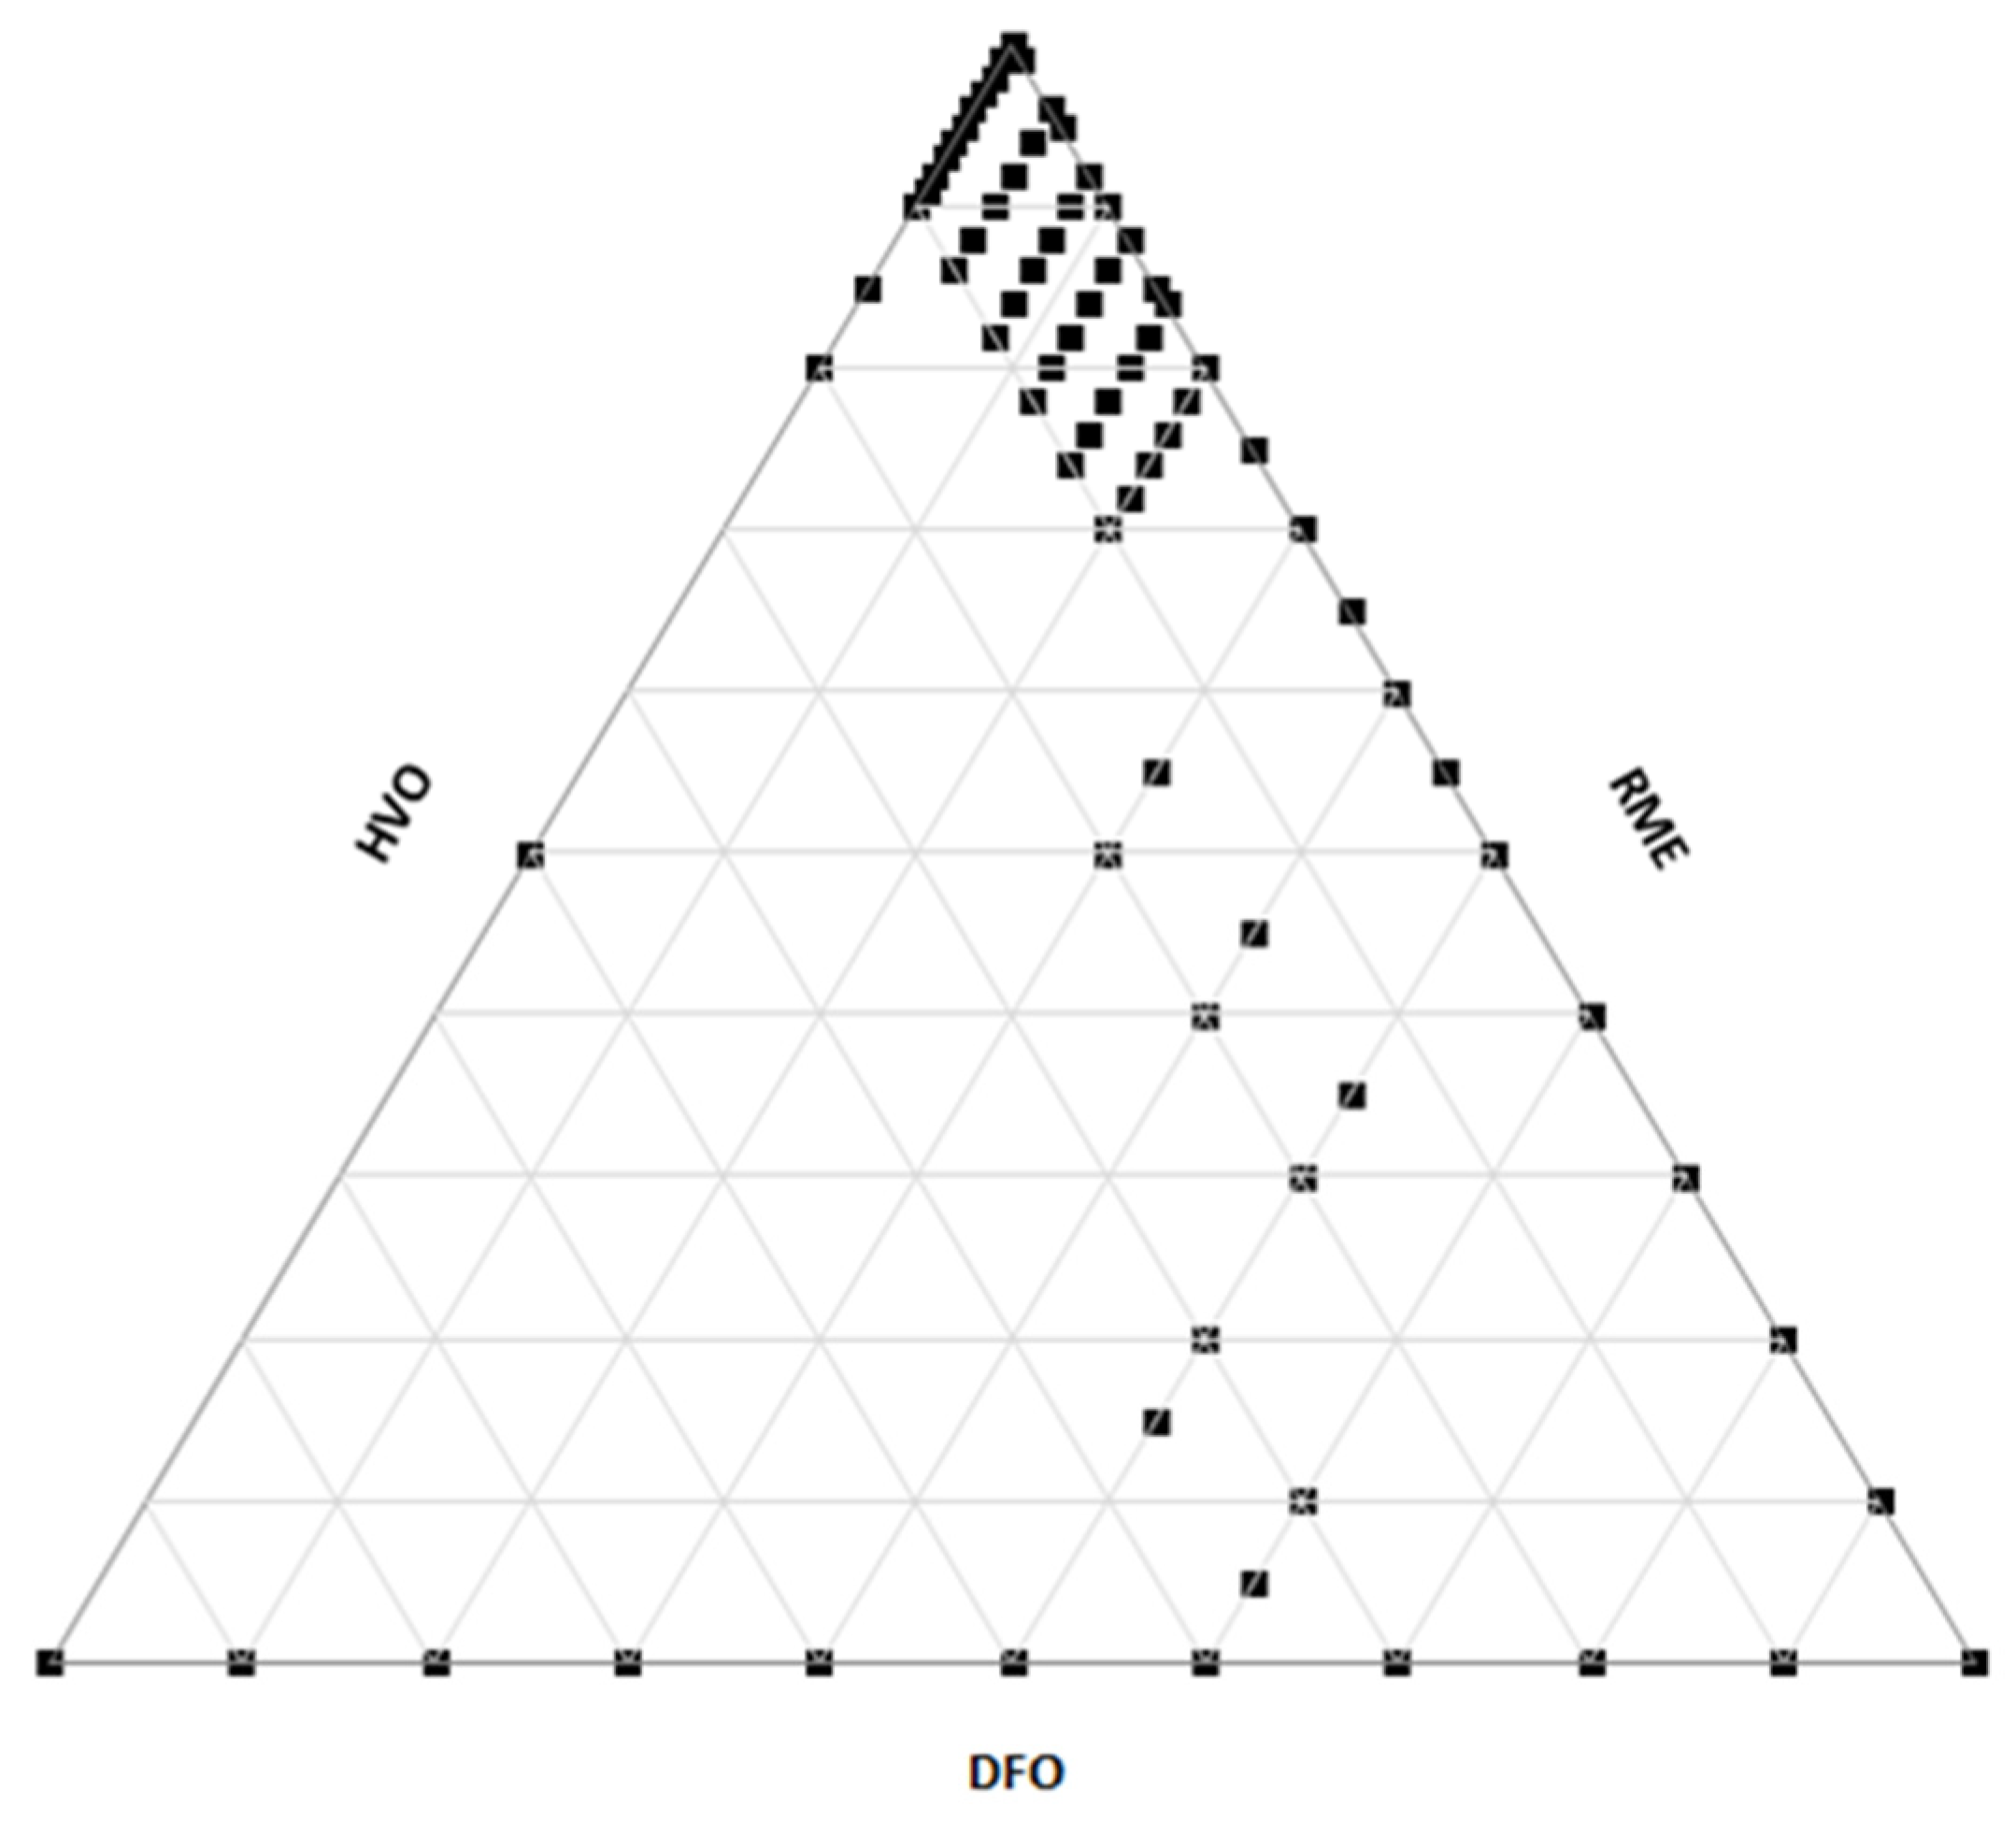
The NIR-spectroscopy uses near-infrared radiation, where the wavelength is between 700 and 2500 nm. A NIR spectrum represents energy, absorbed as a consequence of molecular vibrations, in the wavelength equivalent to the energy, in the range between 4000 and 12,500 cm−1. The NIR absorptions are based on overtones and combination of vibrations of the molecule [18]. In addition, the vibrational motions are over one or more energy levels, which generates non-harmonious vibrations. This means that the NIR absorption spectrum appears as complicated and normally possess broad overlapping NIR absorption bands. Furthermore, NIR absorption data is multivariable, as it depends on more than one variable simultaneously [19].
Figure 1 represents the NIR spectra of two renewable origin fuels, biodiesel (RME) and renewable diesel, HVO (Bioverno), together with fossil diesel with no bio content (DFO). There are clear differences between these spectra along with chemical structure differences, which provide a basis for developing the calibration method to identify and quantify each fuel using the NIR spectroscopy. In order to filter the information correlated to quantification of diesel fuel composition from the measured NIR absorption data, chemometrics is used for a multivariable data analysis procedure. Chemometrics combines both statistical and mathematical methods for quantitative analyses of the NIR spectrum data [19]. In this work, the measured NIR spectrum data was correlated to analytical values using the PLS regression technique to create a calibration model.

2.2.1. Data Set

The first step in developing the calibration method was to collect calibration data for PLS model construction. For this calibration method, the training data was based on three variable components: RME, HVO (Bioverno) and DFO concentrations. The calibration data had to fill the analytical area of interest by linearly changing the concentration of components forming a dense sequence of concentration combinations over the calibration range. There were a few major challenges during the calibration data set planning:
  • Complexity of variations for multivariable component data set;
  • Identification of the data set limits for minimizing the number of data;
  • Data systematization.
In addition, the properties of the calibration data’ component had also been taken into account during data set planning. E.g., the chemical structure of HVO (Bioverno) and DFO and their measured NIR spectra were almost similar. Therefore, in order to be able to perform more reliable PLS model calculations, the HVO (Bioverno) composition along with linearly changing concentration interval was chosen to be greater compared to RME in two variable component samples.
Figure 2 represents a ternary plot of the analytical data for all collected calibration samples. The total amount of samples collected for calibration purpose was 85, which included three- and two-component samples of RME, HVO and DFO. The data mainly covered the area of analytical interest, where RME was 0–10% (V/V), HVO (Bioverno) 0–20% (V/V) and DFO 70–100% (V/V). The data samples out of the interested analytical range were also included into the calibration data set to achieve well-defined correlations between the NIR spectrum and analytical sample data.
The analytical information of the calibration data set represented the composition fraction for each component, such as mass fraction, % (m/m) and volume fraction, % (V/V). The method used to determine the composition fractions of the samples’ components included weighing of each component added with a stated volume. The constructed PLS model calculations were based on the volume fraction data of the collected calibration samples since the number of moles of a substance is proportional to its volume and the absorbance values of the NIR spectrum are proportional to the volume values of the measured substance. As the NIR measured spectra represents the absorbed energy of the molecular vibrations, the absorbance values are proportional to a number of molecules present in the measured substance.
The mass fraction analytical data was collected to ensure the quality of the volume fractions of the sample components by comparing the sample’s densities ρm and ρV.
ρ m = m 1 + m 2 + m 3 V s a m p l e
ρ V = V 1 × ρ 1 + V 2 × ρ 2 + V 3 × ρ 3 V 1 + V 2 + V 3

2.2.2. Data Treatment

In order to make the calculations easier, the data needs to be processed before developing the model. A method for data pretreatment was chosen according to the quality of the measured spectra. The chosen pretreatment method must be applied for both independent (training set) and dependent (test) variables [16]. The quality of the measured spectra for several different diesel blends samples using the studied spectrometer was very good: the spectrum graph was smooth and clear and the noise level was insignificant. However, a spectra’s major imperfection was the baseline shift. In order to overcome the baseline drifting, several data pretreatment methods were tested:
  • Mean-centering method, used for spectrum centering. Each spectrum has been treated according to Formula (3), where x defines the spectrum variable and X stands for all variables of a spectrum data.
    f ( x ) = x mean ( X )
  • Baseline correction method (Formula (4)), used for data pretreatment of the calibration data spectrum.
    f ( x ) = x min ( X )
  • Standard normal variate (SNV) method (Formula (5)), used for both spectrum centering and scaling [20].
    f ( x ) = x mean ( X ) s t d e v ( X )
Each pretreatment method was tested using the cross-validation method. For each pretreatment method, the PLS model performance values were compared to identify the most effective one. In addition, the collected data were reduced to an average spectrum for each blend sample in combination with the previously mentioned pretreatment methods, and some samples with most spread spectrum data were sorted out from the calibration set. After all, basing on the cross-validation testing results the calibration data set was selected to include 73 spectrum data, where each spectrum represents the average measurement data of each blend sample, treated by applying the SNV method.

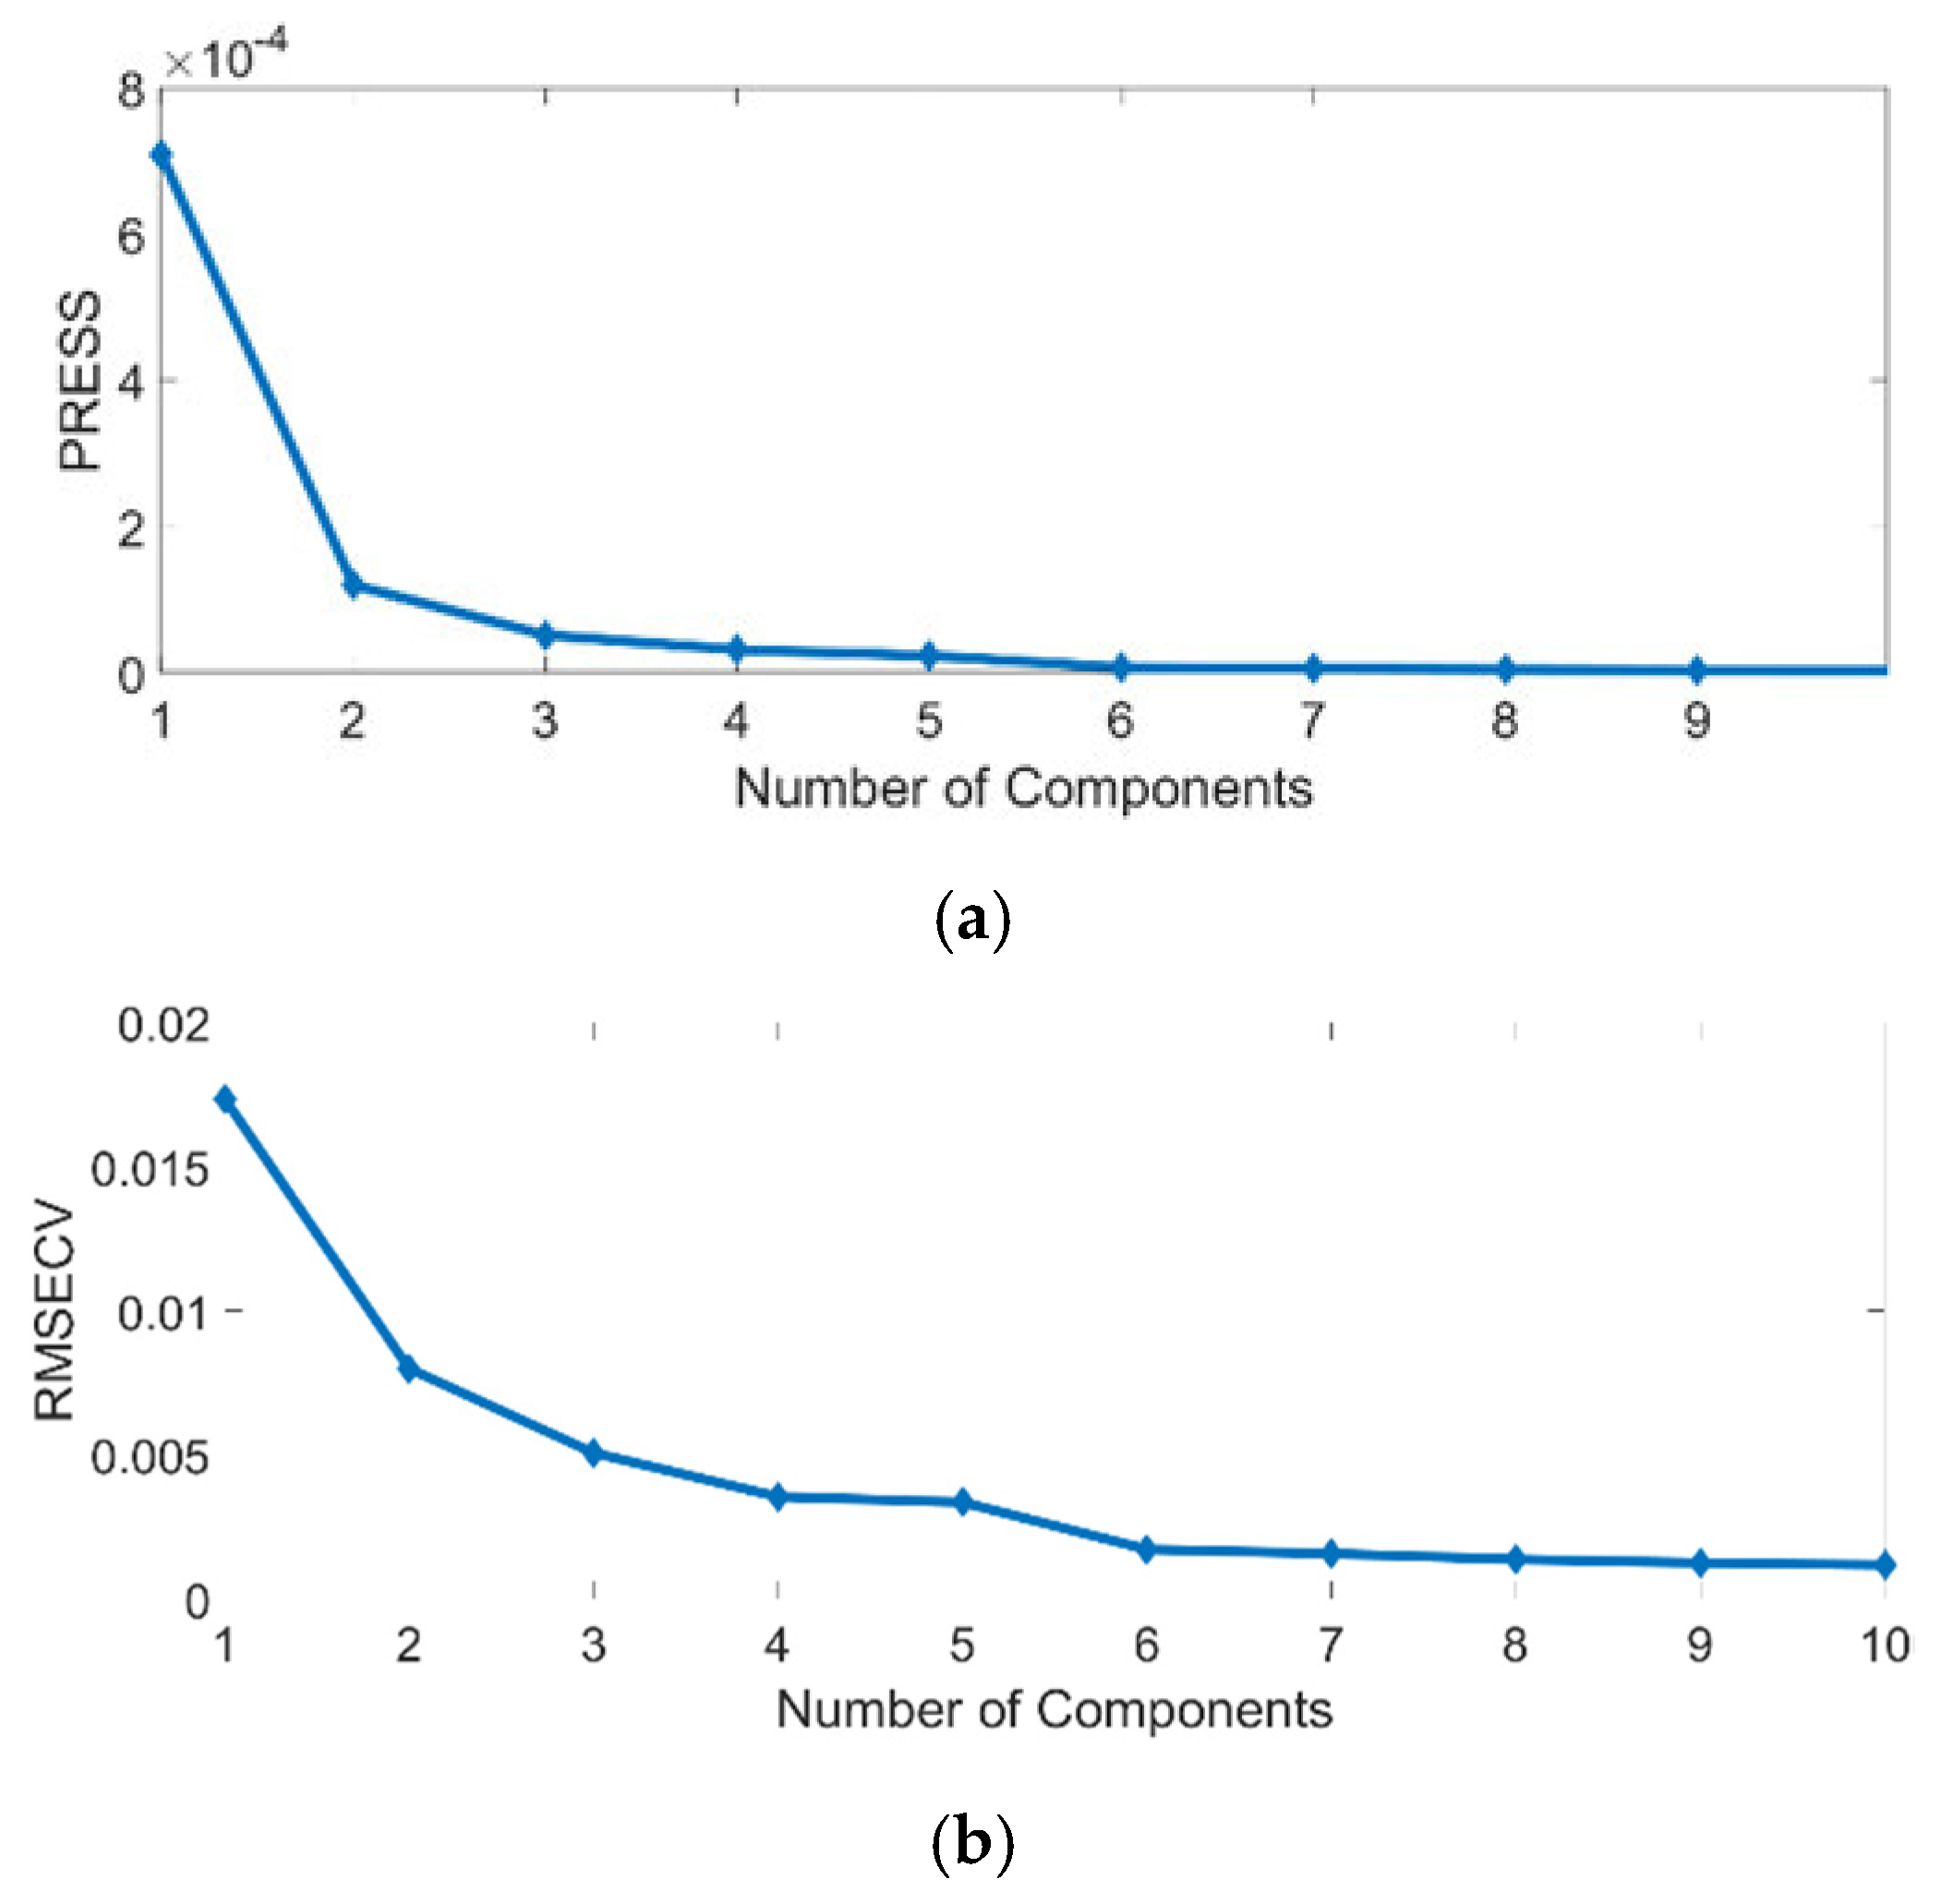
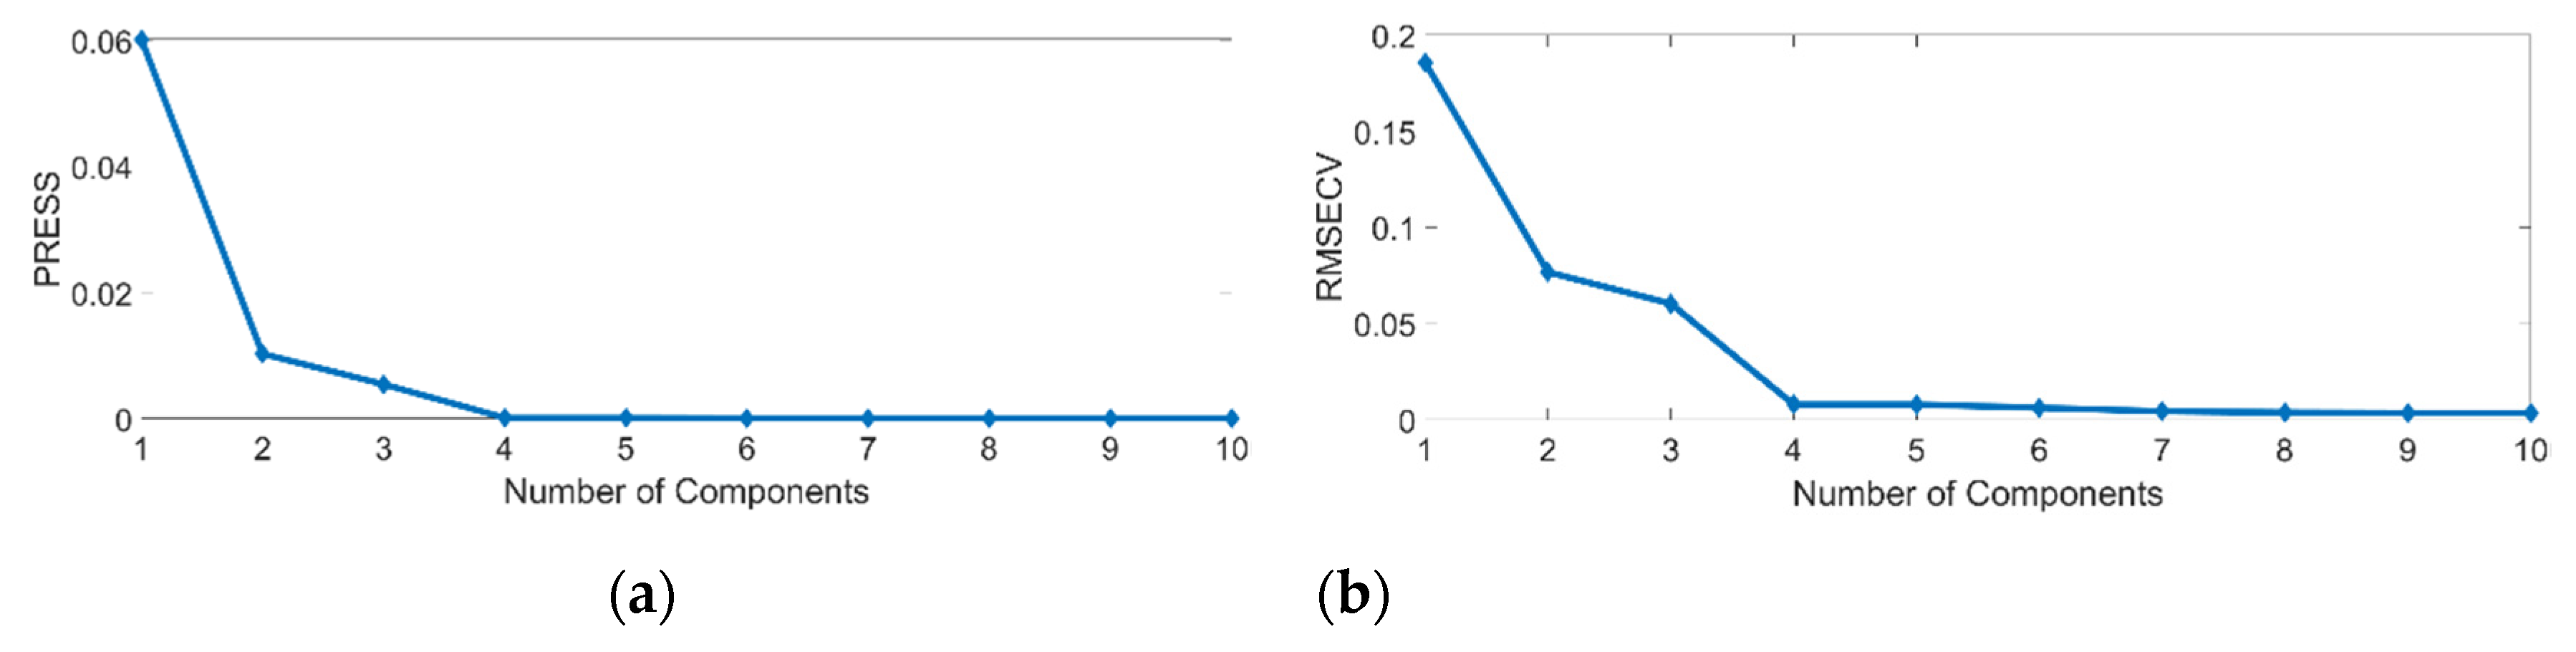
2.2.3. PLS Model Development

The PLS regression is a multivariate data analytical technique for constructing predictive models. The PLS model is built on the properties of the nonlinear iterative partial least squares algorithm. The model can be described as a regression between the scores for the spectrum data and the analytical data [16]. One of the most important properties of the model is the number of the PLS components. It is equal to the model dimensionality and determined to maximize the covariance between the spectra data and the analytical concentrations [19]. In this work, the range for calculated PLS component numbers was from 0 to 10, according to the quality of the measured spectra.
Programming scripts used for computing PLS model in the MatLab program were based on Geladi and Kowalski “Partial Least-squares regression: a tutorial” [16]. The ready-made scripts were used to perform the model selection analysis, during which the relations between spectra and analytical data of the calibration data set were identified and tested, using the “leave one out” (LOO) cross-validation method. The cross-validation method was used to optimize the PLS model with respect to the minimal prediction risk and to set the number of components needed for model prediction [21]. In LOO, each sample, included in the calibration data set, was used in turn as an individual testing data set. As a result, for each sample, the prediction values and PLS model performance values were calculated for each PLS component number providing an estimation of the model performance in predicting new data. The prediction performance of the model was represented by the sum of squared errors (PRESS) and the root mean squared error of cross validation (RMSECV) values, calculated by comparing the reference dependent variables with the testing data predictions [22]. During the cross-validation analysis three, the most convenient PLS component numbers were chosen for the further validation process for each PLS model.

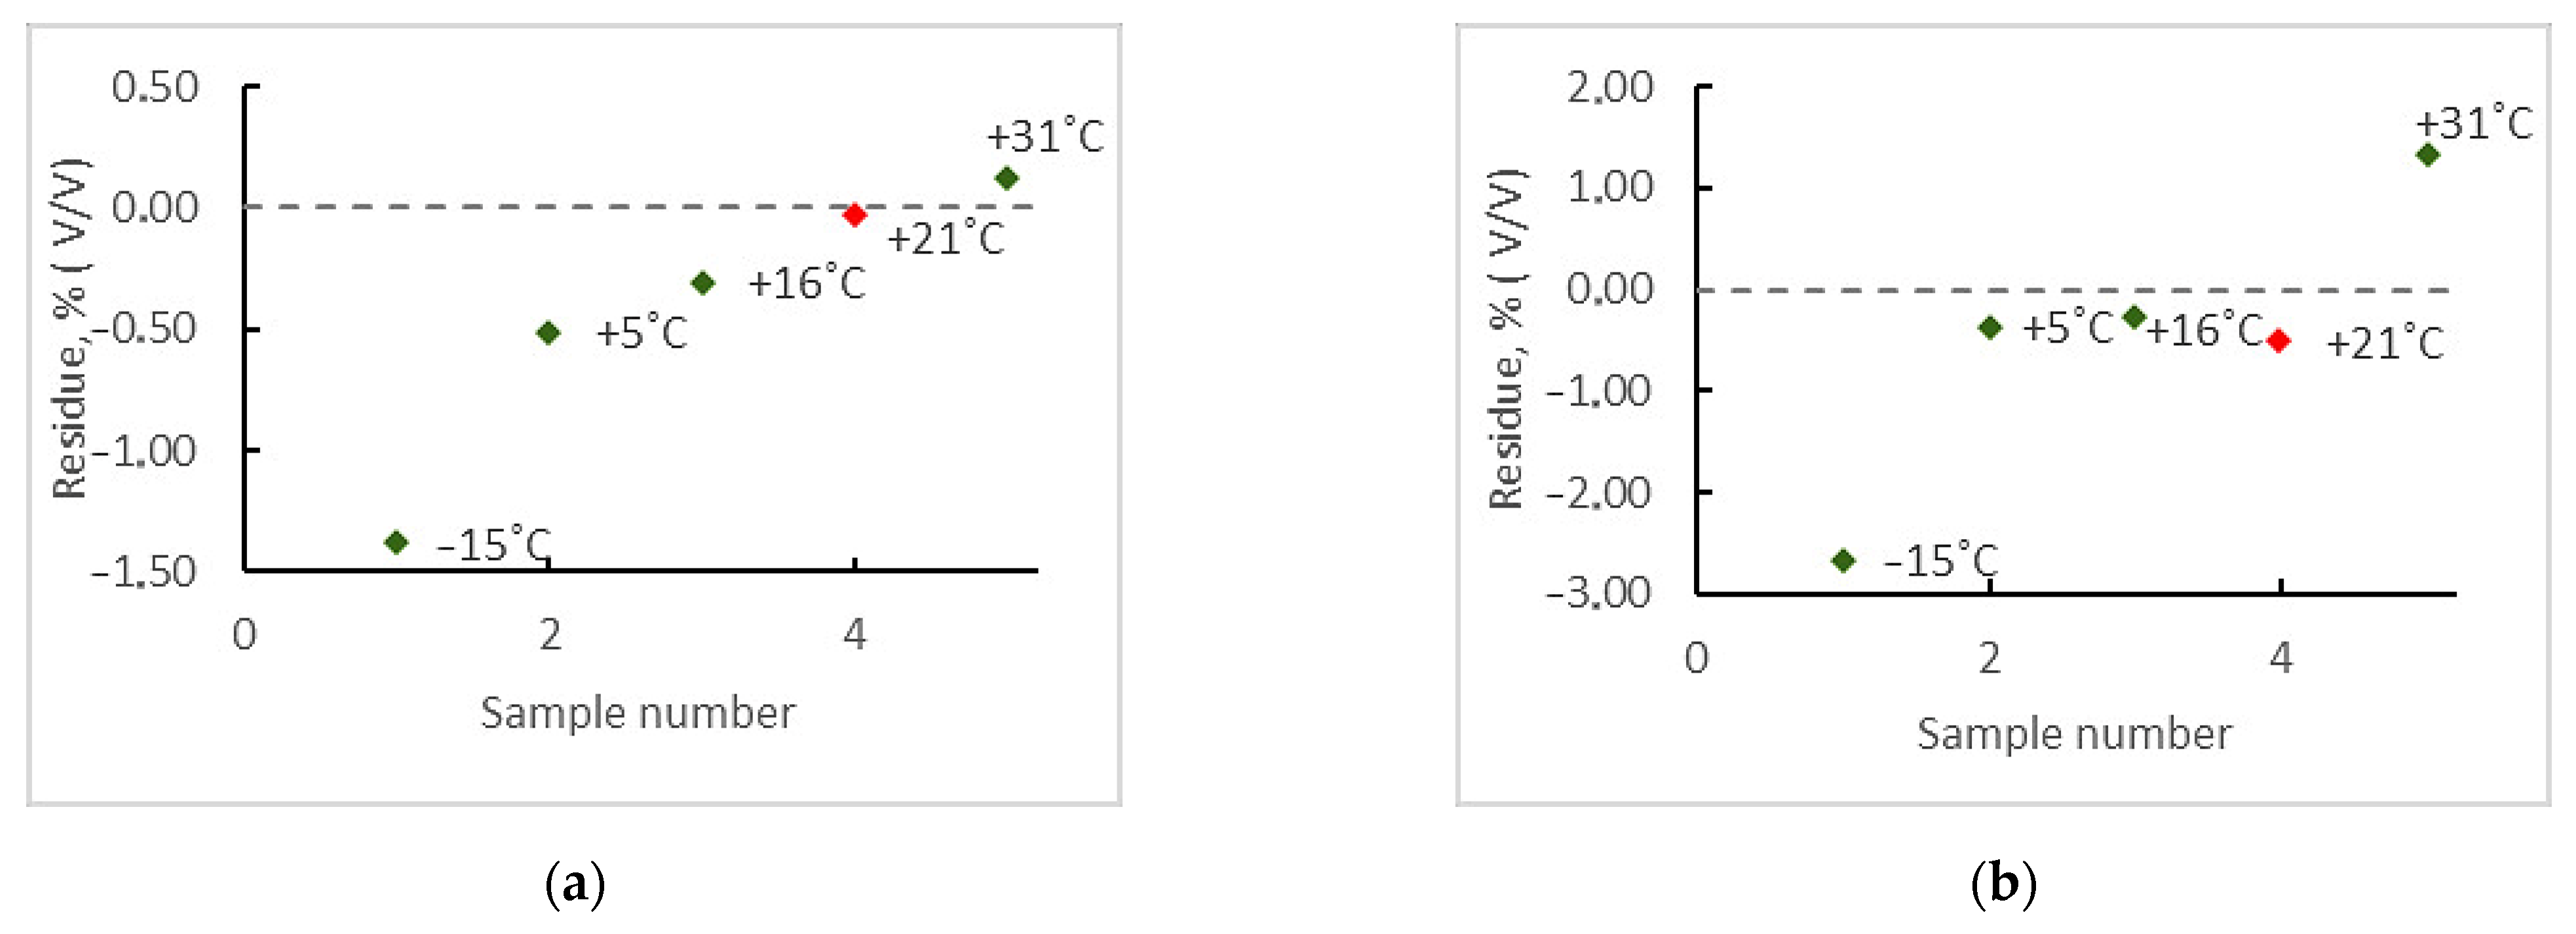
2.2.4. Validation Process

From the calibration set, a separately measured group of diesel blend samples was used for validating the constructed PLS models for RME and HVO quantification. This group of measured diesel blend samples was referred as the validation data set. The main purpose of using the validation set was to estimate how well the model will perform for future samples [23]. In order to be able to accomplish reliable evaluation of the constructed model’s performance, the main factor in the validation data set planning was identified to be the potential variety of the future samples’ content. The analytical data of each group samples of the validation set was equally distributed within the whole interested analytical range. The validation data set included:
  • Group of RME, HVO (Bioverno) and DFO blend samples;
  • Group of HVO (Bioverno) and DFO blend samples;
  • Group of RME and DFO blend samples;
  • Group of HVO (NEXBTL) and DFO blend samples;
  • Group of AFME and DFO blend samples.
During the PLS models predictions for the validation data set, the performance of the model was evaluated for all three component numbers, previously chosen from the model cross validation analysis, for each group separately. This method allowed obtaining a proper picture of the models’ performances for different blend samples with varying composition and contents’ original. After the validation method had been applied the final component numbers for the constructed PLS models were chosen.
In addition, a temperature variable group of sample measurements was used to evaluate the robustness of the model. The additional testing data set contained a group of the temperature variable sample measurements, which included five measurements of a blend sample with RME 7% (V/V), HVO (Bioverno) 15% (V/V) and the rest DFO within a temperature range from −15 °C to +31 °C.

3. Results

Individual calibration models were developed for the quantification of biodiesel and renewable diesel contents in diesel blend samples. Each model was separately calibrated and validated according to the collected analytical data for FAME and HVO compounds using the total collected and treated data sets. Basing on the observation of the models’ predictions for the validation data set, a supplementary data interpretation was applied for each model’s performance improvement. The idea of the supplementary data interpretation was to truncate negative prediction values for the component volume fraction to zeros.
Moreover, the robustness of the calibrated model was tested with a temperature variable group of sample measurements. The results, presented in Figure 3, showed that the calibrated models were sensitive to a difference between the measured sample temperature and the calibration data set standard temperature. The standard temperature, used for the calibration data set measurements, was room temperature, +21 °C, represented by the red mark in the Figure 3 plots. In addition, the calibrated models’ performance was directly affected by the temperature difference as can be observed.

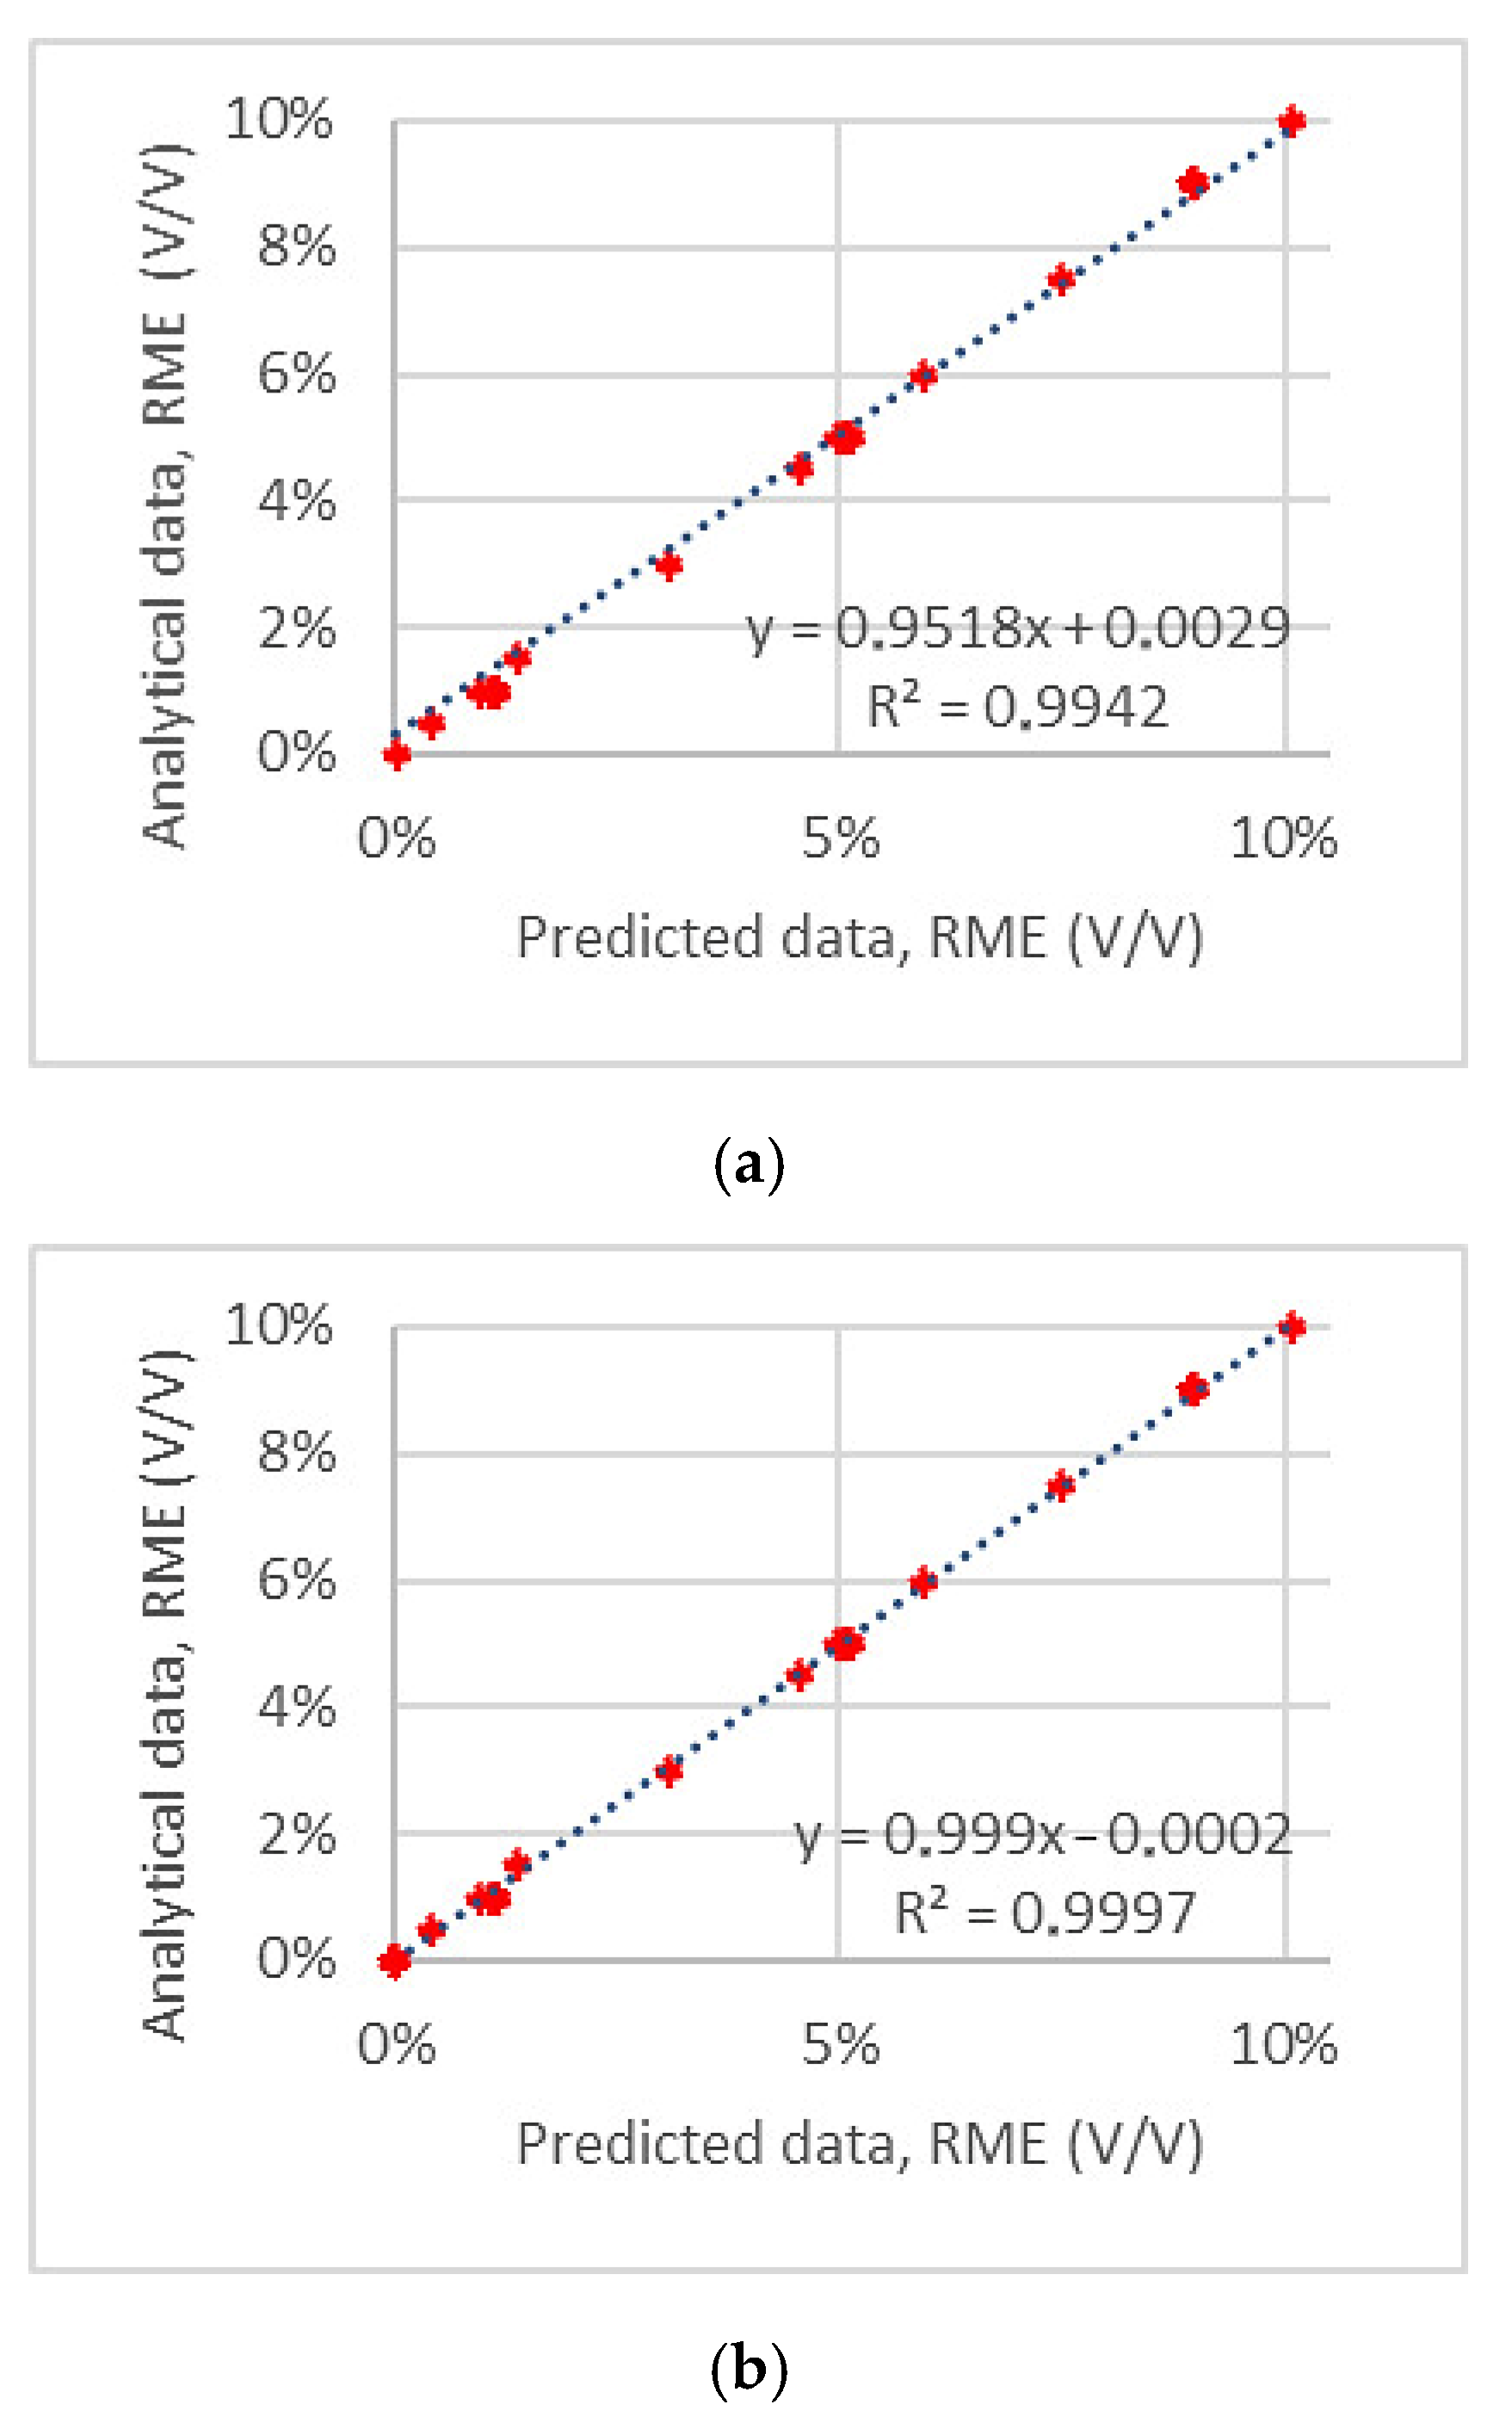
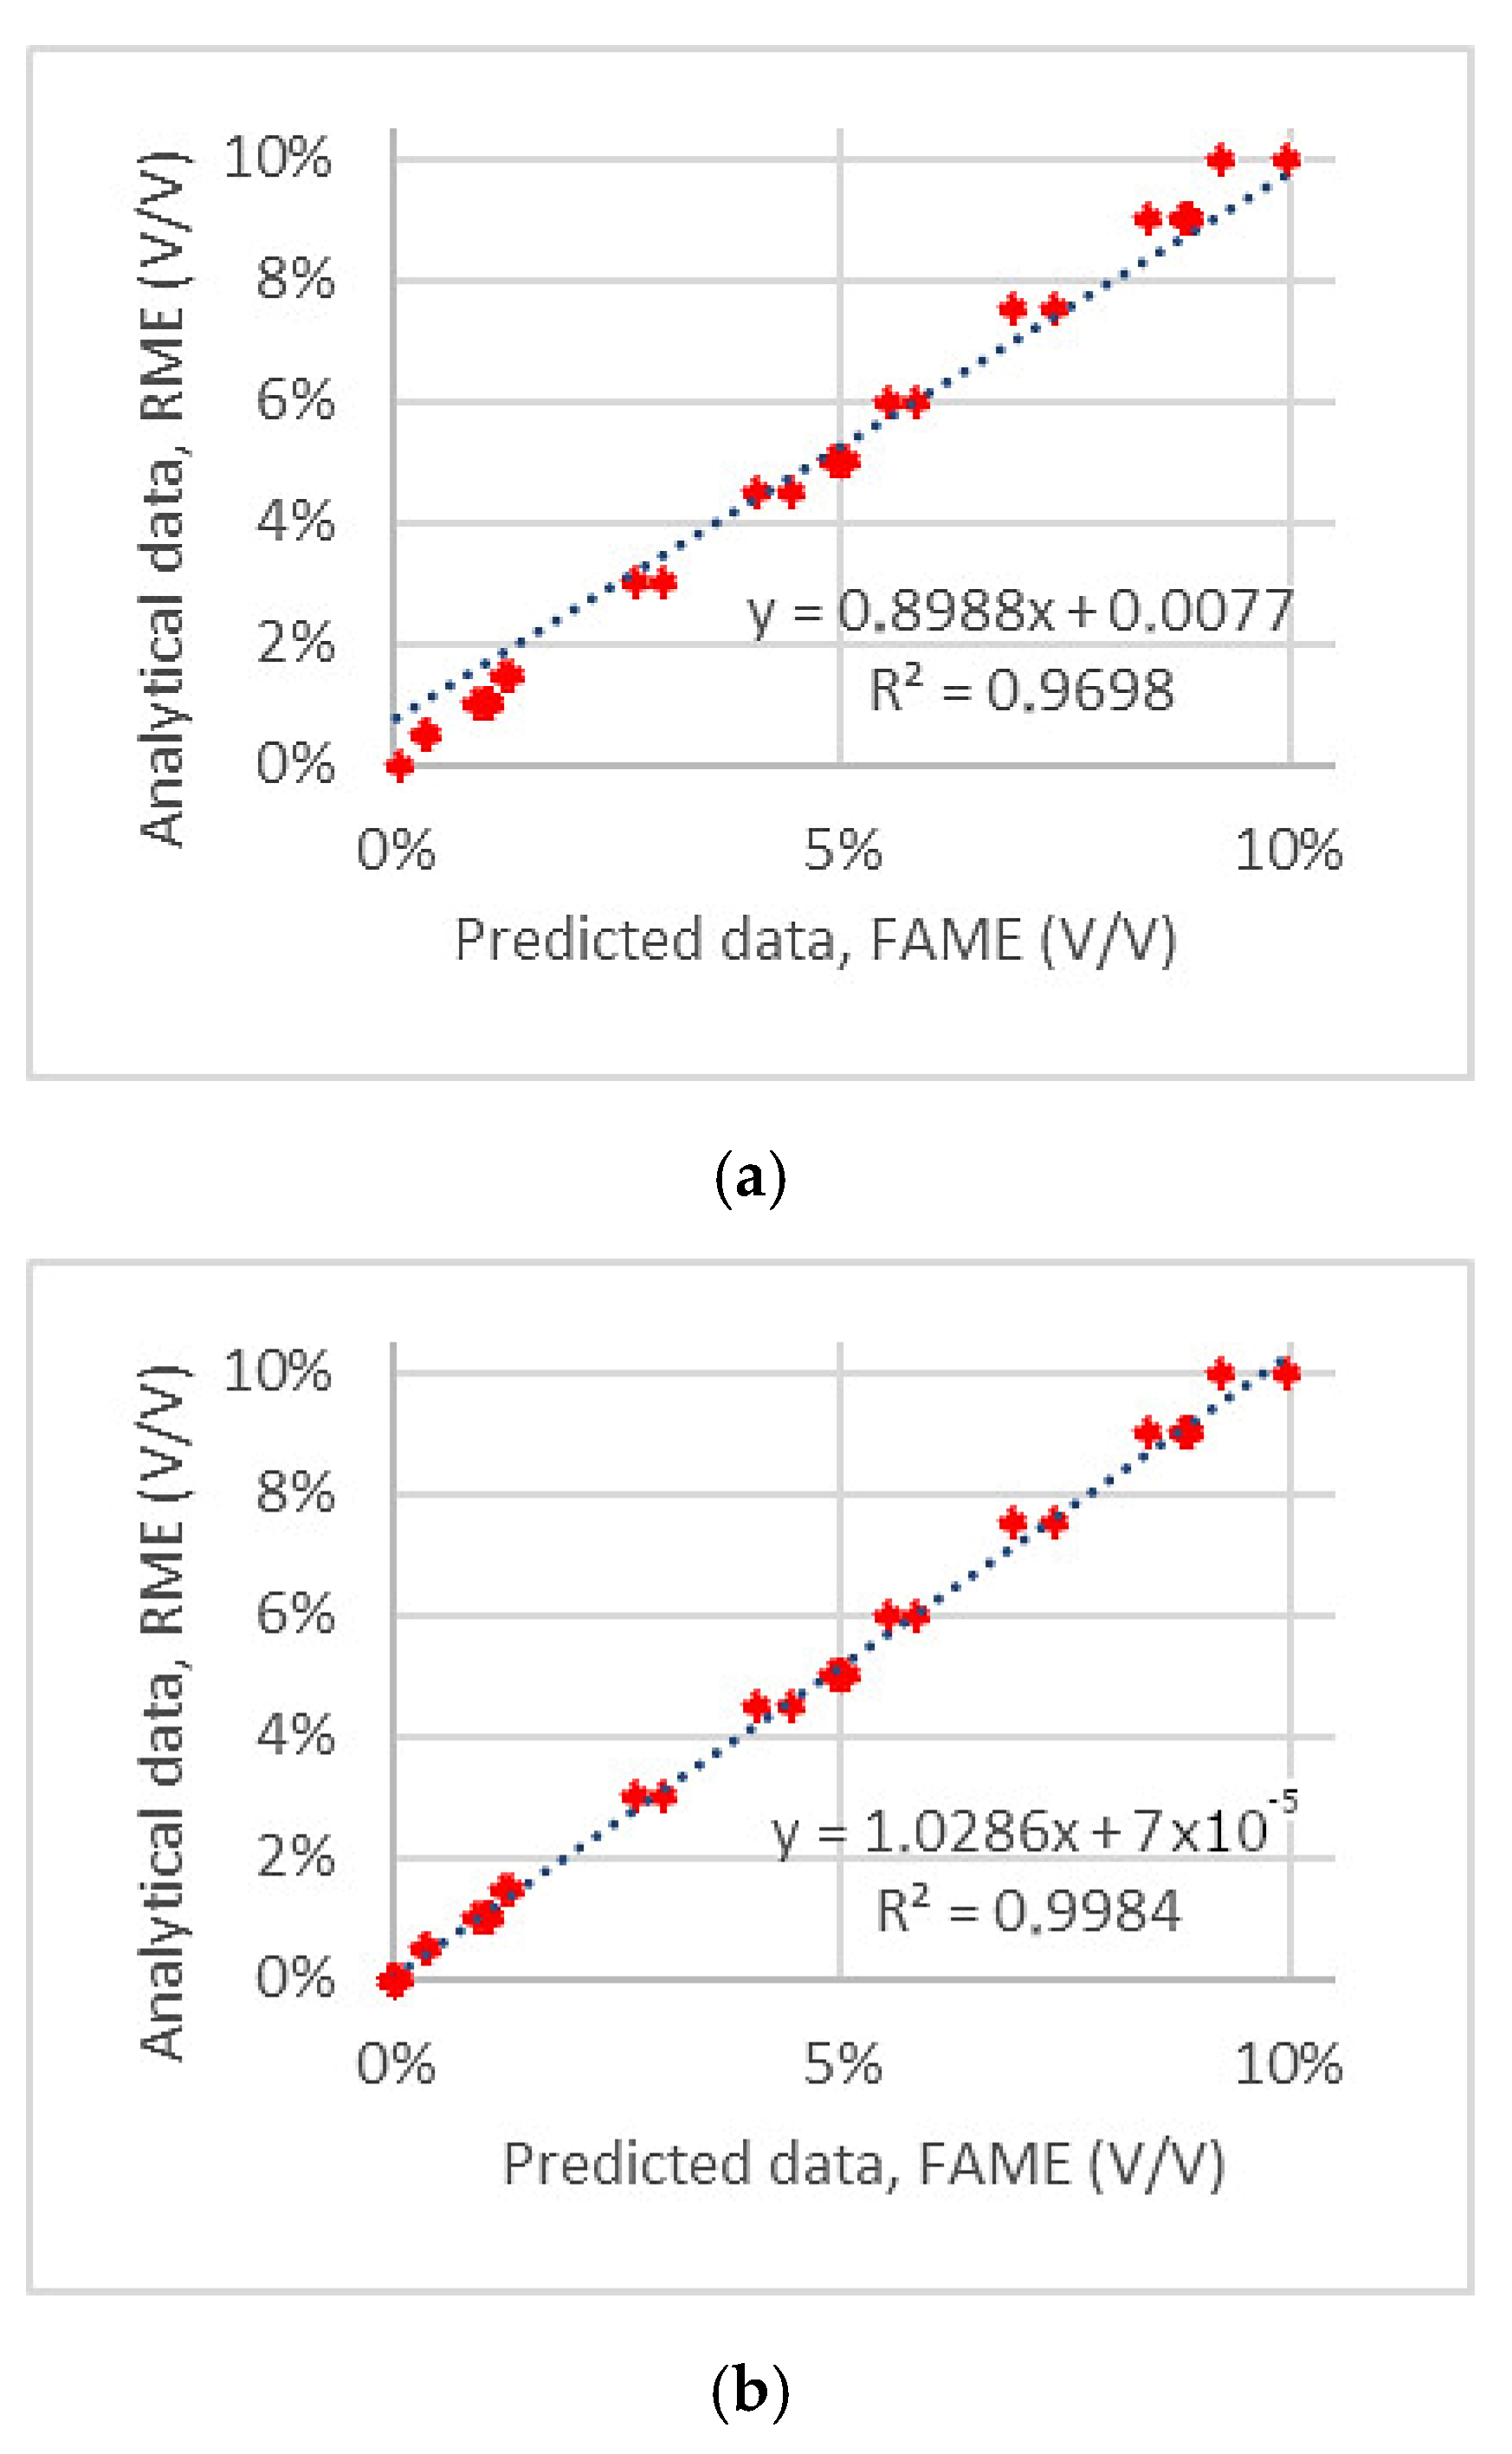
3.1. PLS Calibration Model Results for FAME Quantification, 0–10% (V/V)

The chosen PLS component numbers for FAME quantification model were 5, 6 and 7, according to the PRESS and RMSECV values calculated for each component number during the cross-validation process, Figure 4. Then, each of the chosen component numbers were used for the constructed PLS model validation. Each group of the validation data set was tested separately, in order to analyze the model performance more descriptively and to identify a suitable component number for specific groups of diesel blends. After that, the final PLS component numbers were identified for predicting the biofuel content individually for each two diesel fuel blends groups, rapeseed origin FAME/Wood origin HVO (Bioverno) diesel blends and all diesel fuel blends, basing on the average validation results of each suitable set of the validation data. The FAME quantification PLS model results are presented in Table 2 and Table 3 and in Figure 5 and Figure 6.

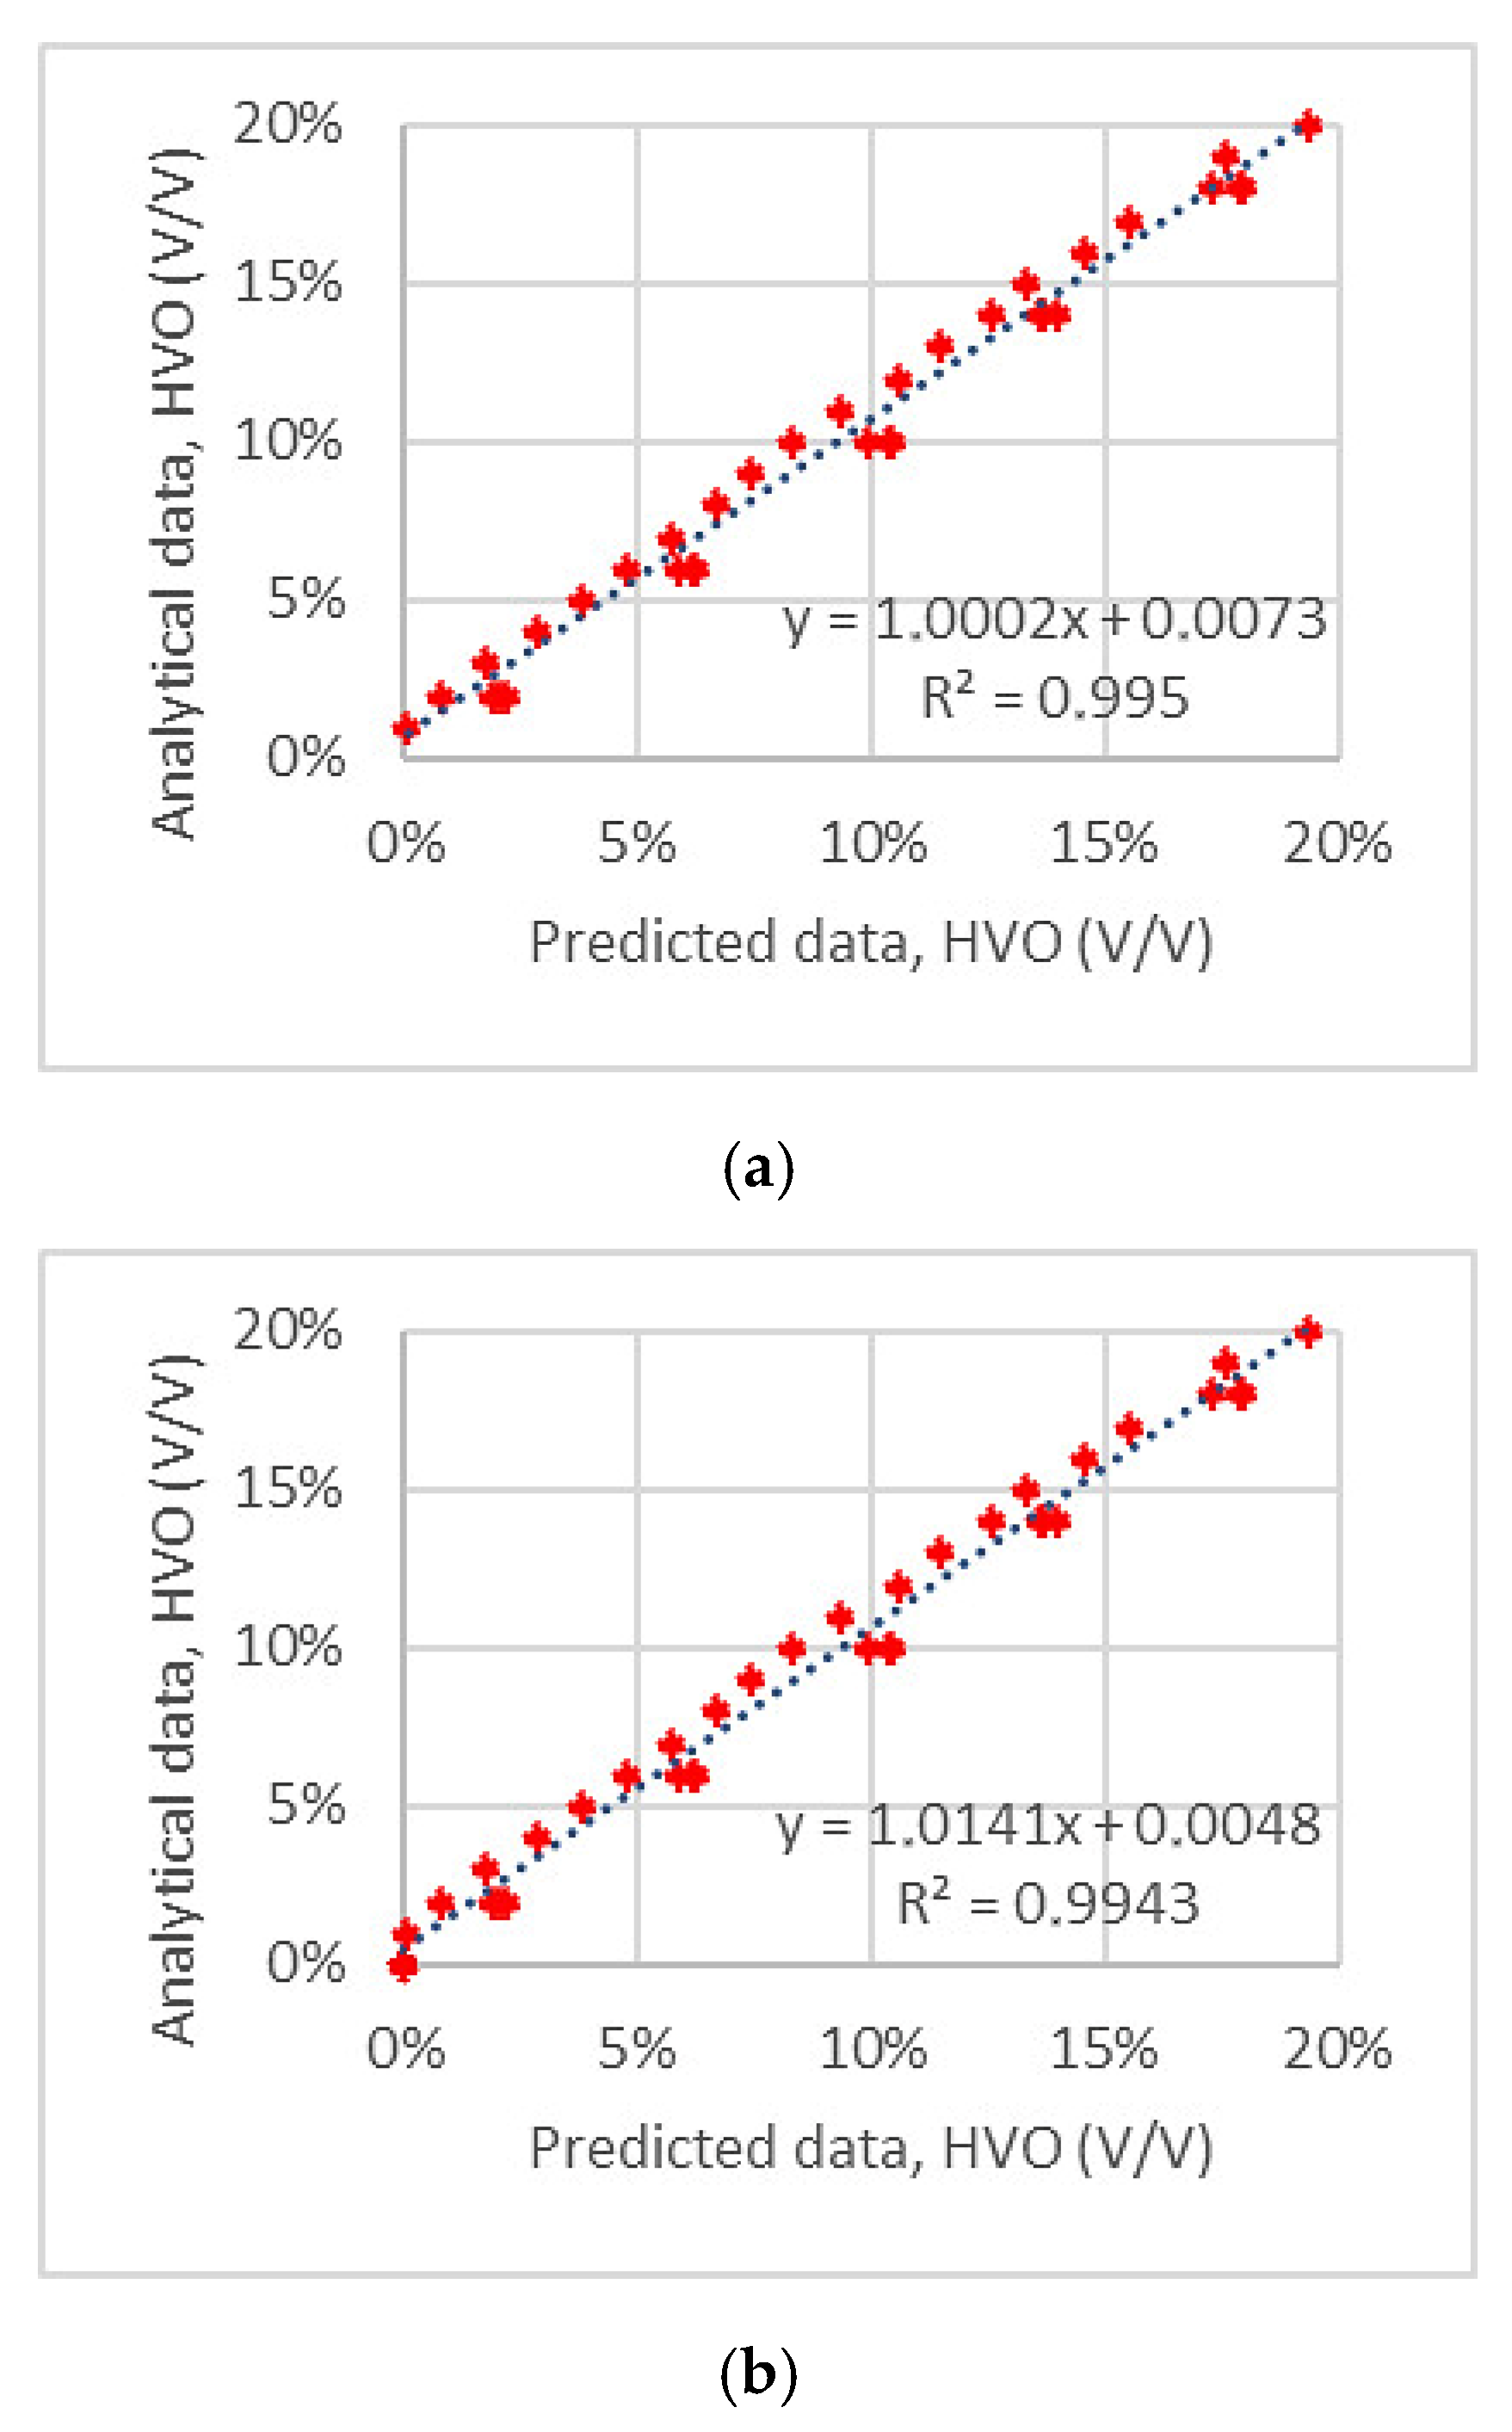
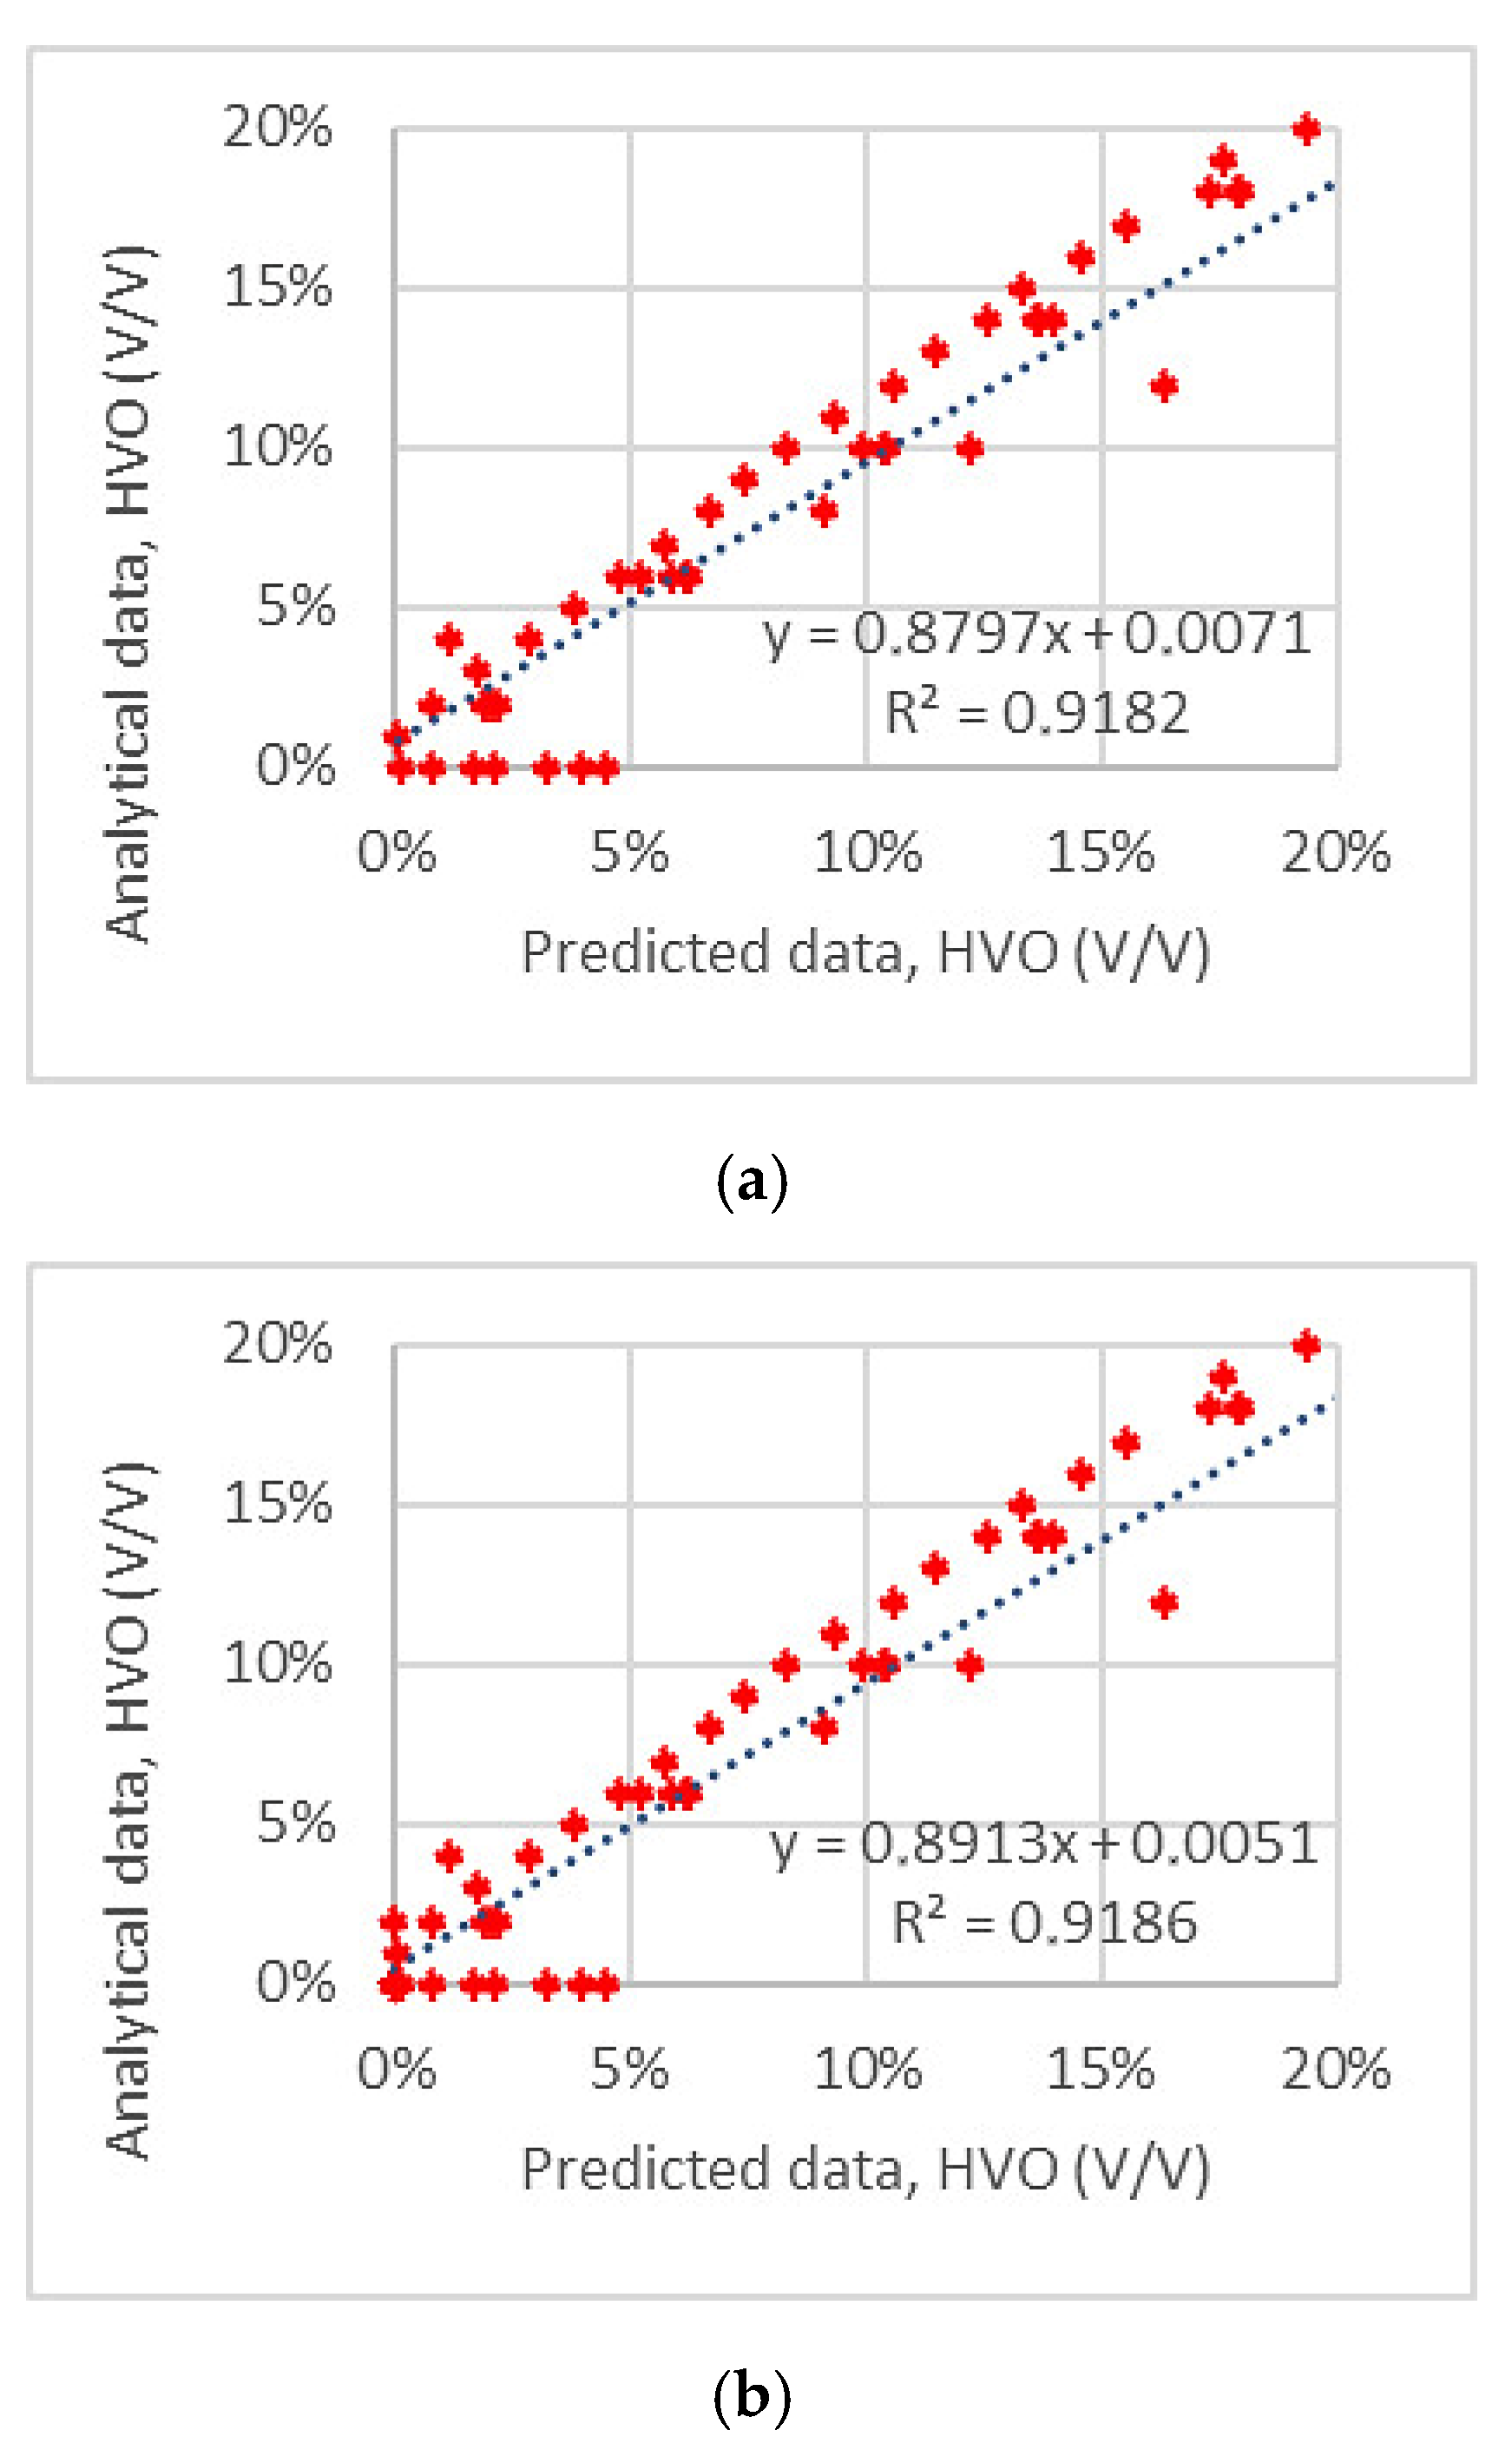
3.2. PLS Calibration Model Results for HVO Quantification, 0–20% (V/V)

A process similar to the FAME quantification PLS model calibration procedure was applied for the HVO quantification PLS model calibration. According to the cross-validation results illustrated in Figure 7, the chosen PLS component numbers were 4, 5, 6 and 7. Each of the chosen component numbers were used for the constructed PLS model validation. After that, the final PLS component numbers were identified for predicting the biofuel content individually for each two diesel fuel blends groups, rapeseed origin FAME/Wood origin HVO (Bioverno) diesel blends and all diesel fuel blends, based on the average validation results of each suitable set of the validation data. The HVO quantification PLS model results are presented in Table 4 and Table 5 and in Figure 8 and Figure 9.

4. Discussion

A lot of work and research have already been done concerning the infrared (IR) spectroscopy applications, including NIR, mid-infrared (MIR) and Fourier transform infrared (FT-IR) spectroscopy, for biodiesel/fossil diesel fuels blends analysis applying different multivariable calibration methods. The diesel fuel blend analysis has been focused individually on the biodiesel content quantification as well as in determination of the fuel blends adulterations and different physicochemical properties, such as density, flash point and others [24,25,26,27]. The calibration method, described in Alves and Poppi (2013), for particular biodiesel content determination, provided the RMSEP value of 0.11% (V/V) for 0–35% analytical range [24]. Palou, Miró and Blanco (2017) created a calibration method for more complex analysis. It comprised the determination of seven physicochemical properties of the diesel fuel blends including the FAME content. The archived RMSEP value for predicting the FAME content was 0.51% (V/V) for 0–15% analytical range [20].
In the current study, the described calibration method was developed to be able to analyze the biofuels contents in the different bio and diesel fuel blends. A near infrared Parafuel Quantum 1800 instrument was utilized for the task. The uniqueness of the developed method is the ability of achieving the reliable results independent of the complexity of the analyzed diesel blend sample. The structure of the constructed calibration set allows for overcoming the effect of the proportional influence of each biofuels’ NIR spectrum within the blend samples spectra. In addition, even though the usage of the PLS regression method is popular within the NIR spectroscopy applications, the developed calibration method for quantification of biodiesel and renewable diesel contents in diesel blend samples is not as common as the calibration methods for just the biodiesel content quantification. The calibration of FAME in all diesel blends was more accurate as the calibration for HVO, probably due to the chosen fuel content. The maximum concentration of the FAME was 10% (V/V) while it was 20% (V/V) for the HVO. It seems that the model overestimates the HVO concentrations as the percentages of these in the mixture increase. This error is not usually relevant in practice, as the properties of HVO are near to neat DFO.
By comparing the results of this work with the results of the similar studies performed by Alves and Poppi (2016), the accomplished calibration method results were assessed. The obtained RMSEP values for the calibration models achieved in that study were 0.53% (V/V) for renewable diesel quantification and 0.24% (V/V) for quantification of the biodiesel [27]. In the present study, the constructed PLS model for FAME quantification had better prediction properties for validation of both the samples with similar composition as the calibration data set (RMSEP = 0.06% (V/V)) and the sample with various composition (RMSEP = 0.18% (V/V)). However, the current PLS model for HVO quantification had larger estimated prediction errors for both the samples with similar composition as the calibration data set (RMSEP = 0.92% (V/V)) and the sample with various composition (RMSEP = 2.66% (V/V)).
One of the major aspects of improvement for the calibration method is adding the variety of biofuels into the calibration data set. As the calibration method was developed to analyze the biofuels’ content for all kinds of diesel blend samples, the accuracy of the created method is improved steadily with additional samples of various bio or renewable and fossil fuel blends. The larger the amount of various bio or renewable and fossil fuel blend samples are available for calibration, the better. Addition of various bio or renewable and fossil fuel blend samples improves the feasibility and robust characteristics of the created calibration method.
In engine experiments, development work and customer cases, it is important to know if the unknown diesel fuel contains FAME or HVO. In addition, the global trend appears to be that the share of bio and renewable fuels in fossil fuel blends increases. In certain sectors, there is already great interest in such fuels, e.g., B20 fuel, which contains 20% (V/V) of bio component, often FAME. Therefore, the calibration method should be further extended to also comprise the higher biofuel contents by enlarging the analytical ranges of both FAME and HVO relatively up to 25 to 30% (V/V).

5. Conclusions

In the current study, the described calibration method was developed to be able to analyze the biofuel contents in the different bio and diesel fuel blends. A near infrared Parafuel Quantum 1800 instrument was utilized for the task. The uniqueness of the developed method is the ability of achieving the reliable results while blending several biofuel types with petrol-based diesel fuel. The structure of the constructed calibration set allows for overcoming the effect of the proportional influence of each biofuels’ NIR spectrum within the blend samples spectra. The application of this method is useful in, e.g., engine development work and customer cases when there is an urgent need to know if the fossil diesel fuel contains FAME or HVO.
The main goal of this work was to create a practical application for an NIR spectrometer to be able to determine the bio content in various blends of fossil and renewable fuels. The method had to be fit to different types of biofuels. Based on the results of the present work, the following conclusions could be drawn:
The constructed PLS models for biofuels content quantification allows for measuring:
  • Biodiesel content in all diesel fuel blends within the range 0–10% (V/V) with estimated uncertainty predictions, expressed by root mean square error of prediction (RMSEP) value, of 0.18% (V/V);
  • Renewable diesel content in all diesel fuel blends within the range 0–20% (V/V) with estimated uncertainty predictions, RMSEP, of 2.66% (V/V).
The created calibration method is suitable for practical laboratory applications to identify the biofuels type and quantify their content in diesel fuel blends.
The calibration method can be further improved by developing a general calibration model for FAME and HVO content quantification. A wider variation of biofuels should be introduced to the calibration and validation data sets. The ranges of bio and renewable fuel contents in blends must also be extended along with the global trend of increasing share of those fuels.

Author Contributions

Conceptualization, S.H. and K.S.; Methodology, E.W.; Software, E.W.; Validation, E.W.; Formal Analysis, E.W. and P.V.; Investigation, E.W.; Resources, S.H., K.S. and S.N.; Data Curation, E.W.; Writing—Original Draft Preparation, E.W.; Writing—Review and Editing, P.V., S.H., K.S., S.N. and A.N.; Visualization, A.N.; Supervision, P.V. and S.N.; Project Administration, S.N.; Funding Acquisition, S.N. All authors have read and agreed to the published version of the manuscript.

Funding

This study was implemented within the Hercules-2 project. This work has received funding from the European Union’s Horizon 2020 research and innovation programme under grant agreement No 634135.

Institutional Review Board Statement

Not applicable.

Informed Consent Statement

Not applicable.

Data Availability Statement

MDPI Research DATA Policies.

Acknowledgments

The authors wish to thank Neste for delivering fossil and renewable diesel and UPM for delivering renewable diesel for research purposes. The authors also wish to thank Feora Oy for delivering animal fat methyl ester.

Conflicts of Interest

The authors declare no conflict of interest.

References

  1. European Standard EN590:2009 (E). Automotive Fuels—Diesel—Requirements and Test Methods. Available online: https://standards.iteh.ai/catalog/standards/cen/c3d8c75c-ea89-4b8a-afc3-0fb533afbc14/en-590-2009 (accessed on 28 April 2021).
  2. Knothe, G. Biodiesel and renewable diesel: A comparison. Prog. Energy Combust. Sci. 2010, 36, 364–373. [Google Scholar] [CrossRef]
  3. Hoekman, S.K.; Broch, A.; Robbins, C.; Ceniceros, E.; Natarajan, M. Review of biodiesel composition, properties, and specifications. Renew. Sustain. Energy Rev. 2012, 16, 143–169. [Google Scholar] [CrossRef]
  4. EN 14214:2012+A1:2014. Liquid Petroleum Products—Fatty Acid Methyl Esters (FAME) for Use in Diesel Engines and Heating Applications—Requirements and Test Method. Finnish Petroleum Federation. 2014. Available online: https://standards.iteh.ai/catalog/standards/cen/37635022-4dce-4dc4-b6a1-d9375012cc8a/en-14214-2012a1-2014-fpra2 (accessed on 28 April 2021).
  5. Neste Oyj. Neste Renewable Diesel Handbook; Neste Proprietary Publication: Espoo, Finland, 2016; pp. 7–8. Available online: https://www.neste.com/sites/default/files/attachments/neste_renewable_diesel_handbook.pdf (accessed on 28 April 2021).
  6. Pantoja, S.S.; da Conceição, L.R.V.; da Costa, C.E.; Zamian, J.R.; Filho, G.N.D.R. Oxidative stability of biodiesels produced from vegetable oils having different degrees of unsaturation. Energy Convers. Manag. 2013, 74, 293–298. [Google Scholar] [CrossRef]
  7. Can, Ö.; Öztürk, E.; Yücesu, H.S. Combustion and exhaust emissions of canola biodiesel blends in a single cylinder DI diesel engine. Renew. Energy 2017, 109, 73–82. [Google Scholar] [CrossRef]
  8. Niemi, S.; Vauhkonen, V.; Mannonen, S.; Ovaska, T.; Nilsson, O.; Sirviö, K.; Heikkilä, S.; Kiijärvi, J. Effects of wood-based renewable diesel fuel blends on the performance and emissions of a non-road diesel engine. Fuel 2016, 186, 1–10. [Google Scholar] [CrossRef]
  9. Ovaska, T.; Niemi, S.; Sirviö, K.; Nilsson, O.; Portin, K.; Asplund, T. Effects of alternative marine diesel fuels on the exhaust particle size distributions of an off-road diesel engine. Appl. Therm. Eng. 2019, 150, 1168–1176. [Google Scholar] [CrossRef]
  10. Câmara, A.B.; de Carvalho, L.S.; de Morais, C.L.; de Lima, L.A.; de Araújo, H.O.; de Oliveira, F.M.; de Lima, K.M. MCR-ALS and PLS coupled to NIR/MIR spectroscopies for quantification and identification of adulterant in biodiesel-diesel blends. Fuel 2017, 210, 497–506. [Google Scholar] [CrossRef]
  11. Palou, A.; Miró, A.; Blanco, M.; Larraz, R.; Gómez, J.F.; Martínez, T.; González, J.M.; Alcalá, M. Calibration sets selection strategy for construction of robust PLS models for prediction of biodiesel/diesel blends physicochemical properties using NIR spectroscopy. Spectrochim. Acta Part A Mol. Biomol. Spectrosc. 2017, 180, 119–126. [Google Scholar] [CrossRef] [PubMed]
  12. Cunha, C.L.; Torres, A.R.; Luna, A.S. Multivariate regression models obtained from near-infrared spectroscopy data for prediction of the physical properties of biodiesel and its blends. Fuel 2020, 261, 116344. [Google Scholar] [CrossRef]
  13. Vrtiška, D.; Simacek, P. Prediction of HVO content in HVO/diesel blends using FTIR and chemometric methods. Fuel 2016, 174, 225–234. [Google Scholar] [CrossRef]
  14. Feora. Alfa Laval Case Story Online. 2011. Available online: http://www.feora.fi/documents/alfalaval_artikel11.pdf (accessed on 26 April 2021).
  15. Neste. The NExBTL Process. 2021. Available online: https://www.neste.com/about-neste/innovation/nexbtl-technology#a6a086d0 (accessed on 26 April 2021).
  16. Geladi, P.; Kowalski, B.R. Partial least-squares regression: A tutorial. Anal. Chim. Acta 1986, 185, 1–17. [Google Scholar] [CrossRef]
  17. MATLAB Version: 8.1.0.604 R2013a. Available online: http://www.facebcok.blogspot.com/2013/04/mathworks-matlab-810604-r2013a-58-gb.html (accessed on 28 April 2021).
  18. Siesler, H.W. Introduction in Near-Infrared Spectroscopy: Principles, Instruments, Applications; Siesler, H.W., Ozaki, Y., Kawata, S., Heise, H.M., Eds.; WILEY-VCH Verlag GmbH: Weinheim, Germany, 2002; pp. 5–6. [Google Scholar]
  19. Metrohm, A.G. A Guide to Near-Infrared Spectroscopic Analysis of Industrial Manufacturing Processes; CH-9101: Herisau, Switzerland, 2013; pp. 11, 13–15. [Google Scholar]
  20. Gaydou, V.; Kister, J.; Dupuy, N. Evaluation of multiblock NIR/MIR PLS predictive models to detect adulteration of diesel/biodiesel blends by vegetal oil. Chemom. Intell. Lab. Syst. 2011, 106, 190–197. [Google Scholar] [CrossRef]
  21. Diaz, I. Estimator and Model Selection Using Cross-Validation in Handbook of Big Data; Bühlmann, P., Drineas, P., Kane, M., van der Laan, M., Eds.; Taylor & Francis Group, LLC: Abingdon, UK, 2016; p. 225. [Google Scholar]
  22. Heise, H.M.; Winzen, R. Chemometrics. In Near-Infrared Spectroscopy in Near-Infrared Spectroscopy: Principles, Instruments, Applications; Siesler, H.W., Ozaki, Y., Kawata, S., Heise, H.M., Eds.; WILEY-VCH Verlag GmbH: Weinheim, Germany, 2002; p. 134. [Google Scholar]
  23. Boysworth, M.K.; Booksh, K.S. Aspects of Multivariate Calibration Applied to Near-Infrared Spectroscopy. In Handbook of Near-Infrared Analysis, 3rd ed.; Burns, D.A., Ciurczak, E.W., Eds.; Arizona State University: Tempe, AZ, USA, 2007; pp. 220–221. [Google Scholar]
  24. Alves, J.C.L.; Poppi, R.J. Biodiesel content determination in diesel fuel blends using near infrared (NIR) spectroscopy and support vector machines (SVM). Talanta 2013, 104, 155–161. [Google Scholar] [CrossRef] [PubMed] [Green Version]
  25. Cunha, C.L.; Luna, A.S.; Oliveira, R.C.; Xavier, G.M.; Paredes, M.L.; Torres, A.R. Predicting the properties of biodiesel and its blends using mid-FT-IR spectroscopy and first-order multivariate calibration. Fuel 2017, 204, 185–194. [Google Scholar] [CrossRef]
  26. Sitoe, B.V.; Máquina, A.D.V.; De Santana, F.B.; Gontijo, L.C.; Santos, D.Q.; Neto, W.B. Monitoring of biodiesel content and adulterant presence in methyl and ethyl biodiesels of jatropha in blends with mineral diesel using MIR spectrometry and multivariate control charts. Fuel 2017, 191, 290–299. [Google Scholar] [CrossRef]
  27. Alves, J.C.L.; Poppi, R.J. Quantification of conventional and advanced biofuels contents in diesel fuel blends using near-infrared spectroscopy and multivariate calibration. Fuel 2016, 165, 379–388. [Google Scholar] [CrossRef]
Figure 1. NIR spectra of biodiesel (RME), renewable diesel (HVO, Bioverno) and fossil diesel fuel (DFO).
Fuels 02 00011 g001
Figure 2. Ternary plot of analytical values % (V/V) for calibration data set.
Fuels 02 00011 g002
Figure 3. The prediction error percentage when the sample temperature deviates from the calibration temperature for: (a)—the calibrated FAME quantification PLS model, (b)—the calibrated HVO quantification PLS model.
Fuels 02 00011 g003
Figure 4. Plot of FAME quantification PLS model performance values of cross validation versus the number of components: (a)—PRESS; (b)—RMSECV.
Fuels 02 00011 g004
Figure 5. Analytical concentration values of rapeseed origin FAME/Wood origin HVO (Bioverno) diesel blend validation samples versus predicted values using FAME quantification PLS model: (a)—PLS model predictions, (b)—PLS model prediction after truncating predicted negative concentrations to zeros.
Fuels 02 00011 g005
Figure 6. Analytical concentration values of all validation samples versus predicted values using FAME quantification PLS model: (a)—PLS model predictions, (b)—PLS model after truncating predicted negative concentrations to zeros.
Fuels 02 00011 g006
Figure 7. Plot of HVO quantification PLS model performance values of cross validation versus the number of components: (a)—PRESS; (b)—RMSECV.
Fuels 02 00011 g007
Figure 8. Analytical concentration values of rapeseed origin FAME/Wood origin HVO (Bioverno) diesel blend validation samples versus predicted values using HVO quantification PLS model: (a)—PLS model predictions, (b)—PLS model prediction with data interpretation.
Fuels 02 00011 g008
Figure 9. Analytical concentration values of all validation samples versus predicted values using HVO quantification PLS model: (a)—PLS model predictions, (b)—PLS model prediction with data interpretation.
Fuels 02 00011 g009
Table 1. Properties of the fuels.
PropertyUnitAFMERMEBiovernoNEXBTL *DFO (EN 590)
Density 15 °Ckg/m3880883813780820–845
Viscosity 40 °Cmm2/s4.464.493.503.002.00–4.50
Flash point°C>1201706270>55
Water contentppm537<30<30<30<200
CFPP°C2−14−8−5+5…−20
Cetane number 64546580>51
OSIh212-->20
* NExBTL diesel product information.
Table 2. FAME quantification PLS model results; rapeseed origin FAME/Wood origin diesel blends. Rapeseed origin FAME/Wood origin HVO (Bioverno) diesel blends.
ModelCNUMRMSECVRMSEPPRESS (v)R2
RPLS model70.16%0.36%0.0005450.9942
PLS model (truncating negative values)70.16%0.36%0.0000160.9997
Table 3. FAME quantification PLS model results; all diesel blends. All diesel blends.
ModelCNUMRMSECVRMSEPPRESS (v)R2
RPLS model60.17%0.91%0.0049960.9698
PLS model (truncating negative values)60.17%0.18%0.0002030.9984
Table 4. HVO quantification PLS model results; rapeseed origin FAME/Wood origin diesel blends. Rapeseed origin FAME/Wood origin HVO (Bioverno) diesel blends.
ModelCNUMRMSECVRMSEPPRESS (v)R2
RPLS model50.80%0.97%0.0040160.9950
PLS model (truncating negative values)50.80%0.92%0.003620.9943
Table 5. HVO quantification PLS model results; all diesel blends.
ModelCNUMRMSECVRMSEPPRESS (v)R2
RPLS model50.80%2.70%0.0405020.9182
PLS model (truncating negative values)50.80%2.66%0.0433160.9186
Publisher’s Note: MDPI stays neutral with regard to jurisdictional claims in published maps and institutional affiliations.

