
Channel Modeling for In-Body Optical Wireless Communications †
by
 , , and
Stylianos E. Trevlakis
1,* ,
,
Alexandros-Apostolos A. Boulogeorgos
2,
Nestor D. Chatzidiamantis
1 and
George K. Karagiannidis
1 1
Department of Electrical and Computer Engineering, Aristotle University of Thessaloniki, 54124 Thessaloniki, Greece
2
Department of Digital Systems, University of Piraeus, 18534 Piraeus, Greece
*
Author to whom correspondence should be addressed.
†
This paper is an extended version of our paper published in part at the 10th International Conference on Modern Circuits and Systems Technologies (MOCAST), Thessaloniki, Greece, 5–7 July 2021.
Telecom 2022, 3(1), 136-149; https://0-doi-org.brum.beds.ac.uk/10.3390/telecom3010009
Submission received: 3 November 2021
/
Revised: 17 January 2022
/
Accepted: 27 January 2022
/
Published: 4 February 2022
(This article belongs to the Special Issue Modern Circuits and Systems Technologies on Communications 2021)
Abstract
:Next generation in-to-out-of body biomedical applications have adopted optical wireless communications (OWCs). However, by delving into the published literature, a gap is recognized in modeling the in-to-out-of channel, since most published contributions neglect the particularities of different types of tissues. In this paper, we present a novel pathloss and scattering models for in-to-out-of OWC links. Specifically, we derive extract analytical expressions that accurately describe the absorption of the five main tissues’ constituents, namely fat, water, melanin, and oxygenated and de-oxygenated blood. Moreover, we formulate a model for the calculation of the absorption coefficient of any generic biological tissue. Next, by incorporating the impact of scattering in the aforementioned model, we formulate the complete pathloss model. The developed model is verified by means of comparisons between the estimated pathloss and experimental measurements from independent research works. Finally, we illustrate the accuracy of the proposed model in estimating the optical properties of any generic tissue based on its constitution. The extracted channel model is expected to enable link budget analysis, performance analysis, and theoretical framework development, which will boost the design of optimized communication protocols for a plethora of biomedical applications.
1. Introduction
The dawn of the sixth generation (6G) wireless communication era comes with the promise of enabling revolutionary multi-scale applications [1]. An indicative example is in-to-out-of-body biomedical applications [2]. Beyond the technical requirements, such as high reliability and energy efficiency and low power consumption and latency, they need to invest in wireless technologies that, on the one hand allow compact deployments, while on the other soothe possible safety concerns.
The reliability, speed, energy efficiency, and latency of optical wireless communications (OWCs) in biomedical applications have been accurately quantified and experimentally verified over the last decade, and a great amount of research effort has been devoted towards optimising in-body OWC systems [3,4,5,6,7]. The current state-of-the-art system would greatly benefit from an accurate pathloss model capable of incorporating any generic tissue’s characteristics.
Motivated by this, several researchers turned their eyes to OWCs for biomedical applications. Specifically, [8,9,10] investigated the optical properties of human brain tissue at various ages in the visible spectrum. Additionally, in [11,12], the optical characteristics, as well as the mineral density of the bone tissue, was measured in the range from 800 to . Moreover, the authors in [13,14,15] performed experiments in order to measure the optical properties of human female breast tissues in multiple wavelengths and over different distances, while, in [16,17,18], the optical properties of both healthy and cancerous skin were studied in the visible and near-infrared spectral range. From the aforementioned works, it is observed that the majority of published works have focused on quantifying the optical characteristics of specific tissues at certain wavelengths [8,9,10,11,12,13,14,15,16,17,18]. Despite the significance of these results, they cannot always be exploited from future researchers due to the fact that they may not include all the necessary wavelengths, while even if the desired wavelength is available, the constitution of a tissue is different enough between distinct individuals that the results cannot be regarded as confident.
A method that estimates the optical properties of any generic tissue based on its constitution is required in order to aid the development of novel biomedical applications that utilise the optical spectrum for communication. As a result, specific formulas have been reported for the pathloss evaluation of a generic tissue that take into account the variable amounts of its constituents (i.e., blood, water, fat, melanin) but require their optical properties at the exact transmission wavelength, which hinders the use of these formulas [19,20]. The development of such a method will open the road towards not only the theoretical analysis of in-to-out-of body OWC links but also the design of novel transmission and reception schemes, as well as scheduling and routing techniques for next generation networks. Motivated by this, this work derives a novel mathematical model, which requires no experimental measurements for the calculation of the pathloss for in-body OWCs. In more detail, the technical contribution of this work is summarized as follows:
- The utilization of an ML-enabled mathematical framework for the extraction of analytical expressions for the absorption coefficients of the main constituents of tissues, namely oxygenated and de-oxygenated blood, water, fat, and melanin.
- Based on these expressions, we drew a general model that enabled the estimation of the absorption coefficient of any generic tissue (i.e., skin, muscle, etc.) based only on its constitution.
- The usability of this model was extended by incorporating the phenomenon of scattering in the analysis and, therefore, increasing the estimation accuracy of the attenuation due to the existence of generic tissues. This model is expected to have a great impact in the design and optimization of future medical devices that require the transmission of optical radiation inside the human body.
- We validated the extracted expression twofold. On the one hand, we fed experimental data into the ML algorithm to extract the mathematical expressions of the aforementioned coefficients and we drew the numerical results to visualize their performance. On the other hand, we compared the extracted numerical results against experimental data taken from different published papers and provided proof that they coincide. This twofold comparison illustrates the validity of the presented channel model.
- We provided the design with insightful discussions based on the pathloss variations, with regard to variable transmission wavelength, complex tissue types, and tissue thickness.
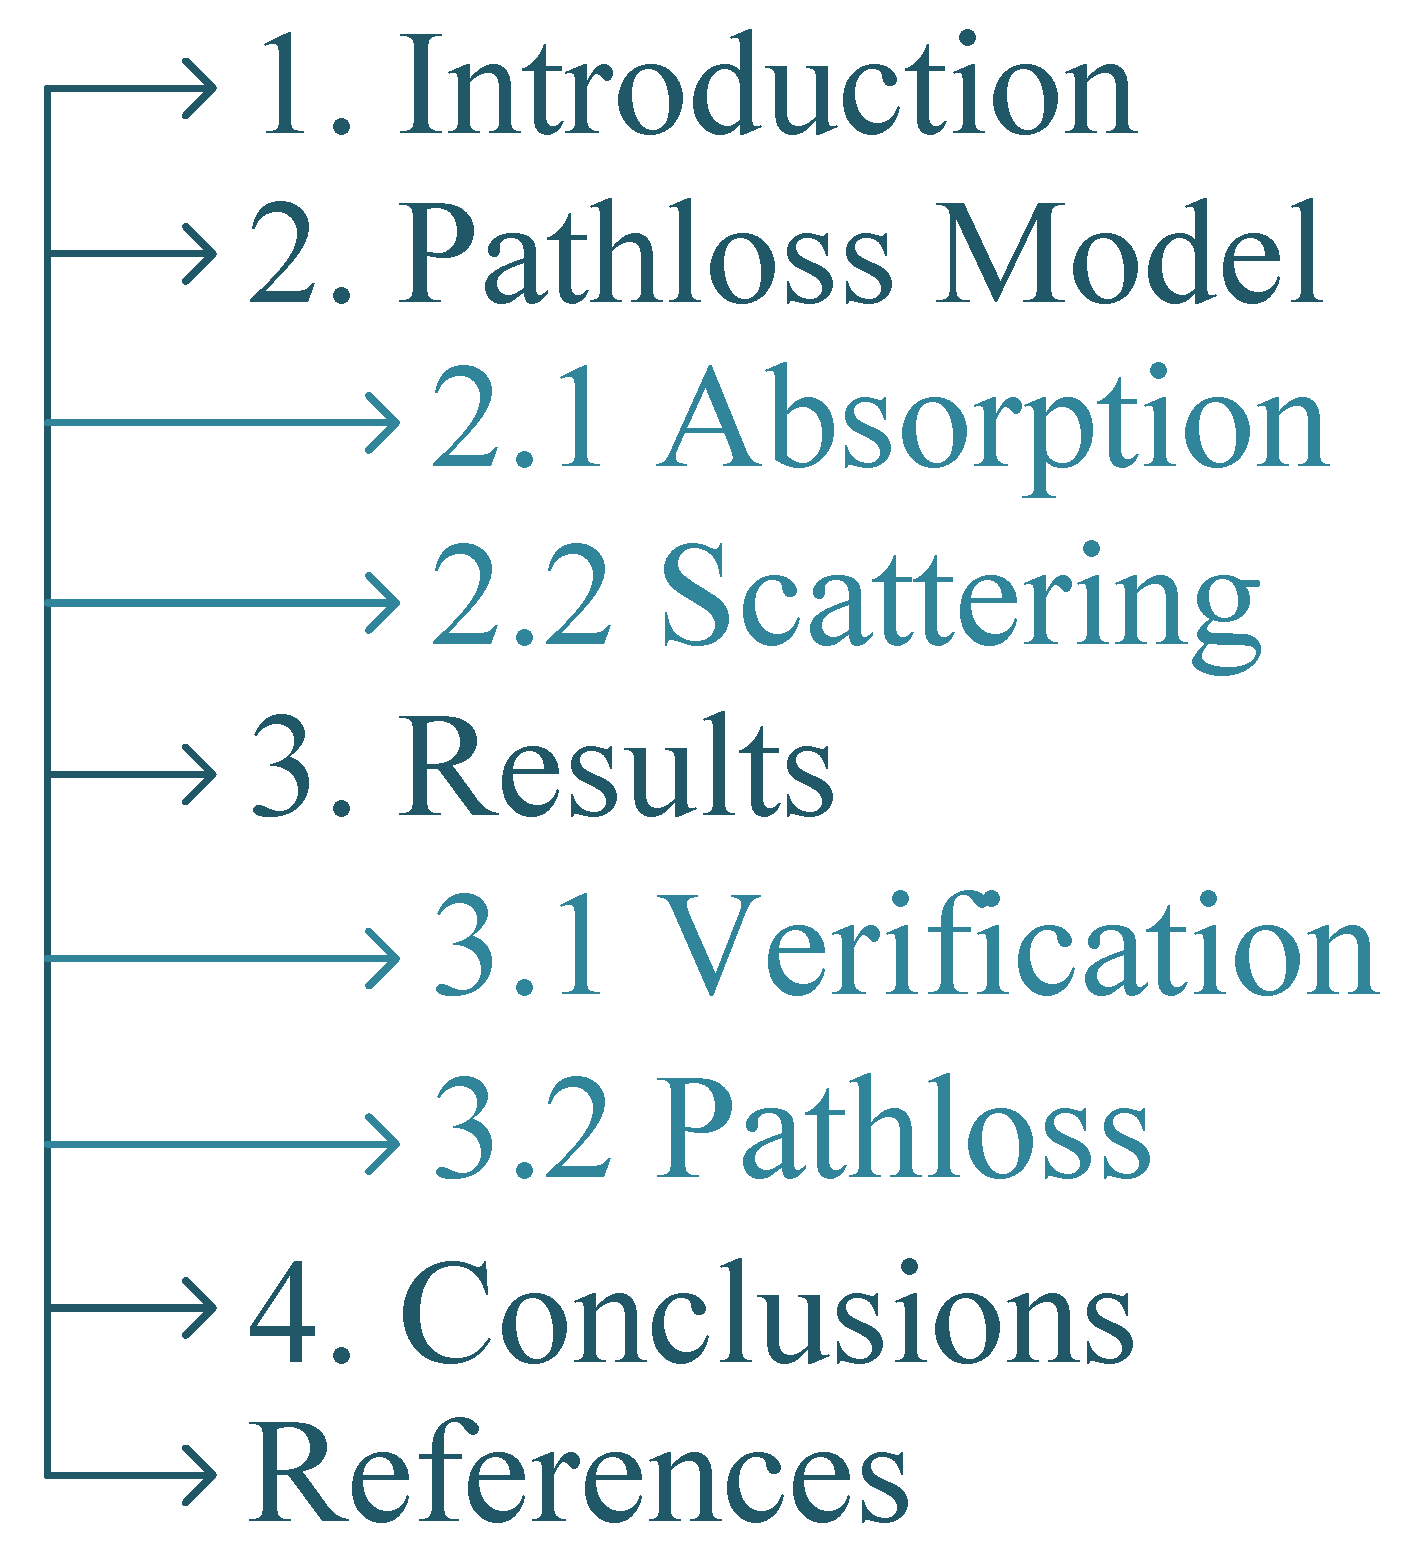
The organisation of this paper and a list of variables alongside their names are presented in Figure 1 and Table 1, respectively. In more detail, Section 2 is devoted to presenting the pathloss model based on the absorption and scattering properties of the constituents of any generic tissue. Section 3 presents respective numerical results that verify the mathematical framework and insightful discussions, which highlight design guidelines for communication protocols. Finally, future research directions are highlighted in Section 4, while closing remarks are summarized in Section 5.
2. Channel Model
The losses due the propagation of optical radiation through any biological tissue can be expressed based on classic OWC theory, as in [21].
where and represent the scattering and absorption coefficient, respectively, while is the propagation distance that is in the range of some mm in real world applications, such as cochlear, cortical, and retinal implants [22]. In addition, the TX and RX are placed at fixed positions and are characterized by high directivity. Therefore, the link under investigation can be regarded as line-of-sight (LoS). However, as discussed in Section 4, we aim to extend the current research to incorporate non-LoS scenarios, where diffusion plays an important role.
2.1. Absorption
The absorption coefficient can be modeled as
with T denoting the fraction of residual optical radiation at distance from the origin of the radiation. Thus, the fractional change of the incident light’s intensity can be written as in [23].
As a result, can be expressed as the sum of all of the tissue’s constituents, namely water, melanin, fat, and oxygenated and de-oxygenated blood. Thus, (2) can be analytically expressed as in [19].
where represents the absorption coefficient of the i-th constituent, while B, W, F, and M represent the blood, water, fat, and melanin volume fractions, respectively. Finally, S denotes the oxygen saturation of hemoglobin.
From (4), we observe that the absorption coefficients and volume fractions of each constituent are required in order to calculate the complete absorption coefficient of any tissue. At this point, it is essential to highlight the dependence of any tissue’s optical properties on the type of tissue, person, and even the procedure of collecting the sample, which hinders their mathematical modeling, despite the recent advances in optical measurement techniques. Although such variations are inherent characteristics of each individual and are subject to tissue preparation protocols, it has been proven in various past publications that they are mainly dependent on the wavelength of the transmitted optical radiation.
Based on the aforementioned, we utilised the non-linear regression-based machine learning algorithm presented in Algorithm 1 to derive analytical expressions for the absorption coefficients based on experimental datasets for each of the constituents [24]. In more detail, the experimental data of the absorption coefficient of water in [25,26,27] were used to extract a Fourier series that accurately describes the absorption coefficient as a function of the transmission wavelength, which can be written as:
Moreover, the analytical expressions of the absorption coefficients of oxygenated and de-oxygenated blood were fitted on the experimental results presented in [28,29,30,31] by using the sum of Gaussian functions and can be expressed as:
and
Furthermore, special attention is required for the appropriate preparation of fat tissue, which requires proper purification and dehydration before measuring its optical properties. As mentioned in [32], this necessary procedure can result in inconsistencies between different published works. To limit this phenomenon, we selected the measurements in [32] as they coincide with multiple published works in the visible spectrum. The extracted analytical expression of the absorption coefficient of fat can be written as a sum of Gaussian functions, as follows:
Note that the parameters of the aforementioned expressions are presented in Table 2. Finally, the absorption coefficient of melanin is highly consistent throughout various experimental measurements in the visible spectrum [19,33,34], based on which we write its analytical expression as:
with denoting the absorption coefficient of melanin at , which is equal to [34].
| Algorithm 1 ML-based fitting mechanism |
|
2.2. Scattering
The analysis so far neglects the effects of scattering on the propagation of the optical radiation through the human tissue. So far, the transmission distance, , was regarded as a single linear path through the material. However, when taking into account the optical scattering, it became the sum of all the paths between scattering events. The analytical evaluation of scattering is not well defined in the literature due to its stochastic nature, especially in diffuse reflectance geometries, such as the majority of tissues found inside the human body. In more detail, the scattering phenomenon can be decomposed into two factors, namely mean free path and phase function. The former represents the mean distance between two scattering instances, while the latter quantifies the stochastic change in direction of a photon when scattering occurs. Throughout the literature, the mean free path is represented as the inverted scattering coefficient, i.e., , which represents the probability of scattering as a function of the transmission distance. Furthermore, the scattering coefficient can be expressed in terms of the more tractable reduced scattering coefficient as
where g represents the anisotropy factor of the generic tissue. On the other hand, the stochastic behavior of the phase function can be mathematically defined based on Mie scattering theory.
Unlike absorption, there is no well-defined analytical relationship that can be used to define the spectral dependence of volume scattering. However, based on experimental observations and simplifying analysis of Mie scattering theory, there is a consensus that the reduced scattering coefficient can be modeled using a power law relationship, as in [19].
where denotes the reduced scattering coefficient at distance and is a dimensionless variable that provides an estimation of the average size of particles in the medium, for instance, if the tissue is composed of small sized particles, , which can be modeled as Rayleigh scattering. On the contrary, if larger particles exist in the tissue, approaches [35,36]. However, when a generic tissue is comprised of variable size particles, which is the most common case, the reduced scattering coefficient can be expressed, as in [21,32,37].
which corresponds to the combination of the two limiting cases, namely Rayleigh and Mie scattering, with denoting the fraction of Rayleigh scattering due to the existence of small sized particles.
3. Results
This section illustrates the performance of the model presented in Section 2. Initially, the extracted expressions for the absorption and scattering coefficients are verified by comparison with experimentally verified results from previously published works. Next, the accuracy of the extracted mathematical framework for estimating the optical properties of any generic tissue is validated against experimental measurements of complex biological tissues, such as skin, bone, breast, and brain tissue. Lastly, the complete pathloss for each of the aforementioned tissues is evaluated, and important design guidelines for communication protocols are derived through insightful discussions.
3.1. Verification
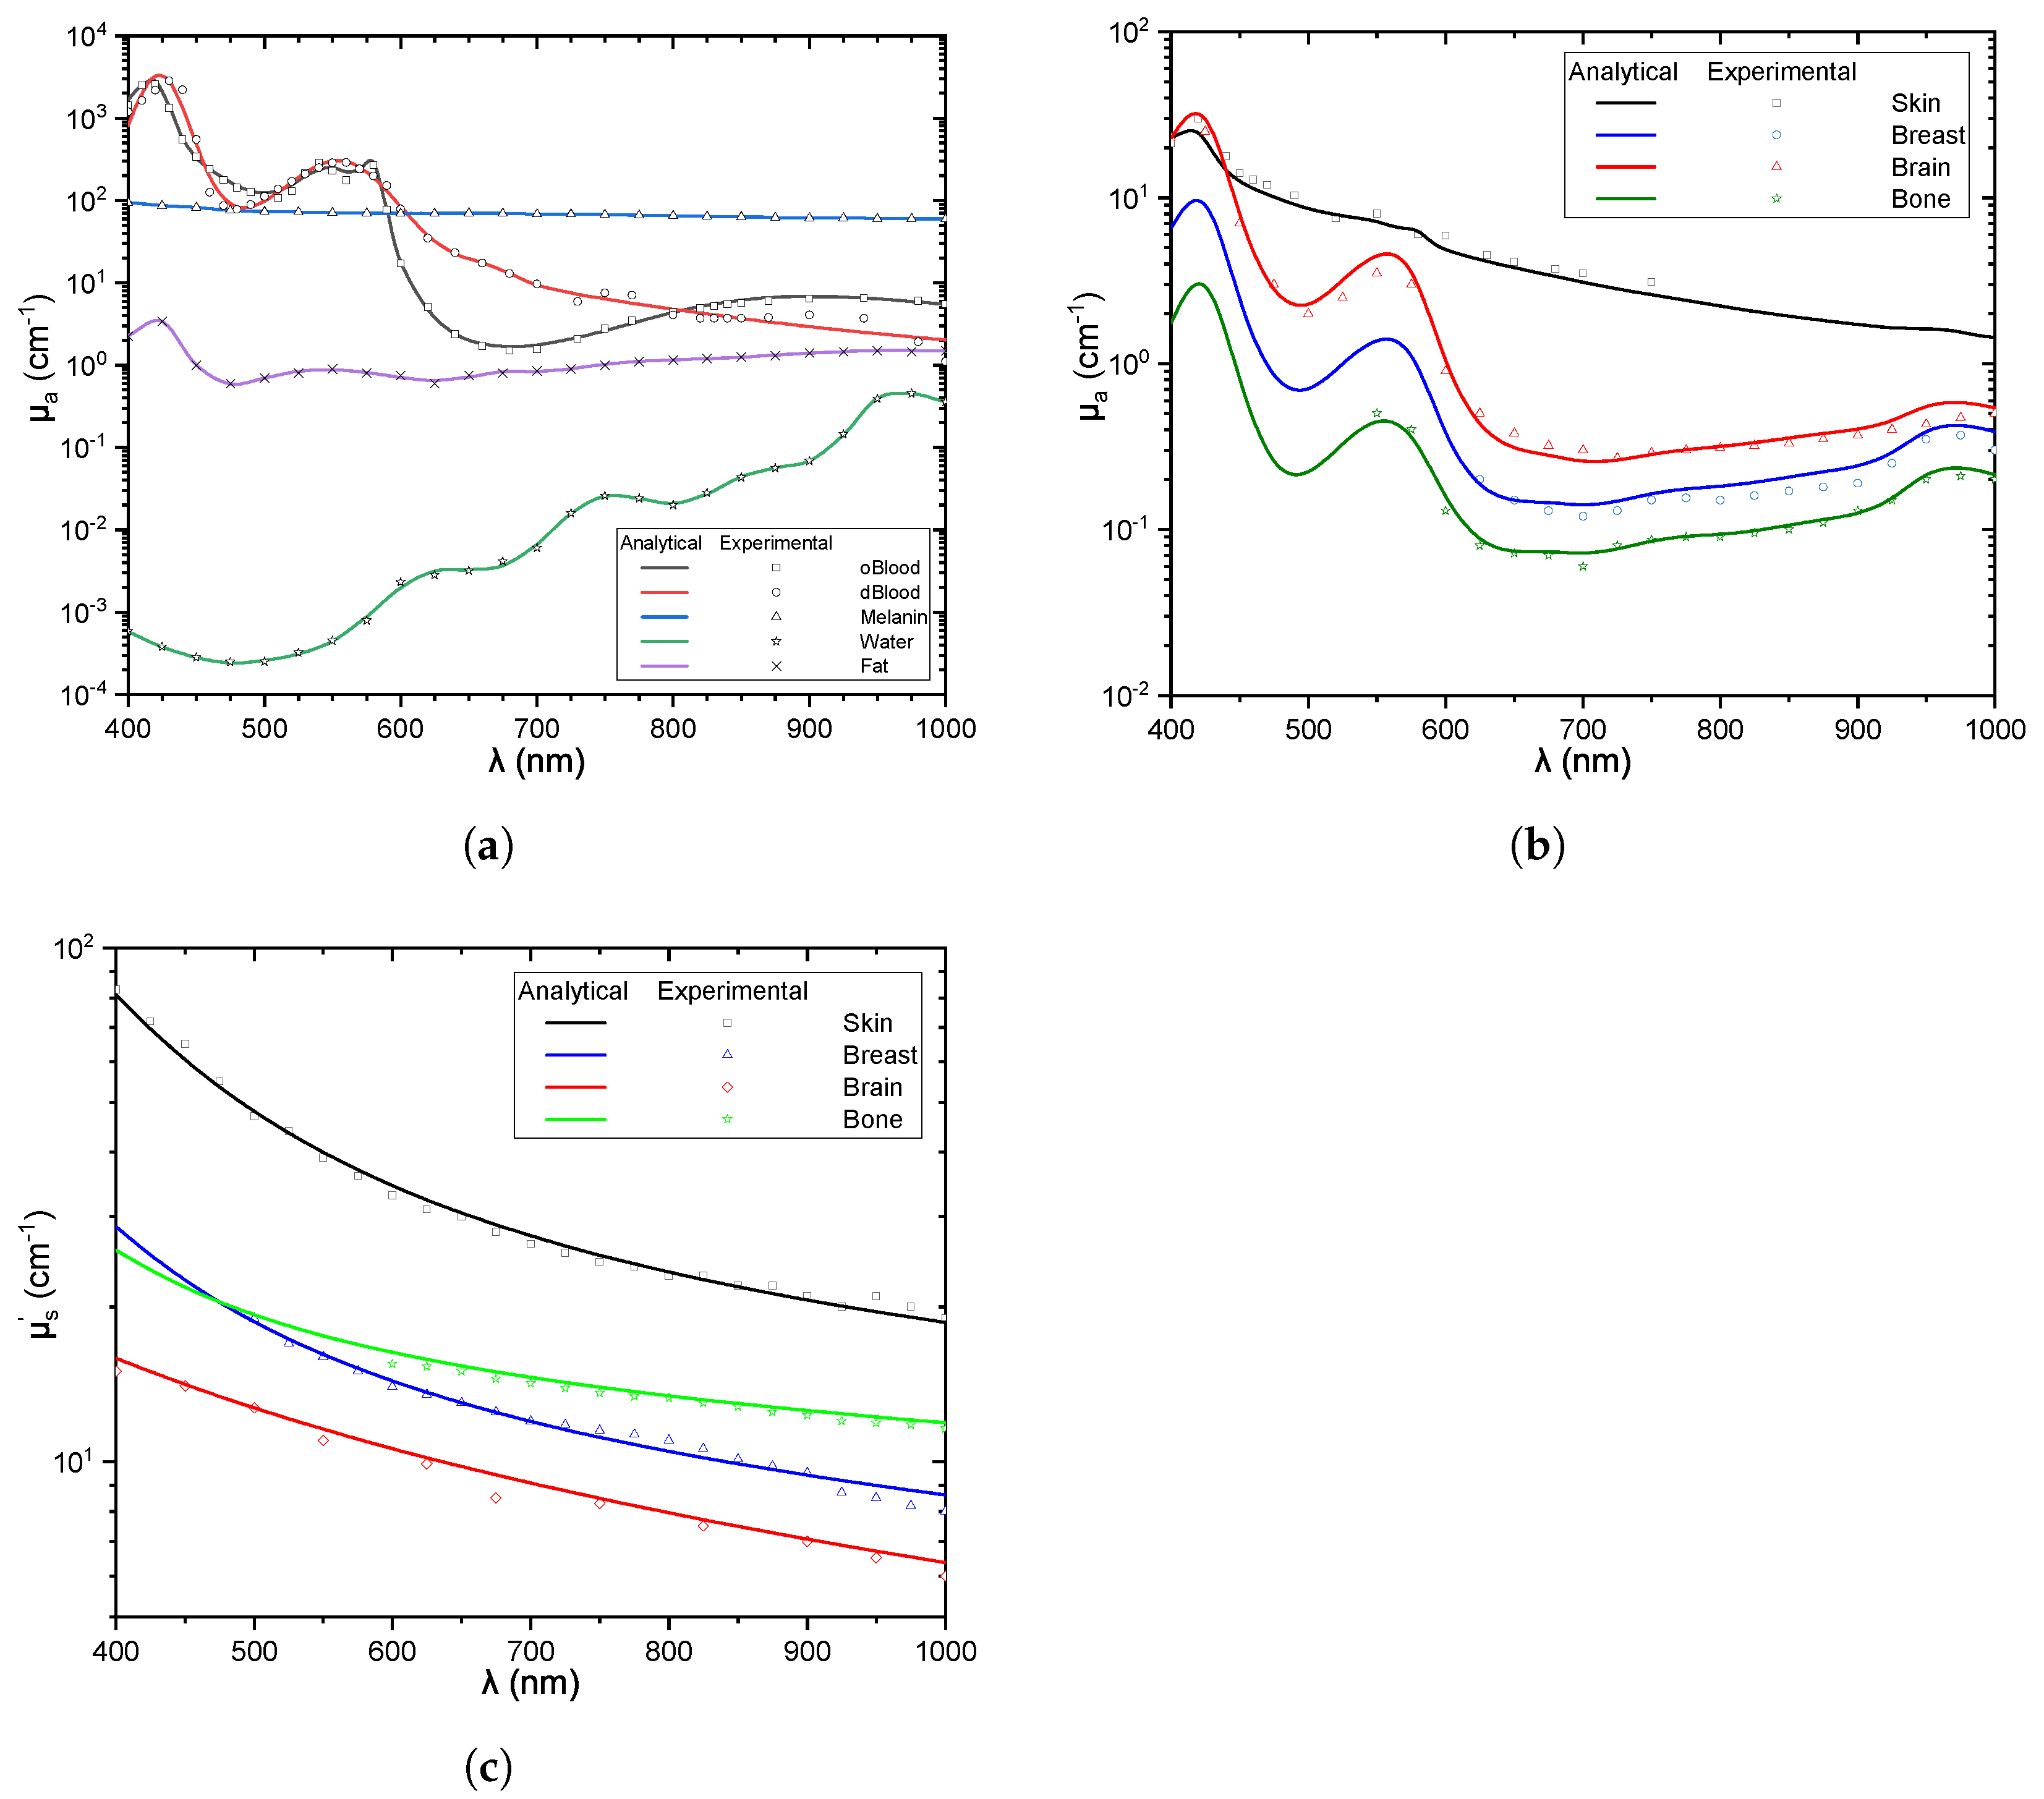
In this subsection, we verify the validity of the extracted analytical expressions presented in Section 2 by comparing them with experimentally verified data from published works. In the following figures, the analytical expressions and the experimental results are depicted as continuous lines and geometric symbols, respectively. Starting with Figure 2a, experimental data for the absorption coefficient of each constituent are plotted against the analytical results extracted from (6) through (9). In particular, the experimental data for the oxygenated and de-oxygenated blood, water, melanin, and fat are represented by square, circle, star, triangle, and cross symbols, respectively, while the corresponding analytical expressions are drawn in black, red, green, blue, and purple colors. The validity of the proposed framework is proven based on the fact that the analytical and experimental results coincide. Moreover, the absorption coefficient of blood is not only higher than the rest of the constituents, between 400 and , but is also among the most influential constituents regardless of the wavelength. Therefore, even with relatively low volume fraction, blood plays an important role in the total absorption coefficient of any generic tissue. Furthermore, it is evident that, as increases, the absorption coefficient increases as well, which highlights the importance of carefully selecting the transmission wavelength for tissues that are rich in water. In addition, the absorption of melanin is among the highest between the generic tissue constituents, as well as the most consistent. This illustrates the significance of the concentration of melanin in the tissue under investigation and, at the same time, the negligible effect of the transmission wavelength on the absorption due to melanin. Lastly, the absorption coefficient of fat has a somewhat stable impact throughout the visible spectrum due to the fact that it receives values around , with very small variations.
It should be highlighted that the volume fraction of any of the constituents plays a very important role in the final form of the absorption coefficient. For instance, if a tissue has a high concentration in water, the impact of its absorption coefficient after it is multiplied by the water volume fraction can affect the total absorption coefficient significantly, even if the absorption coefficient of water seems insignificant on its own. On the other hand, the impact of a constituent with high absorption coefficient, such as melanin, can be diminished if it has a low volume fraction. Thus, although the absorption coefficients presented in Figure 2a play an important role in determining which of them affect the total absorption coefficient of the generic tissue, it is not an absolute metric. The rest of this subsection illustrates the performance of the proposed mathematical framework by comparing the estimation of the absorption and scattering coefficients of complex human tissues with experimental results from the open literature.
Next, Figure 2b presents the absorption coefficients of complex tissues, such as skin, bone, brain, and breast, as a function of the transmission wavelength. The parameters that characterise the constitution of each tissue are provided in Table 3, alongside their sources. From Figure 2b, it can be observed that the analytical expression for the total absorption coefficient provide a very close fit to the experimental data, which not only verifies the extracted expressions but also complements the accuracy of the presented mathematical framework in describing the optical absorption in generic tissues. Moreover, the absorption coefficient of the skin has the most linear behavior out of all of the plotted tissues. This happens due to the increased concentration of melanin in the skin, which leads to increased absorption in higher wavelengths. In addition, the absorption coefficients of other tissues that are rich in blood and water bare a strong resemblance to the blood absorption coefficient in the region between 400 and , while the impact of water becomes visible after . The higher concentration of blood and water results in increased attenuation in the wavelengths, where each of them has relatively high absorption.
Figure 2c depicts the experimental data for the reduced scattering coefficient of each of the complex tissues, namely skin, bone, brain, and breast, against the analytical results extracted from (12). The experimental parameters for each of the tissues are available in Table 3, alongside their sources. This figure verifies the validity and accuracy of the extracted expressions for the reduced scattering coefficient due to the proved fact that they provide a very close fit to the experimental data. Furthermore, all of the reduced scattering coefficients not only exhibit a more linear behavior than the corresponding absorption coefficients, but also hold significantly higher values. This highlights the detrimental effect that scattering plays in the propagation of optical radiation through the human body. Moreover, it is evident that, as increases, the reduced scattering coefficient decreases, which suggests that, as we increase the transmission wavelength, the impact of scattering could prove to diminish. For example, for skin tissue, as rises from to , the reduced scattering coefficient decreases by . Finally, we observed that skin caused almost half an order of magnitude higher attenuation than the rest of the tissues under investigation, while brain tissue exhibited the lowest.
3.2. Pathloss
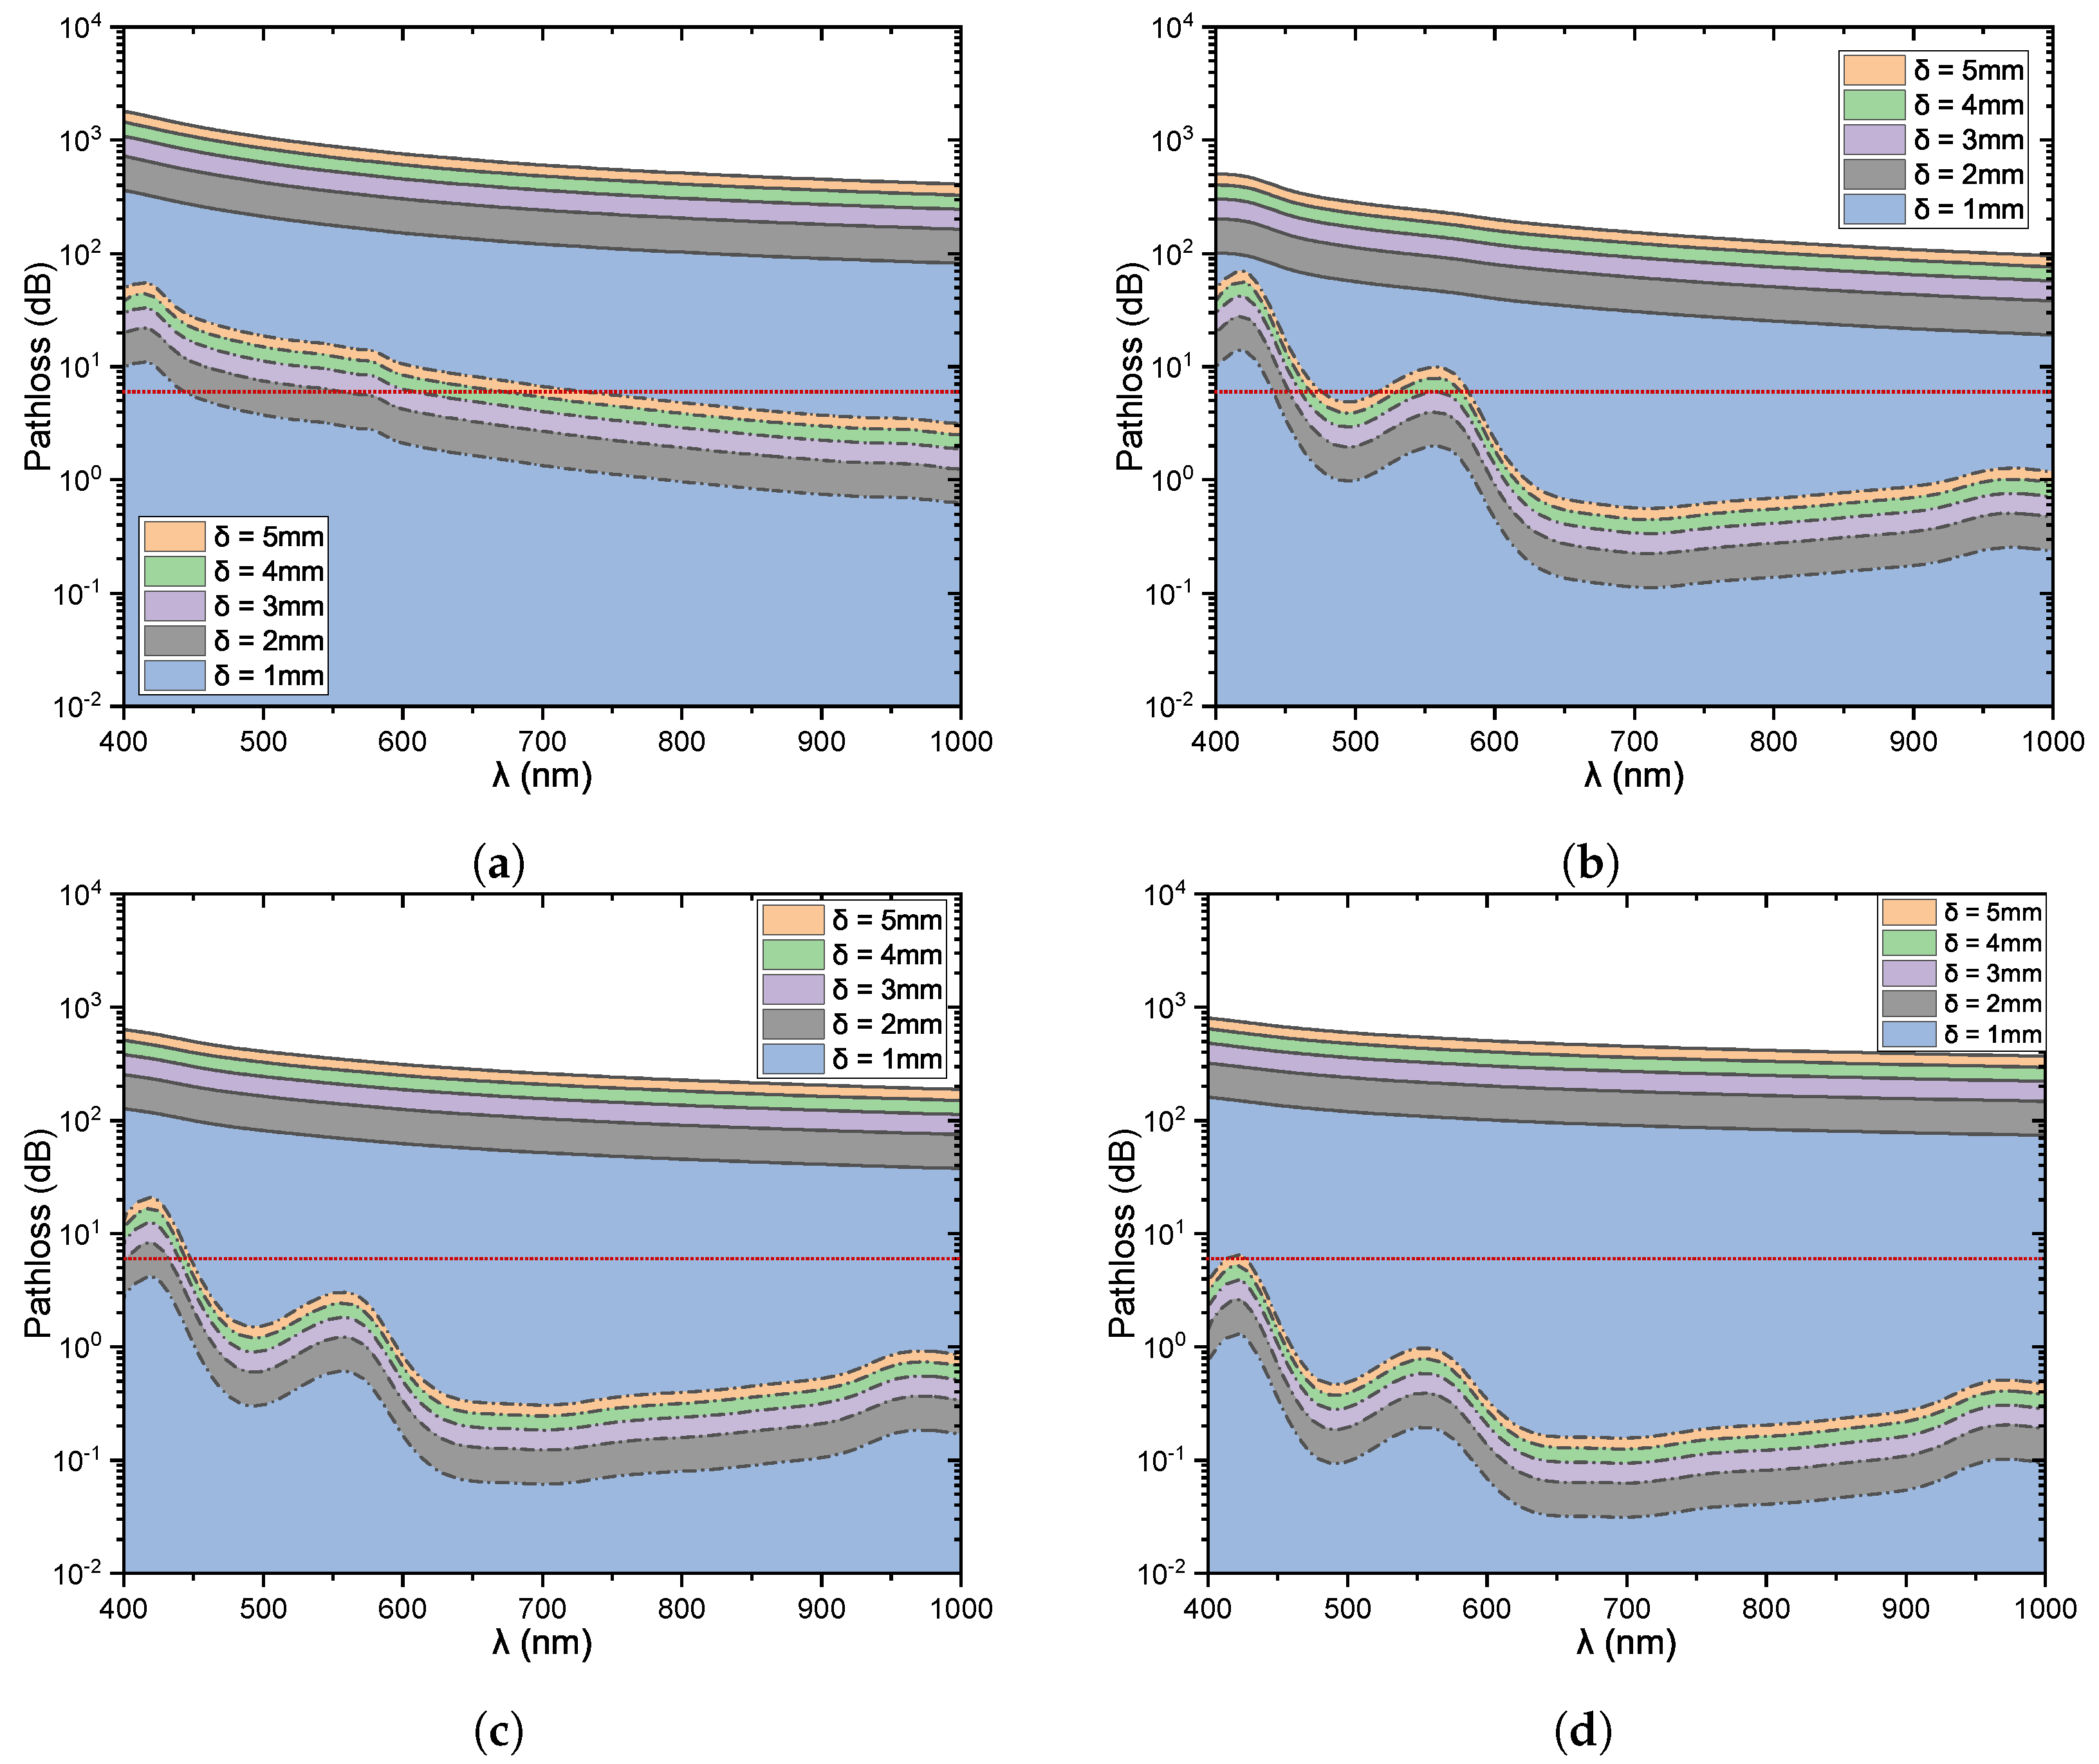
Based on the extracted accurate expressions for the reduced scattering and absorption coefficients of various complex tissues that take into account the particularities of the channel, we can estimate the pathloss. Therefore, Figure 3a depicts the pathloss as a function of the wavelength due to absorption and scattering in skin tissues with different values of thickness. In order to ensure a fair comparison between the plotted tissues, it is necessary to use the same tissue thickness, with the determining tissue being the skin, whose average thickness varies between and 4 mm [22]. Thus, we selected a slightly wider range of thickness for the analysis, i.e., 1–5 mm. Additionally, it is highlighted that, in order to increase the readability of Figure 3, the area below each line is depicted in a specific color that corresponds to a specific skin thickness value. From this figure, it is evident that the complete pathloss (continuous line) decreased with the wavelength and increased with the skin thickness, while the pathloss due to absorption (dashed line) had more fluctuations throughout the visible spectrum. In more detail, we observed that the optimal wavelength was . Furthermore, in the following, we assumed a transmission window to be the spectrum region where the pathloss did not exceed (red dotted line), i.e., the residual optical signal was at least a quarter of the transmitted signal. Thus, for , a transmission window existed for wavelength values higher than , which shrank as the transmission distance increased. For instance, for it reduced to wavelengths higher than , while for , it became even smaller. On the other hand, when taking into consideration the scattering coefficient, the complete pathloss exhibited a more linear behavior. Specifically, the impact of scattering in the propagation of light through biological tissues was approximately two orders of magnitude higher than that of the absorption, which constitutes the dominant phenomenon concerning the optical transmission. For example, if we assume and , the scattering coefficient exceeds 100 times, while for , is 125 times higher. As a result, it is obvious that the absorption coefficient decreases with an increased rate compared to .
Figure 3b illustrates the pathloss due to the existence of brain tissue as a function of the wavelength for different values of . As expected, for higher values of , the pathloss was also higher, while the behavior of pathloss for wavelength variations was not linear. For example, as increased from 500 to the pathloss increased, and while for the same increased from 550 to , pathloss decreased. Additionally, the optimal transmission wavelength was . In addition, two transmission windows existed for . The first was between 450 and , while the second was after . However, as the transmission distance increased, only the second window was valid. Furthermore, when taking into consideration the effect of scattering, the complete pathloss took much higher values and the fluctuations of the absorption became almost obsolete, with its impact being visible only in the 400 to range. By observing Figure 3b, it became evident that the impact of varied greatly with the wavelength, which resulted in fluctuations of the relation between and . For instance, for , as increased from 400 to , the relation between the scattering and absorption coefficient increased from to .
In Figure 3c, the pathloss for transmission through breast tissue is presented with regard to the transmission wavelength for various values of tissue thickness. When taking into account only the absorption phenomenon, it was evident that, as the increased, the pathloss increased as well. On the contrary, the wavelength influenced the pathloss in a non-linear manner. Additionally, a single transmission window was observed for all the plotted values of for wavelengths higher than . Although the optimal transmission wavelength for breast tissue with regard to the absorption was , after introducing the scattering coefficient into the analysis, the complete pathloss exhibited an almost linear behavior and the optimal wavelength shifted to . The increased impact of varied between 1 and 3 orders of magnitude more than the absorption coefficient’s impact. Specifically, for and , was approximately 33 times higher than , while for , it was 600 times higher.
Finally, Figure 3d depicts the pathloss through bone tissue as a function of the transmission wavelength for various transmission distance values. Yet again, pathloss increases with tissue thickness, while its behavior, with regard to , depends. The optimal for transmission through bone tissue is . For the plotted values, only one transmission window exists for higher than , while for higher values, two transmission windows can be formed. For example, the first window was between 475 and , while the second was in the range of 600–950 nm. However, the complete pathloss appeared to be the most detrimental between the studied tissues, which was expected due to the more compact constitution of the bone tissue. This effect was highlighted by the fact that after adding the scattering phenomenon in our simulations, the complete pathloss increased by almost three orders of magnitude. In more detail, for a specific value of equal to , as the transmission wavelength increased from 400 to , the relation between the and increased from to .
4. Future Research Directions
The objective of this work was to build the basic pillar towards an accurate, tractable, easily-used, and general channel model for an optical wireless in-body and transdermal channel. To achieve this, as a first step, the basic propagation mechanisms in such a medium, namely (i) spreading loss and (ii) scattering, were identified. Next, low-complexity models that account the propagation medium particularities, i.e., the different tissue compositions, were introduced. The aforementioned models can open the door to a number of important studies, ranging from ray-tracing-based channel modeling to theoretical assessment of point-to-point to point-to-multi-point links and systems, as well as systems, transmission, and reception schemes and policies designed to optimize. In more detail, the following future research directions can be identified:
- Stochastic channel modeling: As discussed in [2], transdermal and in-body optical wireless links suffer from wavelength-dependent particulate scattering. Within the skin, the main source of scattering is filamentous proteins (e.g., keratin in epidermis and collagen in dermis). Note that, since these particles are comparable to or larger than the wavelength, scattering can be approximated as a Mie solution to Maxwell’s equations. On the other hand, in in-body applications, tissues, such as membranes, striations in collagen fibrils, macromolecules, lysosomes, vesicles, mitochondria, and nuclei are the main scatterers. Note that membranes are usually lower than 1/10 of the wavelength, while all the other structures are comparable to the wavelength. Thus, scattering in tissues can be modeled as a mixture of Rayleigh and Mie processes. By taking into consideration the inhomogeneities in the body content in light-absorbing and scattering, which lead to a variation of the reflective index along the transmission path, it becomes evident that the received power is expected to randomly fluctuate. To model this phenomenon, experimentally verified ray-tracing investigations that capitalize the models presented in the current contribution need to be conducted. Furthermore, except for line-of-sight links, non-line-of-sights scenarios, where diffusion may be the key player, also need to be investigated.
- Theoretical investigation: Several different use cases, such as cochlear, gastric, cortical, retinal, foot drop implants, etc., have been identified [2]. However, only for a small number of them, a link budget analysis that supports their feasibility and reveals the architectural requirements that need to be accounted for has been conducted [6,7]. This motivates the use of the presented contribution as a building block towards the performance assessment of existing and envisioned designs and system models, as well as networks. In particular, for low-distance links, in the orders of some cm, where the strength of line-of-sight components are expected to be considerably larger than the one of non-line-of-sight, due to the high directionality of the links, the channel variation from its expected values will be relatively low. As a result, the presented channel model will provide a very accurate estimation of the received signal strength.
- Design and development of communication, energy harvesting, and neural stimulation modules: In order to select the optimal transmission and reception parameters and equipment, design energy and spectral efficient transmission waveforms, and reception filters and processes, develop low-complexity channel and error correction codes, devise suitable energy harvesting modules, and utilize energy transfer and harvesting policies, a low-complexity channel model that captures the inherent characteristics of the propagation medium is required. In more detail, and as illustrated in Section 3, the presented channel model can aid in identifying optimal transmission wavelengths, as well as transmission windows for different applications. This identification provides guidelines for the architecture designer concerning the LS and PD that should be used, as well as to the industry concerning the characteristics of the aforementioned units that need to be developed. By taking into account the channel characteristics, which in general are wavelength- and distance-dependent, suitable transmission waveform, codes, constellation, reception filters and detection processes that contribute to the maximization of the system’s energy efficiency can be developed and theoretically studied. Additionally, wavelength splitting strategies that ensure uninterrupted and reliable operation can be designed and optimized. Finally, combining the presented channel model with optogenetic stimulation, a highly efficient cell stimulation technique that offers improved spectral coding of sound information due to its higher temporal confinement, aspires great promise for the development of novel architectures capable of achieving unprecedented performance.
5. Conclusions
This paper introduces a novel mathematical framework that models the optical signal’s attenuation as it travels through any generic biological tissue. Initially, we extract analytical expressions for the absorption coefficient of the major generic tissue constituents based on published experimental measurements, which enable the estimation of not only the absorption coefficient of each constituent at any given wavelength but also the absorption coefficient of any generic tissue. Moreover, the phenomenon of scattering is incorporated into the proposed framework as a complex stochastic process comprised of a Rayleigh and Mie scattering component in order to model the impact due to the existence of smaller and larger particles, respectively, in the generic tissue. Next, the phenomena of absorption and scattering are incorporated into a unified framework, which is validated by comparing the analytical results with experimental data from the open literature. Moreover, we illustrate the pathloss as a function of the transmission wavelength for different complex tissues and tissue thickness and provide insightful discussions, as well as design guidelines, for future in-body OWC applications. Finally, the importance of scattering is highlighted in the results of this contribution, and, therefore, future research should further investigate novel techniques to mitigate its impact.
Author Contributions
Conceptualization, S.E.T.; methodology, S.E.T.; software, S.E.T.; validation, S.E.T., A.-A.A.B., N.D.C. and G.K.K.; writing—original draft preparation, S.E.T.; writing—review and editing, A.-A.A.B., N.D.C. and G.K.K.; visualization, S.E.T.; supervision, A.-A.A.B.; project administration, N.D.C.; funding acquisition, N.D.C. All authors have read and agreed to the published version of the manuscript.
Funding
This research is co-financed by Greece and the European Union (European Social Fund-ESF) through the Operational Programme “Human Resources Development, Education and Lifelong Learning 2014–2020” in the context of the project “IRIDA-Optical wireless communications for in-body and transdermal biomedical applications” (MIS 5047929).
Institutional Review Board Statement
Not applicable.
Informed Consent Statement
Not applicable.
Data Availability Statement
Not applicable.
Conflicts of Interest
The authors declare no conflict of interest.
References
- Kaloxylos, A.; Gavras, A.; Camps Mur, D.; Ghoraishi, M.; Hrasnica, H. AI and ML—Enablers for Beyond 5G Networks. Zenodo 2020. [Google Scholar] [CrossRef]
- Boulogeorgos, A.A.A.; Trevlakis, S.E.; Chatzidiamantis, N.D. Optical wireless communications for in-body and transdermal biomedical applications. IEEE Commun. Mag. 2021, 59, 119–125. [Google Scholar] [CrossRef]
- Trevlakis, S.E.; Boulogeorgos, A.A.A.; Karagiannidis, G.K. On the impact of misalignment fading in transdermal optical wireless communications. In Proceedings of the 7th International Conference on Modern Circuits and Systems Technologies (MOCAST), Thessaloniki, Greece, 7–9 May 2018. [Google Scholar] [CrossRef]
- Trevlakis, S.; Boulogeorgos, A.A.A.; Karagiannidis, G. Signal Quality Assessment for Transdermal Optical Wireless Communications under Pointing Errors. Technologies 2018, 6, 109. [Google Scholar] [CrossRef] [Green Version]
- Trevlakis, S.E.; Boulogeorgos, A.A.A.; Karagiannidis, G.K. Outage Performance of Transdermal Optical Wireless Links in the Presence of Pointing Errors. In Proceedings of the IEEE 19th International Workshop on Signal Processing Advances in Wireless Communications (SPAWC), Kalamata, Greece, 25–28 June 2018. [Google Scholar] [CrossRef]
- Trevlakis, S.E.; Boulogeorgos, A.A.A.; Sofotasios, P.C.; Muhaidat, S.; Karagiannidis, G.K. Optical wireless cochlear implants. Biomed. Opt. Express 2019, 10, 707. [Google Scholar] [CrossRef] [PubMed]
- Trevlakis, S.E.; Boulogeorgos, A.A.A.; Chatzidiamantis, N.D.; Karagiannidis, G.K. All-Optical Cochlear Implants. IEEE Trans. Mol. Biol. Multi-Scale Commun. 2020, 6, 13–24. [Google Scholar] [CrossRef]
- Zhao, J.; Ding, H.S.; Hou, X.L.; Zhou, C.L.; Chance, B. In vivo determination of the optical properties of infant brain using frequency-domain near-infrared spectroscopy. J. Biomed. Opt. 2005, 10, 024028. [Google Scholar] [CrossRef]
- Yaroslavsky, A.N.; Schulze, P.C.; Yaroslavsky, I.V.; Schober, R.; Ulrich, F.; Schwarzmaier, H.J. Optical properties of selected native and coagulated human brain tissues in vitro in the visible and near infrared spectral range. Phys. Med. Biol. 2002, 47, 2059–2073. [Google Scholar] [CrossRef]
- van der Zee, P.; Essenpreis, M.; Delpy, D.T. Optical properties of brain tissue. In Photon Migration and Imaging in Random Media and Tissues; Chance, B., Alfano, R.R., Eds.; SPIE: Bellingham, WA, USA, 1993. [Google Scholar] [CrossRef]
- Bashkatov, A.N.; Genina, E.A.; Kochubey, V.I.; Tuchin, V.V. Optical properties of human cranial bone in the spectral range from 800 to 2000 nm. In Saratov Fall Meeting 2005: Optical Technologies in Biophysics and Medicine VII; Tuchin, V.V., Ed.; SPIE: Bellingham, WA, USA, 2006. [Google Scholar] [CrossRef]
- Ugryumova, N.; Matcher, S.J.; Attenburrow, D.P. Measurement of bone mineral density via light scattering. Phys. Med. Biol. 2004, 49, 469–483. [Google Scholar] [CrossRef]
- Sandell, J.L.; Zhu, T.C. A review of in-vivo optical properties of human tissues and its impact on PDT. J. Biophotonics 2011, 4, 773–787. [Google Scholar] [CrossRef] [Green Version]
- Pifferi, A.; Swartling, J.; Chikoidze, E.; Torricelli, A.; Taroni, P.; Bassi, A.; Andersson-Engels, S.; Cubeddu, R. Spectroscopic time-resolved diffuse reflectance and transmittance measurements of the female breast at different interfiber distances. J. Biomed. Opt. 2004, 9, 1143. [Google Scholar] [CrossRef] [Green Version]
- Spinelli, L.; Torricelli, A.; Pifferi, A.; Taroni, P.; Danesini, G.M.; Cubeddu, R. Bulk optical properties and tissue components in the female breast from multiwavelength time-resolved optical mammography. J. Biomed. Opt. 2004, 9, 1137. [Google Scholar] [CrossRef] [PubMed]
- Tseng, T.Y.; Chen, C.Y.; Li, Y.S.; Sung, K.B. Quantification of the optical properties of two-layered turbid media by simultaneously analyzing the spectral and spatial information of steady-state diffuse reflectance spectroscopy. Biomed. Opt. Express 2011, 2, 901. [Google Scholar] [CrossRef] [PubMed] [Green Version]
- Salomatina, E.; Jiang, B.; Novak, J.; Yaroslavsky, A.N. Optical properties of normal and cancerous human skin in the visible and near-infrared spectral range. J. Biomed. Opt. 2006, 11, 064026. [Google Scholar] [CrossRef] [PubMed]
- Shimojo, Y.; Nishimura, T.; Hazama, H.; Ozawa, T.; Awazu, K. Measurement of absorption and reduced scattering coefficients in Asian human epidermis, dermis, and subcutaneous fat tissues in the 400- to 1100-nm wavelength range for optical penetration depth and energy deposition analysis. J. Biomed. Opt. 2020, 25, 1. [Google Scholar] [CrossRef]
- Jacques, S.L. Optical properties of biological tissues: A review. Phys. Med. Biol. 2013, 58, R37–R61. [Google Scholar] [CrossRef]
- Trevlakis, S.E.; Boulogeorgos, A.A.A.; Chatzidiamantis, N.D.; Karagiannidis, G.K.; Lei, X. Electrical vs Optical Cell Stimulation: A Communication Perspective. IEEE Access 2020, 8, 192259–192269. [Google Scholar] [CrossRef]
- Saidi, I.S.; Jacques, S.L.; Tittel, F.K. Mie and Rayleigh modeling of visible-light scattering in neonatal skin. Appl. Opt. 1995, 34, 7410. [Google Scholar] [CrossRef]
- Frontin, J.B.; Anthony, B.W. Quantifying dermatology: Method and device for user-independent ultrasound measurement of skin thickness. In Proceedings of the 2019 41st Annual International Conference of the IEEE Engineering in Medicine and Biology Society (EMBC), Berlin, Germany, 23–27 July 2019; pp. 5743–5748. [Google Scholar]
- Coddington, A.; Levinson, N. Theory of Ordinary Differential Equations; International Series in Pure and Applied Mathematics; McGraw-Hill Companies: New York, NY, USA, 1955. [Google Scholar]
- Boulogeorgos, A.A.A.; Trevlakis, S.E.; Tegos, S.A.; Papanikolaou, V.K.; Karagiannidis, G.K. Machine Learning in Nano-Scale Biomedical Engineering. IEEE Trans. Mol. Biol.-Multi-Scale Commun. 2020, 7, 10–39. [Google Scholar] [CrossRef]
- Hale, G.M.; Querry, M.R. Optical Constants of Water in the 200-nm to 200-μm Wavelength Region. Appl. Opt. 1973, 12, 555. [Google Scholar] [CrossRef]
- Zolotarev, V.M.; Mikhailov, B.A.; Alperovich, L.I.; Popov, S.I. Dispersion and Absorption of Liquid Water in the Infrared and Radio Regions of the Spectrum. Opt. Spectrosc. 1969, 27, 430. [Google Scholar]
- Segelstein, D.J. The Complex Refractive Index of Water. Ph.D. Thesis, University of Missouri, Kansas City, MO, USA, 1981. [Google Scholar]
- Takatani, S.; Graham, M.D. Theoretical Analysis of Diffuse Reflectance from a Two-Layer Tissue Model. IEEE. Trans. Biomed. Eng. 1979, BME-26, 656–664. [Google Scholar] [CrossRef]
- Moaveni, M.K. A Multiple Scattering Field-Theory Applied to Whole Blood; University of Washington: Seattle, WA, USA, 1970. [Google Scholar]
- Schmitt, J. Optical Measurement of Blood Oxygen by Implantable Telemetry; Stanford University: Stanford, CA, USA, 1986. [Google Scholar]
- Zhao, Y.; Qiu, L.; Sun, Y.; Huang, C.; Li, T. Optimal hemoglobin extinction coefficient data set for near-infrared spectroscopy. Biomed. Opt. Express 2017, 8, 5151. [Google Scholar] [CrossRef] [PubMed] [Green Version]
- Bashkatov, A.N. Optical Properties of the Subcutaneous Adipose Tissue in the Spectral Range 400–2500 nm. Opt. Spectrosc. 2005, 99, 836. [Google Scholar] [CrossRef]
- Jacques, S.L.; McAuliffe, D.J. The melanosome: Threshold temperature for explosive vaporization and internal absorption coefficient during pulsed laser irradiation. Photochem. Photobiol. 1991, 53, 769–775. [Google Scholar] [CrossRef] [PubMed]
- Zonios, G.; Dimou, A.; Bassukas, I.; Galaris, D.; Tsolakidis, A.; Kaxiras, E. Melanin absorption spectroscopy: New method for noninvasive skin investigation and melanoma detection. J. Biomed. Opt. 2008, 13, 014017. [Google Scholar] [CrossRef] [Green Version]
- Mourant, J.R.; Fuselier, T.; Boyer, J.; Johnson, T.M.; Bigio, I.J. Predictions and measurements of scattering and absorption over broad wavelength ranges in tissue phantoms. Appl. Opt. 1997, 36, 949. [Google Scholar] [CrossRef]
- Mourant, J.R.; Freyer, J.P.; Hielscher, A.H.; Eick, A.A.; Shen, D.; Johnson, T.M. Mechanisms of light scattering from biological cells relevant to noninvasive optical-tissue diagnostics. Appl. Opt. 1998, 37, 3586. [Google Scholar] [CrossRef]
- Lau, C.; Scepanovic, O.; Mirkovic, J.; McGee, S.; Yu, C.C.; Fulghum, S.; Wallace, M.; Tunnell, J.; Bechtel, K.; Feld, M. Re-evaluation of model-based light-scattering spectroscopy for tissue spectroscopy. J. Biomed. Opt. 2009, 14, 024031. [Google Scholar] [CrossRef]
Figure 1.
The structure of this paper.

Figure 2.
Attenuation coefficients of complex tissues and their constituents as a function of . (a) Absorption coefficient of tissue constituents. (b) Absorption coefficient of complex tissues. (c) Reduced scattering coefficient of complex tissues.
Figure 2.
Attenuation coefficients of complex tissues and their constituents as a function of . (a) Absorption coefficient of tissue constituents. (b) Absorption coefficient of complex tissues. (c) Reduced scattering coefficient of complex tissues.

Figure 3.
Pathloss due to absorption and scattering of various tissues as a function of the transmission wavelength for different values of tissue thickness. Continuous and dashed lines denote the complete pathloss and the pathloss only due to the absorption coefficient. (a) Skin tissue. (b) Brain tissue. (c) Breast tissue. (d) Bone tissue.


Table 1.
Table of variables.
| Variable | Name |
|---|---|
| B | Blood volume fraction |
| Cosine function | |
| Tissue thickness | |
| Exponential function | |
| F | Fat volume fraction |
| Rayleigh scattering factor | |
| g | Anisotropy factor |
| L | Pathloss |
| M | Melanin volume fraction |
| Absorption coefficient | |
| Scattering coefficient | |
| Reduced scattering coefficient | |
| Sine function | |
| W | Water volume fraction |
Table 2.
Fitting parameters for the constituent’s absorption coefficient.
| dBlood | oBlood | Water | Fat | |
|---|---|---|---|---|
| - | - | - | ||
| 14 | ||||
| - | 73 | |||
| - | - | - | ||
| - | - | - | ||
| −25,880 | ||||
| - | ||||
| - | - | - | ||
| - | - | - | ||
| - | ||||
| - | ||||
| - | ||||
| 4668 | - | |||
| - | - | |||
| w | - | - | - |
Table 3.
Tissue parameters related to optical absorption and scattering for skin, bone, brain, and breast tissue.
Publisher’s Note: MDPI stays neutral with regard to jurisdictional claims in published maps and institutional affiliations. |
© 2022 by the authors. Licensee MDPI, Basel, Switzerland. This article is an open access article distributed under the terms and conditions of the Creative Commons Attribution (CC BY) license (https://creativecommons.org/licenses/by/4.0/).
Share and Cite
MDPI and ACS Style
Trevlakis, S.E.; Boulogeorgos, A.-A.A.; Chatzidiamantis, N.D.; Karagiannidis, G.K. Channel Modeling for In-Body Optical Wireless Communications. Telecom 2022, 3, 136-149. https://0-doi-org.brum.beds.ac.uk/10.3390/telecom3010009
AMA Style
Trevlakis SE, Boulogeorgos A-AA, Chatzidiamantis ND, Karagiannidis GK. Channel Modeling for In-Body Optical Wireless Communications. Telecom. 2022; 3(1):136-149. https://0-doi-org.brum.beds.ac.uk/10.3390/telecom3010009
Chicago/Turabian StyleTrevlakis, Stylianos E., Alexandros-Apostolos A. Boulogeorgos, Nestor D. Chatzidiamantis, and George K. Karagiannidis. 2022. "Channel Modeling for In-Body Optical Wireless Communications" Telecom 3, no. 1: 136-149. https://0-doi-org.brum.beds.ac.uk/10.3390/telecom3010009