Article

Prevalence and Patterns of Risk of Osteoporosis in Bangladeshi Adult Population: An Analysis of Calcaneus Quantitative Ultrasound Measurements

1
Department of Physiotherapy and Rehabilitation, Uttara Adhunik Medical College and Hospital, Dhaka 1230, Bangladesh
2
NSU Global Health Institute, North South University, Dhaka 1229, Bangladesh
3
Hasna Hena Pain, Physiotherapy and Public Health Research Center (HPRC), Dhaka 1230, Bangladesh
4
School of Rehabilitation Sciences, McMaster University, Hamilton, ON L8S 4L8, Canada
5
Department of Public Health, North South University, Bashundhara, Dhaka 1229, Bangladesh
*
Author to whom correspondence should be addressed.
Submission received: 15 July 2021 / Revised: 18 September 2021 / Accepted: 28 September 2021 / Published: 3 October 2021

Abstract

:
(1) Objectives: A little is known about the prevalence of the “risk of osteoporosis (RO)” and the factors associated with RO among Bangladeshi adults. Using a cost-effective testing tool, this study aimed to investigate the prevalence of RO and find the association between age, gender, and morbidity with RO among adults in Bangladesh. (2) Results: Among 526 subjects, the prevalence of RO was 37.3%. Gender (p =< 0.001), age (p = 0.003), diabetes (p = 0.003), cardiovascular disease (p =< 0.001) and multimorbidity (p =< 0.001) were associated with RO. The causal relationships, by adjusting confounders in the associations of RO and other variables, were depicted graphically. (3) Conclusion: The pattern of association between gender and age with RO was different and exclusive. Different approaches might be needed to alleviate the high burden of RO considering the subjects’ age, gender, and multimorbidity.

1. Introduction

Osteoporosis is recognized as a significant global public health problem. The features of osteoporosis are silent and are often diagnosed after related complications have occurred [1]. A report suggests that 10 million Americans aged 50 or over have an active diagnosis of osteoporosis, with another 34 million in the “at-risk” category. Every year, 1.5 million Americans suffer from osteoporosis-related fractures (ORF) [2]. ORF is predicted to triple in the USA by 2025 because of a lack of focus on bone health and prevention [3]. Besides high-income countries, the high prevalence of osteoporosis and risk of osteoporosis (RO) is also reported for middle and low-income countries of Southeast Asia [4]. However, early diagnosis and appropriate prevention methods and treatment significantly reduce the prevalence of osteoporosis, RO, and ORF [5].
Diagnosis of osteoporosis after hip, vertebral, or peripheral fractures does not reduce the suffering of the patient [6]. Evidence suggests that fifty percent of patients with ORF have failed to return to their pre-fracture functional ability level [7]. Furthermore, ORF has a very high economic burden because of higher treatment costs, extended hospital stays, and the need for special care at home after discharge from the hospital [8]. To reduce the risk of fracture and economic burden in the health sector, it is crucial to assess bone health (i.e., RO) at an early age.
In low and middle-income countries, the primary barrier to osteoporosis or RO assessment is the lack of cost-effective screening tools [9]. Though Dual-energy X-ray absorptiometry (DXA) is recognized as the gold standard screening tool for osteoporosis [10], it is less accessible and less cost-feasible for low-income countries, for example, Bangladesh [11]. In recent years, calcaneal qualitative ultrasound (QUS), with characteristics of readily accessible and radiation-free bone tests, has become an alternative to DXA for osteoporosis screening all over the world [10]. Furthermore, portability, availability, and low cost made the QUS technique famous among low-income countries as a feasible osteoporosis screening tool [12]. Moreover, the International Society of Clinical Densitometry recognized QUS as an alternative measurement tool for the DXA for osteoporosis screening [13]. Research also reported that QUS findings and bone mineral density (BMD) equally show a strong predictive association for risk factors of osteoporosis [10,13,14,15]. A systematic review and meta-analysis confirmed that QUS significantly predicts the RO and various fracture outcomes for adult men and women [16]. Thus, the utilization of QUS for determining RO among the adult population in Bangladesh was recommended.
Previous studies reported a high prevalence of osteoporosis among women living in the community of Bangladesh [17]. However, no studies focus on the general Bangladeshi population for osteoporosis screening. This study addressed the gap in research-based knowledge regarding osteoporosis screening for the general population. Therefore, we aimed to (1) investigate the prevalence of the risk of osteoporosis, (2) find the pattern of association between age, gender, and morbidity with the risk of osteoporosis among adults in Bangladesh, using a cost-effective testing tool (i.e., QUS).

2. Methods

2.1. Study Design

A cross-sectional study was conducted among 526 adults aged 30–89, in Dhaka City, by a QUS bone health testing program. Two weeks before the test days, the test method, test location, and eligibility criteria to participate in this program were circulated through social media (Facebook, Twitter) and banners targeting Dhaka City dwellers. Exclusion criteria for this study include (1) age < 30 years, (2) history of any fracture within the last one year, (3) bedridden status within the last 12 months, (4) patient treat by medicine those have known risk to affect bone metabolism for example glucocorticoids, proton pump inhibitors, selective serotonin receptor inhibitors, thiazolidinediones, anticonvulsants, medroxyprogesterone acetate, aromatase inhibitors, androgen deprivation therapy, heparin, calcineurin inhibitors, and some chemotherapies. The objectives and procedures of the study were explained to the respondents. Written voluntary informed consent was taken from the study participants before being enrolled in the study. The study period was from August 2019 to February 2020. The minimum necessary sample size for the study was calculated based on a 95% confidence interval and assuming the prevalence of osteoporosis risk among adults in Dhaka city as 35%. We calculated the minimum required sample as 475 by considering a 4.5% marginal error and 80% power. The Ethical Review Committee of the Uttara Adhunik Medical College Hospital approved the study (UAMC-IRB-201905).

2.2. Anthropometric Data

Date of birth, gender, weight, and height was recorded. Weight and size were measured in the morning with an empty stomach and a light dress without shoes before performing the QUS test. Body mass index (BMI) was calculated as weight in kg divided by height squared in the meter. Participants were categorized as underweight, normal, overweight, and obese as per the Asian cut-off for BMI in Indian (Bangladeshi) [18].

2.3. Sociodemographic and Reproductive Health Data

Educational qualification, marital status, sleeping arrangement (firm/foam mattress), physical activity, smoking habit, clinical history, menopausal status (premenopausal, postmenopausal) of female participants were also recorded. Previously diagnosed participants were registered diabetic, cardiovascular disease patients, and patients with multimorbidity. Multimorbidity can be defined as the co-occurrence of two or more chronic conditions in a patient [19].
According to the following definition, females were classified into premenopausal or postmenopausal stages: Pre-menopause was defined as women with regular menstruation. Post-menopause was defined as the permanent cessation of menstrual periods for at least 12 months that occur naturally or may be induced by surgery, per the definition from the World Health Organization [20].

2.4. Quantitative Bone Density

A standardized procedure was instituted for each participant to measure ultrasound variables of the peripheral skeleton, namely the Os Calcis by the Lunar Achilles Express (GE Healthcare, Madison, WI, USA) Ultrasound Bone Densitometer. The same co-investigator conducted all measurements to maintain the reliability of the testing process. Participants have explained the demonstration process where needed. The measure took 20–25 s.
Lunar Achilles Express ultrasound bone densitometer has a global bone density database to select reference values based on the age and gender of Asian (Bangladeshi) adults. The co-investigator calibrated the device based on the reference value supplied and installed by the manufacturer. The machine calculated and expressed QUS T-score based on broadband ultrasonic attenuation (BUA in dB/MHz), speed of sound (in m/s), and the Osteoporosis Indicator. BUA proved as an independent predictor for the osteoporosis screening of the non-osteoporotic adult human [21]. In this study, we considered participants with a T-score less than or equal to −0.1 have a RO [13,22,23]. However, previous research indicated a significant difference in QUS result (T-score) between left and right foot, and non-dominant foot was recommended for testing [24]. We tested the calcaneus of the non-dominant foot of every participant. To ensure quality, great care was taken in standardizing the measurement method according to the manufacturer’s instruction.

2.5. Statistical Analysis

The SPSS software for Windows (version 20.0) was used to analyze the data. The categorical variables were expressed as frequencies and percentages. Descriptive statistics were used to determine the prevalence of the RO (participants with a T-score of ≤−0.1 considered as RO) among categorical variables. p-value was calculated from the chi-square test. A directed acyclic graph method is used to depict hypothesized causal relationships and deduce the statistical associations for adjusting confounders in the associations of RO and other variables. The graph was constructed through http://www.dagitty.net/ (accessed on 17 July 2020). Afterwards, a multivariable linear regression model was deployed to control confounding variables (Model 1). A separate multivariable linear regression model was generated after adjusting the confounding variables to stratify the analysis by male and female groups (Model 2 and Model 3). A significant level was set at α = 0.05 for this study.

3. Results

3.1. Sociodemographic and Clinical Data

The general characteristics of the study subjects can be found in Table 1. A total of 526 participants were engaged in the QUS test; 54.2% were female. Of participants, 43.2% of the females and 30.3% of the males were screened as having RO. The mean age of the participants was 45.53 (±13.21). The mean BMI was reported as 25.87 (±4.09). The overall mean T-score was −0.48 (±1.22). We found that 83.3% of subjects never smoked and 67.7% of participants reported a low level of weekly physical activity. Prevalence of diabetes, cardiovascular disease, and multimorbidity was 18.8%, 7.8%, and 3.8%, respectively. Table 1 also shows that more women were in RO than men (54 vs. 45%, p = 0.003). Likewise, statistically significant high prevalence of RO among people aged over 50 (p =< 0.001). Chronic health conditions were also significantly associated with RO. Higher prevalence of RO among diabetic (34 vs. 50%, p = 0.003) and cardiac patients (37 vs. 78%, p =< 0.001) was found in this study. Additionally, we found a remarkably higher prevalence of RO among subjects with multimorbidity (35 vs. 90%, p =< 0.001).

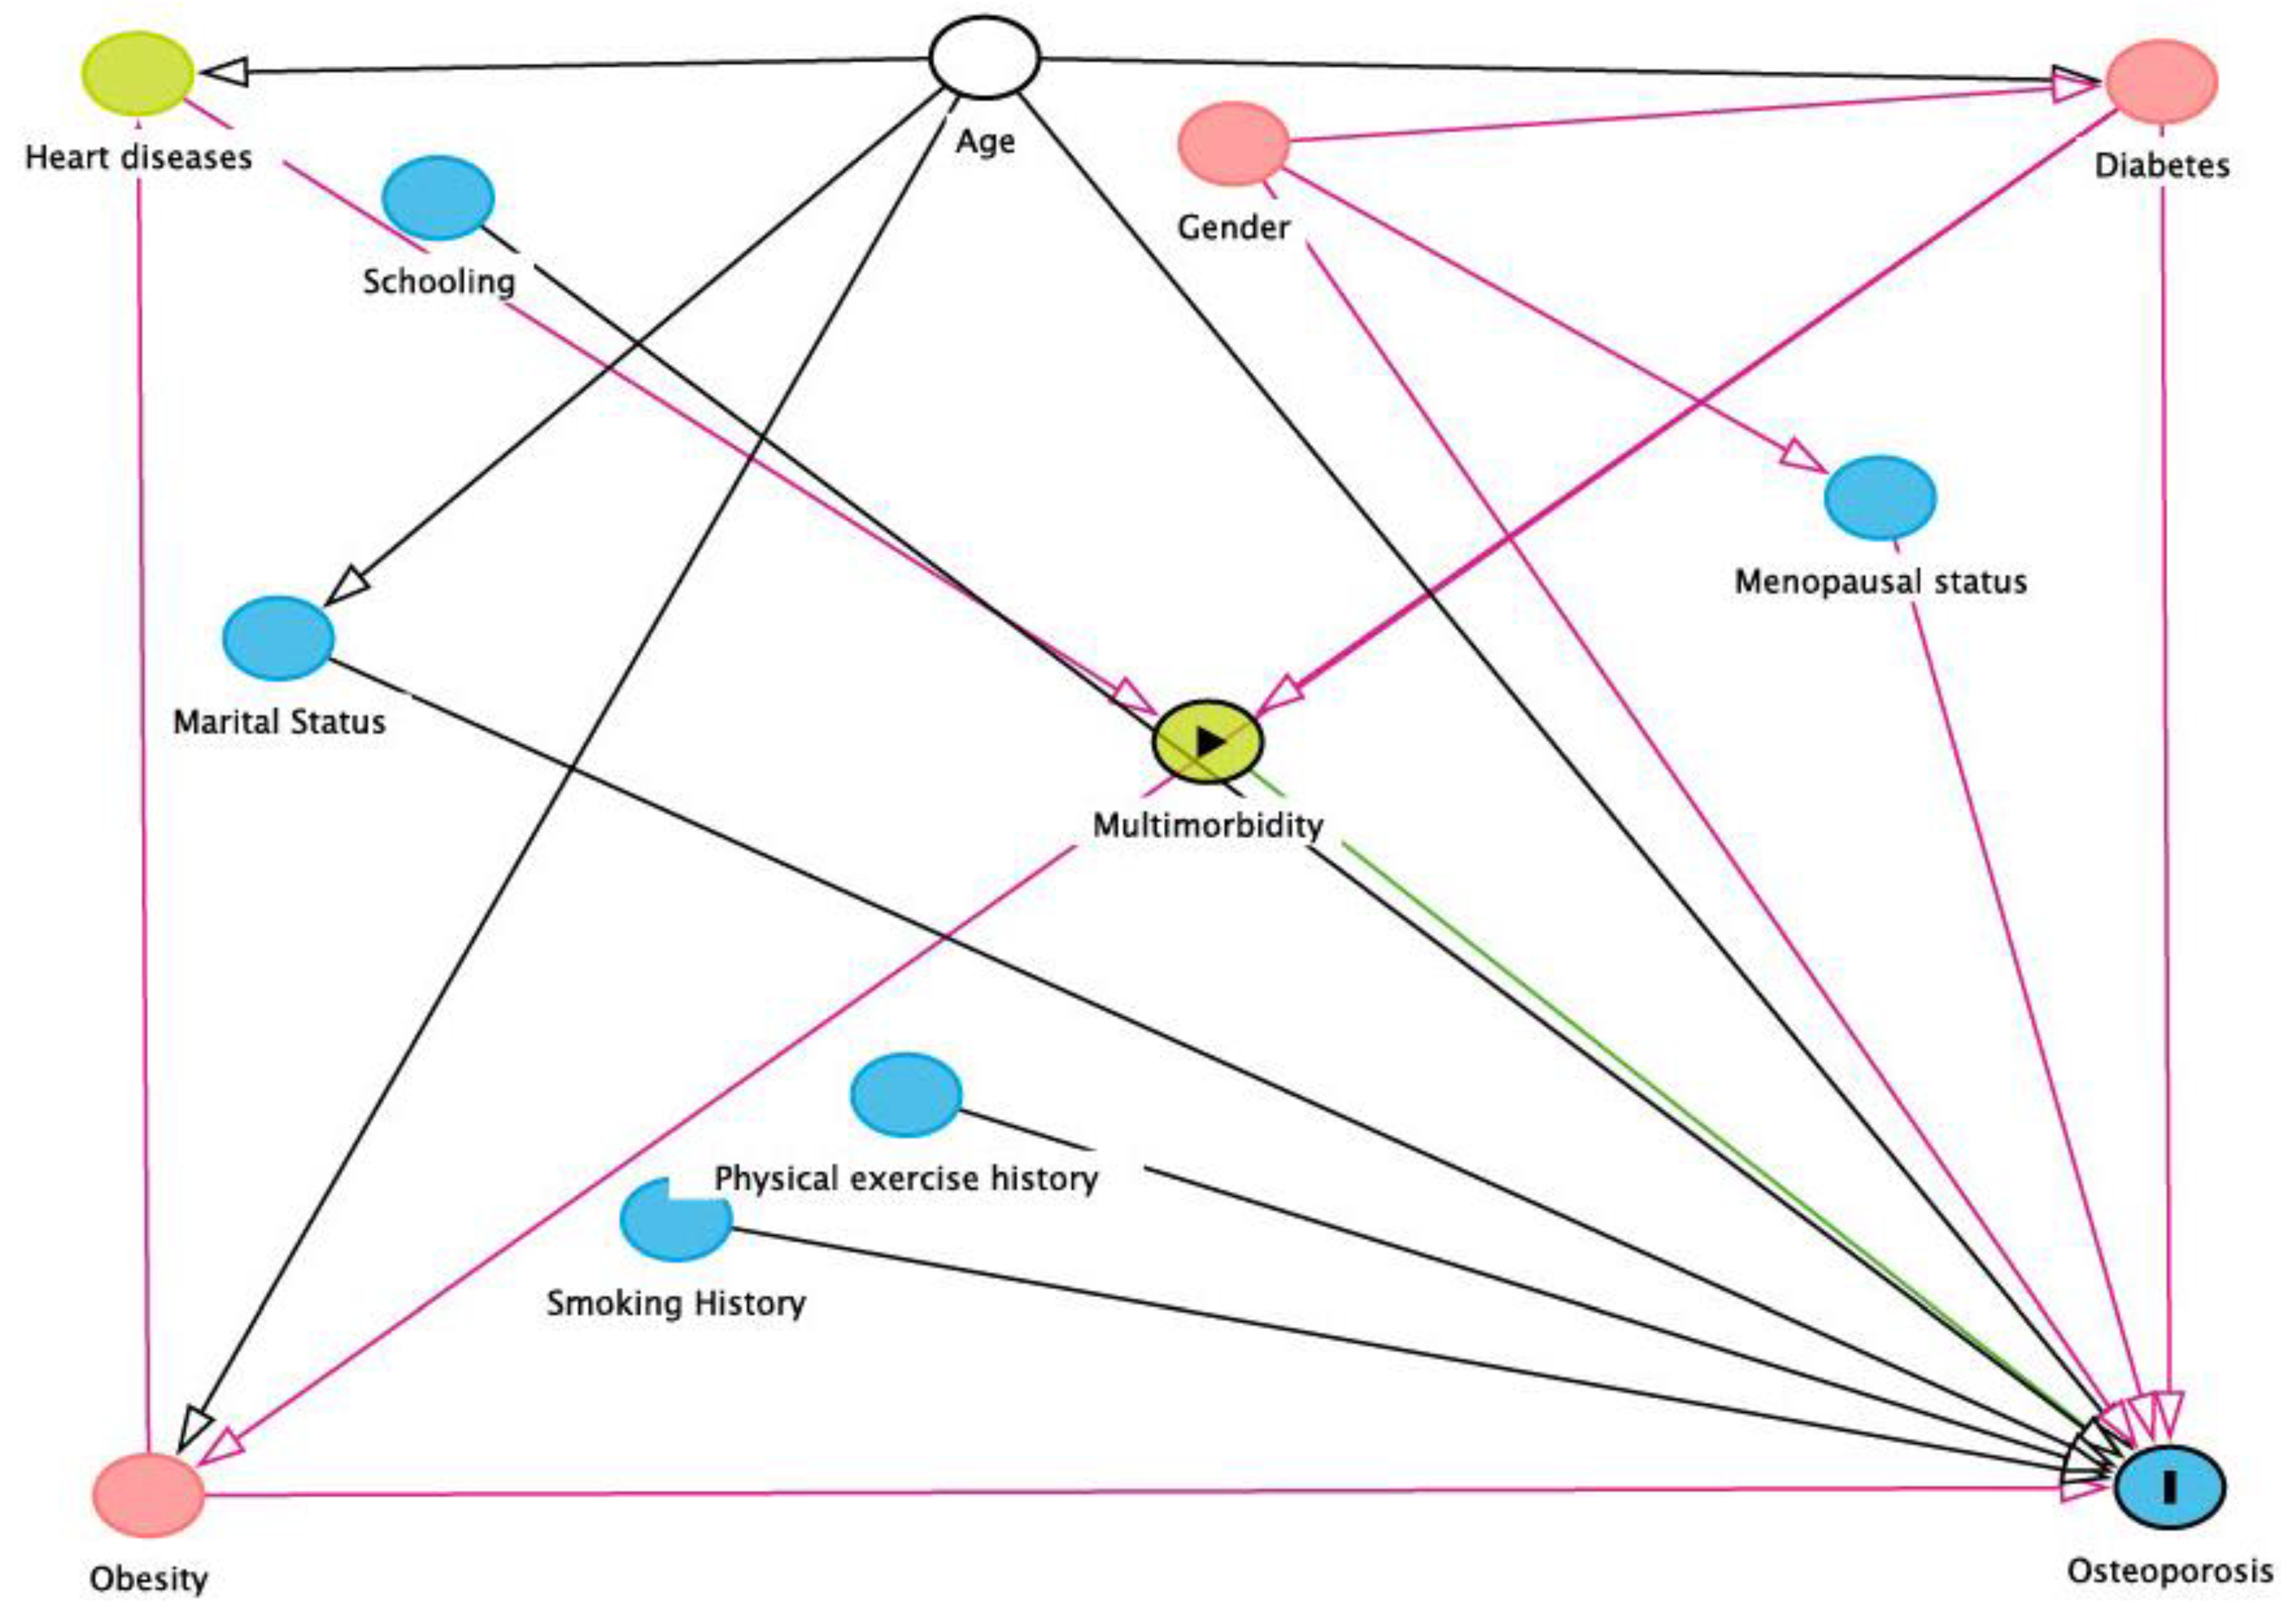
3.2. Variables Associated with the RO

A directed acyclic graph for adjusting confounders in the associations between age, gender, marital status, physical exercise history, smoking history, the menopausal status of females, schooling, morbidity (diabetes and cardiovascular disease), multimorbidity, and RO is provided in Figure 1. This graph method depicts hypothesized causal relationships and deduces the statistical associations implied by these causal relationships. Here, we consider RO as the outcome variable and multimorbidity as the primary exposure variable. Minimum sufficient adjustment sets were derived, containing obesity, gender, diabetes, multimorbidity after adjustment of age for estimating the direct effect of osteoporosis.

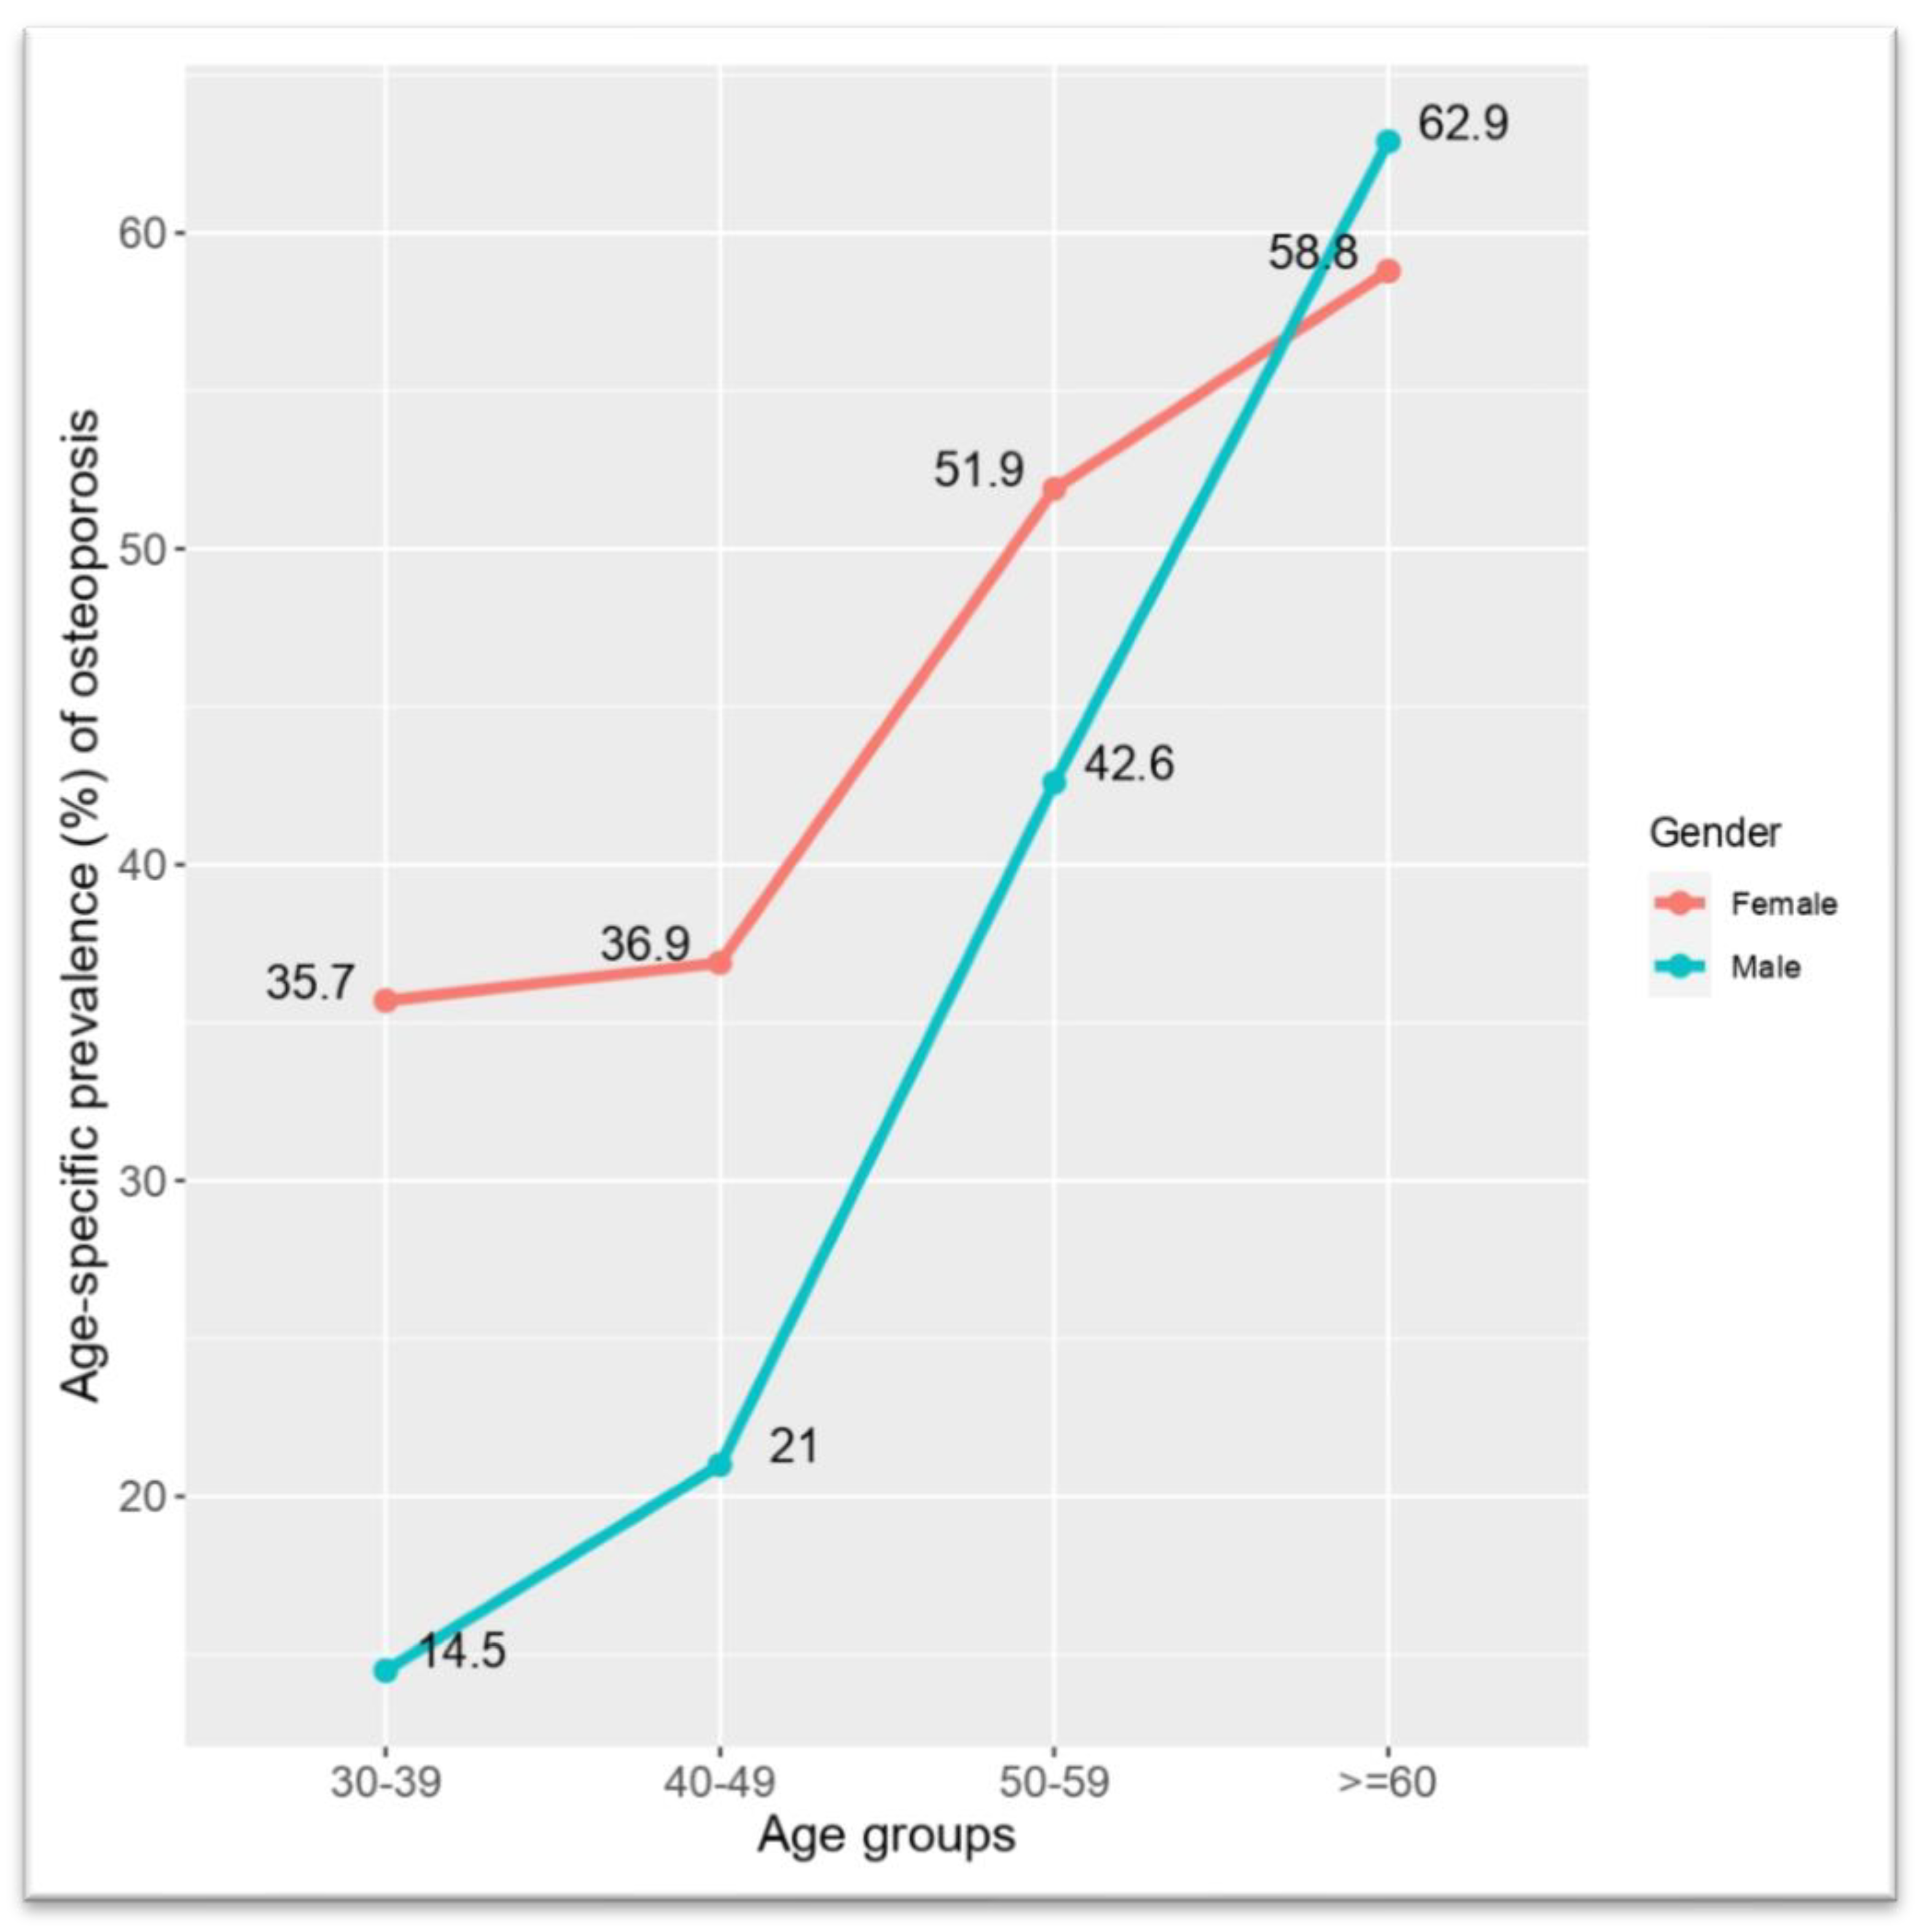
3.3. Age, Gender, and Osteoporosis Prevalence

Figure 2 shows the age-specific prevalence (percentage) of RO among male and female subjects. It was found that, in the age group of 30–39 years, more women had RO than men (14.5% vs. 35.7%). However, after 40 years of age, among men, the prevalence rose sharply from 21% to 42.6% and reached 62.9% in the age group of ≥60 years. On the other hand, the prevalence of RO among women rose relatively slowly than men in the same period and reached 58.8% in the age group of ≥60 years.

3.4. Multivariable Linear Regression Models

Table 2 presents the results from multivariable linear regression models. The results present the slope estimate, 95% confidence interval of the slope, and the corresponding p-value. We applied three models. The first model used all the data, and the next two models were gender-separated, i.e., females have one model and males have the other. The regression model was employed to eliminate confounding bias. Model 1 suggests that more females were identified with RO than males with a slope of 1.92 (95% CI 1.30–2.86, p = 0.001). Furthermore, model 1 found that RO was 2.3 times more prevalent (95% CI 1.40–3.84, p = 0.001) in age group 50–59 and 3.5 times more prevalent (95% CI 2.02–6.17, p =< 0.001) among subjects aged more than 60. Model 1 also found that 9.16 times more Subjects with multimorbidity (95% CI 2.48–59.36, p =< 0.001) was identified as having RO compared with participant not having multimorbidity. In model 2, we found 4.18 (95% CI 1.03–16.94, p = 0.044) times more prevalence of RO among females aged more than 60. In model 3, we found ten times more male participants (95% CI 1.82–87.09, p = 0.031) with RO who had multimorbidity.

4. Discussion

In this study, we found a 37.3% prevalence of RO among adults living in Dhaka City. Gender, age, diabetes, cardiovascular disease, multimorbidity, and menopausal status were associated with RO. The study indicated a different and exclusive pattern of association between gender and age with RO.
Both gender and age play a crucial role in developing osteoporosis risk. In our study, we found that, overall, the prevalence of RO increased as age increase. The prevalence of RO was 2.5 times higher among the age group of 50–59 years and it rose to about four times high among the age group over 60 years for both genders. Previous studies showed that age is the main predictor of osteoporosis risk [25,26]. A study conducted in Asia also observed that the prevalence of osteoporosis increased as age increased among Asian males and females [27]. Data from seven Asian countries revealed that the prevalence of osteoporosis can vary from 41% to 90% among men and women, depending on region and age [28,29,30,31]. A study conducted among 8475 Chinese subjects found that half of the population had moderate to severe osteoporosis levels and concluded that the prevalence of osteoporosis in women was higher than in men [32]. A meta-analysis also supports that there is an association between female gender and osteoporosis [33]. However, other studies suggested that the actual prevalence of osteoporosis among males and/or the number of males with osteoporosis is larger than or equal to women [28,29,30,31]. In our study, RO was identified at a higher rate among Bangladeshi women than men. In line with our findings, a systematic review concluded an association between female gender and osteoporosis [33]. Nevertheless, we found the prevalence of RO was significantly high among postmenopausal women than premenopausal women. A comparative study conducted within Asian men and women above 40 years found a higher prevalence of osteoporosis in postmenopausal women than their counterparts [30].
Age-related gradual and progressive bone loss occurred in both men and women. Bone desorption markedly decreased bone formation, a shift from osteoblastogenesis to predominant adipogenesis in the bone marrow, which also has a lipotoxic effect that affects matrix formation and mineralization, is mainly responsible for osteoporotic fracture risk at old age in both sex, the research revealed [34,35]. Our study showed that the prevalence of RO among younger men was lower than the counterpart of the same age group; however, prevalence progresses at a stiffer pace among men than women. However, it was found that the prevalence of RO in the age group of 50–59 of both genders was matched. Finally, we found a higher prevalence of RO among men than women in the age group of ≥60 years. In line with our findings, a review of the literature suggested that the osteoporosis prevalence rate increases at a much higher pace among females after 40 years than males, and the prevalence rate is equal in older women and men [36]. Additional research is warranted to find the elaborated picture. Multi-morbidity (co-occurrence of two or more chronic conditions) has an increased risk of functional decline, mortality, and poorer quality of life [37]. The prevalence of multimorbidity worldwide is rising and has moved onto the priority agenda for many health policymakers and healthcare providers [19]. The previous study found a high prevalence of multimorbidity among osteoporotic patients [38]; however, the predictability of multimorbidity for osteoporosis was not examined before. Our study identified multimorbidity as the main exposure variable of RO. On the other hand, similar to recent evidence, we found that diabetes and cardiovascular disease also have an exclusive association with RO [39,40].
A systematic review and meta-analysis concluded that lower BMI is a significant risk factor for osteoporosis [41]. Consistent with this finding, we found that the prevalence rate of RO among the underweight was higher than that of normal-weight participants. A representative cross-sectional survey of the noninstitutionalized population of the USA concluded that the relationship between smoking and osteoporosis is unclear [42]. Nonetheless, in our study, we found no statistically significant association between smoking status and RO.

5. Limitations

In this study, the universal limit of the QUS testing system and cross-sectional study cannot be ruled out. Self-information regarding menopausal status, smoking status, physical activity might vary slightly. However, the diagnosis record of comorbidities and multimorbidities was examined thoroughly and meticulously. Moreover, age calculation, height, and weight measurements were strictly controlled. The present study was carried out in Dhaka city, and therefore, the prevalence figures must be applied cautiously to the total of Bangladesh.

6. Conclusions

Age, gender, and morbidity predict osteoporosis differently and exclusively among adult men and women. Our research suggested that different approaches are warranted to avoid or manage osteoporosis and RO considering age, gender, gender, morbidity, and morbidity. However, we found a highly significant association between multimorbidity and RO. Special attention must be given to the patients with multimorbidity when discussing osteoporosis prevention. To find a better prevalence pattern of osteoporosis and RO in Bangladesh, additional research, including longitudinal study, is warranted.

Author Contributions

M.A. participated in the study conception, design, and coordination of the manuscript. M.A. and A.H. also performed the statistical analysis and helped to draft the manuscript. Z.U. reviewed the manuscript and helped to draft the manuscript. Z.U. also supervised the study. All authors have read and agreed to the published version of the manuscript.

Funding

This research received no external funding.

Institutional Review Board Statement

The Ethical Review Committee of the Uttara Adhunik Medical College and Hospital approved the study (UAMC-IRB-201905).

Informed Consent Statement

Informed consent was obtained from all subjects involved in the study.

Data Availability Statement

The data sets used and analyzed during the current study are available from the corresponding author on reasonable request.

Acknowledgments

All the authors acknowledge charity organizations for arranging free testing programs and participants for providing us with the information to conduct the study.

Conflicts of Interest

The authors declare no conflict of interest.

Abbreviations

RORisk of Osteoporosis;
ORFOsteoporosis-Related Fractures
DXADual-energy X-ray absorptiometry
QUSQualitative Ultrasound
BMIBody Mass Index
BUABroadband Ultrasonic Attenuation;
RECResearch Ethics Committee

References

  1. Sozen, T.; Ozisik, L.; Calik Basaran, N. An overview and management of osteoporosis. Eur. J. Rheumatol. 2017, 4, 46–56. [Google Scholar] [CrossRef]
  2. Wright, N.C.; Looker, A.C.; Saag, K.G.; Curtis, J.R.; Delzell, E.S.; Randall, S.; Dawson-Hughes, B. The Recent Prevalence of Osteoporosis and Low Bone Mass in the United States Based on Bone Mineral Density at the Femoral Neck or Lumbar Spine. J. Bone Miner. Res. 2014, 29, 2520–2526. [Google Scholar] [CrossRef] [Green Version]
  3. Kling, J.M.; Clarke, B.L.; Sandhu, N.P. Osteoporosis Prevention, Screening, and Treatment: A Review. J. Women's Health 2014, 23, 563–572. [Google Scholar] [CrossRef]
  4. Khan, A.H.; Jafri, L.; Ahmed, S.; Noordin, S. Osteoporosis and its perspective in Pakistan: A review of evidence and issues for addressing fragility fractures. Ann. Med. Surg. 2018, 29, 19–25. Available online: www.elsevier.com/locate/amsu (accessed on 5 January 2020). [CrossRef] [PubMed]
  5. Vondracek, S.F. Diagnosis and management of osteoporosis in the older senior. Clin. Interv. Aging. 2009, 4, 121. Available online: http://www.dovepress.com/diagnosis-and-management-of-osteoporosis-in-the-older-senior-peer-reviewed-article-CIA (accessed on 5 January 2020). [CrossRef] [PubMed] [Green Version]
  6. Nuti, R.; Brandi, M.L.; Checchia, G.; Di Munno, O.; Dominguez, L.; Falaschi, P.; Fiore, C.E.; Iolascon, G.; Maggi, S.; Michieli, R.; et al. Guidelines for the management of osteoporosis and fragility fractures. Intern. Emerg. Med. 2018, 14, 85–102. [Google Scholar] [CrossRef] [Green Version]
  7. Leibson, C.L.; ScD, A.N.A.T.; Gabriel, S.E.; Bs, J.E.R.; Melton, L.J. Mortality, Disability, and Nursing Home Use for Persons with and without Hip Fracture: A Population-Based Study. J. Am. Geriatr. Soc. 2002, 50, 1644–1650. [Google Scholar] [CrossRef]
  8. Vochteloo, A.J.H.; Van Vliet-Koppert, S.T.; Maier, A.; Tuinebreijer, W.E.; Röling, M.L.; De Vries, M.R.; Bloem, R.M.; Nelissen, R.; Pilot, P. Risk factors for failure to return to the pre-fracture place of residence after hip fracture: A prospective longitudinal study of 444 patients. Arch. Orthop. Trauma Surg. 2012, 132, 823–830. [Google Scholar] [CrossRef] [Green Version]
  9. Rajendran, K.; Suthakaran, P.K.; Nair, L.; Rajaram, L.; Kalappan, M.; Sivanesan, M. Evaluation of osteoporosis using calcaneal QUS and FRAX score as a screening tool in a semi urban tertiary care hospital of South India. Int. J. Adv. Med. 2015, 341–345. [Google Scholar] [CrossRef]
  10. Steiner, B.; Dimai, H.P.; Steiner, H.; Cirar, S.; Fahrleitner-Pammer, A. Prescreening for Osteoporosis With Quantitative Ultra-sound in Postmenopausal White Women. J. Ultrasound Med. 2019, 38, 1553–1559. [Google Scholar] [CrossRef] [Green Version]
  11. Prastowo, N.A.; Ali, S.; Haryono, I.R. A Population-based Study on Bone Mineral Density Using Dual-Energy X-Ray Absorp-tiometry (DEXA) in Postmenopausal Women in Jakarta, Indonesia. Int J. Osteoporos Metab Disord. 2018, 11, 1–6. [Google Scholar] [CrossRef]
  12. Chin, K.-Y.; Ima-Nirwana, S. Calcaneal Quantitative Ultrasound as a Determinant of Bone Health Status: What Properties of Bone Does It Reflect? Int. J. Med. Sci. 2013, 10, 1778–1783. Available online: http://www.medsci.org1778 (accessed on 22 December 2019). [CrossRef] [Green Version]
  13. Burke, É.; Carroll, R.; ‘O’Dwyer, M.; Walsh, J.B.; McCallion, P.; McCarron, M. Quantitative examination of the bone health status of older adults with intellectual and developmental disability in Ireland: A cross-sectional nationwide study. BMJ Open 2019, 9, e026939. Available online: http://0-bmjopen-bmj-com.brum.beds.ac.uk/ (accessed on 22 December 2019). [CrossRef]
  14. Frost, M.L.; Blake, G.M.; Fogelman, I. Quantitative Ultrasound and Bone Mineral Density Are Equally Strongly Associated with Risk Factors for Osteoporosis. J. Bone Miner. Res. 2001, 16, 406–416. [Google Scholar] [CrossRef]
  15. Rhee, Y.; Lee, J.; Jung, J.Y.; Lee, J.E.; Park, S.Y.; Kim, Y.M.; Lee, S.; Choi, H.S.; Kim, S.H.; Lim, S.-K. Modifications of T-Scores by Quantitative Ultrasonography for the Diagnosis of Osteoporosis in Koreans. J. Korean Med. Sci. 2009, 24, 232–236. [Google Scholar] [CrossRef]
  16. Moayyeri, A.; Adams, J.E.; Adler, R.A.; Krieg, M.-A.; Hans, D.; Compston, J.; Lewiecki, E.M. Quantitative ultrasound of the heel and fracture risk assessment: An updated meta-analysis. Osteoporos. Int. 2011, 23, 143–153. [Google Scholar] [CrossRef]
  17. Begum, S.M.; Begum, R.; Alam, R. Bone Mineral Density and Osteoporosis in Women of Rural and Urban Dwellers. Bangladesh J. Nucl. Med. 2017, 18, 39–42. [Google Scholar] [CrossRef] [Green Version]
  18. Misra, A. Ethnic-Specific Criteria for Classification of Body Mass Index: A Perspective for Asian Indians and American Diabetes Association Position Statement. Diabetes Technol. Ther. 2015, 17, 667–671. [Google Scholar] [CrossRef] [PubMed] [Green Version]
  19. Navickas, R.; Petric, V.-K.; Feigl, A.B.; Seychell, M. Multimorbidity: What Do We Know? What Should We Do? J. Comorbidity 2016, 6, 4–11. [Google Scholar] [CrossRef] [PubMed]
  20. NIH State-of-the-Science Conference Statement on management of menopause-related symptoms. NIH Consens. State Sci. Statements 2005, 22, 1–38.
  21. Chan, M.Y.; Nguyen, N.D.; Center, J.R.; Eisman, J.A.; Nguyen, T.V. Quantitative ultrasound and fracture risk prediction in non-osteoporotic men and women as defined by WHO criteria. Osteoporos. Int. 2013, 24, 1015–1022. Available online: http://0-www-ncbi-nlm-nih-gov.brum.beds.ac.uk/pubmed/22878531 (accessed on 20 March 2020). [CrossRef]
  22. Kanis, J.A. Diagnosis of osteoporosis and assessment of fracture risk. Lancet 2002, 359, 1929–1936. [Google Scholar] [CrossRef]
  23. Kruger, M.C.; Todd, J.M.; Schollum, L.M.; Kuhn-Sherlock, B.; McLean, D.W.; Wylie, K. Bone health comparison in seven Asian coun-tries using calcaneal ultrasound. BMC Musculoskelet. Disord. 2013, 14, 81. Available online: http://0-www-biomedcentral-com.brum.beds.ac.uk/1471-2474/14/81 (accessed on 6 January 2020). [CrossRef] [PubMed] [Green Version]
  24. Lee, C.N.Y.; Lam, S.C.; Tsang, A.Y.K.; Ng, B.T.Y.; Leung, J.C.Y.; Chong, A.C.Y. Preliminary investigation on prevalence of osteoporosis and osteopenia: Should we tune our focus on healthy adults? Jpn. J. Nurs. Sci. 2014, 12, 232–248. [Google Scholar] [CrossRef] [PubMed]
  25. Black, D.M.; Rosen, C.J. Postmenopausal Osteoporosis. N. Engl. J. Med. 2016, 374, 254–262. [Google Scholar] [CrossRef] [PubMed]
  26. Thulkar, J.; Singh, S.; Sharma, S.; Thulkar, T. Preventable risk factors for osteoporosis in postmenopausal women: Systematic review and meta-analysis. J. Mid-Life Health 2016, 7, 108. [Google Scholar] [CrossRef] [PubMed]
  27. Pasco, J.A.; Lane, S.E.; Brennan, S.L.; Timney, E.N.; Bucki-Smith, G.; Dobbins, A.G.; Nicholson, G.C.; Kotowicz, M.A. Fracture risk among older men: Osteopenia and osteoporosis defined using cut-points derived from female versus male reference data. Osteoporos. Int. 2013, 25, 857–862. [Google Scholar] [CrossRef]
  28. Bonnick, S.L. Osteoporosis in men and women. Clin. Cornerstone 2006, 8, 28–39. [Google Scholar] [CrossRef]
  29. Cawthon, P.M. Gender Differences in Osteoporosis and Fractures. Clin. Orthop. Relat. Res. 2011, 469, 1900–1905. [Google Scholar] [CrossRef] [Green Version]
  30. Kadam, N.; Chiplonkar, S.; Khadilkar, A.; Khadilkar, V. Prevalence of osteoporosis in apparently healthy adults above 40 years of age in Pune City, India. Indian J. Endocrinol Metab. 2018, 22, 67. [Google Scholar]
  31. Nelson, R.E.; Willson, T.; Nelson, S.; Newbold, J.; LaFleur, J. The clinical epidemiology of male osteoporosis: A review of the recent literature. Clin. Epidemiol. 2015, 7, 65–76. [Google Scholar] [CrossRef] [PubMed] [Green Version]
  32. Qiao, D.; Liu, X.; Tu, R.; Zhang, X.; Qian, X.; Zhang, H.; Jiang, J.; Tian, Z.; Wang, Y.; Dong, X.; et al. Gender-specific prevalence and influencing factors of osteopenia and osteoporosis in Chinese rural population: The Henan Rural Cohort Study. BMJ Open 2020, 10, e028593. [Google Scholar] [CrossRef] [PubMed] [Green Version]
  33. Chen, P.; Li, Z.; Hu, Y. Prevalence of osteoporosis in China: A meta-analysis and systematic review. BMC Public Health 2016, 16, 1–11. [Google Scholar] [CrossRef] [Green Version]
  34. Khosla, S. Pathogenesis of Age-Related Bone Loss in Humans. Med. Sci. Cite J. J. Gerontol A Biol. Sci. Med. Sci. 2013, 68, 1226–1235. [Google Scholar] [CrossRef] [Green Version]
  35. Lane, N.E. Glucocorticoid-Induced Osteoporosis: New Insights into the Pathophysiology and Treatments. Curr. Osteoporos. Rep. 2019, 17, 1–7. [Google Scholar] [CrossRef]
  36. Alswat, K.A. Gender Disparities in Osteoporosis. J. Clin. Med. Res. 2017, 9, 382–387. [Google Scholar] [CrossRef] [Green Version]
  37. Zhang, L.; Sun, F.; Li, Y.; Tang, Z.; Ma, L. Multimorbidity in Community-Dwelling Older Adults in Beijing: Prevalence and Trends, 2004–2017. J. Nutr. Health Aging 2020, 25, 116–119. [Google Scholar] [CrossRef]
  38. Puth, M.-T.; Klaschik, M.; Schmid, M.; Weckbecker, K.; Münster, E. Prevalence and comorbidity of osteoporosis—A cross-sectional analysis on 10,660 adults aged 50 years and older in Germany. BMC Musculoskelet. Disord. 2018, 19, 144. [Google Scholar] [CrossRef]
  39. Farhat, G.N.; Cauley, J.A. The link between osteoporosis and cardiovascular disease. Clin. Cases Mineral. Bone Metabolism. 2008, 5, 19–34. [Google Scholar]
  40. Khan, T.S.; Fraser, L.A. Type 1 diabetes and osteoporosis: From molecular pathways to bone phenotype. J. Osteoporosis. 2015, 2015, 174186. [Google Scholar] [CrossRef] [PubMed] [Green Version]
  41. De Laet, C.; Kanis, J.A.; Odén, A.; Johanson, H.; Johnell, O.; Delmas, P.; Eisman, J.A.; Kroger, H.; Fujiwara, S.; Garnero, P.; et al. Body mass index as a predictor of fracture risk: A me-ta-analysis. Osteoporos. Int. 2005, 16, 1330–1338. [Google Scholar] [CrossRef] [PubMed]
  42. Strozyk, D.; Gress, T.M.; Breitling, L.P. Smoking and bone mineral density: Comprehensive analyses of the third National Health and Nutrition Examination Survey (NHANES III). Arch. Osteoporos. 2018, 13, 16. [Google Scholar] [CrossRef] [PubMed]
Figure 1. DAG demonstrating causal relationships and potential biasing pathways affecting the association between independent variables and risk of osteoporosis (produced using DAGitty V.2.3 software). In this conceptual diagram, each circle represents an individual exposure (“node”) of theoretical relevance to this hypothesis; each node is interconnected by directional arrows (“edges”) that represent theoretical associations based on the researchers’ assessment of a priori literature and determination of biological plausibility. Multimorbidity was the exposure of interest (green node with black border), with risk of osteoporosis (blue node with the black edge) as the outcome of interest. In this instance, all the other exposures (“nodes”) are theoretically causally associated with (i.e., ancestors of) both the exposure and the outcome. To adjust for confounding in the association of interest, it is necessary to close all “backdoor pathways” between the exposure and outcome (i.e., any pathway consisting of a series of one or more edges and nodes) that provides an alternate route between the exposure and outcome); this is accomplished by adjusting for at least one node on that path. The minimally sufficient adjustment set is the combination of the fewest nodes that, being ancestors of both the exposure and outcome, if selected, effectively block all backdoor pathways between the exposure and the outcome (white nodes with black borders). These “adjusted variables” are then introduced into the multivariate modeling as potential confounders.
Osteology 01 00018 g001
Figure 2. Age-specific prevalence (percentage) of risk of osteoporosis among male and female subjects.
Osteology 01 00018 g002
Table 1. Univariate analysis of sociodemographic and clinical factors.
FactorsRisk of OsteoporosisTotal (% within Total)p-Value *
No (%)Yes (%)
All330 (62.7)196 (37.3)526 (100)
Gender0.003
Male168 (69.7)73 (30.3)241 (45.8)
Female162 (56.8)123 (43.2)285 (54.2)
Marital status1.000
Married303 (62.7)180 (37.3)483 (91.8)
Not married 27 (62.7)16 (37.3)43 (8.2)
Age (Years)<0.001
30–39145 (73.2)53 (26.8)198 (37.6)
40–4990 (70.9)37 (29.1)127 (24.1)
50–5961 (53.0)54 (47.0)115 (21.9)
≥6034 (39.5)52 (60.5)86 (16.4)
BMI0.397
Underweight5 (45.5)6 (55.5)11 (2.1)
Normal149 (65.9)77 (34.1)226 (43.0)
Overweight132 (60.3)87 (39.7)219 (41.6)
Obese44 (62.9)26 (37.1)70 (13.3)
Physical Activity0.536
Sedentary 228 (64.0)128 (36.0)356 (67.7)
Light68 (61.8)42 (38.2)110 (20.9)
Moderate-vigorous34 (56.7)26 (43.3)60 (11.4)
Sleeping arrangement0.077
Hard bed265 (60.9)170 (39.1)435 (82.7)
Foam bed65 (71.4)26 (28.3)91 (17.3)
Education0.182
Masters and above 77 (62.6)46 (37.4)123 (23.4)
Bachelor level60 (70.6)25 (29.4)85 (16.2)
Elementary to secondary170 (62.3)103 (37.7)273 (51.9)
Illiterate 23 (51.1)22 (48.9)45 (8.6)
Smoker0.864
No276 (63.0)162 (37.0)438 (83.3)
Yes54 (61.4)34 (38.6)88 (16.7)
Diabetes0.003
No281 (65.8)146 (34.2)427 (81.2)
Yes49 (49.5)50 (50.5)99 (18.8)
Cardiovascular disease<0.001
No321 (66.2)164 (37.8)485 (92.2)
Yes9 (22.0)32 (78.0)41 (7.8)
Multi-morbidity<0.001
No328 (64.8)178 (35.2)506 (96.2)
Yes2 (10.0)18 (90.0)20 (3.8)
* Bold faces are significant at 5% significance level.
Table 2. Results from a multivariable linear regression model with T-score as an outcome.
VariablesCategoriesModel 1 (All Data) *Model 2 (Female Data) *Model 3 (Male Data) *
Gender Female1.92, (1.30–2.86), 0.001--
MaleReference
Age30–39Reference
40–491.13, (0.68–1.87), 0.6240.99, (0.32–2.83), 0.9771.06, (0.56–2.00), 0.852
50–592.31, (1.40–3.84), 0.0011.98, (0.55–6.78), 0.2821.66, (0.84–3.29), 0.143
≥603.51, (2.02–6.17), <0.0014.18, (1.03–16.94), 0.0442.01, (0.99–4.10), 0.510
Multi-morbidity Yes9.16, (2.48–59.36), <0.0017.34, (1.18–42.73) 0.07210.0, (1.82–87.09), 0.031
NoReference
BMINormalReference
Obese1.16, (0.63–2.11), 0.6281.44, (0.59–3.50), 0.4190.98, (0.38–2.39), 0.957
Overweight1.23, (0.81–1.85), 0.3321.44, (0.70–3.02), 0.3271.27, (0.75–2.13), 0.368
* The values present slope (95% confidence interval) and p-value. Bold faces are significant at 5% significance level.
Publisher’s Note: MDPI stays neutral with regard to jurisdictional claims in published maps and institutional affiliations.

