
Intelligent Sensors for Real-Time Decision-Making
by
 , , , and
Tiago Coito
1,* ,
,
Bernardo Firme
1,
Miguel S. E. Martins
1,
Susana M. Vieira
1,
João Figueiredo
2 and
and
João M. C. Sousa
1,*
1
Department of Mechanical Engineering, Center of Intelligent Systems, IDMEC, University of Lisbon, Instituto Superior Técnico, 1049-001 Lisbon, Portugal
2
Department of Mechatronics, IDMEC, University of Évora, 7000-645 Évora, Portugal
*
Authors to whom correspondence should be addressed.
Automation 2021, 2(2), 62-82; https://0-doi-org.brum.beds.ac.uk/10.3390/automation2020004
Submission received: 31 March 2021
/
Revised: 7 May 2021
/
Accepted: 7 May 2021
/
Published: 12 May 2021
Abstract
:The simultaneous integration of information from sensors with business data and how to acquire valuable information can be challenging. This paper proposes the simultaneous integration of information from sensors and business data. The proposal is supported by an industrial implementation, which integrates intelligent sensors and real-time decision-making, using a combination of PLC and PC Platforms in a three-level architecture: cloud-fog-edge. Automatic identification intelligent sensors are used to improve the decision-making of a dynamic scheduling tool. The proposed platform is applied to an industrial use-case in analytical Quality Control (QC) laboratories. The regulatory complexity, the personalized production, and traceability requirements make QC laboratories an interesting use case. We use intelligent sensors for automatic identification to improve the decision-making of a dynamic scheduling tool. Results show how the integration of intelligent sensors can improve the online scheduling of tasks. Estimations from system processing times decreased by over 30%. The proposed solution can be extended to other applications such as predictive maintenance, chemical industry, and other industries where scheduling and rescheduling are critical factors for the production.
1. Introduction
Nowadays, the decreasing sensor prices and the digital transformation are forcing the industry to adopt more flexible data-based solutions. Together, with the continuous growth in mass customization in the new industry 5.0 paradigm, the integration of data towards decision support systems using cost-effective solutions will be even more crucial [1,2]. Information acquired from sensors can be routed to higher levels of decision, improving decision-making. However, there are several challenges. Decision support systems often fail due to insufficient data quality and not due to algorithmic difficulties or the volume of information [3,4]. In scheduling, for instance, data quality problems are in both processing time estimations and business process mappings. These include custom production workflows or resources behaving differently. The missing data often comes from manual time studies, empirical knowledge, and unstructured sources [5]. These lead to inefficient scheduling and productivity losses. However, improvements in data acquisition in complex manufacturing and flexible environments did not receive enough attention in the literature. The simultaneous integration of real-time information from the cloud with sensors in different local architectures and acquiring valuable information can be challenging. The engineered systems must ensure the proper sensors are used and provide relevant data.
Intelligent sensors or smart sensors are distinguished from their non-intelligent counterparts, by their integrated electronics with advanced communication and computational processing capabilities. These include signal enhancements features, the capacity to store information for future analysis, onboard decision-making, and a two-way communication interface, enabling functions such as remote self-calibration and self-diagnosis of faults [6,7]. Intelligent sensors decentralize the decision-making with signal processing in the lower layers of the system hierarchy. It decreases the complexity of architectures by reducing the number of data integration layers required against other traditional approaches. Regarding communication connections, smart sensors may include wireless and Ethernet connectivity. Equipping intelligent sensors with communication standards such as OPC UA PubSub over Time Sensitive Networks (TSN) provide vertical and horizontal interoperability between the sensor and the cloud enabling IoT platforms in a cloud-to-thing continuum [8,9]. In Section 2.1. we present applications and information architectures for integrating intelligent sensors towards real-time decision-making.
The main research question of the work is on how to effectively integrate and acquire information from intelligent sensors towards assisting with cloud data-based decision-making in real-time. To answer our research question, we applied intelligent sensors on a real-time decision-making industrial problem. We use automatic identification sensors to trigger and improve the decision-making of the dynamic scheduling of tasks in analytical Quality Control (QC) laboratories. Sensor systems used were Radio Frequency Identification (RFID): High Frequency (HF) and Ultra High Frequency (UHF) as a Real-Time Location System (RTLS); and Barcode: laser and image-based. Automatic identification intelligent sensors perfectly align with IoT platforms and autonomous decision-making. These include onboard pattern and object recognition features with advanced connectivity options. QC laboratories are an enticing use case, facing a trend in personalized production with growing regulatory complexity and traceability requirements. The dynamic scheduling and planning of resources is a representative problem, which uses automatic intelligent sensor identification. The focus is on the integration of data into useful information for decision-making. In addition to the main question, other research question arises, more specific to the use case, such as how to provide more precise task and subtask times, using automatic identification, under a mass customization environment to improve dynamic scheduling. The introduction of automatic identification in our implementation increased the digital information available, improving scheduling operations. The main contributions of this paper are:
- On industrial architectures and intelligent sensor technologies to achieve the digital twin and support decision-making, relying on the simultaneous acquisition of real-time data from the cloud and edge devices in a cloud-fog-edge architecture.
- An implementation to integrate business data with intelligent sensors for automatic identification, to estimate the duration of tasks and subtasks in real-time, supporting dynamic scheduling in personalized production environments.
This paper is structured as follows: Section 2 presents a brief state of the art on architectures and applications that use intelligent sensors towards decision-making. The use case is on automatic identification applied to the scheduling of tasks in analytical QC laboratories. Section 3 provides detailed information regarding the use case with component characterization and connections. Section 4 presents the implementation, workflow, and analyses. Section 5 discusses the sensors used and the architecture adopted. Finally, Section 6 presents major conclusions and future work.
2. Architectures of Intelligent Sensors for Decision-Making
Today, modern system architectures are increasingly more dependent on data [10,11]. Several frameworks are focusing on the integration of information from intelligent sensors towards real-time decision-making. Trunzer et al. proposes a middleware-based data collection architecture, focusing on interoperability in a technology-neutral framework [12]. A middleware platform relying on a multi-workload database model incorporating business data in real-time has also been proposed [13]. This paper focuses on interoperability and industrial communication standards, such as OPC UA over TSN and PROFINET, evaluating the network latency while reading and writing between OPC nodes and a decision support system in real-time. Decision support systems typically rely on the integration of information from multiple sources under different local architectures. In the IoT vision for industry 4.0, equipping sensors with onboard processing capabilities and connectivity options means faster and more flexible data exchange between the shop floor and the decision-making. However, connecting intelligent sensors directly to the cloud is often impractical and expensive. The increasing diversity of architectures and requirements makes fog computing popular within Industrial IoT (IIoT) system architectures [14]. Fog computing is an intermediary step between the cloud and the edge [15]. It decreases the latency of data transmission moving computational resources closer to the edge while also offloading intelligent sensors [16,17]. It also improves interoperability and security by creating a data structuring and integration layer for legacy devices. There is a gap between reference conceptual architectures and use case-specific implementations [12,18]. To improve industry 4.0 reference architectures, such as the OpenFog Reference Architecture, we examine applications on intelligent sensors integrations towards real-time decision-making in cloud-fog-edge architectures.
2.1. Applications and Use Case
In the literature, intelligent sensors are often used in applications towards real-time decision-making such as predictive models, automatic rescheduling, machine learning, and data mining:
Fog computing is helping intelligent sensors in many of these applications. A framework with guidelines for the physical realization of system architectures with automatic decision-making and their impacts on internal supply chains has been previously proposed in the literature [39]. It focuses on the automation pyramid disruption and analyses data requirements, features, or dimensions of the problem to be addressed, such as interoperability, responsiveness, traceability, and what data to acquire towards achieving faster time-to-market, increased flexibility, efficiency, and quality.
2.1.1. Predictive Models
Regarding predictive models, such as towards predictive maintenance, these can be integrated into existing scheduling systems, adding triggers indicating resource unavailability, whilst contributing to dynamic scheduling algorithms. Additionally, like dynamic scheduling, predictive models rely on real-time information acquired from sensorized equipment in the shop floor towards decision-making. O’Donovan et al. [40] use sensors in a cloud-fog-sensing architecture to deliver real-time embedded machine learning engineering applications for Industry 4.0. It uses PMML-encoded machine learning models and Raspberry PI (for its portability) as a fog computing gateway. Wu et al. [22] use Arduino and a ZigBee module for wireless communication as fog computing to detect and measure vibrations and the temperature on pumps and CNC machines towards real-time predictive maintenance. Lavassani et al. [16] present a framework that combines fog and cloud computing with distributed data modeling at the sensor device for wireless sensor networks. It also uses a Raspberry PI gateway as fog with wireless communication and a java program to publish values in the cloud via MQTT for machine learning and data mining applications. Syafrudin et al. [41] use classification models for fault prediction in an assembly line process for producing door-trim at automotive manufacturing. Here a single-board computer gateway (Raspberry Pi) was used to acquire temperature, humidity, accelerometer, and gyroscope data. Then, a fog computing python application was used to send data into a historical database in MongoDB, to be used in real-time for fault prediction. Cakir [23] proposes a low-cost IIoT based architecture of a condition monitoring System (CMS) to capture the vibration, sound, current, rotational speed, and temperature to classify the expected durability of bearings and their damage using machine learning methods towards predictive maintenance. Along with the sensors, their setup relies on a Wi-Fi module, a Bluetooth module, and a microcontroller platform based on Arduino to send data to a PC.
2.1.2. Dynamic Scheduling
Scheduling problems are an excellent example of the necessary integration between intelligent sensors and decision support systems. Sensors for automatic identification can be used to merge task and resource events with other business information to improve scheduling operations. Tools such as this rely on real-time and historical data to estimate the duration of each task/subtask for every personalized production order. Thus, one of the main objectives is to automatically record timestamps after each resource change of state, along with all the necessary information to provide context and meaning to existing records. Several authors explore the potential of automatic identification to improve resource tracking and scheduling in real-time. Chongwatpol et al. [25] researched the potential of using automatic identification technologies to track delays in the arrival of raw materials, or machine downtimes to improve real-time scheduling. According to their study, performing thousands of analyses enables gathering enormous quantities of data. In the future, such systems will facilitate high-throughput analysis, increasing the accuracy of tests, and decreasing labor costs. In Zhong et al. [42] machines were equipped with RFID readers and operator’s RFID tags. The authors then examine the duration of tasks considering different factors, such as working shifts, different machines, gender, operator experience, and technology complexity. This information is then used on future schedules to improve estimated task durations.
Analytical QC laboratories are an interesting use case of scheduling problems. In analytical QC labs, every drug must be sampled and tested along the value chain to ensure it meets all safety and quality requirements. In the last years, several factors contributed to an increase in the complexity of analytical QC laboratories, such as growing regulatory complexity, an increase in personalized production, and traceability requirements. This has also increased the complexity of the scheduling operations. RFID and Barcode applications include supply chain, inventory management, tracking goods and humans to healthcare [31]. In industries like drug manufacturing, making mistakes is unacceptable as QC can have a direct impact on the health of the consumer [43]. IoT and automatic identification sensors track asset locations and movements, minimizing data errors, increasing timely information, eliminating paperwork, and decreasing inventory-related problems [44]. Prabhu et al. [45] discuss the adoption of RFID, barcode identification, and robotic systems to analytical laboratories, to improve drug quality control. In analytical QC labs, scheduling information usually recurs from the ERP, the Laboratory Information Management Systems (LIMS), and real-time information from the laboratories [46]. While most production orders follow a schedule, unexpected samples arrive with top priority, forcing the schedule to readjust in real-time. Analysts and equipment can also have unique competencies, making resource allocation difficult.
In QC laboratories the need to track samples and log them into LIMS is not new. Unlike other supply chain applications, laboratory samples are typically unique. Automatic identification technologies such as RFID improve LIMS by creating a location-based tracking, real-time chain-of-custody (COC) [47]. Analytical chemistry, forensics, clinical trials, and diagnostic laboratories are examples of applications where the integrity of the sample life cycle is crucial. Current LIMS do not provide granular timestamps of each operation, nor is information readily available in real-time. In addition, Electronic Lab Notebooks (ELN) often are more concerned with following recipes and recording results than enforcing the timely introduction of data. Urso et al. [48] use RFID identification and automatic Business Process Mapping (BPM) to analyze the pharmaceutical workflow. It tracks relevant lead times characterizing the main phases of the production cycles.
Although the case presented in this study is for a specific job shop, its workflow provides details and problem scenarios present in many manufacturing operations. The implementation, discussion, and conclusions on the QC laboratories are generic for many decision-making applications affected by mass customization and digitalization challenges.
2.2. Automatic Identification
Automatic identification technologies refer to the methods for automatic identification of objects and data collection into computer systems. They have an important role regarding data integrity and reliability, increasing the data quality, and improving data management. Automatic identification can be hundreds of times faster than manually entry codes and are less prone to errors [49]. Automatic identification introduces operational savings and improves efficiency. It allows for more efficient regulatory actions and develops decision-making tools. Moreover, in heavily regulated industries, traceability is often mandatory as quality defects are not tolerated. An example is the quality control of the pharmaceutical industry. Two of the most successful automatic identification technologies are optical identification systems and radio identification systems. Other automatic identification technologies will not be discussed in this work, such as smart cards, optical character recognition, biometrics (retina and finger), voice recognition, ultrasounds, and any method that obtains unique external data through analysis of images, sounds, or videos [50].
2.2.1. Optical System Identification
Optical system identification can be based on imaging and/or scanning through an optical sensor. Examples of codes are: 1D Barcodes; 2D Matrix Codes: QR Code, Data Matrix, Direct Part Marking (DPM); Text Recognition (OCR); object recognition [50]. When using the image, the optical reader records an image of the barcode and decodes the information with digital imaging software. It often uses onboard machine learning and pattern recognition software to identify the type of barcode used and decode its information. Optical systems can also use laser scanning lines. The light reflects from the barcode into a light-detecting photoelectric cell, and the information is decoded. For instance, Youssef et al. [49] propose a smart barcode detection and recognition system for the identification of people and goods. The author uses an intelligent barcode reader to train a back-propagation neural network to decode distorted barcodes using laser-optical sensors.
2.2.2. Radio System Identification
Several radio system identification technologies are used in IoT depending on its application (e.g., tracking, indoor positioning) with different energy consumptions, ranges, and precisions. Examples include RFID, ZigBee, Near-Field Communication (NFC), Bluetooth and Bluetooth Low Energy (BLE), Ultra-Wideband (UWB), Wireless Local Area Network (WLAN), and Global Position System (GPS).
RFID is a wireless technology that allows automatic independent identification and tracking of objects and people in an indoor environment. The technology is based on the communication between tags and readers through antennas by sending and receiving a unique identity through radio waves. RFID tags are unique identity labels containing data and typically have three components: an integrated circuit that stores the data and decodes/codes radio frequency signals; an antenna to receive and transmit signals and a mechanism that is activated by a reader signal. Generically, RFID tags can either be passive (cheaper) using the radio energy transmitted by the reader or active if it has an onboard battery. Typical RFID systems are classified in Passive Reader Active Tag (PRAT), Active Reader Passive Tag (ARPT), or Active Reader Active Tag (ARAT).
RFID adds extra functionality to barcode identification, including automatic remote bulk reading, and the ability to modify the tag information [51]. Therefore, RFID systems are more expensive and difficult to set up when compared to a barcode system. RFID properties depend on their frequency band. While low-frequency RFID tags can have a limited range to a few centimeters (<30 cm), higher frequency tags (UHF) allow for higher reading speeds and considerable ranges (~10 m). However, UHF tags are also subjected to interferences depending on the solid state of the surroundings. Radio waves bounce off metal and are absorbed by liquids at ultra-high frequencies (longer ranges). However, RFID technology is still being improved. Recent studies on UHF RFID tags, for instance, have shown improved performance on liquid bottles [52]. One of the major challenges to RFID is the price when the number of things to track starts to increase. The presence of electronic circuits makes the price of these tags non-negligible. An alternative approach is to use chipless RFID tags that use RF waves to analyze the radar signature of the tag. In chipless RFID tags, the strategy is to use low-cost conductive inks to print a planar encoded pattern containing the ID code. The price of the tag can be substantially reduced; however, it still offers much lower performance in terms of reading range and data capacity compared to standard RFID tags or even optical barcodes [53].
2.2.3. Real-Time Location Systems
RTLS is another important class of radio-based automation identification systems on the shop floor. These provide the ability to locate objects and people in three-dimensional spaces. RFID can use the received Signal Strength Indicator (RSSI) for position estimation. It can be used individually or, for example, through trilateration using at least three reader antennas for more accurate object localization and positioning. Omer et al. [54] proposed an enhanced method to estimate the indoor distance for passive UHF RFID tag where the distance measurements rely on a relationship between the RSSI and the differential of the Radar Cross-Section (RCS). Huang et al. [55] propose the combined use of RFID and UWB to improve the precision of an RTLS. The RFID accesses the room entrance, exit, and near each of the workstations. UWB remedies the disadvantages of RFID in positioning accuracy for tools and AGVs within the inspection area over the remaining blind spots. Unlike RFID that uses signal strength, UWB measures the Time Difference of Arrival (TdoA) between multiple antennas to triangulate the positioning of the active transponders. Because UWB uses high bandwidths, it has the advantage of eliminating material interferences on its lower frequencies, providing precision to a few centimeters level. UWB also relies on the Line-of-Sight (LoS) signal for calculations, as reflections caused by material interferences have little impact on the accuracy as these travel much longer distances. Nevertheless, UWB accuracy deteriorates with the increasing presence of obstacles. One of the main challenges of adopting UWB was the interference with coexisting radio frequency technologies such as Wi-Fi; however, new designs and a low-power emission spectrum prevent them from interfering with other systems [56]. Comparing to RFID, UWB is a more expensive radio identification option and always requires at least three antennas. BLE, on the other hand, has become a cheaper alternative technology for indoor positioning. It has a longer battery life and can use the Wi-Fi network infrastructure, saving on hardware. The drawback is its lower accuracy, up to several meters. Nevertheless, recent version BLE 5.1 specification enables measuring the direction of an incoming signal through the Angle of Arrival (AoA), improving accuracy in the position estimation and improvements in the advertising mode [57].
With the growth of mass customization, data acquisition and integration in real-time is crucial for the success of Cyber-Physical Systems (CPS) and decision support systems. From the literature review, fog-based architectures enable efficient data exchange between the enterprise and shop floor levels to meet each application requirement. This is assisted by intelligent sensors with enhanced onboard processing and connectivity options. The following research aims to tackle and discuss these challenges in an industrial use case affected by personalized production and complex workflows. In the studied use case, the processing workflow times are difficult to properly acquire and act as a major bottleneck affecting productivity through inefficient scheduling. The acquisition of timestamps with automatic identification sensors is of extreme importance in the development of digital twins and planning and scheduling activities across many industries.
3. Strategy for Integrating Intelligent Sensors
3.1. Methodology
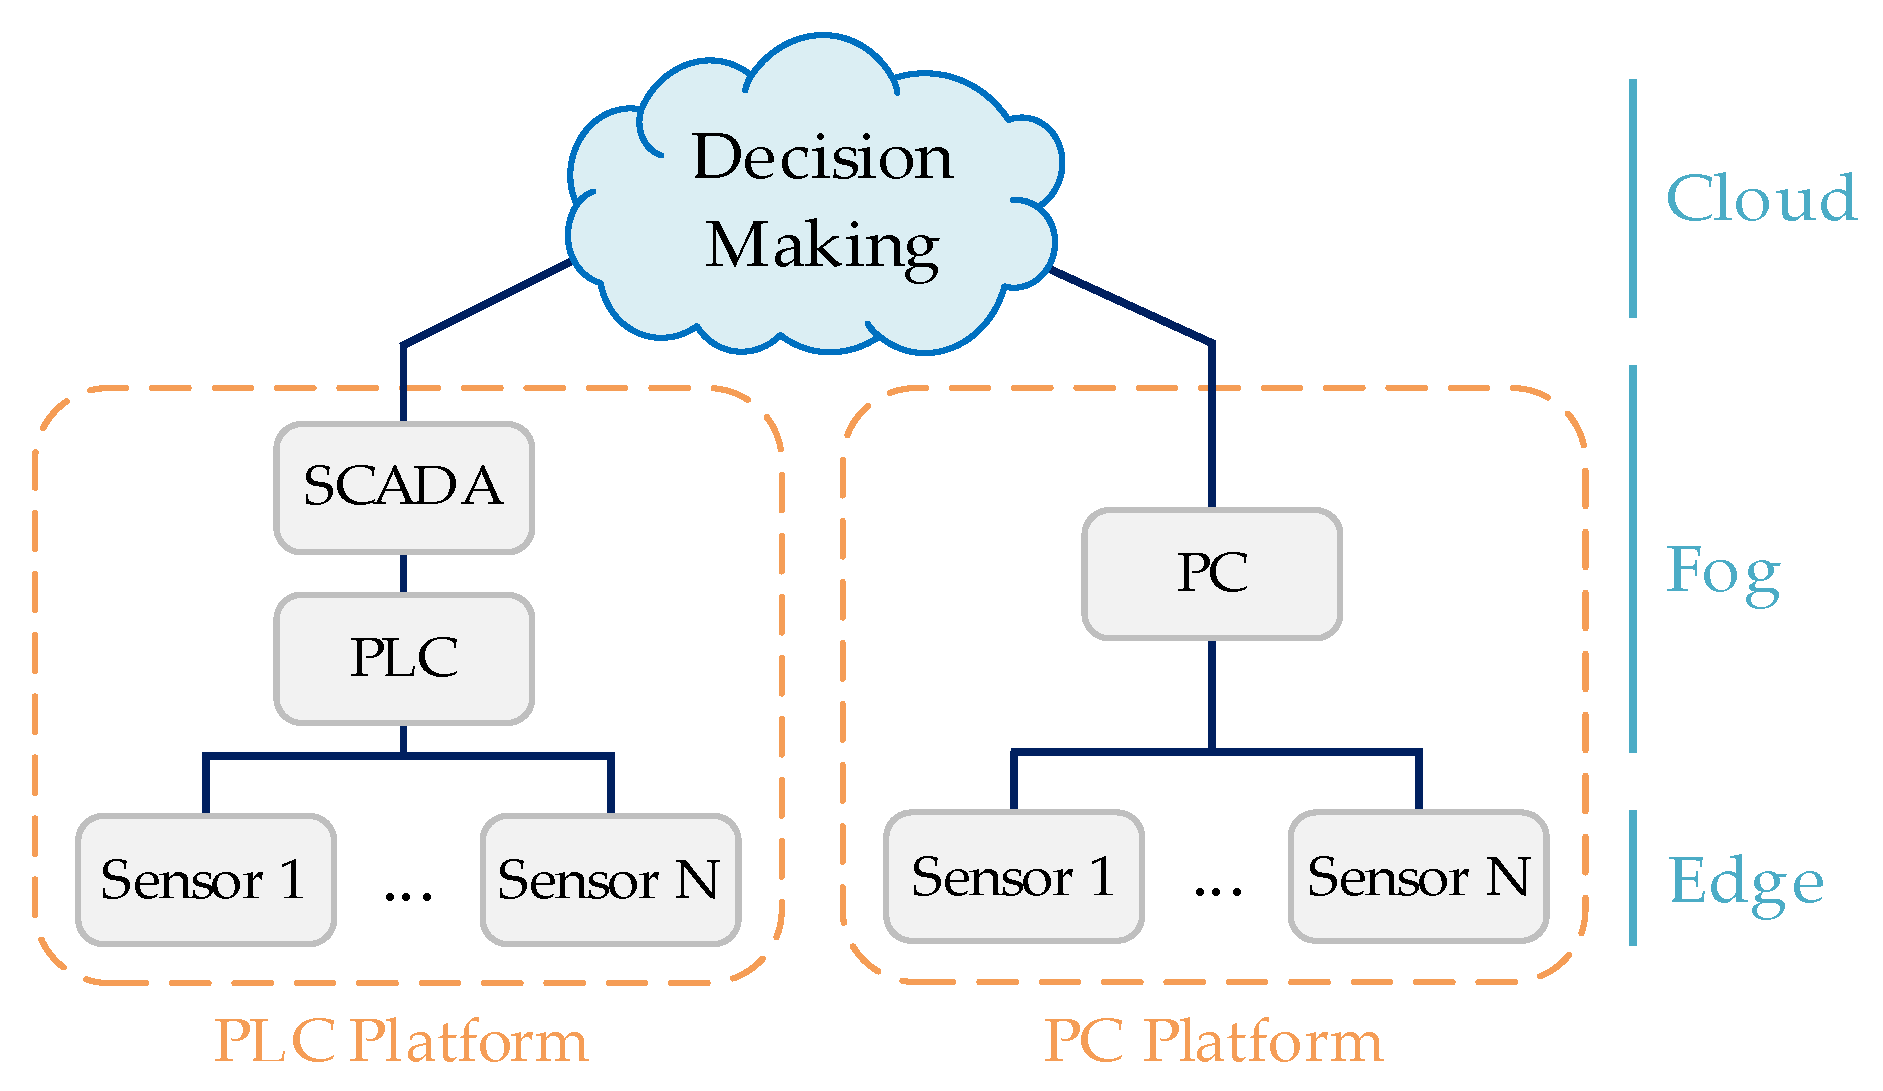
Intelligent sensors can be used in the industry to empower decision-making in a cloud-to-thing paradigm. Our methodology is to use current industrial architectures, such as those based on fog computing, to analyze and discuss the use of intelligent sensors in industry 4.0 and the smart factory. In our implementation, we are particularly interested in the acquisition of timestamps to feed a dynamic scheduling tool in the quality control laboratories of the pharmaceutical industry, affected by mass customization. To deal with the complex workflows and processing times estimations, our approach integrates simultaneously several intelligent sensors with business data to improve resource traceability in real-time. These sensors typically already include embedded software with image processing and communication capabilities. To do this, the acquisition of timestamps and the integration with enterprise databases towards decision-making was developed in two different ways: the PLC Platform, and the PC Platform. The first follows a more classical hierarchical approach and the last a more gateway-like direct one. Nevertheless, both coexist in the same architecture, summarized in Figure 1.
Sensors 1 to N represent intelligent sensors at the edge of the network. In our implementation, these are represented by radio sensors and optical readers but can be generalized to any other type of sensor. The cloud is an abstraction layer that includes the decision-making along with the enterprise databases. In this approach, we consider fog computing to be the intermediary steps, such as the SCADA, the PC, the connection modules, and, to some extent, even the PLC, as its role is mainly to control the reading frequency and provide connectivity. We note that these two platforms are representative of robust industrial platforms, as there can be many more possible configurations, as presented in the literature review. Next, we describe the case study with the characterization of components, connections, communications, and software.
3.2. Connections
3.2.1. PLC Platform
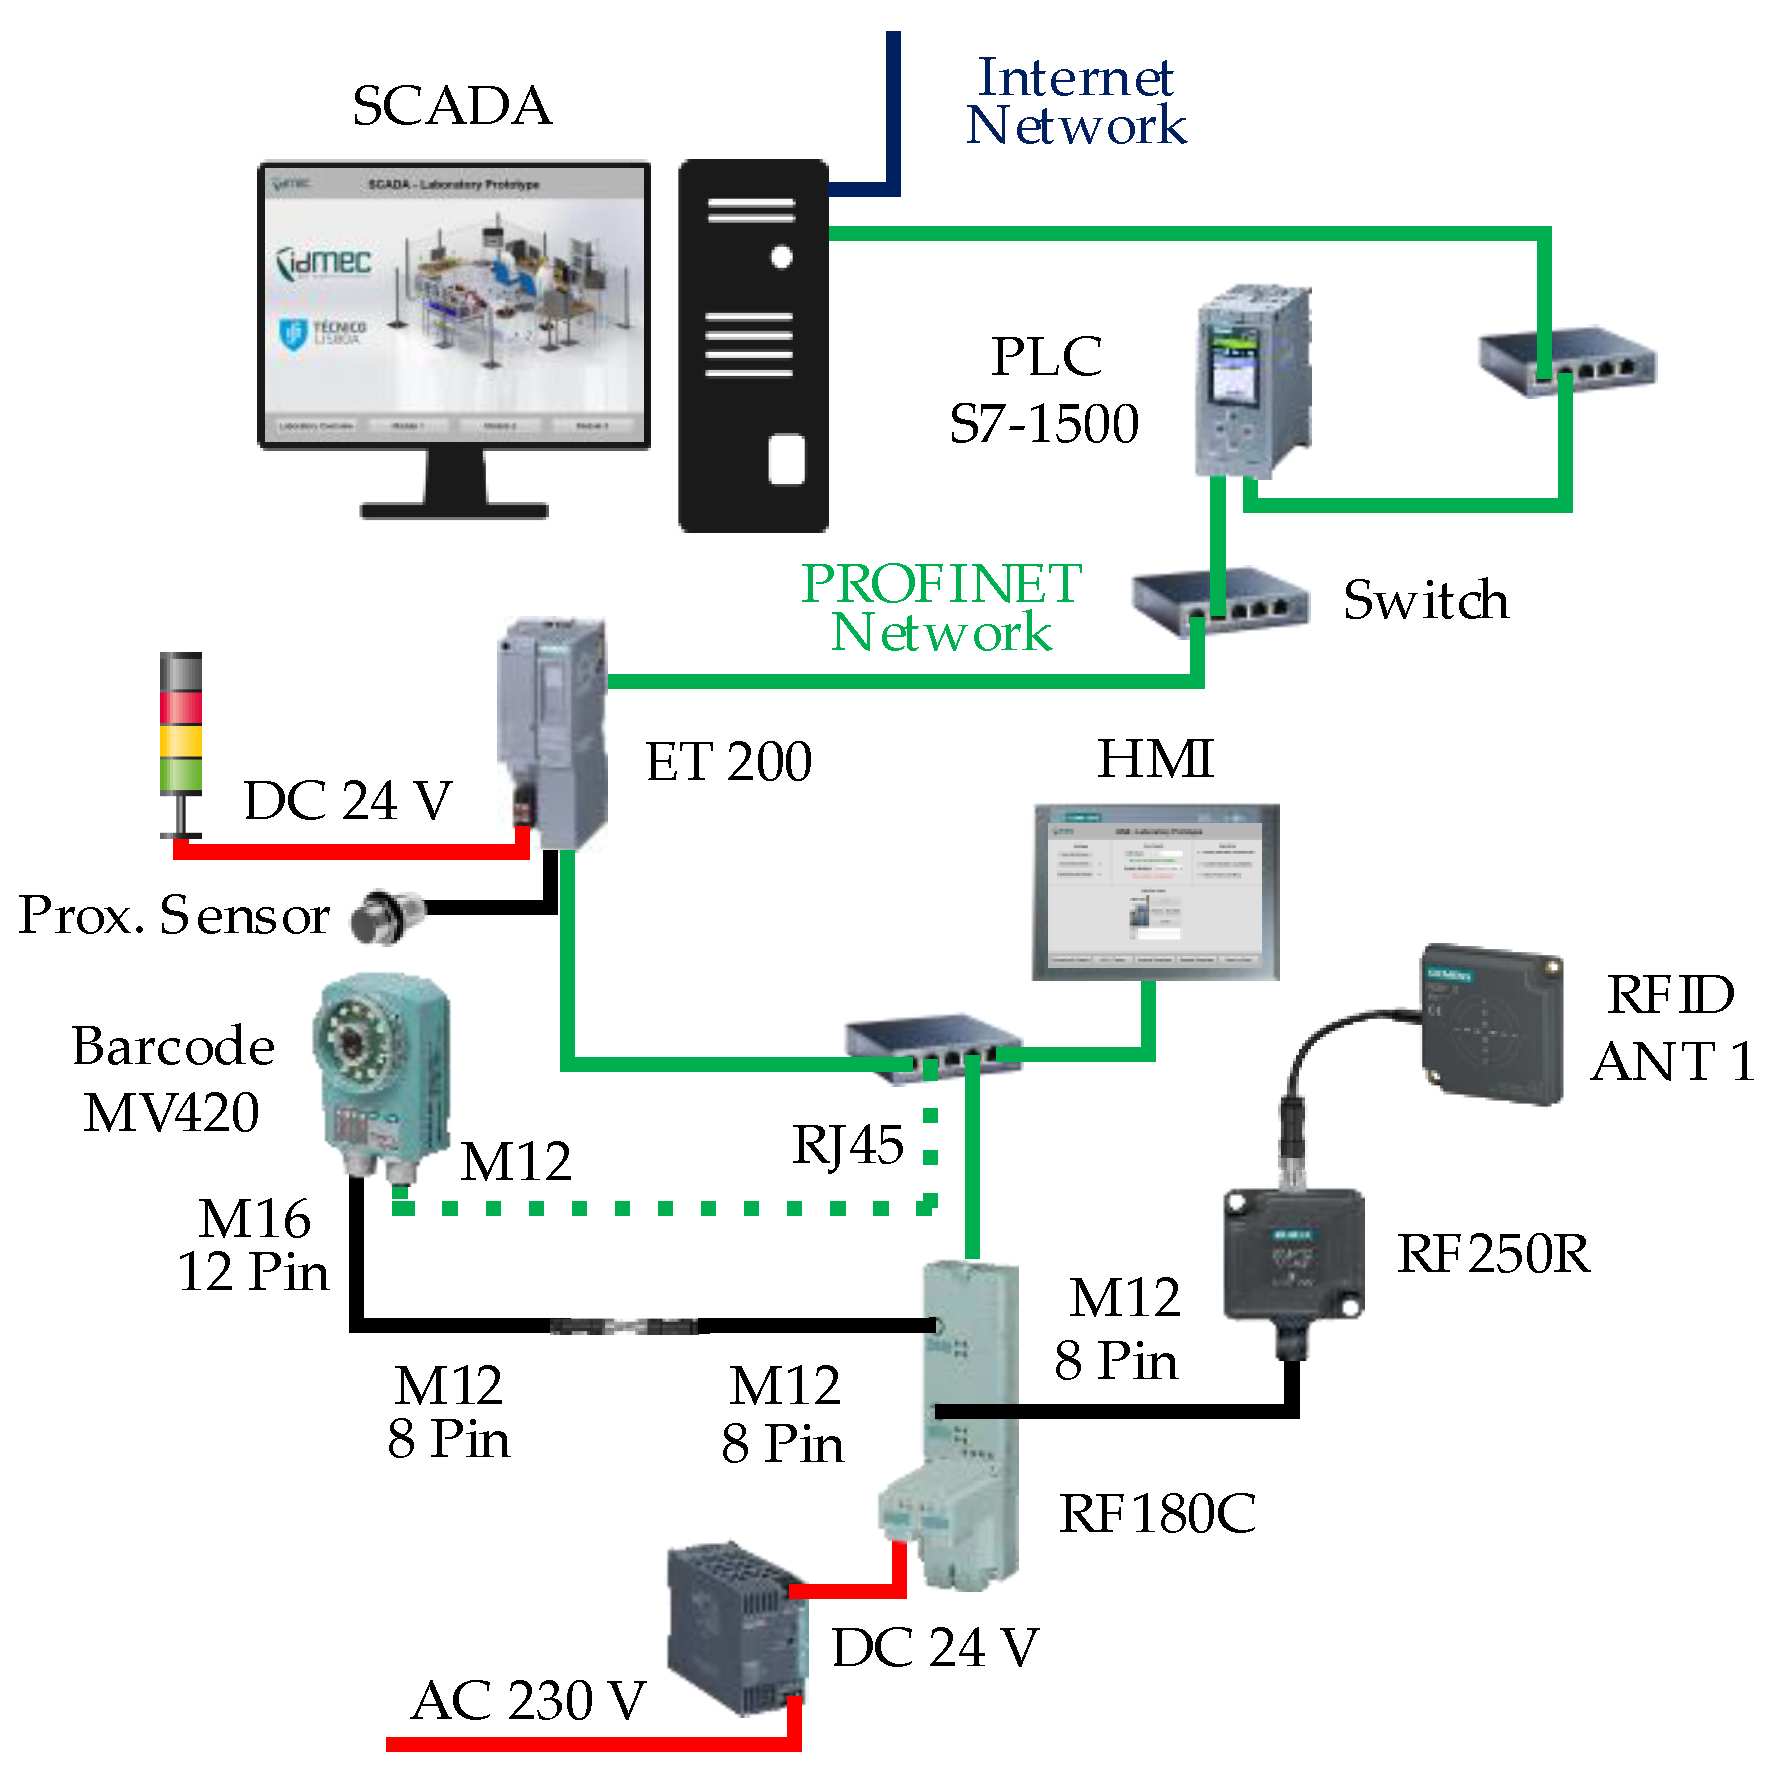
The PLC Platform consists of a fixed Barcode reader, as well as the RFID read/write device. These are connected to the controlling PLC through an Extension Terminal (ET), providing real-time data over the samples and the analysts whenever they arrive at the working bench and start running tests. To manage the information acquisition, we have a SCADA computer and a Human Machine Interface (HMI) on the shop floor. The layout includes light signals to inform analysts whether the station is free, occupied, or requires intervention, also connected to the ET. In Figure 2, we present the connections and components.
In Figure 2, the fixed RFID read/write device RF250R with ANT 1 from Siemens connects to the communication module RF180C. This connection can be achieved by connecting the RF250R with the RF180C through the RF plug-in cable RS422, M12 (8 pin male) to M12 (8 pin female). The RF180C module includes an IP configurable address and together with the RF180C connection block can connect to the PLC network via Ethernet. The RF180C is powered with 24 Vdc. The fixed Barcode reader MV420 also from Siemens has two connection options. It can connect directly to the PROFINET with the cable RJ45+M12, having the device its own IP in the network or via the communication module RF180C. For the first option, the MV420 has an integrated web server, allowing access to the images of the camera via browser, making possible the adjustment of the image settings, such as brightness, resolution, distance, and distortion over the code used (Code-128). This step is mandatory prior to camera use, as we need to create, configure, and save, inside the camera, programs that will later be called in the TIA Portal with each camera reading. This is a configuration cable. The second option is achieved by linking the port of the camera M16 (8 pin) to one of the ports M12 (8 pin) of the communication module RF180C: this is done with the two connection cables. The runtime implementation of the PLC Platform only uses the second option through the RF180C. While the RFID reader is triggered by the presence of a transponder, the Barcode reader only reads when manually triggered, thus a proximity sensor was installed near the MV420.
3.2.2. PC Platform
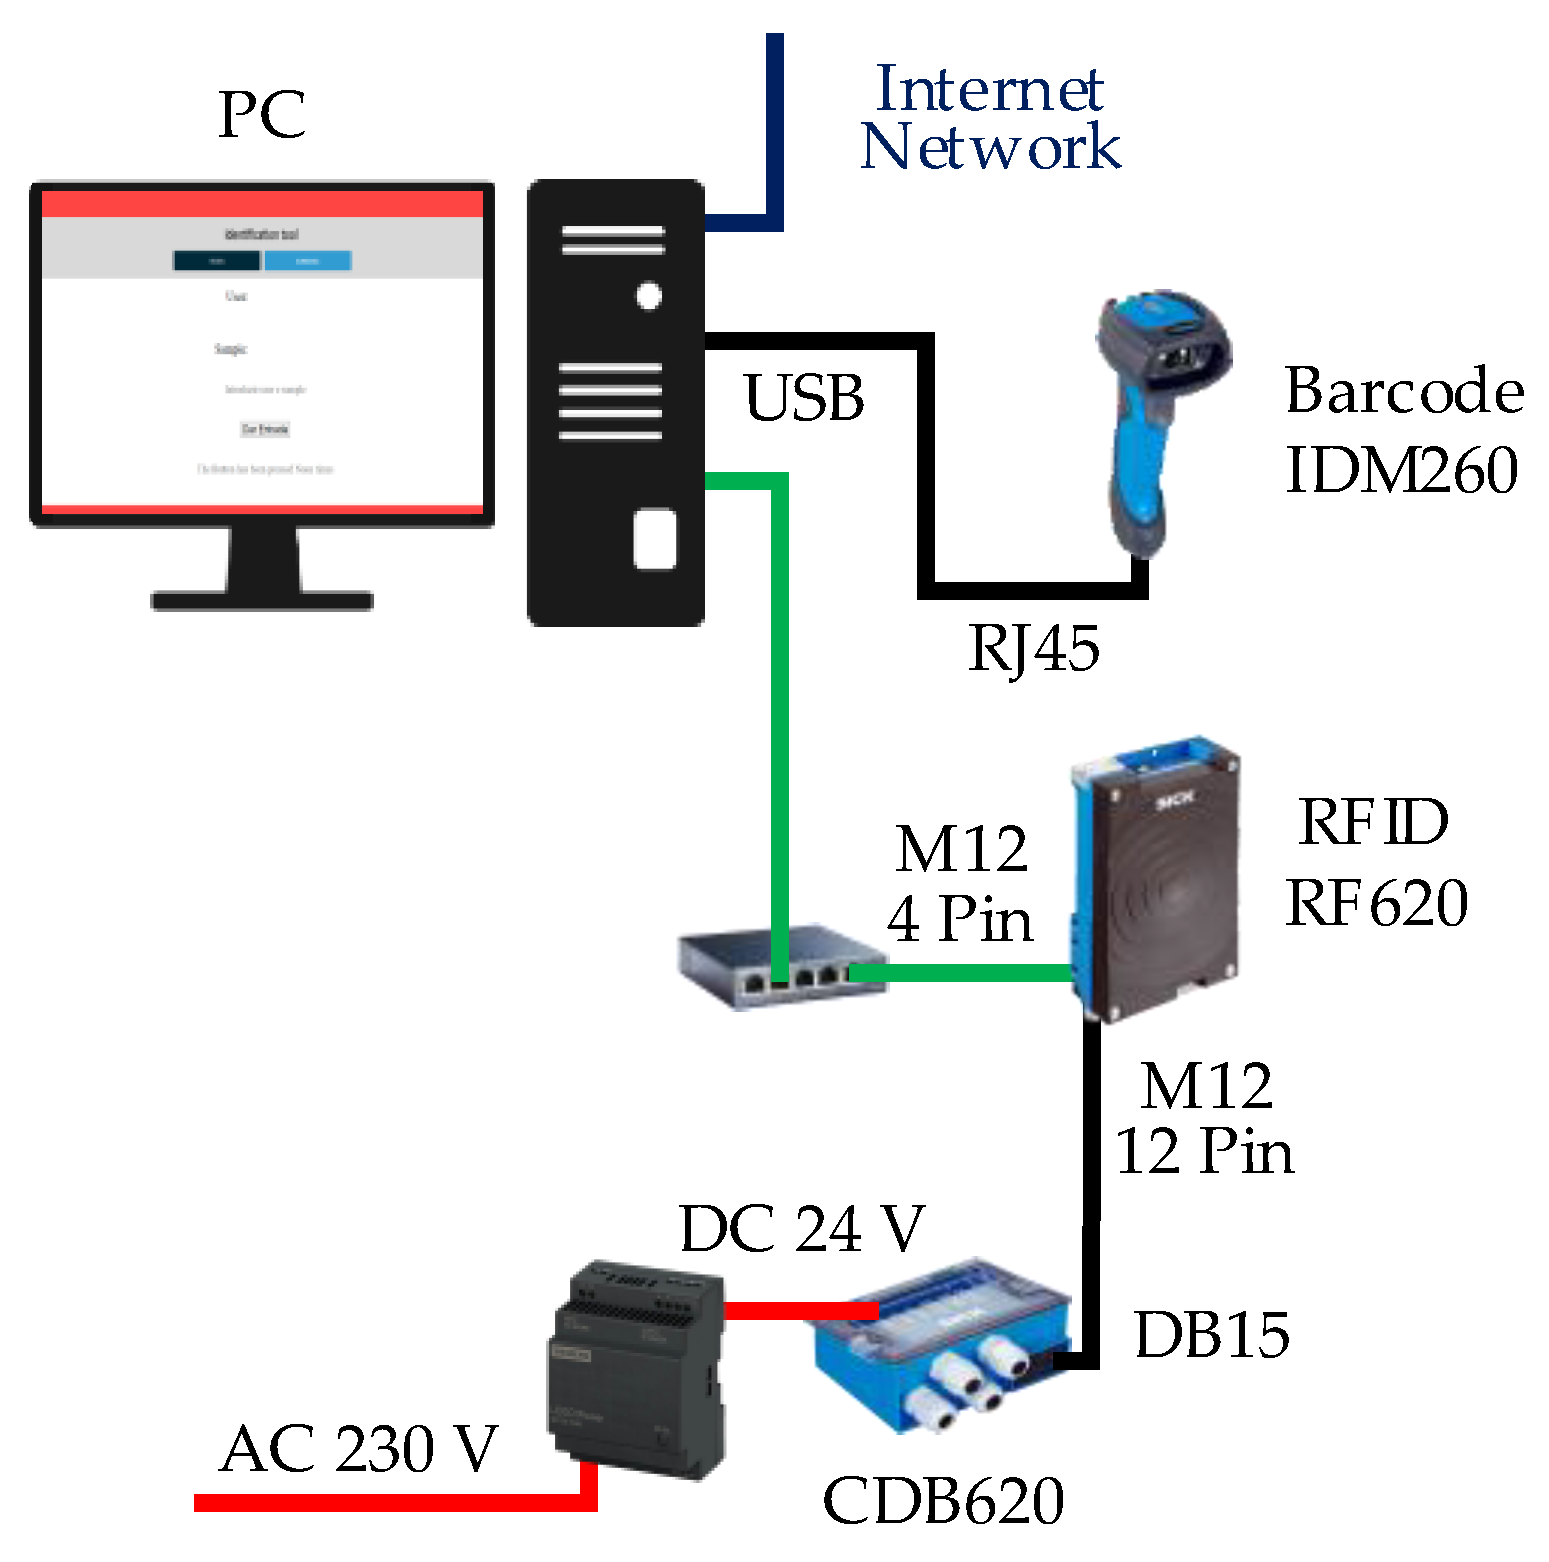
The PC Platform includes a hand-held Barcode reader and a fixed RFID read/write device. These are connected to the PC, also providing real-time data over the samples and the analysts whenever they arrive at the working bench and start the sample preparation. To manage the information acquisition, a Graphical User Interface (GUI) was developed in the PC to record the arrival of the work along with the beginning and end of the sample preparations. In Figure 3, we present the connections and components.
The hand-held Barcode reader IDM260-100S from SICK connects to the computer via the connection cable RJ45 to USB as shown in Figure 3. The fixed RFID read/write device RFH620-1001201 also from SICK includes an IP configurable address and connects to the computer via Ethernet. This connection can be achieved with its RJ45 to M12 (4 Pin) connection cable. RFH620 is powered via the connection module CDB620-001 with its M12 (12 Pin) to DB15 connection cable. The CDB620 is powered with 24 Vdc.
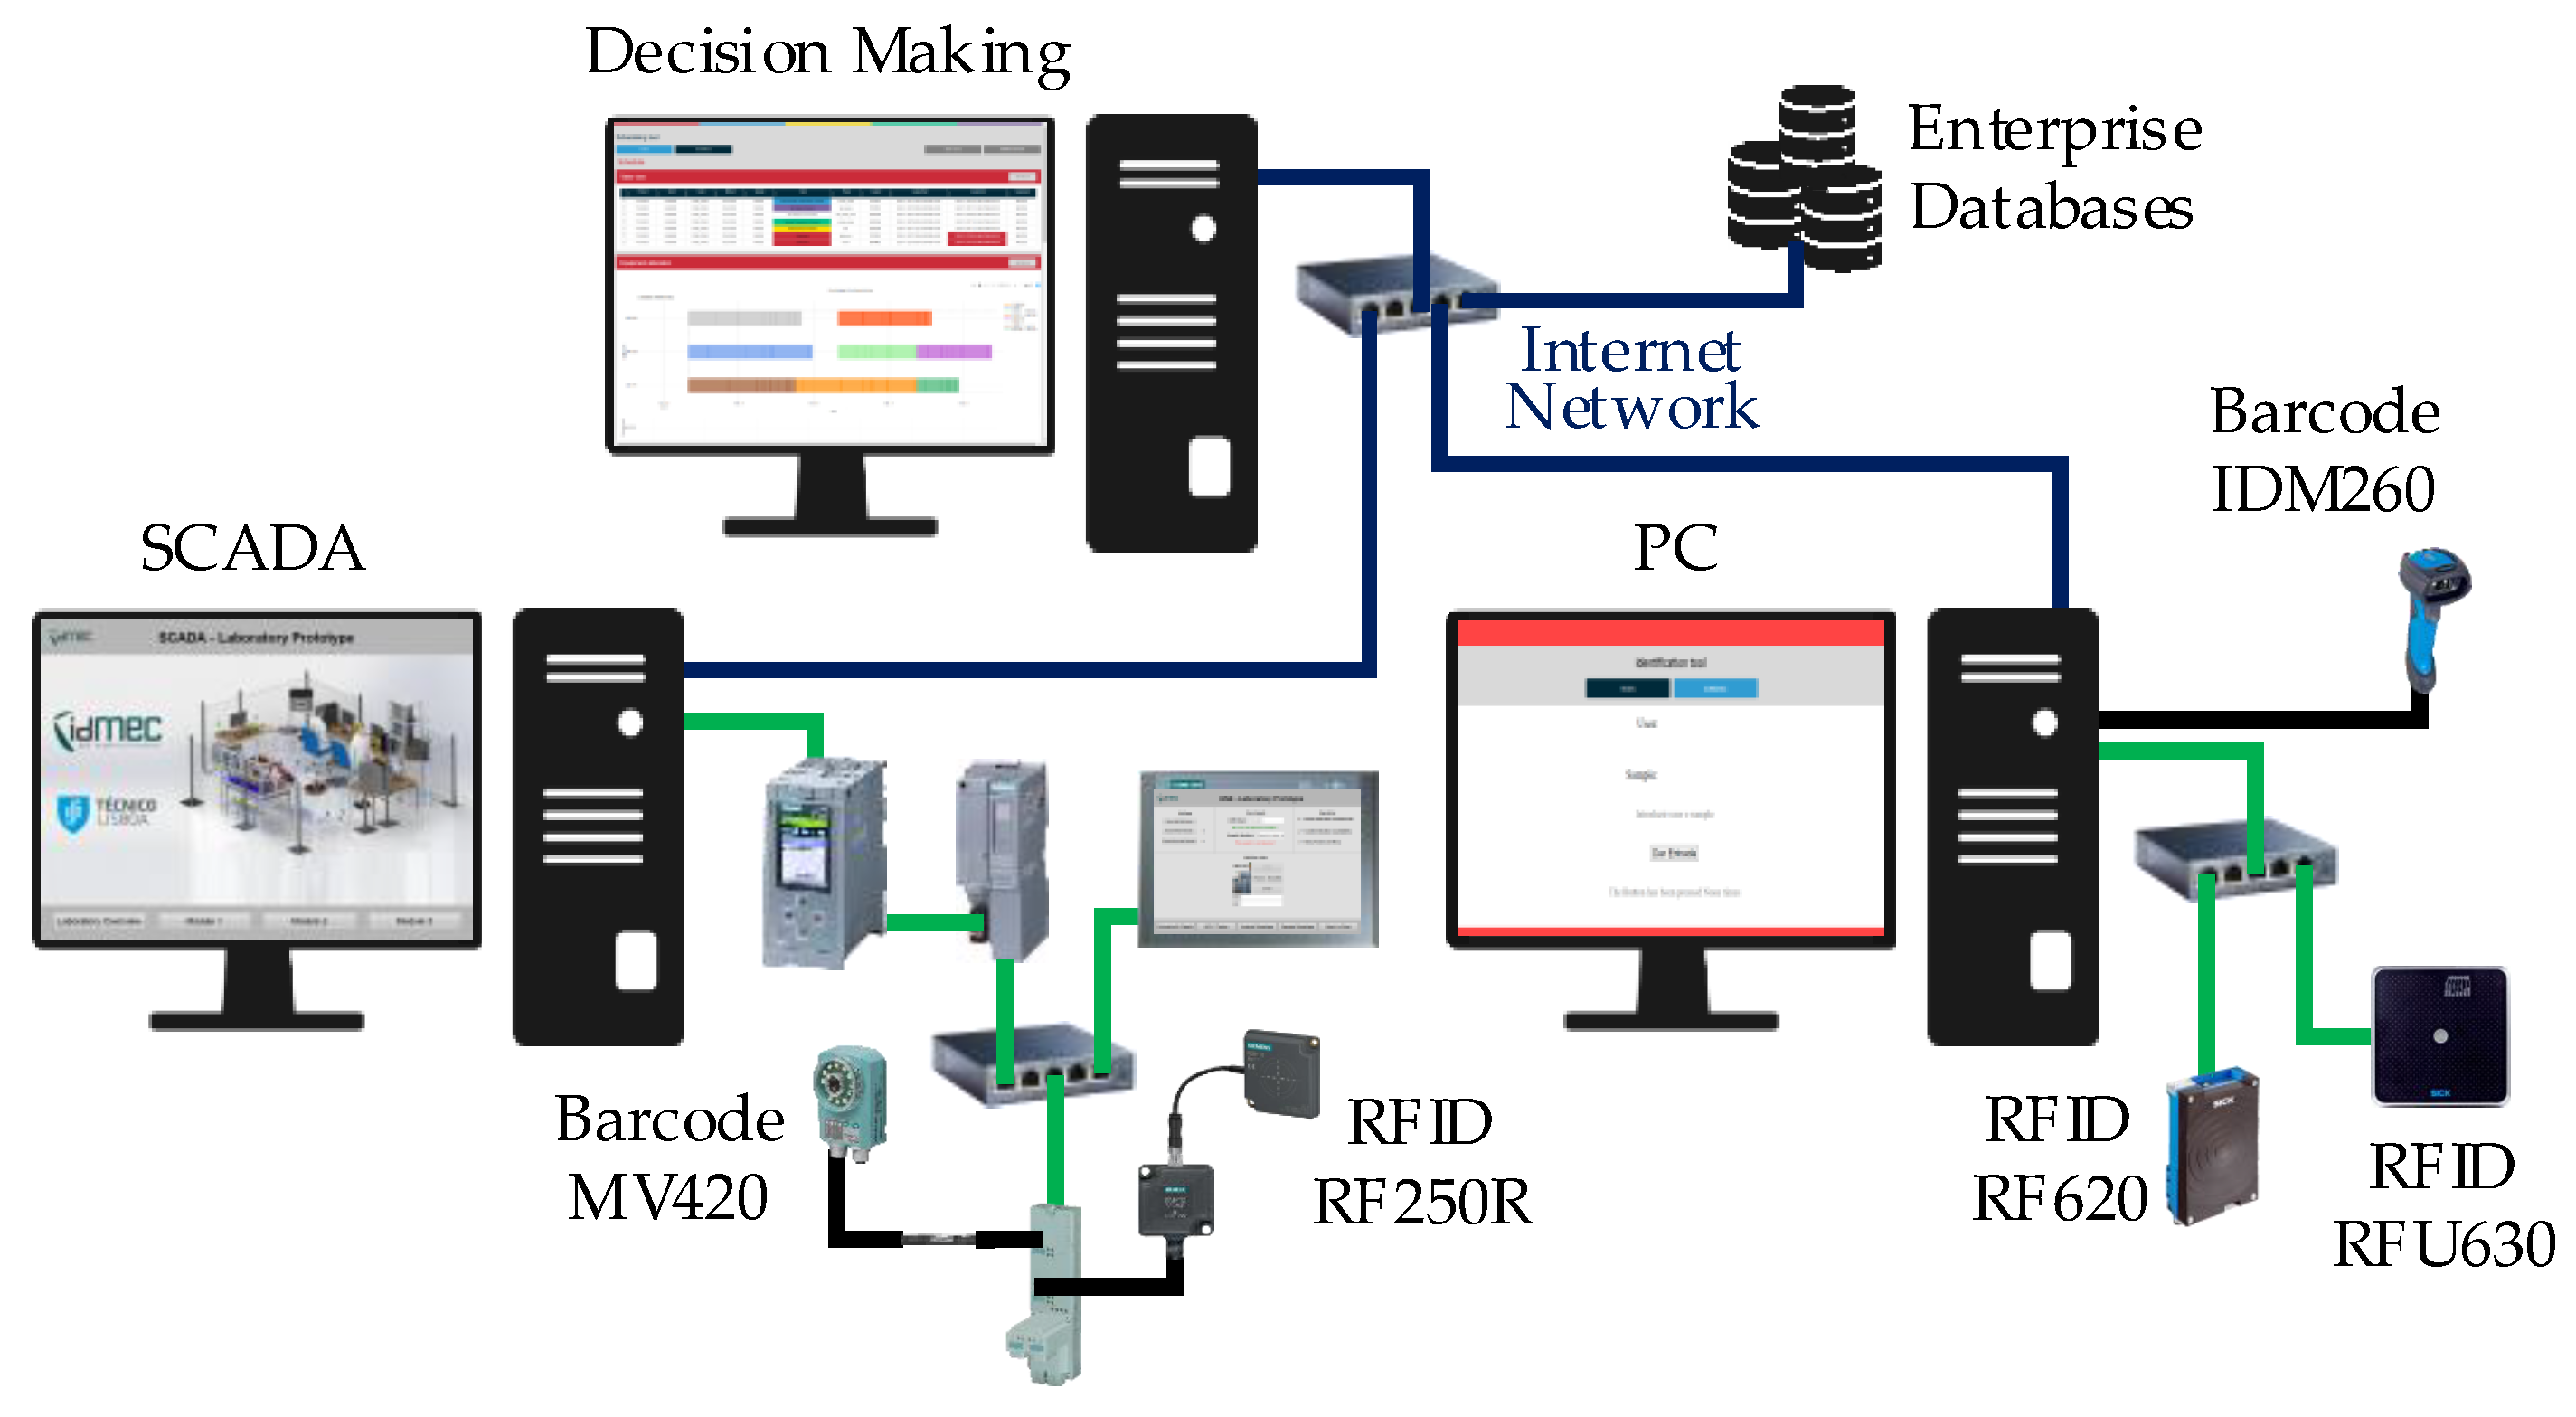
3.2.3. Full Architecture
4. Implementation and Analyses
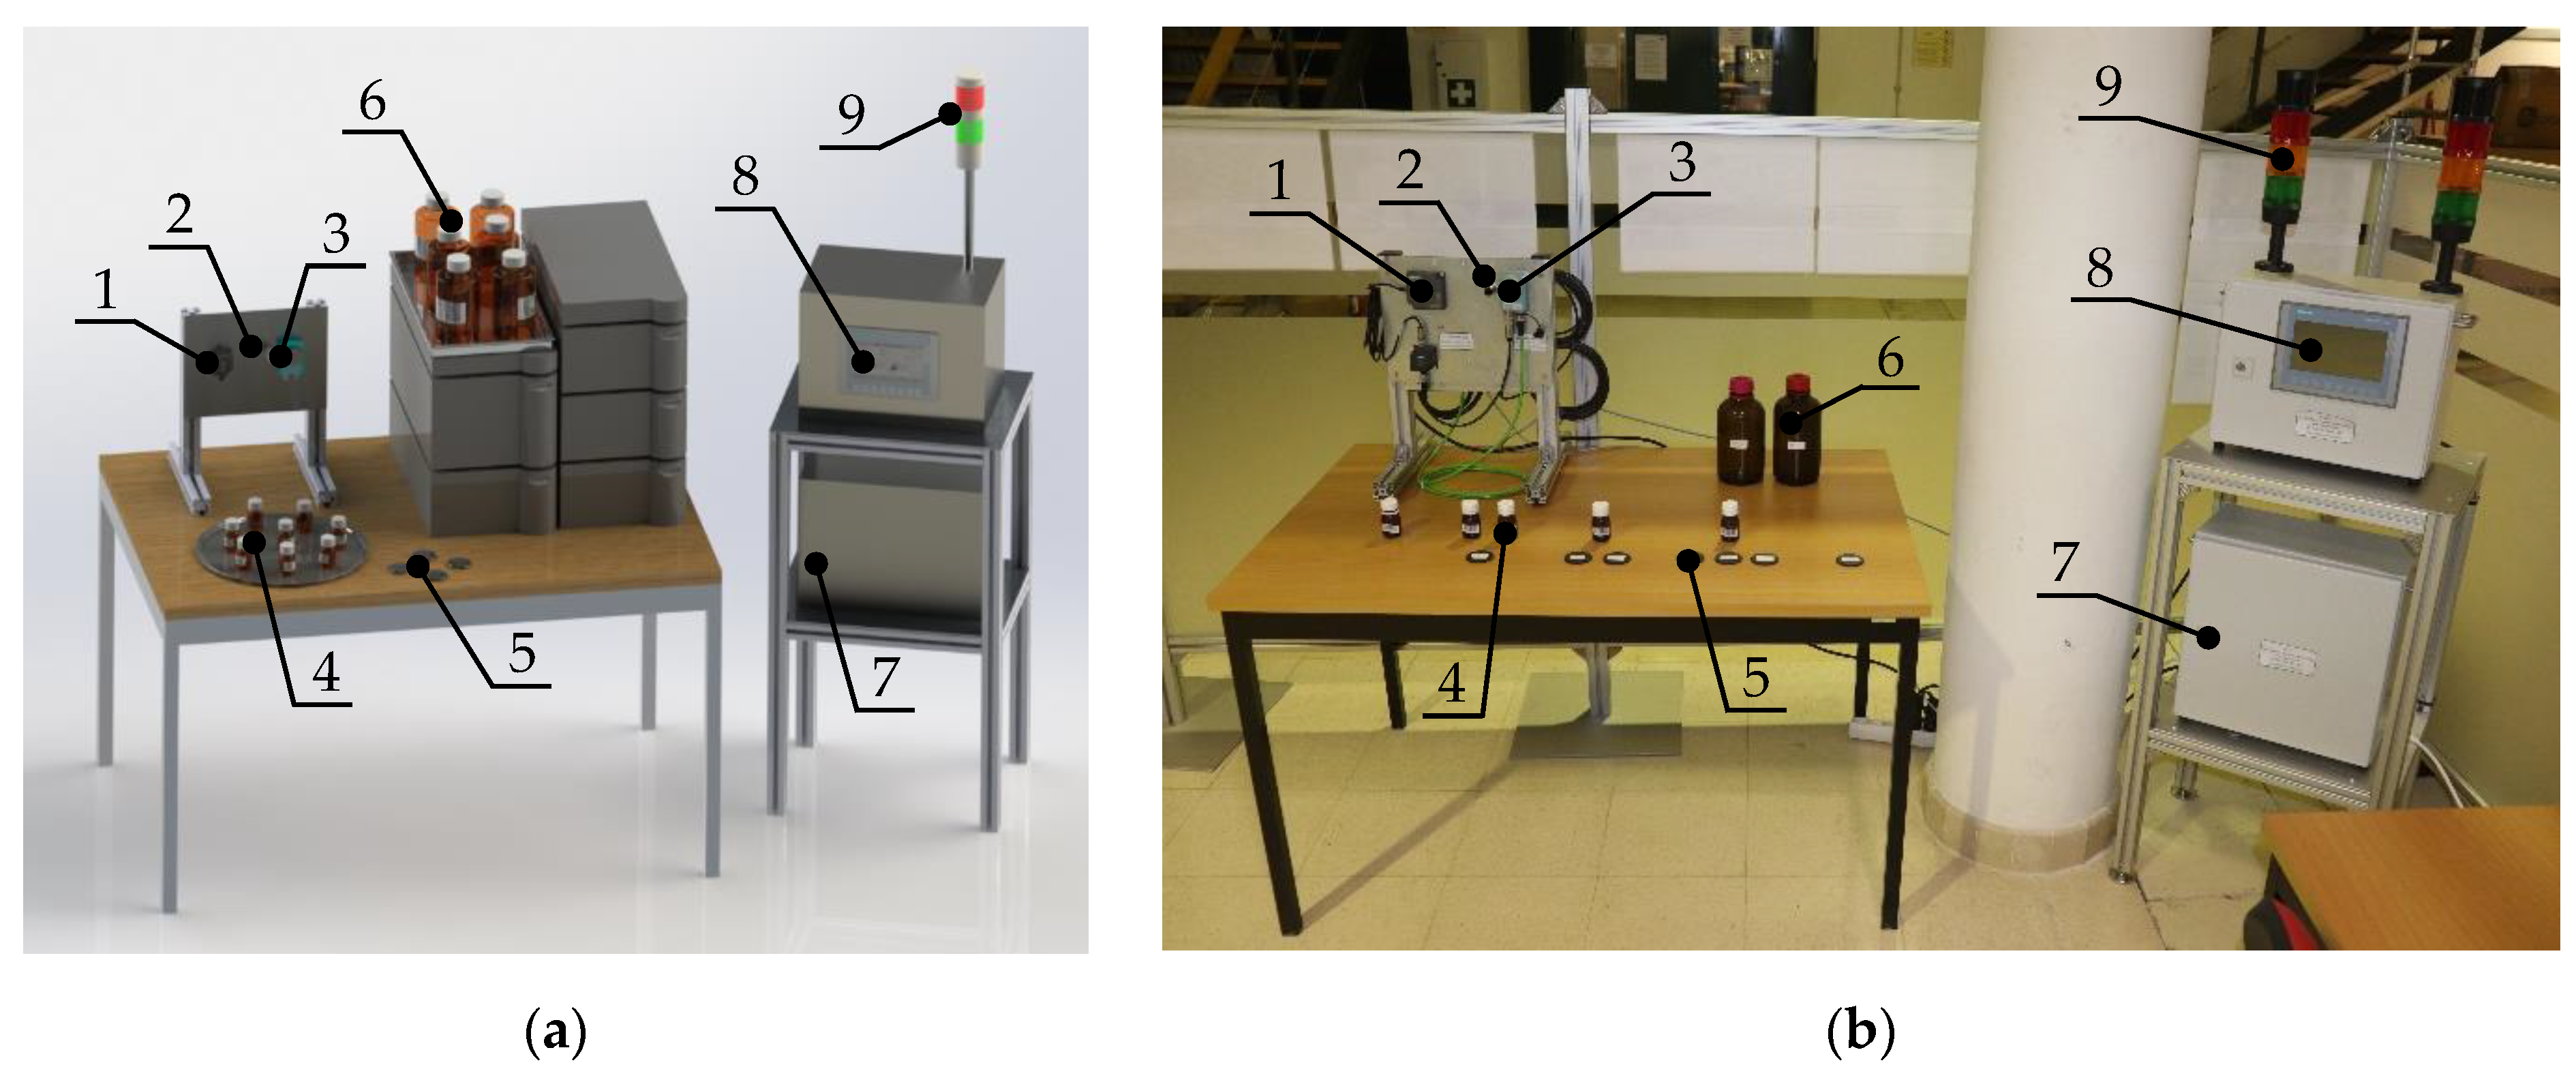
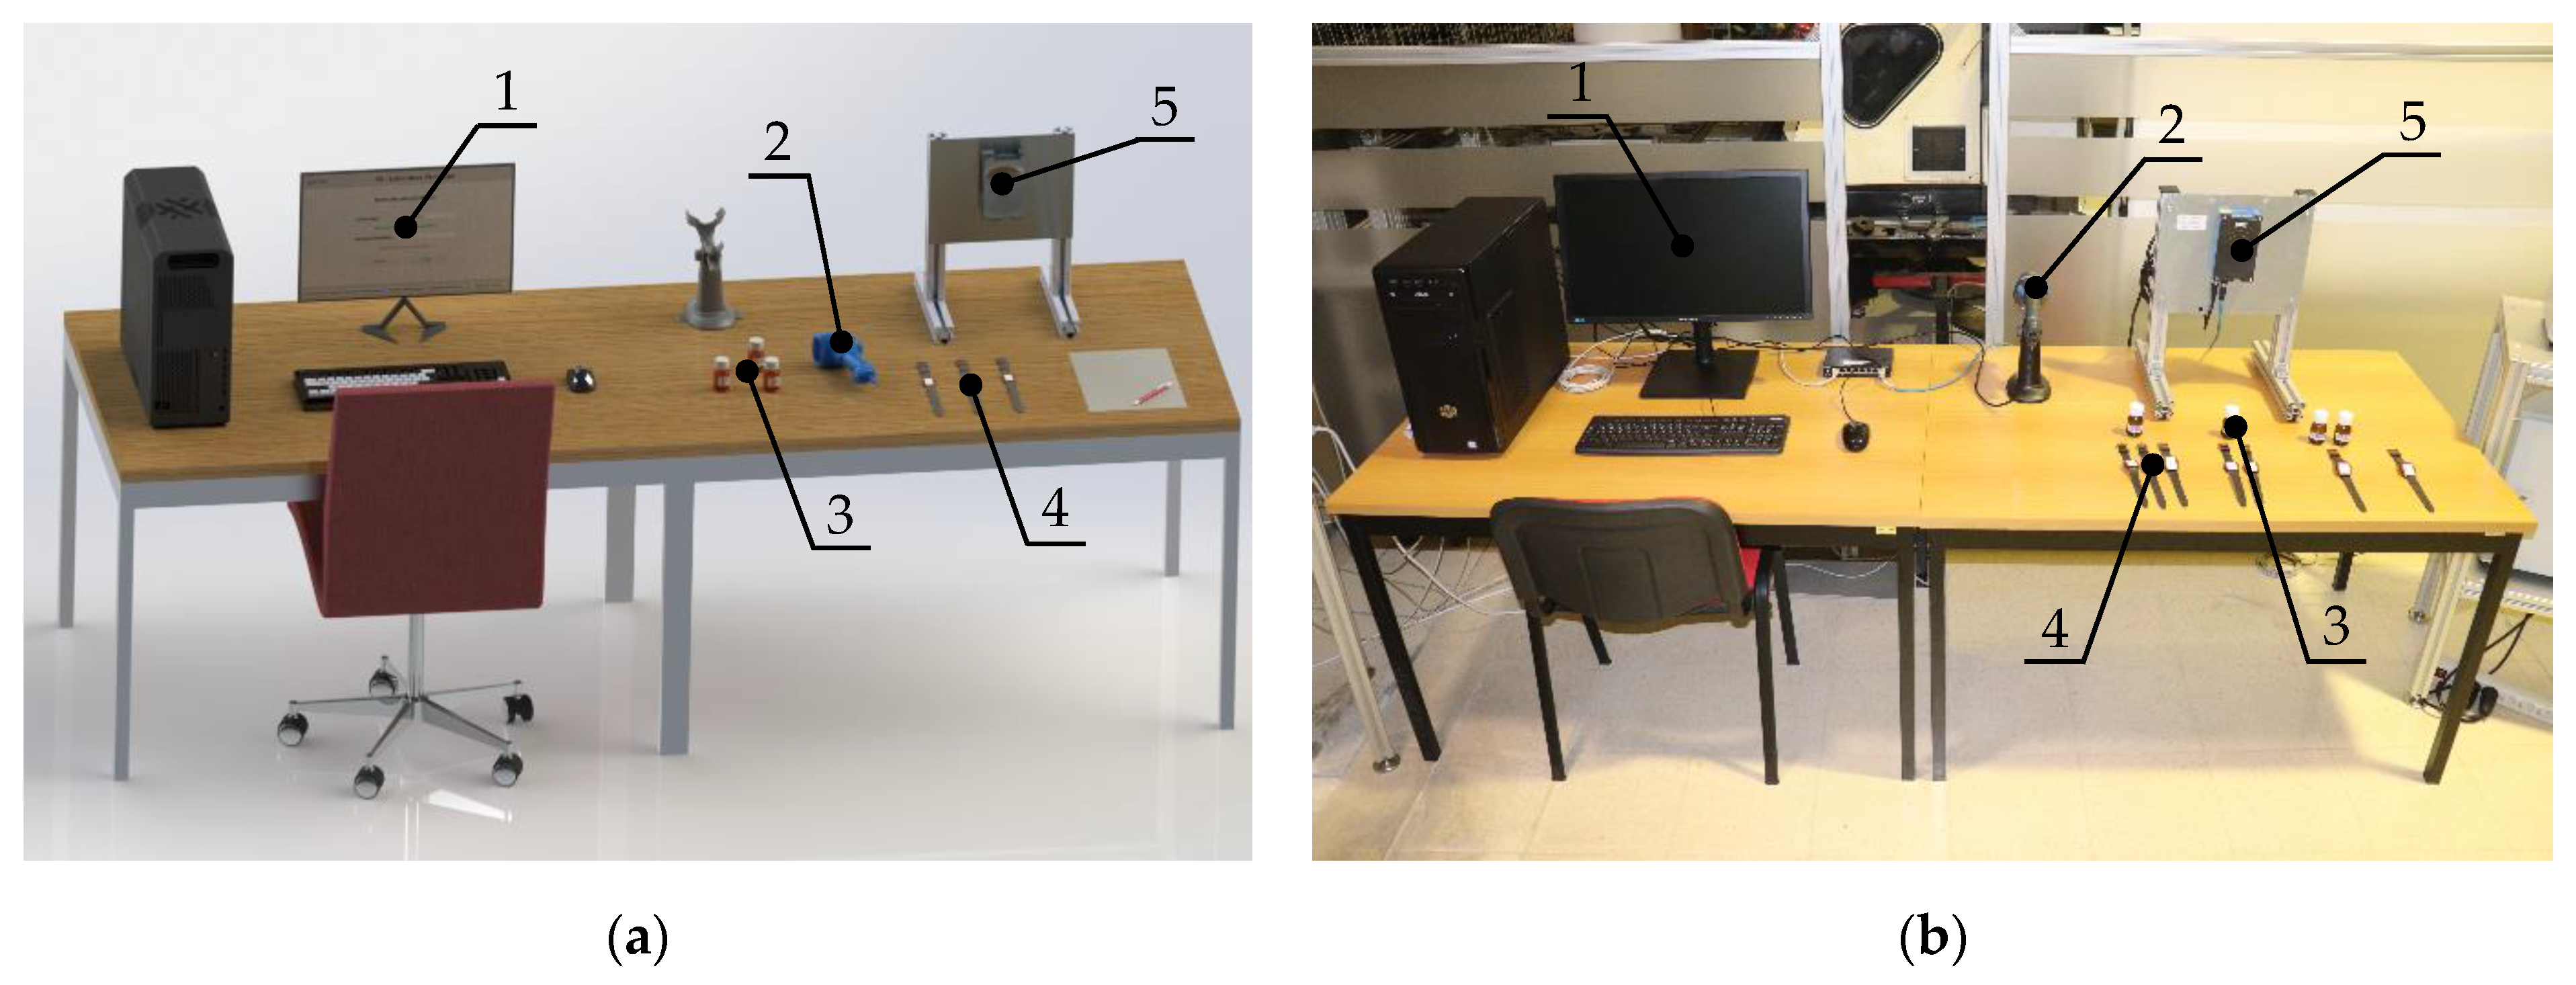
The main result of the proposed automatic identification architecture is the integration of intelligent sensors towards assisting with decision-making and task time estimations. With the increasing variability of production orders, there was no digital information available regarding the beginning and finishing of tasks and subtasks. Processing times were manually estimated by experts and/or based on biased time studies, similar to other applications [58], thus inaccurate, besides their stochastic nature. In comparison, we now have a solution to have these available in real-time, improving knowledge over actual task times. In our implementation, the Barcode is used to identify the samples, while the RFID is used to identify the analyst. In Figure 5 and Figure 6, we present the prototype design and the actual implementation of the PLC and PC Platforms, respectively.
In Figure 5 the numbers stand for:
- RFID reader (read analyst);
- Proximity sensor (trigger Barcode reader);
- Barcode reader (read sample);
- Sample with barcode (test sample);
- RFID tag for user identification;
- Material preparation;
- Local control (PLC / ET);
- HMI (user-sample management);
- Stack light (station status).
In Figure 6, the numbers stand for:
- PC with GUI (sample reception and user-sample management);
- Barcode reader (read sample);
- Sample with barcode (test sample);
- RFID tag for user identification;
- RFID reader (read analyst).
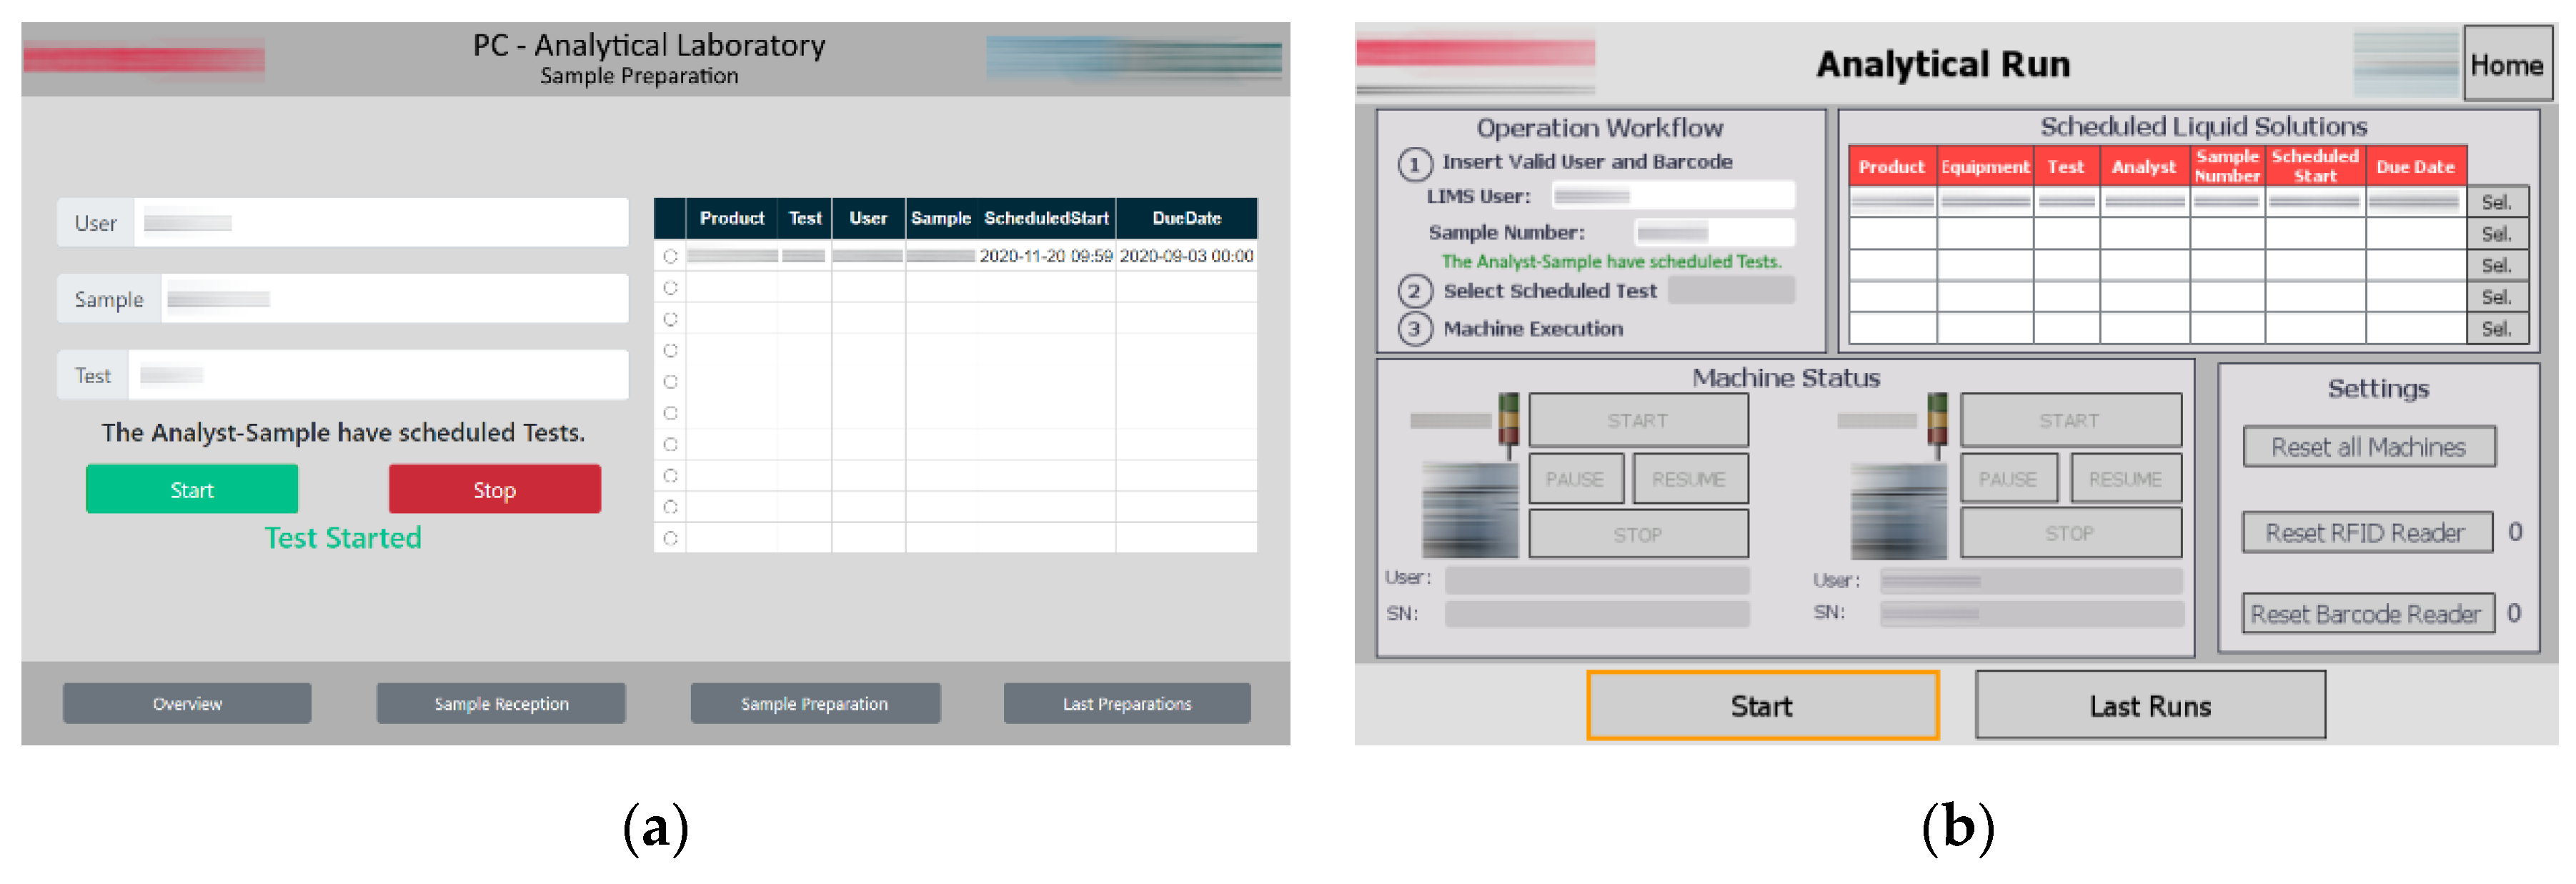
The analytical QC laboratories provide a good case study due to their complexity with highly personalized tests. Efforts in mapping and standardizing the workflow with BPM towards scheduling resulted in each job (test) typically organized into six main tasks, in the following order: system preparation, system suitability, sample preparation, analytical run, data processing, and review. These tasks require the presence of an analyst, equipment, or both. Moreover, resources are necessary for the entire duration or only for a percentage of the task duration. The mathematical formulation of the dual resource constrained job shop scheduling dynamic scheduling problem is presented in [59]. The system preparation, system suitability, and analytical run follow the PLC Platform for data collection, while the sample preparation follows the PC Platform. This work does not discuss the remaining tasks. In terms of workflow, the PC Platform is used initially to register the arrival of new samples. This operation triggers the data loading operation. The data loading updates the data model, fetching all the tests associated with the sample and business information relevant for the scheduler, such as task processing times. The scheduler then evaluates the data and reschedules if necessary. Finally, the scheduled combination of user and sample starts and stops tasks in the respective equipment. In Figure 7, we present examples of the actual dashboards currently used for the beginning and finishing of tasks in the PC and PLC Platforms: the user registers his/her RFID identifier and reads the sample through the Barcode reader.
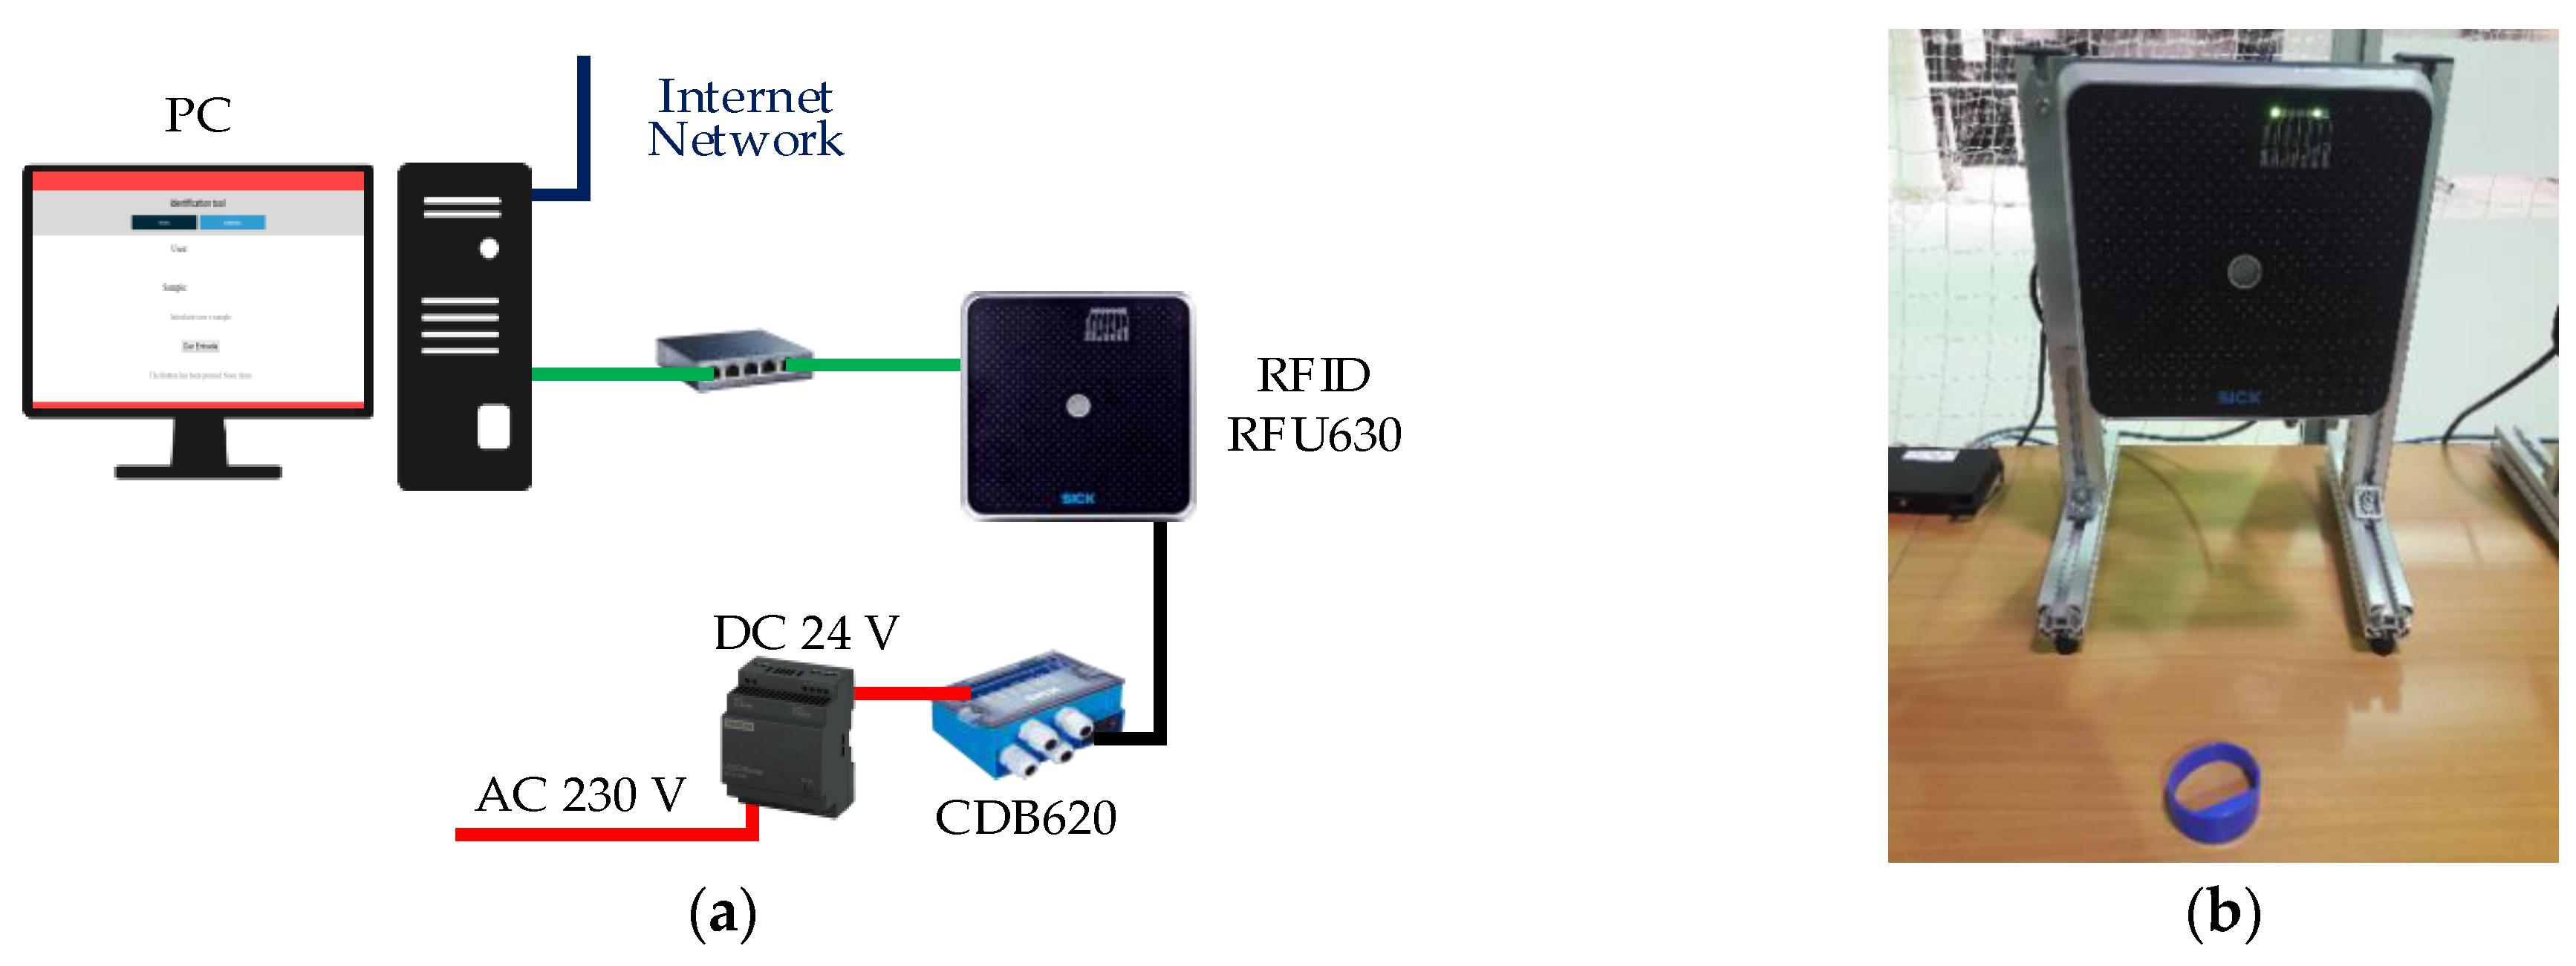
Recall that most tasks do not require the presence of an analyst for their entire duration. The analyst can come and go from the workbench multiple times during the operation. Each analyst can perform several tasks simultaneously, as each task includes smaller subtasks, often done in parallel with some flexibility in terms of precedence. Therefore, it is difficult to estimate the analyst availability. In such conditions, mapping business processes with low granularity can be unfeasible. It can be considered that the analyst is only required for a smaller amount of time, given in percentage of the total processing time. The implemented solution was to place UHF RFID single reader antennas near critical equipment and give to the analyst a UHF bracelet tag. Then, through periodic readings, it is possible to compute the amount of time each analyst spends near critical equipment, between the beginning and end of each task, from the number of times the analyst is considered near the equipment multiplied by the size of the time interval between readings . The ratio of analyst occupation within each task, , is given by:
where is the total time of the task. These values have been used to improve subtask processing times and predict real-time problems in the execution of tasks. The additional hardware used is depicted in Figure 8.
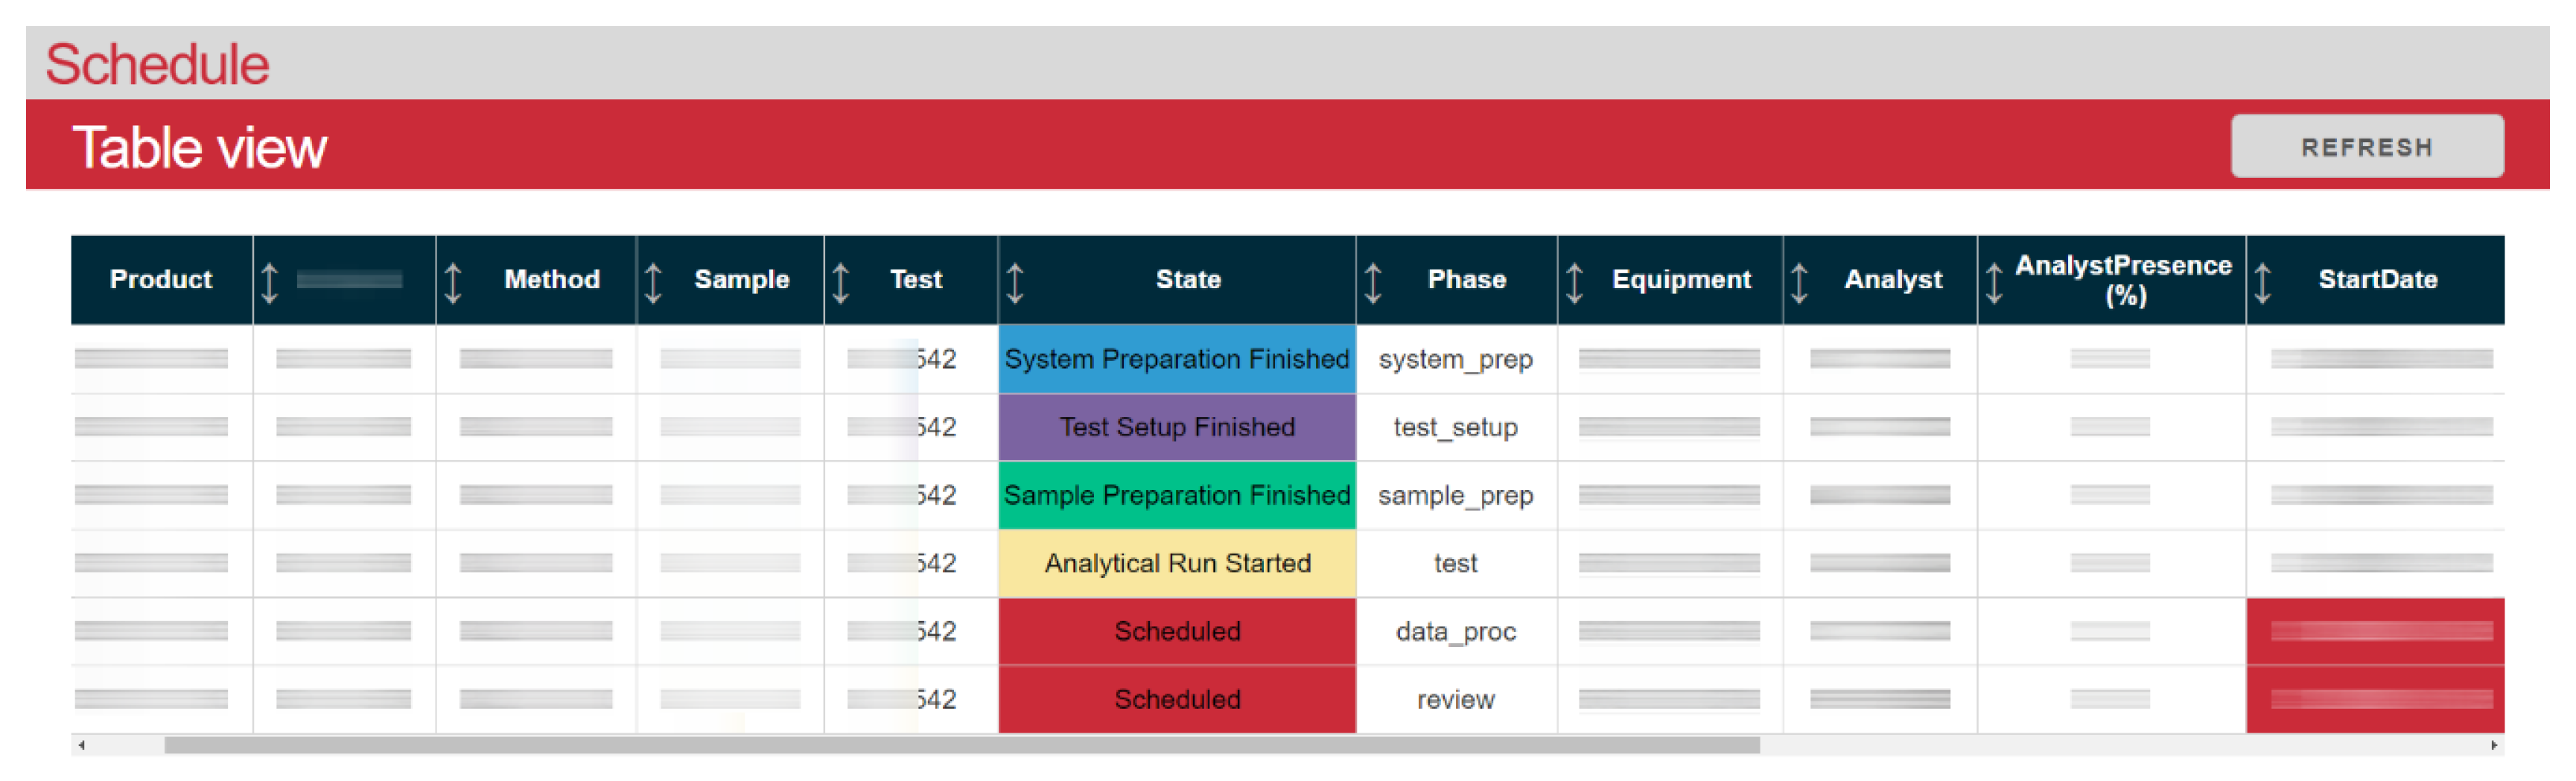
In Figure 8, we use the RFU630 UHF interrogation reader and the CDB620 connection module. These receive the signal strength of the analyst. We can also see a UHF transponder bracelet in Figure 8b. In Figure 9, we present the dashboard with a summary view of the tasks belonging to a test.
In Figure 9, the test has completed the system preparation, system suitability (test setup), and sample preparation. Next, we compare the information available before and after the introduction of the automatic identification systems. Table 1 summarizes the main differences.
The manual estimation of processing times can be difficult because analysts do many small tasks in parallel, often from more than one test, and start new tasks while still finishing the previous ones. Additionally, many subtasks can group with other tasks, so there are many overlapping operations. With automatic identification, we can track the beginning and finishing of tasks, including gathering clues over intermediate steps. After starting to record the beginning and finishing of tasks and the average processing times, we improved the estimations of tasks (proposed system) over the manual time estimations from experts (actual system), according to Table 2.
In Table 2, the system preparation task was reduced from an average processing time of 139 min to 93 min, translating into an absolute time reduction of 46 min (33%). For the system suitability, the reduction was 57 min (36%). For the sample preparation and analytical run, the reductions were 18% and 2%, respectively. This result is remarkable, showing the advantage of the proposed system. It shows clearly that experts tend to overestimate the time of the tasks. Overestimation can happen due to two reasons: analysts do subtasks simultaneously, and some of these subtasks have a failure rate harder to predict, demanding subtask repetitions. In the analytical run, the values follow recipe times, therefore more easily estimated by the experts.
On average there was a decrease in the total task time of each test, after the adoption of automatic identification, of 133 min: from 662 to 529 min (20% reduction). This improvement leads to an increase in efficiency. For this analysis, over 2000 distinct tests were considered on a total of a few tens of thousand tests every year. In terms of job variability, 90% of the tests are within the 458–786 min frame of average total task time after applying the automatic identification. Variability is primarily from using different analytical techniques, followed by distinct analytical methods and unique customer specifications, namely the chemical grade.
Concerning subtask estimation, the time fraction the analyst spends near the equipment does not change significantly. These results make scheduling operations more efficient. To analyze the impacts these results can have in terms of throughput, we need to compare two equal periods with the same workload, which is hard to set up due to the demand variability. The value of information is difficult to quantify. However, it is expectable that the increase in the throughput can be proportional to the 20% decrease in total task times. Next, we present a summary of the impacts and implications of the adoption of automatic identification:
- Analyze analyst profiles: helps to analyze the workflow differences between analysts, depending on their different levels of experience and evaluate if there are problems with the training or advantages to having dedicated people to specific tasks;
- Include failure rates: determine how many times particular tasks fail until the analyst moves to the next. This allows the scheduling to include average failure rates;
- Analyze equipment competencies: why in some equipment analysts take more or less time, and in which products;
- Analyze resource availability: currently there is no way to measure the Overall Equipment Effectiveness (OEE) or other Key Performance Indicators (KPIs). This will allow providing information on whether new equipment is necessary, improving resource management;
- Improve Business Process Mapping: the adoption of automatic identification is helping to map and standardize more granular business operations;
- How to react to delays and save time in the passing of work between shifts.
We started by using the estimated values from the experts to deal with possible outliers in the first measured values. Once removed, the estimated values are excluded, and only the real measurements are used. Estimations are inaccurate, but they are hardly outliers. Additionally, there is nothing else to compare with the first measured values. This is done by first computing the median between the estimated value and the real measurements of the same type. We chose the median because it is more robust in dealing with outliers than the mean. After a few records, we use the estimated value and the median to compute a temporary mean and standard deviation. Once outliers are removed, we compute the new average and standard deviation from the measured filtered records, excluding the manual estimation. Whenever a new measurement is recorded, we evaluate if it is an outlier through the z-score. We consider an outlier new records with a z-score higher than 3 or lower than −3. A study on outlier detection can be found in [60].
5. Discussion
5.1. Automatic Identification Sensors
In our implementation, the track of a task has six pieces of information recorded: task, test (job), equipment, user, timestamp, and action, such as start or stop. RFID and Barcode readers are two automatic identification technologies that essentially make the handling of codes and physical identification faster and easier, adding an abstraction layer to it. RFID has the potential to eliminate user interactions and provide timing accuracy when compared to optical readers, which are typically manually held. Nevertheless, reading a sample is often not enough. Samples are the entities moving around in the workplace carrying identification tags. However, a single sample can have multiple scheduled tests or jobs. Each test has several tasks, and each task can have a different scheduled combination of user-equipment. This limitation requires that an automatic system with RFID tags to start and stop tasks must rely on a manual action of the user saying which test and task are being done from the identified sample. Developing fully automatic identification solutions in the industry can be challenging and expensive. In our use case, it is hard to automatically know in which stage a test is, solely based on automatic readings, as the sample stands still in a workbench, while their tests and tasks do not. A proposed solution is to create physical representations of tests and tasks to move around in the lab carried by analysts. However, invasive monitoring methods were faced with strong employee resistance. Additionally, the environment where the tasks are executed can be shared, thus is it hard to automatically tell when some tasks end and the next begins. One considered solution to split automatically the tasks is to merge the information with the power consumption from sockets to evaluate the beginning and finishing of tasks through the equipment usage. Moreover, another challenge to fully automatic systems is material groupings, where an analyst can group similar tasks, doing both simultaneously, increasing their overall availability. This solution could also be addressed by carrying a physical representation of jobs. RFID has already been used to determine material groupings in real-time [61]. Regarding the adoption of other radio system identification technologies, low-range technologies such as NFC have a similar range when compared to RFID HF. The biggest difference and advantage of NFC is its bidirectional communication; however, this feature was unnecessary to our application.
Even though we could use the internal memory of the RFID tags, we opted to only use the Unique Identifier (UID), leaving the management of the correspondence between the UID and the user exclusive to the database. This is a more flexible solution not just because the scheduled correspondence could change in real-time, but also because we were already fetching data of tests and tasks from the enterprise databases. Nevertheless, we should note that using the RFID internal memory can reduce reaction times and avoidable connections to enterprise layers in time-critical applications, such as by including clearance levels inside the tags.
One of the toughest challenges of using manual automatic identification is to keep an accurate track of tasks when operators may delay readings. In heavily regulated industries such as quality control in drug manufacturing, there is little room for mistakes. Everything must be properly documented and peer-reviewed, thus it is easier to impose the manual start and end of tasks when compared to other industries, that typically face strong employee resistance [26]. In other industries, an extra design effort must be made while adopting automatic identification to improve the quality of the decision-making. In our use case, the challenge was the lack of standardization and process mapping towards scheduling operations with more granular processing times. We ended up having barcode labels for the samples and small range RFID HF tags for the user identification, with ranges below 10 cm in both PLC and PC Platforms. The start and end of tasks were incorporated in the workflow as manual tasks, leading to the improvements mentioned in Table 2.
We still intended to use RFID towards automatic sample reception, but HF tags proved troublesome to read near liquid containers and within metal packages. Low-frequency and UHF tags are better at managing material interferences; however, low-frequency tags only work on limited ranges, and UHF systems are expensive for the application. We also identified some additional challenges a fully automatic UHF system would face, such as deciding in which direction did the tags travel when passing through an interrogation zone. There are several approaches to address this last issue in the literature, such as by using the RSSI of the RFID antennas [62], but it would require additional software development. We also would have to ensure tags would not pass perpendicularly to the antenna field. In our implementation, the overall investment of using HF/UHF tags on samples did not provide advantages against cheaper solutions. We ended using an RFID UHF antenna near critical equipment, with a reading range of several meters, to map the analyst presence and improve subtask estimation times. Previous studies demonstrated how to use the RSSI value of UHF tags to have position estimations within a few tens of centimeters [54].
Overall, longer-range radio system identification technologies present promising opportunities for RTLS in indoor environments. UWB can provide more precise positioning within centimeter-level. It uses active transponders, which are bigger, more difficult to mount, and require higher power consumptions with strong penetration power and far transmission distance [55]. While the UHF RFID can monitor critical equipment, the overall UWB infrastructure investment to deploy a network of antennas and monitor all resources in the three-dimensional space is more expensive requiring a different commitment with a careful Return of Investment (ROI) analysis. For now, such precision was unnecessary. BLE is a cheaper alternative despite its still lower accuracy. Nevertheless, commercially available solutions of RTLS using UWB can already be found in the market, with the promise of supporting many new applications, such as digital twins of the shop floor along with further support to scheduling operations [63]. RTLS must be further investigated, not just to improve subtasks time estimations, but also to capture analyst movements and improve business process mappings.
As for the optical readings, the PLC Platform records the barcode image, while the PC Platform uses laser technology. In Table 3 we present a summary of some of the captured advantages and disadvantages of the optical and RFID technologies towards integrated real-time decision-making identified while conducting our field research.
5.2. Intelligent Sensors Architectures
The embedded processing and communication capabilities of intelligent sensors allow designing IoT architectures in a new three-layer concept: cloud, fog, and edge. The fog handles the data transformation and filtering steps without compromising low-level requirements of the edge, such as deterministic communication. It also avoids dealing with large volumes of data, typically present in the cloud. In our implementation, two different approaches are used simultaneously to achieve IT-OT convergence: PLC Platform and PC Platform. Considering the fog computing architecture, the main differences are summarized in Table 4.
Both approaches are perfectly suited for our implementation and represent the diversity of technologies used in current industrial fog-like architectures. The PLC Platform follows a more classic method with more automation layers and an explicit system hierarchy (ISA-95). It is also more suited to work in industrial and ruggedized environments. On the other hand, the PC Platform establishes direct links between smart devices and the cloud, closely resembling an IoT architecture with distributed PCs acting as gateways (Fog). As the PLC Platform has more layers, it demands a more complex communication infrastructure, with more software and requiring more engineering configurations. Another important aspect is interoperability. The PLC Platform typically requires proprietary software, making it more expensive. The use of widely adopted standards such as OPC UA and open-source programming languages such as Python makes the integration with legacy and future technologies easier. Regarding real-time capabilities, the SCADA in our implementation introduces a cycle delay of 200 ms in the PLC Platform, while the overall cycle in the PC Platform is around 6 ms. These values were measured from the moment the user tag was read by the RFID until the feedback on its scheduled tests was received by the interface. In terms of security, by adding more layers and ensuring a physical separation, classical approaches are usually more secure [64]. However, for more direct architectures such as cloud-to-thing, the Ethernet security task group is already targeting the data-link layer, enhancing security checks. The OPC UA roadmap also includes improved security using elliptic-curve cryptography in future releases [65].
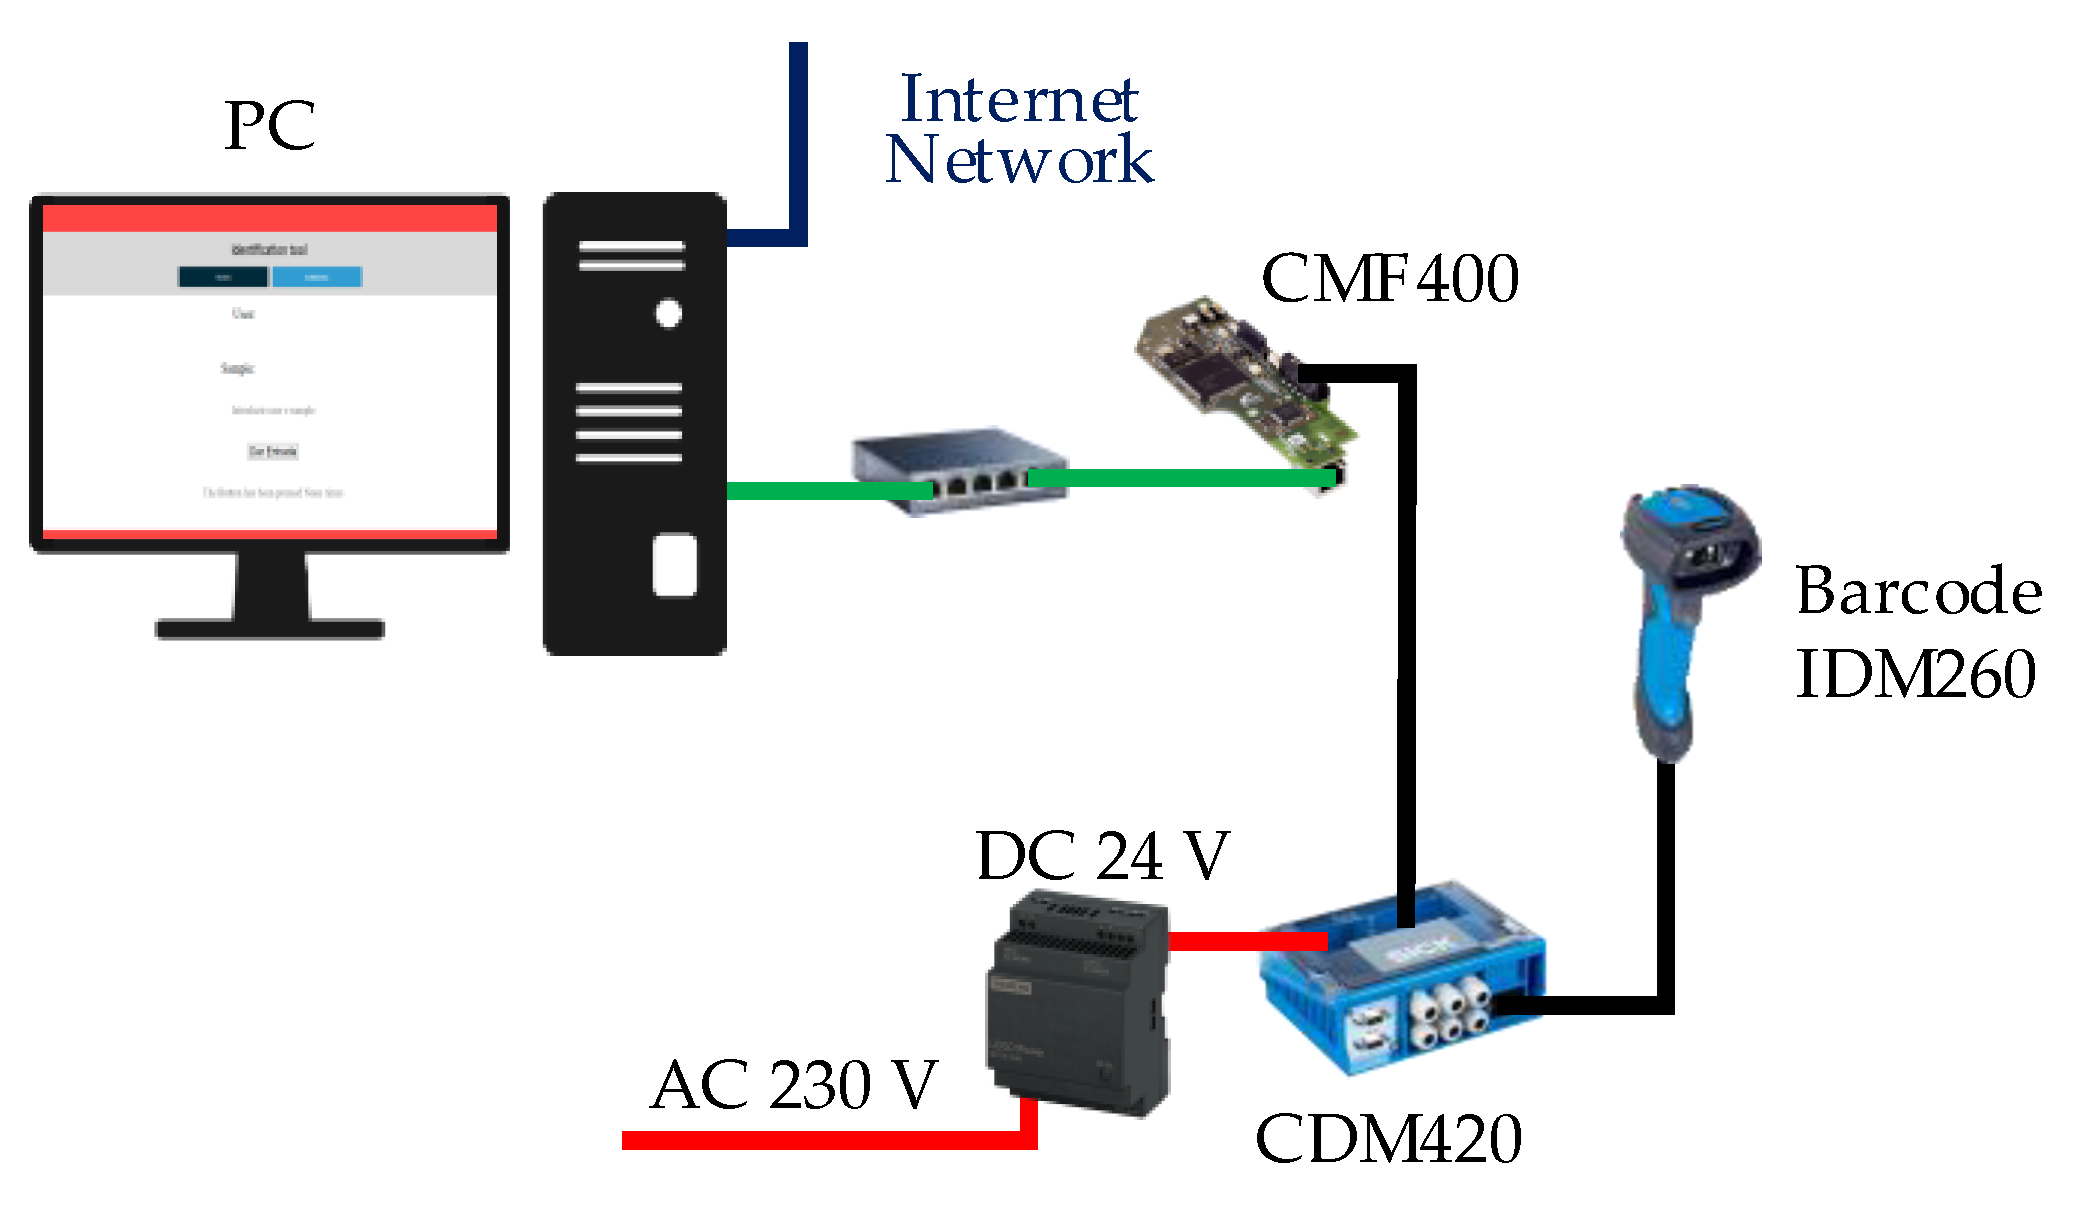
One important feature that characterizes intelligent sensors is their connectivity. The hand-held Barcode reader IDM260 connects to the PC via USB; however, we could have connected it through Ethernet using the connection module CDM420 powered with 24 Vdc and the ethernet kit adapter CMF400 as presented in Figure 10.
If there is no need for user interactions, a single PC is sufficient to manage all the data acquisition and connectivity between the network of Barcode readers and the cloud; also improving scalability.
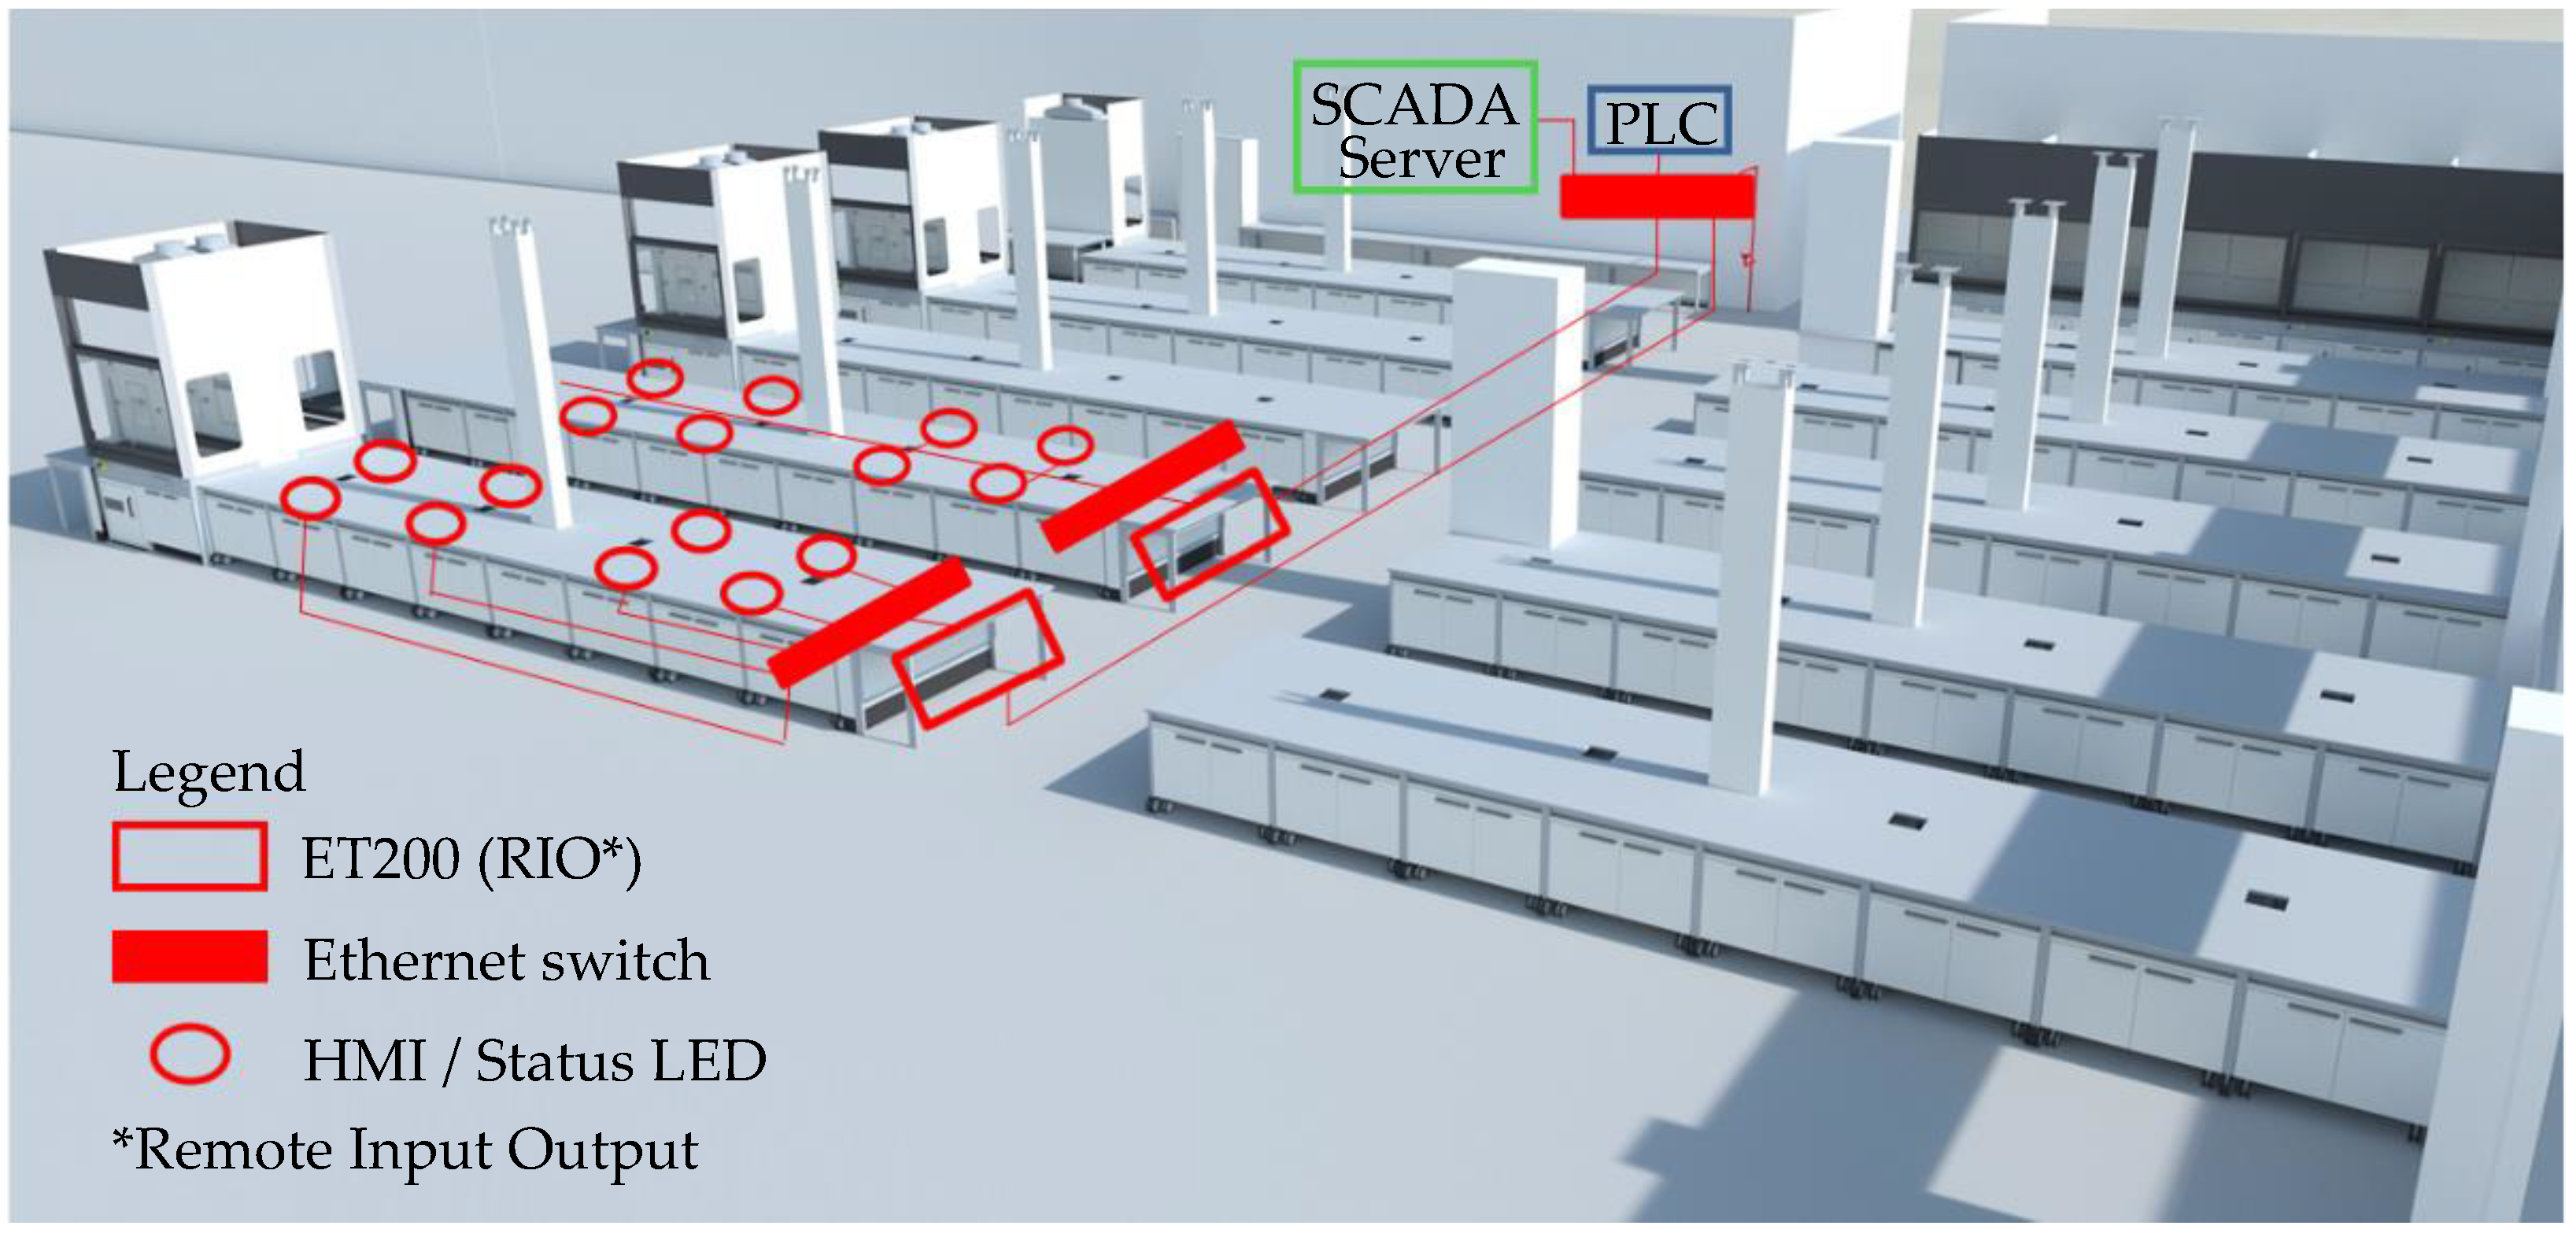
Concerning the proposed structure, the solution can be scaled at the operational level either through distributed PLCs or PCs. Using the PLCs as an example, the communication flow between the SCADA system and the distributed PLCs runs on an Ethernet bus. The Ethernet bus also assures all communications below the PLC layer (field equipment). The proposed system is organized in PLC groups, corresponding to departments or sections (see Figure 11). Each group connects to several ETs, where each ET can connect to several workstations. This architecture provides flexibility to the system, allowing the future growth of the communication nodes. For the PC Platform, the scalability is identical, but instead of HMIs we use PCs, and these connect directly to the cloud.
Decision-making relies on data and mathematical models to convey an output. The real-time integration of information between sensors and the cloud is crucial for the relevance and the performance of a decision system. In production, real-time decision-making typically follows two approaches: cyclic or event-based. In the event-based approach, the rescheduling is triggered by automatic identification events. The sensed information evaluates, fetches data, and updates the data model before it is used. In applications such as predictive maintenance, sensed information is fed cyclically to a model, and the output is computed in every cycle. There are several literature reviews of machine learning methods applied to predictive maintenance [66,67]. Here, models can be trained offline, in batches, or in real-time. The deployment and lifecycle management of online machine learning models can be complex and are addressed case by case [21]. The decision-making can also provide feedback for the model after being used. Supervised classification models, for instance, require the transformation of raw data into a suitable format before being used for training. In our application, data preparation focus on cleansing past and historic data, updating records and constraints, while ensuring the data model have all the business data required for the new scheduling.
Regarding the adopted architectures, many intelligent sensors cannot be connected directly to the cloud. Their connectivity is limited to gateways and other field devices to reduce price, improve latency, and create security barriers. In the PLC Platform, devices such as the RF180C connection module (Figure 5) already support OPC UA connectivity as an IoT interface. However, it still requires an IoT gateway such as Ruggedcom RX1400 with CloudConnect to connect to IoT platforms such as MindSphere. The PC Platform is identical: while the RFID RF620 (Figure 6) can be connected via OPC with the SOPAS OPC configurator, the OPC server would still be hosted on the PC. There are many possible architectures between the cloud and the intelligent sensors, hence the name fog. Fog computing helps to solve many challenges of the cloud-to-thing continuum, such as interoperability to connect with legacy devices, sensor costs, connectivity, determinism, and security. Security is currently one of the major concerns in the field layer. New gateways and middleware technologies are addressing these issues. In the future, with the decreasing of sensor costs, intelligent sensors will become more easily connected to the cloud, such as having onboard wireless connectivity, standard communication protocols, and security features. Protocols such as OPC UA PubSub over TSN will make these integrations possible. Nevertheless, having middleware to handle both real-time deterministic operations while also exchanging information with the transaction world has proven advantageous to real-time decision-making and intelligent automation applications.
6. Conclusions and Future Work
In this paper, we discuss the adoption of intelligent sensors for real-time decision-making. The contributions can be both to the managerial body and the academia. For managers looking to improve their operations, we present a practical and detailed industrial implementation of intelligent sensors towards real-time decision-making. We also introduce the true workflow complexity of current shopfloors and the limitations of existing designs and technologies. This work may provide valuable insight into business cases and ROI analyses. For academia, we present the present-day challenges faced by modern industry operations so new solutions may be researched and proposed.
Unlike sensors, intelligent sensors include onboard processing and communications capabilities. This is advantageous for IoT architectures looking to connect the edge to the cloud in a cloud-to-thing continuum. However, challenges with current architectures show that there are advantages in having an intermediary layer. Fog computing is applied to reduce implementation costs, interoperability, and latency. To support real-time decentralized decision-making, we analyzed an industrial use case of a dynamic scheduling algorithm to the analytical QC laboratories of the pharmaceutical industry. Analytical QC laboratories are being affected by the growing data-based mass personalized production with high demands on data integration and traceability. We used automatic identification technologies for the acquisition. RFID and Barcode readers are two examples of intelligent sensors with onboard intelligent capabilities to decode information and easily track resource states. While RFID can decrease user interactions to a minimum, it is more expensive and not very robust under certain conditions, such as depending on the solid state of the surrounding materials and the tag angle relative to the antenna.
There are two relevant practical notes on the implemented system for future research. The first is that, unlike resources, we do not always have physical representations of the jobs and tasks to be executed. One single sample can encode many jobs and tasks. In this scenario, it is not clear if it is possible to design fully automated systems to start and stop individual tasks, as these run in a shared environment. We propose further studying the creation of physical representations of tasks. In the current implementation, these are delivered together with manual inputs. The other note is that tasks often do not require an operator to be present for its entire duration, but only a percentage of the total processing time. Automatic identification tracks analyst position in real-time, computing the amount of time that she or he spends near each workstation. However, tracking operators in real-time brings ethical concerns. Future research will focus on RTLS technologies for indoor positioning. These complement other identification systems, providing more granular and detailed information, improving business process mappings. Future research includes relying on intelligent sensors for other decision-making systems, such as analyzing the energy consumption in machinery to monitor the execution of tasks, or predictive maintenance, including industrial use cases with implementation details and their challenges. Future decision-making solutions will merge information acquired from multiple sources towards each desired end.
Author Contributions
Conceptualization, T.C., S.M.V., J.F. and J.M.C.S.; methodology, T.C. and J.F.; software, T.C. and B.F.; validation, B.F. and M.S.E.M.; formal analysis, T.C.; investigation, T.C.; resources, J.F., S.M.V. and J.M.C.S.; data curation, B.F.; writing—original draft preparation, T.C.; writing—review and editing, B.F., M.S.E.M., S.M.V., J.F. and J.M.C.S.; visualization, T.C.; supervision, S.M.V., J.F. and J.M.C.S.; project administration, J.F. and J.M.C.S.; funding acquisition, S.M.V., J.F. and J.M.C.S. All authors have read and agreed to the published version of the manuscript.
Funding
This work was supported by FCT, through IDMEC, under LAETA, project UIDB/50022/2020.
Conflicts of Interest
The authors declare no conflict of interest. The funders had no role in the design of the study; in the collection, analyses, or interpretation of data; in the writing of the manuscript, or in the decision to publish the results.
References
- Nahavandi, S. Industry 5.0—A Human-Centric Solution. Sustainability 2019, 11, 4371. [Google Scholar] [CrossRef] [Green Version]
- Esmaeilian, B.; Behdad, S.; Wang, B. The Evolution and Future of Manufacturing: A Review. J. Manuf. Syst. 2016, 39, 79–100. [Google Scholar] [CrossRef]
- Gudivada, V.N.; Ding, J.; Apon, A. Data Quality Considerations for Big Data and Machine Learning: Going Beyond Data Cleaning and Transformations. Int. J. Adv. Softw. 2017, 10, 11–14. [Google Scholar]
- Ghasemaghaei, M.; Calic, G. Can Big Data Improve Firm Decision Quality? The Role of Data Quality and Data Diagnosticity. Decis. Support. Syst. 2019, 120, 38–49. [Google Scholar] [CrossRef]
- Costigliola, A.; Ataíde, F.A.P.; Vieira, S.M.; Sousa, J.M.C. Simulation Model of a Quality Control Laboratory in Pharmaceutical Industry. IFAC-PapersOnLine 2017, 50, 9014–9019. [Google Scholar] [CrossRef]
- Islam, T.; Mukhopadhyay, S.C.; Suryadevara, N.K. Smart Sensors and Internet of Things: A Postgraduate Paper. IEEE Sens. J. 2017, 17, 577–584. [Google Scholar] [CrossRef]
- Morris, A.S.; Langari, R. Chapter 11-Intelligent sensors. In Measurement and Instrumentation; Morris, A.S., Langari, R.B.T.-M.I., Third, E., Eds.; Academic Press: Cambridge, MA, USA, 2021; pp. 323–348. ISBN 978-0-12-817141-7. [Google Scholar]
- Cavalieri, S.; Salafia, M.G.; Scroppo, M.S. Integrating OPC UA with Web Technologies to Enhance Interoperability. Comput. Stand. Interfaces 2019, 61, 45–64. [Google Scholar] [CrossRef]
- Bruckner, D.; Blair, R.; Stanica, M.-P.; Ademaj, A.; Skeffington, W.; Kutscher, D.; Wilmes, R.; Wachswender, K.; Leurs, L.; Seewald, M.; et al. OPC UA TSN A New Solution for Industrial Communication. Proc. IEEE 2019, 107, 1–10. [Google Scholar] [CrossRef]
- Kusiak, A. Smart Manufacturing. Int. J. Prod. Res. 2018, 56, 508–517. [Google Scholar] [CrossRef]
- Coito, T.; Viegas, J.L.; Martins, M.S.E.; Cunha, M.M.; Figueiredo, J.; Vieira, S.M.; Sousa, J.M.C. A Novel Framework for Intelligent Automation. IFAC-PapersOnLine 2019, 52, 1825–1830. [Google Scholar] [CrossRef]
- Trunzer, E.; Calà, A.; Leitão, P.; Gepp, M.; Kinghorst, J.; Lüder, A.; Schauerte, H.; Reifferscheid, M.; Vogel-Heuser, B. System Architectures for Industrie 4.0 Applications: Derivation of a Generic Architecture Proposal. Prod. Eng. 2019, 13, 247–257. [Google Scholar] [CrossRef] [Green Version]
- Coito, T.; Martins, M.S.E.; Viegas, J.L.; Firme, B.; Figueiredo, J.; Vieira, S.M.; Sousa, J.M.C. A Middleware Platform for Intelligent Automation: An Industrial Prototype Implementation. Comput. Ind. 2020, 123, 103329. [Google Scholar] [CrossRef]
- Verba, N.; Chao, K.M.; Lewandowski, J.; Shah, N.; James, A.; Tian, F. Modeling Industry 4.0 Based Fog Computing Environments for Application Analysis and Deployment. Future Gener. Comput. Syst. 2019, 91, 48–60. [Google Scholar] [CrossRef] [Green Version]
- Aazam, M.; Zeadally, S.; Harras, K.A. Deploying Fog Computing in Industrial Internet of Things and Industry 4.0. IEEE Trans. Ind. Inform. 2018, 14, 4674–4682. [Google Scholar] [CrossRef]
- Lavassani, M.; Forsström, S.; Jennehag, U.; Zhang, T. Combining Fog Computing with Sensor Mote Machine Learning for Industrial IoT. Sensors 2018, 18, 1532. [Google Scholar] [CrossRef] [PubMed] [Green Version]
- Fernández-Caramés, T.M.; Fraga-Lamas, P.; Suárez-Albela, M.; Díaz-Bouza, M.A. A Fog Computing Based Cyber-Physical System for the Automation of Pipe-Related Tasks in the Industry 4.0 Shipyard. Sensors 2018, 18, 1961. [Google Scholar] [CrossRef] [Green Version]
- Foehr, M.; Vollmar, J.; Calà, A.; Leitão, P.; Karnouskos, S.; Colombo, A.W. Engineering of Next Generation Cyber-Physical Automation System Architectures. In Multi-Disciplinary Engineering for Cyber-Physical Production Systems; Springer International Publishing: Cham, Switzerland, 2017; pp. 185–206. ISBN 9783319563459. [Google Scholar]
- Jin, X.; Chen, K.; Ji, J.; Zhao, K.; Du, X.; Ma, H. Intelligent Vibration Detection and Control System of Agricultural Machinery Engine. Meas. J. Int. Meas. Confed. 2019, 145, 503–510. [Google Scholar] [CrossRef]
- Ruiz-Sarmiento, J.R.; Monroy, J.; Moreno, F.A.; Galindo, C.; Bonelo, J.M.; Gonzalez-Jimenez, J. A Predictive Model for the Maintenance of Industrial Machinery in the Context of Industry 4.0. Eng. Appl. Artif. Intell. 2020, 87, 103289. [Google Scholar] [CrossRef]
- Angelopoulos, A.; Michailidis, E.T.; Nomikos, N.; Trakadas, P.; Hatziefremidis, A.; Voliotis, S.; Zahariadis, T. Tackling Faults in the Industry 4.0 Era—a Survey of Machine-Learning Solutions and Key Aspects. Sensors 2020, 20, 109. [Google Scholar] [CrossRef] [Green Version]
- Wu, D.; Liu, S.; Zhang, L.; Terpenny, J.; Gao, R.X.; Kurfess, T.; Guzzo, J.A. A Fog Computing-Based Framework for Process Monitoring and Prognosis in Cyber-Manufacturing. J. Manuf. Syst. 2017, 43, 25–34. [Google Scholar] [CrossRef]
- Cakir, M.; Guvenc, M.A.; Mistikoglu, S. The Experimental Application of Popular Machine Learning Algorithms on Predictive Maintenance and the Design of IIoT Based Condition Monitoring System. Comput. Ind. Eng. 2020, 151, 106948. [Google Scholar] [CrossRef]
- Rossit, D.A.; Tohmé, F.; Frutos, M. Industry 4.0: Smart Scheduling. Int. J. Prod. Res. 2019, 57, 3802–3813. [Google Scholar] [CrossRef]
- Chongwatpol, J.; Sharda, R. RFID-Enabled Track and Traceability in Job-Shop Scheduling Environment. Eur. J. Oper. Res. 2013, 227, 453–463. [Google Scholar] [CrossRef]
- Guo, Z.X.; Ngai, E.W.T.; Yang, C.; Liang, X. An RFID-Based Intelligent Decision Support System Architecture for Production Monitoring and Scheduling in a Distributed Manufacturing Environment. Int. J. Prod. Econ. 2015, 159, 16–28. [Google Scholar] [CrossRef]
- Rossit, D.A.; Tohmé, F.; Frutos, M. A Data-Driven Scheduling Approach to Smart Manufacturing. J. Ind. Inf. Integr. 2019, 15, 69–79. [Google Scholar] [CrossRef] [Green Version]
- Sun, Z.; Li, C.; Wei, L.; Li, Z.; Min, Z.; Zhao, G. Intelligent Sensor-Cloud in Fog Computer: A Novel Hierarchical Data Job Scheduling Strategy. Sensors 2019, 19, 5083. [Google Scholar] [CrossRef] [Green Version]
- Zhong, R.Y.; Dai, Q.Y.; Qu, T.; Hu, G.J.; Huang, G.Q. RFID-Enabled Real-Time Manufacturing Execution System for Mass-Customization Production. Robot. Comput. Integr. Manuf. 2013, 29, 283–292. [Google Scholar] [CrossRef]
- Tsang, N.W.-H.; Lam, K.-Y.; Qureshi, U.M.; Ng, J.K.-Y.; Papavasileiou, I.; Han, S. Chapter 11-Indoor Activity Tracking for Elderly Using Intelligent Sensors. In Intelligent Data-Centric Systems; Wister, M., Pancardo, P., Acosta, F., Hernández, J.A.B.T.-I.D.S., Eds.; Academic Press: Cambridge, MA, USA, 2018; pp. 197–222. ISBN 978-0-12-812130-6. [Google Scholar]
- Camacho-Cogollo, J.E.; Bonet, I.; Iadanza, E. Chapter 4—RFID technology in health care. In Clinical Engineering Handbook, 2nd; Iadanza, E., Ed.; Academic Press: Cambridge, MA, USA, 2020; pp. 33–41. ISBN 978-0-12-813467-2. [Google Scholar]
- Barkunan, S.R.; Bhanumathi, V.; Sethuram, J. Smart Sensor for Automatic Drip Irrigation System for Paddy Cultivation. Comput. Electr. Eng. 2019, 73, 180–193. [Google Scholar] [CrossRef]
- Astill, J.; Dara, R.A.; Fraser, E.D.G.; Roberts, B.; Sharif, S. Smart Poultry Management: Smart Sensors, Big Data, and the Internet of Things. Comput. Electron. Agric. 2020, 170, 105291. [Google Scholar] [CrossRef]
- Chakraborty, S.; Das, S.; Sidhu, T.; Siva, A.K. Smart Meters for Enhancing Protection and Monitoring Functions in Emerging Distribution Systems. Int. J. Electr. Power Energy Syst. 2021, 127, 106626. [Google Scholar] [CrossRef]
- Kalpana, S.; Priyadarshini, S.R.; Maria Leena, M.; Moses, J.A.; Anandharamakrishnan, C. Intelligent Packaging: Trends and Applications in Food Systems. Trends Food Sci. Technol. 2019, 93, 145–157. [Google Scholar] [CrossRef]
- Ghaani, M.; Cozzolino, C.A.; Castelli, G.; Farris, S. An Overview of the Intelligent Packaging Technologies in the Food Sector. Trends Food Sci. Technol. 2016, 51, 1–11. [Google Scholar] [CrossRef] [Green Version]
- Bibi, F.; Guillaume, C.; Gontard, N.; Sorli, B. A Review: RFID Technology Having Sensing Aptitudes for Food Industry and Their Contribution to Tracking and Monitoring of Food Products. Trends Food Sci. Technol. 2017, 62, 91–103. [Google Scholar] [CrossRef]
- Zheng, K.; Zheng, K.; Fang, F.; Yao, H.; Yi, Y.; Zeng, D. Real-Time Massive Vector Field Data Processing in Edge Computing. Sensors 2019, 19, 2602. [Google Scholar] [CrossRef] [Green Version]
- Coito, T.; Viegas, J.; Martins, M.; Firme, B.; Figueiredo, J.M.G.; Vieira, S.; Sosua, J. The Impact of Intelligent Automation in Internal Supply Chains. Int. J. Integr. Supply Manag. 2021, 1, 1. [Google Scholar] [CrossRef]
- O’Donovan, P.; Gallagher, C.; Leahy, K.; O’Sullivan, D.T.J. A Comparison of Fog and Cloud Computing Cyber-Physical Interfaces for Industry 4.0 Real-Time Embedded Machine Learning Engineering Applications. Comput. Ind. 2019, 110, 12–35. [Google Scholar] [CrossRef]
- Syafrudin, M.; Alfian, G.; Fitriyani, N.L.; Rhee, J. Performance Analysis of IoT-Based Sensor, Big Data Processing, and Machine Learning Model for Real-Time Monitoring System in Automotive Manufacturing. Sensors 2018, 18, 2946. [Google Scholar] [CrossRef] [PubMed] [Green Version]
- Zhong, R.Y.; Huang, G.Q.; Dai, Q. Mining Standard Operation Times for Real-Time Advanced Production Planning and Scheduling from RFID-Enabled Shopfloor Data; IFAC: Geneva, Switzerland, 2013; Volume 46, ISBN 9783902823359. [Google Scholar]
- Sharma, D.K.; Bhargava, S.; Singhal, K. Chapter 6—Internet of Things applications in the pharmaceutical industry. In An Industrial IoT Approach for Pharmaceutical Industry Growth Volume 2; Balas, V.E., Solanki, V.K., Kumar, R.B.T.-A.I.I.A., Eds.; Academic Press: Cambridge, MA, USA, 2020; pp. 153–190. ISBN 978-0-12-821326-1. [Google Scholar]
- Çakici, Ö.E.; Groenevelt, H.; Seidmann, A. Using RFID for the Management of Pharmaceutical Inventory-System Optimization and Shrinkage Control. Decis. Support Syst. 2011, 51, 842–852. [Google Scholar] [CrossRef]
- Prabhu, G.R.D.; Urban, P.L. Trends in Analytical Chemistry The Dawn of Unmanned Analytical Laboratories. Trends Anal. Chem. 2017, 88, 41–52. [Google Scholar] [CrossRef]
- Prasad, P.J.; Bodhe, G.L. Trends in Laboratory Information Management System. Chemom. Intell. Lab. Syst. 2012, 118, 187–192. [Google Scholar] [CrossRef]
- Venkatesan, M.; Grauer, Z. Leveraging Radio Frequency Identification (RFID) Technology to Improve Laboratory Information Management. Am. Lab. 2004, 36, 11–14. [Google Scholar]
- Urso, O.; Chiacchio, F.; Compagno, L.; D’Urso, D. An RFID Application for the Process Mapping Automation. Procedia Manuf. 2020, 42, 8–15. [Google Scholar] [CrossRef]
- Youssef, S.M.; Salem, R.M. Automated Barcode Recognition for Smart Identification and Inspection Automation. Expert Syst. Appl. 2007, 33, 968–977. [Google Scholar] [CrossRef]
- Mukati, A.; Mukati, R. A Survey on Growing Trends in Automatic Identification and Data Capture Techniques Based on Assigned Properties. Int. J. Comput. Sci. Inf. Secur. 2016, 14, 580–589. [Google Scholar]
- Rance, O.; Perret, E.; Siragusa, R.; Lemaître-Auger, P. 1–Automatic Identification Technology. In RCS Synthesis for Chipless RFID; Elsevier: Amsterdam, The Netherlands, 2017; pp. 51–85. ISBN 978-1-78548-144-4. [Google Scholar]
- Sohrab, A.P.; Huang, Y.; Hussein, M.; Kod, M.; Carter, P. A UHF RFID Tag with Improved Performance on Liquid Bottles. IEEE Antennas Wirel. Propag. Lett. 2016, 15, 1673–1676. [Google Scholar] [CrossRef]
- Herrojo, C.; Paredes, F.; Mata-Contreras, J.; Martín, F. Chipless-RFID: A Review and Recent Developments. Sensors 2019, 19, 3385. [Google Scholar] [CrossRef] [Green Version]
- Omer, M.; Tian, G.Y. Indoor Distance Estimation for Passive UHF RFID Tag Based on RSSI and RCS. Meas. J. Int. Meas. Confed. 2018, 127, 425–430. [Google Scholar] [CrossRef]
- Huang, S.; Guo, Y.; Zha, S.; Wang, F.; Fang, W. A Real-Time Location System Based on RFID and UWB for Digital Manufacturing Workshop. Procedia CIRP 2017, 63, 132–137. [Google Scholar] [CrossRef]
- Zhai, C.; Zou, Z.; Zhou, Q.; Mao, J.; Chen, Q.; Tenhunen, H.; Zheng, L.; Xu, L. A 2.4-GHz ISM RF and UWB Hybrid RFID Real-Time Locating System for Industrial Enterprise Internet of Things. Enterp. Inf. Syst. 2017, 11, 909–926. [Google Scholar] [CrossRef]
- Yang, J.; Poellabauer, C.; Mitra, P.; Neubecker, C. Beyond Beaconing: Emerging Applications and Challenges of BLE. Ad Hoc Netw. 2020, 97, 102015. [Google Scholar] [CrossRef] [Green Version]
- Pacciarelli, D.; D’Ariano, A. Assessing the Value of RFID in Pharmaceutical Production Scheduling; IFAC: Geneva, Switzerland, 2009; ISBN 9783902661432. [Google Scholar]
- Cunha, M.M.; Viegas, J.L.; Martins, M.S.E.; Coito, T.; Costigliola, A.; Figueiredo, J.; Sousa, J.M.C.; Vieira, S.M. Dual Resource Constrained Scheduling for Quality Control Laboratories. IFAC-PapersOnLine 2019, 52, 1421–1426. [Google Scholar] [CrossRef]
- Aslam, M. Introducing Grubbs’s Test for Detecting Outliers under Neutrosophic Statistics—An Application to Medical Data. J. King Saud Univ. Sci. 2020, 32, 2696–2700. [Google Scholar] [CrossRef]
- Zhong, R.Y.; Huang, G.Q.; Lan, S.; Dai, Q.Y.; Zhang, T.; Xu, C. A Two-Level Advanced Production Planning and Scheduling Model for RFID-Enabled Ubiquitous Manufacturing. Adv. Eng. Inform. 2015, 29, 799–812. [Google Scholar] [CrossRef]
- Jie, W.; Minghua, Z.; Bo, X.; Wei, H. RFID Based Motion Direction Estimation in Gate Systems. In Proceedings of the 2018 IEEE 22nd International Conference on Computer Supported Cooperative Work in Design CSCWD 2018, Nanjing, China, 9–11 May 2018; pp. 790–795. [Google Scholar] [CrossRef]
- Siemens. Real-Time Locating Systems (RTLS) in Production; Siemens: Munich, Germany, 2019. [Google Scholar]
- Muller, T.; Walz, A.; Kiefer, M.; Dermot Doran, H.; Sikora, A. Challenges and Prospects of Communication Security in Real-Time Ethernet Automation Systems. In Proceedings of the 2018 14th IEEE International Workshop on Factory Communication Systems (WFCS), Imperia, Italy, 13–15 June 2018; pp. 1–9. [Google Scholar] [CrossRef] [Green Version]
- OPC Foundation OPC UA Roadmap. Available online: https://opcfoundation.org/about/opc-technologies/opc-ua/opcua-roadmap/ (accessed on 1 March 2020).
- Carvalho, T.P.; Soares, F.A.A.M.N.; Vita, R.; da Francisco, R.P.; Basto, J.P.; Alcalá, S.G.S. A Systematic Literature Review of Machine Learning Methods Applied to Predictive Maintenance. Comput. Ind. Eng. 2019, 137, 106024. [Google Scholar] [CrossRef]
- Zonta, T.; da Costa, C.A.; da Rosa Righi, R.; de Lima, M.J.; da Trindade, E.S.; Li, G.P. Predictive Maintenance in the Industry 4.0: A Systematic Literature Review. Comput. Ind. Eng. 2020, 150, 106889. [Google Scholar] [CrossRef]
Figure 1.
Intelligent sensors in a Cloud to Fog to Edge architecture.

Figure 2.
PLC Platform connections.

Figure 3.
PC Platform connections.

Figure 4.
Full system architecture.

Figure 5.
PLC Platform components: (a) Prototype; (b) Implementation.

Figure 6.
PC Platform components: (a) Prototype; (b) Implementation.

Figure 7.
Dashboards tasks developed: (a) Sample preparation—PC Platform; (b) Analytical Run—PLC Platform.
Figure 7.
Dashboards tasks developed: (a) Sample preparation—PC Platform; (b) Analytical Run—PLC Platform.

Figure 8.
PC Platform improved with UHF RFID system: (a) Connections; (b) Implementation.

Figure 9.
Table view with the task states from a test.

Figure 10.
PC Platform connections with ethernet barcode connectivity.

Figure 11.
Scaled architecture for the PLC Platform.


Table 1.
Before and after the adoption of the proposed implementation.
| Before | After |
|---|---|
|
|
Table 2.
Average task processing times (minutes).
| Task Times (min) | Actual System | Proposed System | Improvement | Reduction |
|---|---|---|---|---|
| System Preparation | 139 | 93 | 46 | 33% |
| System Suitability | 159 | 102 | 57 | 36% |
| Sample Preparation | 143 | 117 | 26 | 18% |
| Analytical Run | 221 | 217 | 4 | 2% |
| Total | 662 | 529 | 133 | 20% |
Table 3.
Optical vs. RFID for real-time decision-making.
| Optical System | RFID System | |
|---|---|---|
| Advantage |
|
|
| Disadvantage |
|
|
Table 4.
Automatic identification architectures.
| Measure | PLC Platform | PC Platform |
|---|---|---|
| Hierarchical | + | − |
| Complexity | + | − |
| Interoperability | − | + |
| Real-Time | − | + |
| Security | + | − |
Publisher’s Note: MDPI stays neutral with regard to jurisdictional claims in published maps and institutional affiliations. |
© 2021 by the authors. Licensee MDPI, Basel, Switzerland. This article is an open access article distributed under the terms and conditions of the Creative Commons Attribution (CC BY) license (https://creativecommons.org/licenses/by/4.0/).
Share and Cite
MDPI and ACS Style
Coito, T.; Firme, B.; Martins, M.S.E.; Vieira, S.M.; Figueiredo, J.; Sousa, J.M.C. Intelligent Sensors for Real-Time Decision-Making. Automation 2021, 2, 62-82. https://0-doi-org.brum.beds.ac.uk/10.3390/automation2020004
AMA Style
Coito T, Firme B, Martins MSE, Vieira SM, Figueiredo J, Sousa JMC. Intelligent Sensors for Real-Time Decision-Making. Automation. 2021; 2(2):62-82. https://0-doi-org.brum.beds.ac.uk/10.3390/automation2020004
Chicago/Turabian StyleCoito, Tiago, Bernardo Firme, Miguel S. E. Martins, Susana M. Vieira, João Figueiredo, and João M. C. Sousa. 2021. "Intelligent Sensors for Real-Time Decision-Making" Automation 2, no. 2: 62-82. https://0-doi-org.brum.beds.ac.uk/10.3390/automation2020004