Article

Climate-Environmental Governance in the Mexico Valley Metropolitan Area: Assessing Local Institutional Capacities in the Face of Current and Future Urban Metabolic Dynamics

by
Gian Carlo Delgado Ramos
Center for Interdisciplinary Research on the Sciences and Humanities, National Autonomous University of Mexico, Mexico City 03100, Mexico
Submission received: 2 December 2020 / Revised: 22 December 2020 / Accepted: 30 December 2020 / Published: 11 January 2021

Abstract

:
This paper focuses on the evaluation of local institutional capacities for advancing climate-environmental governance in the Mexico Valley Metropolitan Area (MVMA). It starts with a brief contextualization of the MVMA, followed by an estimation of current and tendential urban inflows and outflows by 2050 with the objective of delineating the challenges and potential implications ahead. Next, an assessment of local climate-environmental institutional capacities is offered. For that, the methodology and main outcomes of the so-called ICI-CLIMA index is presented for 2019. A qualitative discussion continues in order to assert the challenges and opportunities for advancing a coordinated urban agenda for sustainability and resilience. Such discussion has been enriched with documental and other type of information gathered through field research in all of the 76 municipalities that comprise the MVMA. The paper concludes that, in addition to the limited current climate-environmental local capacities, there is a mismatch between them and both the level of climate vulnerability officially identified and the environmental challenges currently facing. Therefore, for coping with a tendential scenario of increasing urban inflows and outflows and their associated climate-environmental implications, MVMA governments will have to improve their capacities while advancing, at all levels of government, the coordination of climate-environmental agendas, and of the later with urban planning and development agendas.

1. Introduction

Mexico Valley Metropolitan Area (MVMA) encompasses 7866 km2 of administrative land and a population of 21 million inhabitants (about 17% of the national population). It is the largest urbanization in Mexico, followed by Guadalajara and Monterrey metropolitan areas.
Governed by 76 local municipalities of three different states—16 of Mexico City, 59 of the State of Mexico and one of Hidalgo—the MVMA has unceasingly expanded, mostly since the 1980s when built area expansion surpassed the rhythm of population growth. From 1980 to 2010, the population grew 1.42%, while the built area increased 357% [1].
Despite generating around a quarter of Mexico’s Gross Domestic Product–GDP, the economic structure of the MVMA, mostly of services, it is among the 275 metropolitan areas of the Organization for Economic Cooperation and Development (OECD) that rank with the lowest per capita GDP, which in this case is of about sixteen thousand dollars yearly [2]. Similar metropolitan areas, in terms of size, such as Paris, generate at least an additional 5% of the national GDP than what the MVMA currently does [2]. Such type of constrained economic structure that characterizes the MVMA is in addition spatially uneven, as the per capita GDP is 3.7 times higher in Mexico City than in the remaining metropolitan area [2]. This spatial inequality, reinforced by urban speculation and sprawling [3,4], takes shape not only in terms of per capita GDP, but also of population density (half of total MVMA population resides in only ten municipalities), housing supply, quality of infrastructure, availability of public (green) spaces, and certainly in the access and accessibility of basic services.
Unequal urban growth has also translated into an uneven spatial distribution of soaring environmental and health impacts associated to air, water, and soil pollution, a condition expected to aggravate within an environmental and climate changing context [5,6,7,8].

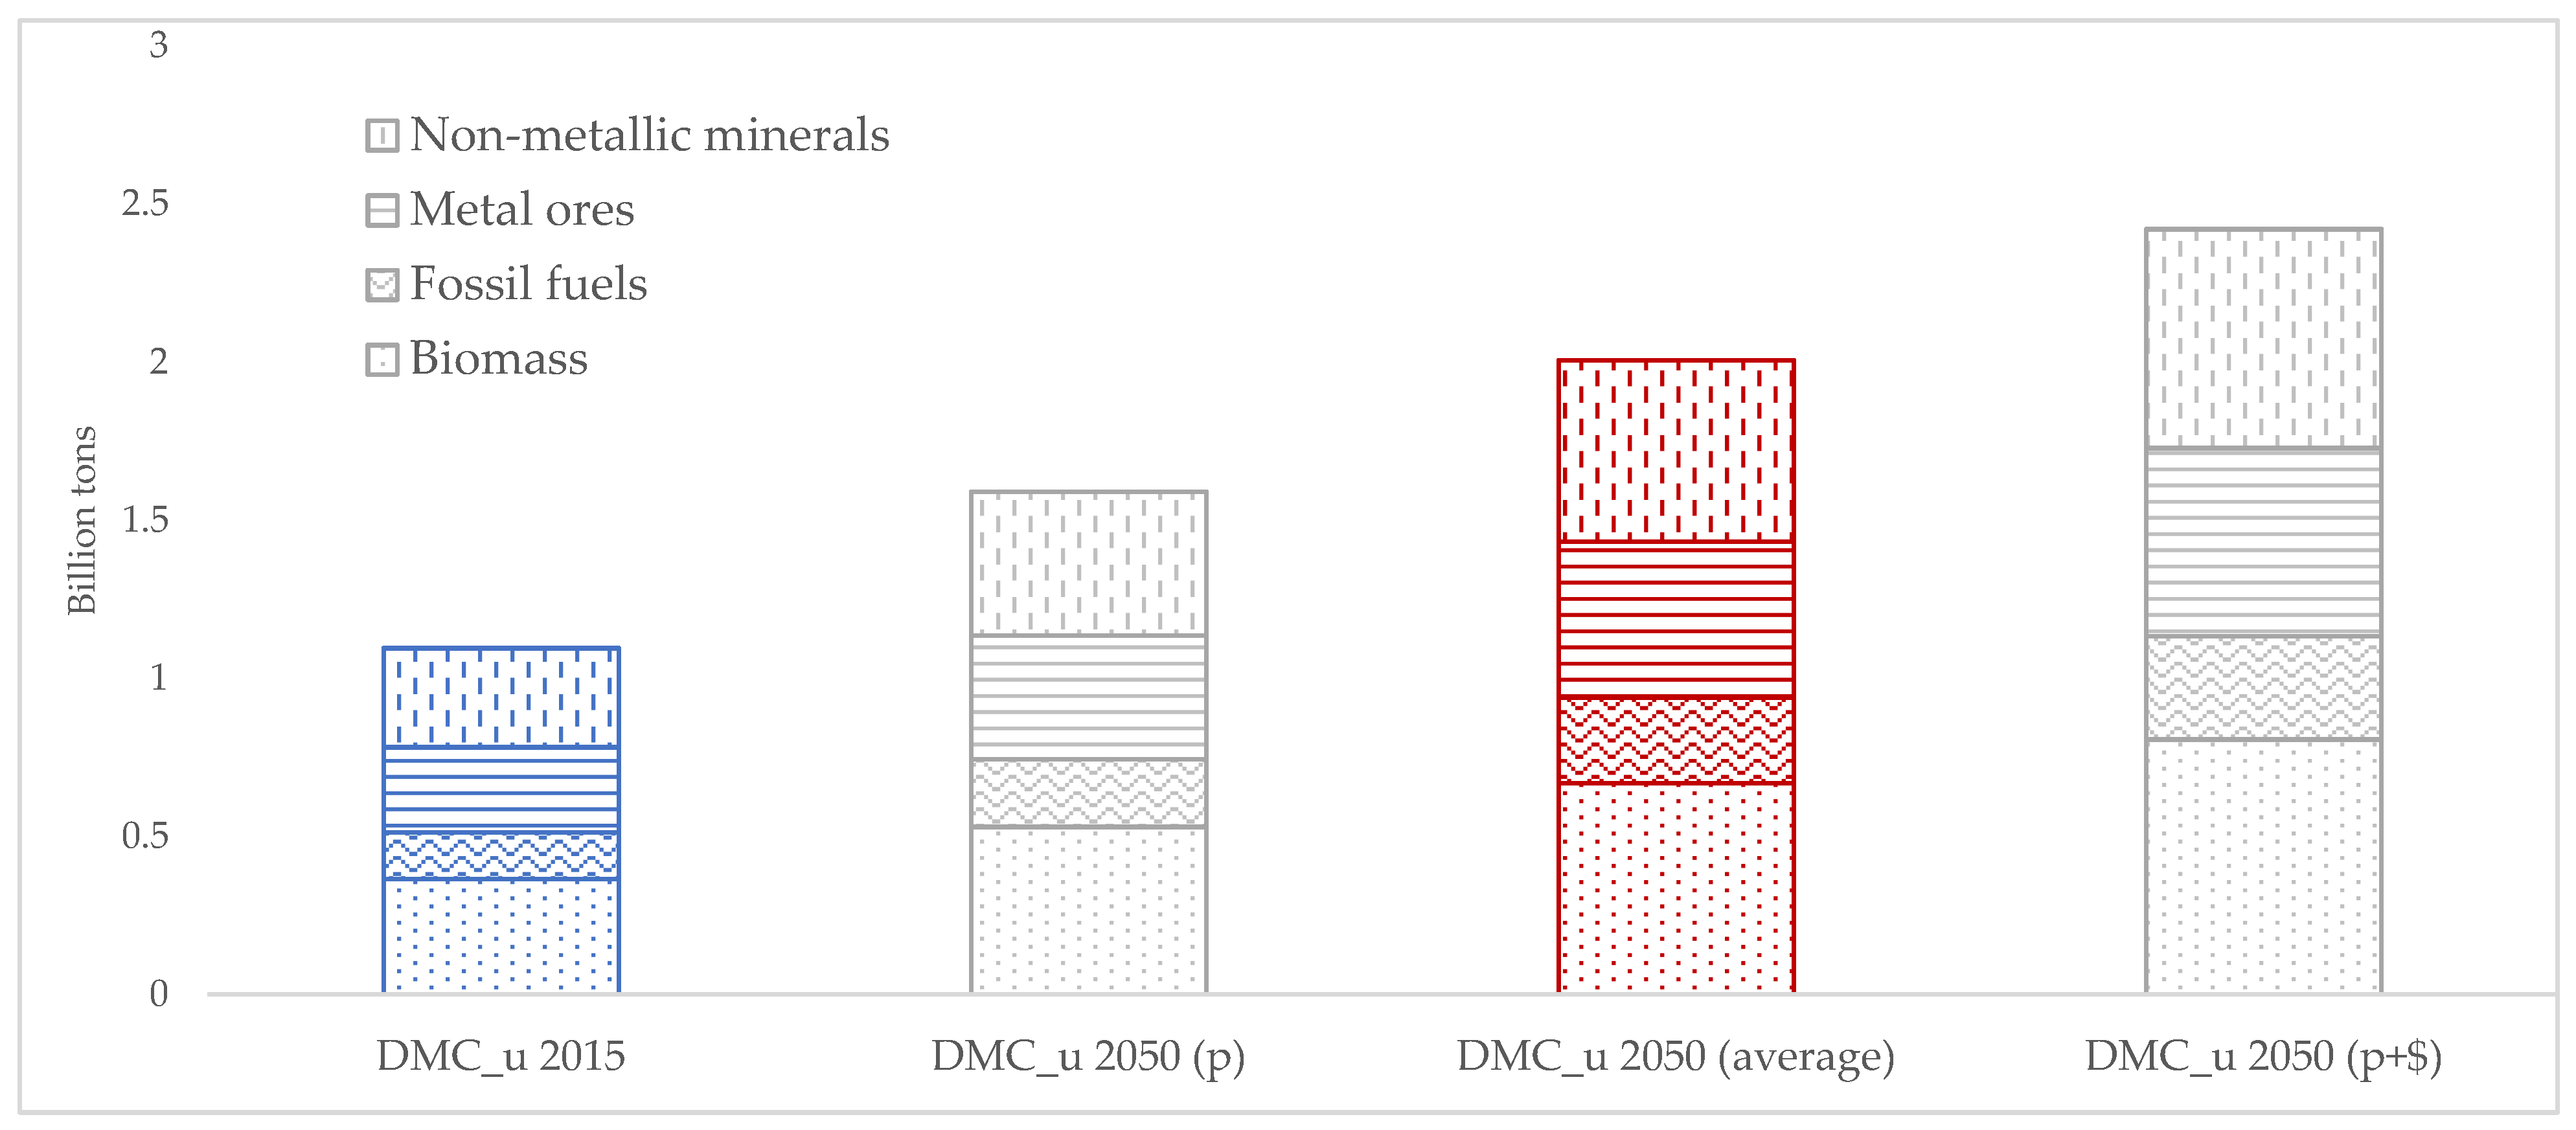
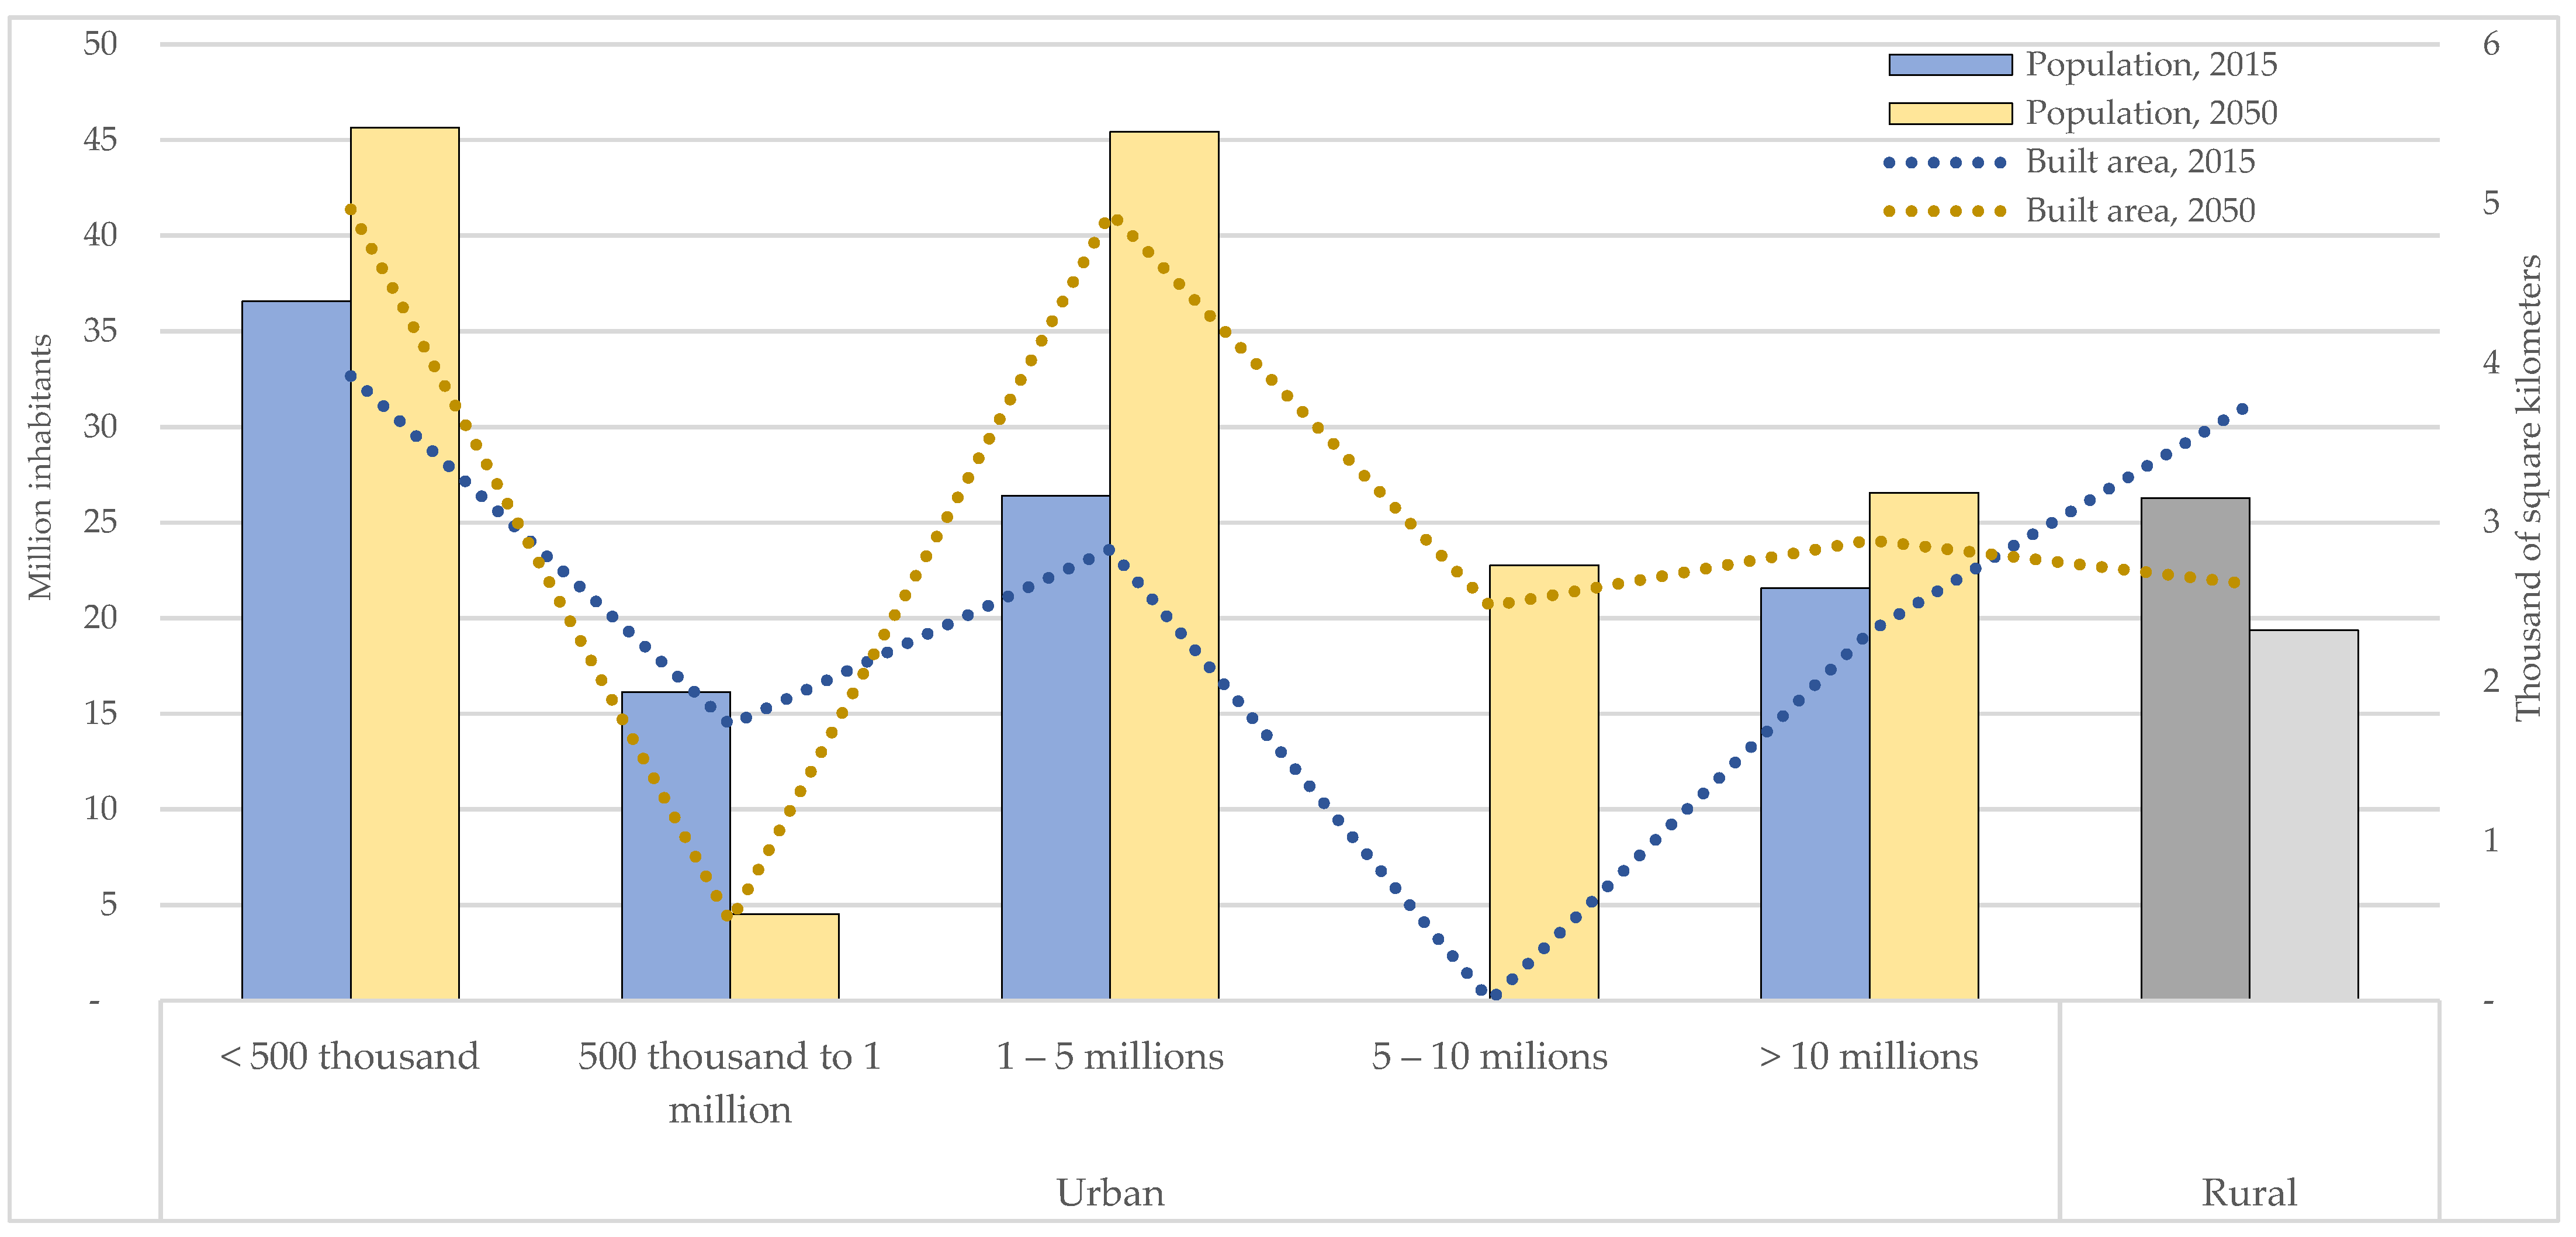
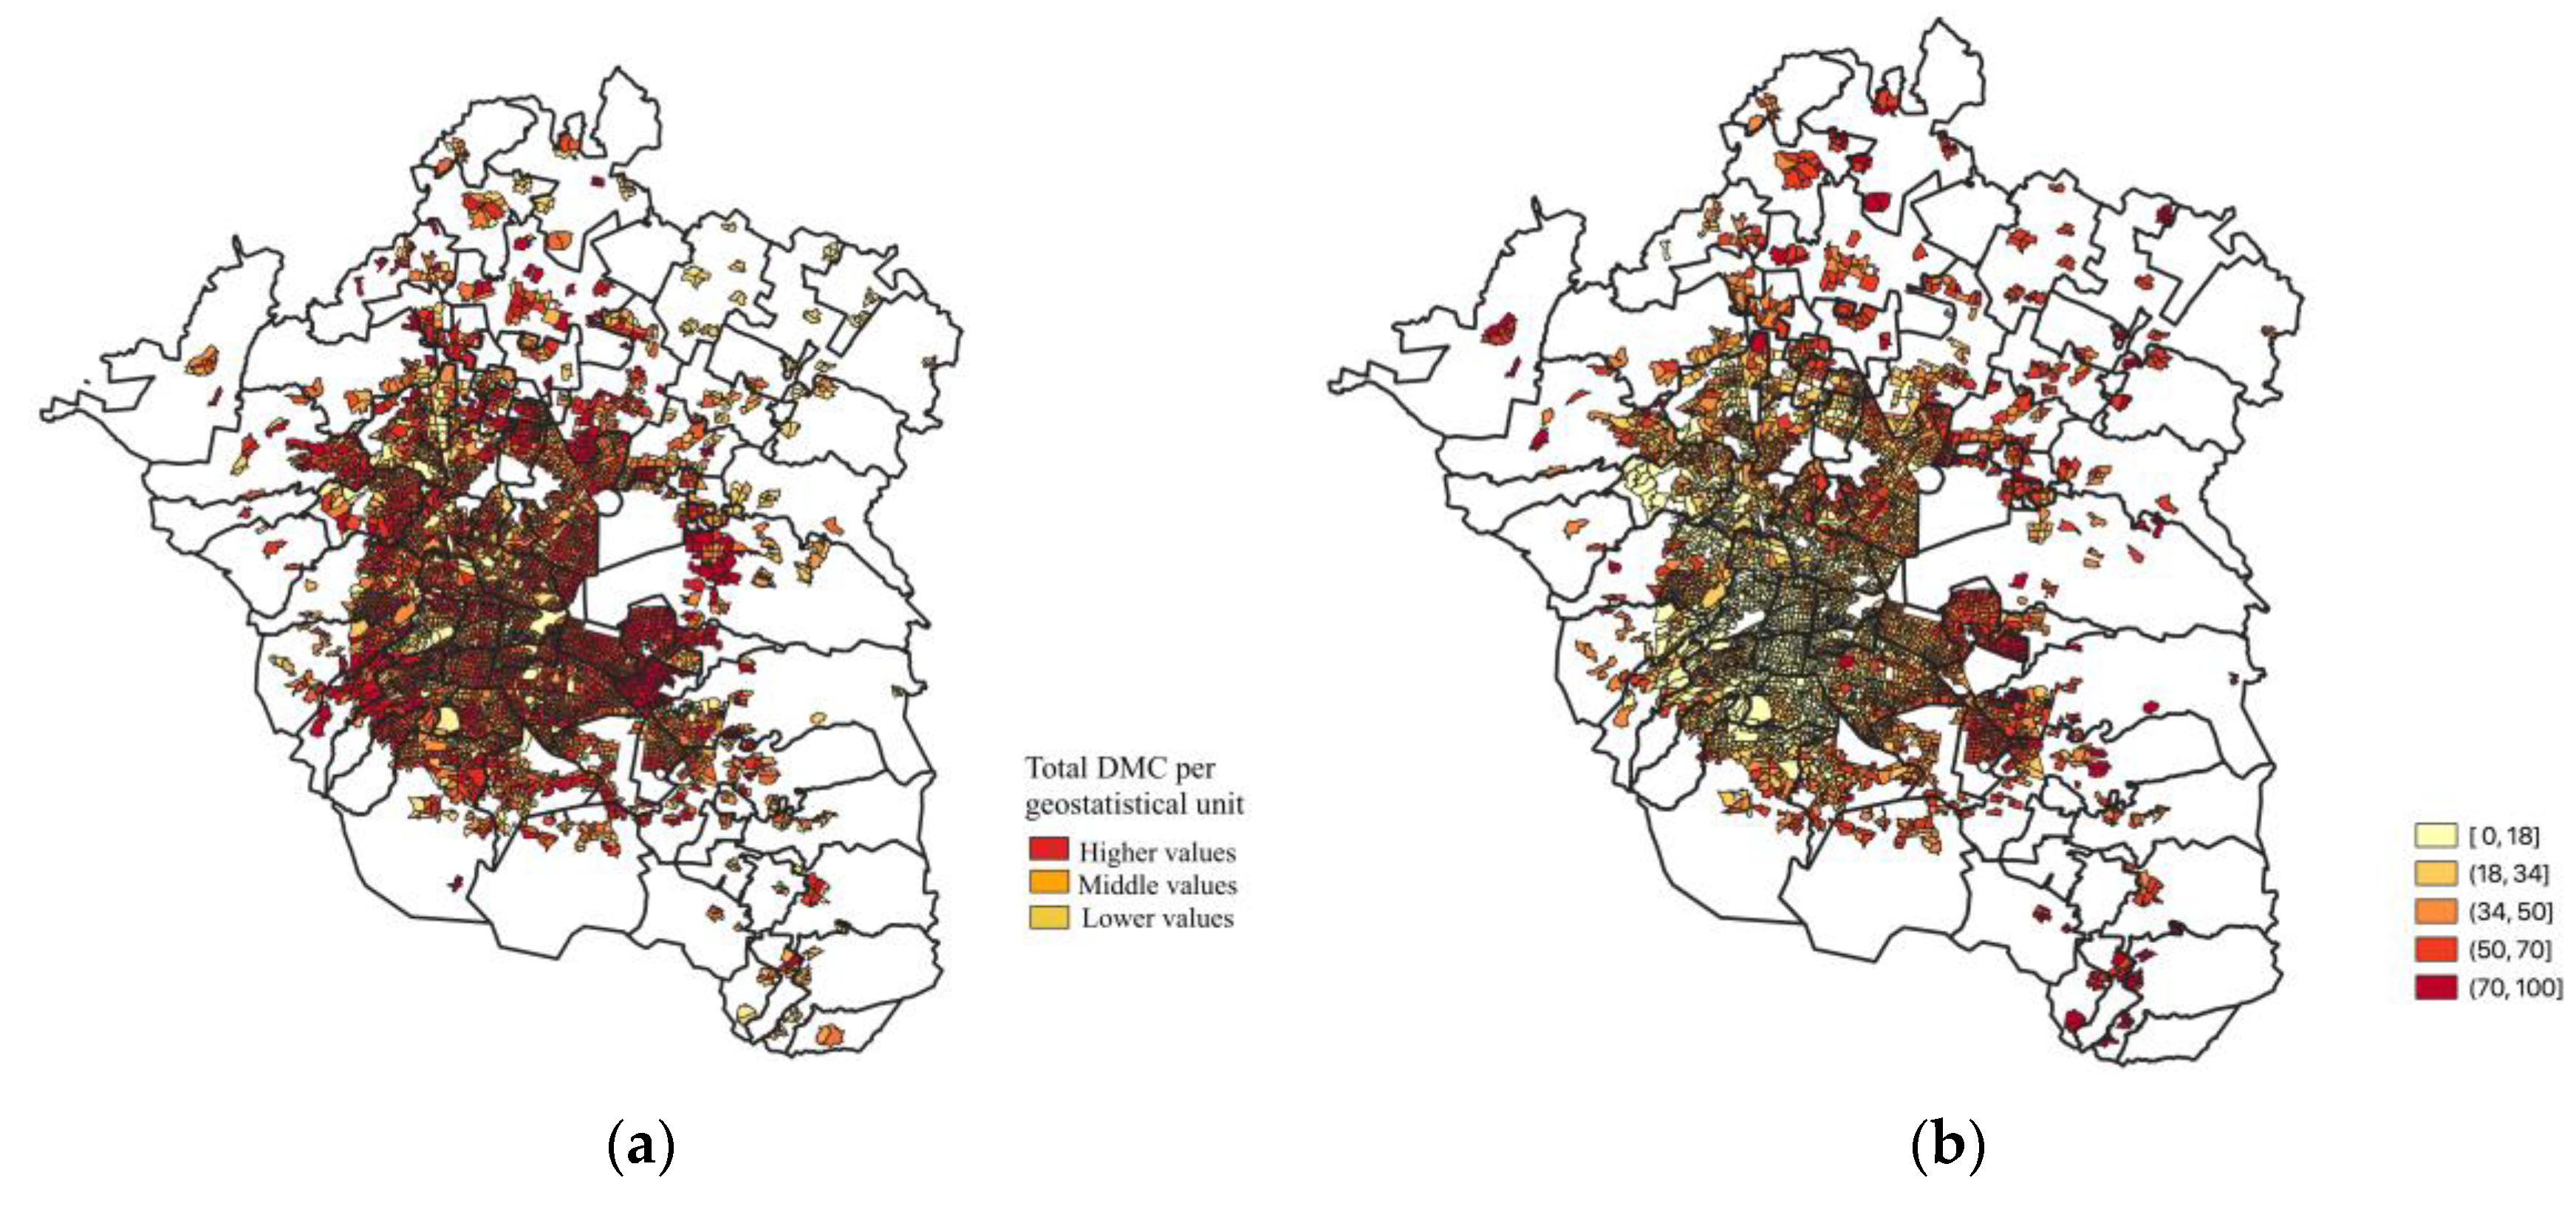
2. Current and Tendential Scenarios of the MVMA’s Urban Inflows and Outflows

Urban inflows and outflows have been analyzed by a diversity of metabolic approaches and methodologies for several cities around the world, most of them in the Global North. In Latin America and the Caribbean, just a few dozens of studies have been published, some of them focusing on the ecological, political, and policy implications of the uneven distribution of urban inflows and outflows [9,10], rather than on the actual estimation of such flows. The later kind of analysis, which are few, have paid attention to one or more key major flows [11,12,13,14,15], occasionally within specific sectors [16,17,18,19,20,21,22,23].
Such urban metabolic assessments have been carried out either as aggregated analyses at the national level [24,25,26,27], for the case of specific cities, or as comparative analyses of few major cities, usually capitals [28,29,30]. Methodologies variate, but most of them are based on some sort of material flow analysis or hybrid analysis that introduce additional measures such as urban ecological footprint or urban water footprint. However, data is scarce and weakly standardized, which is typically the case for small and mid-size cities of the Global South.
In Mexico there are few urban metabolic studies of variated quality and focus, for example for the case of Mexico City and its metropolitan area [3,31,32,33,34,35,36,37,38], Guadalajara [39,40], Cuautla [41], Morelia [42], San Luis Potosí [43,44], and Holbox island [45]. None of them but one [27] offer a useful methodology for carrying out an assessment at a national scale. In what follows, an estimation of the material footprint of the MVMA is presented on the basis of such methodology, which has been developed in the context of the preparation of the forthcoming UNEP’s report The Weight of Cities in Latin America and the Caribbean (for a global assessment, see: [46]). Local data has also been incorporated for its refinement and georeferencing.
The estimation is, in a nutshell, based on national data of Domestic Material Consumption—DMC (as defined by Eurostat [47]) generated by the International Resource Panel—IRP [48], adjusted with a proxy of the weight of urban consumption. The later results from the average of urban national spending weight and an “adjusted” urban GDP, which in turn is an outcome of subtracting to the total GDP all primary activities and extractive activities (mining and oil extraction). Such urban proxy, or what has been called factor U, avoids the mere use of population weight. It also allows to somehow include not only individuals’ consumption but others such as governmental consumption and the private sector consumption. Finally, it also enables to circumvent the distortion that heavy extractive and export-based manufacturing economies tend to display when estimating national DMC patterns.
The generation of tendential scenarios are based on the average of a lower and a higher DMC potential value. The lower value results from projecting total DMC on the basis of population growth data, assuming no changes in per capita consumption patterns. The higher value is estimated on projections of real per capita GDP growth, which are directly translated into a DMC growth rate.
The main outcomes of this methodology applied to Mexico’s National Urban System, composed by 401 cities that cover about 14.5 thousand square kilometers of built-up area and where 74.2% of the country’s population resides, are presented below.
In 2015, the National Urban System demanded around 1095 million tons of biomass, fossil fuels, metal ores, and non-metallic minerals, a consumption intensity with significant ecological and climate direct and indirect impacts due to material extraction, use, and disposal [27]. Under a tendential scenario for 2050, such urban DMC is expected to increase between 45% and 221% due to population growth, built area expansion, changes in economic dynamics and likely intensification of consumption patterns [27]; see Figure 1.
Since the methodology for DMC accounting does not include water, water inflows and outflows are to be added as well as the generation of other outflows such as waste and greenhouse gases—GHG. For estimating urban water inflows and outflows, national water footprints accounts [50] have been used (considering the industrial consumption component of the national water footprint as fully urban and by applying the factor U to agricultural and human consumption components). For urban municipal waste and GHG emissions, national data [51,52] has been adjusted by applying the already mentioned factor U. Tendential projections to 2050 have considered both, population growth [48] as well as changes in consumption patterns (based on [49]). See data estimations in Table 1.
In the above described context of increasing demand of resources, which imply considerable ecological impacts, the MVMA is a central case as it plays and still will play a significant role by 2050, despite the fact that it will experience a decline on its relative population and built area weight within the National Urban System. As Figure 2 shows, small and mid-size cities will experience most of future population growth and built-area expansion.
Under a tendential scenario, MVMA’s average DMC will increase from 9.47 tons per capita in 2015, to 13.63 tons per capita in 2050 with inequalities of up to 50% among the municipalities that compose it. Details and data for MVMA estimations in Supplementary Material.
Furthermore, spatial disparities are noticeable due to high population density and poverty prevalence, on one hand (as in Iztapalapa, Nezahualcóyotl, Ecatepec, or most of the peri-urban municipalities of the east), and low population density, higher income, and elevated consumption patterns, on the other (as clearly noticeable in Benito Juárez and in general in the central areas of Mexico City). Figure 3a shows DMC intensities in 2015 for each MVMA’s geostatistical unit. Figure 3b shows poverty prevalence in 2015. If the two figures are seen together, the second type of description can be appreciated when looking at the clear colors in Figure 3b that turn red or orange in Figure 3a.
A similar trend could be experienced in urban water inflows and outflows as well as in other type of urban outflows as they are usually related to changes of consumption patterns.
MVMA’s water footprint may thus increase, under a tendential scenario, from 6.07 m3 per capita daily in 2015 to 6.49 m3 per capita daily in 2050 (average value of a range between 6.07 and 6.9 m3 per capita daily). Of such volume, agricultural WF, or the contained and virtual water of food consumed, represents 86.3% of the total MVMA’s WF while WF outflows represent 7.3% of the total MVMA’s WF. See calculation details in Supplementary Material.
Similarly, MVMA’s GHG emissions may grow from about 8.2 kg per capita daily in 2016 to 11.81 kg per capita daily in 2050 (average value from a range between 8.2 and 15.41 kg per capita daily), while municipal solid waste may increase from 1.1 kg per capita daily in 2015 to 1.6 kg per capita daily in 2050 (average value from a range between 1.1 and 2.09 kg per capita daily).
Trends in urban inflows and outflows can indeed change if measures are effectively taken. Those include: (i) long-term urban planning and design for sustainability, health, and resilience [55,56,57,58]; (ii) technological and non-technological measures for decreasing natural resource extraction, improving urban efficiency, and closing urban flows cycles [47,59,60]; (iii) introduction of nature-based solutions for reducing climate risk and promoting biodiversity and habitat conservation [61,62,63]; (iv) addressing social inclusion while reducing inequalities of all kind [64,65,66,67]; (v) enhancing urban participatory governance, hand in hand with local institutional capacity building, science–policy interface promotion, and finance innovation [68,69,70,71]; and undoubtedly, (vi) climate-environmental education for everyday practices and behavioral change [72,73].
In what follows, focus is paid to existing local institutional capacities in the MVMA as an entry point for portraying the degree of resolution needed for coping with the previously described tendential scenario and its potential implications, say through the implementation of the above-described measures.
Local institutional capacities are certainly just one type among other capacities that are crucial too. Nonetheless, institutional capacities can lead and set the tone by enabling the urban governance that a profound sustainable and resilient transformation demands.

3. ICI-CLIMA: Assessing Local Institutional Capacities for Climate-Environmental Action

With the support of the International Network for Government Science Advice and the International Development Research Centre, the Climate-Environmental Local Institutional Capacity Index, in what follows ICI-CLIMA, was developed [74]. It offers a comprehensive assessment of the existing climate-environmental local capacities within the MVMA, yet its methodology can be replicated to other cities or metropolitan areas.
ICI-CLIMA analyzes seven broad aspects: (1) existence of key and updated planning instruments; (2) state of human capacities; (3) budget adequacy and efficient administration; (4) accountability and institutional openness; (5) degree of integration of climate-environmental issues within current institutional arrangements and structures; (6) coordination of climate-environmental and the civil protection agendas; (7) coordination among neighboring local governments; and (8) existence and quality of social participation mechanisms. See further details in Appendix A.
Contrary to other efforts that seek to assess local capacities in Mexico (for the case of local climate adaptation capacities, see [75]), ICI-CLIMA integrates both qualitative and quantitative information and data emanated from documentary and field research, including evaluations through observation, in-depth interviews, and workshops with local policymakers and decision makers.
In the methodology 1.0, ICI-CLIMA is limited to draw a baseline from which progress or setbacks can be verified. Future editions of ICI-CLIMA may thus refine or extend information, data, and appraisals, a process that could be better served if it responds to local current priorities and challenges (yet without losing its comparative analysis aptitudes). Aspects related to individual capacities of dedicated personal to climate-environmental issues can, for example, be analyzed in depth by addressing their level of education and experience, hand in hand with the type of responsibilities they undertake. Similarly, in a 2.0 methodological edition (to be implemented in the next edition of ICI-CLIMA), a more detailed evaluation can be offered in relation to the degree and type of coordination among those governmental institutions (of all levels) that are relevant for advancing urban sustainability and resilience. Social participation may as well be better evaluated by including in the process citizen’s perceptions, an aspect that has not been considered in the 1.0 methodology as it is restricted to local governments’ auto-evaluations, combined with an expert evaluation.
ICI-CLIMA valuation scale ranges from 0 to 3, three being the existence of robust capacities and zero the absence of capacities. Values below 1.5 refer to insufficient or very limited capacities. Those between 1.51 and 2 indicate insufficient capacities, between 2.01 and 2.5 sufficient capacities, and above 2.51 refer to robust capacities. Figure 4a–h present the resulting evaluation for each ICI-CLIMA aspect as it was during the second half of 2019.
The heterogeneous evaluation outcome of local institutional capacities in 2019 derives from specific situations or local realities. In some cases, the lower values responded to structural issues (including limited budget and human capacities, and the prevalence of relatively inefficient or slow administration processes). In others, a greater role had the lack of updating planning instruments, an unsatisfactory openness of policymakers, the resistance to change, or the limited coordination within the structure of each local government, as well as among them and with other levels of government. The diverse aspects evaluated reveal inertias inherited from previous administrations, either positive or negative. They also demonstrate the relevance that climate-environmental issues have, or do not have, in current local government plans in the face of expected climate urban vulnerability and risk (the later not yet officially evaluated at an urban level in Mexico, an issue one would expect as an effect of the conceptual transition observed in the last two IPCC’s assessment reports about knowledge on climate change; see [76]).
In this context, the mismatch has been notorious between climate-environmental existing capacities and the officially recognized degree of climate vulnerability for most of the local governments that comprise the MVMA. Figure 5a presents the aggregated valuation of ICI-CLIMA 2019 by municipality, while Figure 5b shows their level of climate vulnerability.

4. Discussion: Implications of ICI-CLIMA 2019 Findings

ICI-CLIMA offers a baseline for pursuing science-based solutions and fostering science-policy interface arrangements seeking to enhance climate-environmental local action. Since local capacities continuously evolve, ICI-CLIMA 2019 outcomes may differ from future evaluations, particularly due to changes in local governments, as well as in policy, economic, and social local to global dynamics (including, for instance, the current COVID-19 emergency). Tracking such local capacities not only allows to identify accomplishments and undesirable setbacks within time, as already said, but can also empower local governments and civil society, either for supporting continuity or transformation of actions and their related regulations, financing, and implementation mechanisms. With that in mind, four aspects stand out when seeking to advance local climate-environmental institutional action in the MVMA:

4.1. Financial, Technological, and Human Institutional Capacity Building

Local governments are highly dependent on state and federal funding, a feature that reduces local governments’ flexibility for planning and implementing autonomous actions. Budgetary limitations are as well a general concern as local responsibilities such as urban green spaces or waste management are not necessarily appropriate assumed. Even when some local MVMA governments have implemented, in some degree or another, actions that, for instance, on one hand comprise safety issues or urban development and infrastructure improvement—considered by local residents as urgent issues—while on the other, adopting certain environmental measures, the restrictions are nevertheless evident, at least from the viewpoint of fulfilling a comprehensive climate-environmental agenda at both the local and metropolitan levels. Hence, generating local resources and exploring non-traditional sources of funding seem to be key aspects for MVMA’s local governments, an issue that certainly should involve improving transparency and accountability mechanisms on a permanent basis. Yet, local climate-environmental agendas should not be constrained to the generation of such resources, and even more, the latter may not imply a setback in local sustainability and resilience.
Due to the aforementioned strong budgetary dependence and limitations, local capacities are also inadequate, from equipment and penetration of technologies in everyday management and administrative processes to the existence of human capacities with the appropriate experience for planning and executing robust climate-environmental local agendas. This situation translates into uneven and sometimes limited monitoring capacities, which in turn explains the constrained quality or even the absence of local data. It also relates to a weak or an absence of accountability at the local level, in some cases a condition that enables the discretional use of local resources. It is thus desirable to reverse the absence or weak monitoring of climate-environmental investments. Such measure, on one hand, could support the visualization of the correct dimension of said agenda in the action of local governments, and on the other, may encourage the development of local climate-environmental budgets in parallel to traditional local budgets (as the cases of Oslo [77] or New York [78] have shown feasible).
The relevance of such climate-environmental budget resides in their potential for articulating actions among different government entities, within local but also across different levels of government, which in turn may reduce unnecessary expenditures or implementation delays.
A combined climate and environmental budget can also support MVMA local governments to visualize how to implement concrete climate adaptation and mitigation actions as they have repetitively expressed the difficulty to (financially) justify and translate potential climate risks into preventive actions.

4.2. Sustainable and Resilient Land Use Policies for Long-Term and Inclusive Urban Planning

In the MVMA, as in other metropolitan areas of the country, there is an increasing necessity for enhancing, updating, and harmonizing ecological land use planning and urban planning, instruments which are particularly weak at a local scale but also at a metropolitan level.
The aforementioned is particularly important, especially in a context in which administrative times do not facilitate medium and long-term planning, a situation that is aggravated by the recurrent lack of information and records from previous administrations. It is also significant because despite the recognition of the current climate-environmental crisis, local institutional reaction usually does not respond with the sense of urgency needed, nor does it necessarily have a representative weight within the organizational structure of local governments. In fact, mapping those spaces of decision and the individuals in charge of the climate-environmental local agendas in the MVMA is quite challenging, as they variate from municipality to municipality. In some, there is only one councilor who addresses all local environmental issues among other issues of the local administration, but without a formal municipal structure for implementing a formal agenda. In others, climate-environmental issues are placed under different management structures, either as independent entities or as decision spaces that are subordinated to broader management structures in charge of urban development, urban services, or else.
Changes in public servants in charge of local climate-environmental agendas, or changes in the local managing structures, are to be added to the previously said, as they challenge any stable effort of planning within a framework of relatively short local administrations. During the few months of the ICI-CLIMA 2019 evaluation process, changes were experienced in five municipalities, including two cases of partial or full reengineering of climate-environmental local managing structures.
In response to the above, it is urgent to increase environmental sensitivity within the institutional local structures while advancing clear administrative procedures that may allow transcending the political will on climate-environmental matters. Each local government will, however, have to explore the mechanisms that better fit its own reality while improving communication, planning, and the promotion of coordinated actions at the regional and metropolitan levels.
Finally, it has to be said that climate-environmental action in the MVMA faces specific challenges related to the unavoidable territorial nature of climate-environmental action, a feature that challenges the control of territories by organized crime (including narcotraffic or illegal logging of urban and peri-urban forests) but also of other type of “informal” urban powers such as the one behind waste picking. Such challenges include the difficulty of local authorities, but also of local residents, to organize themselves and maneuver climate-environmental interventions in certain areas (some of which are of greater ecological value). In other cases, the control of organized crime has even penetrated the institutional structures of government, specifically in areas directly connected with territorial control of which climate-environmental management is a key one (it has been striking that one of the local governments that presented one of the highest level of opacity during the ICI-CLIMA 2019 evaluation was precisely one later involved in a scandal associated to the detention of environmental authorities and their formal accusation for narcotraffic [79]. This is the type of “extreme” reality that face the MVMA local governments which cannot be eluded when trying to accelerate sustainable and resilient land uses for long-term and inclusive urban planning.

4.3. Science-Policy Interface Enhancement and Knowledge Generation for Supporting a Participatory Urban Governance

A more robust science-policy interface is desired at both the local and metropolitan scales, all along with a minimum and updated training of policy and decision makers on basic aspects such as land use planning and uses, current climate-environmental instruments and regulations, and in what respects to the positive connotation of coordinating actions within local governments and, at least, neighboring governments that comprise the MVMA—particularly in such cases where common climate-environmental challenges exist.
In addition, the need of generating open and up-to-date data and knowledge for planning but also evaluating and monitoring climate-environmental agendas at a local, regional, and metropolitan scale is certainly evident for the MVMA case, mostly if a more robust and informed participatory governance is to be promoted. In this line of thought, several actions could be promoted, from financing research-action agendas on pressing climate-environmental issues to the acceleration of science-policy practice interaction through, for example, encouraging partnerships between universities and local city governments, developing and supporting governmental and non-governmental platforms of open-knowledge useful for local decision making (such as Decidim platform currently being used by several cities for public dialogue, consultations and participatory decision making), or by building bridges among key actors through facilitators and boundary organizations.
In this context, it has to be recognized that despite the imperative democratization of decision-making, insecurity, and, on occasions, the institutional and social relegation of climate-environmental urgency, limits or hinders the capacity to act. Yet, it is also true that a more institutional and community-based climate-environmental action for urban transformation can conversely serve, on one hand, for reversing prevalent schemes of vested interests and, on the other, for reducing insecurity through strengthening both citizen communication and neighborhood ties.

4.4. Solving the Causes, Not Just the Symptoms, of Climate-Environmental and Other Types of Urban Vulnerability and Risks

The three aforementioned axes can enable an institutional governance for advancing a truly urban transformation, meaning a process of transformational changes not only in what respects to the sociotechnical dimension of cities (infrastructure and network-type urban systems), but mostly of urban planning, design, and management. The latter presumes the recognition of the causes, not the mere symptoms, of climate-environmental challenges, including associated vulnerabilities and risks. This implies the recognition of urban inequalities, a context in which success—paraphrasing Pelling and Garschagen [80]—should be measured in terms of the concrete improvement of the living conditions of the most vulnerable population.
ICI-CLIMA is just a tool that seeks to support such an effort by visualizing key challenges, gaps, and opportunities for advancing a more robust institutional climate-environmental governance which, in the current context of the COVID-19 pandemic and its impacts, undoubtedly acquires a more preponderant role. COVID-19 context has not only hindered efforts for improving MVMA local climate-environmental capacities, but also some of the most basic aspects of local governability, including a supplementary pressure on local budgets within a context of a generalized decline of local economic activities. It has also affected administrative procedures, science-policy interactions, and social participation schemes. Impacts have even involved certain de-stabilization of local governments as COVID-19 related dead-tolls have included, only in the case of the MVMA, a couple of mayors (case of Tonanitla and Coyotepec municipalities), workers of diverse level or responsibility within local governments, not to say population in general. COVID-19 deaths in the MVMA account for more than 278 thousand people until 24 November 2020. Figure 6a,b shows the spatial asymmetric intensities on the disease transmission and deaths within the MVMA.

5. Conclusions

A desirable urban transformation is possible, but it will depend on the type of measures taken, the degree of articulation of the actions, the existing capacities to implement them, and moreover, the willingness to actually “leave no one behind” as set by the Sustainable Development Goals motto.
How and where local action and public/private resources are allocated in the coming months and years—as part of policy and financial measures for tackling COVID-19 impacts—will be key given that they could, on the one hand, reinforce notions of “renewed” cities but anchored into conventional logics that point towards business-as-usual trends, or on the other, actively support sustainable, resilient, inclusive, and just urban transformation pathways.
The current COVID-19 crisis has demonstrated the possibility of dramatically reducing GHG emissions as a result of collective action, albeit mandatory due to lockdown measures [81]. It has also attested the viability for coordinating local to metropolitan actions when political will is fully set into motion, as it is precisely the case of the MVMA (governments of Mexico City and the State of Mexico, led by different political parties, officially agreed and actually coordinate actions for managing the up-to-now COVID-19 crisis).
At the same time, it has starkly (re)exposed the uneven nature of cities due to the asymmetrical prevalence of poverty, consumption patterns, access to public services, exposure to pollutants, and distribution of unwanted urban and peri-urban land uses, among other issues, including the differentiated capacities to confront a diversity of social vulnerabilities, either of climate-environmental or health type [82]. Therefore, if an urban transformation as the one here envisioned is to be successful, among other things for reverting tendential scenarios of increasing urban inflows and outflows, it must then take into account that public, private, and individual actions are to be implemented in a coordinated but differentiated way, so they can best respond to the prevalent unequal vulnerabilities, responsibilities, and capacities. The worst scenario would certainly be the lack of action as it may not only reinforce, but even aggravate business as usual trends.

Supplementary Materials

The following are available online at https://0-www-mdpi-com.brum.beds.ac.uk/2673-4060/2/1/3/s1, Excel database of DMC estimations for Mexico’s urban national system entitled, “Mexico data”; and database of MVMA general estimations, entitled “MVMA data.”

Funding

This research was supported, on one hand, through a UNEP’s contract for developing The Weight of Cities in Latina America and the Caribbean (forthcoming) report, and on the other, through the 2019 INGSA research associate program, which is supported by the International Development Research Centre of Canada—IDRC.

Institutional Review Board Statement

Not applicable.

Informed Consent Statement

Not applicable.

Data Availability Statement

Data is contained within the article and the supplementary material. Data Citation: Delgado Ramos, G.C. 2021. Mexico’s and MVMA’s Metabolic Estimations Data. Available online: www.mdpi.com/2673-4060/2/1/3/s1.

Acknowledgments

Data related to MVMA’s inflows and outflows comes from estimates developed for UNEP’s report The Weight of Cities in Latin America and the Caribbean. Information on local institutional capacities, including ICI-CLIMA methodology and data, are main outcomes of the research project “Valuating science–policy interface for urban climate-environmental action,” supported by INGSA-IDRC.

Conflicts of Interest

Author declares no conflict of interest as the funders had no role in the design of the study; in the collection, analyses, or interpretation of data; in the writing of the manuscript, or in the decision to publish the results.

Appendix A

ICI-CLIMA is based on a mixed assessment methodology. It incorporates both quantitative and qualitative components, in addition to being based on documentary and field work. The evaluation shows the state of institutional capacities at a certain moment. It assess eight aspects: (1) existence of key and updated planning instruments; (2) state of human capacities; (3) budget adequacy and efficient administration; (4) accountability and institutional openness; (5) degree of integration of climate-environmental issues within current institutional arrangements and structures, including (6) the coordination of climate-environmental and the civil protection agendas; (7) coordination among neighboring local governments; and (8) existence and quality of social participation mechanisms.
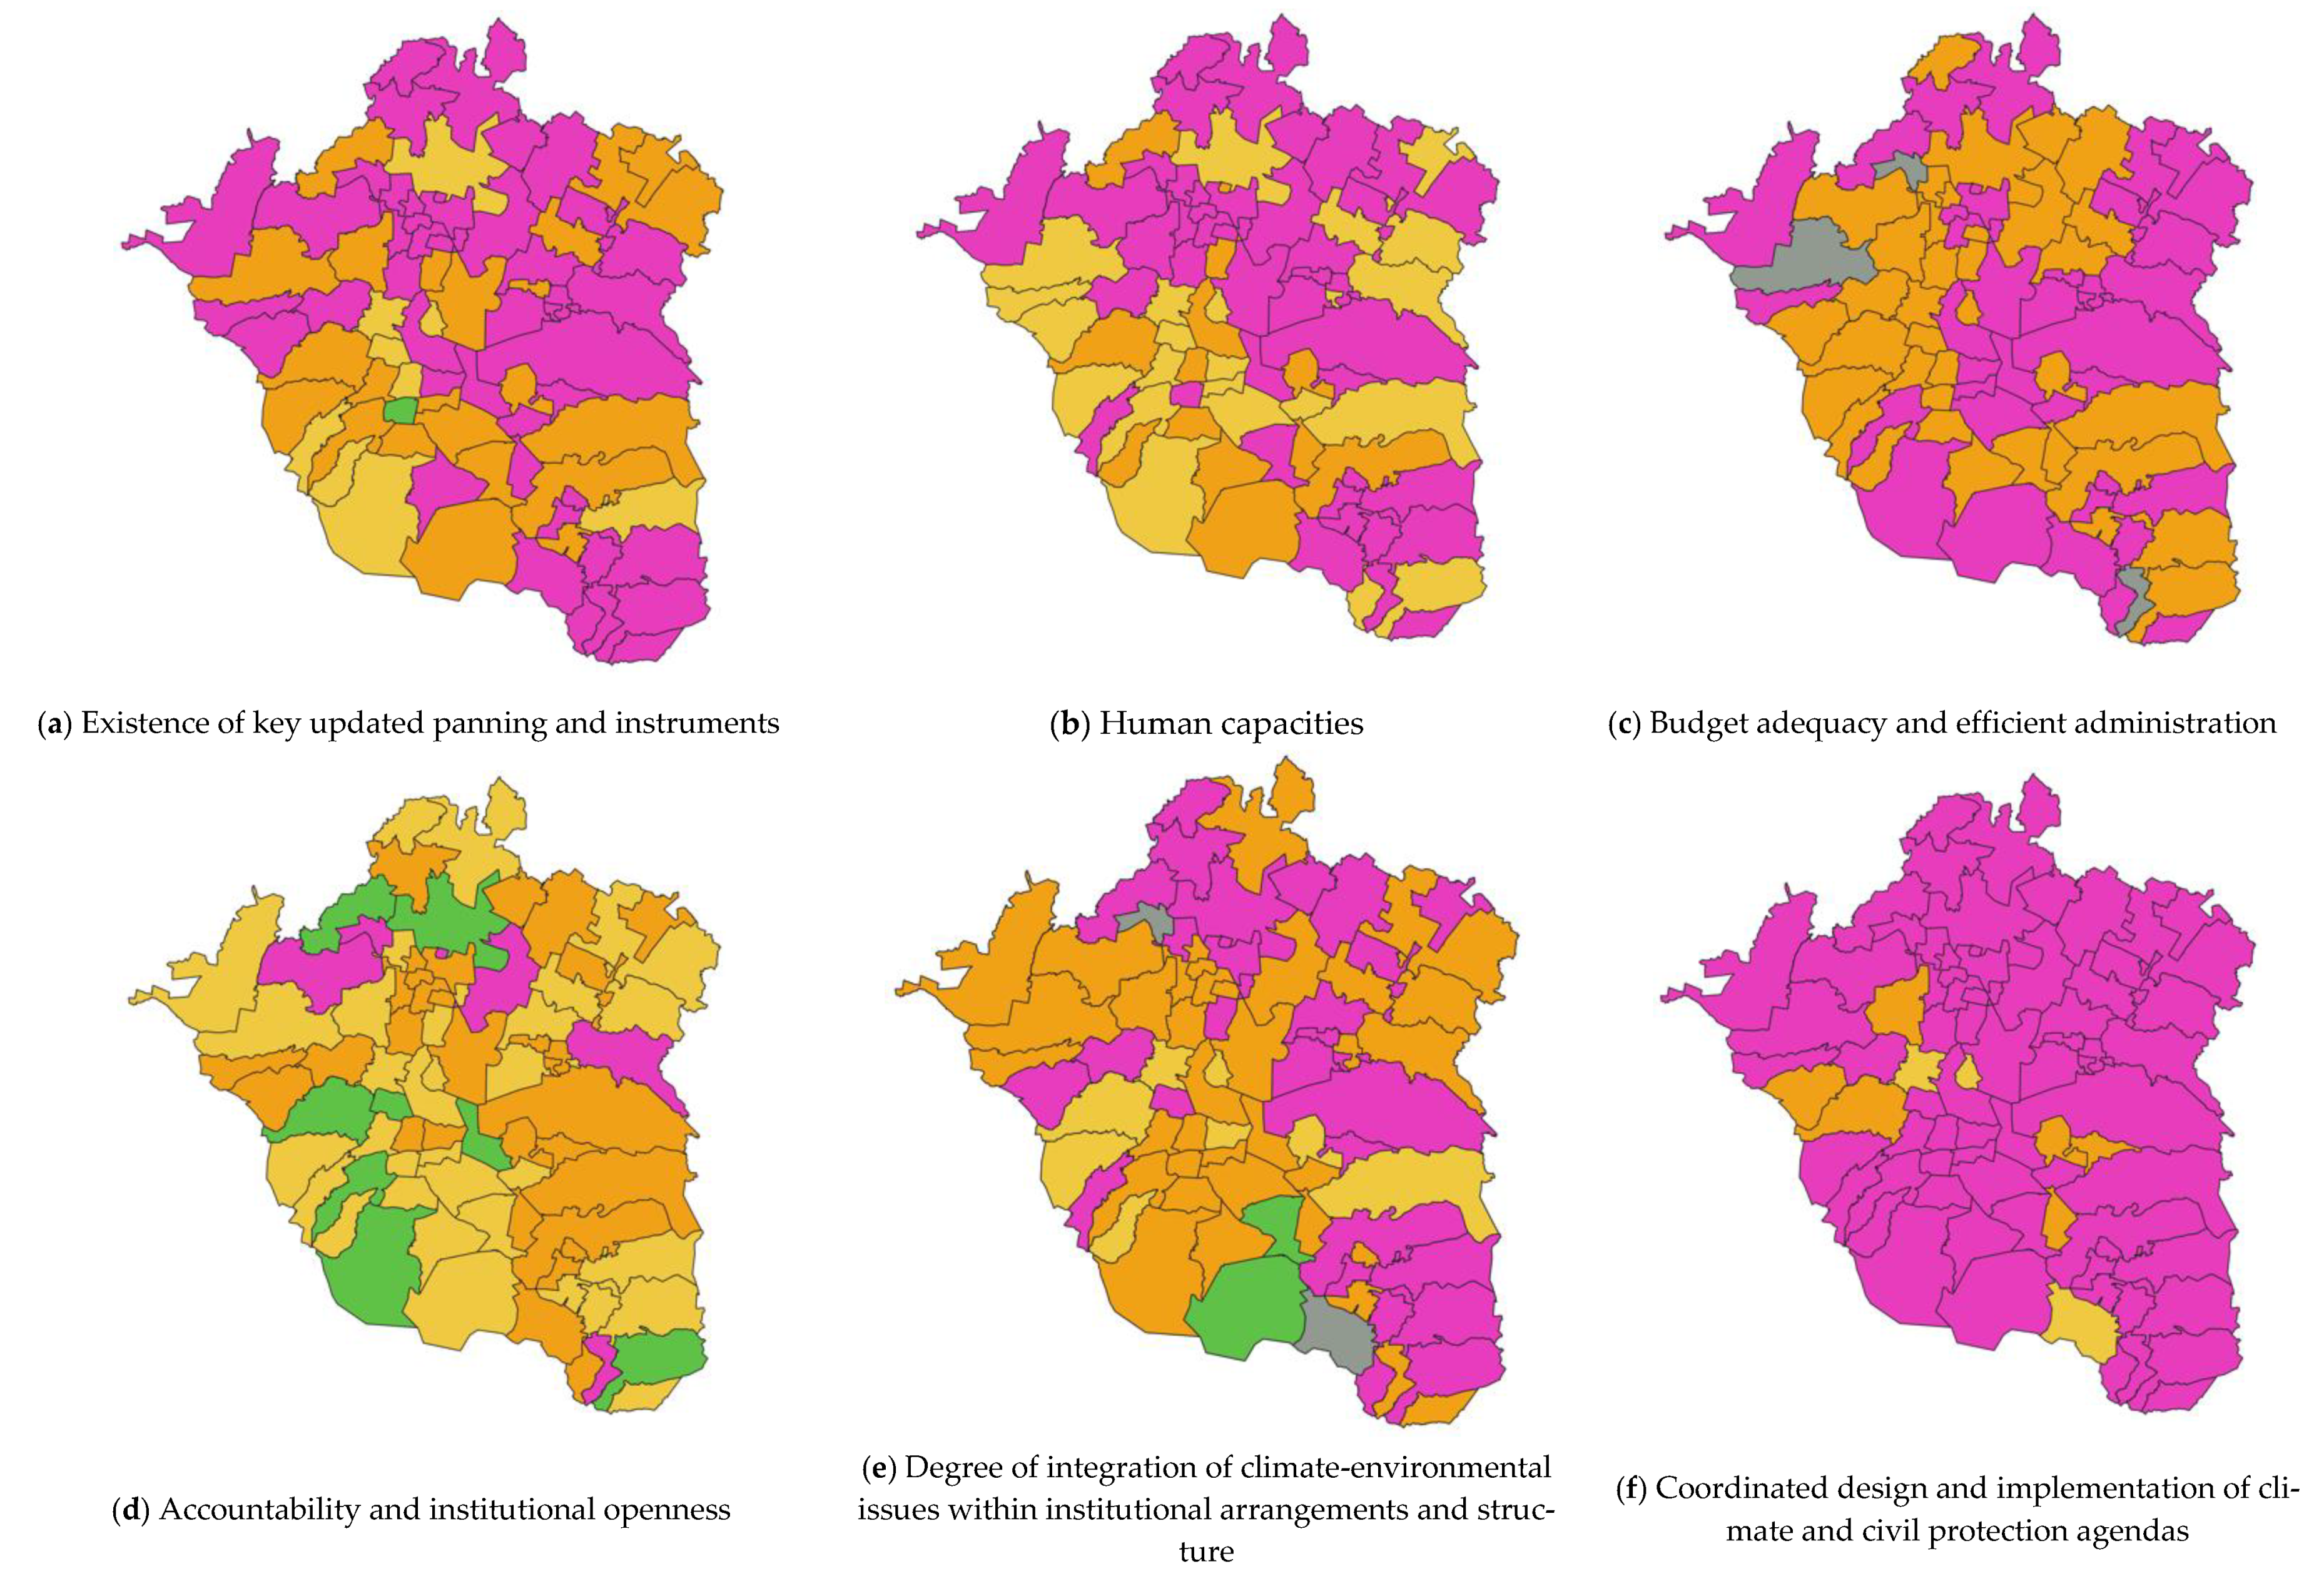
  • Aspect 1: Evaluates the existence and updating of climate-environmental planning instruments at the local level. A local Urban Development Program with no more than 3 years old is considered robust, while one up to 5-years old is pondered as sufficient. A 10-year-old program is evaluated as insufficient and a 15-year-old program or older as an obsolete. A local Risk Atlas is considered robust if it has been updated in a period of time no longer than 2 years, while a 3-to-5 year-old as one that is satisfactory. A local Risk Atlas 5 to 7 years old is appraised as insufficient and one older than 8 years as very limited. In evaluating both Urban Development Programs and Risk Atlas, government cycles have been considered, as well as the possibility of an additional renewal period for up to a total of 6 years as established by Mexican law (each cycle lasts 3 years for the case of local governments while at the state level a cycle lasts 6 years).
    For the case of local Climate Change Action Plans at the municipal level, ICI-CLIMA 1.0 only evaluates their existence, but in later versions, the index will assess their level of progress, which until 2019, for most the 14 existing programs in the MVMA, was unsatisfactory. Waste Management Plans at the local level are evaluated in the same way as local Climate Change Action Plans are in ICI-CLIMA 1.0.
  • Aspect 2: The number of people in decision-making positions is assessed by coupling two components. On the one hand, the rate of human capacities for decision-making in each local government, measured in terms of the institutional potential to serve its population in climate-environmental related issues (number of officials per 100,000 inhabitants). On the other, the existing human capacity to cover the geographical extent of each demarcation (officials per square kilometer or hectares only when municipalities are too small). The rating scale for the first component assumes that a rate greater than 5 officials is a robust level, while between 3 and 4 is sufficient, between 1 and 2 insufficient, and less than 1 very limited. For the second case, it is presumed that a ratio of one official for less than 6.25% of the territory of each demarcation represents a robust situation, while between 6.26% and 12.5% is sufficient, between 12.6 and 25% insufficient, and more than 25% very limited. This last scale has the exception when it comes to very large territorial extensions with a relatively small population. In such cases, the aggregated valuation of the components is reduced by a quintile, which in turn derives from the aggregation of the highest values of the range obtained for each (which applies to all cases).
    In the case of the role and empowerment of women within local institutional structure and existing capacities on climate-environmental matters, the existence of 25% or less of women with respect to the total number of decision-making positions is considered a very limited level of empowerment. The presence of women in the range of 25.1% to 45% is considered as insufficient empowerment; 45.1% to 50% as sufficient, and equal to or greater than 50.1% as robust. Of course, any structure in which the role of women in decision-making positions is greater than 55% should also be considered as unbalanced, as it does not comply with a gender parity scheme. In later versions of ICI-CLIMA, the gender issue will be integrated with the capacities and training of decision-makers on climate-environmental issues.
  • Aspect 3: Budgetary sufficiency is assessed through the analysis of the Annual Operational Programs of each demarcation, accounting for the weight of spending on climate-environmental matters. In order to avoid distortions in the measurement, programmed spending on urban infrastructure and equipment is not included, even if it has, to one degree or another, environmental implications (say on issues such as mobility or management of drinking water and sanitation services). Instead, it does include the budget for civil protection actions as it is central, not only for disaster prevention and management, but also to advance the local adaptation agenda. Given that local institutional capacities are being measured, this item does not contemplate spending executed from other levels of government. Considering that the proportion of spending on climate-environmental actions with respect to the total programmed spending of local governments does not in itself reflect the degree of sufficiency, a qualitative assessment is at the same time used. The later assessment is based on the perception of local decision-makers and the use of knowledge about local climate-environmental challenges. Both components are added considering equal weights.
    In relation to administrative efficacy and efficiency, the evaluation is only qualitative when dealing with governments just elected. Such evaluation is grounded on the appreciation of the decision makers themselves. When it comes to local governments on their last year in office, administrative efficacy and efficiency is assessed by reviewing both the programed budget and actual spending, but also thru the qualitative analysis described above. Aggregation gives the same weight to both components. ICI-CLIMA 1.0 for 2019 uses the first calculation.
  • Aspect 4: Accountability on climate-environmental information is evaluated through a qualitative assessment on the degree of public accessibility to documents and not merely their existence. The extent to which local governments themselves are clear and direct in their dissemination is analyzed.
    Local authorities’ willingness to collaborate with ICI-CLIMA was valued in a comprehensive manner, including the request for appointments, openness during interviews, quality of the information or arguments offered, and the participation on the remaining process, including a qualitative exercise of self-assessment and the review of preliminary results of the ICI-CLIMA before its public release.
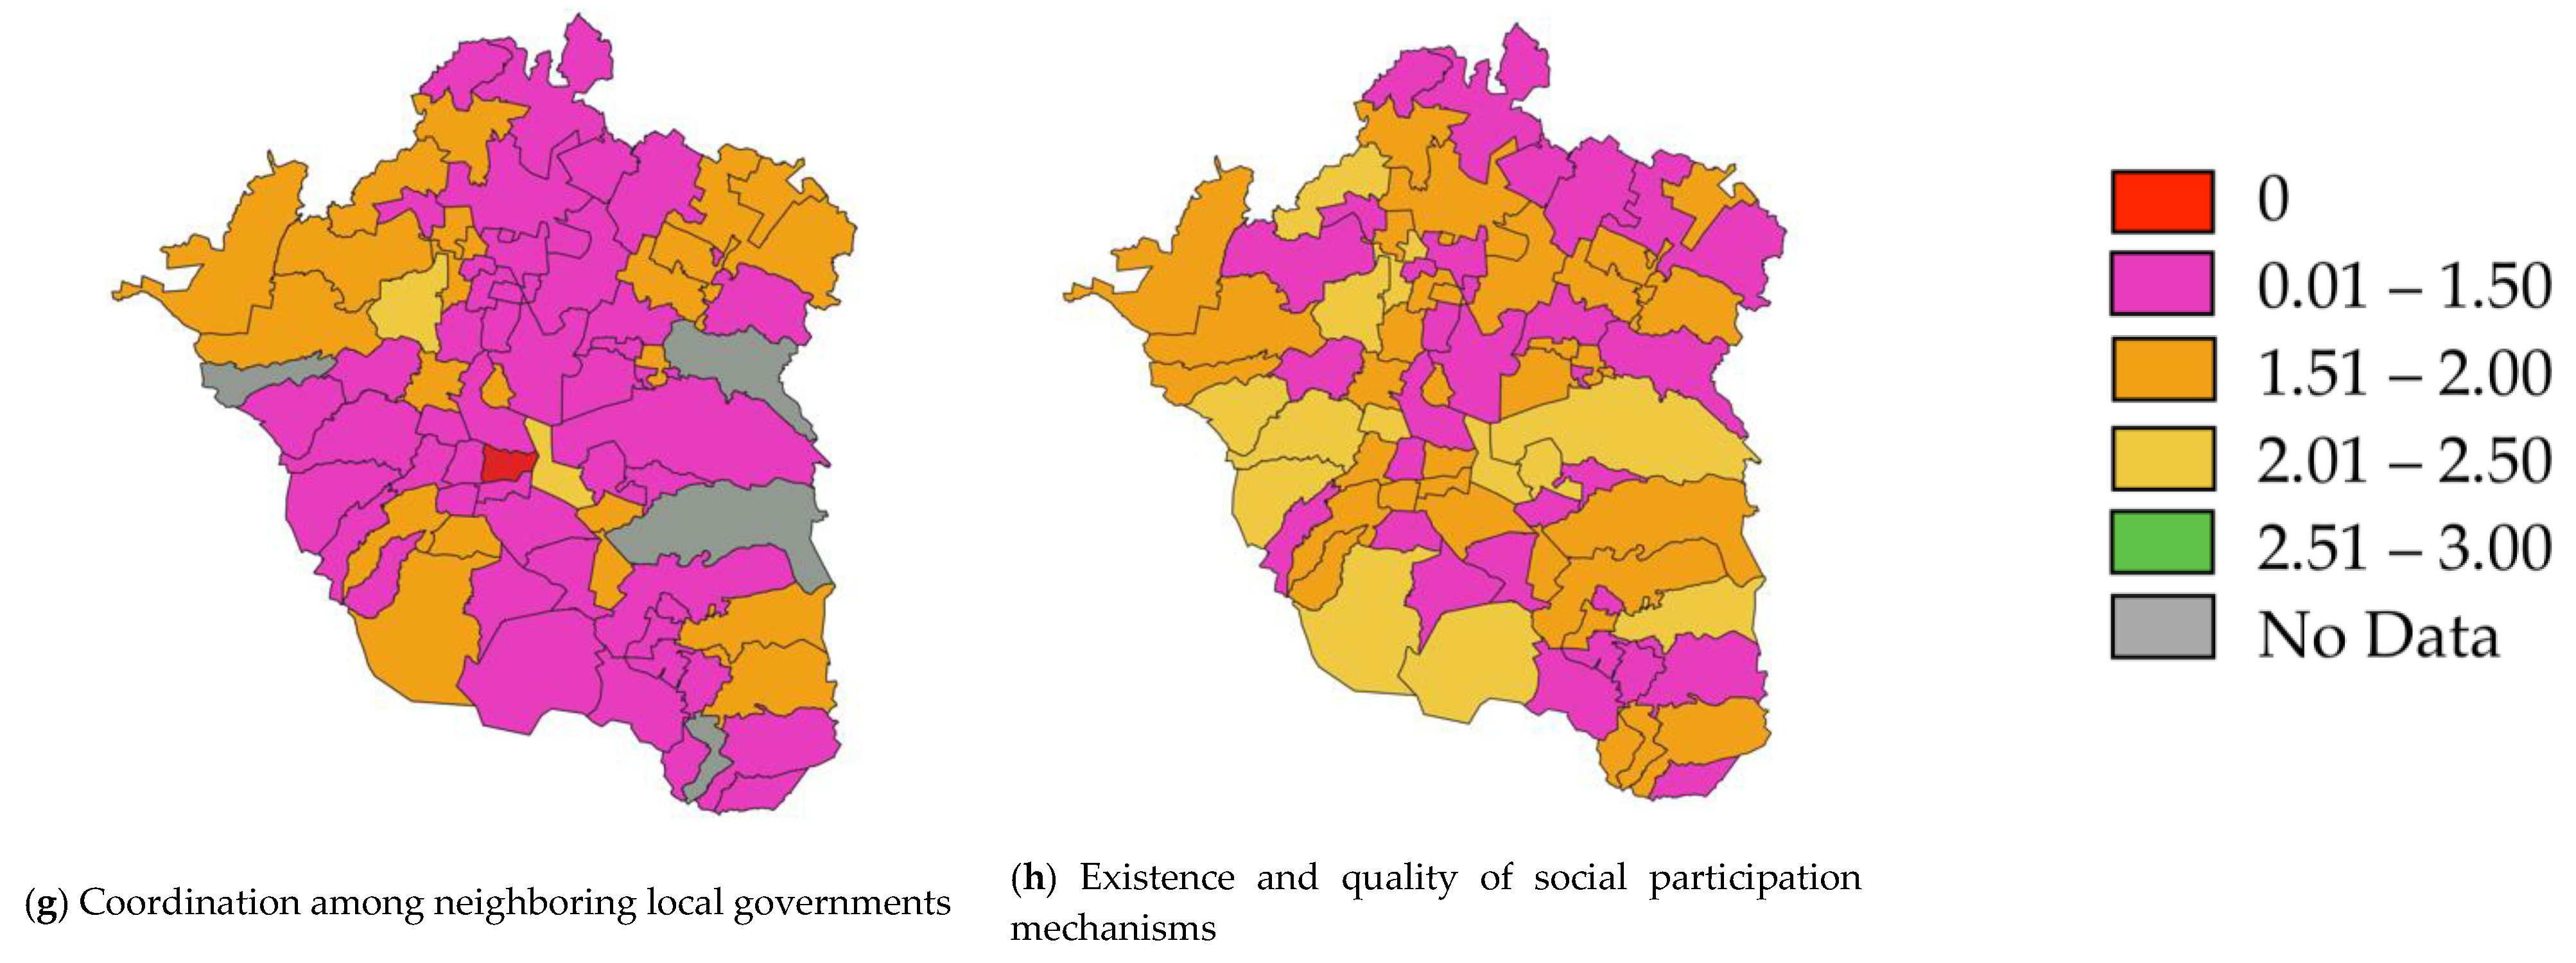
  • Aspects 5, 6, 7, and 8: These three aspects are based on a qualitative evaluation derived from documentary and field work, the latter essentially based on interviews with local decision-makers on climate-environmental issues. It should be pointed out that the maximum value of evaluation, especially in aspect 7, is a level of sufficient capacities (noting robust capacities would mean that there is no longer room for improvement, in this case on social participation mechanisms).
    The weighting is equal for all of the various elements of ICI-CLIMA. For its aggregation, the highest level of each of the five scales has been used by ICI-CLIMA 1.0. Those elements whose valuation is unknown, have not been incorporated into the aggregation process, so that the results obtained can be comparable.
    While the quantitative components do not represent an appreciation challenge, but rather a simple verification process, the qualitative components do represent greater complexity. Therefore, in order to appreciate eventual differences, ICI-CLIMA index is ideally complemented by a self-assessment carried out by local climate-environmental authorities. Although this does not necessarily settle eventual differences, it does confirm transparency of the evaluation process. Details for each municipality can be consulted at: https://transformacionurbana.mx/en/projects/interface_sp/.

References

  1. SEDATU. Delimitación de las Zonas Metropolitanas de México 2015. Available online: www.gob.mx/conapo/documentos/delimitacion-de-las-zonas-metropolitanas-de-mexico-2015 (accessed on 24 November 2020).
  2. OECD. Estudios Territoriales de la OECD. Available online: www.gob.mx/cms/uploads/attachment/file/56213/valle-de-mexico-OCDE.pdf (accessed on 24 November 2020).
  3. Delgado Ramos, G.C. Real estate industry as an urban growth machine: A review of the political economy and political ecology of urban space production in Mexico City. Sustainability 2019, 11, 1980. [Google Scholar] [CrossRef] [Green Version]
  4. Pradilla Cobos, E. Zona Metropolitana del Valle de México: Una ciudad baja, dispersa, porosa y de poca densidad. In Pradilla Cobos, Emilio. In Ciudades Compactas, Dispersa, Fragmentadas; Porrua: Mexico City, Mexico, 2011; Chapter VIII; pp. 257–293. [Google Scholar]
  5. Calderon-Garcidueñas, L.; Kulesza, R.J.; Doty, R.L.; DÁngiulli, A.; Torres-Jardon, R. Megacities air pollution problems: Mexico City Metropolitan Area critical issues in the central nervous system pediatric impact. Environ. Res. 2015, 137, 157–169. [Google Scholar] [CrossRef] [PubMed]
  6. Delgado Ramos, G.C.; Mac Gregor Gaona, M.F.; Ortega León, R.; De Luca Zuria, A. Hacia una Agenda Coordinada de Acción Climática—Ambiental para la Zona Metropolitana del Valle de México; Plataforma de Conocimiento para la Transformación Urbana: Ciudad de México, Mexico, 2019. [Google Scholar]
  7. Graizbord, B.; Gonzalez Granillo, J.L. Urban Growth and Environmental Concerns: The Venture of the Greater Mexico City Metropolitan Area. Politics Policy 2019, 47, 178–206. [Google Scholar] [CrossRef]
  8. Lome-Hurtado, A.; Touza-Montero, J.; White, P.C.L. Environmental injustice in Mexico City: A Spatial Quantile Approach. Expo. Health 2020, 12, 265–269. [Google Scholar] [CrossRef] [Green Version]
  9. Lara Castañeda, E.A. Buen Vivir, Decrecimiento y Desarrollos Otros: Una Revisión y Propuesta Desde el Urbanismo y la Ciudad. Bachelor’s Thesis, Universidad Nacional Autónoma de México, Mexico City, Mexico, 2017. Available online: http://132.248.9.195/ptd2017/agosto/0764512/0764512.pdf (accessed on 24 November 2020).
  10. Delgado Ramos, G.C. Water and the political ecology of urban metabolism: The case of Mexico City. J. Political Ecol. 2015, 22, 98–114. [Google Scholar] [CrossRef] [Green Version]
  11. Kuhn, E.A. Metabolismo de um Municipio Brasileiro de Pequeño Porte: O caso de Feliz, RS. Ph.D. Thesis, Universidade Federal do Rio Grande do Sul, Porto Alegre, Brazil, 2014. Available online: https://lume.ufrgs.br/bitstream/handle/10183/96657/000918309.pdf?sequence=1&isAllowed=y (accessed on 24 November 2020).
  12. Díaz Álvarez, C.J. Metabolismo de la Ciudad de Bogotá, DC: Una Herramienta Para el Análisis de la Sostenibilidad Ambiental Urbana. Ph.D. Thesis, Instituto de Estudios Ambientales, Universidad Nacional de Colombia, Bogotá, Colombia, 2011. [Google Scholar]
  13. Díaz Álvarez, C.J. Bogotá: Entre el espejismo del crecimiento y la utopía del metabolismo sostenible. In Cuadernos de Utopía Colombia; Universidad Central: Bogota, Colombia, 2012. [Google Scholar]
  14. Inostroza Pino, L. Metabolismo urbano y apropiación de excedentes ecológicos. De la estepa a la arquitectura burguesa. Rev. Urbano 2013, 29, 34–44. [Google Scholar]
  15. García Serna, M.I.; Morales-Pinzón, T.; Guerrero Erazo, J. Análisis de flujos de agua en áreas metropolitanas desde la perspectiva del metabolismo urbano. Luna Azul 2014, 39, 234–249. [Google Scholar] [CrossRef]
  16. López-Tovar, M.A.; Gordillo-Martínez, A.J.; Cabrera-Cruz, R.B.E.; Otazo, E.M.; Prieto, F.; González, C.A.; Rolón, J.C. Tendencias de investigación y aplicación de metodologías del metabolismo urbano, para el sector de la construcción de vivienda. Rev. Iberoam. Cienc. 2019, 6, 1–14. [Google Scholar]
  17. Rivera León, G.J. Análisis de Flujos Dinámicos de Materiales Aplicado a la Proyección de Demanda de Materiales de Construcción en Colombia. Bachelor´s Thesis, Universidad Nacional de Colombia, Bogotá, Colombia, 2015. Available online: http://bdigital.unal.edu.co/51054/1/1017123336.2015.pdf (accessed on 24 November 2020).
  18. Quintero Ávalo, C.B.; Tabares Ramírez, A. Metabolismo Urbano en el Flujo de Materiales de Construcción de Vivienda de la Ciudad de Pereira. Bachelor’s Thesis, Universidad Tecnológica de Pereira, Pereira, Colombia, 2015. [Google Scholar]
  19. Herrera Mancero, J.A.; Vilema Tigxi, B.M. Análisis del Flujo Metabólico de los Materiales de Construcción en la Ciudad de Riobamba. Bachelor’s Thesis, Universidad Nacional de Chimborazo, Riobamba, Ecuador, 2019. Available online: http://dspace.unach.edu.ec/bitstream/51000/5900/1/UNACH-EC-ING-ARQT-2019-0007.pdf (accessed on 24 November 2020).
  20. Gómez-Azpeitia, G.; Arvizu Piña, V.; Arena Granados, P. Análisis del Ciclo de vida de la Vivienda de Interés Social en México. Available online: https://drive.google.com/file/d/1THzSZ1eIO1Ub58HQI0Y8kJFbZuBJdB_X/view?usp=sharing (accessed on 24 November 2020).
  21. Calderón, R.; Arredondo, J.A.; Gallegos, R.; Mayagoitia, F. Reducción del consumo eléctrico y CO2 mediante sistemas de ahorro y de aislamiento térmico aplicados a viviendas en zonas áridas de México. Inf. Tecnol. 2011, 22, 69–78. [Google Scholar] [CrossRef]
  22. Delgado Ramos, G.C. Metabolismo urbano y transporte. In Delgado Ramos, G.C. (coord). Transporte, Ciudad y Cambio Climático; CEIICH-UNAM: Mexico City, Mexico, 2012; pp. 129–168. [Google Scholar]
  23. Hackenhaar, I.C. Avaliação do Ciclo de Vida Para Apoiar Políticas Públicas Para o Desenvolvimento Urbano Sustentável: Um Estudo de Caso do Sistema de Transporte Público Coletivo de Porto Alegre. Master’s Thesis, Universidade Federal do Rio Grande so Sul, Porto Alegre, Brazil, 2020. Available online: https://lume.ufrgs.br/handle/10183/213543 (accessed on 24 November 2020).
  24. Páez, A. Energy-urban transition: The Mexican case. Energy Policy 2010, 38, 7226–7234. [Google Scholar] [CrossRef]
  25. Vergara Herrera, A.M. Una Aproximación del Consumo Energético a Través del Metabolismo Urbano. El caso de México de 1990–2015. Master’s Thesis, Instituto Politécnico Nacional, Mexico City, Mexico, 2018. Available online: https://tesis.ipn.mx/bitstream/handle/123456789/26072/Alejandra%20Mariel%20Vergara%20Herrera.pdf?sequence=1&isAllowed=y (accessed on 24 November 2020).
  26. Niño Soto, A.; Chávez Martínez, S. Metabolismo urbano: Reflexiones sobre el crecimiento urbano y el consumo energético. Rev. AUS 2020, 27, 80–85. [Google Scholar] [CrossRef]
  27. Delgado Ramos, G.C. El peso de las ciudades mexicanas en un contexto de cambio climático: Consumo de energía y materiales del Sistema Urbano Nacional. Plur. Consenso 2020, 46, 48–59. [Google Scholar]
  28. Guibrunet, L.; Sanzana Calvet, M.; Castán Broto, V. Flows, system boundaries and the politics of urban metabolism: Waste management in Mexico City and Santiago de Chile. Geoforum 2017, 85, 353–367. [Google Scholar] [CrossRef] [Green Version]
  29. Delgado-Ramos, G.C. Climate change and metabolic dynamics in Latin American major cities. In Sustainable City VIII. Urban. Regeneration and Sustainability; Zubir, S.S., Brebbia, C.A., Eds.; WIT Press: Southampton, UK, 2013; pp. 39–56. [Google Scholar]
  30. Delgado Ramos, G.C. Ecología política del metabolismo urbano y los retos para la conformación de ciudades de bajo carbono. Crítica Emancip. 2014, VI, 149–173. [Google Scholar]
  31. Barro Marín, M.G. Análisis del Metabolismo Urbano en la Ciudad de México y la Ciudad de Bogotá D.C. Bachelor’s Thesis, Universidad Autónoma del Estado de México, Toluca, Mexico, 2018. Available online: http://ri.uaemex.mx/bitstream/handle/20.500.11799/95335/UAEM-FaPUR-TESIS-MAR%c3%8dA%20GUADALUPE%20BARRO%20MAR%c3%8dN.pdf?sequence=1&isAllowed=y (accessed on 24 November 2020).
  32. Salazar, R.; Rojano, A.; López, I. Energy and environmental costs related to water supply in Mexico City. Water Supply 2012, 12, 768–772. [Google Scholar] [CrossRef]
  33. Delgado Ramos, G.C. Nezahualcóyotl, entre la segregación y los usos indeseables del suelo”. In Los Desafíos de la Ciudad del Siglo XX.; Álvarez Enríquez, L., Delgado Ramos, G.C., Leal Martínez, A., Eds.; Senado de la República/UNAM—CEIICH, PUEC, PUES: Mexico City, Mexico, 2016; pp. 363–396. Available online: https://drive.google.com/file/d/19w_YnNpD1JKYtlh23hUaU_9Ou5QgZcIS/view?usp=sharing (accessed on 24 November 2020).
  34. Delgado Ramos, G.C.; Blanco, H. La transformación de la infraestructura de agua ante el cambio climático: Los casos de Los Ángeles y la Ciudad de México. In Climate Change Sensitive Cities; PINCC, UNAM: Mexico City, Mexico, 2018; pp. 265–322. Available online: https://drive.google.com/file/d/1j6Bx40cw_CosLDuQM99H2VeVNbofa3J5/view (accessed on 24 November 2020).
  35. Guibrunet, L. The interplay of tacit and explicit knowledge in the informal economy: The atypical case of a recycling family business in Mexico City. Int. Dev. Plan. Rev. 2019, 2019, 1–19. [Google Scholar]
  36. Huerta-Barrientos, A. Scaling in Urban Complex Systems: Mexico City Metabolism. In Urban Agglomeration; Ergen, M., Ed.; Intech Open Science: London, UK, 2018; pp. 133–147. Available online: https://cdn.intechopen.com/pdfs/57499.pdf (accessed on 24 November 2020).
  37. Gómez Zamudio, R. Energy-Water Nexus in Mexico: A network Based Approach of Polycentric Governance. Master’s Thesis, Lund University Centre for Sustainability Studies, Lund, Sweden, 2019. Available online: http://lup.lub.lu.se/luur/download?func=downloadFile&recordOId=8978358&fileOId=8978362 (accessed on 24 November 2020).
  38. Rentería Juárez, P.M. Política Verde Urbana Ante el Cambio Climático: El caso de la Vivienda Sustentable en la Ciudad de México. Bachelor’s Thesis, Universidad Nacional Autónoma de México, Mexico City, Mexico, 2020. Available online: http://132.248.9.195/ptd2020/marzo/0801804/Index.html (accessed on 24 November 2020).
  39. Rojas-Ramírez, J.J. Periurbanización en zonas metropolitanas Guadalajara y Ocotlán, Jalisco. Bitácora 2019, 29. [Google Scholar] [CrossRef]
  40. McCulligh, C.; Vega Fregoso, G. Defiance from down river: Deflection and dispute in the urban-industrial metabolism of pollution in Guadalajara. Sustainability 2019, 11, 6294. [Google Scholar] [CrossRef] [Green Version]
  41. Luna Nemecio, J. El metabolismo urbano-rural del agua, actores sociales y gestión de los recursos hídricos público urbano de la ciudad de Cuautla, Morelos (2006–2013). Espac. Rev. Geogr. 2015, 5, 43–62. [Google Scholar] [CrossRef]
  42. Napoletano, B.M.; Paneque-Gálvez, J.; Méndez-Lemus, Y.; Vieyra, A. Geographic rift in the urban periphery, and its concrete manifestations in Morelia, Mexico. J. Latin Am. Geogr. 2019, 18, 38–64. [Google Scholar] [CrossRef]
  43. Benavides Mondragón, L.E. Advancing Sustainability in Latin American Cities: As Study Case of the Urban Metabolism of San Luis Potosí, México. Master’s Thesis, Universidad Autónoma de San Luis/Cologne University of Applied Sciences, San Luis Potosí, Mexico, 2017. Available online: https://ninive.uaslp.mx/xmlui/bitstream/handle/i/4337/MCA1BML201701.pdf?sequence=1&isAllowed=y (accessed on 24 November 2020).
  44. Cisneros Vidales, A.A. Building Sustainable Urban Metabolism through Resilience Strategies in La Pila, San Luis Potosí México. Master’s Thesis, Universidad Autónoma de San Luis/Cologne University of Applied Sciences, San Luis Potosí, Mexico, 2018. Available online: https://ninive.uaslp.mx/xmlui/bitstream/handle/i/4536/MCA1CVA201801.pdf?sequence=1&isAllowed=y (accessed on 24 November 2020).
  45. García Rodríguez, L.; Gracia, M.A.; Bello Baltazar, E.; Aldasoro Maya, E.M. Metabolismo social y ecoturismo: La problemática de los residuos en la isla de Holbox, Quintana Roo, México. Nova Sci. 2018, 10, 779–822. [Google Scholar] [CrossRef]
  46. IRP—PNUMA. The Weight of Cities. Resource Requirements of Future Urbanization; Swilling, M., Hajer, M., Baynes, T., Bergesen, J., Labbé, F., Musango, J.K., Ramaswami, A., Robinson, B., Salat, S., Suh, S., et al., Eds.; IRP—PNUMA: Nairobi, Kenya, 2018. [Google Scholar]
  47. Eurostat. Domestic material consumption. In Glossary; Eurostat b, 2016; Available online: http://ec.europa.eu/eurostat/statistics-explained/index.php/Category:Glossary (accessed on 24 November 2020).
  48. UNDESA. World Urbanization Prospects: The 2018 Revision; UNDESA: New York, NY, USA, 2019. [Google Scholar]
  49. OECD. Real GDP Long-Term Forecast-Mexico. Available online: https://data.oecd.org/gdp/real-gdp-long-term-forecast.htm (accessed on 24 November 2020).
  50. Mekonnen, M.M.; Hoekstra, A.Y. National Water Footprint Statistics. Statistics on Green, Blue and Grey Water Footprints of National Production and Consumption; Waterfootprint, 2012. Available online: https://waterfootprint.org/media/downloads/Report50-Appendix-VIII&IX.xls (accessed on 24 November 2020).
  51. Kaza, S.; Yao, L.; Bhada-Tata, P.; Van Woerden, F. What a Waste 2.0–Country Level Dataset; World Bank: Washington, DC, USA, 2018. [Google Scholar]
  52. World Bank. CO2 emissions (metric tons per capita). World Bank Data. Available online: https://data.worldbank.org/indicator/EN.ATM.CO2E.PC (accessed on 24 November 2020).
  53. FAO. The State of Food Security and Nutrition in the World; FAO; IFAD; UNICEF; WFP; WHO: Rome, Italy, 2020. [Google Scholar]
  54. CONEVAL. Medición de la Pobreza, Estados Unidos Mexicanos, 2010–2015. Available online: www.coneval.org.mx/Medicion/Documents/Pobreza_municipal/Concentrado_indicadores_de_pobreza.zip (accessed on 24 November 2020).
  55. UNHABITAT. The Value of Sustainable Urbanization; UNHABITAT: Nairobi, Kenya, 2020. [Google Scholar]
  56. Delgado Ramos, G.C.; Aragón Durand, F.; Di Bella, J.; Franco, C.; Henríquez Ruíz, C.; Hernández Pedraza, C. Urban and Rural Settlements. In Adaptation to Climate-Change Risks in Ibero-American Countries—RIOCCADAPT Report; Moreno, J.M., Laguna-Defior, C., Barros, V., Calvo Buendía, E., Marengo, J.A., Oswald Spring, U., Eds.; McGrawHill: Madrid, Spain, 2020; pp. 497–540. [Google Scholar]
  57. Khreis, H.; Sudmant, A.; Gouldson, A.; Nieuwenhuijsen, M. Transport Policy Measures for Climate Change as Drivers for Health in Cities. In Integrating Human Health into Urban and Transport Planning; Nieuwenhuijse, M., Khreis, H., Eds.; Springer: Berlin/Heidelberg, Germany, 2019; pp. 583–608. [Google Scholar]
  58. Liang, Y.; Du, M.; Wang, X.; Xu, X. Planning for urban life: A new approach of sustainable land use plan based on transit-oriented development. Eval. Program Plan. 2020, 80, 101811. [Google Scholar] [CrossRef] [PubMed]
  59. Zeller, V.; Towa, E.; Degrez, M.; Achten, W.M.J. Urban waste flows and their potential for a circular economy model at city-region level. Waste Manag. 2019, 83, 83–94. [Google Scholar] [CrossRef] [PubMed]
  60. Mohan, S.V.; Amulya, K.; Modestra, J.A. Urban Biocycles—Closing Metabolic Loops for Resilient and Regenerative Ecosystem: A perspective. Bioresour. Technol. 2020, 306, 123098. [Google Scholar]
  61. Bush, J.; Doyon, A. Building urban resilience with nature-based solutions: How can urban planning contribute? Cities 2019, 95, 102483. [Google Scholar] [CrossRef]
  62. Hunter, R.F.; Cleary, A.; Braubach, M. Environmental, health and equity effects of urban green space interventions. In Biodiversity and Health in the Face of Climate Change; Springer: Cham, Switzerland, 2019; pp. 381–409. [Google Scholar]
  63. Beatley, T. The emergence of biophilic design and planning Re-envisioning cities and city life. In Ecologies Design: Transforming Architecture, Landscape, and Urbanism; Zari, M.P., Connolly, P., Southcombe, M., Eds.; Routledge: New York, NY, USA, 2020; pp. 96–105. [Google Scholar]
  64. Ulbrich, P.; Albuquerque, J.P.; Coaffee, J. The Impact of urban Inequalities on Monitoring Progress towards the Sustainable Development Goals. Geo Inf. 2018, 8, 1–18. [Google Scholar]
  65. UNHABITAT. Habitat III Policy Paper: The Right to the City and Cities for All; United Nations: New York, NY, USA, 2017. [Google Scholar]
  66. Wolch, J.R.; Byrne, J.; Newell, J.P. Urban green space, public health and environmental justice: The challenge of making cities ‘just green enough’. Landsc. Urban Plan. 2014, 125, 234–244. [Google Scholar] [CrossRef] [Green Version]
  67. Deakin, M. The case for socially inclusive visioning in the community-based approach to sustainable urban regeneration. Sustain. Cities Soc. 2012, 3, 13–23. [Google Scholar] [CrossRef]
  68. Ahmad, E.; Dowling, D.; Chan, D.; Colenbrander, S.; Godfrey, N. Scaling up Investment for Sustainable Urban Infrastructure: A Guide to National and Subnational Reform; Coalition for Urban Transitions. 2019. Available online: https://newclimateeconomy.report/workingpapers/wp-content/uploads/sites/5/2019/04/CUT2019_Scaling_up_investment_for_sustainable_urban_infrastructure.pdf (accessed on 24 November 2020).
  69. WCRP—World Climate Research Programme. Global Research and Action Agenda on Cities and Climate Science; WCRP Publication No. 13/2019. 2019. Available online: https://www.wcrp-climate.org/WCRP-publications/2019/GRAA-Cities-and-Climate-Change-Science-Full.pdf (accessed on 24 November 2020).
  70. Su, C. Managed Participation: City Agencies and Micropolitics in Participatory Budgeting. Nonprofit Volunt. Sect. Q. 2018, 47. [Google Scholar] [CrossRef]
  71. Floater, G.; Dowling, D.; Chan, D.; Ulterino, M.; Braunstein, J.; McMinn, T.; Ahmad, E. Global Review of Finance for Sustainable Urban. Infrastructure; Coalition for Urban Transitions. 2017. Available online: http://newclimateeconomy.report/workingpapers/wp-content/uploads/sites/5/2018/01/NCE2017_CUT_GlobalReview_02012018.pdf (accessed on 24 November 2020).
  72. Shahzalal, M.; Hassan, A. Communicating Sustainability: Using Community Media to Influence Rural People’s Intention to Adopt Sustainable Behavior. Sustainability 2019, 11, 812. [Google Scholar] [CrossRef] [Green Version]
  73. Coskun, A.; Zimmerman, J.; Erbug, C. Promoting sustainability through behavior change: A review. Des. Stud. 2015, 41 Pt B, 183–204. [Google Scholar] [CrossRef]
  74. Delgado Ramos, G.C.; Mac Gregor Gaona, M.F. Índice de Capacidades Institucionales Climáticas–Ambientales Locales ICI-CLIMA 2019: El caso de la Zona Metropolitana del Valle de México; Plataforma de Conocimiento para la Transformación Urbana-IDRC-INGSA: Mexico City, Mexico, 2020; p. 47. Available online: https://zenodo.org/record/3984235/files/ICI-CLIMA%202019.pdf?download=1 (accessed on 24 November 2020).
  75. INECC. Medición Multidimensional de Capacidad Institucional a Nivel Municipal que Fomente la Adaptación al Cambio Climático; INECC-SEMARNAT: Mexico City, Mexico, 2017; ISBN 9781636256634. [Google Scholar]
  76. Mac Gregor Gaona, M.F. Caja de Herramientas para Medir la Vulnerabilidad y el Riesgo Urbano ante el Cambio Climático: El caso de la Ciudad de México; Technical Report—Master on Sustainability Sciences; UNAM: Mexico City, Mexico, 2020. [Google Scholar]
  77. Municipality of Oslo. Climate Budget 2019. Available online: https://www.klimaoslo.no/wp-content/uploads/sites/88/2019/03/Climate-Budget-2019.pdf (accessed on 24 November 2020).
  78. New York City Council. New York Participatory Budgeting. Available online: http://ideas.pbnyc.org/page/about (accessed on 24 November 2020).
  79. Jiménez, G. Caen dos funcionarios vinculados al narco en Cuajimalpa. Excelsior. 10 October 2020. Available online: https://www.excelsior.com.mx/comunidad/caen-dos-funcionarios-vinculados-al-narco-en-cuajimalpa/1410442 (accessed on 24 November 2020).
  80. Pelling, M.; Garschagen, M. Put equity first in climate adaptation. Nature 2019, 569, 327–329. [Google Scholar] [CrossRef] [PubMed] [Green Version]
  81. Tollefson, J. How the coronavirus pandemic slashed carbon emissions. Nature 2020, 582, 158–159. [Google Scholar] [CrossRef] [PubMed]
  82. Delgado Ramos, G.C.; López García, D. Las Ciudades ante el COVID-19: Nuevas Direcciones para la Investigación Urbana y las Políticas Públicas; Plataforma de Conocimiento para la Transformación Urbana: Mexico City, Mexico, 2020; Available online: https://zenodo.org/record/3894075/files/Ciudades%20ante%20el%20COVID-19.pdf?download=1 (accessed on 24 November 2020).
Figure 1. Mexico’s urban Domestic Material Consumption (DMC) in 2015 and 2050. Estimation of DMC_u 2050 (p) based only on urban population growth [48], assuming the same composition (proportions of type of materials) and per capita intensity of 2015 DMC_u. Estimation of 2050_u (p + $) integrates OECD’s economic growth projections [49], assuming the same material composition of DMC_u 2015. DMC_u 2050 (average) is the average of DMC_u 2050 (p) and DMC_u 2050 (p + $). Source: author’s own elaboration.
World 02 00003 g001
Figure 2. Urban and rural population and built area in Mexico, 2015 and 2050. Source: author’s own elaboration.
World 02 00003 g002
Figure 3. (a) DMC spatial intensity adjusted by population density and poverty prevalence, 2015. Source: author’s own elaboration based on municipal DMC per capita estimations adjusted by poverty prevalence [54]. Percentage of poverty for each geostatistical unit reduces average per capita DMC in half while increasing the average per capita DMC for the remaining population that is not considered as poor. (b) Poverty prevalence, 2015. Source: author’s own elaboration.
World 02 00003 g003
Figure 4. (a,b) ICI-CLIMA 2019 evaluation by component. Source: taken from [74].
World 02 00003 g004aWorld 02 00003 g004b
Figure 5. (a,b) Local institutional capacities as reported by ICI-CLIMA 2019 (aggregated outcome) and climate vulnerability level as officially recognized. Source: taken from [74].
World 02 00003 g005aWorld 02 00003 g005b
Figure 6. (a,b) COVID-19 transmission and death rates in the Mexico Valley Metropolitan Area (MVMA). Source: author’s own elaboration based on official data of the Federal Government.
World 02 00003 g006
Table 1. Mexico’s urban water footprint, waste generation and GHG emissions, 2015 and 2050.
YearWater Footprint-WF
(Billion Cubic Meters)
Waste
(Million Tons)
GHG
(Million Tons)
Agricultural WFIndustrial WFDomestic WFTotal WF
2015202.86.711.6221.146.9441.4
2050294.4 a9.8 a16.8 a321.0 a68.2 a640.9 a
315.4 a,c18.4 a,b31.6 a,b365.4 a,b128.1 a,b1204.0 a,b
a Estimation assuming urban population growth [48] without changes in consumption patterns. b Estimation assuming urban population growth [48] and changes in consumption patterns which have been correlated to economic growth projections [49]. c Estimation assuming 25% of increment in urban agricultural water footprint for undernourished population [53], considering equal urban and rural proportions of undernourished population and no changes of such proportions in future.
Publisher’s Note: MDPI stays neutral with regard to jurisdictional claims in published maps and institutional affiliations.

