Measuring Walkability with Street Connectivity and Physical Activity: A Case Study in Iran


1
Faculty of Architecture and Urbanism, Tabriz Islamic Art University, Tabriz 51368, Iran
2
School of Built Environment, Western Sydney University, Penrith, NSW 2750, Australia
*
Author to whom correspondence should be addressed.
World 2021, 2(1), 49-61; https://0-doi-org.brum.beds.ac.uk/10.3390/world2010004
Submission received: 4 December 2020
/
Revised: 5 January 2021
/
Accepted: 5 January 2021
/
Published: 18 January 2021
Abstract
:The walkability of urban areas is an important criterion related to the level of physical activity and public health of citizens. This research aims to measure this parameter in Golsar town located in Rasht, Iran. Two methods were used in this research: Street connectivity and International Physical Activity Questionnaire (IPAQ). The principal variables of street connectivity were measured in four districts of Golsar by Geographic Information System (GIS) to rank each one. Then, the acquired results were compared by the average walking time of the respondents of the questionnaire. The comparison explicitly indicated that there is a strong positive correlation between the measures of street connectivity and people’s tendency to walk. As well, District 1 had the highest value of connectivity and the highest average time for walking amongst the four districts. This supports the contention that walkability and the level of outdoor physical activities of people in each district are undoubtedly under the influence of the variables of street connectivity. Nevertheless, the evaluation of other indexes such as proximity, land use mix, safety, and density in Golsar, in future research. can expand our perception of the walkability of this region.
1. Introduction
Walking is one of the affordable, major, and most elementary types of physical activity [1], that provides a sustainable means of transport and leisure [2]. Walking can be done alone at any time and can be embedded in our routine plans without special equipment or clothes, or consumption of fossil fuels. It is the most popular and inexpensive habitual practice among adults of all ages [3,4,5,6]. Not only is regular walking recommended to keep people healthy through the prevention of many diseases, such as cardiovascular disease, obesity, and diabetes, but it also associated with positive social interactions, economic benefits, and their mental health [7,8,9]. Besides, the US National Research Council and US Institute of Medicine [10] reported: “The factors in the physical environment that are important to health include harmful substances, such as air pollution or proximity to toxic sites; access to various health-related resources; and community design and the built environment”. The solution for most of these dangerous threats can be discovered by physical activity resulted from the type of urban design and planning [11]. Increasing walking activities in cities through changes in the design of built environments is an outstanding policy with some advantages in several areas such as sustainability, health, social ties, economic transactions and traffic [12,13].
The need for research about the influence of the built environment on public health and their relationships has been stressed by the World Health Organization (WHO) [14,15,16,17]. Many health professionals invited architects and urban designers to react against the sedentary lifestyle by using the design of the built environments [18]. Therefore, the analysis of the urban environment has remarkably increased in the fields of urban planning and geography, and public health and well-being in recent decades for the encouragement and facilitation of walking [19,20]. Urban designers and planners have focused on the characteristics of better walkable cities or neighborhoods, the correlation between walking, walkability, and built environments, and measuring physical activities in cities [21,22,23]. In this case, in addition to improving the health-oriented urban spaces by regarding walking as an important priority in urban studies [24,25], they can achieve transportation and environmental goals (e.g., decreasing car dependency or reduction of exhaust fumes and emissions) [26,27].
2. Literature Review
2.1. Walkability
The term ‘walkability’ means compatibility, attractiveness, and opportunity of built environments in a street or a neighborhood for walking [20,28,29,30,31]. It is a general definition for this term although some recent literature has revealed a conflict in the interpretation of walkability and measuring its indexes [32,33]. The manner of defining walkability has significant connections to the perception of street networks, urban transportation, and the design of public spaces and streets [34]. The researchers considered walkability as a determinative factor for the quality of urban space and citizens’ lives [35,36], as well as quantitative aspects of walking [32]. It is referred to as characteristics of the built environment that can help people to walk for different purposes, either leisure or access destinations [29], compelling them not to use their cars [4,37]. In fact, a deeper understanding of walkability encompasses both selectable plans of walking (e.g., walking to the workplace, shopping center, etc.) or leisure-related mobility [32,38] for various types of citizens [39], and health advantages [40]. Numerous publications acknowledge the function of walkability as a supplier of public health [41] and positive relations between different amounts of walkability in cities and people’s physical activities [42,43].
Features of the urban built environment ranging from the form of the cities to improved pedestrian crossings can change our movement and whatever we do within the urban areas [44,45]. In particular, urban design can change and facilitate our travel behavior in cities, including the quantity and quality of walking, cycling, public transport, and commuting by personal cars [46,47]. A positive intervention in these features of the built environment supports active transportation (walking and cycling), encouraging populations to walk or ride a bicycle instead of using motor-vehicles [11,12,31,48]. Accurate design of the built environment plays a vital role in walkability because it promotes more accessible, convenient, attractive, and efficient local neighborhoods [1,49], which in turn produces notable health benefits [50].
Frank et al. [41] proposed the first composite walkability index that includes land use mix, connectivity, and residential density within a buffer around a residence. Since then, many scholars have identified that several variables within a framework of 3D’s are the cornerstone of the definition and assessment of walkability: Density, land use Diversity (Land use mix), and pedestrian-oriented Design (Street connectivity) [4,41,51,52,53]. These are three large-scale features of the design of neighborhoods associated with walking and physical activity [54,55].
Density gathers more people and places in walkable spaces [32]. For instance, residential density is one of the most influential built environment factors that change people’s interests in walking or cycling instead of other types of transportation [45,56]. The land use mix provides a greater variety of walkable destinations and activities in a geographic location [45,51]. In other words, mixed land use leads to provide daily destinations of a spectrum of people within closer proximity and with less distance travel [57]. Furthermore, better street connectivity provides shorter routes and better traffic flows [32,51].
2.2. Street Connectivity
In contemporary decades, urban planners and researchers of transportation have analyzed walkability in urban environments and predicted more than 56 various items or indicators that can be useful for walking behaviors. Among the most notable of these items are accessibility, land use mix, safety, comfort, density, connectivity, attractiveness, proximity, public transport supply, street layout, and so on [44]. One of the main environmental features that could exert direct or indirect impacts on active transport and physical activity is connectivity [48]. In a general view, street connectivity refers to the density of connections and the directness of links in the road network of cities [4,31,41] to simplify the movement between the origins (e.g., houses) and the destinations (e.g., shops) [55].
In the definition of this index, a well-connected road system should have numerous short links (a street between two intersections or from a dead-end to an intersection) and several nodes (including three- or four-way intersections and end of dead-end streets) with a few numbers of cul-de-sacs [44]. A road network with better connectivity contributes to more road options and more direct routes [58], minimizes distances between origins and destinations [14,59], increases walkability [48], and consequently, makes physical activity, bicycling, and walking more appealing and convenient [35]. In fact, “Research has generally shown more people walk in neighborhoods that have connected sidewalks and provide shorter walking distances and more route choices to destinations” [60] (p. 2). The main determinant factors in people’s decisions for walking are shortness, directness, and continuity of paths that are all under the influence of street connectivity [61].
Many studies have investigated connectivity based on various variables. In this research, 10 variables were studied: intersection density, street density, block density, cul-de-sac density, average block length, median block length, connected node ratio, link node ratio, alpha index, and gamma index. The definition and the methods of measurement of each variable in the built environment will be discussed, respectively.
This research aims to evaluate the impact of street connectivity as one of the most important criteria of walkability on the amounts of walking and cycling of the residents in a neighborhood area and whether better street connectivity in a district necessarily leads to an increase in the physical activities of people in it. By comparing the measurement of street connectivity in a town and the residents’ outdoor physical activities, we can achieve a better understanding of the role of connectivity of streets in walkable neighborhoods.
3. Research Methods
Several methods emerged from various fields of study (urban planning and architecture, transport engineering, public health, social sciences) to measure walkability in a determined urban area [62]. These methods entailed audit tools, checklists, questionnaires, surveys, inventories, level-of-service scales such as IPAQ (International Physical Activity Questionnaire) to assess the physical activity [63], Neighborhood Environment Walkability Scale (NEWS) [64], Indicators of Accessibility and Attractiveness of Pedestrian Environments (IAAPE) [62], Walk Score [65], Walkability Index [66], as well as Connectivity of streets [48,67]. After reviewing the backgrounds about the importance of urban design in public health, the role of connectivity of streets on walkable neighborhoods, and the way walkability of neighborhoods affects the physical health of citizens, it is required to measure the variables of street connectivity.
3.1. Variables of Street Connectivity
Ten variables related to street connectivity were selected in this research. The variables are:
- Intersection density: This indicator measures the ratio of intersections in a unit area [29,68]. It shows the density of intersections in each district by dividing the number of three- or four-way intersections by the area of the district. A higher number means more intersections that lead to more connectivity [41]. In this research, we designate a weight of 0.5 for a three-way and 1 for a four-way intersection [69].
- Average block length: “Block lengths can be measured from the curb or the centreline of the street intersection. The Geographic Information System (GIS) measures the street length from centre of intersections. Shorter blocks mean more intersections and therefore a greater number of routes available” [58] (p. 6). To measure this variable, the total length of links should be divided by the number of nodes in an area. There is an inverse relationship between the average length of streets and connectivity [70].
- Average block section: Other block-based connectivity variables such as block area, perimeter length, and face length are not reliable because of some underlying flaws in their ratios [74]. “An alternative block-based measure that resolves these issues is the ‘block section’, defined as the maximum distance between any two points on the perimeter of a block, or an area enclosed by the designated route network” [74] (p. 4). The minimum block section means better connectivity.
- Connected node ratio: It is equal to the proportion of real nodes to the total of all nodes calculated by dividing the number of three-way and four-way intersection by the sum of all nodes, including cul-de-sacs within a study area. The maximum ratio is 1 representing a more connected street network [48,75].
- Link node ratio: This variable is defined by dividing the number of streets (links) by the total number of real nodes in a district [64]. Notwithstanding, the perfect value for a grid network is 2.5, a link node ratio of 1.4 or more is a desirable target for urban planners in the term of connectivity of street [76].
- Gamma index: “The gamma index builds further on the link node ratio and is a ratio of the number of streets in the network to the maximum possible number of streets between intersections” [41] (p. 38). This is a good index to represent the street network. The higher ratio for the gamma index results in better connectivity [48]. It was calculated as below:
The GIS is a digital technology to analyze, visualize, and record spatial data with a combination of hardware and software [77]. It enables users to map geographic aspects of data from different resources and integrate them [78]. The framework of GIS has a great capacity of surveying to deal with plenty of spatial issues in several interdisciplinary subjects [79]; therefore, the GIS software (ArcView version 3.3) was used to determine the value of each variable of street connectivity based on their mentioned definition within each district individually. Subsequently, the self-reported physical activity of the residents was measured with IPAQ. This standard questionnaire was used to measure the amount of walking and physical activities of participants in the past seven days [46]. In a validation study in 12 countries, self-reported data of IPAQ demonstrated acceptable reliability [63].
3.2. Sample Size
The sampling was a simple random method. To calculate an ideal sample size, we used Cochran’s Formula (z = 1.96, q = p = 0.5).
In this case, through considering 115,000 for the total population (N) and 0.05 for the desired level of precision (d), the number of 383 was determined for the number of all participants (n). Thus, 96 participants are sufficient in every district. Adults living and working (if they had a job in the last week) in a district were randomly chosen to answer the questionnaire. Finally, Pearson’s formula has been used to clarify the correlation between the parameters of street connectivity and walkable districts in Golsar. The results are described in the next section meticulously.
3.3. Statistical Analysis
For a better analogy, the values of street connectivity in Table 1 were normalized between 0 and 1 in Table 2. The higher scores for the applied variables signify the better condition for walkability according to street connectivity. The following formula was applied to normalize the values. Assuming: Zij = value of criterion j for county i; then:
where rij is the required normalized value of a variable. However, for three variables (cul-de-sac density, average block length, average block section), in which fewer values mean better connectivity, this formula is as follows:
3.4. Correlation Coefficient
At the end of the results and discussion, the Correlation Coefficient (Pearson’s r) was used to find the correlation of the street connectivity and physical activity. It is a useful theorem of statistics to measure the linear correlation between the two types of variables (X and Y). In this study, these variables referred to street connectivity (normalized values assuming as X) and the average time for walking and cycling based on IPAQ (minutes per week assuming as Y) in the districts of Golsar. The formula of Pearson’s r for a sample is:
In this formula, −1 ≤ rxy ≤ 1 where higher value means a perfect positive linear correlation, 0 is no linear correlation, and the lower value indicates a negative linear correlation.
4. Results and Discussion
This article firstly reviewed the literature on walkability, street connectivity, and its variables. In this section, walkability was analyzed in a case study and compared based on two methods: measuring the variables of street connectivity and physical activity to find the connection between street connectivity and real walking behaviors of residents. This process has been conducted to show a correlation of street connectivity and outdoor physical activities, and the role of the variables of street connectivity in public health, walking habits of people in Golsar, and urban development in this region.
4.1. Case Study
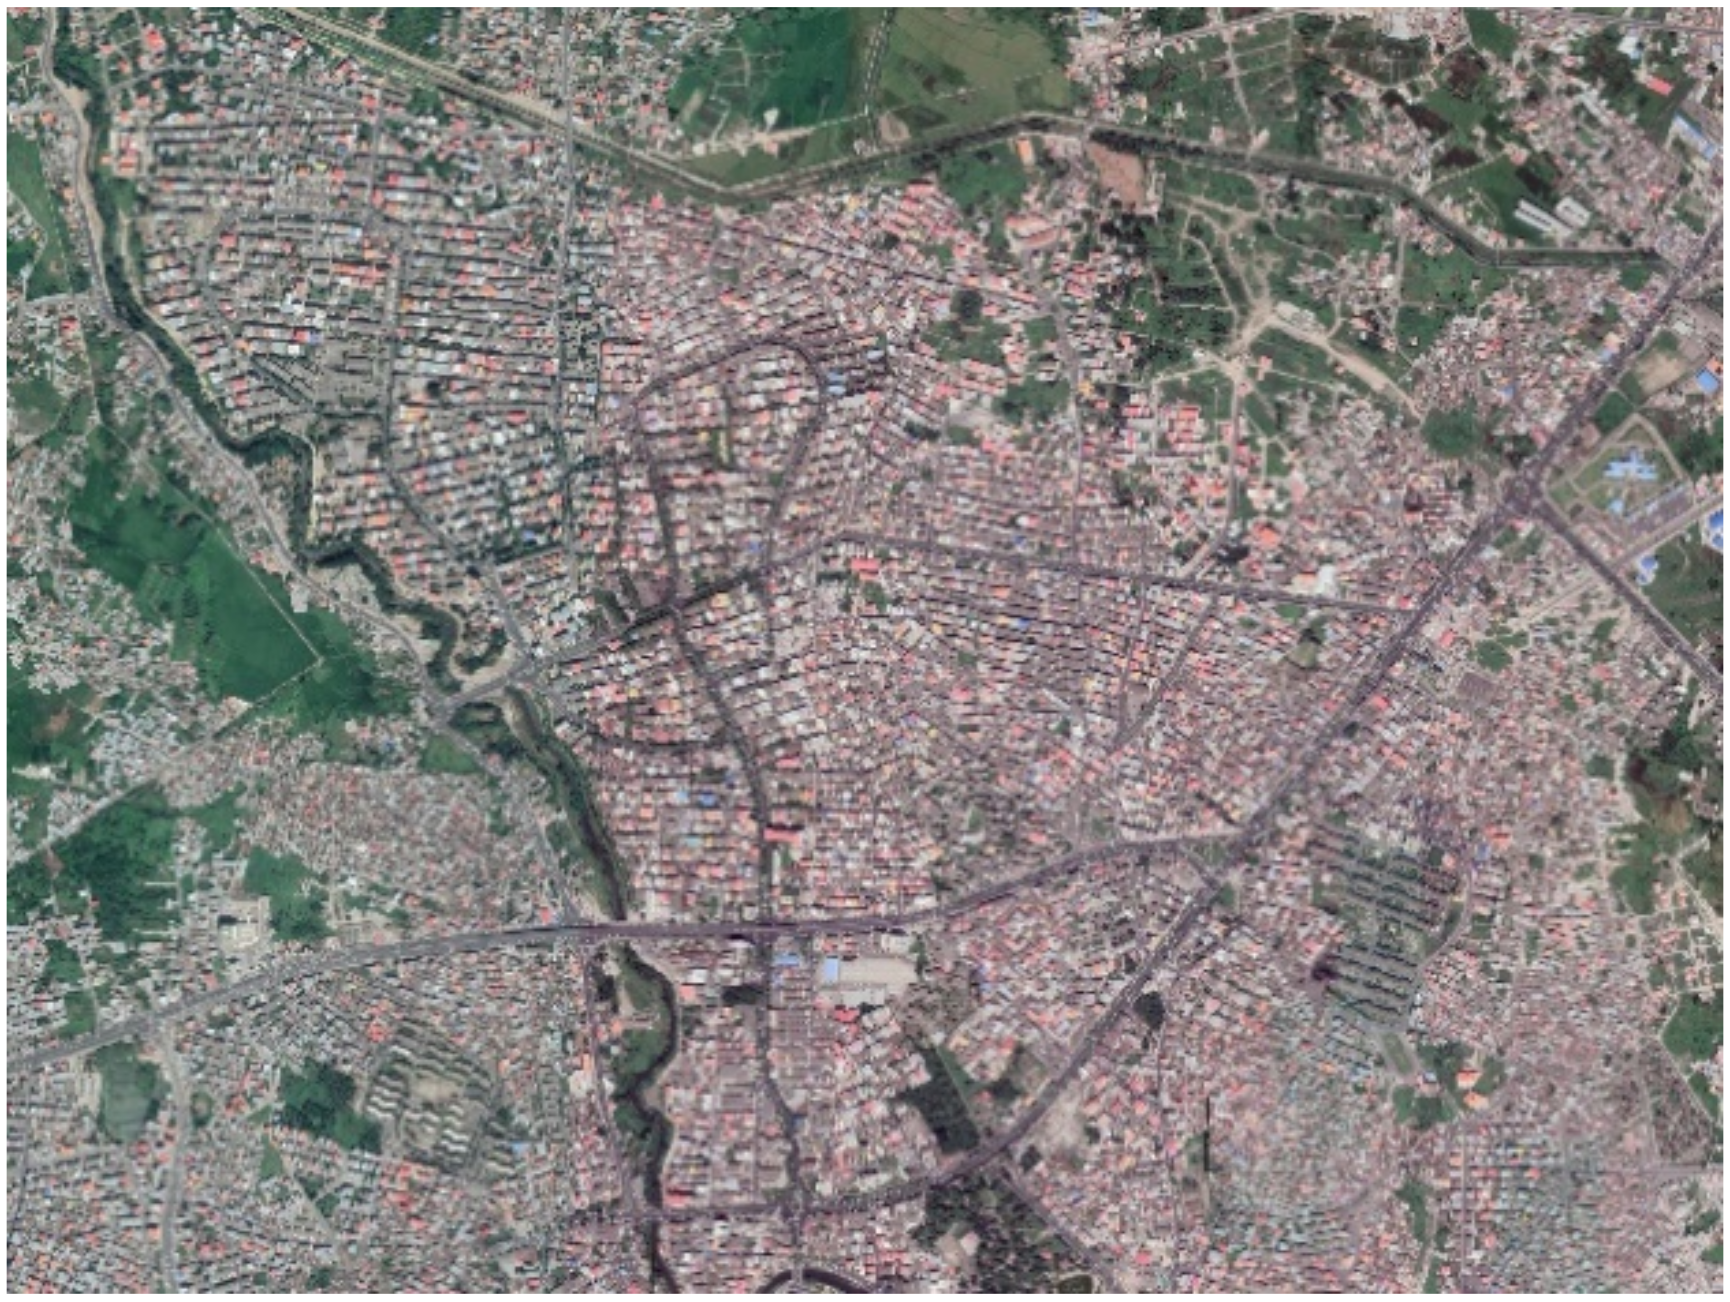
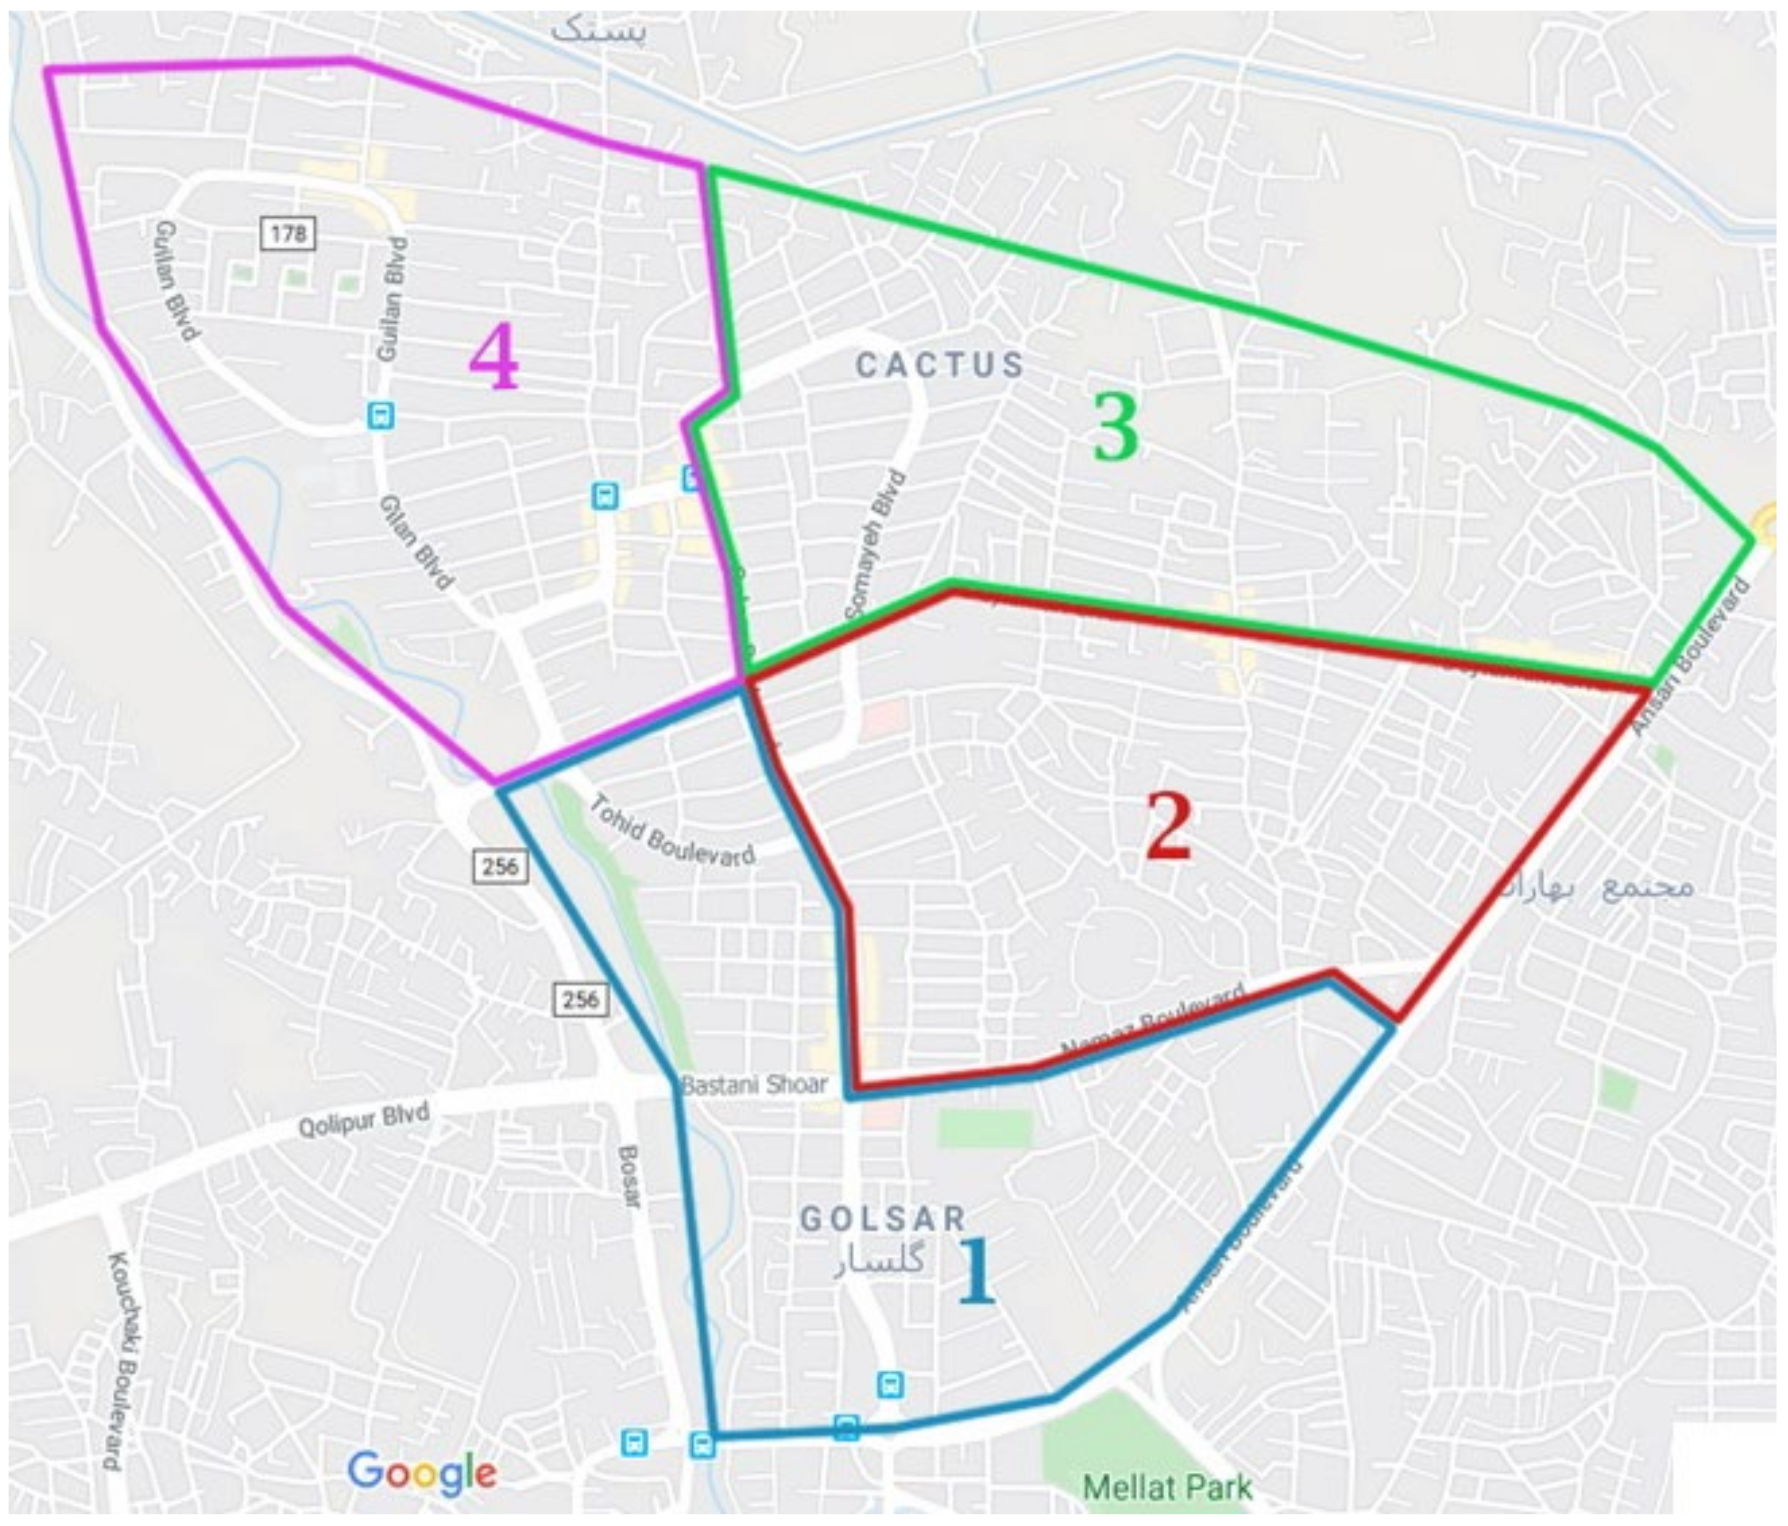
The selected case is Golsar town in Rasht, geographically located in the North of Iran, with an urban population of 748,711 in 2016 and with an area of 180 km2. This town with around 115,000 population is one of the high-density residential areas in the city and can be considered as an upscale neighborhood (Figure 1). Based on the information of the municipality, four districts of Golsar were chosen to focus on neighborhood walkability and street connectivity (Figure 2). The research paper identified useful understandings of the positive and negative effects of street design in Golsar that are one of the main options of citizens of Rasht to buy or rent houses and apartments despite the high price of estates.
4.2. Street Connectivity
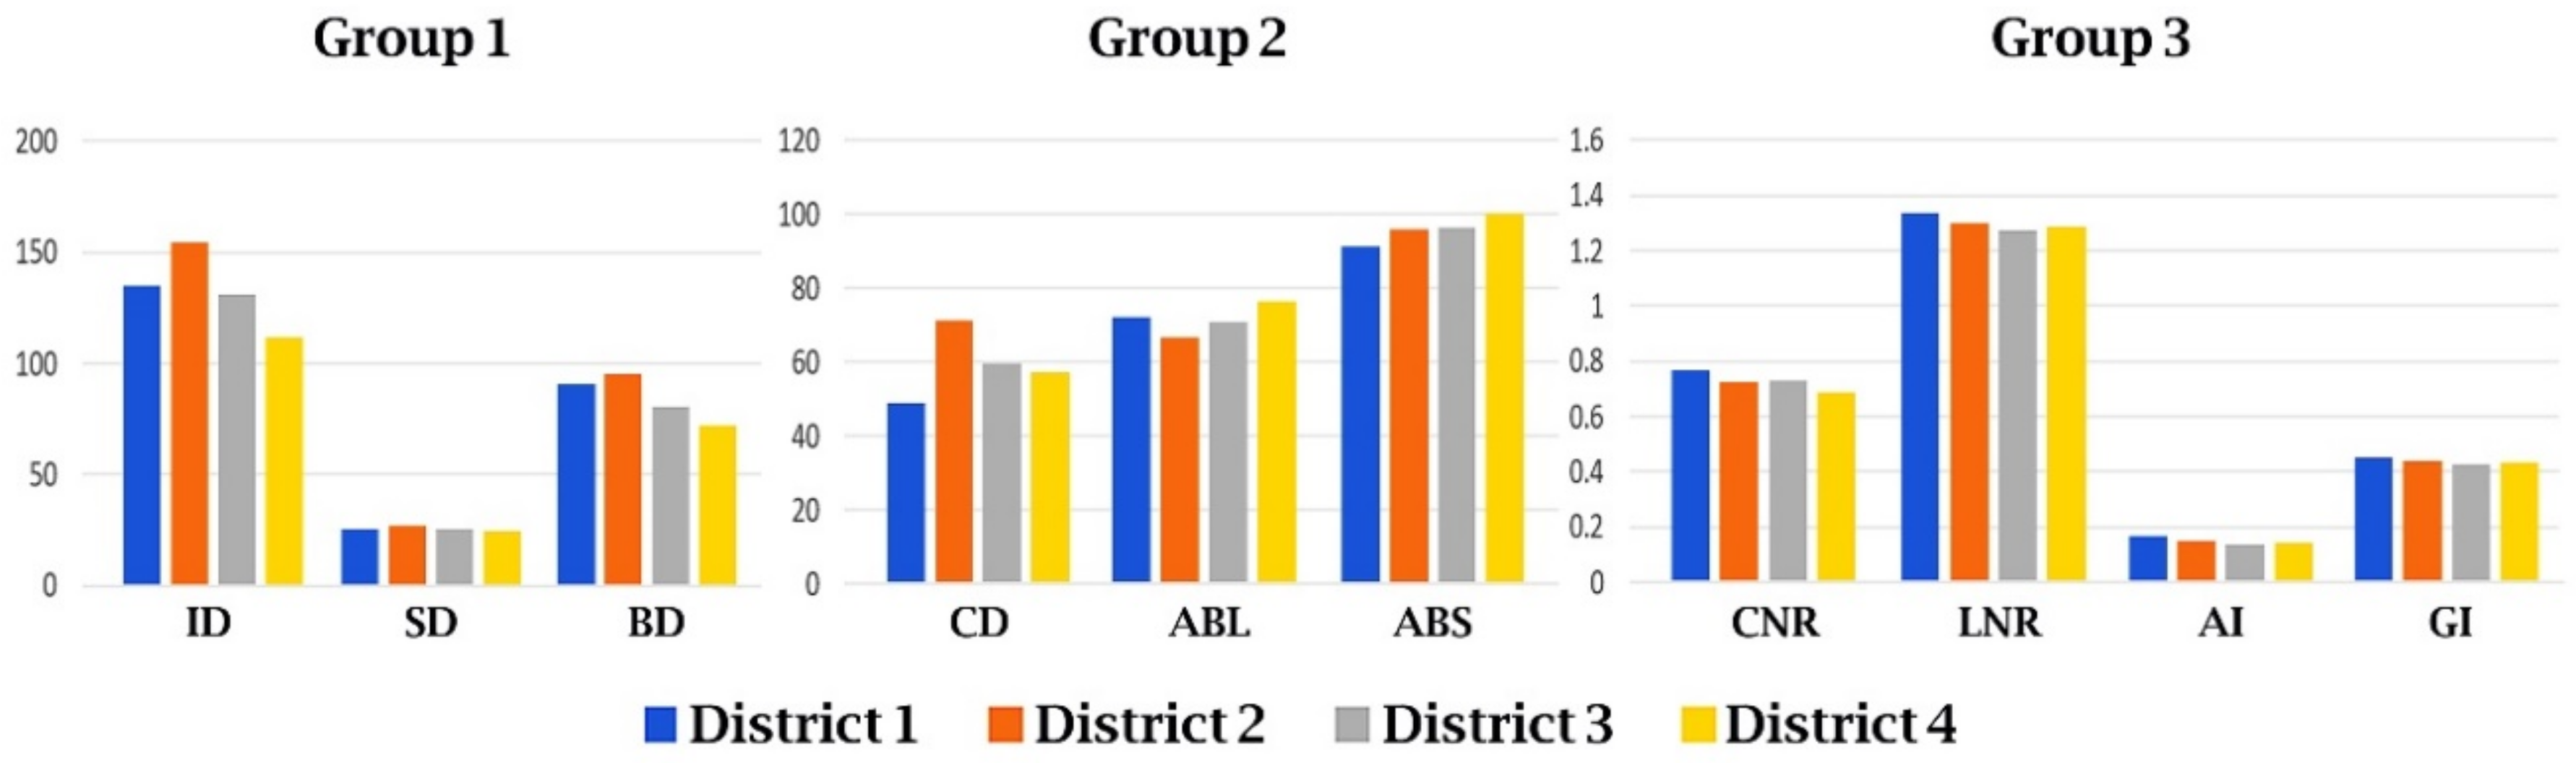
First, the definition of variables was explained in the Section 3. In this part, for the assessment of street connectivity, values of 10 variables for each district in Golsar town should be calculated by using GIS data. The information concerning the 10 variables was extracted via GIS software (ArcView) in each district (Table 1). In addition, the measures of variables are shown in Figure 3 in three groups of bar charts. Group 1 includes intersection (ID), street density (SD), and block density (BD). Group 2 consists of cul-de-sac density (CD), average block length (ABL), and average block section (ABS) in which a small number means a better one. Group 3 includes connected node ratio (CNR), link node ratio (LNR), alpha index (AI), and gamma indexes (GI). As shown, District 1 ranked the first in six variables, including cul-de-sac density, average block section, connected node, and link node ratio, as well as alpha and gamma indexes. It means that regarding these measures, the total measure of connectivity of streets in District 1 is better than others. However, District 2 possessed better connectivity according to these four variables: intersection, street, and block density, as well as average block length. District 4 had the worst condition in six variables in comparison with other districts. Additionally, District 3 had a similar condition with a minimum amount in the last three variables: link node ratio, alpha, and gamma indexes.
The assessment of street connectivity in the four districts demonstrates a complicated pattern of correlation. Measures of the variables in Group 1 are positively related to each other but inversely associated with cul-de-sac density. The ranking order of districts in measures of block features (average block length and section) is different. It was predictable that there are strong positive relationships between the variables in Group 3. Additionally, there was a meaningful discrepancy between variables in Group 1 and Group 2.
The normalized results presented in Table 2 will be (0 ≤ rij ≤ 1), with higher rij values being more desirable for walkability. The analysis revealed that District 1 with 8.09 had the maximum, and District 4 with 1.23 had the minimum score of street connectivity in the Golsar town. District 2 with 6.28 and District 3 with 3.22 possessed the middle positions.
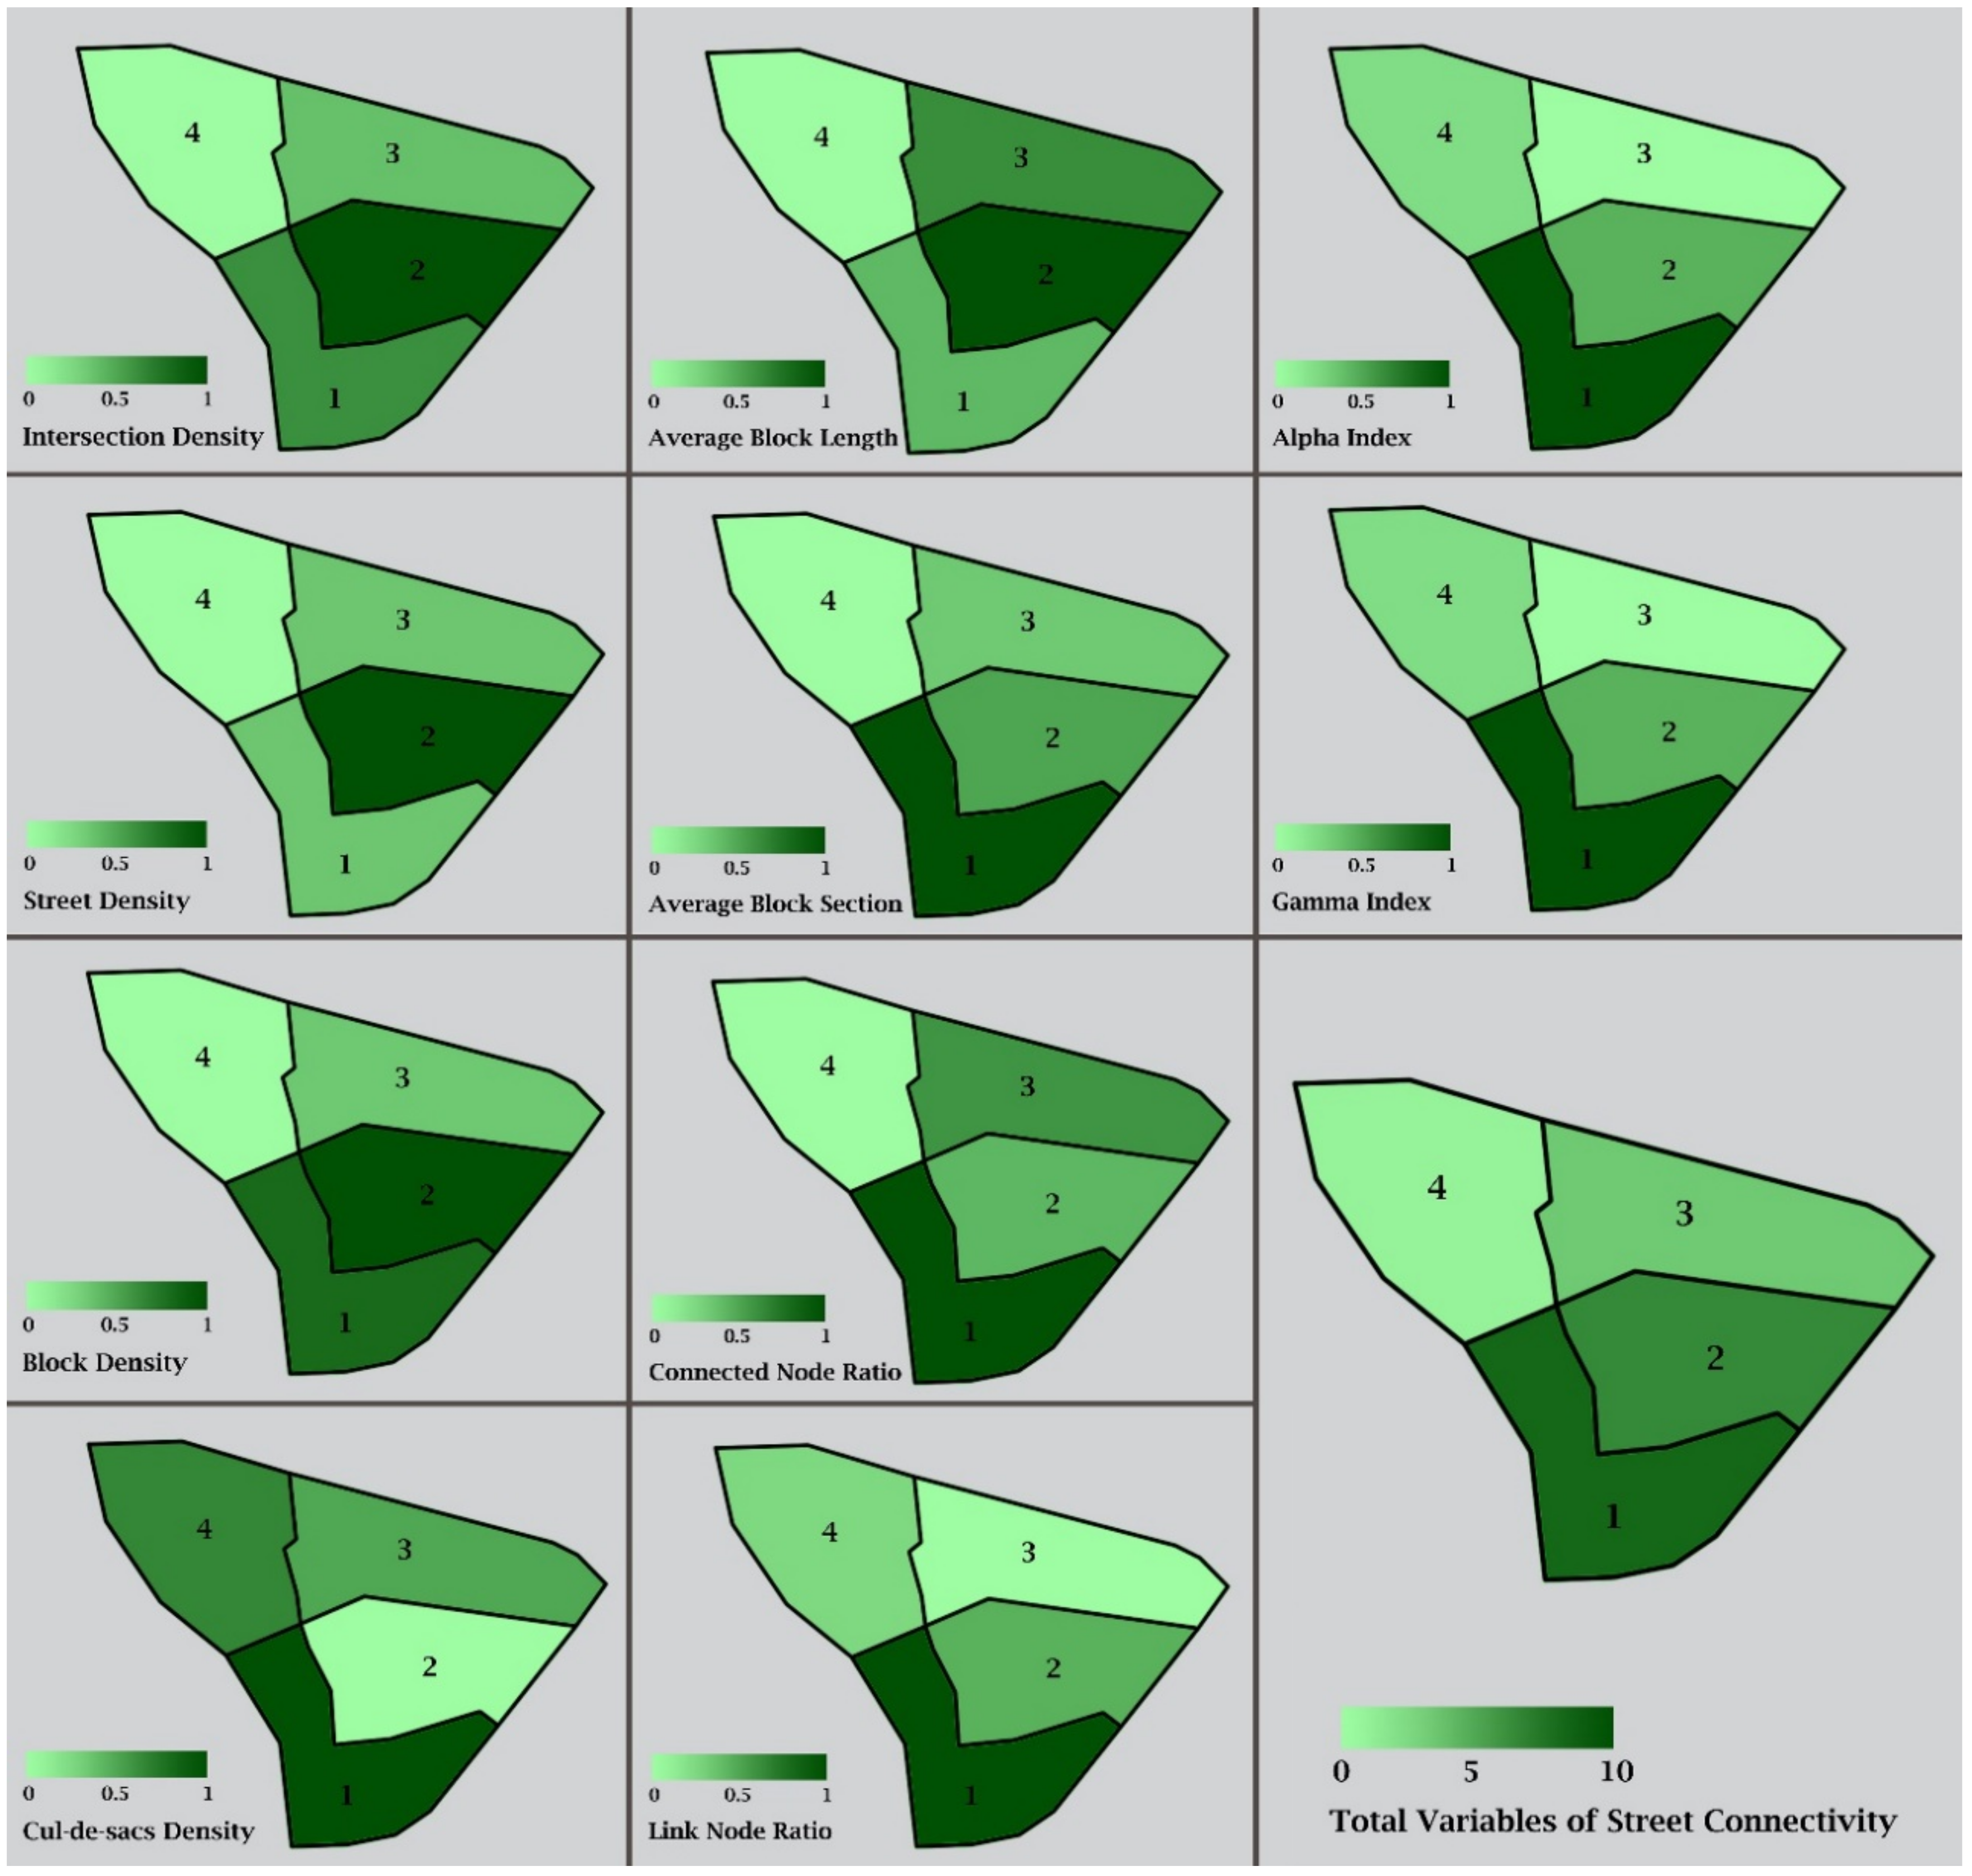
The choropleth maps in Figure 4 show the results of normalized variations of the above table for each variable and total amount in four districts of Golsar town. A choropleth map is a type of thematic map used for visualizing the values of a parameter over a geographical area through the color spectrum. In this figure, colors changed from light to dark green (from 0 to 1) to represent the changing of the values of the variables of street connectivity in Golsar. Darker green displays a better normalized value and lighter green displays a worse one. The variation of the total values from 0 to 10 can be seen in the largest frame. District 1 has the first rank in six variables including cul-de-sac density, average block section, connected node ratio, link node ratio, alpha index, and gamma index. However, District 2 has the most value in the remaining variables. Except for cul-de-sac density, which in District 2 has the lowest value among all districts, District 3 or 4 possesses the last rank in the other nine parameters of street connectivity.
4.3. Physical Activity
Statistic population of this study was in the 18–69 age group among 115,000 people living and working in Golsar. The details of demographic variables (age, sex, employment rate, and living location) of the mentioned population can be found in Table 3.
The IPAQ, as a reliable standard questionnaire, has been designed to evaluate the physical activity of a population across all domains of their work, transportation, leisure-time, and household tasks. In this step, the walking and cycling of people for their work, transportation, and leisure-time have been examined and compared because our focus is on their outdoor physical activities. The participants were 32.3 ± 12.7 years old, 50.2% of them were male, and 49.8% were female. As well, 45% of respondents (n = 173) had paid or unpaid jobs in the last week; thus, their job-related walking has also been evaluated in our study.
As illustrated in Table 4, the average time which is dedicated to walking and cycling in District 1 ranked the first with 223.3 min per week which was more than District 2 with 218.4 min per week. The average time in Districts 3 and 4 were approximately equal, although this amount for District 4 (214.2 min per week) was about half a minute more than District 3. District 1 possessed the most average time in cycling and walking for commuting, and District 2 enjoyed the maximum amount for job-related and leisure-time walking. On the other side, Districts 3 and 4 had the lowest average time for all types of physical activities.
4.4. Correlation between the Two Methods
As mentioned, based on total normalized values of street connectivity in Golsar, District 1 with 8.09, District 2 with 6.28, District 3 with 3.22, and District 4 with 1.23 possessed the first to fourth positions. Additionally, regarding the results of IPAQ, the same ranking applies to the amount of physical activity of people in these districts except for District 4, which ranked the third with a slight difference with District 3. Therefore, according to Pearson’s r formula, for this study, rxy = 0.93 shows a strong positive correlation between the total amounts of street connectivity and the time which people have spent on walking and outdoor physical activities in the four districts of Golsar. Thus, the result of this research indicated that connectivity in this town has a direct positive effect on the public health of people and the duration of walking in the streets.
This study was limited to evaluate the influence of street connectivity on the walkability in Golsar. There are also suggestions for further research. For example, the evaluation of other indexes of walkability such as proximity, pedestrian design, land use mix, safety, and density can improve our knowledge about the walkability of this region, indicating the amount of impact of each index on walking behavior of residents.
5. Conclusions
This paper concerns the association between street connectivity and outdoor physical activity (walking and cycling) of the population in Golsar’s districts. As a result, the study resulted in a strong linear correlation (r = 0.93) between the street connectivity of each district of Golsar and the duration of physical activities of residents in these districts. Due to this correlation, it is apparent that the relationship between street connectivity and walkability in this town is a strong and direct one.
Comparison between the variables of street connectivity in each district and the results of IPAQ vividly revealed that the design of the streets’ network in Golsar directly has been able to take a dominant role in the walkability of neighborhood areas and enhancement of the average time of walking among residents. The more desirable design of street connectivity in District 1 provides a better design of the street network for more physical activity of residents compared with other districts. Consequently, the difference in the measures of walkability between the four districts can lead to a change in the amount of walking of people and may improve the indexes of public health among people.
Author Contributions
All the authors conceived, designed, and wrote the study. P.M. conducted the field survey, analyzed, and visualized the data. L.T. and M.H. reviewed the manuscript and supervised the process. All authors have read and agreed to the published version of the manuscript.
Funding
This research received no external funding.
Institutional Review Board Statement
Not applicable.
Informed Consent Statement
Not applicable.
Data Availability Statement
Not applicable.
Acknowledgments
The authors would like to express their sincere acknowledgment to Farhad Rezaei for his help during GIS data collection and processing.
Conflicts of Interest
The authors declare no conflict of interest.
References
- Shaaban, K. Assessing Sidewalk and Corridor Walkability in Developing Countries. Sustainability 2019, 15, 3865. [Google Scholar] [CrossRef] [Green Version]
- Kruger, J.; Ham, S.; Berrigan, D.; Ballard-Barbash, R. Prevalence of transportation and leisure walking among U.S. adults. Prev. Med. 2008, 47, 329–334. [Google Scholar] [CrossRef] [PubMed]
- Cerin, E.; Conway, T.L.; Saelens, B.E.; Frank, L.D.; Sallis, J.F. Cross-validation of the factorial structure of the neighborhood environment walkability scale (NEWS) and its abbreviated form (NEWS-A). Int. J. Behav. Nutr. Phys. 2009, 6, 32. [Google Scholar] [CrossRef] [PubMed]
- Lu, Y.; Xiao, Y.; Ye, Y. Urban density, diversity and design: Is more always better for walking? A study from Hong Kong. Prev. Med. 2017, 13, 99–103. [Google Scholar] [CrossRef] [PubMed]
- Shafray, E.; Seiyong, K.A. Study of Walkable Spaces with Natural Elements for Urban Regeneration: A Focus on Cases in Seoul, South Korea. Sustainability 2017, 9, 587. [Google Scholar] [CrossRef] [Green Version]
- Tudor-Locke, C.; Jones, G.; Myers, A.; Paterson, D.; Ecclestone, N. Contribution of structured exercise class participation and informal walking for exercise to daily physical activity in community-dwelling older adults. Res. Q. Exerc. Sport 2002, 73, 350–356. [Google Scholar] [CrossRef] [PubMed]
- Coffee, N.T.; Howard, N.; Paquet, C.; Hugo, G.; Daniel, M. Is walkability associated with a lower cardiometabolic risk? Health Place 2013, 21, 163–169. [Google Scholar] [CrossRef] [PubMed]
- Fathi, S.; Sajadzadeh, H.; Mohammadi, F.; Aram, F.; Pinter, G.; Felde, I.; Mosavi, A. The Role of Urban Morphology Design on Enhancing Physical Activity and Public Health. Int. J. Environ. Res. Public Health 2020, 17, 2359. [Google Scholar] [CrossRef] [Green Version]
- Pelleri, D.; Piracha, A. Urban design and walkability in north-west Sydney. In Proceedings of the First International Conference on Sustainable Urbanization (ICSU 2010), Hong Kong, China, 15–17 December 2010; The Hong Kong Polytechnic University: Hong Kong, China, 2010; pp. 1612–1621. [Google Scholar]
- National Research Council and Institute of Medicine (US). U.S. Health in International Perspective, Shorter Lives, Poorer Health; National Academies Press: Washington, DC, USA, 2013. [Google Scholar]
- Boulange, C.; Pettit, C.; Giles-Corti, B. The Walkability Planning Support System: An Evidence-Based Tool to Design Healthy Communities. In Planning Support Science for Smarter Urban Futures; Springer: Cham, Switzerland, 2017; pp. 153–216. [Google Scholar] [CrossRef]
- Bereitschaft, B. Walk Score® versus residents’ perceptions of walkability in Omaha, NE. J. Urbanism Int. Res. Placemak. Urban Sustain. 2018, 11, 412–435. [Google Scholar] [CrossRef]
- Lowe, M.; Boulange, C.; Giles-Corti, B. Urban design and health: Progress to date and future challenges. Health Promot. J. Aust. 2014, 25, 14–18. [Google Scholar] [CrossRef]
- Hobbs, G. Wellbeing: A Theoretical and Empirical Study. Ph.D. Thesis, Manchester Metropolitan University, Manchester, UK, 2016. [Google Scholar]
- Scriven, A.; Garman, S. Promoting Health: Global Perspectives; Palgrave Macmillan: Basingstoke, UK, 2005. [Google Scholar]
- Crawshaw, P. Whither wellbeing for public health? Crit. Public Health 2008, 18, 259–261. [Google Scholar] [CrossRef]
- South, J.; Woodall, J. Empowerment and Health and Well-Being: Evidence Summary; Leeds Centre for Health Promotion Research and Leeds Metropolitan University: Leeds, UK, 2010. [Google Scholar]
- Mason, E.K.; Pearce, N.; Cummins, S. Associations between fast food and physical activity environments and adiposity in mid-life: Cross-sectional, observational evidence from UK Biobank. Lancet Public Health 2018, 3, 24–33. [Google Scholar] [CrossRef] [Green Version]
- Brownson, R.C.; Hoehner, C.M.; Day, K.; Forsyth, A.; Sallis, J.F. Measuring the Built Environment for Physical Activity: State of the Science. Am. J. Prev. Med. 2009, 36, 99–123. [Google Scholar] [CrossRef] [PubMed] [Green Version]
- Tribby, C.P.; Miller, H.J.; Brown, B.B.; Werner, C.M.; Smith, K.R. Assessing built environment walkability using activity-space summary measures. J. Transp. Land Use 2016, 9, 187–207. [Google Scholar] [CrossRef] [Green Version]
- Laverly, A.; Webb, E.; Vamos, E.; Millett, C. Associations of Increase in Public Transport Use with Physical Activity and Adiposity in Older Adults. Int. J. Behav. Nutr. Phys. Act. 2018, 15, 31. [Google Scholar] [CrossRef]
- Saills, J.F. Measuring physical activity environments: A brief history. Am. J. Prev. Med. 2009, 36, 86–92. [Google Scholar] [CrossRef] [Green Version]
- Weinberger, R.; Sweet, M.N. Integrating Walkability into Planning Practice. Transp. Res. Rec. 2012, 2322, 20–30. [Google Scholar] [CrossRef] [Green Version]
- Dong, H.; Qin, B. Exploring the link between neighborhood environment and mental wellbeing: A case study in Beijing, China. Landsc. Urban Plan. 2017, 164, 71–80. [Google Scholar] [CrossRef]
- Honold, J.; Lakes, T.; Beyer, R.; Van der Meer, E. Restoration in urban spaces: Nature views from home, greenways, and public parks. Environ. Behav. 2016, 48, 796–825. [Google Scholar] [CrossRef]
- Nieuwenhuijsen, M.J.; Khreis, H. Car free cities: Pathway to healthy urban living. Environ. Int. 2016, 94, 251–262. [Google Scholar] [CrossRef]
- Ewing, R.; Handy, S. Measuring the unmeasurable: Urban design qualities related to walkability. J. Urban Des. 2009, 14, 65–84. [Google Scholar] [CrossRef]
- Forsyth, A.; Oakes, J.M.; Lee, B.; Schmitz, K.H. The built environment, walking, and physical activity: Is the environment more important to some people than others? Transp. Res. D Transp. Environ. 2009, 14, 42–49. [Google Scholar] [CrossRef]
- Leslie, E.; Coffee, N.; Frank, L.; Owen, N.; Bauman, A.; Hugo, G. Walkability of local communities: Using geographic information systems to objectively assess relevant environmental attributes. Health Place 2007, 13, 111–122. [Google Scholar] [CrossRef]
- Richardson, E.A.; Mitchell, R.; Hartig, T.; de Vries, S.; Astell-Burt, T.; Frumkin, H. Green cities and health: A question of scale? J. Epidemiol. Community Health 2012, 66, 160–165. [Google Scholar] [CrossRef] [Green Version]
- Saelens, B.E.; Sallis, J.F.; Frank, L.D. Environmental correlates of Walking and Cycling: Findings from the Transportation, Urban Design, and Planning Literatures. Ann. Behav. Med. 2003, 25, 80–91. [Google Scholar] [CrossRef] [PubMed]
- Dörrzapf, L.; Kovács-Győri, A.; Resch, B.; Zeile, P. Defining and assessing walkability: A concept for an integrated approach using surveys, biosensors and geospatial analysis. Urban Dev. Issues 2019, 62, 5–15. [Google Scholar] [CrossRef] [Green Version]
- Forsyth, A. What is a walkable place? The walkability debate in urban design. Urban Des. Int. 2015, 20, 274–292. [Google Scholar] [CrossRef]
- Hutabarat, R. Walkability: What is it? J. Urbanism Int. Res. Placemak. Urban Sustain. 2009, 2, 145–166. [Google Scholar] [CrossRef]
- Blecic, I.; Canu, D.; Cecchini, A.; Congiu, T.; Fancello, G. Walkability and Street Intersections in Rural-Urban Fringes: A Decision Aiding Evaluation Procedure. Sustainability 2017, 9, 883. [Google Scholar] [CrossRef] [Green Version]
- Speck, J. Walkable City: How Downtown Can Save America, One Step at a Time; Macmillan: New York, NY, USA, 2012. [Google Scholar] [CrossRef]
- Sivam, A.; Karuppannan, S.; Koohsari, M.J.; Sivam, A. Does Urban Design Influence Physical Activity in the Reduction of Obesity? A Review of Evidence. Open Urban Stud. J. 2012, 5, 14–21. [Google Scholar] [CrossRef]
- Bucksch, J.; Schneider, S. Walkability—Das Handbuch zur Bewegungsförderung in der Kommune; Verlag Hans Huber: Bern, Switzerland, 2014. [Google Scholar]
- Villanueva, K.; Knuiman, M.; Nathan, A.; Giles-Corti, B.; Christian, H.; Foster, S.; Bull, F. The impact of neighborhood walkability on walking: Does it differ across adult life stage and does neighborhood buffer size matter? Health Place 2014, 25, 43–46. [Google Scholar] [CrossRef] [PubMed] [Green Version]
- Sundquist, K.; Eriksson, U.; Mezuk, B.; Ohlsson, H. Neighborhood walkability, deprivation and incidence of type 2 diabetes: A population-based study on 512,061 Swedish adults. Health Place 2015, 31, 24–30. [Google Scholar] [CrossRef] [PubMed] [Green Version]
- Shashank, A. Walkability and Connectivity: Unpacking Measures of the Built Environment. Master’s Thesis, Simon Fraser University, Vancouver, BC, Canada, 2016. [Google Scholar]
- Grasser, G.; Titze, S.; Stronegger, W.J. Are residents of high-walkable areas satisfied with their neighbourhood? J. Public Health 2016, 24, 469–476. [Google Scholar] [CrossRef] [PubMed] [Green Version]
- Sarkar, C.; Webster, C.; Gallacher, J. Neighborhood walkability and incidence of hypertension: Findings from the study of 429,334 UK Biobank participants. Int. J. Hyg. Environ. Health 2018, 221, 458–468. [Google Scholar] [CrossRef] [PubMed]
- Anciaes, P.R.; Nascimento, J.; Silva, S. The distribution of walkability in an African city: Praia, Cabo Verde. Cities 2017, 67, 9–20. [Google Scholar] [CrossRef]
- Kent, J.; Thompson, S.M.; Jalaludin, B. Healthy Built Environments: A Review of the Literature; Healthy Built Environments Program, City Futures Research Centre, UNSW: Sydney, Australia, 2011. [Google Scholar]
- Dyck, V.D.; Cardon, G.; Deforche, B.; Owen, N.; De Bourdeaudhuij, I. Relationships between neighborhood walkability and adults’ physical activity: How important is residential self-selection? Health Place 2011, 17, 1011–1014. [Google Scholar] [CrossRef]
- Katapally, T.R.; Bhawra, J.; Leatherdale, S.T.; Ferguson, L.; Longo, J.; Rainham, D.; Larouche, R.; Osgood, N. The SMART Study, a Mobile Health and Citizen Science Methodological Platform for Active Living Surveillance, Integrated Knowledge Translation, and Policy Interventions: Longitudinal Study. JMIR Public Health Surveill. 2018, 4, 31. [Google Scholar] [CrossRef]
- Berrigan, D.; Pickle, L.W.; Dill, J. Associations between street connectivity and active transportation. Int. J. Health Geogr. 2010, 9, 20. [Google Scholar] [CrossRef] [Green Version]
- Forsyth, A.; Krizek, K.J. Promoting walking and bicycling: Assessing the evidence to assist planners. Built Environ. 2010, 36, 429–446. [Google Scholar] [CrossRef]
- Berke, E.M.; Koepsell, T.D.; Moudon, A.V.; Hoskins, R.E.; Larson, E.B. Association of the built environment with physical activity and obesity in older persons. Am. J. Public Health 2007, 97, 486–492. [Google Scholar] [CrossRef]
- Dovey, K.; Pafka, E. What is walkability? The urban DMA. Urban Stud. 2019, 57, 93–108. [Google Scholar] [CrossRef]
- Ewing, R.; Bartholomew, K.; Winkelman, S.; Walters, J.; Chen, D. Growing Cooler: The Evidence on Urban Development and Climate Change; Urban Land Institute: Washington, DC, USA, 2008. [Google Scholar] [CrossRef]
- Frank, L.D.; Sallis, J.F.; Saelens, B.E.; Leary, L.; Cain, L.; Conway, T.L.; Hess, P.M. The development of a walkability index: Application to the neighborhood quality of life study. Br. J. Sports Med. 2010, 44, 924–933. [Google Scholar] [CrossRef] [PubMed]
- Adams, M.A.; Frank, L.D.; Schipperijn, J.; Smith, G.; Chapman, J.; Christiansen, L.B.; Coffee, N.; Salvo, D.; du Toit, L.; Dygrýn, J.; et al. International variation in neighborhood walkability, transit, and recreation environments using geographic information systems: The IPEN adult study. Int. J. Health Geogr. 2014, 13, 43. [Google Scholar] [CrossRef] [PubMed] [Green Version]
- Frank, L.D.; Andresen, M.A.; Schmid, T.L. Obesity relationships with community design, physical activity, and time spent in cars. Am. J. Prev. Med. 2004, 27, 87–96. [Google Scholar] [CrossRef]
- Radbone, I.; Hamnett, S. Land Use, Walking and Cycling: A Review of Recent Research, Australian Policies and Suggestions for Further Work. In Proceedings of the 26th Australasian Transport Research Forum, Wellington, New Zeland, 1–3 October 2003. [Google Scholar]
- Saelens, B.E.; Handy, S.L. Built environment correlates of walking: A review. Med. Sci. Sports Exerc. 2008, 40, 550–566. [Google Scholar] [CrossRef] [Green Version]
- Tresidder, M. Using GIS to Measure Connectivity: An Exploration of Issues; School of Urban Studies and Planning in Portland State University: Portland, OR, USA, 2005. [Google Scholar]
- Moudon, A.V.; Lee, C.; Cheadle, A.D.; Garvin, C.; Johnson, D.; Schmid, T.L.; Weathers, R.D.; Lin, L. Operational definitions of walkable neighborhood: Theoretical and empirical insights. J. Phys. Act. Health 2006, 3, 99–117. [Google Scholar] [CrossRef]
- Schlossberg, M.; Johnson-Shelton, D.; Evers, C.; Moreno, G. Refining the grain: Using resident-based walkability audits to better understand walkable urban form. J. Urbanism Int. Res. Placemak. Urban Sustain. 2015, 8, 260–278. [Google Scholar] [CrossRef]
- Blecic, I.; Cecchini, A.; Canu, D.; Cappai, A.; Congiu, T.; Fancello, G. Evaluating the Effect of Urban Intersections on Walkability. In Proceedings of the 16th International Conference of Computational Science and Its Applications (ICCSA 2016), Beijing, China, 4–7 July 2016; Part IV. pp. 138–149. [Google Scholar] [CrossRef]
- Mouraa, F.; Cambraa, P.; Goncalves, A.B. Measuring walkability for distinct pedestrian groups with aparticipatory assessment method: A case study in Lisbon. Landsc. Urban Plan. 2017, 157, 282–296. [Google Scholar] [CrossRef]
- Craig, C.L.; Marshall, A.L.; Sjöström, M.; Bauman, A.E.; Booth, M.L.; Ainsworth, B.E.; Pratt, M.; Ekelund, U.; Yngve, A.; Sallis, J.F.; et al. International Physical Activity Questionnaire (IPAQ): 12-country reliability and validity. Med. Sci. Sports Exer. 2003, 35, 1381–1395. [Google Scholar] [CrossRef] [Green Version]
- Cerin, E.; Conway, T.L.; Cain, K.L.; Kerr, J.; Bourdeaudhuij, I.D.; Owen, N.; Reis, R.S.; Sarmiento, O.L.; Hinckson, E.A.; Salvo, D.; et al. Sharing good NEWS across the world: Developing comparable scores across 12 countries for the neighborhood environment walkability scale (NEWS). BMC Public Health 2013, 13, 309. [Google Scholar] [CrossRef] [Green Version]
- Zhang, J.; Tan, P.Y.; Zeng, H.; Zhan, Y. Walkability Assessment in a Rapidly Urbanizing City and Its Relationship with Residential Estate Value. Sustainability 2019, 11, 2205. [Google Scholar] [CrossRef] [Green Version]
- Lefebvre-Ropars, G.; Morency, C.; Singleton, P.A.; Clifton, K.J. Spatial transferability assessment of a composite walkability index: The Pedestrian Index of the Environment (PIE). Transp. Res. D Transp. Environ. 2017, 57, 378–391. [Google Scholar] [CrossRef] [Green Version]
- Dill, J. Measuring Network Connectivity for Bicycling and Walking. In Proceedings of the 83rd Annual Meeting of Transportation Research Board, Washington, DC, USA, 11–15 January 2004. [Google Scholar]
- Cervero, R.; Radisch, C. Travel choices in pedestrian versus automobile oriented neighborhoods. Transp. Policy 1996, 3, 127–141. [Google Scholar] [CrossRef] [Green Version]
- Iravani, H.; Rao, V. The effects of New Urbanism on public health. J. Urban Des. 2020, 25, 218–235. [Google Scholar] [CrossRef] [Green Version]
- Cervero, R.; Kockelman, K. Travel Demand and the 3Ds: Density, Diversity, and Design. Transp. Res. D Transp. Environ. 1997, 2, 199–219. [Google Scholar] [CrossRef]
- Frank, L.D.; Stone, B.; Bachman, W. Linking land use with household vehicle emissions in the central Puget Sound: Methodological framework and findings. Transp. Res. D Transp. Environ. 2000, 5, 173–196. [Google Scholar] [CrossRef]
- Bejarano, C.M.; Carlson, J.A.; Cushing, C.C.; Kerr, J.; Saelens, B.E.; Frank, L.D.; Glanz, K.; Cain, K.L.; Conway, T.L.; Sallis, J.F. Neighborhood built environment associations with adolescents’ location-specific sedentary and screen time. Health Place 2019, 56, 147–154. [Google Scholar] [CrossRef]
- Nowrouzian, R. Spatial Models for Analyzing the Effects of Land Use Patterns on Automobile Ownership and Usage. Ph.D. Thesis, University of Florida, Gainesville, FL, USA, 2014. [Google Scholar]
- Stangl, P. Block size-based measures of street connectivity: A critical assessment and new approach. Urban Des. Int. 2015, 20, 44–55. [Google Scholar] [CrossRef]
- Song, Y. Impacts of Urban Growth Management on Urban Form: A Comparative Study of Portland, Oregon, Orange County, Florida and Montgomery County, Maryland. In National Center for Smart Growth Research and Education; University of Maryland: College Park, MD, USA, 2003. [Google Scholar]
- Ewing, R. Best Development Practices: Doing the Right Thing and Making Money at the Same Time; American Planning Association: Chicago, IL, USA, 1996. [Google Scholar] [CrossRef]
- Elwood, S. Critical issues in participatory GIS: Deconstructions, reconstructions, and new research directions. Trans. GIS 2006, 10, 693–708. [Google Scholar] [CrossRef]
- Teixeira, S. Qualitative Geographic Information Systems (GIS): An untapped research approach for social work. Qual. Soc. Work 2016, 17, 9–23. [Google Scholar] [CrossRef]
- Xianjin, H.; Huan, L.; Jinliao, H.; Yueguang, Z. 2.20—Application of GIS-Based Models for Land-Use Planning in China. In Comprehensive Geographic Information Systems; Huang, B., Ed.; Elsevier: New York, NY, USA, 2018; pp. 424–445. [Google Scholar] [CrossRef]
Figure 1.
Golsar, Rasht.

Figure 2.
Four districts in Golsar.

Figure 3.
Charts of the measures of street connectivity in four districts. Source: Authors.

Figure 4.
Choropleth maps of the variation of the variables of street connectivity in the 4 districts of Golsar.
Figure 4.
Choropleth maps of the variation of the variables of street connectivity in the 4 districts of Golsar.


Table 1.
Values of 10 variables of street connectivity in four districts of Golsar.
| Variables | District 1 | District 2 | District 3 | District 4 |
|---|---|---|---|---|
| Intersection Density | 135.01 | 154.61 | 130.84 | 111.29 |
| Street Density | 25.49 | 27.10 | 25.52 | 24.56 |
| Block Density | 90.40 | 95.63 | 80.22 | 72.18 |
| Cul-de-sac Density | 48.77 | 71.19 | 59.51 | 57.14 |
| Average Block Length | 72.33 | 66.60 | 70.70 | 76.56 |
| Average Block Section | 91.39 | 95.70 | 96.38 | 100.02 |
| Connected Node Ratio | 0.767 | 0.724 | 0.730 | 0.685 |
| Link Node Ratio | 1.339 | 1.302 | 1.272 | 1.290 |
| Alpha Index | 0.169 | 0.150 | 0.135 | 0.144 |
| Gamma Index | 0.450 | 0.437 | 0.427 | 0.433 |
Table 2.
Normalized values of the street connectivity in four districts.
| Variables | District 1 | District 2 | District 3 | District 4 |
|---|---|---|---|---|
| Intersection Density | 0.54 | 1 | 0.45 | 0 |
| Street Density | 0.36 | 1 | 0.37 | 0 |
| Block Density | 0.77 | 1 | 0.34 | 0 |
| Cul-de-sac Density | 1 | 0 | 0.52 | 0.62 |
| Average Block Length | 0.42 | 1 | 0.58 | 0 |
| Average Block Section | 1 | 0.50 | 0.42 | 0 |
| Connected Node Ratio | 1 | 0.47 | 0.54 | 0 |
| Link Node Ratio | 1 | 0.44 | 0 | 0.27 |
| Alpha Index | 1 | 0.44 | 0 | 0.26 |
| Gamma Index | 1 | 0.43 | 0 | 0.26 |
| Total | 8.09 | 6.28 | 3.22 | 1.23 |
Table 3.
Demographic characteristics of participants (n = 384).
| Demographic Variables | District 1 | District 2 | District 3 | District 4 | Total | ||
|---|---|---|---|---|---|---|---|
| Age | Mean | 32.1 | 32.4 | 31.9 | 32.9 | 32.3 | |
| SD 1 | 13.5 | 11.6 | 11.8 | 13.9 | 12.7 | ||
| Median | 30.5 | 32 | 31 | 31 | 31 | ||
| Min, Max | 18, 69 | 18, 67 | 18, 66 | 18, 69 | 18, 69 | ||
| Sex ratio | Male | Count | 48 | 49 | 49 | 47 | 193 |
| Percent | 50% | 51% | 51% | 49% | 50.2% | ||
| Female | Count | 48 | 47 | 47 | 49 | 191 | |
| Percent | 50% | 49% | 49% | 51% | 49.8% | ||
| Employment rate 2 | Count | 44 | 43 | 44 | 42 | 173 | |
| Percent | 45.8% | 44.7% | 45.8% | 43.7% | 45% | ||
1 The standard deviation of the age distribution; 2 paid or unpaid job in the last week.
Table 4.
Average time (minutes per week) for walking and cycling of respondents in Golsar.
| Physical Activities 1 | District 1 | District 2 | District 3 | District 4 |
|---|---|---|---|---|
| Job-Related Walking | 39.7 | 41.1 | 36.5 | 40.3 |
| Transport Walking | 124.4 | 118.3 | 122.2 | 118.8 |
| Leisure-Time Walking | 42.7 | 44.4 | 41 | 41.4 |
| Cycling | 16.5 | 14.6 | 14.1 | 13.7 |
| Total | 223.3 | 218.4 | 213.8 | 214.2 |
1 Different types of outdoor physical activities based on IPAQ (International Physical Activity Questionnaire) (minutes per week).
Publisher’s Note: MDPI stays neutral with regard to jurisdictional claims in published maps and institutional affiliations. |
© 2021 by the authors. Licensee MDPI, Basel, Switzerland. This article is an open access article distributed under the terms and conditions of the Creative Commons Attribution (CC BY) license (http://creativecommons.org/licenses/by/4.0/).
Share and Cite
MDPI and ACS Style
Molaei, P.; Tang, L.; Hardie, M. Measuring Walkability with Street Connectivity and Physical Activity: A Case Study in Iran. World 2021, 2, 49-61. https://0-doi-org.brum.beds.ac.uk/10.3390/world2010004
AMA Style
Molaei P, Tang L, Hardie M. Measuring Walkability with Street Connectivity and Physical Activity: A Case Study in Iran. World. 2021; 2(1):49-61. https://0-doi-org.brum.beds.ac.uk/10.3390/world2010004
Chicago/Turabian StyleMolaei, Pouya, Liyaning Tang, and Mary Hardie. 2021. "Measuring Walkability with Street Connectivity and Physical Activity: A Case Study in Iran" World 2, no. 1: 49-61. https://0-doi-org.brum.beds.ac.uk/10.3390/world2010004