Article

Assessing Socio-Economic Factors Affecting the Implementation of Payment for Ecosystem Services (PES) Mechanism

by
Beeju Poudyal
1,2,
Suraj Upadhaya
2,3,*,
Suman Acharya
2,4,5 and
Bir Bahadur Khanal Chhetri
1
1
Institute of Forestry Pokhara Campus, Pokhara 33700, Nepal
2
Himalayan Conservation and Research Institute, Dolpa 21400, Nepal
3
Department of Natural Resource Ecology and Management, Iowa State University, Ames, IA 50011, USA
4
Department of Anthropology, University of Maine, Orono, ME 04469, USA
5
Climate Change Institute, University of Maine, Orono, ME 04469, USA
*
Author to whom correspondence should be addressed.
Submission received: 19 December 2020 / Revised: 16 January 2021 / Accepted: 1 February 2021 / Published: 5 February 2021

Abstract

:
The Payment for Ecosystem Services (PES) mechanism has been pursued as a means to provide incentives for achieving conservation goals while also promoting rural development by alleviating poverty. However, the degree to which these goals are met depends on the implementation of the programs, which depends on the desirability and accessibility of programs targeting rural communities. Understanding the factors motivating or dissuading PES is vital for successful implementation. This paper evaluated the determinants of locals’ preference for PES implementation in the Begnas Lake Watershed. We interviewed 180 residents representing upstream and downstream. Factors such as income, the distance between house and lake, knowledge about PES, education, and duration of living in the area significantly determined locals’ attitude towards PES implementation. Their decision to take a stake in the PES program, if implemented, was influenced by income, family size, the distance between house and lake, education, and knowledge about PES. The majority of the household prefer community forestry as an institution and indirect payment as a compensation mechanism. The study suggests that the implementation of PES can contribute to uplifting the livelihood of local communities and conservation of Begnas lake watershed. The study further recommends the involvement of multi-stakeholders for ground-level awareness.

1. Introduction

The ecosystem provides different goods and services to human society ranging from local, regional, and global scales on which human communities greatly depend on, directly or indirectly, for their livelihoods [1]. The Millennium Ecosystem Assessment defines ecosystem services as the benefits humans receive from nature, such as clean water, food, fiber, wood, timber, medicinal herbs, and climate regulation [2]. However, several studies have found that different beneficial services generated from ecosystems are deteriorating rapidly due to the lack of appropriate conservation models and incentive mechanisms for stakeholders involved in managing such ecosystems [2,3,4,5,6]. A growing scarcity of the services, increasing pressure on ecosystems (in combination with decreasing interest in ecosystem management and conservation), has led to an outbreak of conservation innovations in the form of payment schemes [7,8]. As a result, the Payment for Ecosystem Services (PES) program has received global attention as an innovative conservation approach promoting sustainable natural resource management and enhancing locals’ livelihood through developing PES mechanisms [5,7,9,10,11]. PES is considered as a promising free-market-based approach designed to conserve the natural environment, in which the users of ecosystem services pay producers (managers of ecosystems) to adopt and maintain eco-friendly regimes to ensure the sustainability of such services [7].
The five different criteria are described as (1) a voluntary transaction, in which (2) a well-defined land use likely to secure those services is (3) bought by a minimum of one Ecosystem Services (ES) -buyer from (4) a minimum of one ES provider if (5) the ES provider secures ES provisions (conditionality) [12]. Fulfilling these five different criteria ensures a continuous supply of services without compromising societal goals [7,12,13]. However, some studies argue that commoditization of the ecosystem under neoliberalism does not necessarily benefit the economically poor livelihoods which are dependent on these services [14]. To solve environmental problems, decentralization of natural resources [15] and community-based forest management [16] are key factors, and PES schemes are gaining popularity among local governments and communities that appreciate PES as critical economic development pillars.
Thus, in developing countries like Nepal, where the state’s investment in conservation is inadequate, the PES mechanism seems to have a broader scope to develop as an incentive system for better resource conservation and livelihood improvement. Existing literature shows that two PES market models, i.e., private sector financing and public sector financing, are prevalent in Nepal [17]. The private sector model, which is voluntary in nature, is normally adopted by business entities such as hydropower companies, tourism industries such as trekking agencies, and hotels [17]. The public financing model is where the government provides financial incentives to local communities for managing different ecosystem services. The Reducing Emissions from Deforestation and Forest Degradation (REDD+) program follows the public financing model that provides incentives to the efforts that play a crucial role in reducing carbon dioxide concentration in the atmosphere [18]. Several questions on the sustainability of these PES models have been raised due to the inadequate policy, legislation, and institutional capacity [17]. Despite these constraints, few PES projects in Nepal are mostly localized and focus on self-organized private deals [19].
Despite the fragile legislative framework in Nepal, PES in watersheds, particularly provisioning of water for wetlands [20], is one of the most promising ecosystem services under the PES mechanism. However, there are few PES supportive policies and legal frameworks—such as Forest Policy (2015), Forest Sector Strategy (2016), Forest Act, 1993 (amended 2019), etc. [12]. PES provides ample opportunities to solve acute water scarcity problems for domestic and agricultural purposes, particularly in pre-monsoon months when perennial water bodies such as rivers and streams have reduced flows and even dry up altogether [21,22,23,24]. PES mechanisms provide incentives for local communities to conserve natural capital through the distribution and transfer of livelihood resources and financial support [25,26]. Though PES from wetlands and watersheds promise to solve problems by linking upstream and downstream communities, the involvement of relevant institutions and local communities in PES implementation is crucial. Numerous studies have investigated and pointed to the importance of non-monetary factors and demographic factors in motivating PES participation [27,28]. Researchers have recognized perceptions towards the conservation and environmental attitudes of locals as key participation motivators [29]. In Nepal, as in other parts of the world, there exist both communities that support and oppose PES. There is also a lack of understanding of what socio-economic factors motivate or dissuade communities’ participation in implementing PES mechanisms. The factors that motivate locals’ participation in PES will vary widely from one place to another. Understanding the factors that motivate participation serves as an important step to evaluate the implementation of PES programs to meet ecological and social goals [9]. Our main goal is to identify the key variables affecting locals’ attitude towards implementation and participation in PES mechanisms in the Begnas Lake watershed.

2. Materials and Methods
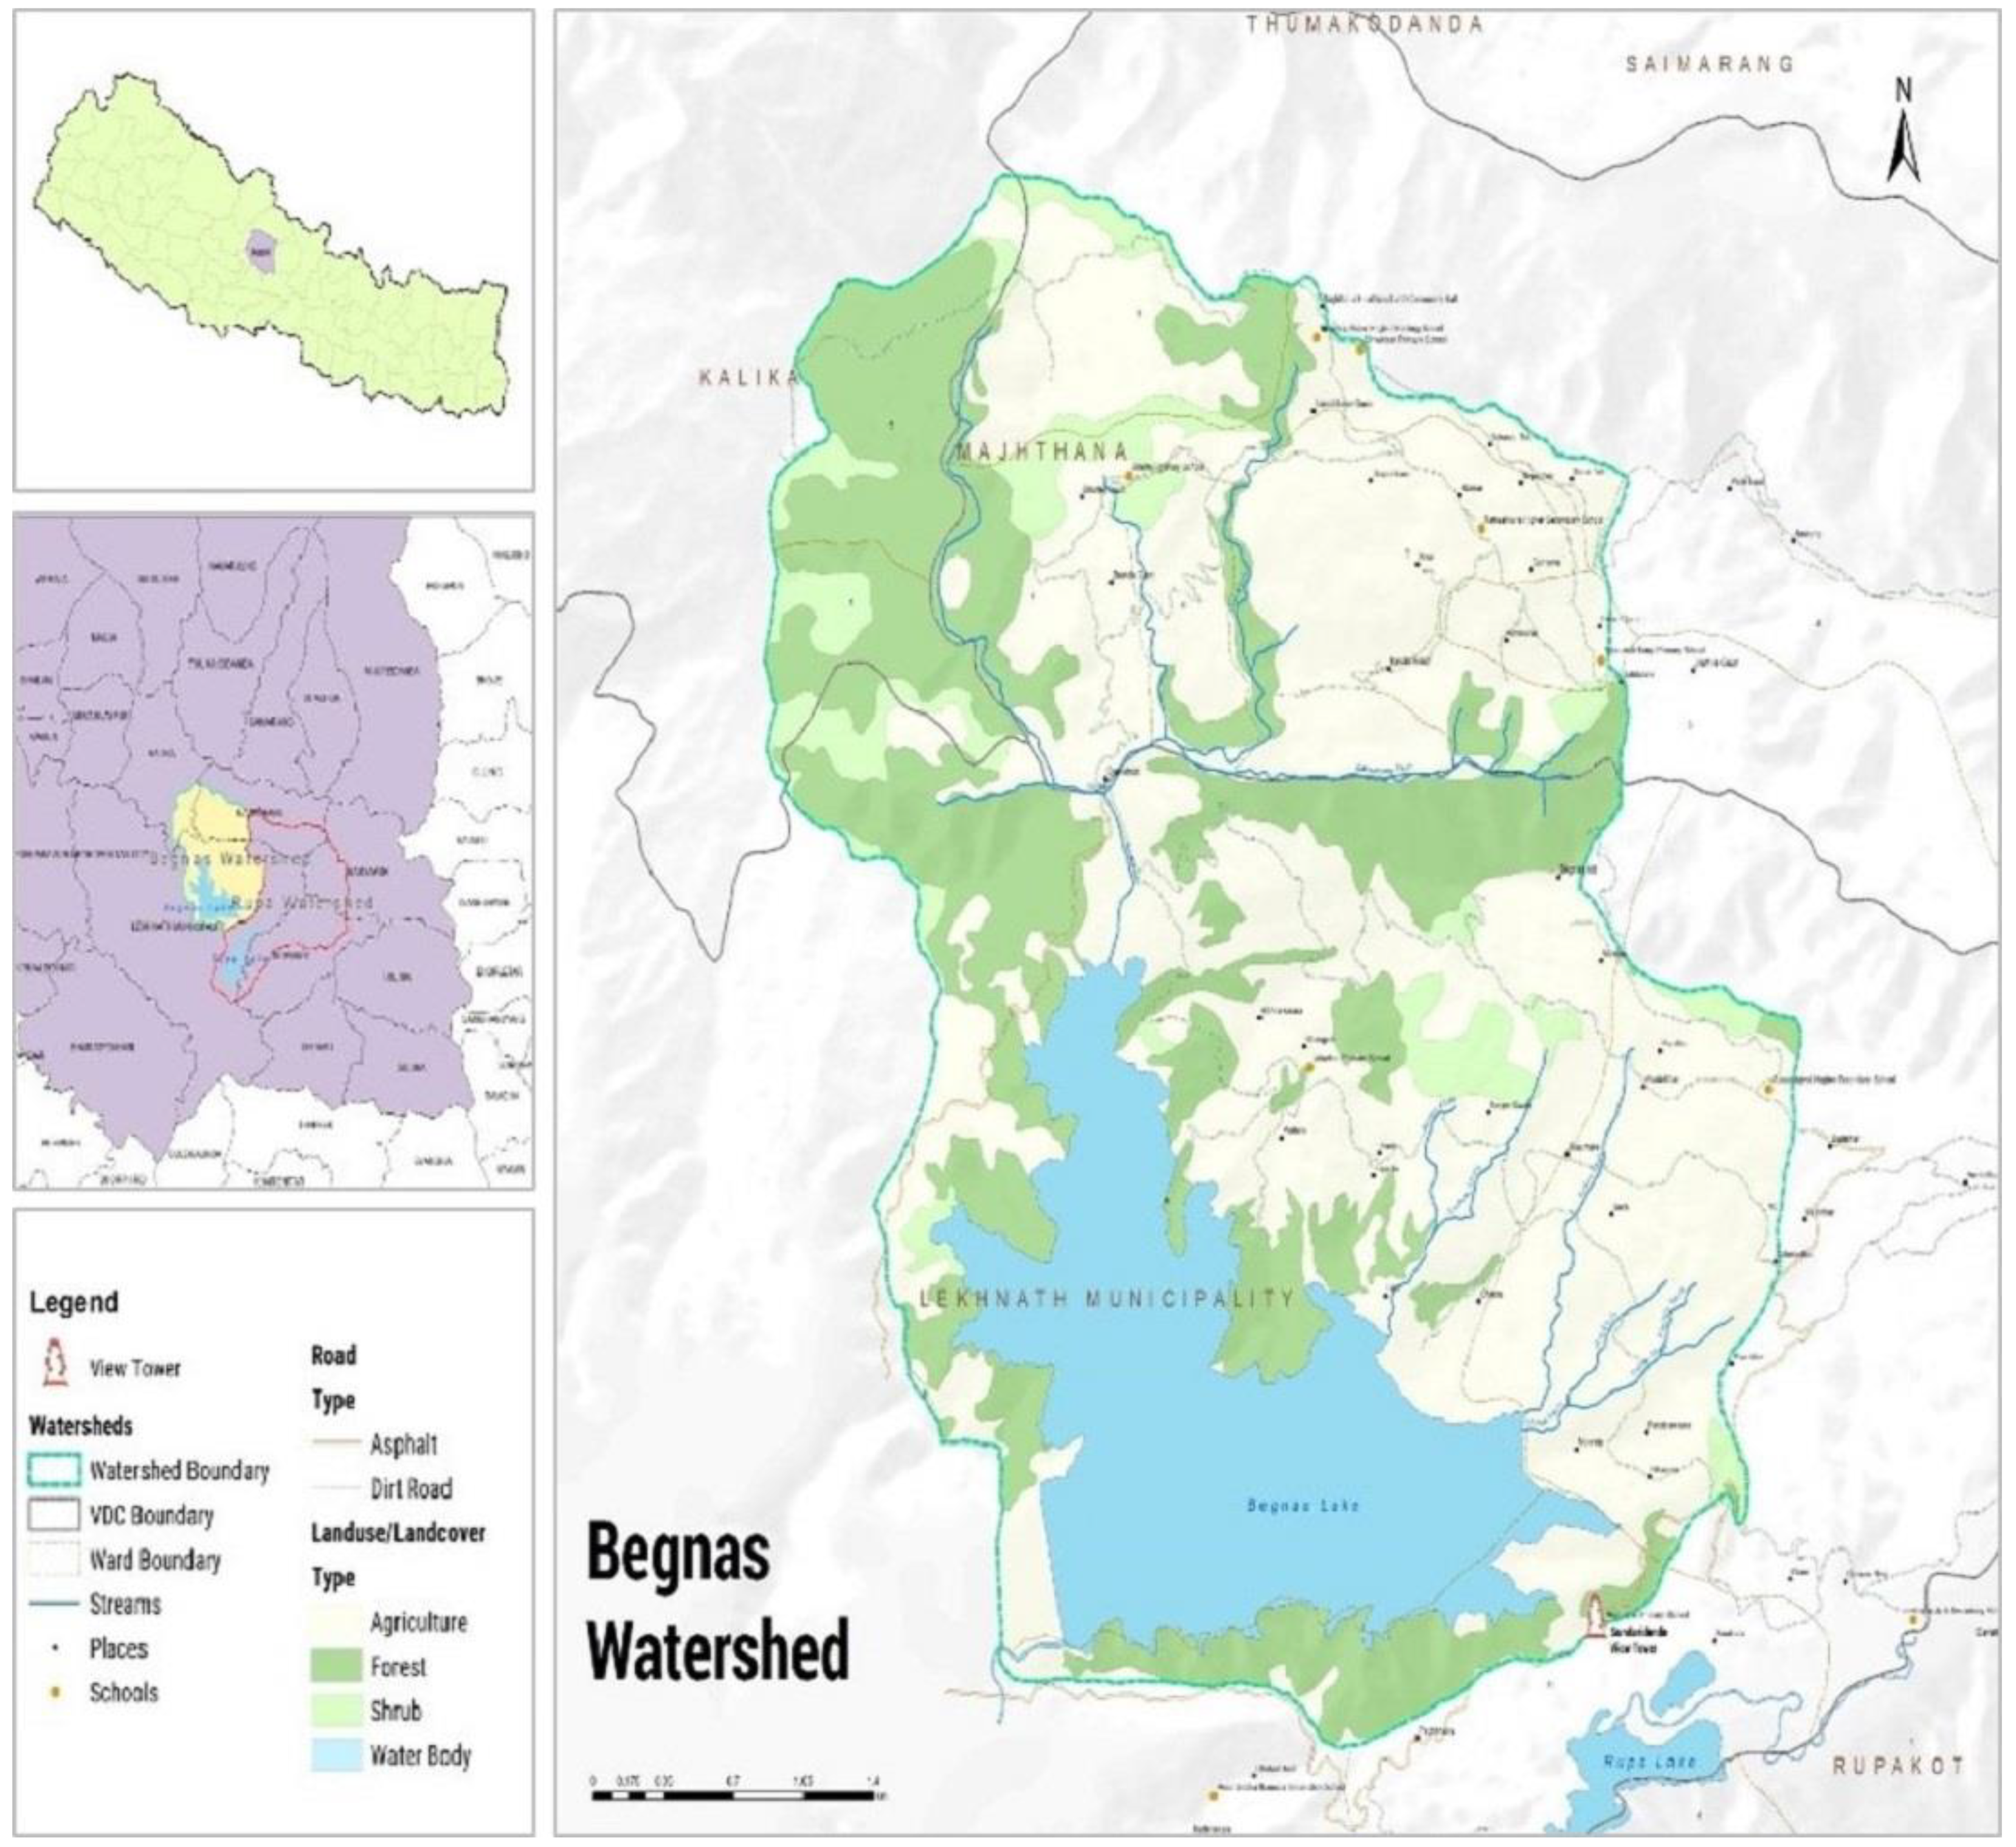
2.1. Study Area

This study was carried out in Begnas Lake watershed at Pokhara-Lekhnath Metropolitan of Kaski district of Nepal (Figure 1). Begnas Lake is a freshwater lake extending between 28° 7′ N to 28°12′ N latitudes, and 84°5′ E to 84°10′ E longitudes ranging from the elevation ranges from 600 m above sea level in the south to 1440 m to the north. Begnas lake watershed area comprises the former Begnas village development committee (VDC), Majthana VDC, ward 1–5 of Kalika VDC, and wards 8–11 of former Lekhnath Municipality. After the government’s recent reclassification of local administrative units, most parts of the watershed area lie in wards 28, 30, and 31 of the Pokhara-Lekhnath Municipality. The Begnas Lake watershed includes three distinct landforms: steep to very steep hill slopes to the north, valley to the floor to the south and south-east, and Begnas lake is located at the confluence of these two landforms. The total area of the Begnas lake watershed that feeds water and sediment to the lake is 49 km2, including the area’s socio-cultural and ecological landscape. The wetland has high biodiversity, which provides great aesthetic value and is an important tourist attraction. Locals generate income from ecotourism activities such as boating or other water sports in the lake. This lake is enlisted as a Ramsar site, a wetland of international importance under the Convention on Wetlands. The watershed is under different land use, including forestry, with agriculture being dominant. Furthermore, different areas of land within the watershed are under different management regimes, including private, community, and government ownership. The lake is under growing pressure from increasing populations and their demand for the products and services generated by the wetland and its catchment. The area has gone through a significant population increase where the number of households between 2001 and 2011 increased by 60% [30].

2.2. Data Collection

Participatory and exploratory research methods were used to collect data. The data collection was done in two stages, from February 2016 to March 2017. During the first stage, we visited the area to explain the purpose and objectives of this research, which helped us to establish a connection and trust with key informants and stakeholders. A thorough visit of the watershed, including upstream and downstream, was done to identify stakeholders and respondents. During the second stage, we administered questionnaires, key informant surveys, household surveys, and focus group discussions. Non-governmental organizations working in study areas such as LIBIRD, officials from District Forest Office and District Soil and Watershed Conservation Office, community foresters’ user groups, and members from fisheries groups were involved in key informants’ interviews and focus group discussions. Using simple random sampling, we surveyed 180 respondents, about 10 percent of the total population (n = 1780). These randomly selected respondents represent both upstream (n = 97) and downstream (n = 83) households. We also conducted two focus group discussions with Lekhnath Municipality, community forest user groups, and women’s groups representing both upstream and downstream.
The collected data were analyzed using Statistical Package for Social Sciences (SPSS version 21) and R. Both descriptive and analytical methods were used to analyze the data. Respondents were asked to rank the ecosystem services from 1 to 6, 1 being the most important, and six being the least important. Similarly, in the case of impacts, respondents were asked to rank from 1 to 4, 1 being the most important and 4 being the least important. Friedman’s test was used to compare the mean ranks. The logit regression model was used in identifying the factors that influence the implementation of PES in the area.
We used the logistic regression model to see the correlation between different socio-economic factors and locals’ interest in implementing and participating in PES mechanisms. The probability of the respondent’s attitude towards the implementation of PES and taking stake/participating in it or not depends on a set of variables X such that,
Prob (Y = 1) = f (βx)
Prob (Y = 0) = 1 − (βx)
Using the logistic distribution, we have,
Prob (Y = 1) = eβx/1 + eβx
= A (βx)
where A is the logistic cumulative distribution function
Then the probability model of the regression:
E(Y/Xi) = 0[1 − F (βx)] + 1[f (βx)] = F (βx)
where Xi is defined as the set of variables including:
Y = βo + β1X1 + β2X2 + β3X3 + β11X11
where,
Y = dependent variable taking values of 0 and 1,
1 = interested to participate in PES mechanism
0 = otherwise,
X = variables

3. Results

Among the total respondents (n = 180), 53.6% of the respondents were male, and 46.4% were female, while in downstream (n = 83), 44.6% of the respondents were male, and 55.4% were female (Table 1). The mean household size was 5.17, mean age was 41.65 with a maximum of 82 and a minimum of 12 years, mean year of schooling was 6.5 with a minimum of 0 and maximum of 18 years, mean walking distance was 33.24 min and the average time the respondents had lived in the area was 29.17 years with a minimum of 1 and maximum of 80. Farming was seen as a major occupation in both upstream and downstream communities, and fishing was not the primary occupation for most respondents. Most of the respondents had an income of less than 20,000 Nrs (USD 170) per month (Table 1).

3.1. Existing Ecosystem Services Provided by Begnas Lake

We found that, like other watersheds, Begnas Lake provides all major types of ecosystem services, which include supporting, regulatory, cultural, and provisioning services (Table 2).

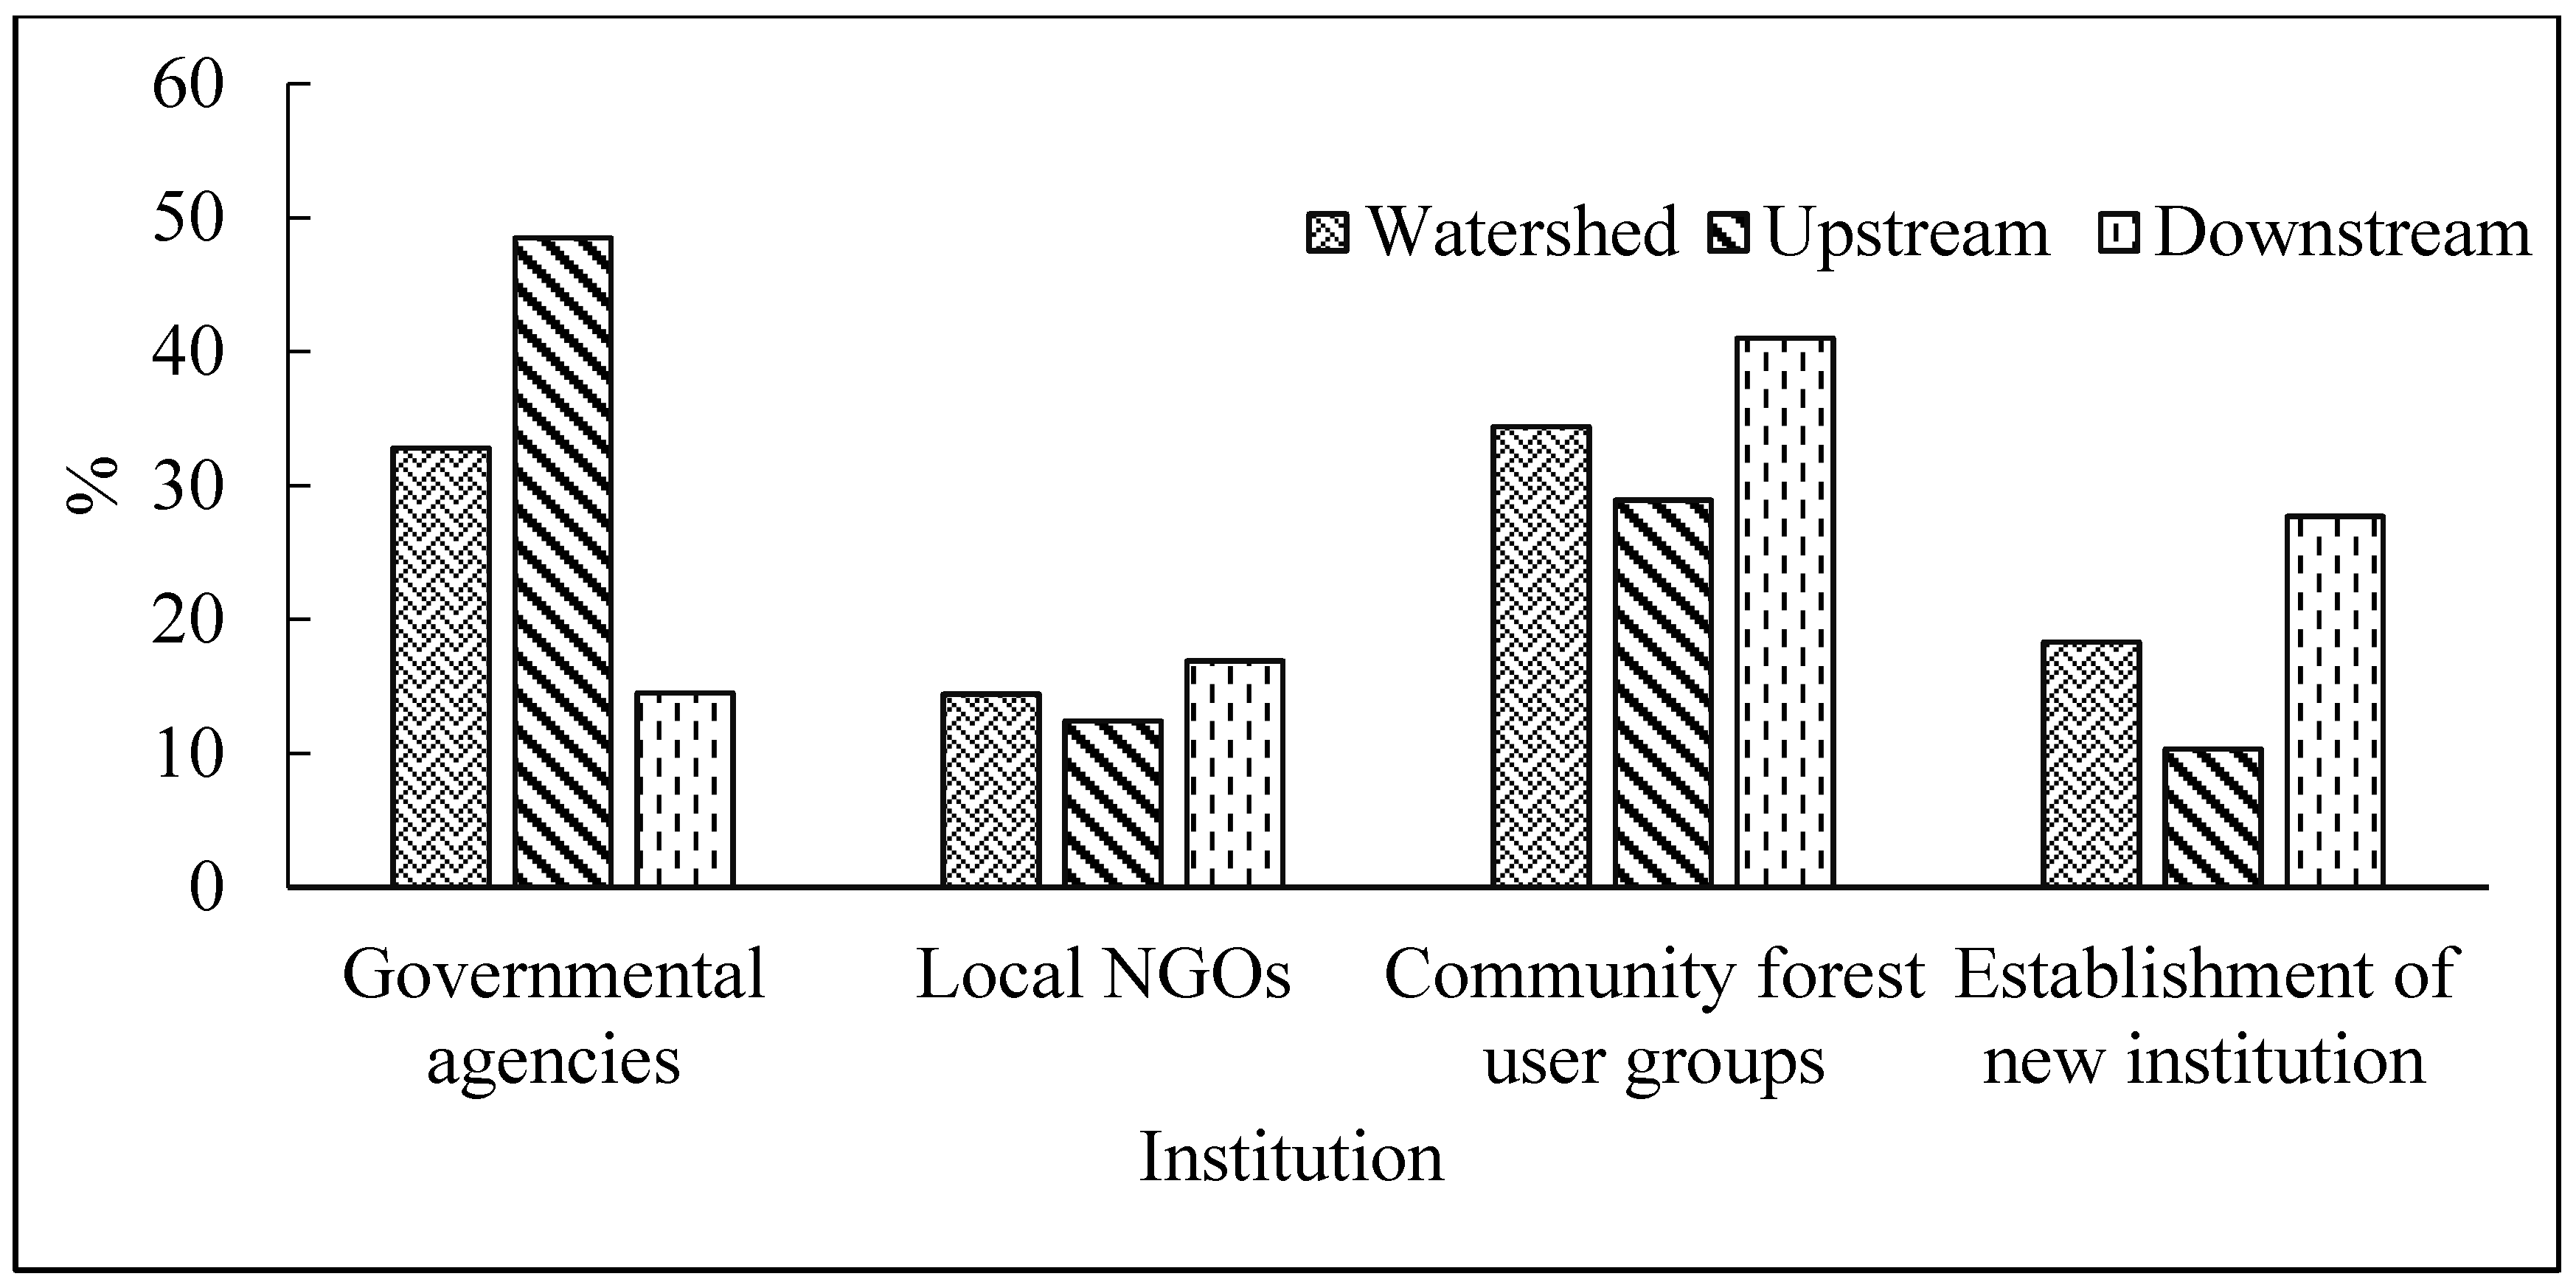
3.2. Institutional Preference for Implementation of PES Mechanism

Different types of institutions were found actively involved in the area. The existing institutions with different working themes identified were community involvement committees, the boater’s committee, youth clubs, community forest users’ groups, the teacher-parents association, drinking water user’s committee, and financial cooperatives. Among the total respondents (n = 180), 34.4% of the respondents preferred community forest users’ groups, and 32.8% preferred governmental organizations such as the District Forest Office as a preferred institution for implementing PES mechanisms (Figure 2).
While calculating the result of the upstream and downstream samples separately, the preferences of the respondents differed (Figure 2).

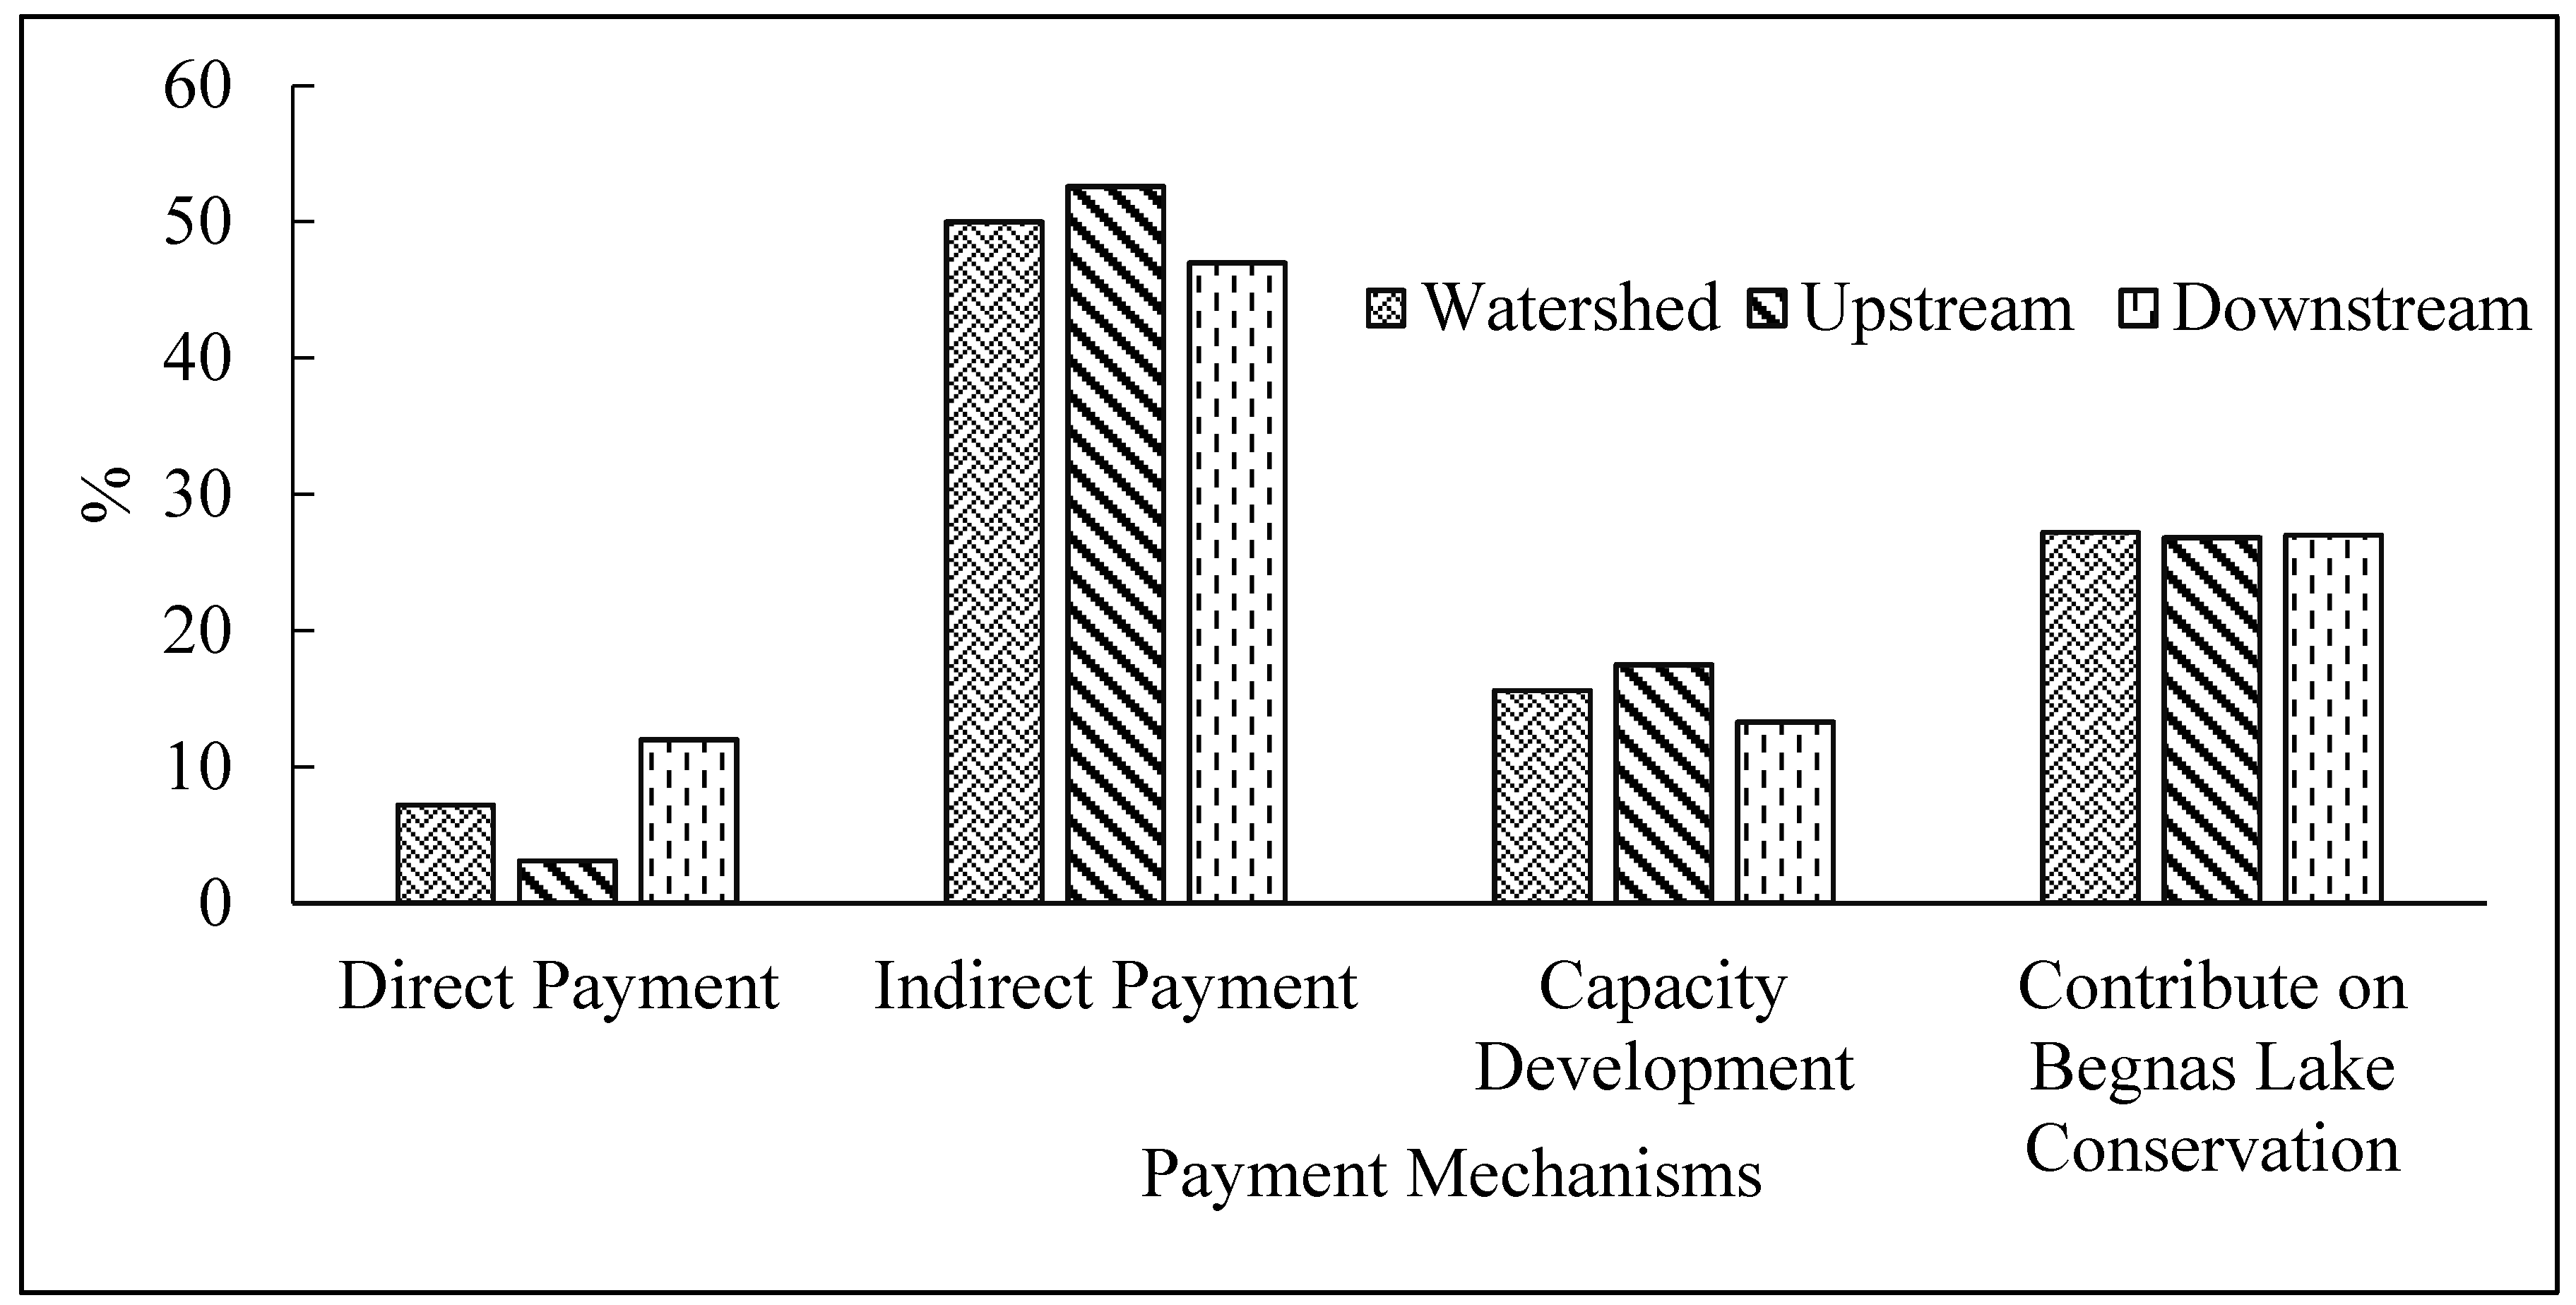
3.3. Preference of Potential Compensation Mechanism

Fifty percent of the total respondents (n = 180) think that there should be an indirect payment (school scholarships, community development, etc.) as a means of compensation. Only 7.2% of the respondents preferred direct deposit to a community member’s bank account. (Figure 3).

3.4. Factors Affecting Locals’ Interest in Implementing PES

Regression analysis showed that the locals who know (knowledgeable) ecosystem services and PES are more in favor of implementing PES mechanism in their area (Table 3). We found high correlation between factors: knowledge about ecosystem services, knowledge about PES, and attitudes towards implementing PES mechanism in Begnas Lake. Factors such as education level and living time in the area were also significantly correlated with the attitude towards the implementation of PES mechanisms (Table 3). Upstream respondents with knowledge about PES were found to be more supportive of the implementation of PES in their community (Table S1). Whereas factors such as age, living time in the area, and distance from house to the lake were found to be positively correlated with locals’ attitude toward implementing PES in downstream (Table S2).

3.5. Factors Affecting Locals’ Interest in Taking a Stake in PES Mechanisms if Implemented

Locals with higher education having knowledge about PES were found to be more positive towards taking a stake in PES mechanisms if implemented in their watershed (Table 4). We found a negative correlation between family size and interest in taking a stake in PES mechanisms (Table 4). In upstream, we found factors such as education, living time in the area, and ownership of house negatively correlated with locals’ attitude towards participating/taking stake for PES (Table S3). While in downstream, factors such as age, gender, size of family, marital status, living time in the area, ownership of the house, and income were found to negatively correlate with the attitude towards participating in PES mechanism if implemented (Table S4).

4. Discussion

From our results, several socio-economic factors were found as the key influencers on locals’ attitudes to participate and implement the PES mechanisms in their area. The results revealed that key factors affecting locals’ attitudes to implement and participate in PES include knowledge about PES, knowledge of ecosystem services, ownership, income, distance to the lake, family size, gender, and age. It is found that locals with a high level of awareness about ecosystem services and PES are more likely to accept the implementation of PES mechanisms in their area and actively take a stake in these mechanisms. Similar results were reported by [9], where communities with easy access to media, which create awareness about ecosystem service programs, tended to participate in such programs. Our results also suggest that locals with lower education, income, and new to the upstream areas are more likely not to take an important stake in the PES mechanism. While in downstream, we found age, gender, and size of the family affect the attitude of locals taking a stake in PES mechanisms. This might be the case because the upstream area is more rural as compared to downstream regions. They are more concerned about fulfilling their livelihood needs, which are primarily dependent on the forest, while in downstream young people are more aware of the current paradigm in conservation. Respondents from both upstream and downstream are directly involved in income generation activities from Begnas Lake. Overall, our results suggest that the socio-demographic factors play important roles in the implementation and success of PES mechanism. This also indicates that we need to understand the socio-demography of a particular area for the effective implementation of PES. In addition to socio-demographic factors, the availability of institutions for payment mechanisms is also a crucial factor that determines the success of PES.
Institutional and legal factors associated with PES are two major and important factors to successfully implement PES mechanisms. Institutions play a notable role in any PES mechanisms and schemes since the PES scheme cannot work in a vacuum [15]. Ensuring the successful implementation of policy and law is the key purpose of any institution, therefore, the successful execution of a PES scheme requires an effective institutional framework. Various formal and informal institutions have evolved in the Begnas Lake watershed, which is associated in one way or another with ecosystem service and goods. Local people from the study area want to implement PES mechanisms through existing institutions, most likely because it provides the quickest way of getting benefits from PES. Other possible reasons for adopting pre-existing local institutions are that they function based on local knowledge systems and economic development builds off of the pre-existing institutions that communities have rather than trying to reinvent them. Moreover, there exists a strong relationship between respondents and local institutions enhanced with traditional, cultural, social, and political bonding [31,32].
In countries like Nepal, where an umbrella legislative approach does not exist, the local government can play an important role in making PES successful [19]. However, the question of whether the existing institutions are capable of handling the mechanism can not be answered until a rigorous institutional analysis is carried out or unless these institutions get fully engaged in the PES. The majority of respondents wanted community forest users’ groups to lead the implementation of PES mechanisms mostly because this has proven to be the most successful institution for resource management in Nepal’s mid-hills [33,34,35]. This view resonates with existing literature, which argues that CFUGs are well—established local organizations at the grassroots level that could serve as an effective platform for sustainable community development and livelihood enhancement under PES schemes [12,19]. Our results also show that community forestry is not the preferred institution upstream. Instead, they preferred the involvement of governmental agencies. We found that this perception of the community from the upstream existed because PES is a new concept in the upstream region, and people think that it requires huge administrative work. And they believe CFUGs are not well advanced to carry out large administrative works and implement PES successfully.
Community-based resource management has successfully conserved, maintained, and enhanced ecosystem goods and services in rural Nepal; however, debates and uncertainties exist regarding the equitable sharing of benefits generated from such services, institutional mechanisms, and policies governing the process [36]. There are still debates on CFUG’s performance and capacity in climate change adaptation and mitigation issues. This might be another challenge to run PES mechanisms without any technical and financial assistance. A governmental body is needed to secure the proposed approach in a sustainable manner and provide financial and technical assistance to enhance the institutional capacity. Government’s involvement in institutional capacity building will also help to ensure the accountability and transparency of institutions. While multiple stakeholders benefit from utilizing wetland resources, the management of the resources is mostly guided by local institutions in line with local and national policies. The lack of proper institutional frameworks and governance in resource management will further challenge the evaluation of the benefits generated from these ecosystem services.
To fully realize the benefits through engagement in payments for ecosystem services, properly functioning institutions and clear legislative frameworks are prerequisites that could identify, communicate, and link service providers and buyers. Enabling the local institutions from the local and central bodies and understanding the socio-demographic status of the area can strengthen the capabilities of locally available institutions and sustain the mechanism. The collaboration between local institutions and governmental authorities strengthens the relationship between the government and local people to a great extent.

5. Conclusions

The provisioning and cultural services of Begnas Lake are the most popular ecosystem services provided by the lake. Mainly local communities have benefited from the water provided by the lake that they use for irrigating fields and fisheries. Besides, many households benefit from the lake’s recreational services, particularly employment and alternative income generating opportunities as a result of tourism activities in the wetland. This, along with other services, has sustained their livelihood. Both the upstream and downstream communities are willing to conserve the watershed and implement the PES mechanism. Various factors such as age, education level, income, and distance from house to lake governed respondents’ interest in implementing the PES and taking part in it. The watershed area has faced a significant increase in population where the number of households increased by 60% between 2001 and 2011 [30]. This increase in population has put high pressure on watershed areas for different livelihood components. As our results suggest that respondents new to the area are less likely to take an important stake in PES mechanism, the increase in population might hinder the effective implementation of PES in the area.
There were differing views on the choice of institutions when it comes to implementing PES mechanisms. The majority of upstream respondents believed that community forestry was the most suitable institution, while people living in the downstream region preferred other government institutions to implement PES mechanisms. The indirect payment was the most preferred PES mechanism by the local communities in the Begnas area. This study suggests that there are adequate pre-existing institutions at the local level that could play an important role in successfully implementing PES mechanisms. We recommend that strengthening such institutions, formulating a clear legislative framework, and conducive policy ambiance is essential before making them involved in the PES mechanism.

Supplementary Materials

The following are available online at https://0-www-mdpi-com.brum.beds.ac.uk/2673-4060/2/1/6/s1, Table S1: Logistic regression examining correlation between socio-demographic variables and positive attitudes toward PES implementation in Begnas lake (Upstream). Table S2: Logistic regression examining correlation between socio-demographic variables and positive attitudes toward PES implementation in Begnas lake (Downstream). Table S3: Logistic regression examining the correlation between socio-demographic variables and positive attitudes toward participating/taking stake for PES in Begnas lake (upstream). Table S4: Logistic regression examining the correlation between socio-demographic variables and attitudes toward participating/taking stake for PES in Begnas Lake (Downstream).

Author Contributions

Conceptualization, B.P. and S.U.; methodology, B.P.; software, S.U.; validation, S.U., B.B.K.C. and S.A.; formal analysis, B.P.; investigation, B.P.; resources, S.U.; data curation, B.P.; writing—original draft preparation, B.P.; writing—review and editing, B.P., S.U., S.A., B.B.K.C.; supervision, B.B.K.C. All authors have read and agreed to the published version of the manuscript.

Funding

This research was funded by SeedTree and NORHED-SURNEM IOF project.

Institutional Review Board Statement

The study was conducted according to the guidelines of the Tribhuvan University, Institute of Forestry, Pokhara Campus’s Review Board.

Informed Consent Statement

Informed consent was obtained from all subjects involved in the study.

Data Availability Statement

No available data.

Conflicts of Interest

The authors declare no conflict of interest. The funders had no role in the design of the study; in the collection, analyses, or interpretation of data; in the writing of the manuscript, or in the decision to publish the results.

References

  1. Costanza, R.; Arge, R.; De Groot, R.; Farberk, S.; Grasso, M.; Hannon, B.; Limburg, K.; Naeem, S.; O’Neill, R.V.; Paruelo, J.; et al. The value of the world ’ s ecosystem services and natural capital. Nature 1997, 387, 253–260. [Google Scholar] [CrossRef]
  2. Millenium Ecosystem Assessment. Ecosystems and Human Well-Being: Synthesis; Island Press: Washington, DC, USA, 2005; ISBN 1597260401. [Google Scholar]
  3. Farley, J.; Costanza, R. Payments for ecosystem services: From local to global. Ecol. Econ. 2010, 69, 2060–2068. [Google Scholar] [CrossRef]
  4. Robertson, G.P.; Gross, K.L.; Hamilton, S.K.; Landis, D.A.; Schmidt, T.M.; Snapp, S.S.; Swinton, S.M. Farming for ecosystem services: An ecological approach to production agriculture. Bioscience 2014, 64, 404–415. [Google Scholar] [CrossRef]
  5. Yang, H.; Yang, W.; Zhang, J.; Connor, T.; Liu, J. (Jack) Pathways from payments for ecosystem services program to socioeconomic outcomes. Sci. Adv. 2018, 4, 1–8. [Google Scholar] [CrossRef] [Green Version]
  6. Karami, O.; Yazdani, S.; Saleh, I.; Rafiee, H.; Riahi, A. A comparison of Zayandehrood River water values for agriculture and the environment. River Res. Appl. 2020, 1–7. [Google Scholar] [CrossRef]
  7. Wunder, S.; Engel, S.; Pagiola, S. Taking stock: A comparative analysis of payments for environmental services programs in developed and developing countries. Ecol. Econ. 2008, 65, 834–852. [Google Scholar] [CrossRef]
  8. Adhikari, B.; Agrawal, A. Understanding the social and ecological outcomes of PES projects: A review and an analysis. Conserv. Soc. 2013, 11, 359–374. [Google Scholar] [CrossRef]
  9. Bremer, L.L.; Farley, K.A.; Lopez-Carr, D. What factors influence participation in payment for ecosystem services programs? An evaluation of Ecuador’s SocioPáramo program. Land Use Policy 2014, 36, 122–133. [Google Scholar] [CrossRef]
  10. Salzman, J.; Bennett, G.; Carroll, N.; Goldstein, A.; Jenkins, M. The global status and trends of Payments for Ecosystem Services. Nat. Sustain. 2018, 1, 136–144. [Google Scholar] [CrossRef]
  11. Yu, H.; Xie, W.; Yang, L.; Du, A.; Almeida, C.M.V.B.; Wang, Y. From payments for ecosystem services to eco-compensation: Conceptual change or paradigm shift? Sci. Total Environ. 2020, 700, 134627. [Google Scholar] [CrossRef]
  12. Bhatta, L.D.; Van Oort, B.E.H.; Rucevska, I.; Baral, H. Payment for ecosystem services: Possible instrument for managing ecosystem services in Nepal. Int. J. Biodivers. Sci. Ecosyst. Serv. Manag. 2014, 10, 289–299. [Google Scholar] [CrossRef]
  13. Engel, S.; Pagiola, S.; Wunder, S. Designing payments for environmental services in theory and practice: An overview of the issues. Ecol. Econ. 2008, 65, 663–674. [Google Scholar] [CrossRef]
  14. McAfee, K.; Shapiro, E.N. Payments for ecosystem services in Mexico: Nature, neoliberalism, social movements, and the state. Ann. Assoc. Am. Geogr. 2010, 100, 579–599. [Google Scholar] [CrossRef]
  15. Fauzi, A.; Anna, Z. The complexity of the institution of payment for environmental services: A case study of two Indonesian PES schemes. Ecosyst. Serv. 2013, 6, 54–63. [Google Scholar] [CrossRef] [Green Version]
  16. Stapp, J.R.; Lilieholm, R.J.; Leahy, J.; Upadhaya, S. Linking attitudes, policy, and forest cover change in buffer zone communities of Chitwan National Park, Nepal. Environ. Manag. 2016, 57. [Google Scholar] [CrossRef] [Green Version]
  17. Gauli, K.; Ghimire, P.L. Payment of Ecosystem Services in Nepal: Status, Prospects and Ways Forward; MSFP: Kathmandu, Nepal, 2019. [Google Scholar]
  18. Gauli, B.; Upadhaya, S. Reducing emissions from deforestation and forest degradation (REDD) in Nepal: A review. Initiation 2014, 5, 75–83. [Google Scholar] [CrossRef]
  19. Bhatta, L.D.; Khadgi, A.; Rai, R.K.; Tamang, B.; Timalsina, K.; Wahid, S. Designing community-based payment scheme for ecosystem services: A case from Koshi Hills, Nepal. Environ. Dev. Sustain. 2018, 20, 1831–1848. [Google Scholar] [CrossRef]
  20. Upadhaya, S.; Chalise, L.; Paudel, R.P. High altitude ramsar sites of Nepal. Initiation 2010, 3, 135–148. [Google Scholar] [CrossRef]
  21. Adhikari, S.; Shrestha, S.M.; Singh, R.; Upadhaya, S.; Stapp, J.R. Land use change at sub-watershed level. Hydrol. Curr. Res. 2016, 7, 3–7. [Google Scholar] [CrossRef] [Green Version]
  22. Huang, M.; Upadhyaya, S. Watershed-Based Payment for Environmental Services in Asia; SANREM CRSP Working Paper; SANREM CRSP: Blacksburg, VA, USA, 2007. [Google Scholar]
  23. Merz, J.; Nakarmi, G.; Shrestha, S.; Dahal, B.M.; Dongol, B.S.; Schaffner, M.; Shakya, S.; Sharma, S.; Weingartner, R. Public water sources in rural watersheds of Nepal’s Middle Mountains: Issues and constraints. Environ. Manag. 2004, 34, 26–37. [Google Scholar] [CrossRef] [PubMed]
  24. Pradhan, N.; Providoli, I.; Regmi, B.; Kafle, G. Valuing Water and Its Ecological Services in Rural Landscapes: A Case Study from Nepal; Mount. For. Bulletin: Kathmandu, Nepal, 2010. [Google Scholar]
  25. Gutman, P. Ecosystem services: Foundations for a new rural-urban compact. Ecol. Econ. 2007, 62, 383–387. [Google Scholar] [CrossRef]
  26. Kumar, S.; Managi, S. Compensation for environmental services and intergovernmental fiscal transfers: The case of India. Ecol. Econ. 2009, 68, 3052–3059. [Google Scholar] [CrossRef]
  27. Kosoy, N.; Corbera, E. Payments for ecosystem services as commodity fetishism. Ecol. Econ. 2010, 69, 1228–1236. [Google Scholar] [CrossRef]
  28. Van Hecken, G.; Bastiaensen, J.; Vásquez, W.F. The viability of local payments for watershed services: Empirical evidence from Matiguás, Nicaragua. Ecol. Econ. 2012, 74, 169–176. [Google Scholar] [CrossRef]
  29. Cranford, M.; Mourato, S. Community conservation and a two-stage approach to payments for ecosystem services. Ecol. Econ. 2011, 71, 89–98. [Google Scholar] [CrossRef] [Green Version]
  30. CBS. National Population and Household Survey, 2011; Central Bureau of Statistics: Kathmandu, Nepal, 2014. [Google Scholar]
  31. LI-BIRD. Begnas Lake Conservation Fund Management Guidelines 2016; LI-BIRD: Pokhara, Nepal, 2016. [Google Scholar]
  32. Khanal, P.; Wagle, B.H.; Upadhaya, S.; Ghimire, P.; Acharya, S. Perceived climate change impacts and adaptation strategy of indigenous community (Chepangs ) in rural mid-hills of Nepal. For. J. Inst. For. 2019, 16, 48–61. [Google Scholar] [CrossRef]
  33. Lund, J.F.; Baral, K.; Bhandari, N.S.; Chhetri, B.B.K.; Larsen, H.O.; Nielsen, Ø.J.; Puri, L.; Rutt, R.L.; Treue, T. Who benefits from taxation of forest products in Nepal’s community forests? For. Policy Econ. 2014, 38, 119–125. [Google Scholar] [CrossRef]
  34. Smith, P.D.; Bahadur, B.; Chhetri, K. Meeting the Needs of Nepal’s Poor; Oxford Academic: Oxford, UK, 2003. [Google Scholar]
  35. Baynes, J.; Herbohn, J.; Smith, C.; Fisher, R.; Bray, D. Key factors which influence the success of community forestry in developing countries. Glob. Environ. Chang. 2015, 35, 226–238. [Google Scholar] [CrossRef]
  36. Stapp, J.R.; Lilieholm, R.J.; Upadhaya, S.; Johnson, T. Evaluating the impacts of forest management policies and community-level institutions in the buffer zone of Chitwan National Park, Nepal. J. Sustain. For. 2015. [Google Scholar] [CrossRef]
Figure 1. Location of Begnas Lake watershed. (Source: LIBIRD).
World 02 00006 g001
Figure 2. Preference of potential institutions to follow compensation mechanisms (n = 180 for the watershed, n = 97 for upstream, n = 83 for downstream).
World 02 00006 g002
Figure 3. Preference of potential compensation mechanism.
World 02 00006 g003
Table 1. Demographic information and descriptive statistics about the respondents.
VariablesMaxMinMeanS.E
Age821441.61.27
Family size1215.10.14
Walking dis (minute)129733.21.69
Year of schooling1806.50.37
Duration of the residence (year)80129.11.50
Socio-economic characteristicsTotal(%)Upstream(%)Downstream(%)
(n = 83)
(n = 180)(n = 97)
Sex
Male89(49.4)52(53.6)37(44.6)
Female91(50.6)45(46.4)46(55.4)
Occupation
Farming88(48.9)50(51.5)38(45.8)
Fishing3(1.7)2(2.1)1(1.2)
Governmental14(7.8)7(7.2)7(8.4)
Non-governmental44(24.)18(18.8)26(31.3)
Self employed21(17.2)20(20.6)11(13.3)
Income (Month)
<10,00066(26.7)46(47.4)20(24.1)
1000–20,00094(52.2)39(40.2)55(66.3)
20,000–50,00018(10)12(12.2)6(7.2)
>50,00029(1.1) 2(2.4)
Table 2. Different ecosystem services provided by Begnas Lake ** denotes records from direct observation and * denotes from people’s ranking.
Ecosystem Services TypeServices Provided by Begnas Lake
Supporting services● Natural purification of water *
● Habitat for fish and wildlife *
Regulatory services● Forest and soil conservation *
● Erosion control *
Cultural services● Beautiful landscape *
● Recreation *
● Ecotourism *
Provisioning services● Water **
● Fish **
Table 3. Logistic regression examining the correlation between various socioeconomic factors and attitudes toward PES implementation in Begnas Lake watershed.
VariablesBSEP
Age−0.010.010.29
Gender (male = 1)−0.10.370.66
Family size−0.080.090.35
Distance from house to lake0.010.000.14
Martial Status (married = 1)−0.80.620.19
Education0.120.050.01
Major Occupation0.090.160.56
Income0.350.280.20
Living time0.020.010.02
Ownership of house0.340.690.62
Knowledge of ecosystem services (yes = 1)1.500.420.000
Know PES (yes = 1)2.370.630.000
n = 180, B = logistic regression coefficient, SE = standard error, p = significance value.
Table 4. Logistic regression examining the correlation between socio-demographic variables and positive attitudes toward participating/taking stake for PES in Begnas Lake.
FactorsBSEP
Age0.001 0.63
Gender0.100.0153030.83
Family size−0.090.3622240.25
Distance to lake0.0060.0980220.43
Marital Status0.090.5423650.86
Education0.090.0087660.03
Major Occupation0.20.0460540.10
Income0.20.1528410.28
Living time in the area−0.0010.2609770.89
Ownership of house−0.7660.0104960.31
Knowledge of ecosystem services0.200.7631670.31
Know PES1.60.3963810.000
n = 180, B = logistic regression coefficient, SE = standard error, p = significance value.
Publisher’s Note: MDPI stays neutral with regard to jurisdictional claims in published maps and institutional affiliations.

