
Assessing a Nation’s Competitiveness in Global Food Innovation: Creating a Global Food Innovation Index


Abstract
:1. Introduction
2. Methods and Limitations
2.1. Benchmarking as the Chosen Methodology
2.2. Creation of Pillars
2.3. Weighting of Variables
2.4. Data Collection Methods
2.5. Limitations
3. Results
3.1. Regulatory Environment
3.1.1. Product Approval Period
3.1.2. Food Safety Assurance Measures
3.1.3. Transparency and Communication
3.2. Environmental Restrictions
3.2.1. Waste Management
3.2.2. Environmental Risk Assessments and Environmental Protection Acts
3.3. Business Competitiveness
3.3.1. Trade Balance: Food Items (Exports-Imports)
3.3.2. CPI Food Prices
3.3.3. Economic Indicators
3.4. Capital and Credit Availability
3.4.1. Government Grants and Loans
3.4.2. Foreign Direct Investment per Capita
3.5. Distribution Networks
3.5.1. Large-Scale Competitors
3.5.2. Private Label
3.5.3. Shipping Capacity
3.6. Training and Education
3.6.1. Student Incentives
3.6.2. Education Trends
3.6.3. Employment Trends
3.6.4. Job Retraining
3.7. Diversity and Inclusion
3.7.1. Incentives and Equitable Training Programs
3.7.2. Pay Gap
3.8. Proprietary Protection
3.8.1. Patent Procedures
3.8.2. Patent Protection, Enforcement and Monitoring
3.9. Research and Development
3.9.1. Federal Budget
3.9.2. National Data Strategy
3.9.3. Data Privacy and Restrictions
4. Discussion
4.1. Determining Final Rankings
4.2. Applying the Index: Canada as an Example
5. Conclusions
Author Contributions
Funding
Institutional Review Board Statement
Data Availability Statement
Conflicts of Interest
Appendix A. Indicator Descriptions
Appendix A.1. Regulatory Environment
Appendix A.1.1. Approval Periods for New and Novel Food Products
Appendix A.1.2. Food Safety Assurance Measures
Appendix A.1.3. Transparency and Communication
Appendix A.2. Environmental Restrictions
Appendix A.2.1. Waste Management and Packaging Laws
Appendix A.2.2. Environmental Risk Assessments
Appendix B. Business Competitiveness
Appendix B.1. Economic Indicators
Appendix B.1.1. Exportation and Importation of Food Products
Appendix B.1.2. Consumer Price Index
Appendix B.1.3. Annual Long-Term Interest Rate
Appendix B.1.4. Annual Exchange Rates
Appendix B.1.5. Labour Productivity
Appendix B.2. Capital Credit and Credit Availability
Appendix B.2.1. Government Grants and Loans
Appendix B.2.2. Foreign Investment
Appendix B.3. Distribution Networks
Appendix B.3.1. Number of Large-Scale Competitors
Appendix B.3.2. Prevalence of Private Labels
Appendix B.3.3. Shipping Capacity
Appendix C. Market Readiness
Appendix C.1. Training and Education
Appendix C.1.1. Incentives for New Students
Appendix C.1.2. Education Trends
Appendix C.1.3. Employment Trends
Appendix C.1.4. Job Retraining Programs
Appendix C.2. Diversity and Inclusion
Appendix C.2.1. Incentives and Equitable Training Programs
Appendix C.2.2. Pay Gap Analysis
Appendix D. Intellectual Property and Research and Development
Appendix D.1. Proprietary Protection
Appendix D.1.1. Patent Procedures
Appendix D.1.2. Patent Protection, Enforcement, and Monitoring
Appendix D.2. Research and Development
Appendix D.2.1. Federal Budgets for Research Spending
Appendix D.2.2. National Data Strategies
Appendix D.2.3. Data Privacy and Restrictions on Access
References
- Gagliardi, D.; Niglia, F.; Battistella, C. Evaluation and Design of Innovation Policies in the Agro-Food Sector: An Application of Multilevel Self-Regulating Agents. Technol. Forecast. Soc. Chang. 2014, 85, 40–57. [Google Scholar]
- DeMaria, F.; Zezza, A. Drivers and Barriers of Process Innovation in the EU Manufacturing Food Processing Industry: Exploring the Role of Energy Policies. Bio-Based Appl. Econ. 2020, 9, 25–52. [Google Scholar]
- Esbjerg, L.; Burt, S.; Pearse, H.; Glanz-Chanos, V. Retailers and Technology-driven Innovation in the Food Retail Sector. Br. Food J. 2016, 188, 1370–1383. [Google Scholar]
- Knickel, M.; Neuberger, S.; Klerkx, L.; Knickel, K.; Brunori, G.; Saatkamp, H. Strengthening the Role of Academic Institutions and Innovation Brokers in Agri-Food Innovation: Towards Hybridisation in Cross-Broder Cooperation. Sustainability 2021, 13, 4899. [Google Scholar]
- Grimsby, S.; Kure, C.F. How Open is Food Innovation: The Crispbread Case. Br. Food J. 2018, 121, 950–963. [Google Scholar]
- Kowalska, H.; Czajkowska, K.; Cichowska, J.; Lenart, A. What’s New in Biopotential of Fuirt and Vegetable By-Products Applied in the Food Processing Industry. Trends Food Sci. Technol. 2017, 67, 150–159. [Google Scholar]
- Gouranga, G.D. Food-feed-biofuel Trilemma: Biotechnological Innovation Policy for Sustainable Development. J. Policy Model. 2017, 39, 410–442. [Google Scholar]
- Albertson, L.; Wiedmann, K.-P.; Schmidt, S. The Impact of Innovation-Related Perception on Consumer Acceptance of Food Innovations—Development of an Integrated Framework of the Consumer Acceptance Process. Food Qual. Prefer. 2020, 84, 103958. [Google Scholar]
- Gemen, R.; Breda, J.; Coutinho, D.; Fernández Celemín, L.; Khan, S.; Kugelberg, S.; Newton, R.; Rowe, G.; Strähle, M.; Timotijevic, L.; et al. Stakeholder Engagement in Food and Health Innovation Research Programming—Key Learnings and Policy Recommendations from the INPROFOOD Project. Nutr. Bull. 2015, 40, 54–65. [Google Scholar]
- Luo, J.; Guo, H.; Jia, F. Technological Innovation in Agricultural Co-operatives in China: Implications for Agro-Food Innovation Policies. Food Policy 2017, 73, 19–33. [Google Scholar]
- Le Vallé, J.-C.; Charlebois, S. Benchmarking Global Food Safety Performances: The Era of Risk Intelligence. J. Food Prot. 2015, 78, 1896–1913. [Google Scholar]
- Charlebois, S.; MacKay, G. World Ranking: 2010 Food Safety Performance. Johnson-Shoyama Graduate School of Public Policy, Regina, Saskatchewan. 2010. Available online: http://www.schoolofpublicpolicy.sk.ca/_documents/_publications_reports/food_safety_final.pdf (accessed on 1 August 2021).
- Charlebois, S.; Yost, C. Food safety performance world ranking: How Canada is doing. In Research Network on Food Systems; University of Regina: Regina, SK, Canada, 2008. [Google Scholar]
- Vanderlee, L.; Goorang, S.; Karbasy, K.; Vandevijvere, S.; L’Abbé, M.R. Policies to Create Healthier Food Environments in Canada: Experts’ Evaluation and Prioritized Actions Using the Healthy Food Environment Policy Index (Food-EPI). Environ. Res. Public Health 2019, 16, 4473. [Google Scholar]
- European Comission. Legislation. Available online: https://ec.europa.eu/food/safety/novel_food/legislation_en (accessed on 1 August 2021).
- Official Journal of the European Union. Regulation (EU) on Novel Foods (2015/2283). 2015. Available online: https://eur-lex.europa.eu/legal-content/EN/TXT/HTML/?uri=CELEX:32015R2283&from=EN (accessed on 1 August 2021).
- United Kingdom. Novel Foods. Food Standards Agency. Available online: http://www.food.gov.uk/business-guidance/novel-foods (accessed on 1 August 2021).
- Japan. Food Additives. Ministry of Health, Labour and Welfare. Available online: https://www.mhlw.go.jp/stf/seisakunitsuite/bunya/kenkou_iryou/shokuhin/syokuten/index_00012.html (accessed on 1 August 2021).
- Japan. Food. Ministry of Health, Labour and Welfare. Available online: https://www.mhlw.go.jp/english/topics/foodsafety/ (accessed on 1 August 2021).
- Australia. Food Standards Australia New Zealand: Application Handbook. Food Standards Australia New Zealand. 2016. Available online: https://www.foodstandards.gov.au/code/changes/pages/applicationshandbook.aspx (accessed on 1 August 2021).
- Canada. The Food Directorate’s Pre-Market Submission Management Process for Food Additives, Infant Formulas and Novel Foods. Health Canada. 2016. Available online: https://www.canada.ca/en/health-canada/services/food-nutrition/public-involvement-partnerships/food-directorate-market-submission-management-process-food-additives-infant-formulas-novel-foods.html (accessed on 1 August 2021).
- Canada. Food Additive Submission Checklist. 2008. Available online: https://www.canada.ca/en/health-canada/services/food-nutrition/reports-publications/appendix-food-additive-submission-checklist-guide-preparation-submissions-food-additives.html (accessed on 1 August 2021).
- Food and Consumer Products of Canada. Industry Sustainability and Competitiveness Study. Available online: https://www.fcpc.ca/Industry-Resources/Industry-Sustainability-Competitiveness-Study (accessed on 1 August 2021).
- United States. Ingredients, Additives, GRAS & Packaging Guidance Documents & Regulatory Information. Food and Drug Administration. 2019. Available online: http://www.fda.gov/food/guidance-documents-regulatory-information-topic-food-and-dietary-supplements/ingredients-additives-gras-packaging-guidance-documents-regulatory-information (accessed on 1 August 2021).
- United States. Guidance for Industry: Questions and Answers about the Food Additive or Color Additive Petition Process. Food and Drug Administration. 2020. Available online: http://www.fda.gov/regulatory-information/search-fda-guidance-documents/guidance-industry-questions-and-answers-about-food-additive-or-color-additive-petition-process (accessed on 1 August 2021).
- Mexico. Los más Buscado. Government of Mexico. Available online: https://www.gob.mx/tramites (accessed on 1 August 2021).
- Canada. Centre of Administration for Permissions. Canadian Food Inspection Agency. 2015. Available online: https://inspection.gc.ca/about-the-cfia/permits-licences-and-approvals/centre-of-administration-for-permissions/eng/1395348583779/1395348638922 (accessed on 1 August 2021).
- Canada. Regulatory Readiness: A Decision Model for Canadian Food Products. Agriculture and Agri-Food Canada. 2011. Available online: http://www.agr.gc.ca/eng/industry-markets-and-trade/canadian-agri-food-sector-intelligence/processed-food-and-beverages/trends-and-market-opportunities-for-the-food-processing-sector/regulatory-readiness-a-decision-model-for-canadian-food-products/?id=1311966040606 (accessed on 1 August 2021).
- Canada. Canada’s Regulatory System for Foods with Health Benefits: An Overview for Industry. Agriculture and Agri-Food Canada. 2010. Available online: http://www.agr.gc.ca/eng/industry-markets-and-trade/canadian-agri-food-sector-intelligence/processed-food-and-beverages/trends-and-market-opportunities-for-the-food-processing-sector/canada-s-regulatory-system-for-foods-with-health-benefits-an-overview-for-industry/?id=1274467299466 (accessed on 1 August 2021).
- Canada. Novel Foods. Health Canada. 2010. Available online: https://www.canada.ca/en/health-canada/services/food-nutrition/genetically-modified-foods-other-novel-foods/factsheets-frequently-asked-questions/novel-foods.html (accessed on 1 August 2021).
- Hale, G. Regulatory system in North America: Diplomacy navigating asymmetries. Am. Rev. Can. Stud. 2019, 1, 123–149. [Google Scholar] [CrossRef]
- European Food Safety Authority. Novel Food. Available online: https://www.efsa.europa.eu/en/topics/topic/novel-food (accessed on 1 August 2021).
- Germany. Federal Ministry of Food and Agriculture. Federal Ministry of Food and Agriculture. Available online: https://www.bmel.de/EN/Homepage/homepage_node.html (accessed on 1 August 2021).
- Germany. Novel Food. Available online: https://www.bfr.bund.de/en/novel_food-1809.html (accessed on 1 August 2021).
- Netherlands. Food Safety Requirements. Government of the Netherlands. Available online: https://www.government.nl/topics/food/food-safety-requirements (accessed on 1 August 2021).
- Ellwood, K.; Finley, J.W.; Hoadley, J. Launching a new food product or dietary supplement in the United States: Industrial, regulatory, and nutritional considerations. Annu. Rev. Nutr. 2014, 34, 421–447. [Google Scholar] [CrossRef]
- Japan. Implementation of Imported Foods Monitoring Plan for FY 2019. Ministry of Health, Labour and Welfare. Available online: https://www.mhlw.go.jp/english/topics/importedfoods/19/index.html (accessed on 1 August 2021).
- Italy. Istituto Zooprofilattico Sperimentale del Lazio e Della Toscana. Available online: http://www.izslt.it/eng/food-safety/%0ahttp:/www.salute.gov.it/portale/p5_0.jsp?lingua=italiano&id=52 (accessed on 1 August 2021).
- France. Novel Foods and Food Ingredients. French Agency for Food, Environmental and Occupational Health & Safety. Available online: https://www.anses.fr/en/content/novel-foods-and-food-ingredients (accessed on 1 August 2021).
- Mexico. Comisión Federal Para la Protección Contra Riesgos Sanitarios. Comisión Federal Para la Protección Contra Riesgos Sanitarios. Available online: https://www.gob.mx/cofepris (accessed on 1 August 2021).
- Steier, G. The carbon tax vacuum and the debate about climate change: Emission taxation of commodity crop production in food system regulation. Pace Environ. Law Rev. 2018, 35, 346–374. [Google Scholar]
- Canada. Consolidated Federal Laws of Canada, Pest Control Products Act. Justice Laws Canada. 2019. Available online: https://laws-lois.justice.gc.ca/eng/acts/P-9.01/ (accessed on 1 August 2021).
- Canada. Consolidated Federal Laws of Canada, New Substances Notification Regulations (Organisms). Justice Laws Canada. 2018. Available online: https://laws-lois.justice.gc.ca/eng/regulations/SOR-2005-248/index.html (accessed on 1 August 2021).
- Canada. Pollution Pricing. Environment and Climate Change Canada. 2018. Available online: https://www.canada.ca/en/environment-climate-change/services/climate-change/pricing-pollution-how-it-will-work.html (accessed on 1 August 2021).
- Canada. Managing and Reducing Waste. Environment and Climate Change Canada. 2017. Available online: https://www.canada.ca/en/services/environment/pollution-waste-management/managing-reducing-waste.html (accessed on 1 August 2021).
- Canada. Water Overview. Environment and Climate Change Canada. 2017. Available online: https://www.canada.ca/en/environment-climate-change/services/water-overview.html (accessed on 1 August 2021).
- Canada. Management of Hazardous Waste and Hazardous Recyclable Material. Environment and Climate Change Canada. 2010. Available online: https://www.canada.ca/en/environment-climate-change/services/managing-reducing-waste/permit-hazardous-wastes-recyclables/management.html (accessed on 1 August 2021).
- Canada. Wastewater Systems Effluent Regulations. Available online: https://laws-lois.justice.gc.ca/eng/regulations/SOR-2012-139/FullText.html (accessed on 1 August 2021).
- United States. Tonnage of Top 50 US Water Ports, Ranked by Total Tons. Bureau of Transportation Statistics, US Department of Transport. 2018. Available online: https://www.bts.gov/content/tonnage-top-50-us-water-ports-ranked-total-tons (accessed on 1 August 2021).
- United States. Summary of the Food Quality Protection Act. United States Environmental Protection Agency. 2015. Available online: https://www.epa.gov/laws-regulations/summary-food-quality-protection-act (accessed on 1 August 2021).
- United States. About the Office of Water. United States Environmental Protection Agency. 2013. Available online: https://www.epa.gov/aboutepa/about-office-water (accessed on 1 August 2021).
- United States. Guidelines for the Storage and Collection of Residential, Commercial, and Institutional Solid Waste. Electronic Code of Federal Regulations. Available online: https://www.ecfr.gov/cgi-bin/retrieveECFR?gp=&SID=c94567294dff611654af7a3944a91d69&mc=true&r=PART&n=pt40.27.243 (accessed on 1 August 2021).
- European Union Law. European Parlaiment and Council Directive on Packaging and Packaging Waste (31994L0062—EN—26.05.2015). Available online: https://eur-lex.europa.eu/legal-content/EN/TXT/HTML/?uri=CELEX:01994L0062-20150526&from=EN (accessed on 1 August 2021).
- Netherlands. Information from the Government of the Netherlands. Governemtn of the Netherlands. 2013. Available online: https://www.government.nl/ (accessed on 1 August 2021).
- Netherlands. Government-Wide Programme for a Circular Economy. Government of the Netherlands. Available online: https://www.government.nl/documents/letters/2016/09/14/government-wide-programme-for-a-circular-economy (accessed on 1 August 2021).
- Australia. Find, Explore and Reuse Australia’s Public Data. Australian Government. Available online: https://data.gov.au (accessed on 1 August 2021).
- Australia. Food Regulation System. Department of Health. Available online: https://www1.health.gov.au/internet/publications/publishing.nsf/Content/foodsecretariat-stakeholder-engagement-toc~4 (accessed on 1 August 2021).
- United Kingdom. Carbon Emissions Tax. Available online: https://www.gov.uk/government/publications/carbon-emmisions-tax/carbon-emmisions-tax (accessed on 1 August 2021).
- United Kingdom. Packaging (Essential Requirements) Regulations: Guidance Notes. Available online: https://www.gov.uk/government/publications/packaging-essential-requirements-regulations-guidance-notes (accessed on 1 August 2021).
- Germany. Waste Management in Germany 2018: Facts, Data, Diagrams. 2018. Available online: https://www.bmu.de/fileadmin/Daten_BMU/Pools/Broschueren/abfallwirtschaft_2018_en_bf.pdf (accessed on 1 August 2021).
- Germany. Federal Ministry for the Environment, Nature Conservation and Nuclear Safety Germany. Federal Ministry for the Environment, Nature Conservation and Nuclear Safety. Available online: https://www.bmu.de/en/ (accessed on 1 August 2021).
- France. Ministry of Ecological and Solidarity Transition. Ministry of Ecological and Solidarity Transition. Available online: https://www.ecologique-solidaire.gouv.fr/en (accessed on 1 August 2021).
- Japan. Waste & Recycling. Ministry of the Environment. Available online: http://www.env.go.jp/en/recycle/index.html (accessed on 1 August 2021).
- Qasim, H.; Liang, Y.; Guo, R.; Saeed, A.; Badar, N.A. The defining role of environmental self-identity among consumption values and behavioral intention to consume organic food. Int. J. Environ. Res. Public Health 2019, 16, 1106. [Google Scholar] [CrossRef] [Green Version]
- Canada. Canadian Environmental Protection Act Registry. Environment and Climate Change Canada. 2007. Available online: https://www.canada.ca/en/environment-climate-change/services/canadian-environmental-protection-act-registry.html (accessed on 1 August 2021).
- United States. Title 40: Protection of the Environment. Electronic Code of Federal Regulations. Available online: https://www.ecfr.gov/cgi-bin/retrieveECFR?gp=1&SID=287870523535af49d3562aec528d94c9&ty=HTML&h=L&n=40y17.0.1.1.4&r=PART (accessed on 1 August 2021).
- United Kingdom. Guidelines for Environmental Risk Assessment and Management: Green Leaves III. Available online: https://www.gov.uk/government/publications/guidelines-for-environmental-risk-assessment-and-management-green-leaves-iii (accessed on 1 August 2021).
- United Kingdom. Waste and Environmental Impact. Available online: https://www.gov.uk/browse/business/waste-environment (accessed on 1 August 2021).
- Environmental Law Alliance Worldwide. Act on the Prevention of Harmful Effects on the Environment Caused by Air Pollution, Noise, Vibration and Similar Phenomena. 2002. Available online: https://www.elaw.org/content/germany-act-prevention-harmful-effects-environment-caused-air-pollution-noise-vibration-and- (accessed on 1 August 2021).
- Environmental Law Alliance Worldwide. Federal Water Act. 2002. Available online: https://elaw.org/content/germany-federal-water-act-19-august-2002 (accessed on 1 August 2021).
- Japan. Agricultural Chemicals Regulation. Food and Agricultural Materials Inspection Center. Available online: http://www.acis.famic.go.jp/eng/hourei/regulation_law.htm (accessed on 1 August 2021).
- Japan. Health & Chemicals. Ministry of the Environment. Available online: http://www.env.go.jp/en/chemi/index.html (accessed on 1 August 2021).
- Water Environment Partnership in Asia. Water Pollution Control Law. Available online: http://www.wepa-db.net/policies/law/japan/wpctop.htm (accessed on 1 August 2021).
- Australia. Food and Medicine Regulation. Department of Health. 2014. Available online: https://www.tga.gov.au/community-qa/food-and-medicine-regulation (accessed on 1 August 2021).
- Netherlands. Environmental Management Act. Ministry of Housing, Spatial Planning and the Environment. 2004. Available online: https://www.asser.nl/upload/eel-webroot/www/documents/national/netherlands/EMA052004.pdf (accessed on 1 August 2021).
- Observatory of Economic Complexity. Italy (ITA) Exports, Imports, and Trade Partners. The Observatory of Economic Complexity. Available online: https://oec.world/en/profile/country/ita/ (accessed on 1 August 2021).
- Observatory of Economic Complexity. Canada (CAN) Exports, Imports, and Trade Partners. Available online: https://oec.world/en/profile/country/can/ (accessed on 1 August 2021).
- Observatory of Economic Complexity. Mexico (MEX) Exports, Imports, and Trade Partners. Observatory of Economic Complexity. Available online: https://oec.world/en/profile/country/mex/ (accessed on 1 August 2021).
- Observatory of Economic Complexity. France (FRA) Exports, Imports, and Trade Partners. Observatory of Economic Complexity. Available online: https://oec.world/en/profile/country/fra/ (accessed on 1 August 2021).
- Observatory of Economic Complexity. Netherlands (NLD) Exports, Imports, and Trade Partners. Observatory of Economic Complexity. Available online: https://oec.world/en/profile/country/nld/ (accessed on 1 August 2021).
- Observatory of Economic Complexity. Australia (AUS) Exports, Imports, and Trade Partners. Observatory of Economic Complexity. Available online: https://oec.world/en/profile/country/aus/ (accessed on 1 August 2021).
- Observatory of Economic Complexity. United States (USA) Exports, Imports, and Trade Partners. Observatory of Economic Complexity. Available online: https://oec.world/en/profile/country/usa/ (accessed on 1 August 2021).
- Observatory of Economic Complexity. United Kingdom (GBR) Exports, Imports, and Trade Partners. The Observatory of Economic Complexity. Available online: https://oec.world/en/profile/country/gbr (accessed on 1 August 2021).
- Observatory of Economic Complexity. Germany (DEU) Exports, Imports, and Trade Partners. Observatory of Economic Complexity. Available online: https://oec.world/en/profile/country/deu/ (accessed on 1 August 2021).
- Observatory of Economic Complexity. Japan (JPN) Exports, Imports, and Trade Partners. Observatory of Economic Complexity. Available online: https://oec.world/en/profile/country/jpn/ (accessed on 1 August 2021).
- Canada. Consumer Price Index, Annual Average, Not Seasonally Adjusted (Table: 18-10-0005-01). Statistics Canada. 2020. Available online: https://www150.statcan.gc.ca/t1/tbl1/en/tv.action?pid=1810000501 (accessed on 1 August 2021).
- Germany. Short-Term Indicators: Consumer Price Index for Germany, Food and Non-Alcoholic Beverages. Statistisches Bundesamt. 2020. Available online: https://www.destatis.de/EN/Themes/Economy/Short-Term-Indicators/Basic-Data/vpi001j.html;jsessionid=760218DD610D832C2CEA16500E445580.internet8711 (accessed on 1 August 2021).
- France. Consumer Price Index—Base 2015—All Households—France—Food (Identifier 001759963). Institut National de la Statistique et des Études Économiques. 2020. Available online: https://www.insee.fr/en/statistiques/serie/001759963#Tableau (accessed on 1 August 2021).
- United States. March 25, 2020 Forecast: Consumer Price Indexes (Not Seasonally Adjusted) and Forecasts by USDA, Economic Research Service. US Bureau of Labor Statistics. 2020. Available online: https://www.bls.gov/cpi/tables/home.htm (accessed on 1 August 2021).
- Australia. Consumer Price Index, Australia (6401.0, Dec 2019). Australian Bureau of Statistics. 2019. Available online: https://www.abs.gov.au/AUSSTATS/[email protected]/DetailsPage/6401.0Dec%202019?OpenDocument (accessed on 1 August 2021).
- Netherlands. Consumer Prices; Price Index 2015=100. CBS Statistics Netherlands. 2020. Available online: https://opendata.cbs.nl/statline/#/CBS/en/dataset/83131eng/table?ts=158619811027 (accessed on 1 August 2021).
- United Kingdom. Consumer Price Inflation Timer Series. Office for National Statistics. 2020. Available online: https://www.ons.gov.uk/economy/inflationandpriceindices/datasets/consumerpriceindices (accessed on 1 August 2021).
- Federal Reserve Bank of St. Louis. Consumer Price Index: Food for Mexico. Federal Reserve Bank of St. Louis. 2020. Food and Consumer Products of Canada. Growth and Innovation. Available online: https://www.fcpc.ca/Priorities-Policy/Growth-Innovation (accessed on 1 August 2021).
- Italy. Ufficio Italiano Brevetti e Marchi. Ministero Dello Sviluppo Economico. Available online: https://uibm.mise.gov.it/index.php/it/ (accessed on 1 August 2021).
- Organization for Economic Co-Operation and Development. GDP per Hour Worked (Labour Productivity). Organization for Economic Co-Operation and Development. 2020. Available online: https://data.oecd.org/lprdty/gdp-per-hour-worked.htm (accessed on 1 August 2021).
- Organization for Economic Co-Operation and Development. Long-Term Interest Rates. Organization for Economic Co-Operation and Development. 2020. Available online: https://data.oecd.org/interest/long-term-interest-rates.htm (accessed on 1 August 2021).
- Consumer Price Index: Food for Mexico. Available online: https://fred.stlouisfed.org/series/MEXCPIFODAINMEI (accessed on 1 August 2021).
- World Economic Forum. Global Competitiveness Report 2019. Available online: https://www.weforum.org/reports/global-competitiveness-report-2019/ (accessed on 1 August 2021).
- Bank of Canada. Currency Converter. Bank of Canada. 2020. Available online: https://www.bankofcanada.ca/rates/exchange/currency-converter/ (accessed on 1 August 2021).
- Canada. Canadian Agricultural Partnership. Agriculture and Agri-Food Canada. 2019. Available online: http://www.agr.gc.ca/eng/about-our-department/key-departmental-initiatives/canadian-agricultural-partnership/?id=1461767369849 (accessed on 1 August 2021).
- Canada. Strategic Innovation Fund: About the Program. Innovation, Science and Economic Development Canada. 2019. Available online: http://www.ic.gc.ca/eic/site/125.nsf/eng/00023.html (accessed on 1 August 2021).
- Canada. The Government of Canada Invests in Innovation to Advance Canada’s Food Processing. Agriculture and Agri-Food Canada. 2019. Available online: https://www.canada.ca/en/agriculture-agri-food/news/2019/08/the-government-of-canada-invests-in-innovation-to-advance-canadas-food-processing.html (accessed on 1 August 2021).
- United Kingdom. Guidance: State Aid for Agriculture and Fisheries. Department for Environment, Food & Rural Affairs. 2020. Available online: https://www.gov.uk/guidance/state-aid-for-agriculture-and-fisheries#public-money-spend-the-process (accessed on 1 August 2021).
- United Kingdom. Guidance: UK Seafood Innovation Fund. Department for Environment, Food & Rural Affairs. 2020. Available online: https://www.gov.uk/guidance/uk-seafood-innovation-fund (accessed on 1 August 2021).
- United Kingdom. Farmers Affected by This Summer’s Flooding Can Now Apply for Support through the Farming Recovery Fund. Department for Environment, Food & Rural Affairs. 2019. Available online: https://www.gov.uk/government/news/defra-opens-2-million-fund-to-restore-flood-affected-farmland (accessed on 1 August 2021).
- Germany. 27th Subsidy Report: 2017–2020. Federal Ministry of Finance. 2020. Available online: https://www.bundesfinanzministerium.de/Content/EN/Standardartikel/Press_Room/Publications/Brochures/2020-03-03-27subsidy-report.pdf?__blob=publicationFile&v=4 (accessed on 1 August 2021).
- Germany. Agricultural policy: More Cash for Sustainable Agriculture. Federal Government of Germany. 2020. Available online: https://www.bundesregierung.de/breg-en/search/nachhaltige-landwirtschaft-1667612 (accessed on 1 August 2021).
- France. The State Budget. Ministère de l’Économie et des Finances. 2020. Available online: https://www.aft.gouv.fr/en/state-budget#PLF (accessed on 1 August 2021).
- France. French Agri-Food Industries. Ministère de l’Agriculture et de l’Alimentation. 2018. Available online: https://agriculture.gouv.fr/french-agri-food-industries-2018 (accessed on 1 August 2021).
- France. The Big Investment Plan 2018–2022. Government of France. Available online: https://www.gouvernement.fr/en/the-big-investment-plan-2018-2022 (accessed on 1 August 2021).
- European Union. (2017, April 7). Italy Launches New Financial Instrument to Support Agriculture Using EU Funds. European Union. Available online: https://ec.europa.eu/info/news/italy-launch-new-financial-instrument-agriculture-supported-eu-funds-2017-apr-07_en (accessed on 1 August 2021).
- Italy. Home Page. Ministero delle Politiche Agricole Alimentary e Forestali. Available online: https://www.politicheagricole.it/flex/cm/pages/ServeBLOB.php/L/IT/IDPagina/202 (accessed on 1 August 2021).
- Japan. A Guide to Japan’s Aid. Government of Japan. Available online: https://www.mofa.go.jp/policy/oda/guide/1998/1-6.html (accessed on 1 August 2021).
- Netherlands. (2017, December 14). Government Wants €75 Million for Young Farmers. Government of the Netherlands. Available online: https://www.government.nl/topics/agriculture/news/2017/12/14/government-wants-€75-million-for-young-farmers (accessed on 1 August 2021).
- Netherlands. Funding of European Grants. Government of the Netherlands. Available online: https://www.government.nl/topics/european-grants (accessed on 1 August 2021).
- United States. Agriculture and Food Research Initiative. National Institute of Food and Agriculture. 2020. Available online: https://nifa.usda.gov/program/agriculture-and-food-research-initiative-afri (accessed on 1 August 2021).
- United States. Beginning Farmer and Rancher Development Program. National Institute of Food and Agriculture. 2020. Available online: https://nifa.usda.gov/funding-opportunity/beginning-farmer-and-rancher-development-program-bfrdp (accessed on 1 August 2021).
- United States. Community Food Projects (CFP) Competitive Grants Program. National Institute of Food and Agriculture. 2020. Available online: https://nifa.usda.gov/funding-opportunity/community-food-projects-cfp-competitive-grants-program (accessed on 1 August 2021).
- United States. Food Safety Outreach Program. National Institute of Food and Agriculture. 2020. Available online: https://nifa.usda.gov/funding-opportunity/food-safety-outreach-program (accessed on 1 August 2021).
- United States. Search for a Funding Opportunity. National Institute of Food and Agriculture (US Department of Agriculture). 2020. Available online: https://nifa.usda.gov/page/search-grant (accessed on 1 August 2021).
- Australia. Current Grants and Assistance. Department of Agriculture, Water and the Environment. 2019. Available online: https://www.agriculture.gov.au/ag-farm-food/drought/assistance/other-assistance (accessed on 1 August 2021).
- Australia. Grants and Programs: Agriculture. Business. Available online: https://www.business.gov.au/SearchResult?query=agriculture&type=1 (accessed on 1 August 2021).
- Organization for Economic Co-Operation and Development. Foreign Direct Investment for Development: Maximising Benefits, Minimising Costs. 2002. Available online: https://www.oecd.org/investment/investmentfordevelopment/foreigndirectinvestmentfordevelopmentmaximisingbenefitsminimisingcosts.htm (accessed on 1 August 2021).
- Edeka. Aktuelle Geschaftsberichte. Edeka. 2020. Available online: https://verbund.edeka/unternehmen/daten-fakten/berichte/ (accessed on 1 August 2021).
- Germany. More than 60 Billion Euros Revenue for the First Time. Rewe Group. 2019. Available online: https://www.rewe-group.com/en/newsroom/press-releases/1686-rewe-group-experiences-strong-national-and-international-growth (accessed on 1 August 2021).
- Metro. Annual report 2018/19: Consolidated Financial Statements. Metro. 2019. Available online: https://reports.metroag.de/annual-report/2018-2019/servicepages/downloads.html (accessed on 1 August 2021).
- Rewe Group. Rewe Group Annual Report 2018. Rewe Group. 2018. Available online: https://www.rewe-group-geschaeftsbericht.de/en/home/index.html (accessed on 1 August 2021).
- Lidl. Number of Stores. Lidl. Available online: https://unternehmen.lidl.de/about-lidl (accessed on 1 August 2021).
- United States. Germany Retail Foods 2018. Foreign Agricultural Service. 2018. Available online: https://apps.fas.usda.gov/newgainapi/api/report/downloadreportbyfilename?filename=Retail%20Foods_Berlin_Germany_4-17-2018.pdf (accessed on 1 August 2021).
- Asda Group Ltd. Asda Group Publishes Annual Statutory Accounts. Asda Group Ltd. 2018. Available online: https://corporate.asda.com/newsroom/2019/09/16/asda-group-limited-publishes-annual-statutory-accounts (accessed on 1 August 2021).
- John Lewis Partnership. The Partnership Difference: John Lewis Partnership PLC Annual Report and Accounts 2019. John Lewis Partnership. 2019. Available online: https://www.johnlewispartnership.co.uk/content/dam/cws/pdfs/financials/annual-reports/john-lewis-partnership-annual-report-and-accounts-2019.pdf (accessed on 1 August 2021).
- Jolly, J. (2020, January 6). Aldi Sales Reach Record £1 bn at Christmas as It Opens More Stores. The Guardian. Available online: https://www.theguardian.com/business/2020/jan/06/aldi-sales-christmas-stores (accessed on 1 August 2021).
- Kantar. Great Britain: Grocery Market Share. Kantar. 2020. Available online: https://www.kantarworldpanel.com/grocery-market-share/great-britain (accessed on 1 August 2021).
- Lidl GB. Our History. Lidl GB. Available online: https://www.lidl.co.uk/about-us (accessed on 1 August 2021).
- Morrisons Corporate. 2018/19 Investor Financial Report. Morrisons Corporate. 2019. Available online: https://www.morrisons-corporate.com/investor-centre/financial-reports/ (accessed on 1 August 2021).
- Sansbury’s. Annual Report and Financial Statements 2019. Sansbury’s. 2019. Available online: https://www.about.sainsburys.co.uk/investors/annual-report-2019 (accessed on 1 August 2021).
- Tesco. Annual Report and Financial Statements 2019. Tesco. 2019. Available online: https://www.tescoplc.com/investors/reports-results-and-presentations/annual-report-2019/ (accessed on 1 August 2021).
- Costco Wholesale. 2019 Annual Report. Costco Wholesale. 2019. Available online: https://investor.costco.com/static-files/05c62fe6-6c09-4e16-8d8b-5e456e5a0f7e (accessed on 1 August 2021).
- Empire Company Limited. Empire Company Finishes Fiscal 2019 with Strong Sales and Earnings; Exceeds Sunrise Targets; Announces 9% Dividend Increase and Share Buyback. 2019. Available online: https://corporate.sobeys.com/wp-content/uploads/2019/06/Empire-Q4-F19-News-Release-SEDAR-EN.pdf (accessed on 1 August 2021).
- Loblaw Companies Ltd. Live Life Well: 2019 Annual Report. 2019. Available online: https://s1.q4cdn.com/326961052/files/doc_financials/2019/ar/6573_LCL_ENG_AR2019_Complete_AODA.pdf (accessed on 1 August 2021).
- Metro. Shareholder Information: Financial Information. 2020. Available online: https://corpo.metro.ca/en/investor-relations.html (accessed on 1 August 2021).
- Sobeys Corporate. Our Stores and Businesses: At a Glance. Available online: https://corporate.sobeys.com/at-a-glance/ (accessed on 1 August 2021).
- United States. Canada—Retail Foods—Retail Sector Overview 2018. USDA Foreign Agricultural Service. 2018. Available online: https://apps.fas.usda.gov/newgainapi/api/report/downloadreportbyfilename?filename=Retail%20Foods_Ottawa_Canada_6-26-2018.pdf (accessed on 1 August 2021).
- Walmart Inc. 2020 Annual Report. Walmart Inc. 2020. Available online: https://s2.q4cdn.com/056532643/files/doc_financials/2020/ar/Walmart_2020_Annual_Report.pdf (accessed on 1 August 2021).
- Walmart Inc. Defining the Future of Retail. Part I, Item 2, Chart 2. Walmart Inc. 2019, p. 26. Available online: https://s2.q4cdn.com/056532643/files/doc_financials/2019/annual/Walmart-2019-AR-Final.pdf (accessed on 1 August 2021).
- Aldi. ALDI Merken. Aldi. Available online: https://www.aldi.nl/onze-producten/aldi-merken.html (accessed on 1 August 2021).
- Carrefour Group. 2019 Full-Year Results Presentation. Carrefour Group. 2020. Available online: https://www.carrefour.com/en/newsroom/2020/2019-full-year-results-presentation (accessed on 1 August 2021).
- Carrefour Group. Financial Publications: Sales and Results 2019, Full-Year Financial Results. Carrefour. 2019. Available online: https://www.carrefour.com/en/finance/financial-publications (accessed on 1 August 2021).
- Carrefour Group. All Our Store Formats. Carrefour Group. Available online: https://www.carrefour.com/en/group/stores (accessed on 1 August 2021).
- E.Leclerc. 2019 Confronte la Stratégie Commerciale d’E.Leclerc et Annonce Une Croissance Solide Pour les 3 Prochaines Années. E.Leclerc. 2020. Available online: https://www.mouvement.leclerc/2019-conforte-la-strategie-commerciale-deleclerc-et-annonce-une-croissance-solide-pour-les-3 (accessed on 1 August 2021).
- European Supermarket Magazine. (2020, March 9). Les Mousquetaires Sees 2.1% Growth in Turnover in FY2019. European Supermarket Magazine. Available online: https://www.esmmagazine.com/retail/les-sees-2-1-growth-in-turnover-in-fy2019-91864 (accessed on 1 August 2021).
- Germany. Federal Data Protection Act (BDSG). Bundesministerium der Justiz und Fur Verbraucherschutz. Available online: https://www.gesetze-im-internet.de/englisch_bdsg/ (accessed on 1 August 2021).
- Aldi. Find Your Local Aldi. Aldi. Available online: http://storelocator.aldi.com.au/Presentation/AldiSued/en-au/Start (accessed on 1 August 2021).
- Australian United Retailers Ltd. Annual Report 2018/2018 Financial Year. Australian United Retailers Ltd. 2019. Available online: https://foodworks.com.au/file/preview/b558f1cb-7ad7-4fe0-94bf-19c0bb9505cc/AURL_2019_Financial_Statements.pdf (accessed on 1 August 2021).
- Chung, F. Aldi Launches Biggest Brand Overhaul in 16 years, Vows to Maintain Price Leadership or ‘We′re Dead’. News.com.au. 15 May 2017. Available online: https://www.news.com.au/finance/business/retail/aldi-launches-biggest-brand-overhaul-in-16-years-vows-to-maintain-price-leadership-or-were-dead/news-story/6459bc21121c7f9160c1d9a40e30b99d (accessed on 1 August 2021).
- Coles Group. 2019 Annual Report. Coles Group. 2019. Available online: https://www.colesgroup.com.au/FormBuilder/_Resource/_module/ir5sKeTxxEOndzdh00hWJw/file/Coles_Annual_Report_2019.pdf (accessed on 1 August 2021).
- Groupe Casino. Continuons d’innover pour le Commerce de Domain: Document de Référence 2018. Groupe Casino. 2018. Available online: https://www.groupe-casino.fr/wp-content/uploads/2019/04/Groupe-Casino-DDR-2018.pdf (accessed on 1 August 2021).
- IGA. Get a Taste for Shopping Independent. IGA. Available online: http://our-stores.iga.com.au (accessed on 1 August 2021).
- Metcash. Investing for Growth: Metcash Annual Report 2019. Metcash. 2019. Available online: https://mars-metcdn-com.global.ssl.fastly.net/content/uploads/sites/101/2019/07/26111329/Metcash-Annual-Report-2019.pdf (accessed on 1 August 2021).
- Roy Morgan. (2019, April 5). Woolworths and Aldi Grow Grocery Market Share in 2018. Roy Morgan. Available online: http://www.roymorgan.com/findings/7936-australian-grocery-market-december-2018-201904050426 (accessed on 1 August 2021).
- Woolworths Group. Better Together: 2019 Annual Report. Woolworths Group. 2019. Available online: https://www.woolworthsgroup.com.au/icms_docs/195582_annual-report-2019.pdf (accessed on 1 August 2021).
- Woolworths Group. Australian Food: Woolworths Supermarkets. Woolworths Group. Available online: https://www.woolworthsgroup.com.au/page/about-us/our-brands/supermarkets/Woolworths (accessed on 1 August 2021).
- Ahold Delhaize. Eat well, Save Time, Live Better: Annual Report 2019. Ahold Delhaize. 2019. Available online: https://www.aholddelhaize.com/media/10197/ahold-delhaize-annual-report-2019.pdf (accessed on 1 August 2021).
- Ahold Delhaize. Albert Heijn: Did You Know. Ahold Delhaize. Available online: https://www.aholddelhaize.com/en/brands/netherlands/albert-heijn/ (accessed on 1 August 2021).
- Coop. Coop Groeit Ook in 2019 Stevig Door. Coop. 2019. Available online: https://www.coop.nl/over-coop/coop-groeit-ook-in-2019-stevig-door (accessed on 1 August 2021).
- Coop. Jaarveslag Coop 2019. Coop. 2019. Available online: https://view.publitas.com/coop-supermarkten/coop-jaarverslag-2019/page/82-83 (accessed on 1 August 2021).
- Coop. Coop Organization. Coop. Available online: https://www.coop.nl/over-coop/coop-als-organisatie (accessed on 1 August 2021).
- Detailresult Groep. Organisatie. Detailresult Groep. Available online: https://www.detailresult.nl/over-ons/organisatie (accessed on 1 August 2021).
- Detailresult Groep. Over Ons. Detailresult Groep. Available online: https://www.detailresult.nl/over-ons (accessed on 1 August 2021).
- Jumbo. 2019 Jumbo Formule Ziet Omzet Met Ruim 1 Miljard Stijgen. Jumbo. 2019. Available online: https://www.jumborapportage.com/in-het-kort/ (accessed on 1 August 2021).
- Jumbo. Toelichting Kerngegevens. Jumbo. 2019. Available online: https://www.jumborapportage.com/jaarverslagen/2019/corporate-jaarverslag/kerngegevens/toelichting-kerngegevens (accessed on 1 August 2021).
- Lidl. Lidl Nederland. Lidl. Available online: https://corporate.lidl.nl/?_ga=2.154771128.1251652950.1587940977-251429966.1587940977 (accessed on 1 August 2021).
- Aeon Co., Ltd. Aeon Review 2018: Financial Information. Aeon Co., Ltd. 2018. Available online: https://ssl4.eir-parts.net/doc/8267/ir_material_for_fiscal_ym13/54508/00.pdf (accessed on 1 August 2021).
- Maruetsu. 2018 Corporate Profile. Shiawaseikatsu, Maruetsu. 2018. Available online: https://www.maruetsu.co.jp/corporate/pdf/2018_kaishaannai_english.pdf (accessed on 1 August 2021).
- Life. Home. Life. Available online: http://www.lifecorp.jp/company/ir/library/archive.html (accessed on 1 August 2021).
- Seijo Ishii. About Us: Business. Seijo Ishii. Available online: http://www.seijoishii.co.jp/en/business/ (accessed on 1 August 2021).
- Albertsons Companies. Albertsons Companies Inc., Reports Fourth Quarter and Full Year Results. Albertsons Companies. 2018. Available online: https://last10k.com/sec-filings/1646972 (accessed on 1 August 2021).
- Kroger. 2018 Kroger Fact Book. 2018. Available online: http://ir.kroger.com/Cache/IRCache/a6a0a700-fddd-d4a0-ad3e-c2e12b070cf9.PDF?O=PDF&T=&Y=&D=&FID=a6a0a700-fddd-d4a0-ad3e-c2e12b070cf9&iid=4004136 (accessed on 1 August 2021).
- Peterson, H. The Grocery Wars Are Intensifying with Walmart and Kroger in the Lead and Amazon Poised to ‘Cause Disruption’. Business Insider Singapore. 2020. Available online: https://www.businessinsider.sg/walmart-kroger-dominate-us-grocery-amazon-gains-share-2020-1 (accessed on 1 August 2021).
- Redman, R. Ahold Delhaize Closes out Fiscal Year on an up Note. Supermarket News. 27 February 2019. Available online: https://www.supermarketnews.com/retail-financial/ahold-delhaize-closes-out-fiscal-year-note (accessed on 1 August 2021).
- United States. Retail Trends. Economic Research Service, United States Department of Agriculture. 2019. Available online: https://www.ers.usda.gov/topics/food-markets-prices/retailing-wholesaling/retail-trends/ (accessed on 1 August 2021).
- United States. The Dutch Food Retail Report 2019. U.S. Foreign Agricultural Service. 2019. Available online: https://apps.fas.usda.gov/newgainapi/api/report/downloadreportbyfilename?filename=Retail%20Foods_The%20Hague_Netherlands_6-26-2019.pdf (accessed on 1 August 2021).
- Walmart Inc. 2019 Annual Report: Defining the Future of Retail. Part I, Item 2, Chart 1. 2020, p. 25. Available online: https://s2.q4cdn.com/056532643/files/doc_financials/2019/annual/Walmart-2019-AR-Final.pdf (accessed on 1 August 2021).
- Chedraui. Closer to You: Annual Report 2017. Chedraui. 2017. Available online: http://grupochedraui.com.mx/wp-content/themes/chedraui/documentos/informacion_financiera_ingles/informe_anual/Informe_Anual_2017_ENG.pdf (accessed on 1 August 2021).
- Costco Wholesale. Kirkland Signature. Costco Wholesale. Available online: https://www.costco.com.mx/search/?text=kirkland (accessed on 1 August 2021).
- IGD Retail Analysis. Latin America: Soriana in Focus. IGD Retail Analysis. 2015. Available online: https://retailanalysis.igd.com/news/news-article/t/latin-america-soriana-in-focus/i/9583 (accessed on 1 August 2021).
- LaComer. Financial Information: Annual Reports. LaComer. 2019. Available online: http://lacomerfinanzas.com.mx/en/informacion-financiera/informes-anuales/ (accessed on 1 August 2021).
- Soriana. Soriana Reports Fourth Quarter and Full Year 2017 Financial Results. Soriana. 2017. Available online: http://www.organizacionsoriana.com/pdf/reportes/2017/Eng-2018_02_23_Press_Release_4QFY2017.pdf (accessed on 1 August 2021).
- United States. Mexico: Retail Foods 2018. Foreign Agricultural Service, US Department of Agriculture. 2018. Available online: https://apps.fas.usda.gov/newgainapi/api/report/downloadreportbyfilename?filename=Retail%20Foods_Mexico%20City%20ATO_Mexico_8-7-2018.pdf (accessed on 1 August 2021).
- Conad. Annual Report 2018. Conad. 2018. Available online: https://en.calameo.com/read/0014568979599a14f561d (accessed on 1 August 2021).
- Esselunga Group. Esselunga Group—Preliminary Results Full Year 2019. Esselunga Group. 2019. Available online: https://www.esselunga.it/cms/investor-relations/press-releases/news/2019/26/esselunga-group--preliminary-results-full-year-2018.html (accessed on 1 August 2021).
- Esselunga Group. Esselunga Group Financial Statements Financial Year 2017. Esselunga. 2017. Available online: https://www.esselunga.it/cms/info/investor-relations/financial-reports.html (accessed on 1 August 2021).
- Italiani Coop. Rapporto Coop 2019 Versione Definitiva. Italiani Coop. 2019. Available online: https://www.italiani.coop/rapporto-coop-2019-versione-definitiva/ (accessed on 1 August 2021).
- Italiani Coop. Punti Vendita. Italiani Coop. Available online: https://www.e-coop.it/punti-vendita (accessed on 1 August 2021).
- Selex Gruppo Commerciale. Comunicati Stampa. Selex Gruppo Commerciale. 2020. Available online: https://www.selexgc.it/it/comunicati-stampa (accessed on 1 August 2021).
- Selex Gruppo Commerciale. Le Insegne del Gruppo. Selex Gruppo Commerciale. Available online: https://www.selexgc.it (accessed on 1 August 2021).
- Ahold Delhaize. Product Innovation: Just-for-Kids Own-Brand Line Baunches in US Brands. Ahold Delhaize. 2019. Available online: https://www.aholddelhaize.com/en/media/latest/media-releases/product-innovation-just-for-kids-own-brand-line-launches-in-us-brands/ (accessed on 1 August 2021).
- Albertsons. About Us—Own Brand. Alberstons. Available online: https://www.albertsons.com/about-us/own-brand-lp.html (accessed on 1 August 2021).
- Kroger. Our Quality Brands. Kroger. Available online: https://www.kroger.com/b/ourbrands (accessed on 1 August 2021).
- Walmart Inc. Great Value. Available online: https://www.walmart.ca/en/great-value/N-1019684 (accessed on 1 August 2021).
- Asda Group Ltd. Own Brands. Asda Group Ltd. Available online: https://www.asda.com/about/own-brands (accessed on 1 August 2021).
- Lidl GB. About Our Products. Lidl GB. Available online: https://www.lidl.co.uk/our-products (accessed on 1 August 2021).
- Sainsbury’s. Ranges. Sainsbury′s. Available online: https://www.sainsburys.co.uk/webapp/wcs/stores/servlet/gb/groceries/get-ideas/our-ranges/our-ranges?storeId=10151&langId=44&krypto=%2B3hQOfTNF0GfDlwFu%2Ft%2BT5iL7CpuS4eopDjwBMBK%2FfVgaqjLHOc3rwNh27rStT0vIbW%2F6mG54mdWIyrv9yuOZBJ5rq95L6DPJfOXaf8RucSObyIayI3K6PJhQ3QDBEL4gIYrwx%2BqGONCWVukunnq9jgzUfsdc%2Fo4ivU5P8VSwH0%3D&ddkey=https%3Agb%2Fgroceries%2Fget-ideas%2Four-ranges%2Four-ranges (accessed on 1 August 2021).
- Waitrose. Discover Our Exclusives. Waitrose. Available online: https://www.waitrose.com/content/waitrose/en/home/inspiration/about_waitrose/about_our_food/our_brands.html?wtrint=1-Content-_-2-About%20Waitrose-_-3-Brandsandawards-_-4--_-5-text-_-6-brands (accessed on 1 August 2021).
- Auchan Retail. Auchan Annual Financial Report and non-Financial Performance Statement. Auchan Retail. 2020. Available online: https://www.auchan-retail.com/en/financial-documents-2019/ (accessed on 1 August 2021).
- Carrefour Group. Key Dates in Carrefour group’s History. Carrefour. Available online: https://www.carrefour.com/en/group/history (accessed on 1 August 2021).
- E.Leclerc. Marques. E.Leclerc. Available online: https://www.e-leclerc.com/catalogue/marques-distributeurs (accessed on 1 August 2021).
- Les Mousquetaires. Intermarché. Les Mousquetaires. Available online: https://www.mousquetaires.com/nos-enseignes/alimentaire/intermarche/ (accessed on 1 August 2021).
- Système U. Toutes les Marques U. Système U. Available online: https://www.magasins-u.com/toutes-les-marques-u (accessed on 1 August 2021).
- Coles Group. Pantry. Coles Group. Available online: https://shop.coles.com.au/a/national/everything/browse/pantry?pageNumber=1 (accessed on 1 August 2021).
- IGA. Our Brands. IGA. Available online: https://www.iga.com.au/our-brands/ (accessed on 1 August 2021).
- Woolworths Group. Our brands. Woolworths Group. Available online: https://www.woolworths.com.au/shop/discover/our-brands (accessed on 1 August 2021).
- Costco Wholesale. Kirkland Signature. Available online: https://www.costco.com/kirkland-signature.html (accessed on 1 August 2021).
- Loblaw Companies Ltd. Home. Available online: https://www.loblaw.ca/en.html (accessed on 1 August 2021).
- Metro. Our Products and Private Brands. Available online: https://www.metro.ca/en/our-products-private-brands (accessed on 1 August 2021).
- Sobeys Corporate. Sobeys Private Label Offering. Available online: https://corporate.sobeys.com/our-brands/ (accessed on 1 August 2021).
- Chedraui. Chedraui Monteblanco Selecto, Selecto Brand. Chedraui. Available online: https://www.chedraui.com.mx/Departamentos/Súper/c/MC21?q=%3Arelevance%3AspecialityCategories%3AnuestrasMarcas&toggleView=grid (accessed on 1 August 2021).
- Walmart Inc. Great Value. Walmart Inc. Available online: https://www.walmart.com/search/?query=great%20value (accessed on 1 August 2021).
- Maruetsu. Happy Living: 2012 Corporate Profile. Maruetsu. 2012. Available online: https://www.maruetsu.co.jp/corporate/pdf/2012_kaishaannai_english.pdf (accessed on 1 August 2021).
- Seijo Ishii. Philsophy: Quality Food for a Quality Life. Seijo Ishii. Available online: http://www.seijoishii.co.jp/en/about/ (accessed on 1 August 2021).
- Aldi. Produkte: Unsere Eigenmarken. Aldi. Available online: https://www.aldi-nord.de/produkte/unsere-marken.html (accessed on 1 August 2021).
- Metro. The Own Brands. Metro. Available online: https://www.metroag.de/en/brands/real (accessed on 1 August 2021).
- Rewe. Die REWE Markenwelt—Nur das Beste fur Dich. Rewe. Available online: https://www.rewe.de/marken/ (accessed on 1 August 2021).
- Albert Heijn. Belangrijke Informatie over Online Bestellen. Albert Heijn. Available online: https://www.ah.nl/producten (accessed on 1 August 2021).
- Conad. Logo Rosso. Conad. Available online: https://www.conad.it (accessed on 1 August 2021).
- Gruppo VéGé. Home. Gruppo VéGé. Available online: https://www.gruppovege.it (accessed on 1 August 2021).
- Gruppo VéGé. Prodotti VéGé. Gruppo VéGé. Available online: https://www.gruppovege.it/prodotti/ (accessed on 1 August 2021).
- Maurizio, C.; Silvia, C. Consumer stated preferences for dairy products with carbon footprint labels in Italy. Agric. Food Econ. 2020, 8, 4. [Google Scholar] [CrossRef] [Green Version]
- Selex Gruppo Commerciale. Le Nostre Marche. Selex. Available online: https://www.famila.it/le-nostre-marche (accessed on 1 August 2021).
- United States. Freight Rail Overview. Federal Railroad Administration, US Department of Transportation. 2019. Available online: https://railroads.dot.gov/rail-network-development/freight-rail/freight-rail-overview (accessed on 1 August 2021).
- United States. Number of U.S. Airports. Bureau of Transportation Statistics, US Department of Transportation. 2019. Available online: https://www.bts.gov/content/number-us-airportsa (accessed on 1 August 2021).
- United States. Number of Stations Served by Amtrak and Rail Transit, Fiscal Year. Bureau of Transportation Statistics, US Department of Transportation. 2018. Available online: https://www.bts.gov/content/number-stations-served-amtrak-and-rail-transit-fiscal-year (accessed on 1 August 2021).
- Canada. The Canadian Transportation System: Highway and Air Infrastructure. Statistics Canada. 2018. Available online: https://www144.statcan.gc.ca/tdih-cdit/cts-rtc-eng.htm (accessed on 1 August 2021).
- Canada. Rail Transportation. Transport Canada. 2012. Available online: https://www.tc.gc.ca/eng/policy/anre-menu-3020.htm (accessed on 1 August 2021).
- Dicex Integral Trade. Seaports and Their Role in Mexico. Dicex Integral Trade. 2019. Available online: https://dicex.com/en/seaports-and-their-role-in-mexico/ (accessed on 1 August 2021).
- Organization for Economic Co-Operation and Development. Frieght Railway Development in Mexico. Organization for Economic Co-Operation and Development. 2014. Available online: https://www.itf-oecd.org/sites/default/files/docs/14mexicorail.pdf (accessed on 1 August 2021).
- Statistica. Number of Airports in Mexico from 1991 to 2018. Statistica. 2018. Available online: https://0-www-statista-com.brum.beds.ac.uk/statistics/746907/mexico-number-of-airports/ (accessed on 1 August 2021).
- Italy. The New Italian Port System. Ministero delle Infrastrutture e dei Transporti. 2018. Available online: http://www.mit.gov.it/en/comunicazione/news/porti/new-italian-port-system (accessed on 1 August 2021).
- World Bank. Rail Lines (Total Route-km)—Italy. World Bank. 2018. Available online: https://data.worldbank.org/indicator/IS.RRS.TOTL.KM?locations=IT (accessed on 1 August 2021).
- Autralia. Designated International Airports in Australia. Department of Infrastructure, Transport, Regional Development and Communications. 2019. Available online: https://www.infrastructure.gov.au/aviation/international/icao/desig_airports.aspx (accessed on 1 August 2021).
- World Bank. Rail Lines (Total Route-km)—Australia. World Bank. 2011. Available online: https://data.worldbank.org/indicator/IS.RRS.TOTL.KM?locations=AU (accessed on 1 August 2021).
- World Bank. Rail Lines (Total Route-km)—France. World Bank. 2018. Available online: https://data.worldbank.org/indicator/IS.RRS.TOTL.KM?locations=FR (accessed on 1 August 2021).
- World Bank. Rail Lines (Total Route-km)—Netherlands. World Bank. 2010. Available online: https://data.worldbank.org/indicator/IS.RRS.TOTL.KM?locations=NL (accessed on 1 August 2021).
- Maritime UK. Ports. Maritime UK. 2020. Available online: https://www.maritimeuk.org/about/our-sector/ports/ (accessed on 1 August 2021).
- United Kingdom. Airport Data (2018 01). UK Civil Aviation Authority. 2018. Available online: https://www.caa.co.uk/Data-and-analysis/UK-aviation-market/Airports/Datasets/UK-Airport-data/Airport-data-2018-01/ (accessed on 1 August 2021).
- World Bank. Rail Lines (Total Route-km)—United Kindom. World Bank. 2018. Available online: https://data.worldbank.org/indicator/IS.RRS.TOTL.KM?locations=GB (accessed on 1 August 2021).
- Germany. Waterways as Transport Routes. Federal Ministry of Transport and Digital Infrastructure. 2020. Available online: https://www.bmvi.de/SharedDocs/EN/Articles/WS/waterways-as-transport-routes.html (accessed on 1 August 2021).
- World Bank. Rail lines (Total Route-km)—Germany. World Bank. 2018. Available online: https://data.worldbank.org/indicator/IS.RRS.TOTL.KM?locations=DE (accessed on 1 August 2021).
- Japan. Airports in Japan. Ministry of Land, Infrastructure, Transport and Tourism (MLIT). 2007. Available online: https://www.mlit.go.jp/koku/15_hf_000124.html (accessed on 1 August 2021).
- Knoema. Japan—Total Route Rail Lines. Knoema. 2018. Available online: https://knoema.com/atlas/Japan/Length-of-rail-lines (accessed on 1 August 2021).
- Sea Rates. Sea Ports of Japan. Sea Rates. 2020. Available online: https://www.searates.com/maritime/japan.html (accessed on 1 August 2021).
- Canada. Fields of study. Job Bank. Available online: https://www.jobbank.gc.ca/career-planning/search-field-of-study (accessed on 1 August 2021).
- Canada. Studying in Food Technology and Processing College/CEGEP (01.1002). Job Bank. Available online: https://www.jobbank.gc.ca/studentdashboard/01.1002/LOS04 (accessed on 1 August 2021).
- United States. Agriculture and Food Research Initiative: Education and Workforce Development. National Institute of Food and Agriculture (US Department of Agriculture). 2020. Available online: https://nifa.usda.gov/funding-opportunity/agriculture-and-food-research-initiative-education-workforce-development (accessed on 1 August 2021).
- United States. Indian and Native American Programs. U.S. Department of Labor. Available online: https://www.dol.gov/general/topic/training/indianprograms (accessed on 1 August 2021).
- Australia. Student Payments. Study Assist. Available online: https://www.studyassist.gov.au/support-while-you-study/support-students (accessed on 1 August 2021).
- Germany. The Cabinet Makes Social Cohesion and Modernisation Priorities. Federal Ministry of Finance. 2019. Available online: https://www.bundesfinanzministerium.de/Content/EN/Pressemitteilungen/2019/2019-03-20-pm-eckwertebeschluss.html;jsessionid=CDC6751A7635F121CC830AC0E68A7038.delivery2-replication (accessed on 1 August 2021).
- Long, B.T. Addressing the Academic Barriers to Higher Education. 2014. Available online: https://vtechworks.lib.vt.edu/handle/10919/90811 (accessed on 1 August 2021).
- Bryne, D.; McCoy, S. ‘The sooner the better I could get out of there’: Barriers to higher education in Ireland. Ir. Educ. Stud. 2011, 30, 141–157. [Google Scholar]
- Career One Stop. Food Scientists and Technologists. Career One Stop. Available online: https://www.careeronestop.org/toolkit/careers/occupations/Occupation-profile.aspx?keyword=Food%20Scientists%20and%20Technologists&onetcode=19101200&location=USA (accessed on 1 August 2021).
- United Kingdom. Employment by Occupation. 2020. Available online: https://www.ons.gov.uk/employmentandlabourmarket/peopleinwork/employmentandemployeetypes/datasets/employmentbyoccupationemp04 (accessed on 1 August 2021).
- Italy. Employment Rate, Monthly Data. Italian National Institute of Statistics. Available online: http://dati.istat.it/Index.aspx?QueryId=25132&lang=en (accessed on 1 August 2021).
- Italy. University Graduates—Occupational Status: Degree Group and Monthly Income. Italian National Institute of Statistics. Available online: http://dati.istat.it/Index.aspx?QueryId=25981&lang=en (accessed on 1 August 2021).
- Mexico. Government of Mexico. Available online: http://www.gob.mx/ (accessed on 1 August 2021).
- Mexico. Secretaría de Educación Pública. Secretaría de Educación Pública. Available online: https://www.gob.mx/sep (accessed on 1 August 2021).
- World Education News and Reviews. Education in Mexico. WENR. 2019. Available online: https://wenr.wes.org/2019/05/education-in-mexico-2 (accessed on 1 August 2021).
- Organization for Economic Co-Operation and Development. Average Wages: Total, US Dollars, 2018 or Latest Available. 2018. Available online: https://data.oecd.org/earnwage/average-wages.htm#indicator-chart (accessed on 1 August 2021).
- United States. Unemployed Persons by Industry and Class of Worker, not Seasonally Adjusted (Table A-14.). U.S. Bureau of Labor Statistics. Available online: https://www.bls.gov/news.release/empsit.t14.htm (accessed on 1 August 2021).
- United Kingdom. EARN02: Average Weekly Earnings by Sector. Office for National Statistics. Available online: https://www.ons.gov.uk/employmentandlabourmarket/peopleinwork/earningsandworkinghours/datasets/averageweeklyearningsbysectorearn02 (accessed on 1 August 2021).
- Germany. Statistik: 62321. Federal Office of Statistics. 9 May 2020. Available online: https://www-genesis.destatis.de/genesis/online?operation=statistic&levelindex=0&levelid=1589038252871&code=62321 (accessed on 1 August 2021).
- Germany. Labour Market. Federal Office of Statistics. Available online: https://www.destatis.de/EN/Themes/Labour/Labour-Market/_node.html (accessed on 1 August 2021).
- Germany. Employment. Federal Office of Statistics. Available online: https://www.destatis.de/EN/Themes/Labour/Labour-Market/Employment/_node.html (accessed on 1 August 2021).
- Germany. Employees by Industries. Federal Office of Statistics. Available online: https://www.destatis.de/EN/Themes/Economy/Short-Term-Indicators/Long-Term-Series/Labour-Market/lrerw14a.html (accessed on 1 August 2021).
- France. Monthly Wage Index—Manufacterer of Food Products, Beverage and Tobbaco. Institut National de la Statistique et des Études Économiques. 2017. Available online: https://www.insee.fr/en/statistiques/serie/010562699#Tableau (accessed on 1 August 2021).
- France. ILO Employed Persons (Employment Rate)—All—France Excluding Mayotte—SA Data (Series 010605852). National Institute of Statistics and Economic Studies. Available online: https://www.insee.fr/en/statistiques/serie/010605852#Tableau (accessed on 1 August 2021).
- France. Ministère Do L’éducation Nationale er de la Jeunesse. Ministère Do L’éducation Nationale Er de La Jeunesse. Available online: https://www.education.gouv.fr/ (accessed on 1 August 2021).
- Italy. Average Hourly Earnings for Employee Jobs in the Private Sector: Level of Education. Italian National Institute of Statistics. Available online: http://dati.istat.it/Index.aspx?QueryId=33475&lang=en (accessed on 1 August 2021).
- Netherlands. Employment; Sex, Type of Employment Contract, Job Characteristics, Cao-Sector. CBS Statistics Netherlands. 2019. Available online: https://opendata.cbs.nl/statline/#/CBS/en/dataset/81463ENG/table?ts=1585336799099 (accessed on 1 August 2021).
- Netherlands. International Visitor—DUO. Education Administration Service: Ministry of Education, Culture and Science. Available online: https://www.duo.nl/particulier/international-visitor/index.jsp (accessed on 1 August 2021).
- Netherlands. Monthly Labour Participation and Unemployment. CBS Statistics Netherlands. Available online: https://www.cbs.nl/en-gb/figures/detail/80590eng (accessed on 1 August 2021).
- Japan. Employed Person by Industry and Occupation 2019 Average. 2019. Available online: https://www.e-stat.go.jp/en/stat-search/files?page=1&layout=datalist&toukei=00200531&tstat=000000110001&cycle=7&year=20190&month=0&tclass1=000001040276&tclass2=000001040283&tclass3=000001040284&result_back=1 (accessed on 1 August 2021).
- Australia. Average Weekly Earnings, Australia, Nov 2019 (6302.0). Australian Bureau of Statistics. 2019. Available online: https://www.abs.gov.au/AUSSTATS/[email protected]/DetailsPage/6302.0Nov%202019?OpenDocument (accessed on 1 August 2021).
- Australia. Employment by Industry 2019. Parliament of Australia. Available online: https://www.aph.gov.au/About_Parliament/Parliamentary_Departments/Parliamentary_Library/FlagPost/2019/April/Employment-by-industry-2019 (accessed on 1 August 2021).
- Australia. Australian Qualifications Framework (PDF File). Australian Qualifications Framework Council. Available online: https://www.aqf.edu.au (accessed on 1 August 2021).
- Japan. Higher Education in Japan (PDF file). 2013. Available online: https://www.mext.go.jp/en/policy/education/highered/index.htm (accessed on 1 August 2021).
- United Kingdom. What Can I Do with a Food Science Degree? Prospects. Available online: https://www.prospects.ac.uk/careers-advice/what-can-i-do-with-my-degree/food-science (accessed on 1 August 2021).
- European Centre for the Development of Vocational Training. Apprenticeship Review: Italy. CEDEFOP. 2017. Available online: https://www.cedefop.europa.eu/en/publications-and-resources/publications/4159 (accessed on 1 August 2021).
- Netherlands. Continuing Vocational Training. CBS Statistics Netherlands. Available online: https://opendata.cbs.nl/statline/#/CBS/en/dataset/81850ENG/table?ts=1585316843379 (accessed on 1 August 2021).
- Ahmed, A.; Atif, M.; Hossain, M.; Mia, L. Do LGBT Diversity Policies Create Value for Firms? J. Bus. Ethics 2019, 167, 775–791. [Google Scholar]
- Brimhall, K.C.; Mor Barak, M.E. The Critical Role of Workplace Inclusion in Fostering Innovation, Job Satisfaction, and Quality of Care in a Diverse Human Service Organization. Hum. Serv. Organ. Manag. Leadersh. Gov. 2018, 42, 474–492. [Google Scholar]
- Díaz-García, C.; González-Moreno, A.; Sáez-Martínez, F.J. Gender Diversity within R&D Teams: Its Impact on Radicalnes of Innovation. Innov. Manag. Policy Pract. 2013, 15, 149–160. [Google Scholar]
- Australia. Distribution of Earnings for Employees by Industry (Table 3). Australian Bureau of Statistics. 2019. Available online: https://www.abs.gov.au/AUSSTATS/[email protected]/DetailsPage/6333.0August%202019?OpenDocument (accessed on 1 August 2021).
- Australia. Median Earnings for Employees by Demographic Characteristics and Full-Time or Part-Time (Table 2). Australian Bureau of Statistics. 2019. Available online: https://www.abs.gov.au/AUSSTATS/[email protected]/DetailsPage/6333.0August%202019?OpenDocument (accessed on 1 August 2021).
- United Kingdom. Labour Market Status of Disabled People. Office for National Statistics. 2020. Available online: https://www.ons.gov.uk/employmentandlabourmarket/peopleinwork/employmentandemployeetypes/datasets/labourmarketstatusofdisabledpeoplea08 (accessed on 1 August 2021).
- United Kingdom. Employment by Country of Birth and Nationality. Office for National Statistics. 2018. Available online: https://www.ons.gov.uk/employmentandlabourmarket/peopleinwork/employmentandemployeetypes/datasets/employmentbycountryofbirthandnationalityemp06 (accessed on 1 August 2021).
- Japan. Diversity. Available online: https://www.japan.go.jp/diversity/index.html (accessed on 1 August 2021).
- Australia. Form of Employment by Industry, Occupation and Educational Qualification (Table 10). Australian Bureau of Statistics. 2019. Available online: https://www.abs.gov.au/AUSSTATS/[email protected]/DetailsPage/6333.0August%202019?OpenDocument (accessed on 1 August 2021).
- Japan. Labour Force Survey Basic Tabulation Statistical Table Whole Japan Yearly 2019. Portal Site of Official Statistics of Japan. Available online: https://www.e-stat.go.jp/en/stat-search/files?page=1&layout=datalist&toukei=00200531&tstat=000000110001&cycle=7&year=20190&month=0&tclass1=000001040276&tclass2=000001040283&tclass3=000001040284&result_back=1 (accessed on 1 August 2021).
- Mexico. Employment and Occupation. National Institute of Statistics and Geography. 2006. Available online: http://en.www.inegi.org.mx/temas/empleo/default.html#Tabular_data (accessed on 1 August 2021).
- Netherlands. Wealth of Households; Components of Wealth. CBS Statistics Netherlands. Available online: https://www.cbs.nl/en-gb/figures/detail/83834ENG (accessed on 1 August 2021).
- United Kingdom. Earnings and Working Hours. Office for National Statistics. Available online: https://www.ons.gov.uk/employmentandlabourmarket/peopleinwork/earningsandworkinghours (accessed on 1 August 2021).
- United States. USPTO Fee Schedule. United States Patent and Trademark Office. 2018. Available online: https://www.uspto.gov/learning-and-resources/fees-and-payment/uspto-fee-schedule (accessed on 1 August 2021).
- United States. General Information Concerning Patents. United States Patent and Trademark Office. 2015. Available online: https://www.uspto.gov/patents-getting-started/general-information-concerning-patents#heading-2 (accessed on 1 August 2021).
- United States. Maintain Your Patent. United States Patent and Trademark Office. Available online: https://www.uspto.gov/patents-maintaining-patent/maintain-your-patent (accessed on 1 August 2021).
- United States. Patent FAQs. United States Patent and Trademark Office. Available online: https://www.uspto.gov/help/patent-help (accessed on 1 August 2021).
- United States. Patent Process Overview. United States Patent and Trademark Office. Available online: https://www.uspto.gov/patents-getting-started/patent-process-overview#step3 (accessed on 1 August 2021).
- Canada. Doing Business Abroad: Protecting Your IP in Mexico. Canadian Intellectual Property Office. 2020. Available online: https://www.ic.gc.ca/eic/site/cipointernet-internetopic.nsf/eng/wr04735.html (accessed on 1 August 2021).
- European Union. How to Register Your Patent in Mexico. Latin America IPR SME Helpdesk. 2017. Available online: https://www.latinamerica-ipr-helpdesk.eu/sites/default/files/factsheets/how_to_register_your_patent_mexico_edition.pdf (accessed on 1 August 2021).
- Mexico. Instituto Mexicano de la Propiedad Industrial. Government of Mexico. Available online: https://www.gob.mx/impi (accessed on 1 August 2021).
- Canada. A Guide to Patents. Canadian Intellectual Property Office. 2020. Available online: http://www.cipo.ic.gc.ca/eic/site/cipoInternet-Internetopic.nsf/eng/h_wr03652.html#marketingLicensingPatent1 (accessed on 1 August 2021).
- Canada. Standard Fees for Patents. Canadian Intellectual Property Office. 2020. Available online: https://www.ic.gc.ca/eic/site/cipointernet-internetopic.nsf/eng/wr00142.html (accessed on 1 August 2021).
- Canada. Annual Report 2017-2019: Helping Make Canada a Global Centre for Innovation. Canadian Intellectual Property Office. 2019. Available online: https://www.ic.gc.ca/eic/site/cipointernet-internetopic.nsf/eng/h_wr04468.html (accessed on 1 August 2021).
- Canada. How Your Patent Application is Processed. Canadian Intellectual Property Office. 2019. Available online: https://www.ic.gc.ca/eic/site/cipointernet-internetopic.nsf/eng/wr01414.html (accessed on 1 August 2021).
- Canada. Tutorial—Your Patent Application. Canadian Intellectual Property Office. 2016. Available online: https://www.ic.gc.ca/eic/site/cipointernet-internetopic.nsf/eng/wr01398.html (accessed on 1 August 2021).
- Canada. What Are Trademarks? Canadian Intellectual Property Office. 2016. Available online: https://www.ic.gc.ca/eic/site/cipointernet-internetopic.nsf/eng/wr03718.html (accessed on 1 August 2021).
- Lexis Halsbury’s Laws of Canada. I. Patents of Invention, 1 Applicable Law, (2) Patent Act. 2020. Available online: https://advance.lexis.com/api/permalink/23e8fd96-e8fa-4c3b-935a-561fd48c8dbd/?context=1505209 (accessed on 1 August 2021).
- United Kingdom. Guidance: Patent Fact Sheets. Intellectual Property Office. 2014. Available online: https://www.gov.uk/government/publications/patent-fact-sheets (accessed on 1 August 2021).
- Germany. Patent Fees. German Patent and Trade Mark Office. 2020. Available online: https://www.dpma.de/english/services/fees/patents/index.html (accessed on 1 August 2021).
- Germany. Patents: Examination and Grant. German Patent and Trade Mark Office. 2020. Available online: https://www.dpma.de/english/patents/examination_and_grant/index.html (accessed on 1 August 2021).
- Germany. Questions around Patents. German Patent and Trade Mark Office. 2020. Available online: https://www.dpma.de/english/patents/faq/index.html (accessed on 1 August 2021).
- Netherlands. Fees (patents). Netherlands Enterprise Agency. Available online: https://english.rvo.nl/onderwerpen/innovative-enterprise/patents-other-ip-rights/patents/fees-patents (accessed on 1 August 2021).
- Netherlands. How Can I Apply for a Patent? Governement of the Netherlands. Available online: https://www.government.nl/topics/intellectual-property/question-and-answer/how-can-i-apply-for-a-patent (accessed on 1 August 2021).
- Netherlands. Protection of Intellectual Proeprty and Trade Secrets. Government of the Netherlands. Available online: https://www.government.nl/topics/intellectual-property (accessed on 1 August 2021).
- Italy. Brevetti per Invenzione Industrale. Ministero Dello Svluppo Economico. 2019. Available online: https://www.uibm.gov.it/attachments/invenzionistruzioni.pdf (accessed on 1 August 2021).
- Italy. Information Italian Patents. SID. Available online: http://www.sib.it/en/patents/inventions-insights/patents/italian-patents/ (accessed on 1 August 2021).
- Japan. Preliminary Statistical Data on Applications, Requests and Registrations. Japan Patent Office. 2020. Available online: https://www.jpo.go.jp/e/resources/statistics/syutugan_toukei_sokuho/index.html (accessed on 1 August 2021).
- Japan. Schedule of Fees. Japan Patent Office. 2020. Available online: https://www.jpo.go.jp/e/system/process/tesuryo/hyou.html (accessed on 1 August 2021).
- Japan. Procedures for Obtaining a Patent Right. Japan Patent Office. 2019. Available online: https://www.jpo.go.jp/e/system/patent/gaiyo/patent.html (accessed on 1 August 2021).
- Japan. List of FAQs: Fees. Japan Patent Office. 2012. Available online: https://www.jpo.go.jp/e/faq/yokuaru/fees.html (accessed on 1 August 2021).
- Japan. The Role of the Japan Patent Office. Japan Patent Office. 2011. Available online: https://www.jpo.go.jp/e/introduction/soshiki/yakuwari.html (accessed on 1 August 2021).
- Australia. Patent Time and Costs. IP Australia. 2020. Available online: https://www.ipaustralia.gov.au/patents/understanding-patents/time-and-costs (accessed on 1 August 2021).
- Australia. Types of Patents. IP Australia. 2020. Available online: https://www.ipaustralia.gov.au/patents/understanding-patents/types-patents (accessed on 1 August 2021).
- Australia. Single Examination Process for Australia and New Zealand. IP Australia & New Zealand Intellectual Property Office. Available online: https://www.ipaustralia.gov.au/sites/default/files/integration_of_patent_examination.pdf?acsf_files_redirect (accessed on 1 August 2021).
- France. Patent Database. Institut National de Proriété Industrielle (INPI). 2020. Available online: https://bases-brevets.inpi.fr/en/home.html (accessed on 1 August 2021).
- France. The French Patent System. Cabinet Beau de Loménie. 2017. Available online: http://www.bdl-ip.com/upload/Etudes/uk/french_patent_system.pdf (accessed on 1 August 2021).
- United Kingdom. Statutory Guidance: The Patents Act 1977. Intellectual Property Office. 2018. Available online: https://www.gov.uk/government/publications/the-patents-act-1977 (accessed on 1 August 2021).
- United Kingdom. Intellectual Property Enterprise Court. HM Courts & Tribunals Service. Available online: https://www.gov.uk/courts-tribunals/intellectual-property-enterprise-court (accessed on 1 August 2021).
- United Kingdom. Intellectual Property: Law and Practice. United Kingdom Government. Available online: https://www.gov.uk/topic/intellectual-property/law-practice (accessed on 1 August 2021).
- United Kingdom. Limitation Act (1980 c. 58). UK Legislation. Available online: http://www.legislation.gov.uk/ukpga/1980/58 (accessed on 1 August 2021).
- Japan. Patent Act (Act No. 121 of April 13, 1959). Japanese Law Translation. 2006. Available online: http://www.japaneselawtranslation.go.jp/law/detail/?printID=&ft=1&co=01&x=32&y=19&ky=特許法&page=10&id=42&lvm=&re=02&vm=02 (accessed on 1 August 2021).
- Japan. Laws of Japan: Civil Code (Part I, Part II Chapter I, 1896—Act No 89 of 1896). AsianLii. Available online: http://www.asianlii.org/jp/legis/laws/ccipici1896an89o1896346/ (accessed on 1 August 2021).
- Okuyama, S.; Patent Infringement Litigation in Japan. Japan Patent Office. 2016. Available online: https://www.jpo.go.jp/e/news/kokusai/developing/training/textbook/document/index/patent_infringement_litigation_in_japan_2016.pdf (accessed on 1 August 2021).
- United States. The United States Code, Title 35 Patents. Office of the Law Revision Counsel. 2020. Available online: https://uscode.house.gov/browse/prelim@title35/part3/chapter29&edition=prelim (accessed on 1 August 2021).
- ICLG. Mexico: Patents 2020. ICLG. 2020. Available online: https://iclg.com/practice-areas/patents-laws-and-regulations/mexico (accessed on 1 August 2021).
- Holden, J. Italy: Introduction to Intellectual Property Law in Italy. Mondaq. 2004. Available online: https://www.mondaq.com/italy/Intellectual-Property/21161/Introduction-To-Intellectual-Property-Law-In-Italy (accessed on 1 August 2021).
- ICLG. Italy: Litigation and Dispute Resolution 2020. ICLG. 2020. Available online: https://iclg.com/practice-areas/litigation-and-dispute-resolution-laws-and-regulations/italy (accessed on 1 August 2021).
- Italy. Italian Code of Industrial Property (Legislative Decree No. 30 of 10 February 2005). LES Italy. 2013. Available online: https://www.wipo.int/edocs/lexdocs/laws/en/it/it204en.pdf (accessed on 1 August 2021).
- Australia. IP Legislation. IP Australia. 2019. Available online: https://www.ipaustralia.gov.au/about-us/legislation/ip-legislation (accessed on 1 August 2021).
- Australia. Patents Act 1990 (No. 83). Federal Register of Legislation. Available online: https://www.legislation.gov.au/Details/C2020C00099 (accessed on 1 August 2021).
- Germany. German Civil Code. Bundesministerium der Justiz und fur Verbraucherschutz. Available online: https://www.gesetze-im-internet.de/englisch_bgb/englisch_bgb.html (accessed on 1 August 2021).
- Germany. Patent Act. Bundesministerium der Justiz und fur Verbraucherschutz. Available online: http://www.gesetze-im-internet.de/englisch_patg/englisch_patg.html#p0387 (accessed on 1 August 2021).
- Canada. Patent Act (RSC 1985, c. P-4). Department of Justice. 2020. Available online: https://laws-lois.justice.gc.ca/eng/acts/p-4/page-13.html#h-412994 (accessed on 1 August 2021).
- Canada. Protect Your Innovation. Canadian Intellectual Property Office. 2018. Available online: https://www.ic.gc.ca/eic/site/cipointernet-internetopic.nsf/eng/wr03586.html (accessed on 1 August 2021).
- Netherlands. Patent Act 1995. Netherlands Enterprise Agency. Available online: https://english.rvo.nl/topics/innovation/patents-other-ip-rights-topic/patent-law/patent-act-1995 (accessed on 1 August 2021).
- Netherlands. Patent and Other IP Rights. Netherlands Enterprise Agency. Available online: https://english.rvo.nl/onderwerpen/innovative-enterprise/patents-other-ip-rights (accessed on 1 August 2021).
- Japan. Budget. Ministry of Finance, Japan. 2020. Available online: https://www.mof.go.jp/english/budget/budget/index.html (accessed on 1 August 2021).
- Canada. Budget 2019 (Table A2.12, (6) Net Expenditure). Government of Canada. 2019. Available online: https://www.budget.gc.ca/2019/docs/plan/anx-02-en.html#44-Reconciliation-of-Budget-2019-Expenses-with-2018–19-Main-Estimates-and-2019–20-Planned-Estimates (accessed on 1 August 2021).
- Canada. Budget 2019: Investing in the Middle Class. Government of Canada. 2019. Available online: https://www.budget.gc.ca/2019/home-accueil-en.html (accessed on 1 August 2021).
- Netherlands. Summary of the 2019 Budget Memorandum. Government of the Netherlands. 2018. Available online: https://www.government.nl/topics/budget-day/documents/budgets/2018/09/18/summary-of-the-2019-budget-memorandum (accessed on 1 August 2021).
- United States. Budget of the US Government. United States Government. 2019. Available online: https://www.usa.gov/budget (accessed on 1 August 2021).
- United States. Spending Explorer. USA Spending. 2019. Available online: https://www.usaspending.gov/#/explorer/budget_function (accessed on 1 August 2021).
- United Kingdom. Policy Paper, Budget 2018: Documents. HM Treasury & Rt Hon Philip Hammond. 2018. Available online: https://www.gov.uk/government/publications/budget-2018-documents (accessed on 1 August 2021).
- Australia. Budget 2019-20: Overview. Government of Australia. 2019. Available online: https://budget.gov.au/2019-20/content/overview.htm (accessed on 1 August 2021).
- Australia. Budget Papers. Australian Government. 2019. Available online: https://budget.gov.au/2019-20/content/documents.htm (accessed on 1 August 2021).
- Organization for Economic Co-Operation and Development. Open Government Data in Mexico: The Way Forward. Organization for Economic Co-Operation and Development. 2018. Available online: https://www.oecd.org/gov/open-government-data-in-mexico-9789264297944-en.htm (accessed on 1 August 2021).
- United Kingdom. Guidance: National Data Strategy. Department for Digital, Culture, Media & Sport. 2019. Available online: https://www.gov.uk/guidance/national-data-strategy#what-happens-next (accessed on 1 August 2021).
- European Data Portal. Analytical Report 13: Open Data Best Practices in Europe’s Top Three Performers: Ireland, Spain and France. European Data Portal. 2019. Available online: https://www.europeandataportal.eu/sites/default/files/analytical_report_13_open-data-best-practices-top-performers.pdf (accessed on 1 August 2021).
- France. Openness of Public Data. Gouvernement de France. 2016. Available online: https://www.gouvernement.fr/en/openness-of-public-data (accessed on 1 August 2021).
- France. Public Data Policy. Gouvernement de France. 2014. Available online: https://www.gouvernement.fr/en/public-data-policy (accessed on 1 August 2021).
- Open Government Partnership. Open Government Partnership: Summit Agenda. Open Government Partnership. 2015. Available online: https://www.opengovpartnership.org/documents/download-the-agenda-in-word/ (accessed on 1 August 2021).
- Japan. Japan Open Data Charter Action Plan. Prime Minister of Japan and Cabinet. 2013. Available online: https://japan.kantei.go.jp/policy/it/2013/1029_fulltext.pdf (accessed on 1 August 2021).
- Japan. Open Government Data Strategy. IT Strategic Headquarters. 2012. Available online: https://japan.kantei.go.jp/policy/it/20120704/text.pdf (accessed on 1 August 2021).
- Germany. Cabinet retreat in Meseberg: German Government Forges Ahead with Digitalisation. Federal Government of Germany. 2019. Available online: https://www.bundesregierung.de/breg-en/news/digital-klausur-meseberg-1694800 (accessed on 1 August 2021).
- Canada. Open data. Government of Canada. 2020. Available online: https://open.canada.ca/en/open-data (accessed on 1 August 2021).
- Canada. Canada’s Digital Charter: Trust in a Digital World. Innovation, Science, and Economic Development Canada. 2019. Available online: https://www.ic.gc.ca/eic/site/062.nsf/eng/h_00108.html (accessed on 1 August 2021).
- Canada. Report to the Clerk of the Privy Council: A Data Strategy Roadmap for the Federal Public Service. Privy Council Office. 2019. Available online: https://www.canada.ca/en/privy-council/corporate/clerk/publications/data-strategy.html (accessed on 1 August 2021).
- United States. 2020 Action Plan: Federal Data Strategy: Leveraging Data as a Strategic Asset. Offices of Management and Budget, Science and Technology Policy, Department of Commerce and Small Business Administration. 2019. Available online: https://strategy.data.gov/action-plan/ (accessed on 1 August 2021).
- Netherlands. Data Agenda Government. Digital Government. 2019. Available online: https://www.nldigitalgovernment.nl/document/data-agenda-government/ (accessed on 1 August 2021).
- Netherlands. Dutch Vision on Data Sharing between Businesses. Government of the Netherlands. 2019. Available online: https://www.government.nl/ministries/ministry-of-economic-affairs-and-climate-policy/documents/reports/2019/02/01/dutch-vision-on-data-sharing-between-businesses (accessed on 1 August 2021).
- Australia. Review of Australian Government Data Activities 2018. Department of the Prime Minister and Cabinet. 2018. Available online: https://www.pmc.gov.au/resource-centre/public-data/review-australian-government-data-activities-2018 (accessed on 1 August 2021).
- Australia. Australian Government Public Data Policy Statement. Department of the Prime Minister and Cabinet. 2015. Available online: https://www.pmc.gov.au/resource-centre/public-data/australian-government-public-data-policy-statement (accessed on 1 August 2021).
- Australia. Public Data. Department of the Prime Minister and Cabinet. Available online: https://www.pmc.gov.au/public-data (accessed on 1 August 2021).
- Canada. Personal Information Protection and Electronic Documents (Act SC 2000, c. 5.). Department of Justice. 2020. Available online: https://laws-lois.justice.gc.ca/ENG/ACTS/P-8.6/index.html (accessed on 1 August 2021).
- Canada. Privacy act RSC 1985, c. P-21. Department of Justice. 2020. Available online: https://laws-lois.justice.gc.ca/ENG/ACTS/P-21/index.html (accessed on 1 August 2021).
- Canada. Summary of Privacy Laws in Canada. Office of the Privacy Commissioner of Canada. 2018. Available online: https://www.priv.gc.ca/en/privacy-topics/privacy-laws-in-canada/02_05_d_15/ (accessed on 1 August 2021).
- United Kingdom. Data Protection Act (2018, c 12). UK Legislation (Government). 2018. Available online: http://www.legislation.gov.uk/ukpga/2018/12/contents/enacted (accessed on 1 August 2021).
- United Kingdom. Data protection. UK Government. Available online: https://www.gov.uk/data-protection (accessed on 1 August 2021).
- United Kingdom. Home. Information Commissioner’s Office. Available online: https://ico.org.uk (accessed on 1 August 2021).
- France. Data Processing, Data Files and Individual Liberties: France (Act nº78-17 of 6 January 1978). European Union Agency for Fundamental Rights. Available online: https://fra.europa.eu/en/law-reference/act-ndeg78-17-6-january-1978-data-processing-data-files-and-individual-liberties (accessed on 1 August 2021).
- United States. Online Privacy Law: France. The Library of Congress. 2017. Available online: https://www.loc.gov/law/help/online-privacy-law/2012/france.php (accessed on 1 August 2021).
- Netherlands. Protection of Personal Data. Business Netherlands. Available online: https://business.gov.nl/regulation/protection-personal-data/ (accessed on 1 August 2021).
- Japan. Laws and Policies: Act on the Protection of Personal Information. Personal Information Protection Commission Japan. 2017. Available online: https://www.ppc.go.jp/en/legal/ (accessed on 1 August 2021).
- Japan. Current Legal Framework of the Protection of Personal Information. Personal Information Protection Commission Japan. 2015. Available online: https://www.ppc.go.jp/files/pdf/280222_Current_Legal_Framework_v2.pdf (accessed on 1 August 2021).
- DLA Piper. Data Protection Laws of the World: Mexico. DLA Piper. 2019. Available online: https://www.dlapiperdataprotection.com/index.html?t=law&c=MX (accessed on 1 August 2021).
- Australia. Australian Information Commissioner and Privacy Commissioner. Office of the Australian Information Commissioner. 2020. Available online: https://www.oaic.gov.au (accessed on 1 August 2021).
- Australia. Privacy Act 1988. Federal Register of Legislation. Available online: https://www.legislation.gov.au/Series/C2004A03712 (accessed on 1 August 2021).
- Australia. Read the Australian Privacy Principles. Office of the Australian Information Commissioner. Available online: https://www.oaic.gov.au/privacy/australian-privacy-principles/read-the-australian-privacy-principles/ (accessed on 1 August 2021).


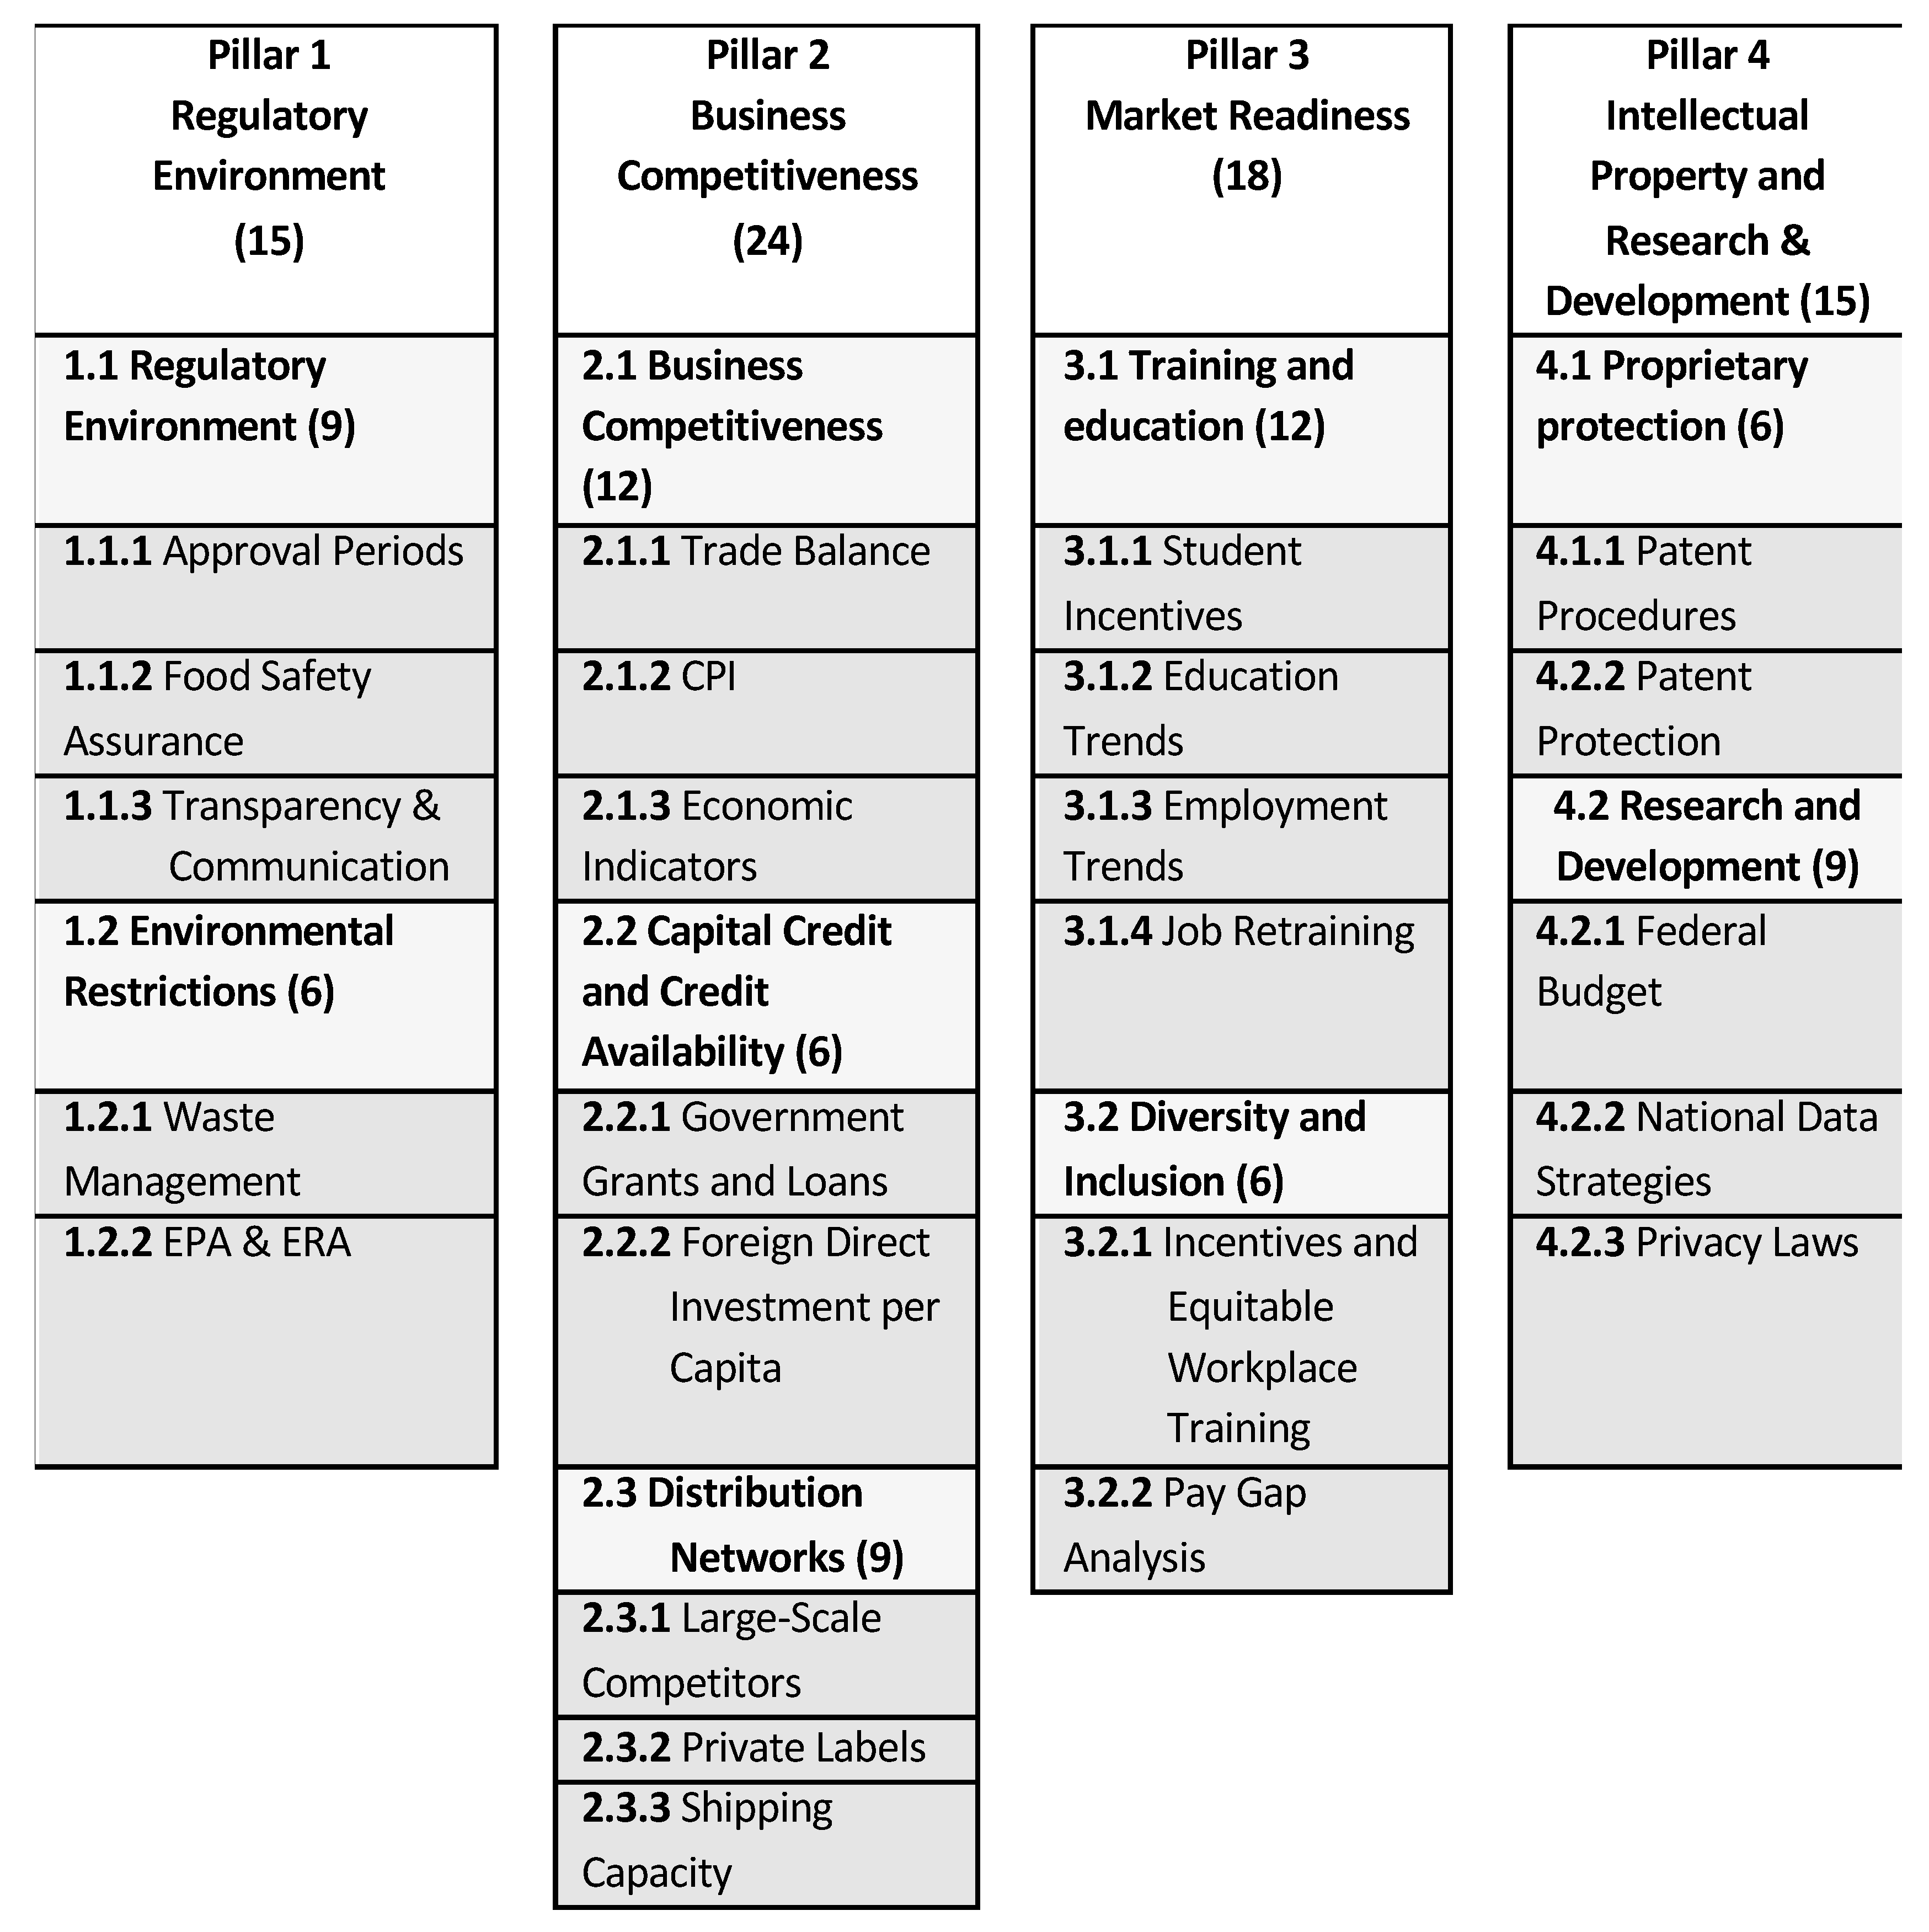
| Country | 1.1.1 Approval Periods (/3) | 1.1.2 Food Safety Assurance (/3) | 1.1.3 Transparency and Communication (/3) | Section 1.1 Total (/9) |
|---|---|---|---|---|
| Canada | 1 | 2 | 2 | 5 |
| United States | 1 | 1 | 3 | 5 |
| Mexico | N/A | N/A | 1 | 1 |
| United Kingdom | 2 | 2 | 2 | 6 |
| Italy | 2 | N/A | 1 | 3 |
| Germany | 2 | 2 | 2 | 6 |
| France | 2 | N/A | 1 | 3 |
| Netherlands | 2 | 3 | 2 | 7 |
| Japan | 3 | 1 | 2 | 6 |
| Australia | 3 | 2 | 1 | 6 |
| Country | Waste Management (/3) | EPA/ERA (/3) | Section 1.2 Total (/6) |
|---|---|---|---|
| Canada | 2 | 2 | 4 |
| United States | 2 | 2 | 4 |
| Mexico | N/A | N/A | N/A |
| United Kingdom | 3 | 2 | 5 |
| Italy | N/A | N/A | N/A |
| Germany | 3 | 2 | 5 |
| France | 1 | 2 | 3 |
| Netherlands | 2 | 1 | 3 |
| Japan | 1 | 2 | 3 |
| Australia | 2 | 2 | 4 |
| Country | 2.1.1 Trade Balance Food Exports-Imports | 2.1.2 CPI Food | 2.1.3 Economic Indicators (/3) | Section 2.1 Total (/9) | ||
|---|---|---|---|---|---|---|
| 2.1.3 Long-Term Interest Rates | 2.1.4 Exchange Rates | 2.1.5 Labour Productivity | ||||
| Canada | 3 | 2 | 2 | 7 | ||
| United States | 1 | 2 | 1 | 4 | ||
| Mexico | 3 | 1 | 3 | 7 | ||
| United Kingdom | 1 | 3 | 3 | 7 | ||
| Italy | 2 | 0 * | 1 | 3 | ||
| Germany | 1 | 2 | 3 | 6 | ||
| France | 3 | 2 | 3 | 8 | ||
| Netherlands | 3 | 3 | 3 | 9 | ||
| Japan | 1 | 0 * | 3 | 4 | ||
| Australia | 3 | 3 | 1 | 7 | ||
| Country | 2.2.1 Government Grants and Loans (/3) | 2.2.2 Foreign Direct Investment per Capita (/3) | Section 2.2 Total (/6) |
|---|---|---|---|
| Canada | 2 | 2 | 4 |
| United States | 3 | 2 | 5 |
| Mexico | N/A | 1 | 1 |
| United Kingdom | 2 | 2 | 4 |
| Italy | 1 | 1 | 2 |
| Germany | 2 | 1 | 3 |
| France | 1 | 1 | 2 |
| Netherlands | 0 * | 3 | 3 |
| Japan | 1 | 1 | 2 |
| Australia | 3 | 1 | 4 |
| Country | 2.3.1 Large-Scale Competitors (/3) | 2.3.2 Private Labels (/3) | 2.3.3 Shipping Capacity (/3) | Section 2.3 Total (/9) |
|---|---|---|---|---|
| Canada | 1 | 1 | 1 | 3 |
| United States | 3 | 2 | 2 | 7 |
| Mexico | 3 | 1 * | 1 | 4 |
| United Kingdom | 2 | 2 | 3 | 7 |
| Italy | 3 | 3 | 1 | 7 |
| Germany | 2 | 3 | 3 | 8 |
| France | 1 | 2 | 0 ** | 3 |
| Netherlands | 1 | 3 | 0 ** | 4 |
| Japan | N/A | N/A | 3 | 3 |
| Australia | 1 | 2 | 1 | 4 |
| Country | 3.1.1 Student Incentives (/3) | 3.1.2 Education Trends (/3) | 3.1.3 Employment Trends (/3) | 3.1.4 Job Retraining (/3) | Section 3.1 Total (/12) |
|---|---|---|---|---|---|
| Canada | 2 | 3 | 2 | 3 | 10 |
| United States | 2 | 3 | 3 | 2 | 10 |
| Mexico | N/A | N/A | N/A | N/A | N/A |
| United Kingdom | 1 | 2 | 1 | 3 | 7 |
| Italy | 0 | 2 | 1 ** | 1 | 3 |
| Germany | 3 | 1 * | 3 | 1 | 7 |
| France | 1 | 1 * | 1 ** | 1 | 2 |
| Netherlands | 1 | 1 * | 1 ** | 1 | 2 |
| Japan | 1 | 1 * | 1 ** | 2 | 3 |
| Australia | 3 | 1 * | 1 ** | 2 | 5 |
| Country | 3.2.1 Equitable Training Programs and Incentives | 3.2.2 Pay Gap | Section 3.2 Total (/6) |
|---|---|---|---|
| Canada | 3 | 1 | 4 |
| United States | 3 | 2 | 5 |
| Mexico | N/A | 0 ** | 0 |
| United Kingdom | 2 | 3 | 5 |
| Italy | 1 | 3 | 4 |
| Germany | 1 | 1 | 2 |
| France | 1 | 0 * | 1 |
| Netherlands | 2 | 0 ** | 2 |
| Japan | 3 | 0 ** | 3 |
| Australia | 2 | 0 ** | 2 |
| Country | Pay Gap | Points Awarded |
|---|---|---|
| Canada | 29.8 | 1 |
| United States | 16.9 | 2 |
| Mexico | No wage data collected | 0 |
| United Kingdom | 6.5 in agriculture to 12.1 in manufacturing | 3 |
| Italy | 7.1 for scientific and technical fields; 13.9 for manufacturing | 3 |
| Germany | 20.0 | 1 |
| France | No gender-based data collected | 0 |
| Netherlands | No data available | 0 |
| Japan | No data available | 0 |
| Australia | 34.0 in scientific and technical fields; 39.0 in manufacturing | 1 |
| Country | 4.1.1 Patent Procedures | 4.1.2 Patent Protection | Section 4.1 Total (/6) |
|---|---|---|---|
| Canada | 2 | 1 | 3 |
| United States | 3 | 2 | 5 |
| Mexico | 2 | 2 | 4 |
| United Kingdom | 2 | 3 | 5 |
| Italy | 2 | 2 | 4 |
| Germany | 2 | 2 | 4 |
| France | 1 | 1 | 2 |
| Netherlands | 2 | 1 | 3 |
| Japan | 1 | 3 | 4 |
| Australia | 1 | 2 | 4 |
| Country | 4.2.1 Federal Budgets | 4.2.2 National Data Strategies | 4.2.3 Data Privacy And Access | Section 4.2 Total (/9) |
|---|---|---|---|---|
| Canada | 2 | 3 | 2 | 7 |
| United States | 3 | 3 | 0 ** | 6 |
| Mexico | N/A * | 1 | 1 | 2 |
| United Kingdom | 3 | 1 | 3 | 7 |
| Italy | N/A * | 0 * | 2 | 2 |
| Germany | N/A * | 0 | 2 | 2 |
| France | N/A * | 1 | 2 | 3 |
| Netherlands | 2 | 3 | 2 | 7 |
| Japan | 1 | 1 | 2 | 4 |
| Australia | 3 | 3 | 1 | 7 |
| Country | Sec 1 Total /15 | Rank Pillar 1 | Sec 2 Total /24 | Rank Pillar 2 | Sec 3 Total /21 | Rank Pillar 3 | Sec 4 Total /15 | Rank Pillar 4 | Total Score /75 | Rank | Final Rank (Weighted Results) |
|---|---|---|---|---|---|---|---|---|---|---|---|
| Canada | 9 | 5 | 14 | 6 | 14 | 2 | 10 | 4 | 47 | 3 | 5 |
| United States | 9 | 5 | 16 | 3 | 15 | 1 | 11 | 2 | 51 | 2 | 2 |
| Mexico | 1 | 10 | 12 | 8 | 0 | 10 | 6 | 7 | 19 | 10 | 8 |
| United Kingdom | 11 | 1 | 18 | 1 | 12 | 3 | 12 | 1 | 53 | 1 | 1 |
| Italy | 3 | 9 | 13 | 7 | 7 | 6 | 5 | 10 | 28 | 9 | 10 |
| Germany | 11 | 1 | 17 | 2 | 9 | 4 | 6 | 7 | 43 | 5 | 3 |
| France | 6 | 8 | 16 | 3 | 3 | 9 | 10 | 4 | 35 | 6 | 9 |
| Netherlands | 10 | 3 | 12 | 8 | 4 | 8 | 6 | 7 | 32 | 7 | 6 |
| Japan | 9 | 5 | 9 | 10 | 6 | 7 | 8 | 6 | 32 | 7 | 7 |
| Australia | 10 | 3 | 15 | 5 | 8 | 5 | 11 | 2 | 44 | 4 | 4 |
Publisher’s Note: MDPI stays neutral with regard to jurisdictional claims in published maps and institutional affiliations. |
© 2022 by the authors. Licensee MDPI, Basel, Switzerland. This article is an open access article distributed under the terms and conditions of the Creative Commons Attribution (CC BY) license (https://creativecommons.org/licenses/by/4.0/).
Share and Cite
Charlebois, S.; Hill, A.; Vezeau, J.; Hunsberger, L.; Johnston, M.; Music, J. Assessing a Nation’s Competitiveness in Global Food Innovation: Creating a Global Food Innovation Index. World 2022, 3, 27-66. https://0-doi-org.brum.beds.ac.uk/10.3390/world3010002
Charlebois S, Hill A, Vezeau J, Hunsberger L, Johnston M, Music J. Assessing a Nation’s Competitiveness in Global Food Innovation: Creating a Global Food Innovation Index. World. 2022; 3(1):27-66. https://0-doi-org.brum.beds.ac.uk/10.3390/world3010002
Chicago/Turabian StyleCharlebois, Sylvain, Amy Hill, Janèle Vezeau, Lydia Hunsberger, Maddy Johnston, and Janet Music. 2022. "Assessing a Nation’s Competitiveness in Global Food Innovation: Creating a Global Food Innovation Index" World 3, no. 1: 27-66. https://0-doi-org.brum.beds.ac.uk/10.3390/world3010002