
On Measuring the Impact of Internal Devaluation in Greece: Poverty, Flexibility, Migration and Growthless Employment


1
Centre of Planning and Economic Research (KEPE), 10683 Athens, Greece
2
Department of Public Administration, Panteion University, 17671 Athens, Greece
*
Author to whom correspondence should be addressed.
World 2022, 3(2), 313-326; https://0-doi-org.brum.beds.ac.uk/10.3390/world3020017
Submission received: 7 April 2022
/
Revised: 13 May 2022
/
Accepted: 17 May 2022
/
Published: 19 May 2022
Abstract
:This article takes a critical view on austerity policy and examines its social and economic consequences for the case of Greece. By introducing the concept of “growthless employment” it demonstrates that the implementation of internal devaluation policies had a substantial impact on the Greek society that needs to be addressed. Within a decade, household disposable income was reduced to an unprecedented level while the labour market was extensively deregulated as several indicators can display. The seemingly paradoxical case of employment without growth—hence, growthless employment—can be interpreted as the consequence of the intensity of the mix of austerity policies that was imposed as “one-size-fits-all” without taking the peculiar structure of the Greek economy into account. A descriptive examination of this idiosyncratic state of affairs is offered, providing new insights on how the level of depreciation can be better assessed. It is argued that the overall severity of the crisis is better captured by the level of disposable income whereas a modified measurement of poverty and income depreciation is introduced for the same purpose. Lastly it is maintained that Greece has suffered by an enormous outflow of its productive-aged population in the aftermath of the crisis. All the above concretise the idea of growthless employment in Greece.
1. Introduction
In the case of the Greek economy as a member of the Eurozone, monetary and trade policies are restricted, while the fiscal policy is bound to the Fiscal Compact. Therefore, the only fully available option of economic policy for a Euro-member economy is the income policy [1]. The 2008–2009 global economic crisis revealed the structural weaknesses of the Greek economy, which was characterised by serious fiscal and external imbalances and resulted in the inability to refinance government debt. Within this framework and given the restrictions in the availability of the means of economic policy, Greek governments attempted to correct macroeconomic imbalances through the application of a mixed policy of fiscal consolidation and internal devaluation (improving competitiveness), such as reductions in government expenditures, increases in both direct and indirect taxation, and cuts in unit labour costs. These policies brought about significant improvement for the state budget primary deficit, but also, significant GDP losses due to the effect of these measures on domestic demand. The negative impact on the GDP is also being underlined by Morán-Álvarez [2] whose emphasis is given on how debt-driven economies such as Greece are affected by the implementation of austerity policies, after the limitations on borrowing are imposed. The structural weaknesses of the private sector of the economy, the resulting burden on the public sector, the expansion of the debt in both public and private sectors, the external trade imbalances, and the transformations in the global fragmentation of production and labour led to a serious drop of the competitiveness of the Greek economy in the pre-crisis period and led to the underutilisation of domestic capital and labour force.
Below, it is argued that these developments had a crucial impact on the standards of living and the poverty levels, and that they are closely related with the systemic variant of the Greek economy. In a similar manner, Maris and Flouros [3] refer to these peculiar characteristics as the “exceptionalism” of the Greek capitalism while, our purpose is to point out some important aspects of the country’s growth regime.
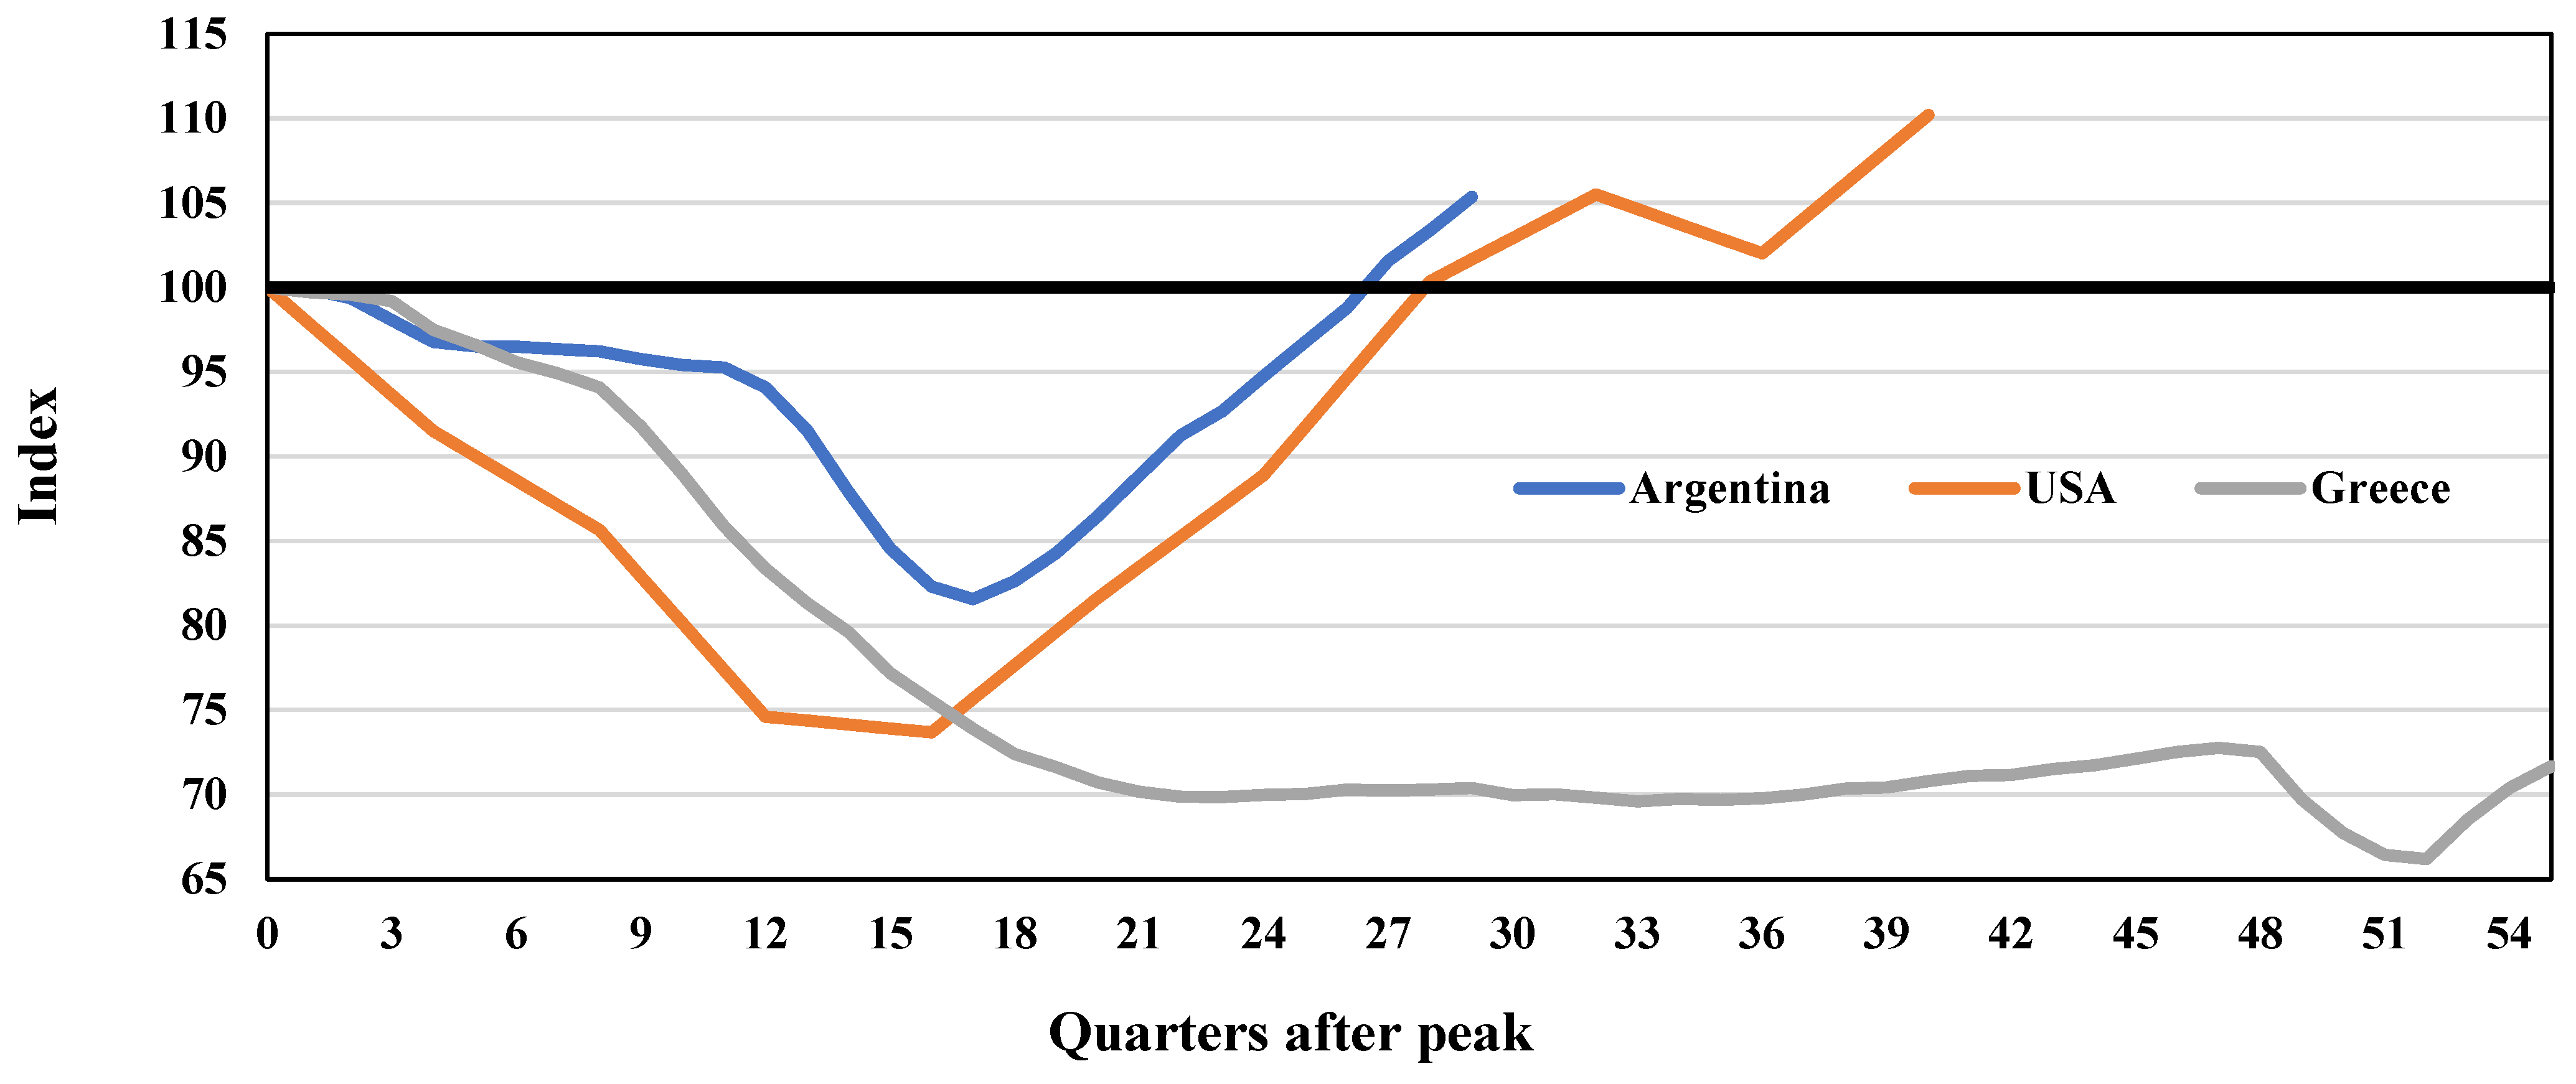
To begin with, the Greek economy seems to have reached a new, low level of equilibrium which is characterized by a persistent high level of unemployment, low-capacity utilisation, and an almost steady loss of GDP which—in cumulative terms—is more than −27% over a 60-month period after the beginning of the crisis, nearly at the second quarter of 2007 (see Figure 1). This situation can be regarded as one of the deepest, severest, and more persistent economic crises ever experienced by a single OECD country in the last century.
Due to the common currency union and the free capital mobility that characterises the economies of the Euro, there is a strong tendency for the formation of a uniform interest rate amongst the member countries [1]. At the same time, the mobility level of the labour force within the Euro area is relatively low, compared to other unified economic areas, such as the USA and Canada. These facts imply that the relative wages within the Euro are largely determined by the relative capital and labour productivities, while the persistent divergence among them leads to a vicious cycle of fiscal and external imbalances in the economy that must be adjusted by cuts in unit labour costs and increases in labour mobility. Thus, addressing these weakness, Greek authorities implemented three consecutive Economic Adjustment Programs (EAP) spanning between 2010 to 2018. (These structural weaknesses are reflected in the backwardness of the Greek economy in the field of labour productivity since it was lower by about 35% in 2017 than the average of the EU (Greece = 64.1 and EU-28 = 100). To deal with the after 2009 situation, Greek chose the road of internal devaluation in comparison to external devaluation, for a comparison of the economic benefits between the two types of devaluations see, e.g., Mariolis et al. [4].)
Moreover, the Greek economy faced a new challenge with the COVID-19 pandemic outbreak which created a whole new GDP downturn with far-reaching repercussions that contributed to the prolongation of the previous crisis. In what follows below, our aim is to bring forth an alternative perspective for accessing the current state of Greece’s macroeconomic performance, emphasizing its impact on the population’s standards of living. Section 2 introduces the concept of “growthless employment”, indicating the seeming paradox of creating new jobs within a state of anaemic growth. A demand-led growth model by Naastepad & Storm [5] provides theoretical ground. However, a descriptive explanation of this idiosyncratic state is offered in Section 3 and Section 4. In the former, we show that the level of disposable income is a better approach to evaluate the severity of the crisis whereas in the latter, we comment on the challenging aspect of the labour market flexibility as a means to overcome the crisis. Section 5 offers a modified measurement that better captures the level of income depreciation and poverty. Section 6 argues that—among other issues—Greece has suffered an enormous outflow of its productive-aged population. Combining these aspects together, it is critical to understand the long-lasting consequences of the economic crisis in Greece.
2. The Growthless employment of the Greek Economy: Is It a Paradox?
Most researchers are aware of studies concerning the issue of “jobless growth”. This literature was prompted as a reaction to the world-wide spread of neoliberal ideas and policies during the 1980s and it was almost exclusively concentrated to cases of emerging economies (India is the most prominent example). In its simplest form, the theoretical concept implies that a country’s GDP increase does not seem to induce the creation of new jobs, or that the elasticity of employment growth to GDP growth is declining. During the late 1980s, the mainstream approach to the subject was opposing the stringency of the regulations framework that existed in the labour market which, as a consequence, was able to maintain a gap between real wages and productivity [6]. Furthermore, some of the most cited causes responsible for the weak rate of job creation is the weak introduction of flexible institutions in the labour market and the expanding implementation of new and advanced technology-intensive services that partly substitute the potential dynamism of labour participation [7].
Papola [8] on the other hand, has offered a different interpretation, combining the effects between the differentiated growth of the economic sectors and their varying capacity to create new jobs, based on the changing level of capital intensity. The relatively faster-growing service sector, he maintains, uses new technologies and is eventually linked to financial services that requires more highly skilled labour; however, it tends to create less new jobs.
The case of Greece, however, deviates substantially from this concept of “jobless growth”. Especially after the implementation of the three consecutive EAP spanning between 2010 to 2018, the Greek economy was remaining trapped in a seemingly paradoxical case of growthless employment. The anaemic rates of growth documented after 2016 and which were interrupted by the COVID-19 pandemic, seem to have led to a strikingly disproportional level of growth in overall employment. Empirical evidence for Greece, contradicts one of the most straightforward and well-founded relations that growth creates employment. ILO (2015), for example, maintains that growth cannot ensure the promotion of new jobs. It is, however, taken to be understood as a prerequisite since it encompasses both advancements in employment as well as, in productivity.
Theoretical insights on the matter are possible to be provided by Naastepad & Storm [5] whose critical approach against mainstream policy recommendation, allows for the incorporation of a varying spectrum of growth regimes ranging between wage-led and profit-led. Their analysis is primarily focused against the “one-size-fits-all” implementation of the mainstream approach that does not take the peculiarities of the economic structure into account. More specifically, their Keynesian demand-led growth model forms a general framework in which, the trade-off between labour-market regulations and unemployment on the one hand, and the distribution effects on the other, that is the dominant perspective of how developed economies operate, and thus becomes a special case.
Two interesting results of the demand-led growth model proposed by Naastepad & Storm [5] seem to provide a theoretical justification for the case of Greece. First, they argue that in a wage-led economy, reducing the difference between wage and productivity growth, entails a decrease in the level of the multiplier since wages (as opposed to profits) are generally assumed to be characterised by a higher propensity to consume. Secondly, by examining the degree of wage-led technological progress, their model allows for an increase in employment and growth as a consequence of a diminishing wage rate of growth. Following Foley & Michl [9], they suggest that cheaper labour may cause firms to abandon searching for productivity-raising techniques. Lower wages may induce firms to hire low-paid employees at the expense of investing on technical progress. Overall, a mediocre level of aggregate demand output growth may come from more low-paid, employment and exports. (Full exposition of the growth model falls outside the spectrum of the present analysis. Naastepad & Storm [5] have demonstrated majority of the mechanics and have included an almost complete appendix with the derivations of the basic relations of the model).
To what follows below, the puzzling idea of growthless employment is seen through the basic macroeconomic developments of the Greek economy. Our interpretation is descriptive and intends to show some of the main aspects which have contributed towards this circumstance captured by the model. To begin with, a different approach for measuring the magnitude of economic recession in Greece is presented to indicate the weak income effect produced by the new jobs created. In addition, we provide evidence on the conditions prevailing in the labour market, showing the extreme level of labour market deregulation that was implemented in Greece and its impact on the level of inequality and its demographics.
3. Gross Domestic Product Versus Disposable Income
A better understanding of the effects of the Greek crisis is revealed when we concentrate on the differentiation that exists between the macroeconomic measures of GDP and that of the Disposable Income [10]. Between 2008 and 2020, the living standards of the overall population were substantially deteriorated. As we make it apparent, acknowledging the overall cumulative downfall caused by the crisis, most policy analysts often refer to the nonetheless considerable reduction in the country’s GDP. However, a less straightforward macro-measure that improves our insights concerning the intensity that the prolonged recession in Greece had on household income, is to be presented by the Gross Disposable Income (GDI), i.e., the amount available to consume or to save after all sorts of direct taxes have been excerpted.
The main idea stems from the fact that taxes are a constituent part of the GDP itself which further implies that austerity or tax-aggressive policies are statistically contained within it and that the overall income effects can be either lessened, in case of recession or augmented, in case of growth. Be that as it may, changing the perspective of how to measure the impact of such policies, several aspects of the mainstream approach—such as the package that was imposed by the IMF, the European Commission, and the European Central Bank upon the Greek economy—can be viewed from a different angle, or even restated. Indicatively, one of the main outcomes of the policy mix that was implemented in Greece was that the drop of the GDP was not followed by an analogous reduction at the level of direct tax revenues.
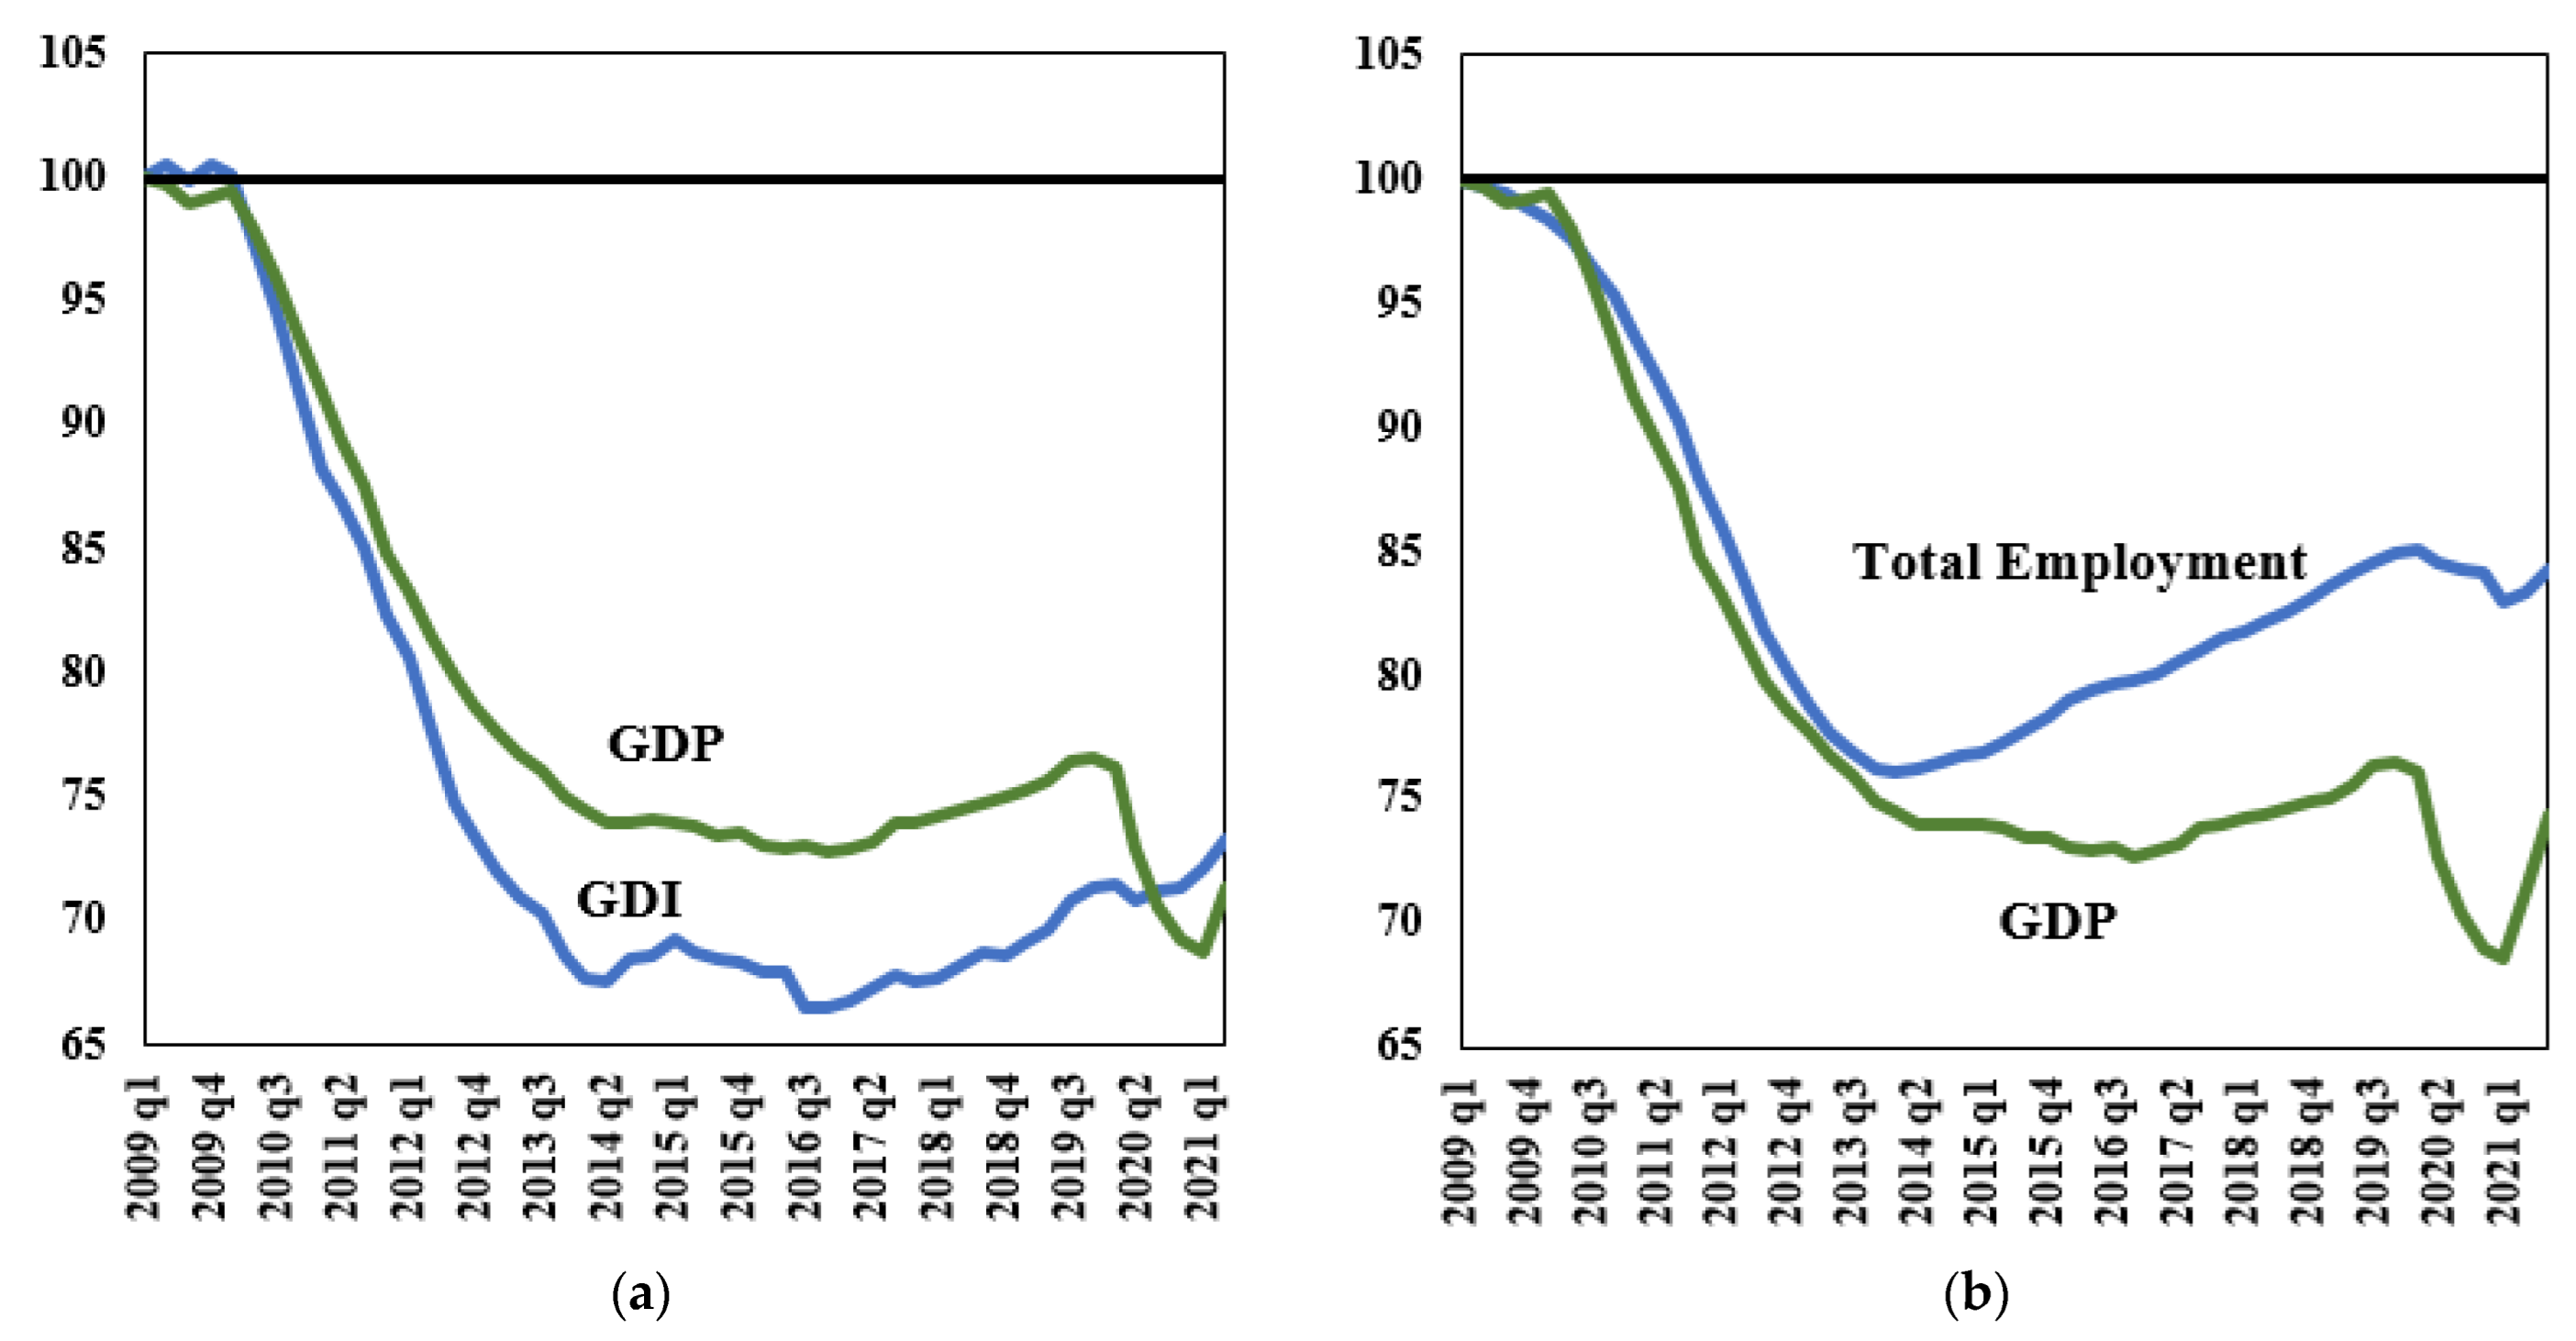
Figure 2 depicts both the normalised GDP and the GDI measures, as they evolved during the Greek crisis and the first semesters of the COVID-19, between 2009q1 and 2021q3. It is observed that between 2009q1 and 2016q4, the GDP contracted by 27.2 percent while the GDI dropped by 33.5 percent. After a period of low growth, the spread between the two measures was further widened, marking the character of implemented policy recommendations and the introduction of a set of neoliberal policies that affected the income standards. However, during the pandemic outbreak, a new shock was added upon the already contracted GDP and the trends were reversed as a result of the emergent public spending package announced for supporting that part of the population which was immediately affected by the abruptness of the economic lockdown (mid-March 2020). Consequently, the trend of the GDI continued moving upwards.
On the other hand, between 2009q1 and 2014q1, both the GDP and employment trends were declining in a tight parallel manner (see the right-side of Figure 2). More specifically, the GDP receded by 25.5% whereas employment declined by 23.8%, indicating the close relation that is frequently stressed throughout economic theory, between them. From that point onwards and until 2020q1—before the lockdown measures of social distancing that put economic activity to a halt were enforced as an immediate response to the ongoing COVID-19 pandemic—the GDP increased only by 2.9% while total employment increased by 11.7%. Such an offbeat spread between the two measures, however, should not be seen as an exceptional case occurring incidentally before their “natural” relation is reset. Within a six-years period, total employment almost regained one-third of its pre-crisis level whereas the GDP, remained stable at an extremely low level. The labour market deregulations and the reorientation of fiscal policy seem to have played its own distinct role in the maintenance of such ambiguous evidence.
4. Labour Market Flexibility
Neoliberal prescriptions on how to deal with economic and social crises, to a great extent, reflect the same old ideas of the 1920s. Keeping inflation low through inflation targeting policies, following a tight monetary policy, balancing the fiscal budgets, and creating a general institutional framework of labour market flexibility, form the dominant policy package for resolving the problem of high unemployment. The IMF has supported the claim that deregulations of the labour market would eventually bring unemployment down by letting the free market create new jobs—“high and persistent unemployment can only be solved through structural reforms” [11]. In addition, within this framework, policy measures for increasing the valued added of economic activity of the high-tech sector must be taken into consideration [12]. However, the experience from the last decades shows that the inability of these policies to create the ideal competitive conditions required for the neoclassical paradigm to operate and to bring efficient results works as an excuse, rather than as a failure of the policymaking to achieve full employment.
Stockhammer [13] claims that labour market flexibility is regarded by the European institutions as a prerequisite of the broader Eurozone architecture to operate without frictions. The burden of adjustment falls almost exclusively on the shoulders of the wage-earners since all other policy options are restricted. A lower wage-share is assumed to have a positive effect on firms’ investment decisions that would eventually manage to activate the underutilized factors of production benefitting the macroeconomy. Concomitantly, neoliberal supporters argue that all kinds of labour market “rigidities” prevent real wages from declining as much as they should to eliminate unemployment. They aim towards removing the “rigidities” without offering any explanation as to why workers should accept a low-paid job that will deteriorate their living standards.
In the case of Greece, this policy framework was an integral part of the second EAP in 2012. As it made it apparent, one of its main purposes was the implementation of “direct measures to improve Greek competitiveness through internal devaluation” [14]. More specifically, the main macroeconomic purpose of internal devaluation is to carry out a set of measures that would bring the real exchange rate down. This is expected to create a more favourable market conditions for boosting exports and improving the trade balance. Contraction of wages and public expenditures along with labour market reforms is intended to contribute towards this objective. Moreover, Avdikos & Chardas [15] have also argued on the reorientation of the EU Cohesion Policy towards competitiveness, which suggests that this policy-framework gained a prominent place on the general macroeconomic mindset of the EU leadership. Hence, an interpretation for the presence of growthless employment in this peripheral country of the Euro may be offered by the qualitative aspect of employment which comes together with a substantially lower level of disposable income (see Figure 1). In this way, household consumption, one of the main components of aggregate demand, may be significantly affected and consumers’ prospects concerning their short and mid-term level of income may discourage their propensity to spend, having devastating consequences on the rate of growth.
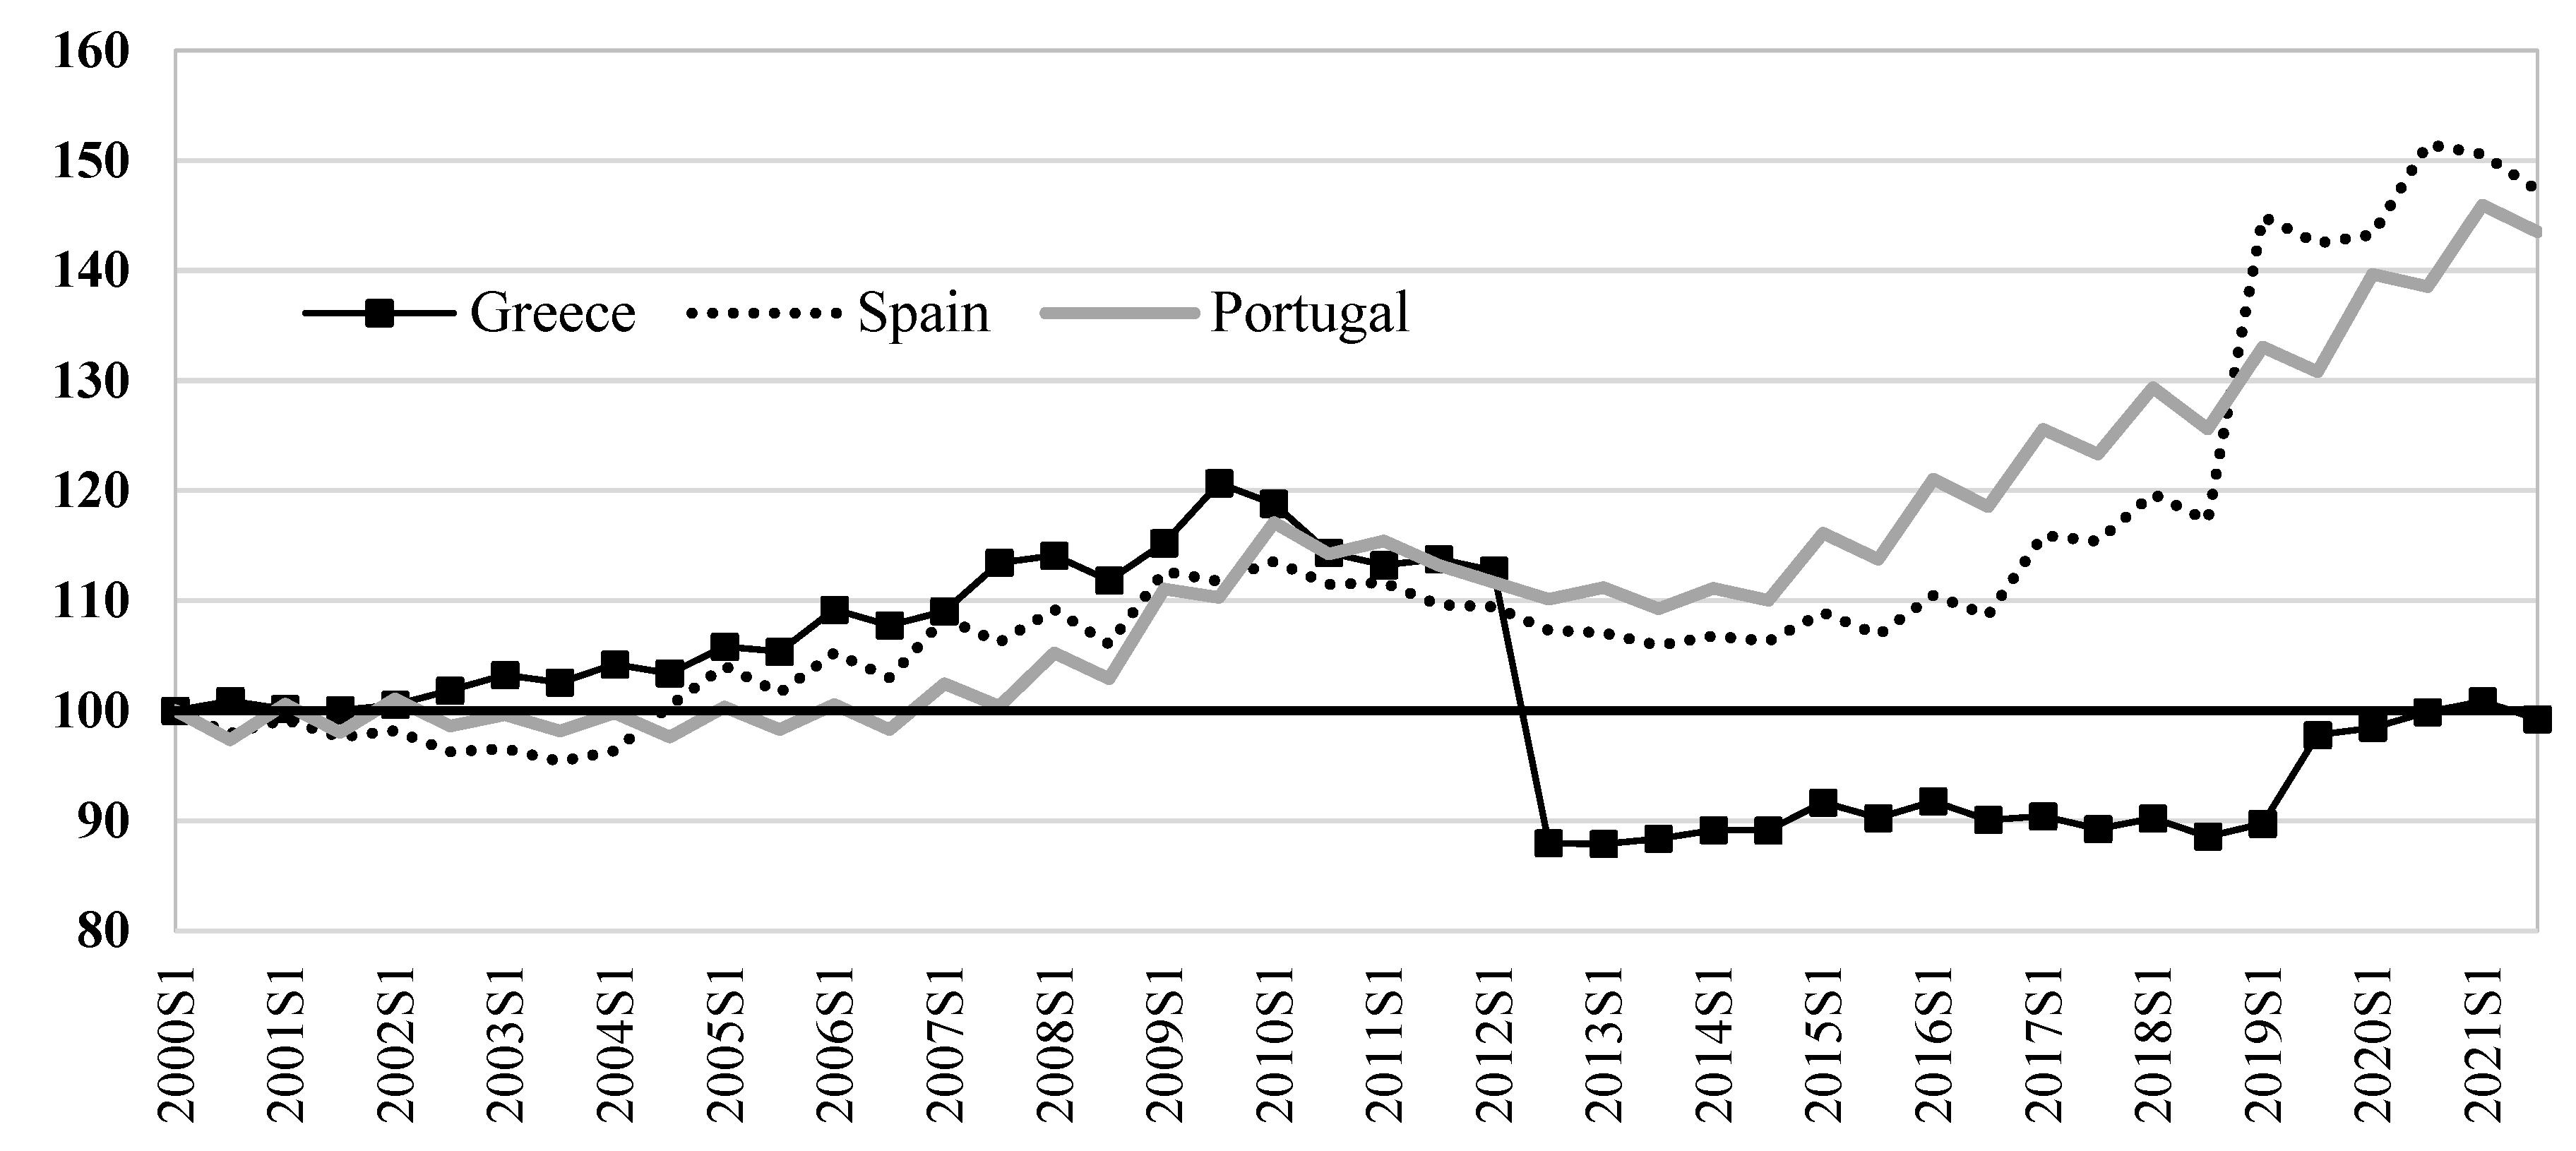
During the prolonged recession in Greece, labour protection laws were repealed, and employers acquired the power to determine the hours of work unilaterally. One of the issues which can better grasp the anti-labour bias expressed by the mainstream policy to overcome the Greek crisis, is depicted in Figure 3, where the real minimum wage is illustrated. Under the new law, which was enacted in 2012, collective bargaining was ceased, and the new minimum wage was decided to be set statutorily under ministerial decree. The biannual changes of the real (deflated by the Consumer Price Index) minimum wage for the countries of the European South (Greece, Portugal and Spain) are able to offer evidence concerning the varying level of flexibility that was introduced during the years of the crisis.
Between 2000 and 2009, the Greek real minimum wage was moving upwards by 20% while, in the mid-2012, it was revised downwardly by more than 20% while an additional, sub-minimum wage was introduced for the younger aged employees of less than 25 years old. Finally, in the end of 2021, the real value of the minimum wage was approximately estimated to have reached the same level of 2000. Spain and Portugal, on the other hand, followed a different approach. Their minimum wages were revised multiple times since 2009, increasing more than 30 percent between 2014 and 2021. Hence, the implemented policies for managing the Greek crisis seem to have been quite different to those adopted by the rest of the southern-European countries.
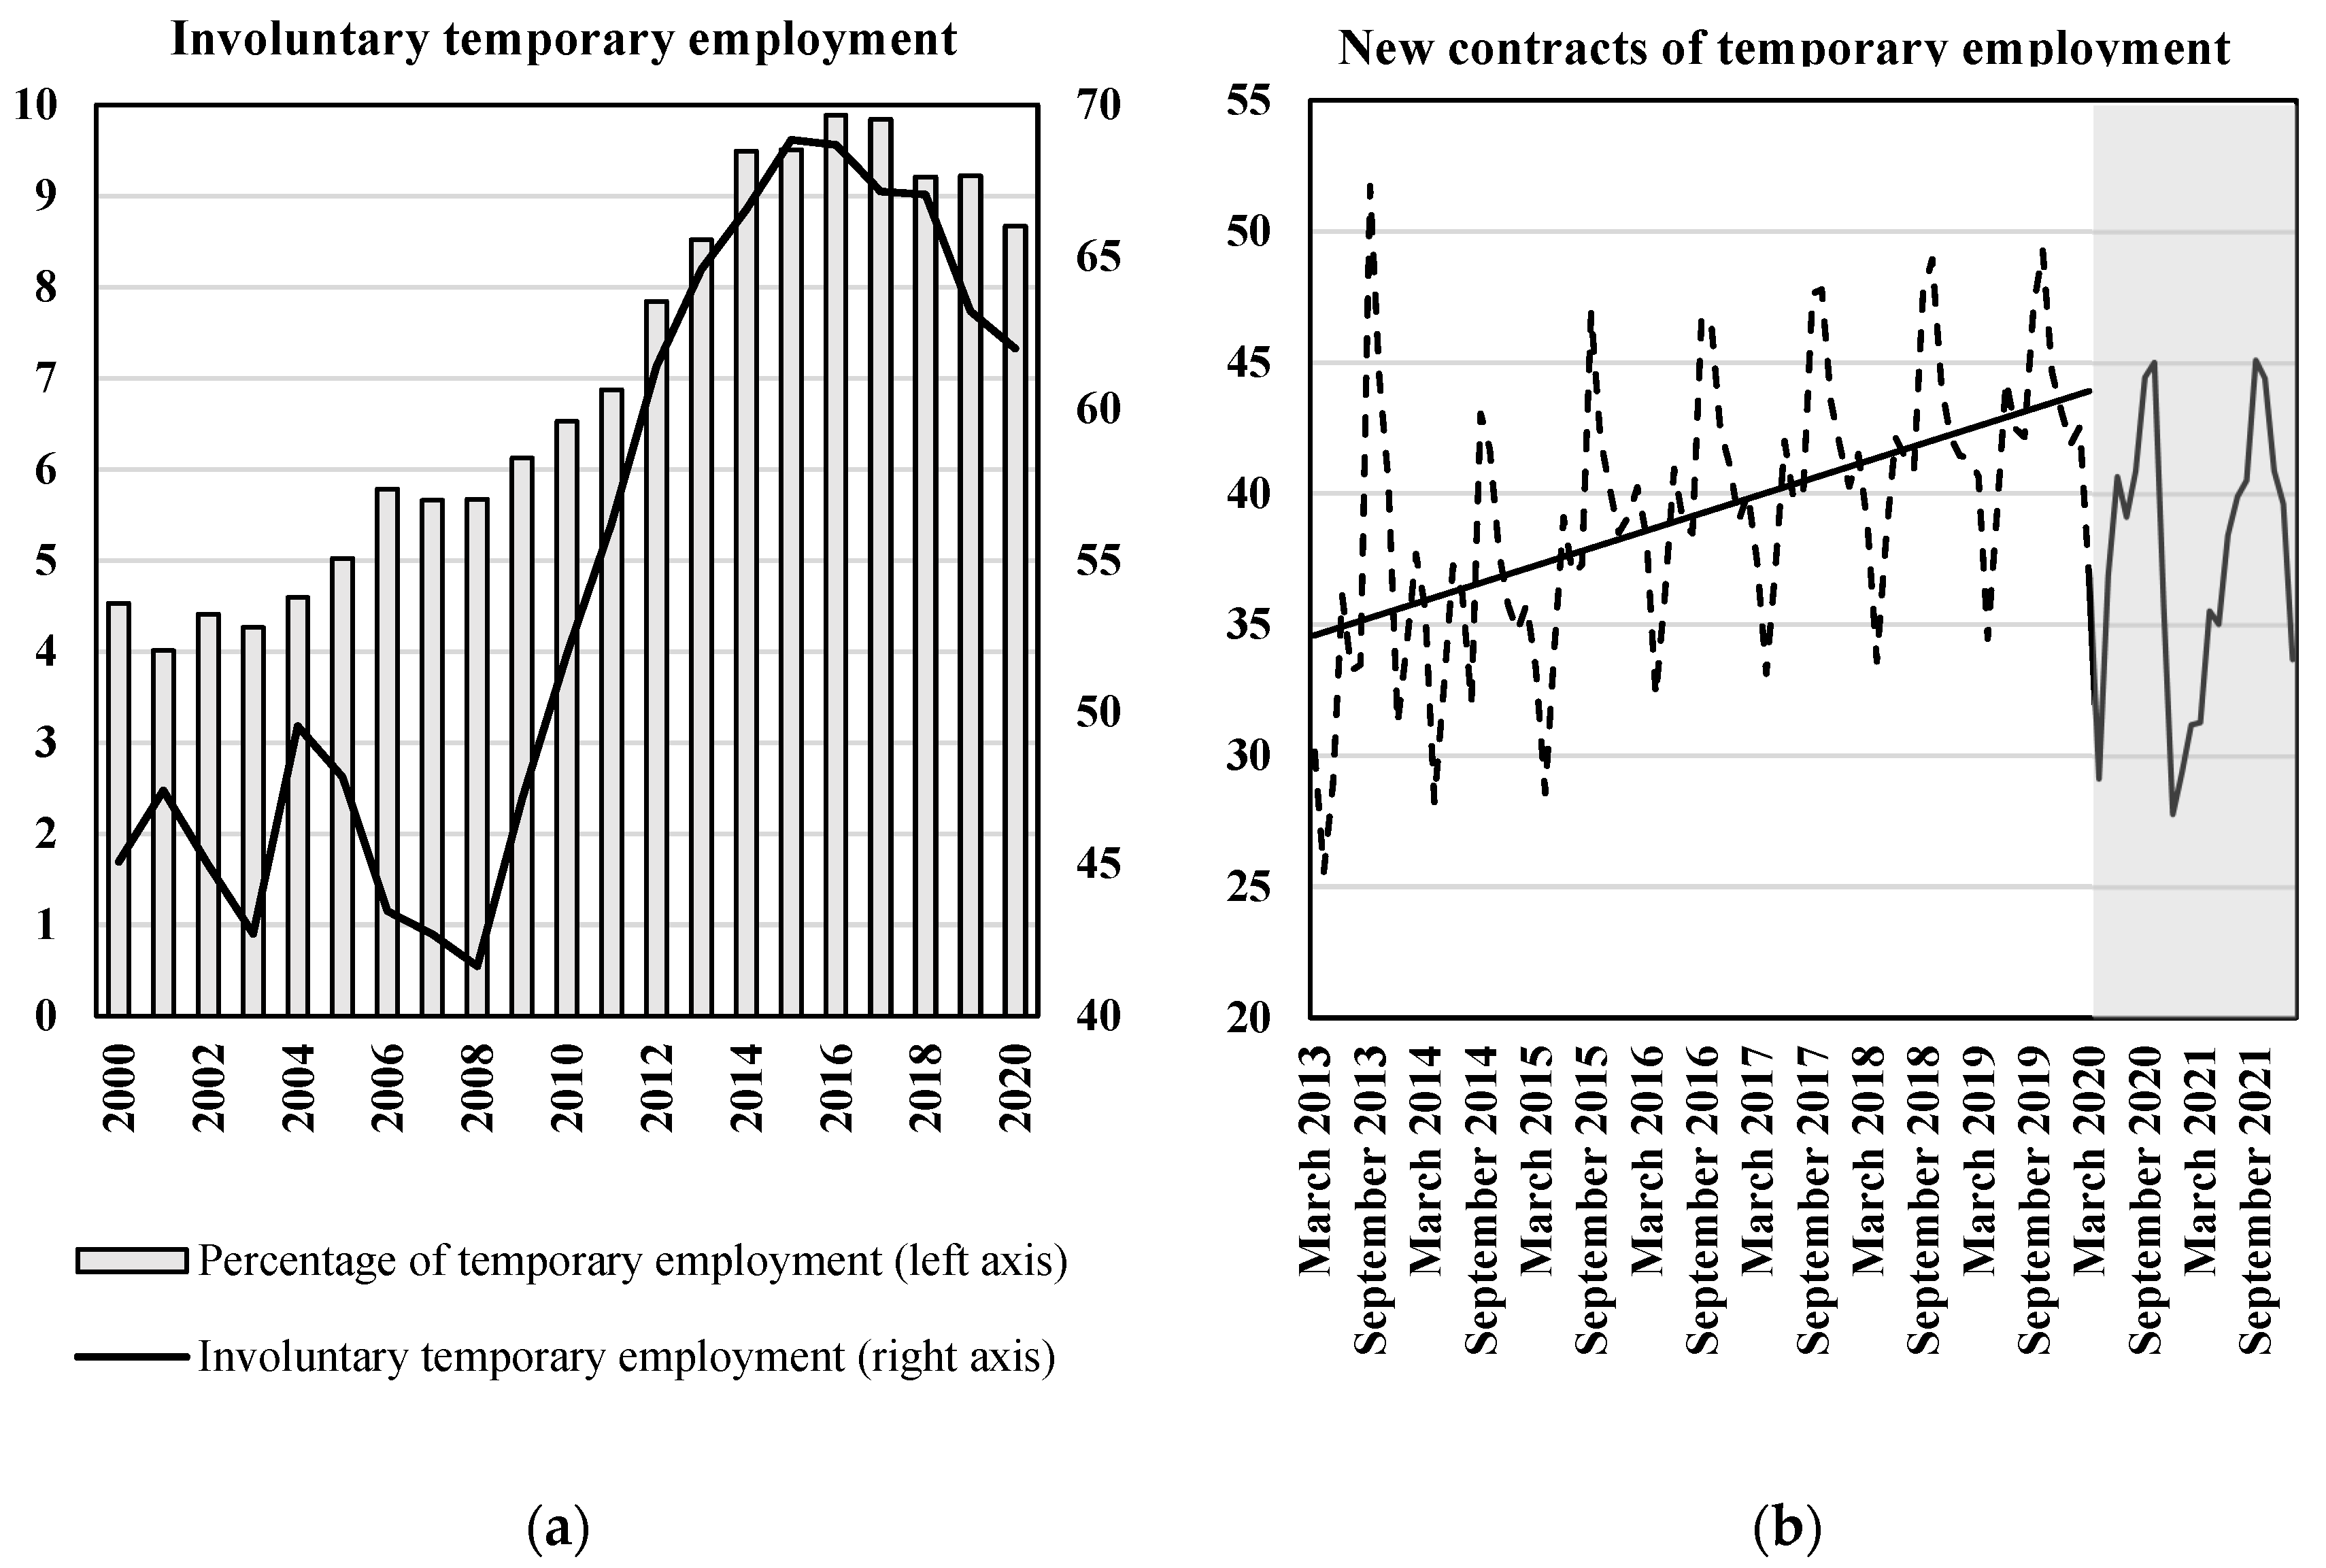
The introduction of flexibility as a necessary prerequisite for reducing unemployment in Greece is also indicated by the change in the scale of temporary employment. In late 2013, the rate of unemployment reached 27%, and from then on, the share of temporary employment gained a significant share of the new jobs created. As showed in Figure 4 (left-hand side), from 2013 to the first quarter of 2020 before the lockdown, the trend of the percentage share of new temporary employment contracts is portrayed upwards by 10 percent (from 35 to 45 percent). In other words, the average monthly share of temporary contracts was rapidly increasing, and unemployment was mitigated by creating new low-cost jobs.
The right-hand side of Figure 4 illustrates that during 2013–2018, the percentage share of temporary employment to overall employment was shifted to 10% and that a major part of it—almost 65%—was involuntary. This latter fact suggests that the majority of temporary employees were forced to accept these types of offered contracts as they could not find a full-time job to satisfy the need for increasing their labour-income. Missos [16] maintains that the changes which have occurred at the level of household income are permanent and that absolute poverty has been raised to unprecedented levels for the working, as well as the unemployed population.
5. Inequality and Poverty
Apart from its macroeconomic effects, the adopted measures of internal devaluation for addressing the consequences of the ongoing economic crisis in Greece has contributed to a significant drop in the population’s standards of living. Wage cuts and policies for labour market flexibility were also followed by an abrupt reduction in the social budget and a scaling down of the system of social protection. The introduction of a new safety net substituted the previous, “southern-European” model of social protection [17] which was characterized by generous social transfers and a redistributive rationale in public expenses. According to Ardagna [18] the introduction of a safety net is necessary for fiscal consolidation to achieve its policy targets. Missos [16] has maintained that as a policy recommendation, the safety net is consistent with the very logic of the neoliberal toolbox, since it is based on the idea of reallocating the previously defined scarce fiscal resources to that part of the population living in conditions of extreme poverty.
Evidence concerning the change in income inequality indices for Greece are depicted in Table 1 [19]. All calculations are original and are based on the 2011 and 2020 Surveys of Income and Living Conditions (SILC), annually published by the Eurostat, referring to incomes of 2010 and 2019. Hence, it appears that between 2010 and 2019, both Gini and Gini (pensions excluded) have been contracted. On the other hand, the Gini before all transfers (pensions and others) has increased. The latter reflects the enduring and intensifying need for social protection. In addition, the last column of Table 1 shows that the indices which appear to be highly sensitive to the upper part of the income distribution, suggest that the level of inequality has risen while the rest of the indices underline the fact that the overall level of dispersion of personal incomes has fallen.
Furthermore, Table 1 demonstrates that during the same period, the upper bound income of the first, poorest, decile of the population, calculated in current prices, has decreased by 14.3% whereas the upper bound income of the fifth decile of the population has contracted by 20.1% and the ninth’s by 24.2%. Be that as it may, the total level of distances among the deciles has shortened and all incomes have been reduced. This crucial finding, along with the rest of the results, shows that the dispersion within the upper income groups is greater than that which is found in the lower parts of the distribution. Thus, these results can provide a clear indication concerning the fervency with which internal devaluation was implemented and the reduction which was caused on the standards of living of the Greek population.
At this point, it is important to highlight upon the close relation that exists between austerity policy and the mainstream view of measuring poverty. All major think tanks, such as the World Bank or the IMF, regard the state of poverty as an exclusively relativistic issue that is defined by the ongoing economic conditions of income. More specifically, the income threshold below which an individual is considered to be “poor” is calculated at 60% of the median income. Undoubtedly, the relative poverty approach can offer some crucial insights concerning the current state of poverty. However, this rather simplistic way of capturing poverty is by no means ideologically neutral. The acceptance of the relativist approach to poverty can be seen as a first step towards the approval of the validity of internal devaluation policies since it is able to soften the magnitude of its outcomes to society by toning down the range of the population affected.
For example, though the poverty threshold in Greece has fallen by one-fifth, the official rate of poverty has decreased from 21.4% in 2010 to 17.7% in 2019. An interesting first aspect is revealed by examining the difference between the various rates of poverty. Between 2010 and 2019, the poverty rate and the poverty rate after transfers (pensions excluded) decreased, whereas the poverty rate before all transfers was estimated to increase. The different level of outcomes that exist between these indices may underline the importance of social transfers in lowering the overall level of inequality. The role of social transfers in maintaining the level of disposable income becomes more important as income from other sources recedes.
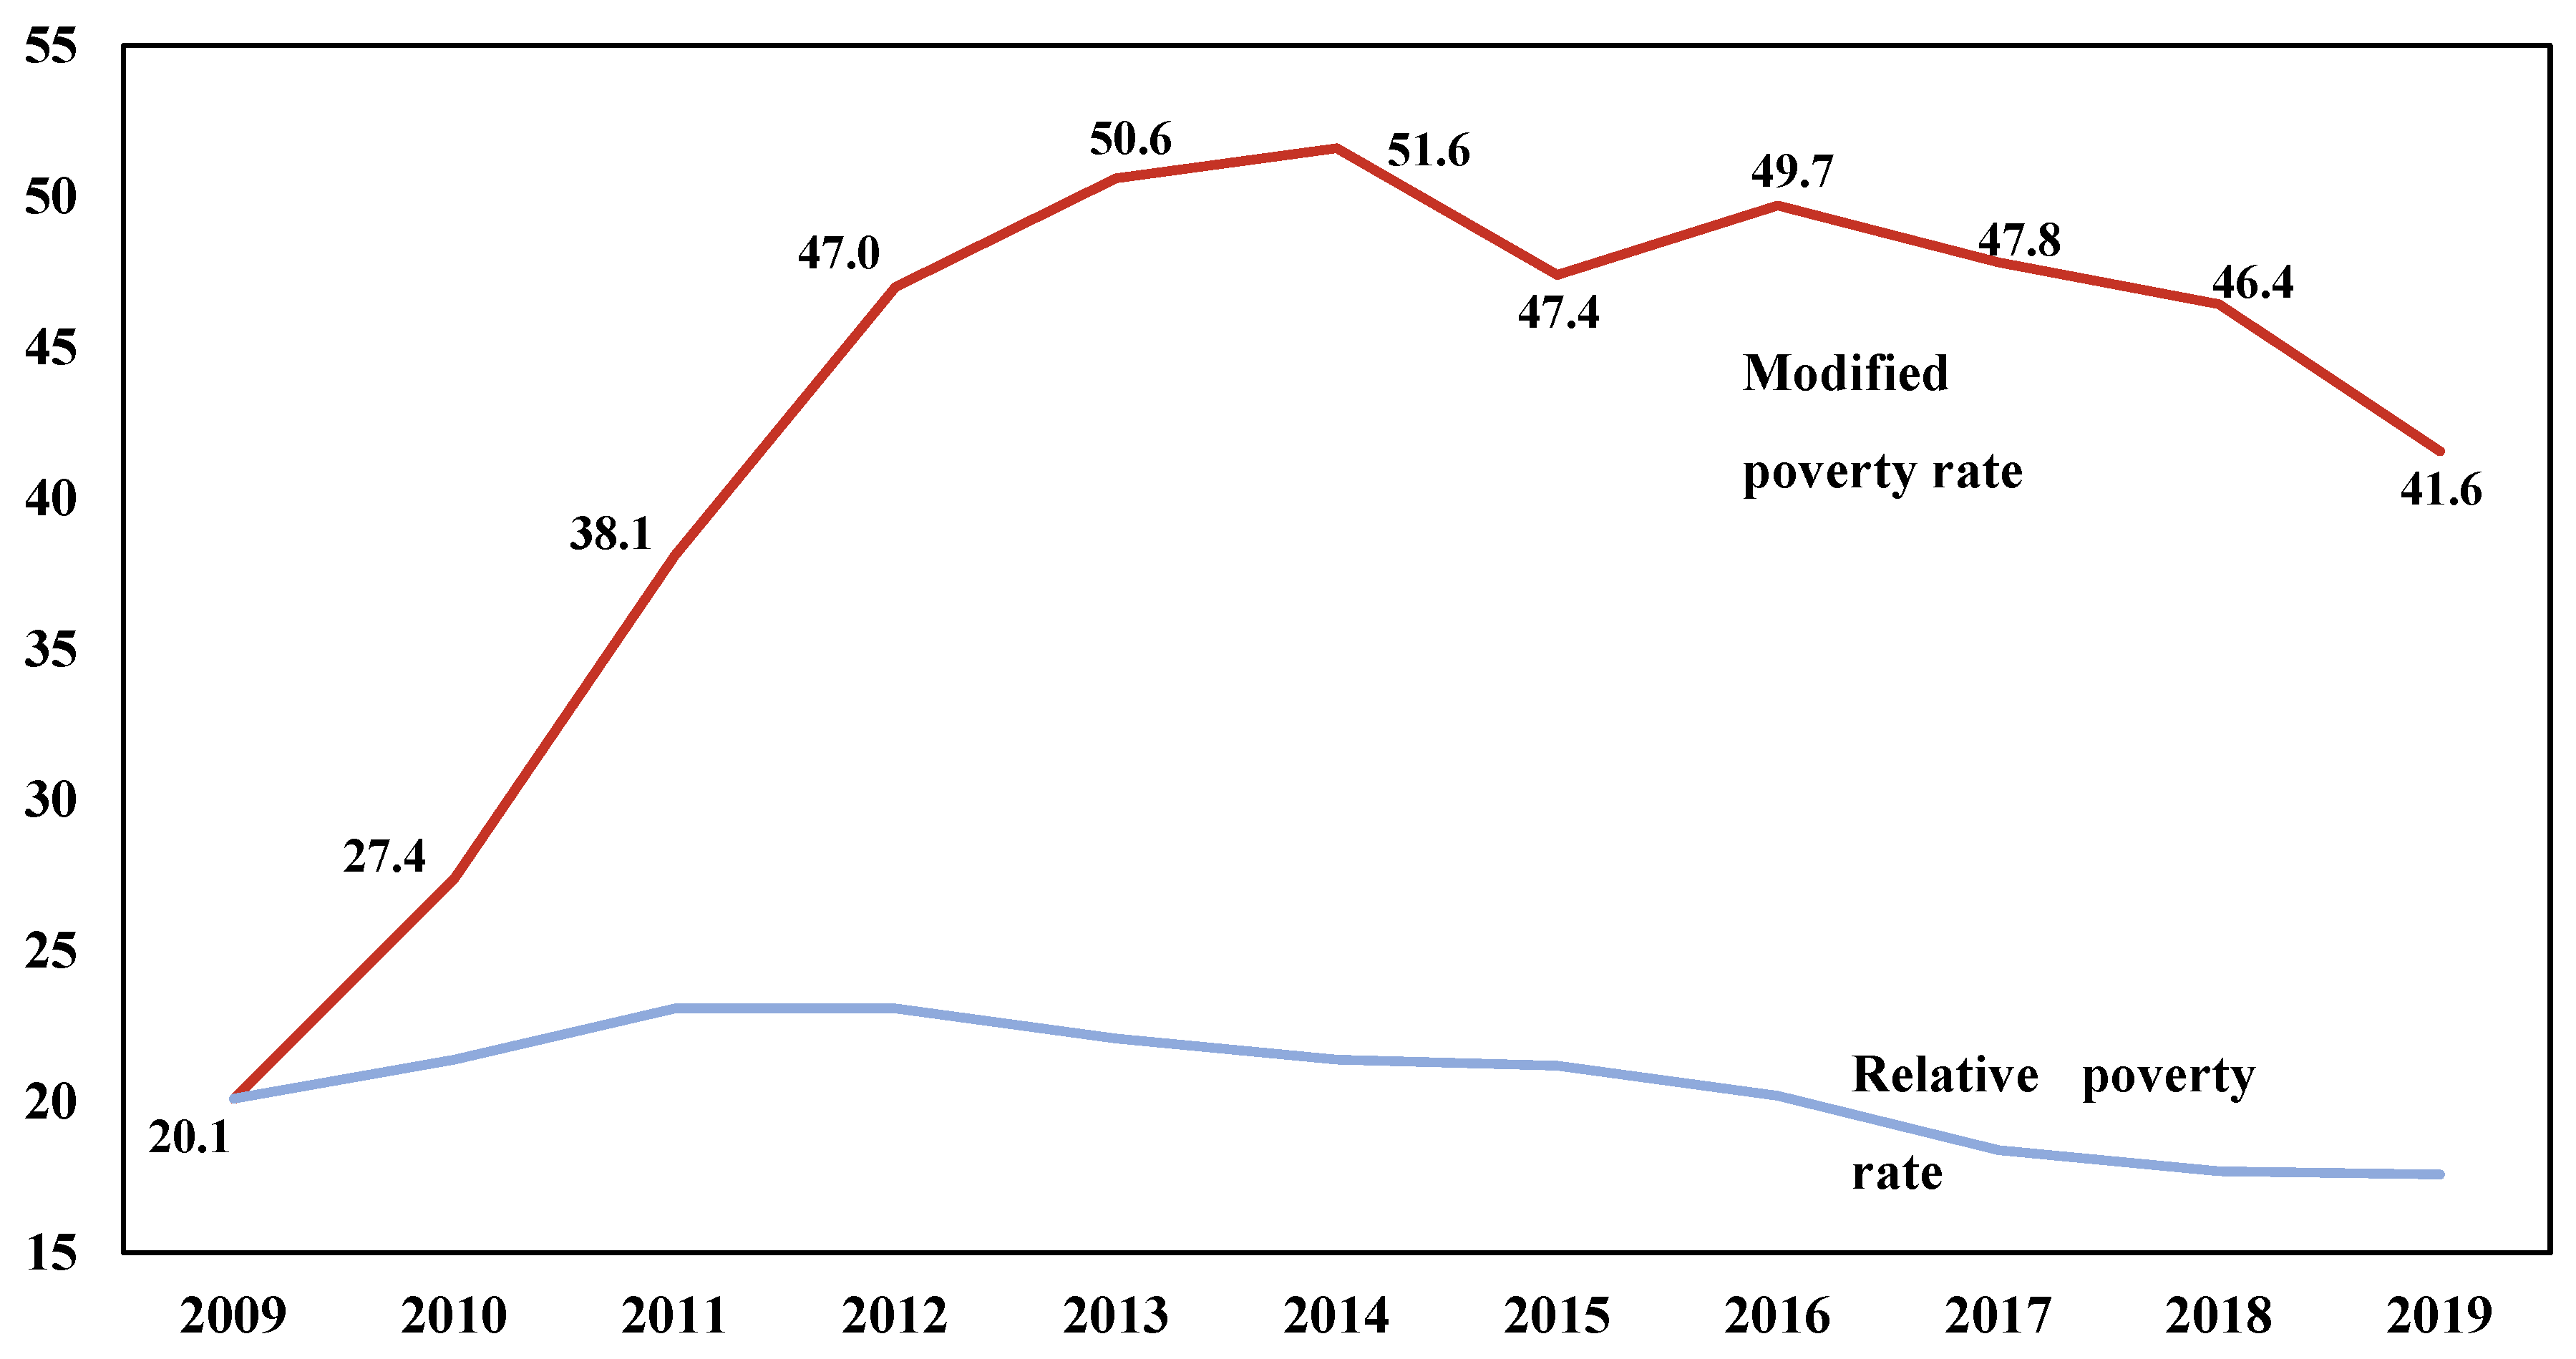
An alternative, more complex, measure of poverty that captures the real income effects of austerity policy is suggested below. A modified poverty rate, calculated by holding the poverty threshold fixed in time and which takes the consumer price index (CPI) into account, is proposed as a substitute to the relative rate used by the mainstream thought and policy makers. Its importance lies on the fact that it provides a better understanding of the level of income depreciation and presents a better understanding of the impact of fiscal internal devaluation policies. A version of a similar measure has also been recommended by Papatheodorou & Papanastasiou [20] and by Missos [21], presenting the alternative poverty rate published by Eurostat which calculates the percentage of the population living with less than the 2007 poverty threshold. However, the proposed modification is differentiated in two respects. First, it is based on the 2009 threshold, i.e., the year when Greece’s median income reached its peak. In this way, a more conclusive approximation of the real social cost of economic adjustment is made and the distance to full recovery is better appreciated. Second, the new measure is based on recalculating the micro-data by using the CPI to be expressed in real deflated prices.
The spread between this modified rate and the mainstream relative rate for Greece is illustrated in Figure 5. The differences between the two are striking. The modified version suggests that in 2014 for example, 51.6 percent of the population was living below the 2009 poverty threshold level. Ten years after the beginning of the crisis in 2019, 41.6 percent of the population is estimated to live with less than the 2009 poverty threshold. In accordance, the income adjustment process imposed by the austerity policy mix was very intense, and the road to recovery seems to be longer than that which was initially considered.
One of the main advantages of this modified concept is that it provides a solid starting basis for interpreting the low employment effect to growth that appears to bring forward the status of growthless employment. Overall household income was sharply reduced, and the newly created jobs were unable to provide for the level of private consumption necessary to stimulate growth. Moreover, Greece was faced with an unforeseen migration outflow of working aged population which seriously affected its economic prospects. This rather unnoticed aspect should be seen as having a long-term consequence on its social and economic life.
6. Net Migration Flows
Migration is generally considered to contribute to the labour market in both low and high-skilled occupations and to address labour market imbalances. For example, Jauer et al. [22] emphasise its close relationship with labour market mobility and indicate that it can absorb as much as a quarter of the labour market shock. As far as Greece is concerned, with little or no room for fiscal manoeuvring and no monetary tools available, the role of immigration on the labour market can become more important. Hence, in this section, we comment on the significance of the migration flows in Greece, as a mechanism of relieving the consequences of devaluation measures.
More particularly, the social impact of the population’s age structure has been one of the European Commission’s main concerns. The European Commission [23] has reported on the social and economic effects of the demographic changes in Europe and has attempted to frame a set of policies to address the issue. Primarily, one of the most important effects of the long-term demographic developments is to be found on the capacity of the national social protection systems to provide the means for supporting the standards of living. Hence, it is expected that the gradual and continuous trend of population-aging that has been ongoing for five decades would affect its balance sheet.
Moreover, the interim report concerning the “Growth Plan for the Greek Economy” [24] highlights that “in the medium term, the economic outlook is deteriorating due to the unfavorable demographic characteristics of the country. The number of births is declining, the age distribution is worsening at the expense of the economically active, while there is a strong negative net migration flow, especially at the most productive ages of the population”. From this viewpoint, in what follows, we focus on the long-term diminishing ratio of births over deaths and the changing levels of the net migration flows. The prolonged period of economic recession (2009–2016) formed the particular circumstances within which the historical deteriorating trend of population ageing was accelerated. The critical period of the pandemic has been left out of the present analysis.
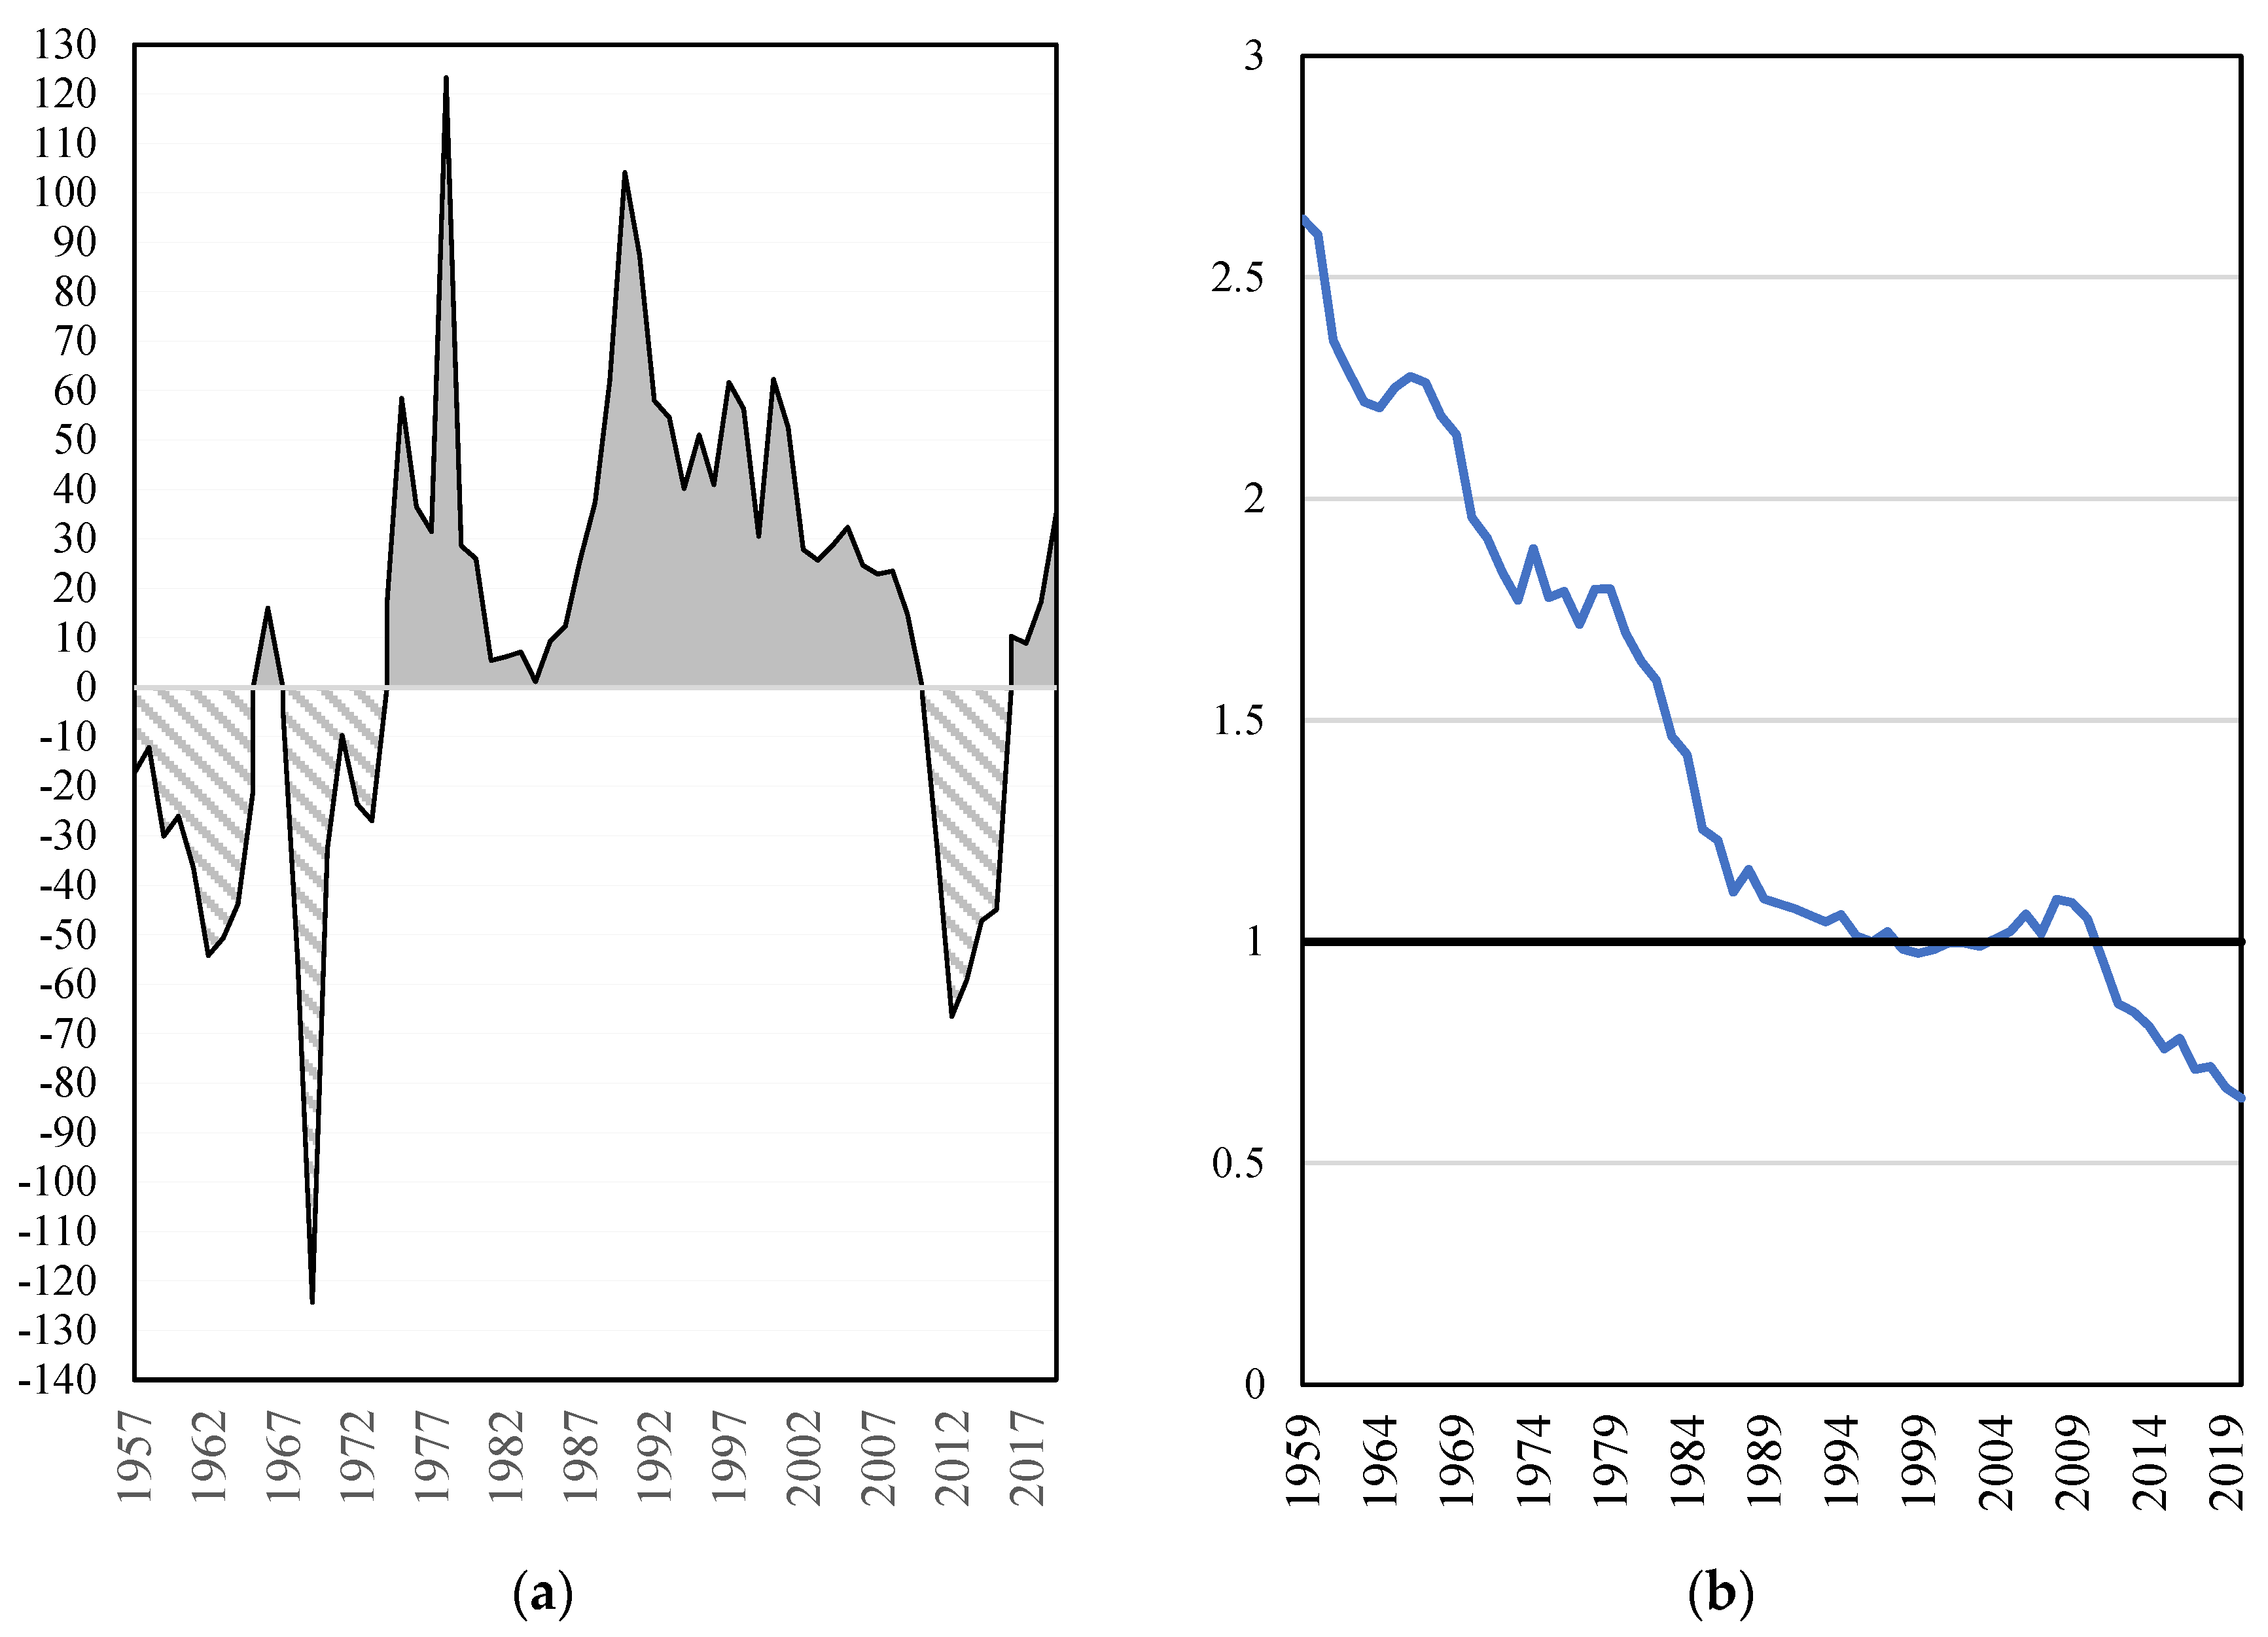
On the right-hand side in Figure 6, the ratio of total annual births over deaths is demonstrated from 1959–2020 for Greece. As it becomes apparent, the overall trend is downward and from 1994 to 2009, seems to have balanced around the unit, indicating an equilibrium between deaths and births. From then onwards, the number of deaths exceeds that of births. Birth deficit in Greece should become a problem of immediate concern, capable of causing a serious damage to the potential inflow on the labour market as well as on the overall performance of the system of social security.
In addition to the natural movement of the population reflected in the birth-death balance, the age distribution of the countries is also affected by migration flows. Therefore, the final population balance outcome is the result of all these parameters. Regarding Greece, the net migration flow is shown in right-hand side of Figure 6, depicting the long-term results from 1957 to 2020. The concept of net migration flows is derived as the difference between the birth-death balance (natural movement of the population) and the total estimated population. When positive (negative), it designates an influx (outflow) of migrants. Therefore, the figure does not capture the absolute number of migrants entering or leaving the country, but it is an indication of the final balance or net flow.
During the period from 1957 to 1974 (with the exception of 1965), Greece recorded a net migratory outflow. This trend was completely reversed during the following period spanning from 1975 to 2009. The return of the migratory outflow of the population during the period 2010 to 2015 is important for at least three reasons. First, it is the first time since 1974 when the continuous inflow of population was interrupted. Secondly, the outflow of migrants takes place in a completely different socio-political environment, in which, however, the level of population ageing in Greece is more intense than that which prevailed in the period 1957 to 1973. Third, the time span is shorter, but on an annual basis, the migratory outflow is much more intense. The annual net outflow before 1974 was 35.5 thousand people (of all ages) per year, while during the financial crisis, it reached 41.9 thousand people per year.
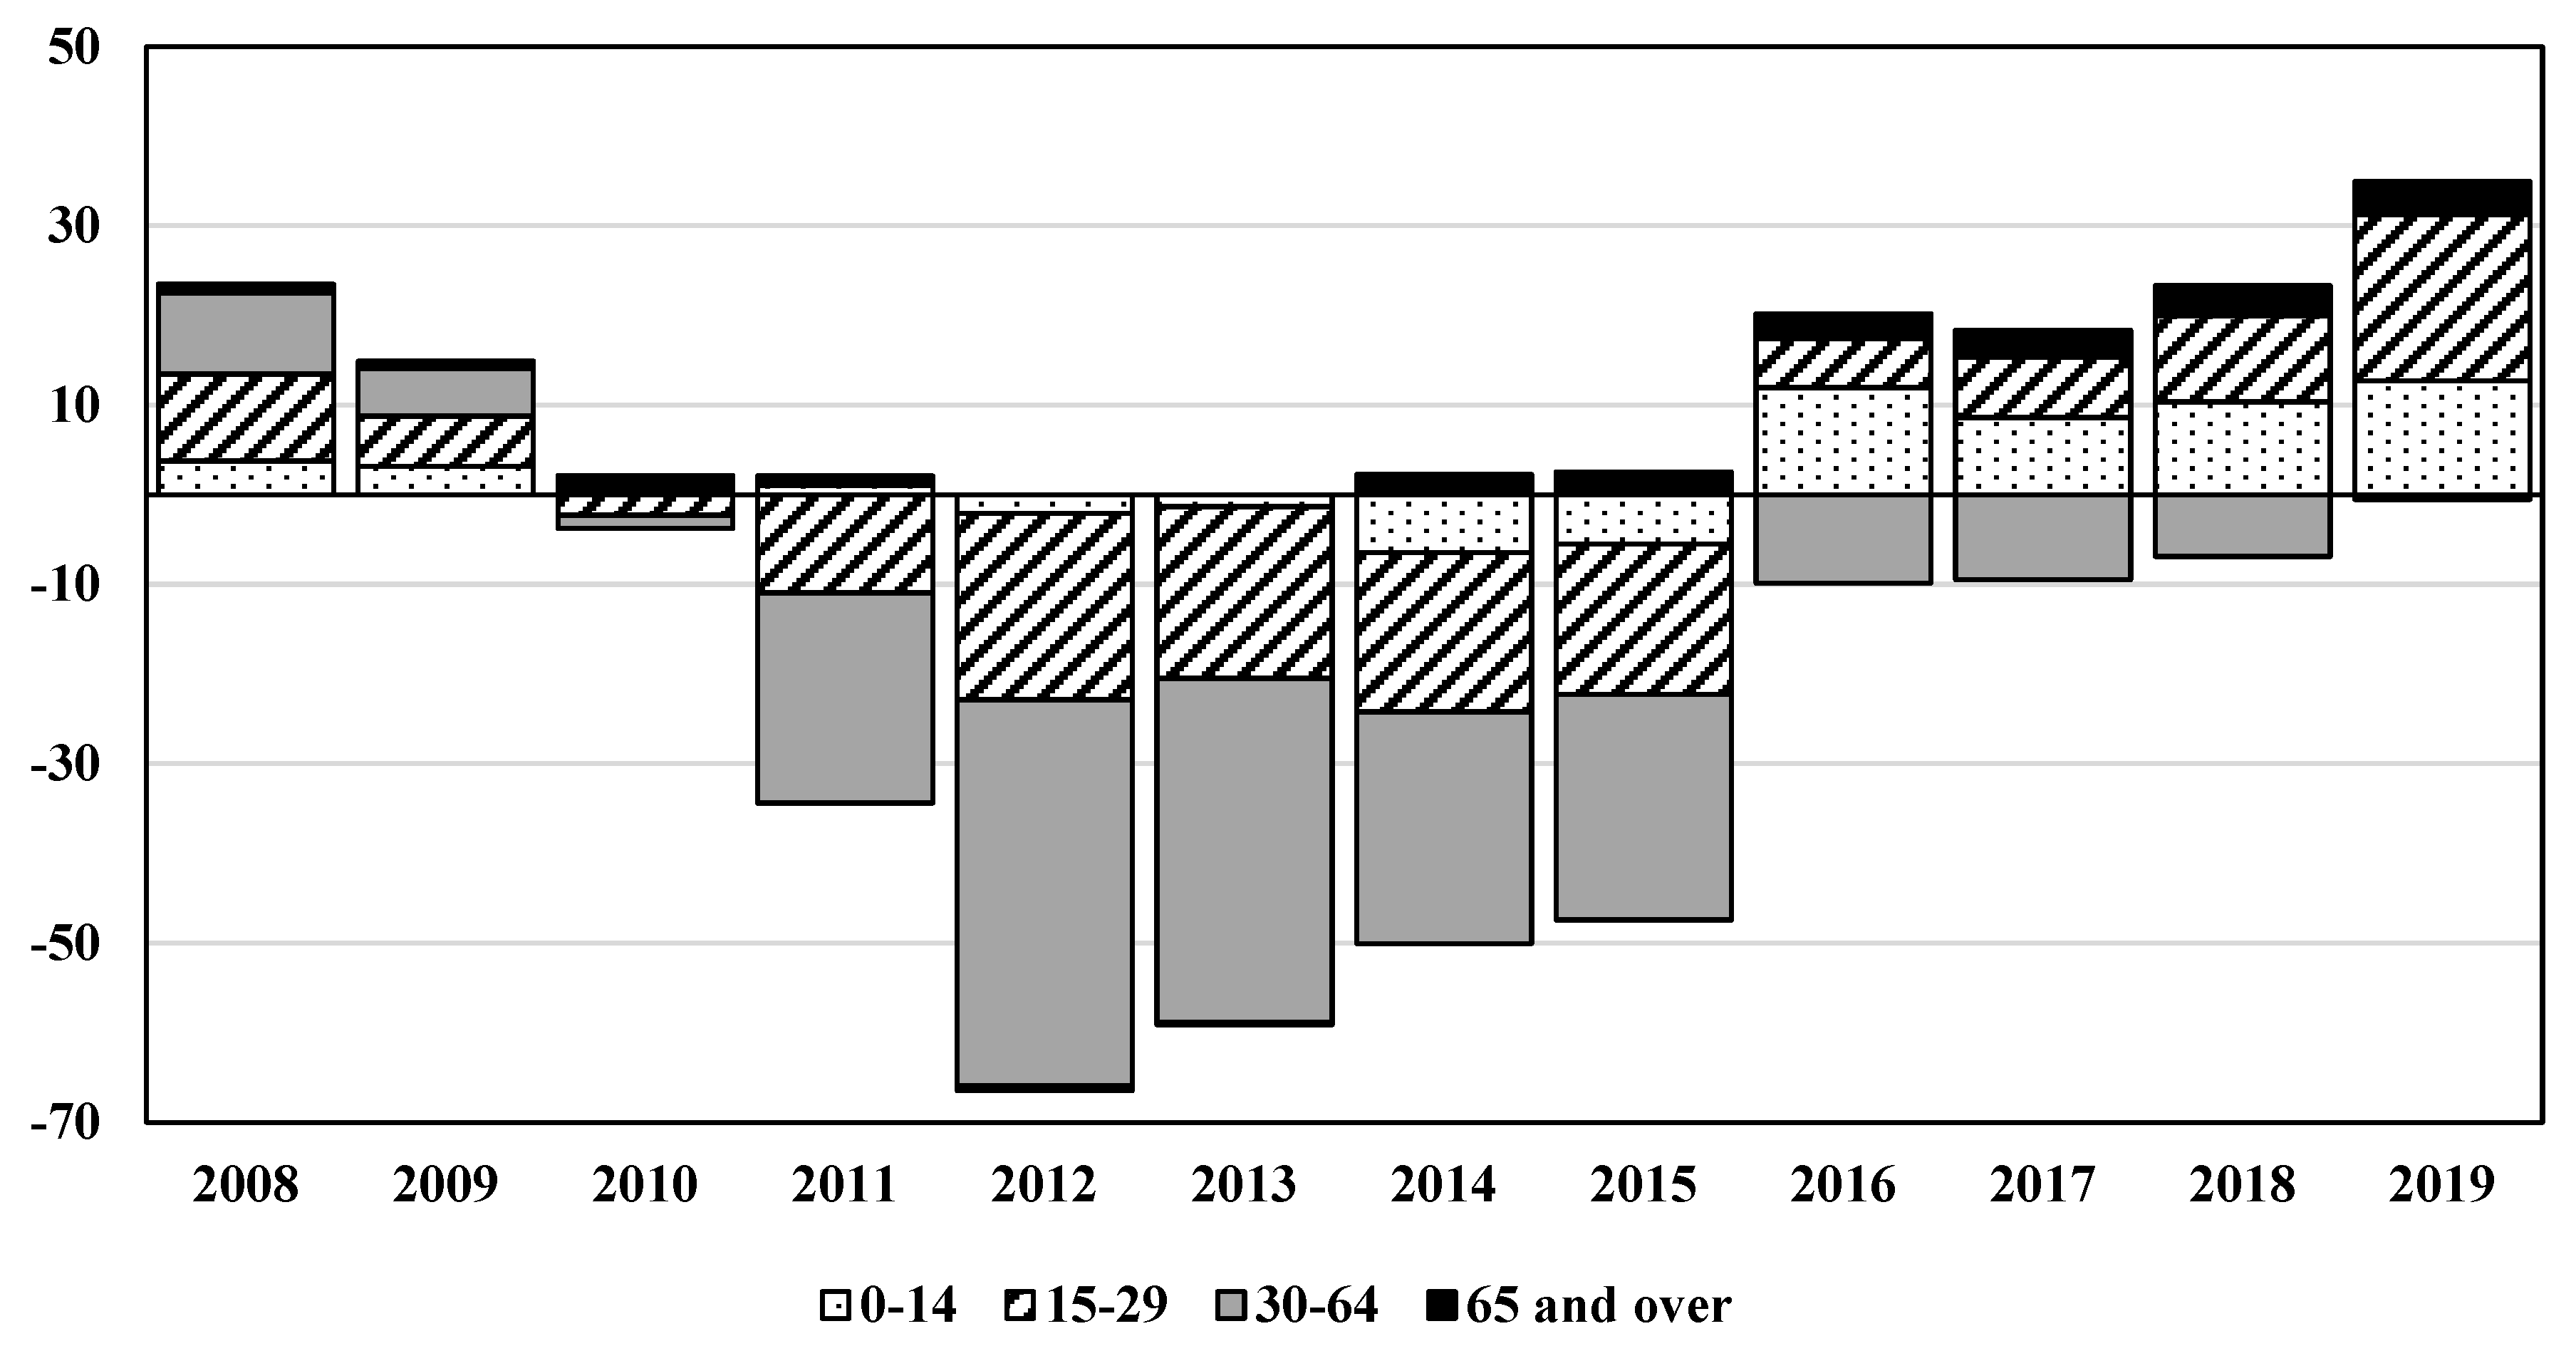
From 2016 onwards, net migration becomes positive. However, an upsetting parameter which creates the conditions for further deterioration of the population ageing concerns the specific structure of age-group balances. Focusing on the developments of the post-2008 net migration flows, it is possible to examine the balance of specific age-groups. Figure 7 depicts the overall tendency of the population to flee the country. Hence, by examining the outgoing and incoming age groups, we may be in a position to assess a qualitative aspect of the overall positive flow.
Figure 7 presents the net migration of particular age groups. Between 2010 to 2015, while the net migration flow result is negative, the age group of 65 years and over is positive, indicating that this age-group keeps entering the country. This trend does not stop even during the 2016 to 2019 period. On the contrary, the outflow of younger age groups and especially the productive age of 30 to 64 are flowing out of the country. The trend is only partially reversed from 2016 onwards when the flow of the productive age-group (30 to 64 years old) continues to be negative.
7. Conclusions
More than a decade after the 2009 crisis, the standards of living of the Greek population are still contracting. Income prospects are unfavourable. The level of disposable income has diminished by more than one-third, while the implemented economic policy mix has set the scene for the population to adjust to a less commodious way of life. However, the social impact of the implemented policies of internal devaluation and market deregulation is hard to assess. The consequences were devastating, and a full appreciation of the economic effects requires time.
Low-paid jobs, created within a deregulated labour-market, seem unable to stimulate growth. Moreover, macroeconomic data suggests that the GDP is not able to provide a clear picture of the intensity of the process of economic adjustment. Policy recommendations included a mix of fiscal consolidation, labour-flexibility, and wage-cuts, which necessarily caused a substantial contraction of the disposable income. This downward pressure on income, however, was far from equally allocated among the different income-groups.
Hence, the need for a more ambitious employment policy that would set targets towards a higher level of wage is of utmost importance. This view is moreover supported through the formulation of a modified, fixed-in-time rate for measuring poverty, showing that ten years after the beginning of the Greek crisis, more than 40 percent of the population was still living on less than the 2009-poverty threshold. In addition, income inequality indicators can demonstrate that the lower-income households were disproportionally affected. On that account, it is argued that the state of growthless employment is not a paradox. The introduced concept is used to indicate that the conditions necessary for the economy to operate as a way of improving the population’s living standards are absent. From a theoretical point of view, the demand-led growth model by Naastepad and Storm [5] allows for the case of employment growth caused by reducing wages to have a low effect on GDP growth in the case of a wage-led economy. However, empirical evidence is also able to offer new insights as far as the social consequences of internal devaluation. In summary, Greece is an ideal case to introduce the concept of growthless employment. Future research efforts should investigate this concept to other countries with similar characteristics to Greece and, especially, to the so called, Southern Europe economies.
Author Contributions
Conceptualization, V.M., N.R. and G.S.; methodology, V.M., N.R. and G.S.; formal analysis, V.M., N.R. and G.S.; writing—original draft preparation, V.M., N.R. and G.S.; writing—review and editing, V.M., N.R. and G.S.; supervision, V.M., N.R. and G.S. All authors have read and agreed to the published version of the manuscript.”
Funding
This research received no external funding.
Institutional Review Board Statement
Not applicable.
Informed Consent Statement
Not applicable.
Data Availability Statement
Not applicable.
Conflicts of Interest
The authors declare no conflict of interests.
References
- Greek NPB. The Productivity and Competitiveness of the Greek Economy, Annual Report 2019, Centre of Planning and Economic Research. 2019. Available online: https://www.kepe.gr/images/npb/NPB_Annual_Report_2019.pdf (accessed on 11 May 2022).
- Morán-Álvarez, J.-C. Keys for the design of economic policy today. In Spanish: Claves Para el Diseño de la Política Económica en la Actualidad; Piramide: Madrid, Spain, 2014. [Google Scholar]
- Maris, G.; Flouros, F. Economic crisis, COVID-19 pandemic, and the Greek model of capitalism. Evol. Inst. Econ. Rev. 2021, 19, 469–484. [Google Scholar] [CrossRef]
- Mariolis, T.; Rodousakis, N.; Katsinos, A. Wage versus currency devaluation, price pass-through and income distribution: A comparative input-output analysis of the Greek and Italian economies. J. Econ. Struct. 2014, 8, 1–23. [Google Scholar] [CrossRef]
- Naastepad, C.; Storm, S. Feasible egalitarianism: Demand-led growth, labour and technology. In Handbook of Alternative Theories of Economic Growth; Edward Elgar: Cheltenham, UK, 2010; pp. 311–330. [Google Scholar]
- World Bank. India: Poverty, Employment and Social Services. In A World Bank Country Study; The World Bank: Washington DC, USA, 1989. [Google Scholar]
- Eichengreen, B.; Gupta, P. The Service Sector as India’s Road to Economic Growth, Working Paper No.16757, National Bureau of Economic Research. 2011. Available online: https://www.nber.org/papers/w16757 (accessed on 9 May 2022).
- Papola, T.-S. Economic Growth and Employment Linkages: The Indian Experience. In Working Paper No. 2013/01; Institute for Studies in Industrial Development: Cheltenham, UK, 2013; Available online: http://103.82.220.134/pdf/WP1301.pdf (accessed on 12 May 2022).
- Foley, D.; Michl, T.-R. Growth and Distribution; Harvard University Press: Cambridge, MA, USA, 1999. [Google Scholar]
- Missos, V.; Rodousakis, N.; Soklis, G. A Race to the Bottom: Measuring Income Loss and Poverty in Greece, Policy Note 2/2022 April 2022. Levy Economics Institute of Bard College. Available online: https://www.levyinstitute.org/pubs/pn_22_2.pdf (accessed on 18 May 2022).
- IMF. Unemployment and Labour Market Institutions: Why Reforms Pay off. Growth and Institutions, World Economi Outlook, April 2003, International Monetary Fund. Available online: https://www.elibrary.imf.org/view/books/081/07990-9781589062122-en/ch04.xml (accessed on 11 May 2022).
- Burkynski, B.; Iermakova, O.; Laiko, O. Stategic directions for increasing the gross value added of the high-tech sector (on the example of the Ukraine economy). Entrep. Sustain. Issues 2021, 8, 508–523. [Google Scholar]
- Stockhammer, E. The Euro Crisis and Contradictions of Neoliberalism in Europe, PKESG, Working Paper 1401. 2014. Available online: https://www.postkeynesian.net/downloads/wpaper/PKWP1401.pdf (accessed on 12 May 2022).
- IMF. Greece: Request for Extended Arrangement under the Extended Fund Facility, IMF Country Report No. 12/57, International Monetary Fund. 2012. Available online: https://www.imf.org/external/pubs/ft/scr/2012/cr1257.pdf (accessed on 12 May 2022).
- Avdikos, V.; Chardas, A. More (place-based and conditional) growth-less redistribution and cohesion. Territ. Politics Gov. 2016, 4, 97–117. [Google Scholar] [CrossRef]
- Missos, V. Introducing a safety net: The effects of neoliberal policy on welfare, poverty and the net social wage during the Greek crisis. Rev. Radic. Political Econ. 2021, 53, 58–76. [Google Scholar] [CrossRef]
- Ferrera, M. The southern model of welfare in social Europe. J. Eur. Soc. Policy 1996, 6, 17–37. [Google Scholar] [CrossRef]
- Ardagna, S. Determinants and Consequences of Fiscal Consolidation in OECD Countries.: European Economy. European Commission. 2009. Available online: https://ec.europa.eu/economy_finance/events/2007/workshop17jan2008/ardagna_en.pdf (accessed on 11 May 2022).
- Missos, V. Comparing income inequality indices between 2010 and 2019 in Greece. Greek Econ. Outlook 2021, 46, 45–48. [Google Scholar]
- Papatheodorou, C.; Papanastasiou, S. The Greek Depression: Poverty Outcome and Welfare Responses. East-West J. Econ. Bus. 2018, XXI, 205–222. [Google Scholar]
- Missos, V. The Greek Tragedy in Times of Austerity; A Vision for Europe; Eris: London, UK, 2019. [Google Scholar]
- Jauer, J.; Liebig, T.; Martin, P.; Puhani, P. Migration as an Adjustment Mechanism in the Crisis? A Comparison of Europe and the United States, IZA DP No.7921, Discussion Papers Series. 2014. Available online: https://ftp.iza.org/dp7921.pdf (accessed on 9 May 2022).
- European Commission. European Commission Report on the Impact of Demographic Change, Secretariat-General. 2020. Available online: https://ec.europa.eu/info/sites/default/files/demography_report_2020_n.pdf (accessed on 12 May 2022).
- Pissarides, C. Growth plan for the Greek economy, interim report [in Greek: Σχέδιο ανάπτυξης για την ελληνική οικονομία, Ενδιάμεση Έκθεση, Ιούλιος 2020]. Available online: https://government.gov.gr/schedio-anaptixis-gia-tin-elliniki-ikonomia-endiamesi-ekthesi/ (accessed on 12 May 2022).
Figure 1.
How long recessions last? Changes from peak GDP (100) during recessions documented for Argentina (1998), Greece (2009) and USA (1929). Source: Eurostat, OECD and author’s calculations.
Figure 1.
How long recessions last? Changes from peak GDP (100) during recessions documented for Argentina (1998), Greece (2009) and USA (1929). Source: Eurostat, OECD and author’s calculations.

Figure 2.
Gross Domestic Product (GDP) and Gross Disposable Income (GDI) (a) and GDP and Total Employment (b) compared to 2009q1 (100), 2009q1–2021q3, Greece. Source: ELSTAT and authors’ calculations.
Figure 2.
Gross Domestic Product (GDP) and Gross Disposable Income (GDI) (a) and GDP and Total Employment (b) compared to 2009q1 (100), 2009q1–2021q3, Greece. Source: ELSTAT and authors’ calculations.

Figure 3.
Biannual level of the Minimum Wage deflated, Greece, Portugal and Spain, 2000–2021 (2000S1 = 100). Source: Eurostat and authors’ calculations.
Figure 3.
Biannual level of the Minimum Wage deflated, Greece, Portugal and Spain, 2000–2021 (2000S1 = 100). Source: Eurostat and authors’ calculations.

Figure 4.
New contracts of temporary employment as a percentage share of total new employment contracts (a) and involuntary temporary employment (b), Greece. Source: Ministry of Labour and Social Affairs, ELSTAT and authors’ calculations.
Figure 4.
New contracts of temporary employment as a percentage share of total new employment contracts (a) and involuntary temporary employment (b), Greece. Source: Ministry of Labour and Social Affairs, ELSTAT and authors’ calculations.

Figure 5.
Relative Poverty Rate (percent) and Poverty Rate (percent) Fixed in Time and Deflated (2009 = 100), Greece, 2009–2019. Source: Hellenic Statistical Authority and authors’ own calculations.
Figure 5.
Relative Poverty Rate (percent) and Poverty Rate (percent) Fixed in Time and Deflated (2009 = 100), Greece, 2009–2019. Source: Hellenic Statistical Authority and authors’ own calculations.

Figure 6.
Net migration flow (a, in thousands) and births over deaths ratio (b), 1957–2020, Greece. Source: ELSTAT and authors’ calculations.
Figure 6.
Net migration flow (a, in thousands) and births over deaths ratio (b), 1957–2020, Greece. Source: ELSTAT and authors’ calculations.

Figure 7.
Net migration flows per age groups (thousands), 2008–2019, Greece. Source: ELSTAT and own calculations.
Figure 7.
Net migration flows per age groups (thousands), 2008–2019, Greece. Source: ELSTAT and own calculations.


Table 1.
Income inequality indices, overall population, 2010 and 2019, Greece.
| 2010 | Differences | 2019 | Differences | Percentage Change 2010–2019 | |||
|---|---|---|---|---|---|---|---|
| Gini | 33.5 |  | 31.1 |  | |||
| 2.1 * | 3.0 * | ||||||
| Gini (pensions excluded) | 35.6 |  | 34.1 |  | |||
| 16.3 * | 20.5 * | ||||||
| Gini before all transfers (pensions and others) | 51.9 | 54.6 | |||||
| Mean log deviation (L) | 19.7 | 17.9 | −9.3% | ||||
| Theil | 19.2 | 18.0 | −6.3% | ||||
| Squared coefficient of variation (C2) | 25.4 | 28.1 | 10.5% | ||||
| Atkinson (Aε = 0.5) | 9.1 | 8.4 | −8.1% | ||||
| Atkinson (Aε = 2) | 43.8 | 48.1 | 9.7% | ||||
| Upper income 10% | 4762 |  | 4080 |  | −14.3% | ||
| 6,223 ** | 4,697 ** | ||||||
| Upper bound of the 5th income decile | 10,985 | 8777 | −20.1% | ||||
| 10,661 ** | 7,628 ** | ||||||
| Upper bound of the 9th income decile | 21,646 | 16,405 | −24.2% | ||||
| Poverty threshold | 6591 | 5266 | −20.1% | ||||
| Poverty rate | 21.4% |  | 17.7% |  | |||
| 3.4 * | 5.9 * | ||||||
| Poverty rate after transfers (pensions excluded) | 24.8% | 23.6% | |||||
| 20.1 * | 26.0 * | ||||||
| Poverty rate before all transfers (pensions and others) | 44.9% | 49.6% |
* In percentage points. ** In euros, current prices. Source: Surveys of Income and Living Conditions, ELSTAT, authors’ calculations.
Publisher’s Note: MDPI stays neutral with regard to jurisdictional claims in published maps and institutional affiliations. |
© 2022 by the authors. Licensee MDPI, Basel, Switzerland. This article is an open access article distributed under the terms and conditions of the Creative Commons Attribution (CC BY) license (https://creativecommons.org/licenses/by/4.0/).
Share and Cite
MDPI and ACS Style
Missos, V.; Rodousakis, N.; Soklis, G. On Measuring the Impact of Internal Devaluation in Greece: Poverty, Flexibility, Migration and Growthless Employment. World 2022, 3, 313-326. https://0-doi-org.brum.beds.ac.uk/10.3390/world3020017
AMA Style
Missos V, Rodousakis N, Soklis G. On Measuring the Impact of Internal Devaluation in Greece: Poverty, Flexibility, Migration and Growthless Employment. World. 2022; 3(2):313-326. https://0-doi-org.brum.beds.ac.uk/10.3390/world3020017
Chicago/Turabian StyleMissos, Vlassis, Nikolaos Rodousakis, and George Soklis. 2022. "On Measuring the Impact of Internal Devaluation in Greece: Poverty, Flexibility, Migration and Growthless Employment" World 3, no. 2: 313-326. https://0-doi-org.brum.beds.ac.uk/10.3390/world3020017