Article

Unlock the Potentials to Further Improve CO2 Storage and Utilization with Supercritical CO2 Emulsions When Applying CO2-Philic Surfactants

1
Department of Petroleum and Geosystems Engineering, The University of Texas at Austin, Austin, TX 78712, USA
2
Bureau of Economic Geology, The Jackson School of Geosciences, The University of Texas at Austin, Austin, TX 78712, USA
3
School of Petroleum Engineering, China University of Petroleum (East China), Qingdao 266555, China
*
Author to whom correspondence should be addressed.
Sustain. Chem. 2021, 2(1), 127-148; https://0-doi-org.brum.beds.ac.uk/10.3390/suschem2010009
Submission received: 24 December 2020 / Revised: 17 February 2021 / Accepted: 25 February 2021 / Published: 2 March 2021

Abstract

:
Supercritical CO2 (ScCO2) emulsion has attracted lots of attention, which could benefit both climate control via CO2 storage and industry revenue through significantly increased oil recovery simultaneously. Historically, aqueous soluble surfactants have been widely used as stabilizers, though they suffer from slow propagation, relatively high surfactant adsorption and well injectivity issues. In contrast, the CO2-soluble surfactants could improve the emulsion performance remarkably, due to their CO2-philicity. Here, comprehensive comparison studies are carried out from laboratory experiments to field scale simulations between a commercially available aqueous soluble surfactant (CD 1045) and a proprietary nonionic CO2-philic surfactant whose solubility in ScCO2 and partition coefficient between ScCO2/Brine have been determined. Surfactant affinity to employed oil is indicated by a phase behavior test. Static adsorptions on Silurian dolomite outcrop are conducted to gain the insights of its electro-kinetic properties. Coreflooding experiments are carried out with both consolidated 1 ft Berea sandstone and Silurian dolomite to compare the performances as a result of surfactant natures under two-phase conditions, while harsher conditions are examined on fractured carbonate with presence of an oleic phase. Moreover, the superiorities of ScCO2 foam with CO2-philic surfactant due to dual phase partition capacity are illustrated with field scale simulations. ScCO2 and WAG injections behaviors are used as baselines, while the performances of two types of CO2 emulsions are compared with SAG injection, characterized by phase saturations, CO2 storage, oil production, CO2 utilization ratio and pressure distribution. A novel injection strategy, named CO2 continuous injection with dissolved surfactant (CIDS), which is unique for a CO2-philic surfactant, is also studied. It is found that the CO2-soluble surfactant displays much lower oil affinity and adsorption on carbonate than CD 1045. Furthermore, in a laboratory scale, a much higher foam propagation rate is observed with the novel surfactant, which is mainly ascribed to its CO2 affinity, assisted by the high mobility of the CO2 phase. Field scale simulations clearly demonstrate the potentials of CO2 emulsion on CO2 storage and oil recovery over conventional tertiary productions. Relative to traditional aqueous soluble surfactant emulsion, the novel surfactant emulsion contributes to higher injectivity, CO2 storage capability, oil recovery and energy utilization efficiency. The CIDS could further reduce water injection cost and energy consumption. The findings here reveal the potentials of further improving CO2 storage and utilization when applying ScCO2-philic surfactant emulsion, to compromise both environmental and economic concerns.

1. Introduction

Worldwide sustainable economic development and energy safety request better control of greenhouse gas and more efficient fuel production. As an effective tertiary enhanced oil recovery (EOR) technique [1], CO2 flooding contributed significantly on incremental oil production when simultaneously effectively reducing the carbon footprint, which suffered from viscous fingering, channeling and gravity override. Historically, a thermodynamically unstable colloid system, Foam, has been employed to mitigate those adverse impacts with conformance and mobility control agents [2]. Traditionally, gaseous fluid (bubbles) disperses in continuous liquid [3], and is separated by lamella. The significant dispersing phase mobility reduction [4] results from shear stresses between pores and fluids interface [5], in conjunction with bubble trapping [6], increase significantly, resulting in a dramatic gas mobility reduction.
Under supercritical conditions, ScCO2 displays gas-like viscosity accompanied by liquid-like density, which distinguishes it from historically defined “Foam”, but endues it more emulsion-like behaviors [7]. Traditionally, aqueous soluble surfactants (ASS) have been widely applied for CO2 emulsion behavior studies [8], which attempts to achieve improved CO2 trapping and oil recovery simultaneously through enhanced mobility control and oil affinity. It has been found that foam generation and stability are affected by multiple external quantities, such as injection gas volumetric fraction [9], the phase injection rate [4], surfactant type and concentration [10], rock permeability [11], surfactant/rock interactions and the presence of other additives. Surfactant adsorption (retention) is highly affected by the electrostatic kinetics between surfactant charge and rock surface zeta potential [12,13]. Meanwhile, it was well-known that foam stability would be adversely affected by the additional oleic phase, which could be further ascribed to the presence of microemulsion [14,15] or macroemulsion [16,17,18].
In the past few decades, a number of onshore CO2 emulsion pilots were implemented [19,20], which aimed to adjust near wellbore fluid distributions and in-depth conformation control [21,22], mitigate the injection/production issues due to heterogeneity [23], improve in-situ foam generation and reduce production GOR [24], which achieved both technical and economic success. Hitherto, the only recorded pilot test using CO2-philic surfactants (CPS) took place in the Kelly-Snyder field SACROC Unit [25], which indicated relative to conventional ASS foam, an additional 30% gas injection rate reduction and 10% CO2 storage & usage were achieved. When surfactants are added, some other injection strategies were employed, based on simultaneous water and gas injection (SWAG) and water alternating gas (WAG). Unlike in a laboratory, surfactant solution co-injection with gas [26] was seldom preferred in field applications, owing to potential injectivity issues. Contrarily, surfactant solution alternating injection with gas (SAG) [27] has been applied for the in-depth mobility control or production of GOR reduction [19,22]. CO2-philic surfactants could be carried by either the aqueous or CO2 phase, owing to its dual phase partition capacity. Pilot results have showed that CPS emulsion cold be more effective for fluid diversion than ASS foam with water-alternating gas with dissolved surfactant injection (WAGS) [25]. Moreover, another novel strategy, CO2 continuous injection with dissolved CO2-philic surfactant (CIDS) [28,29] could further increase the CO2/oil contact [30], improve injectivity performance and reduce the water shielding effluences [31].
Around 60% of oil reserves worldwide are contributed by carbonate reservoirs [32], which often display a natural fracture, owing to their sensitivities to geological stress [33]. The anomalously high residual oil saturation in the upswept matrix is very attractive, however, which makes it extremely challenging to apply any EOR technique with the presence of numerous theft zones. Foam provides potentially economical solutions for gas trapping and oil production, relative to other EOR methods, such as wettability alternation followed by imbibition [34], interfacial tension (IFT) reduction [35], miscible solvent injection [36] and gas injections assisted by diffusion [37], gravity drainage [38], oil viscosity reduction [39], light component vaporization [40], oil swelling [41] and IFT reduction [42]. Several experimental studies have been carried out to extend fundamental understandings [43,44] besides the field implementation [45]. On one hand, foam or CO2 emulsion could improve gas flooding performances based on aforementioned mechanisms, such as molecular diffusion and vaporization [46,47], to enhance mass transfer between the fracture & matrix. On the other hand, it is more efficient to apply foam as a blocking agent and divert injection fluids into matrix directly through significantly reduced fractured conductivity [48,49]. It was found that over 50% more fluid mobility reduction was achieved for immiscible CO2 emulsion [8], and an additional 20% [50] or as much as 70% [51] additional oil could be recovered with pre-generated CO2 emulsion through fluid diversion.
Essentially, solubility is a thermodynamic quantity, determined by the mutual chemical potentials, nature & molecular structure and composition of both solutes and solvents. Most traditional ASSs demonstrated negligible solubility in ScCO2, owing to the poor solvent capacity of CO2 to hydrophilic molecules and polar compounds [52]. Despite being characterized by nonflammable and being environmentally benign [53], ScCO2 is an ideal solvent, with its easily accessible critical temperature and pressure (87.98 °F and 1071 psi). Bernard and Holm [54] first proposed to apply CO2-in-water emulsion with CPS for EOR applications. Historically, lots of efforts have been made towards modifying the surfactants’ structure with different functional groups. The considerable solubility displayed by fluorinated- [55] or silicone [56]-based hydrophobes could not disguise their high cost and toxicity. More attention was paid on more environmentally friendly and economic substitutes, such as methylated branched hydrocarbon surfactants [57], fluorocarbon-hydrocarbon hybrid surfactants [58], branched nonylphenol ethoxylate surfactants [29] and switchable ethoxylated amine surfactants [59]. Maleic anhydride with different alcohols [60] and branched ethoxylated surfactants [28,29] demonstrated substantial potential on CO2 retention and oil recoveries.
As mentioned, even though CO2 emulsion with ASS has been implemented in multiple field applications, the performances could be dramatically improved by the employment of novel CPS. Up to now, however, there has been a lack of systematic comparison studies to demonstrate the superiorities of CPS caused by its dual phase partition capacity, which is addressed here. In current communication, comprehensive comparisons are carried out experimentally and numerically with a commercially available ASS (CD-1045) and a proprietary nonionic CPS whose aqueous stability, partition coefficient between ScCO2/brine and solubility in ScCO2 have been determined in prior publications [61]. Individual surfactant affinity to the oleic phase is indicated through a phase behavior test. To gain some insight on the electro-kinetic behaviors of selected surfactants, static adsorption measurements are carried out on Silurian dolomite outcrop. CO2 storage and retention in porous media are indicated by corefloodings with both Berea sandstone and Silurian dolomite under a two-phase condition (W/ScCO2) to evaluate individual emulsion performances, characterized by incubation times, emulsion propagation, pressure drop magnitude and liquid desaturations. Harsher conditions are employed to reveal the incremental oil production over CO2 flooding and co-injection of brine/ScCO2 through fractured carbonate. Moreover, field scale simulations are employed to predict the superiorities of ScCO2 foam with CPS under a gravity field. Multiple tertiary injections act as baselines (ScCO2 and WAG) to illustrate the necessity of conformance control when mitigating gravity segregation. SAG injections are carried out to compare two types of CO2 emulsions, which are assessed by phase saturation, surfactant/pressure distribution, CO2 storage/retention factor, oil production and the CO2 utilization ratio. The studies here attempt to meet the gap between academic research and field implementation of this novel technology, which could benefit both environmental concerns via the final sink of CO2 even in the form of gas hydrates [62,63], as well as industrial revenue through substantial increased oil recovery for waste valorization towards a circular economy [64].

2. Experiment Description

2.1. Materials

Synthetical brine with 3 wt% pure NaCl (99.99%) is used to be consistent with the conditions employed for solubility and partition coefficient measurements [61], as too do the system pressure (1500 psi) and temperature (35 °C). The viscosity and density of Wasson crude oil are 7.1 cp (@35 °C) and 0.86 g/cm3 respectively. Chaser CD 1045 (anionic) is commercially available without modifications. A novel proprietary nonionic hydrocarbon CPS (2-ethyl-1-hexanol, 2EH-PO5-EO15) is selected, whose solubility in ScCO2 and partition coefficient between brine/ScCO2 are shown in the Appendix A, as previously determined [61]. Both Silurian dolomite and Berea sandstone outcrops are employed, and properties in details are displayed below (Table 1). Industrial-grade liquid CO2, delivered in cylinders with 900 psig initial pressure, is compressed to 1500 psi.

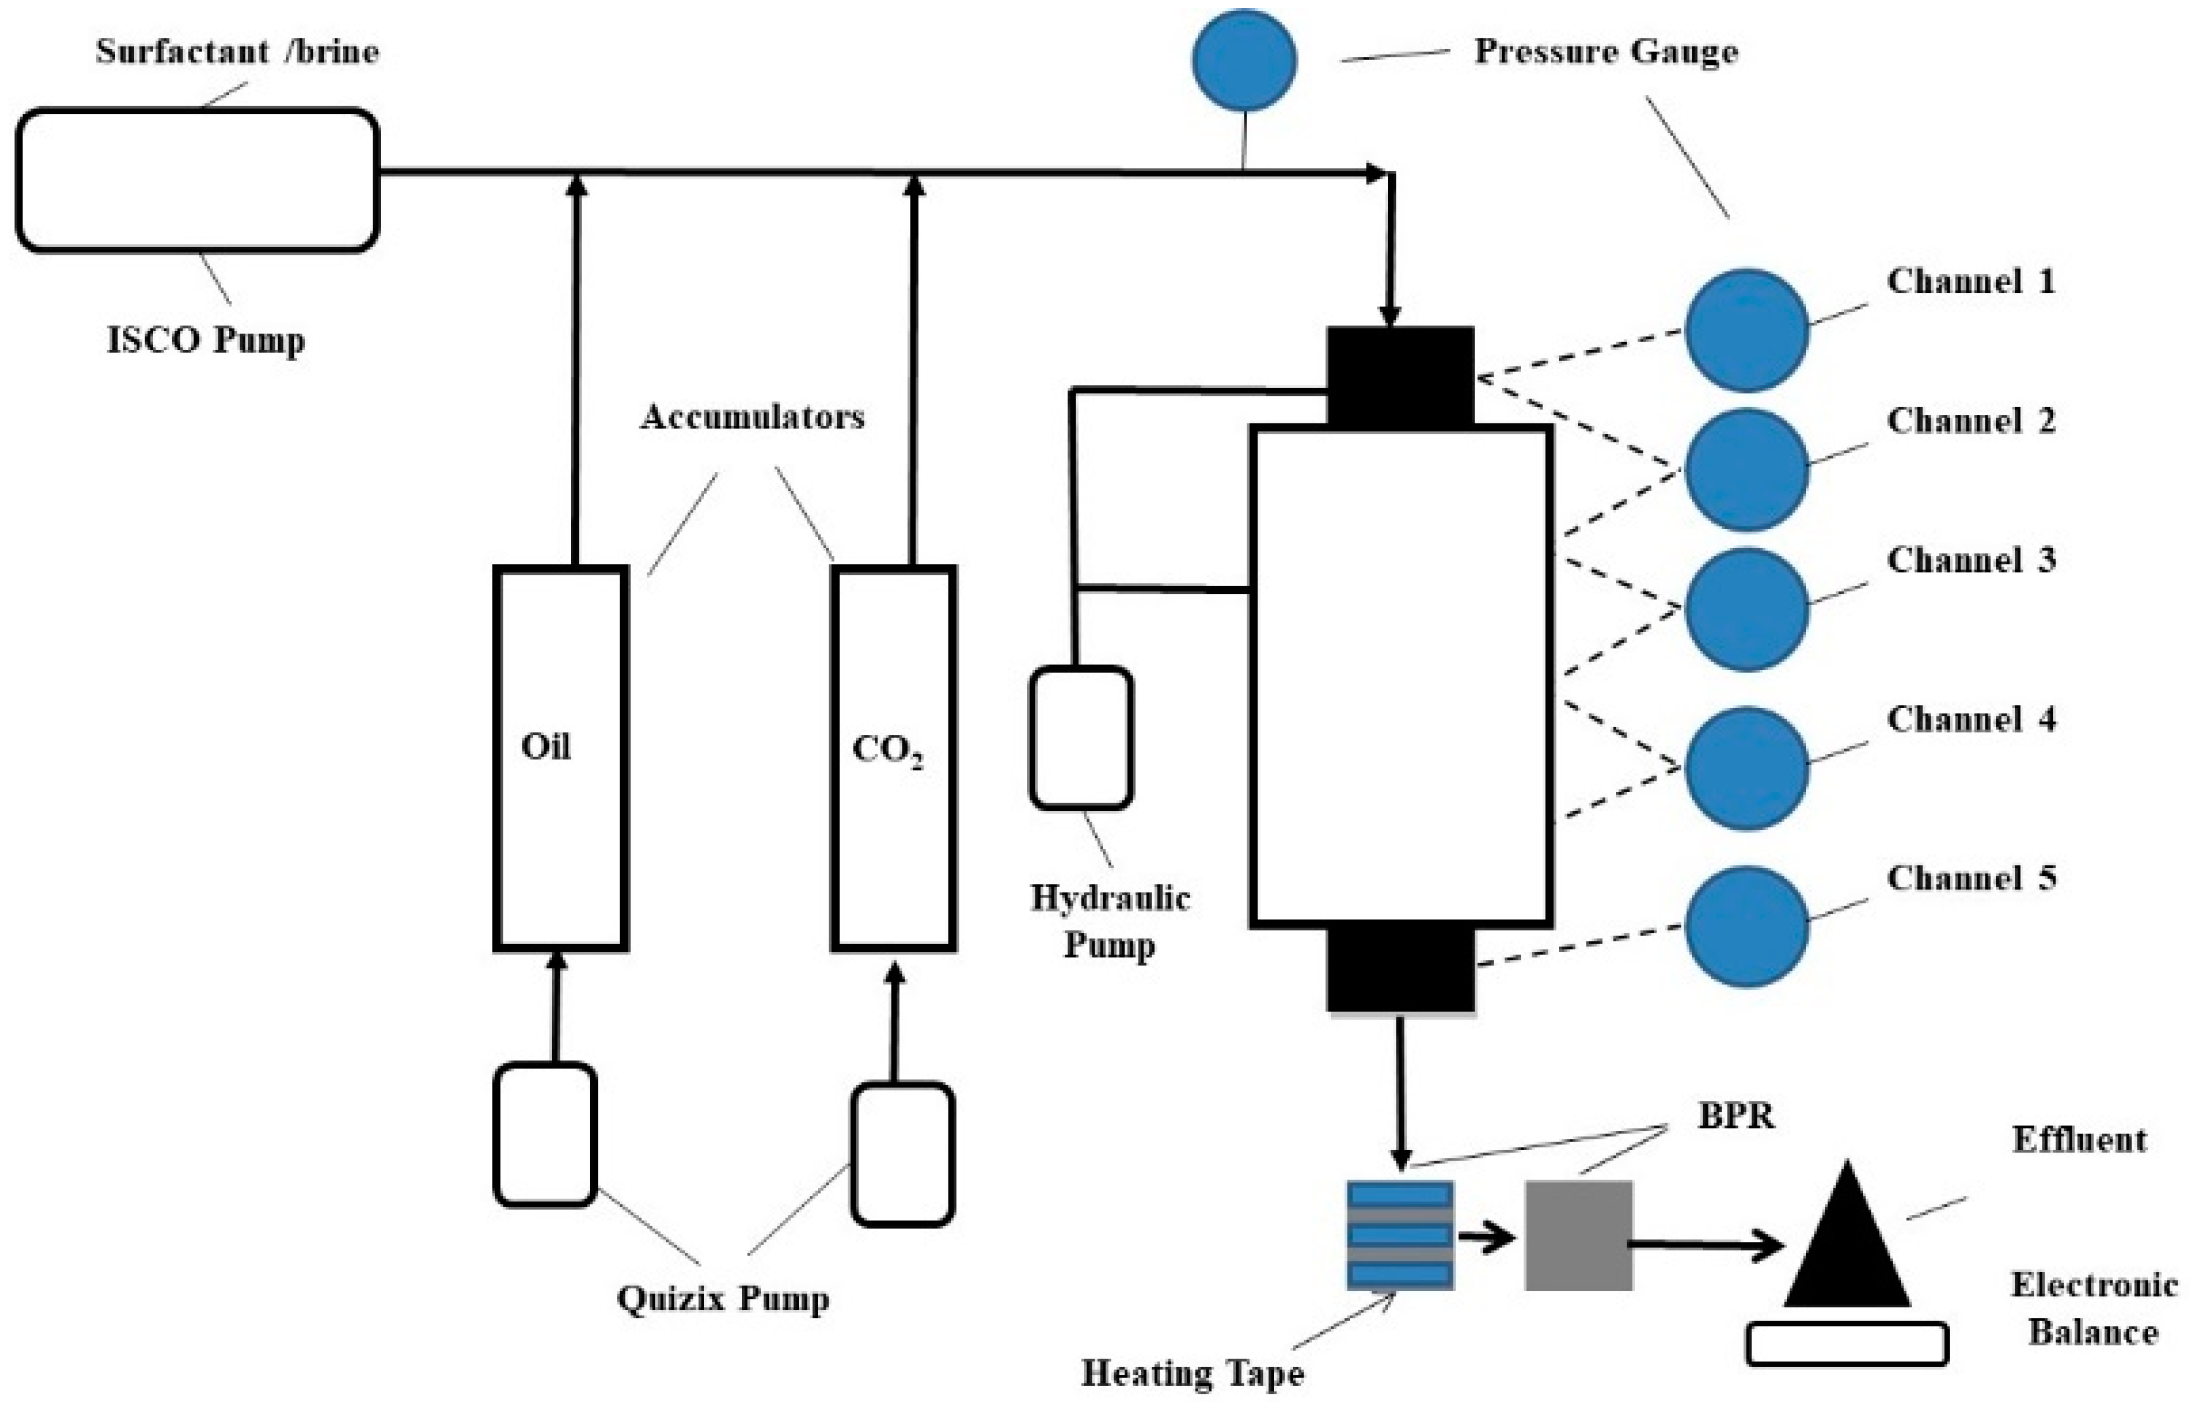
2.2. Experimental Apparatus and Procedures

2.2.1. Static Adsorption

In current studies, except for surfactant adsorption, there are no other geochemical reactions of ScCO2 with carbonate accounted. Static surfactant adsorption on Silurian dolomite outcrop is conducted at 35 °C and pH of 7.2. With two sieves of 40 and 100 mesh, fine particles ground from the rock sample, whose diameters span 0.15 mm to 0.425 mm, are used. In every test, 10 g of prepared fine particles are mixed with 20 g aqueous surfactant solution. The composed sample is rested for 24 h after being gently stirred for 1 h, and centrifuged for 5 min to separate the particle and solution. Then, high-performance liquid chromatography (HPLC) is employed to analyze the surfactant concentration in the supernatant. Even though it is known that static adsorption may overestimate the surfactant retention over a dynamic test [65], the studies here attempt to pay more attention on comparative evaluation rather than individual performance.

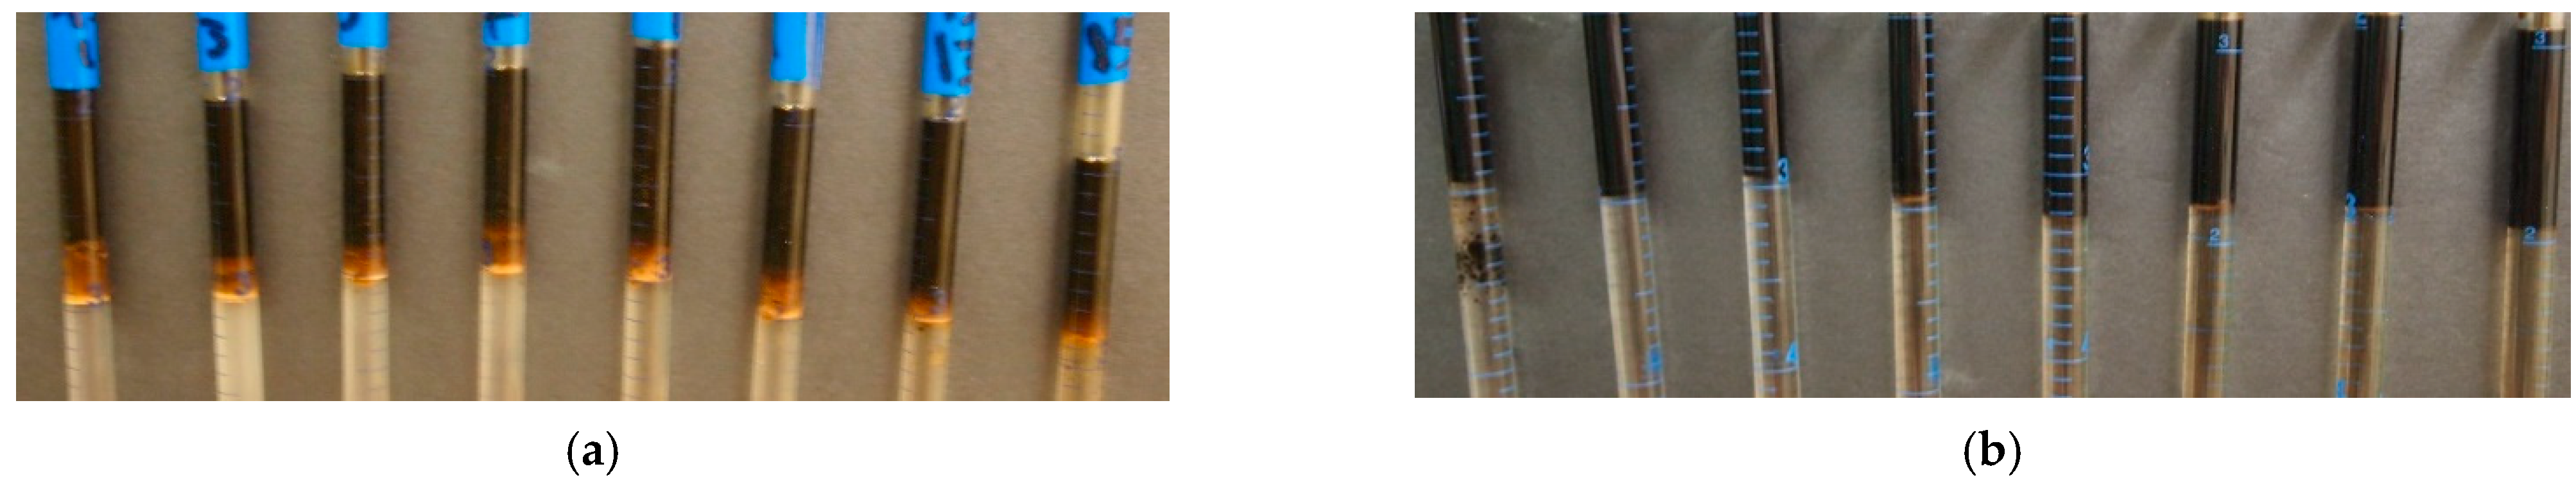
2.2.2. Phase Behavior Test

It is important to understand the preferences to interfaces of employed surfactants with presence of the third phase (oleic phase), owing to their amphiphilic characteristics. Foam stability could be impaired, potentially caused by the mitigation of the surfactant from the G/W interface to the oleic phase due to preferential partition [66], which may also generate an additional microemulsion phase. The composition and structure of microemulsion and macroemulsion are determined by aqueous salinity, temperature and other factors [67]. Meanwhile, it is known that presence of microemulsion or macroemulsion may individually facilitate the increase of the desaturation capillary number through the reduction of interfacial tension [68] or an increase of viscous force [69]. However, those “side effects” would confound the observations’ interpretations, and it is also uncertain that synergism or antagonism would appear with the addition of foam. Hence, the affinity to the O/W interface of a current foaming agent is indicated through a phase behavior test. Here, mother brine fluid is diluted to reach eight different salinities in 2 wt% increment. Thereafter, the surfactant is added respectively to achieve 0.2 wt% solutions. The opening of the 5 cc capacity pipette is sealed after mixing 2 cc surfactant solution with 1 cc oil. The fluid is mixed by rotating the pipette gently and frequently, and then the remainder in a convection oven under 35 °C for 10 days to reach equilibrium.

2.2.3. Two-Phase Coreflooding without Artificial Fracture

A schematic graph of coreflooding setup is shown in Figure 1, which comprises a fluid injection system, oven, core holder, pressure transducers, back pressure regulator (BPR) and effluent collector. Brine and surfactant are injected by a TELEDYNE ISCO Model 500D syringe pump, while compressed ScCO2 is displaced by DI water through a high-pressure accumulator separated by a piston and connected to a QX-6000 Quizix pump. A phoenix Hassler-type core holder for a 1 ft-long & 2-inch diameter core is mounted vertically, and fluids are injected from the top. Overburden pressure is exerted by hydraulic oil assisted by the 0.25 inch-thick rubber sleeve to prevent leakage and ensure the axial flow. Two absolute and three differential transducers (±0.1 psi) align the side of the core holder to indicate pressure variations and fluid propagation. Three differential transducers correspond to the three sections arraying downward, designated as Section 1 (2 inches long), 2 (4 inches long) and 3 (4 inches long), respectively. Two BPRs are connected in series to the outlet of the core holder, set at 1500 psi and 1100 psi respectively, to realize stepwise pressure reduction and prevent severe pressure shock during CO2 phase conversion. The employed cores are drilled from outcrops, followed by cleaning and drying under 110 °C for 24 h. To prevent CO2 diffusion and penetration, cores are wrapped with multiple layers of aluminium foil, and then a teflon heat shrink tube. After loading into the core holder, it is vacuumed for 12 h before porosity and permeability measurement with brine, which are listed in Table 1 for details. Cores are not reused among different corefloodings.
In-situ generation of CO2 emulsion is employed without a pre-generator through simultaneous injection of ScCO2 and surfactant solutions on the initially fully brine-saturated cores. A 0.2 wt% surfactant concentration is used along all of the experiments with a dissolved surfactant in the aqueous phase regardless of the surfactant nature. Constant fluid injection rates (CO2, 0.1 cc/min, 1.4 ft/d; liquid, 0.3 cc/min, 4.2 ft/d) are maintained to achieve 75% foam quality (injection gas fraction) at reservoir conditions (1500 psi, 35 °C). Pressure drops are recorded in real time, and the average water saturation inside the core is derived from the mass balance calculations of effluents.

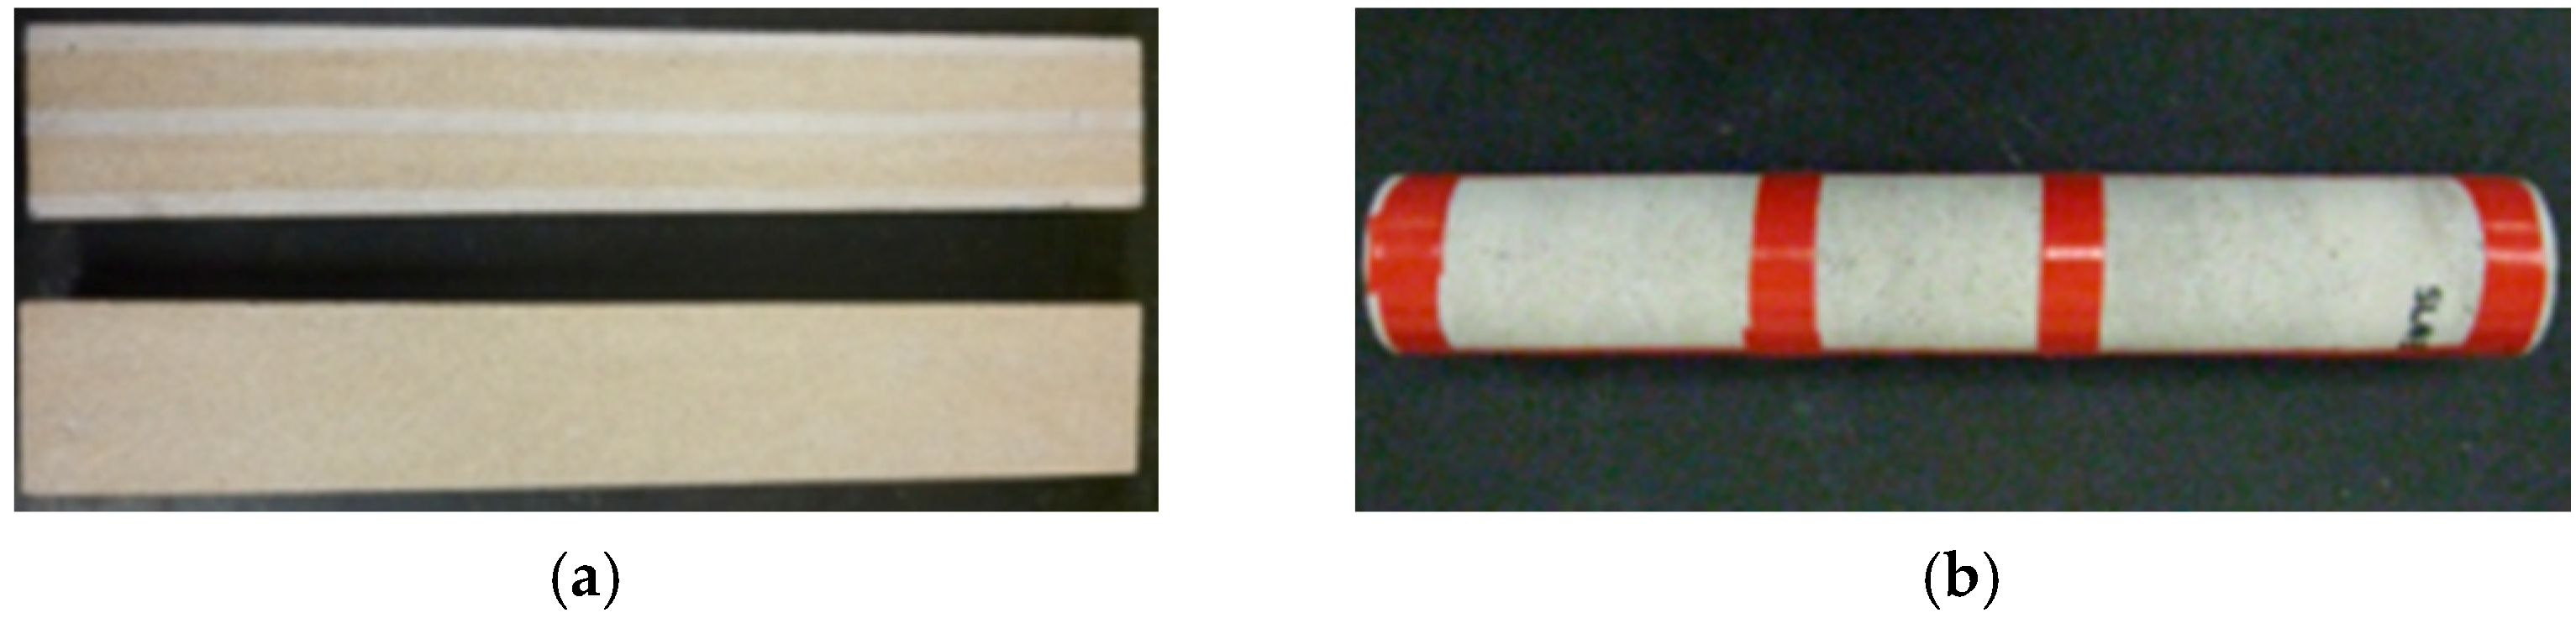
2.2.4. Three-Phase Coreflooding with Artificial Fracture

The same coreflooding setup is used as above (Figure 1). The same procedures are employed to prepare the unfractured core, and matrix porosity & permeability are measured in the same manner (Table 1). Thereafter, the core is fractured artificially with a band saw into two halves along the longitudinal axis, followed by drying out in an oven for 24 h, which creates a smooth surface with minimal roughness [51]. Then, three precut Teflon film strips with 75-micron thickness are placed onto the surface to build an artificial fracture whose contributes negligibly (<0.1%) on total pore volume (PV) (Figure 2a). The split halves are composed back and fixed with tape (Figure 2b). Similarly, brine saturation in 1 cc/min stops after 10 PV injections under 2000 psi confining pressure. The permeability to brine of the fractured composite core is measured and derived with Darcy’s law, as listed in Table 1. 2 PV of crude oil is injected under constant pressure (400 psi), and the initial oil saturations before each following tested strategy are also documented in Table 1.
Pure ScCO2 injection is carried out at 0.8 cc/min (2.333 ft/D) on composite fractured core as a baseline, until oil cut in effluent is close to 0, to indicate the impacts of such extreme heterogeneity even though minimal miscible pressure is satisfied. The simultaneous injection of brine and ScCO2 at 0.2 and 0.6 cc/min respectively at reservoir conditions (1500 psi and 35 °C) to maintain 75% injection foam quality behave as the other baseline. Then, CO2 emulsion corefloodings are conducted similar to the above W&G co-injection, except for an additional 0.2 wt% surfactant in the brine. The pre-saturation of the surfactant solution is not employed to resemble the practical conditions in the field. Outcrop cores are not reused, and properties such as initial oil saturation are listed in Table 1. Pressure drops across the core and oil production with time are recorded.

3. Simulation Description

3.1. Simulation Deck

As mentioned, foam behaviors are sensitive to in-situ phase velocities, which implies the radial flow in a cylindrical coordinator would be more appropriate for foam modeling, and better resemble the practical scenario. A 2D sector (theta 15°, porosity 20%) simulation deck is built, as shown in Figure 3, which is homogeneous but anisotropic with respect to permeability, except for the outermost grid column. The permeabilities in radial and vertical directions of the main body are set as 200 and 400 md, respectively. In the outermost column, the vertical producer locates holds permeability as high as 10,000 Darcy in every direction to mimic an open boundary condition and prevent artificial backflow [70]. An injector is positioned in innermost column grids vertically. The sector is 440 ft in a radial direction, which is divided into 100 grids unevenly. The grid size is 3 ft for the first 30 grids, and increases to 5 ft for the remains. It is as thick as 100 ft in the Z direction, which is cut to 20 layers evenly. Initial oil saturation is 0.4 without the presence of a gaseous phase and any surfactants. Oil properties have been tuned with CMG/WINPROP to ensure the achievement of multiple contact miscible (MMP~1082 psi) under initial reservoir conditions (1500 psi, 35 °C). Measured partition coefficients between brine/ScCO2 of selected CPS (2EH-PO5-EO15) is fed into STARS directly.

3.2. Foam Model

Different modeling techniques and numerical models were proposed, classified as implicit texture models [71], pore network [72], fractional flow theory [73] and population balance equations [74]. Here, in CMG/STARS, an empirical/implicit texture foam model is employed to ascribe foam effects to gas relative permeability reduction, represented by a dimensionless factor, FM, which is the product of multiple factors,
k r g f =   k r g o   F M
F M =   1 1 + ( f m m o b F 1 F 2 F 3 F 4 F 5 F 6 F 7 )
where fmmob denotes as reference mobility reduction factor and F1 to F7 stand for various effects from an application point of view. To meet the purpose of demonstrations and comparisons but also prevent the unnecessary complexity, only the effects of surfactant concentration (F1) and dry out (F7) are employed here, which are defined in the following,
F 1 = { ( C s f m s u r f   ) e p s u r f                         C s < f m s u r f                                   1                                         C s f m s u r f  
F 7 =   0.5 +   arctan ( e p d r y ( S w f m d r y ) π
where Cs denotes as in-situ surfactant concentration; fmsurf is a critical concentration above which foam strength would not increase further; epsurf indicates the dependence of gas mobility on surfactant concentration; fmdry is a critical water saturation at which foam would coalescence significantly and epdry controls the shape of the curve when approaching fmdry. Here, fmsurf is set as the same with surfactant concentration in an injection aqueous stream, and a typical value of foam mobility reduction in the field [75] is chosen for fmmob (Table 2). To prevent unrealistic gas trapping, fmdry is slightly higher than irreducible water saturation (Table 2).

3.3. Injection Strategy

Table 3 summarizes the tested injection schemes which are under a constant rate constraint. Continuous pure ScCO2 injection is carried out as a baseline, in rates of 420,000 scf/d to maintain the same voidage displacement with the following alternating injections. WAG injection acts as another baseline, with rates at 45 bbl/d and 315,000 scf/d respectively, to achieve a 75% injection gas volume fraction at reservoir conditions, when maintaining the slug ratio of brine to ScCO2 at 1:1 and the unit slug size at 180 days. With corresponding law, the compressibility factor of ScCO2 is derived with its known critical pressure and temperature. Accordingly, CO2 volumes could be converted between downhole and surface (14.7 psi, 20 °C). As mentioned above, 420,000 scf maintains a similar reservoir volume to the summation of 45 bbl and 315,000 scf. Meanwhile, the implementation time for alternating injection is doubled (2880 days) relative to the continuous injection to maintain the same amount of total fluids injection (brine and ScCO2). Lastly, the novel strategy, CIDS, is studied with reduced surfactant concentration (molar fraction) in ScCO2 phase to remain similar among surfactant injections. Here, the results at the end of injection will be evaluated through the observed gas production rate, well bottom hole pressure (BHP), gas saturation, surfactant distribution, pressure distribution, CO2 storage (the difference between injection & production CO2), CO2 retention factor (CO2 storage/CO2 injection × 100%), oil production and CO2 utilization ratio (oil production/CO2 injection).

4. Results and Discussion

4.1. Experiments

4.1.1. Static Adsorption

Multiple factors would impose significant impacts on surfactant performances on the rock surface, including surface nature, fluid/rock interactions and fluid electrolyte composition/strength [76]. The HPLC analyses indicate that the static adsorption of CD-1045 and 2EH-PO5-EO15 on Silurian dolomite are 1.1 and 0.25 mg/g, respectively. The more than four-times-higher affinity to dolomite rock of employed ASS than selected CPS could be ascribed to the intrinsic molecular structure differences. Ionic surfactant behaviors are mainly affected by the electrostatic attraction/repulsion between the charged head group and rock surface [12]. Dolomite surface is positively charged in neutral pH brine (~7.2), with an iso-potential point of around pH 8.2 [77], which results in strong attraction with negatively charged anionic CD-1045. On the contrary, nonionic surfactant adsorption on dolomite depends on the silica and clay content in the mineral, and electrostatic force is not the dominant factor [78]. Therefore, the adsorption of 2EH-PO5-EO15 is mainly driven by hydrogen bonding between oxygen in the ethoxy groups (EO) of surfactant and the hydroxyl groups on the mineral surface, which is weaker than the electrostatic force. In addition, the relatively large number of EO groups in 2EH-PO5-EO15 enhances its hydrophilicity, which in turn reduces its adsorption [65].

4.1.2. Phase Behavior Test

It is important to ensure the foam/CO2 emulsion generation and stability are not adversely impacted by the preferential partition of employed surfactants to the W/O interface, which may result in surfactant loss and the generation of stable viscous W/O emulsion or microemulsion [79,80]. It is also crucial to prevent misinterpretations by foam alone if microemulsion [68] or macroemulsion [69] is indeed present. Figure 4 illustrates the phase behaviors observations of selected surfactant solutions with Wasson crude oil under variant salinities. Neither of these display the typical Winsor type phase behaviors. It is observed that CD-1045 produces small amount of light brown separate phase (Figure 4a), which is slightly more viscous than original oil. It is similar to unstable liquid crystal which may be caused by a certain high molecular component in oil, such as asphaltene. In general, the detrimental impacts to foam stability should not be severe, which is supported by the literatures that state CD-1045 is a proven good foaming agent [81]. Meanwhile, the novel CPS demonstrates negligible affinity to employed Wasson oil, with an almost indiscernible inter phase between oil and brine. Similar conclusions were drawn by Chen et al. [82], with another nonionic CPS whose partition coefficient between W/O was very small. Hence, the observations here eliminate the concerns of impairment to foam stability by surfactant loss or interference to observation interpretation by the potential presence of additional phases, which implies the poor affinities of both selected ASS and CPS to Wasson crude oil as foaming agents.

4.1.3. Two-Phase Flooding with Unfractured Berea Sandstone

Sandstone is normally negatively charged with neutral pH brine (~7.2) with an iso-potential point of around pH 5 [83], which results in similar adsorption levels for both anionic and nonionic surfactants. Therefore, the comparisons between two types of CO2 emulsions would be ascribed to their foam behaviors only. Figure 5 displays the sectional pressure drops across the cores of ASS (Figure 5a) and CPS (Figure 5b), which indicate not only the propagation, but also the apparent viscosity of CO2 emulsions. After satisfying minimum pressure gradient for foam generation [83], strong ASS CO2 emulsion appears at three total injection PV (TIPV, liquid & CO2) at Section 1, while a much shorter TIPV is required for CPS emulsion (~1 TIPV). This earlier response is mainly attributed to the dual partition of CPS, which has one of the most supreme superiorities over conventional ASS. Before the strong foam generation, ScCO2 mobility (~0.058 cp, 708 kg/m3 and water-wet @ 1500 psi and 35 °C) was much higher than brine, resulting in the faster spreading of CPS [84], which could promote the apparent emulsion propagation. Further propagating downward, CPS emulsion reaches Section 2 and Section 3 at 5 and 12 TIPV, respectively (Figure 5b), which are still earlier than responses from ASS emulsion at 8 and 15 TIPV, respectively. However, those similar subsequent observations should be more attributed to the better stabilizing ability of CPS to emulsion film rather than surfactant spreading, as addressed above. It has been claimed that foam would not affect the liquid relative permeability and propagation directly [85]. Therefore, either type of employed surfactant would already spread to the end of core after such amount of TIPV with current 75% injection foam quality. It is important to note that owing to its thermodynamically instability, foam actually “propagates” in the manner of breaking and reforming [86]. In other words, foam or CO2 emulsion could not stay intact as a homogenous and isotropic phase with unchanged properties to propagate, as conventional polymer solution does. Instead, it has to regenerate downstream after strong foam has been generated upstream. Hence, the observed earlier responses in Section 2 and Section 3 from CPS emulsion indeed imply its better stabilizing ability to film. It has been reported that the CPS employed here could reduce the ScCO2/water IFT to 5.6 mN/m (@ 2000 psi, 24 °C, 0.01 wt%) [87], relative to 9.5 mN/m, which CD-1045 could achieved under similar conditions [88]. Lower IFT would explicitly reduce the difference of capillary pressures between the plateau border and film, which in turn weakens the capillary suction that is the main driving mechanism of film coalescence [89]. This superior film stabilization ability of CPS significantly reduces the time needed in every section approaching the plateau values (Figure 5a,b). In addition, prominently higher apparent emulsion strength, indicated by more than doubled total pressure drops (Figure 5a,b), could also be attributed to the more robust emulsion film stabilized by CPS. In turn, the combinations of more rapid propagation, faster foam strength buildup and higher apparent emulsion viscosity result in a much steeper water desaturation rate and lower eventual water saturation (Figure 5c, CPS 0.2 VS ASS 0.46), which clearly manifests the superiorities of CPS ScCO2 emulsion over the conventional one in fluid displacement efficiency and CO2 storage.

4.1.4. Two-Phase Flooding with Unfractured Silurian Dolomite

When replacing consolidate porous media with Silurian dolomite, similar relative behaviors are observed (Figure 6), except for the Section 1, which may be caused by the lithology of employed dolomite demonstrating a stronger inlet effect [90]. It takes around 2 TIPV for ASS emulsion to demonstrate a discernible pressure response in Section 2, while only as less as 0.5 TIPV is needed for CPS emulsion. Furthermore, once strong emulsion has been generated, it takes much less TIPV for CPS to buildup in each section and propagate downstream (Figure 6a,b, 1.3 TIPV VS 5 TIPV). In particular, with Silurian dolomite, ASS emulsion could hardly reach comparable strength in both sections, which partially results in lower total emulsion strength relative to CPS emulsion. Accordingly, much clearer contrast is displayed on the average water saturation in the cores (Figure 6c). The desaturation rate of CPS emulsion is very high, and CO2 storage reaches more than 90% in 2.8 TIPV, while much gentler stepwise behaviors are shown by ASS emulsion. Moreover, the eventual water saturation is reduced to as low as 0.03 by CPS emulsion which is five times less than the conventional one. The observations here could be ascribed to significantly reduced CPS adsorption on the dolomite rock surface, in addition to the superiorities of CPS emulsion as observed on Berea sandstone.

4.1.5. Three-Phase CO2 & W/G Floodings with Fractured Silurian Dolomite

The permeability of an open space between parallel plates—that is, the configuration of a fracture in current composition system—is proportional to the square of a fracture aperture. Thereby, 75 micron corresponds to 475 Darcy, which increases the composite core permeability to around 1 Darcy with 150 mD matrix permeability. Thus, the fracture behaves as a severe theft zone, with tremendously high conductivity. In turn, typical pure ScCO2 flooding produces very low oil recovery (24%), corresponding to negligible pressure drop (Figure 7), even though MMP is currently achieved. In such a short core without mobility control, with the presence of a high conductivity fracture along central axis, advective flow in longitudinal direction is dominant over transverse flow in radial direction, not to mention the molecular diffusion, where multiple contact miscibility would play a very limited role [91]. In contrast, the co-injection of brine and ScCO2 slightly improves the performances, but to a limited extent. Injection fluids still break through early at 0.3 TIPV, and level off at 35% oil recovery, accompanied with pressure drops in a similar order of magnitude (Figure 7). The effects of additional brine phase injection are two-fold. On one hand, it was suggested that the simultaneous injection could provide better mobility control than continuous single-phase injection (brine of gas) to reduce oil capillary entrapment via the multiple phase relative permeability effect [92]; nevertheless, the enhancement may be more valid for small-scale heterogeneity. On the other hand, a significant amount of brine may reduce CO2-oil contact for a miscible process through the water shielding effect [31]. Therefore, it seems like the current scenario is still dominated by the lack of sufficient mobility control, and only the regions near fracture are swept.

4.1.6. Three-Phase ScCO2 Emulsion Floodings with Fractured Silurian Dolomite
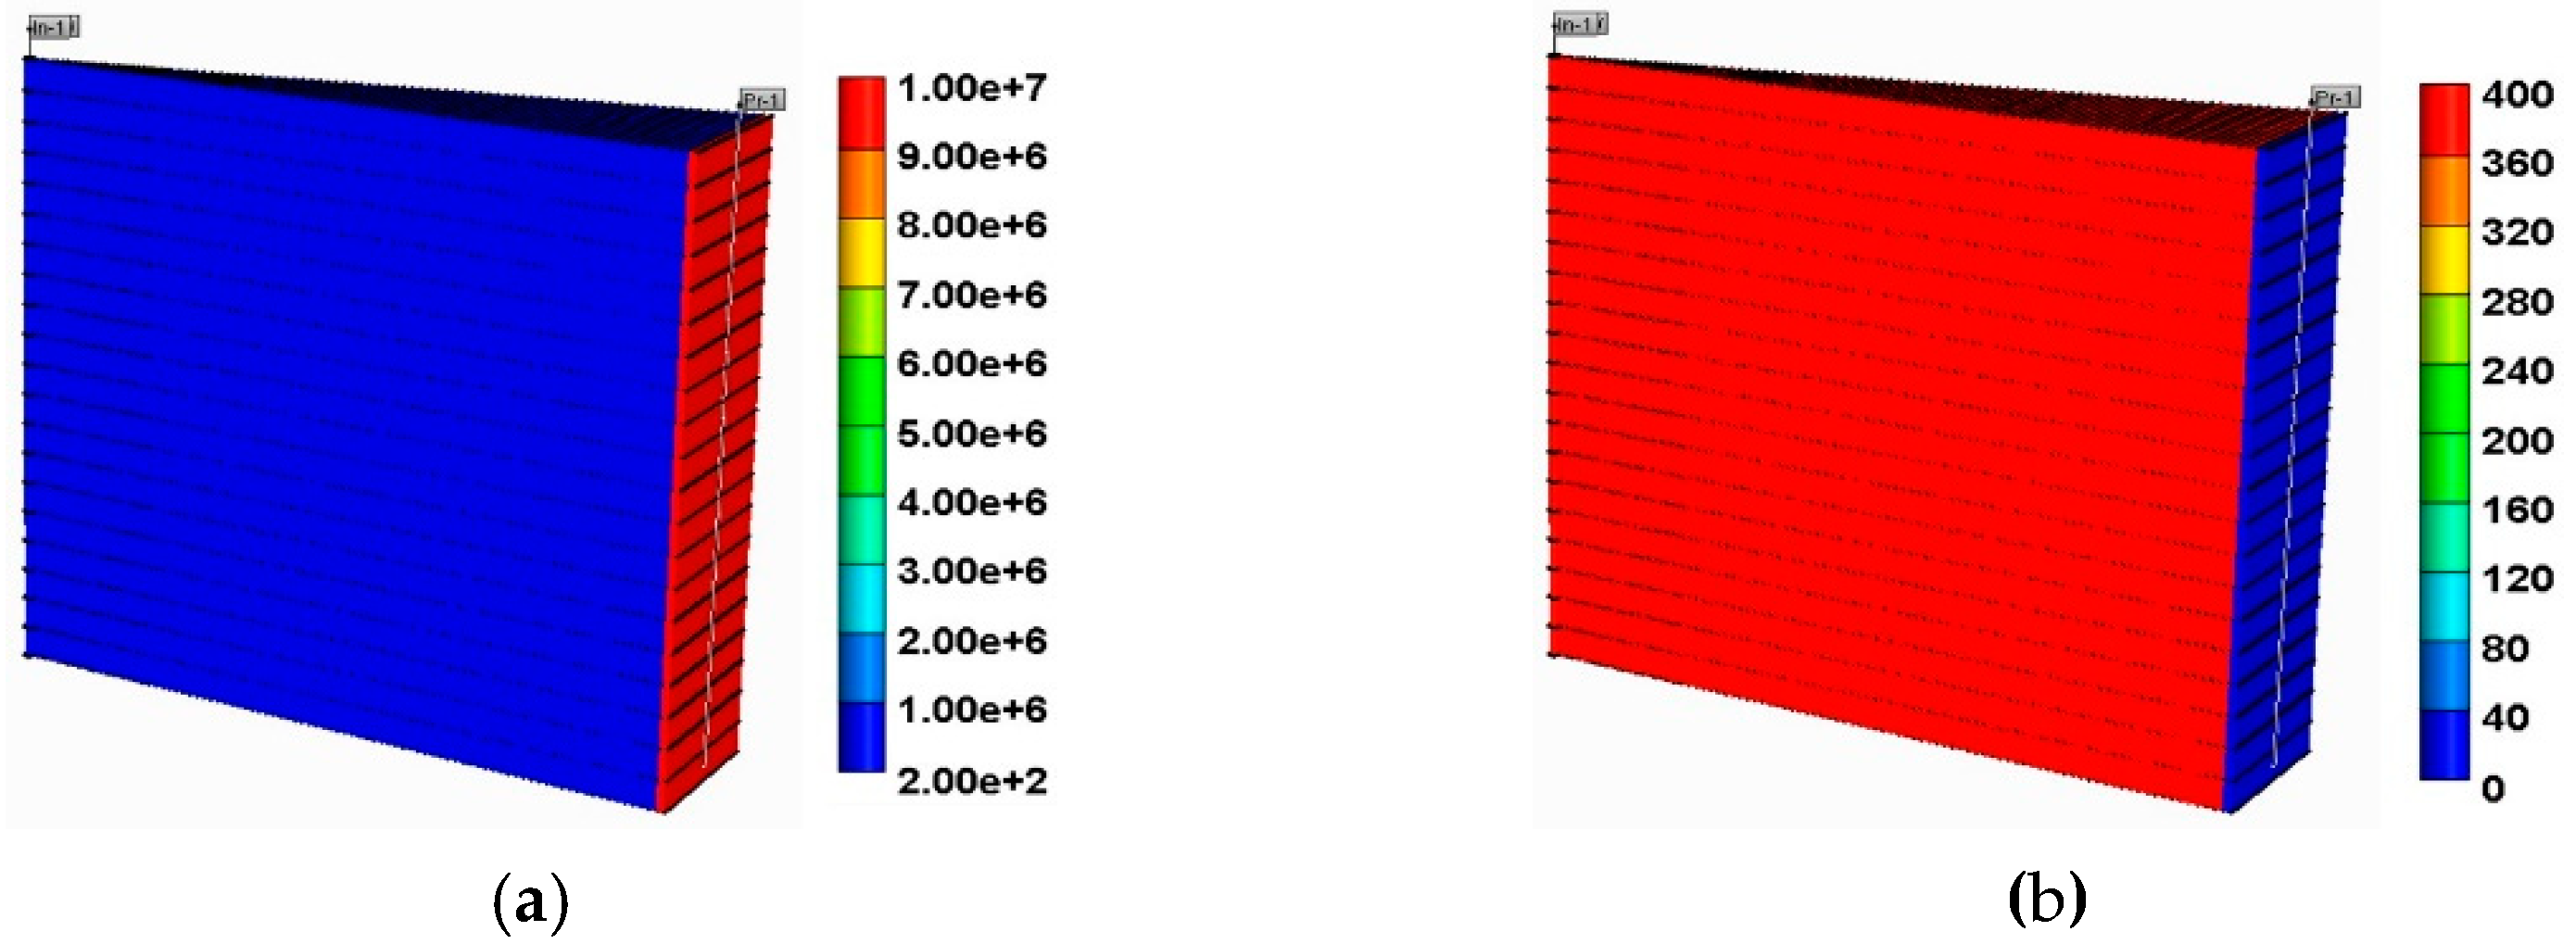
Relative to the above baselines, the performance improvements with the presence of ASS are prominent. As shown in Figure 8, even though a similar 30% oil is recovered, indicating the sweeping of near fracture regions, further continuous oil production is observed, implying the improvement of mobility control and desaturation in a radial direction, which results in an eventual 54% oil recovery with more than a forty-times increase of the pressure drop. The enhancement of liquid production also suggests the marked improvement of CO2 storage. As mentioned, the presence of a surfactant could stabilize the thin film, called lamella, which separates the dispersing bubbles. Due to this, dispersing phase (gas or ScCO2) mobility could be reduced via increased apparent viscosity, owing to shear stresses between porous media and film [93] and through reduced effective relative permeability due to dispersing phase trapping [85]. It has been proven that CD-1045 was an effective CO2 foaming agent under variable reservoir conditions [81]. In contrast, when replacing stabilizer agent with CPS, more than 10 times the pressure drop across the composite core is observed, and oil recovery is further enhanced to 70%, which nearly reaches the levels in unfractured systems. The high conductivity fracture could further promote the CPS spreading rate when it transports with high-mobility ScCO2. The superior performances here of CPS emulsion in such harsh reservoir conditions could be ascribed to not only the better film stabilization ability, as mentioned above, but also the extraordinary tolerance to the oleic phase, as illustrated in prior test, since oil saturation in a fracture is much higher than that of a matrix, when it behaves as a flow path.

4.2. Simulations

Five injection scenarios are tested to illustrate the necessary of mobility control and superiors of CPS emulsion in practical reservoir conditions with the presence of a gravity field. Figure 9 demonstrates the gas production rates of variable scenarios, in which the ScCO2 times are highlighted (upper right sub-graph). ScCO2 BTs rapidly in 55 days for pure ScCO2 injection, and approaches the plateau quickly, which indicates the necessity of mobility control. With the presence of a WAG injection, it indeed delays the gas BT until 240 days. Densities of brine and ScCO2 are conspicuously distinct, which could result in three flow zones in the reservoir, owing to the countercurrent flow of water and gas [94], i.e., mixing zone (near wellbore comprising both water and gas), override zone (mainly consisting of gas) and underride zone (mainly consisting of water). Therefore, the downwards flow of brine impedes the migration of ScCO2 upwards to some extent. When adding ASS in water stream, ScCO2 BT is further delayed to 282 days with a prominently reduced gas production rate, which is caused by the obviously reduced gas mobility than WAG [95,96]. With novel CPS, even better performances are observed that ScCO2 BTs until 295 days with another ~10% gas production rate decrease. Owing to its dual phase partition capacity, CPS would be carried by injected ScCO2 to the traditional override zone, and better mitigate the issue of gravity segregation. When applying the most novel strategy, CIDS, relative to pure ScCO2 injection, it did reduce the gas production rate by 25% after ScCO2 BT, even though the BT time is just slightly delayed to 60 days. CIDS could generate ScCO2 emulsion with in-situ brine, and further analysis would give more details in the following.
More direct illustrations are shown in Figure 10 of gas saturation distributions at the end of injections. As aforementioned, pure ScCO2 injection (Figure 10a) and even WAG flooding (Figure 10b) cause a lack of appropriate mobility control to the gas phase, and severe gravity segregation would promote low viscosity and cause the density CO2 phase to mitigate to the override zone at a few top layers, and leave significant upswept areas by miscible flooding; the presence of a surfactant, especially CPS (Figure 10d), mitigates those adverse impacts remarkably. In particular, CPS emulsion not only extends mixing zone pronouncedly deeper into reservoir, as displayed by ASS emulsion (Figure 10c), but also pulls the override zone downwards, which is ascribed to the better gas mobility control in the override zone. More striking effectiveness is provided by CIDS injection where no area is unswept by ScCO2 (Figure 10e), which is expected to give excellent CO2 final retention. As shown in Figure 11a, CPS emulsion stores more than 63% injected CO2 than emulsion using ASS, while another 28% improvement is achieved by novel CIDS injection. However, it is noted that cumulative CO2 injections are different among tested scenarios, thereby the CO2 retention factor (CO2 storage/injection) could have a better quantity for storage efficiency. Figure 11b indicates that alternating injection with CPS provides the supreme CO2 retention efficiency, which is 65% higher than conventional ASS emulsion, while CIDS performs comparably, as just 4% lower.
The surfactant concentration distributions (Figure 12) provide better interpretations of the above observations, and reveal the essential causes of CPS superiorities. Owing to water slumping and only the aqueous solubility of ASS, a thin topmost layer behaves as a surfactant vacuum zone lack of CO2 mobility control, and most ASS concentrates near wellbore. On the contrary, CPS with alternating injection could be carried by injected ScCO2 and be present in those top layers to slow down the gas mobility and facilitate the CO2 diversion downwards. A much more prominent contrast is shown by CIDS, which displays almost uniform high concentration in the whole swept region. Moreover, it is interesting to note that in both scenarios employing CPS, the surfactant vacuum zones instead appear near the wellbore vertically, which could be attributed to the liquid dry out effect and the dual phase partition of CPS. The aqueous phase has marginal solubility in CO2 phase but is nonnegligible under the scenario with a significant amount of CO2 injection. Here, water saturation near wellbore would be reduced markedly, resulting in a noteworthy increase of surfactant concentration in the aqueous phase. Due to this, the preferential partition of CPS into an injected ScCO2 stream will be driven by thermodynamic equilibrium under the constant partition coefficient. Consequently, foam would be weakened, caused by a decrease of local surfactant concentration. Meanwhile, conspicuously reduced water saturation may invoke the so-called foam dry out effect, resulting in the further impairment of foam strength. Here, the dynamic partition, in conjunction with water dry-out, promotes the appearance of the CPS vacuum zone near the wellbore, which potentially improves the injectivity, as shown below. The superiorities of CPS emulsion are also manifested by the economic analysis for oil recovery and CO2 utilization efficiency (oil production/CO2 injection), as shown in Figure 13. Alternating injections of CPS emulsion doubles the oil production over WAG, and produces 30% more than the scenario using ASS (Figure 13a). More strikingly, CIDS injection could provide another 13% additional oil recovery. The variation of CO2 utilization ratio is consistent with oil production and monotonically increasing among tested scenarios, which corresponds with the increase of industrial revenue (Figure 13b). In addition, without liquid phase injection, the operation cost will be further reduced to benefit the balance sheet.
Injectivity is always an important concern during the field implementation of foam. Figure 14 displays the pressure distributions and contour lines at end of injection time frames, which provides some clues. It is interesting to note that with the variation of scenarios, not only the magnitude of pressures but also the pressure distributions, including the contour lines, are varying. Owing to the lack of mobility control, pure ScoCO2 and WAG floodings show almost horizontal pressure contour lines, and high pressures distribute at the bottom (Figure 14a,b), corresponding to the phase separations in the reservoir. When applying the surfactants, pressure contour lines become more vertical-like morpha, indicating piston-like displacement and improvement of mobility control, but with different configurations. The pressure distribution of ASS emulsion is very uneven (Figure 14c), where high pressure zones compact in a few feet, and dissipate quickly away from wellbore. On the contrary, the scenarios using CPS demonstrate much more even pressure gradients with lower injection pressures (Figure 14d,e), corresponding to the surfactant vacuum zones near wellbore, as addressed above. The tilt extent of contour lines and pressure gradient distribution imply the energy utilization efficiency, and are relevant to the project cost. Furthermore, the maximum readings from above pressure distributions (Figure 15a) indicate the well injectivities, and correspond to the bottom hole pressures under the constant rate injection mode (Figure 15b). For alternating injection, CPS emulsion could reduce the max BHP as much as 250 psi, or equivalent to as high as a 76% injectivity increase, if using 1500 psi as average reservoir pressure in the far end. Moreover, when considering CIDS, one may have to compromise the remarkable injectivity reduction with improved oil production and CO2 utilization ratio, relative to alternating injection, as addressed above.

5. Conclusions

Here, systematic comparison studies have been carried out between aqueous and CO2 soluble surfactants as CO2 emulsion stabilizers. Laboratory experiments are conducted in homogeneous and fractured outcrops under both two- and three-phase conditions facilitated by auxiliary tests, which indicate the superiorities of this CO2-philic agent. Field scale simulations further predict its ascendancies over traditional aqueous soluble agents in practical conditions. The findings here would benefit both greenhouse control and storage, as well as enhancing oil recovery, which are summarized as the following:

5.1. Experiments

  • The employed anionic aqueous soluble surfactant displays more than four times higher adsorption on Silurian dolomite than selected CO2-philic one, which is ascribed to stronger electrostatic attraction owing to opposite charges. The behaviors of nonionic CPS are dominated by hydrogen bonding, which is weaker than the electrostatic force.
  • Both ASS (CD-1045) and CPS (2EH-PO5-EO15) show poor affinity to Wasson oil, particularly the latter. In brief, the observations here eliminate the concern of surfactant loss to W/O interface, and both surfactants are mainly used for foaming purposes.
  • In the two-phase unfractured Berea sandstone system, CPS emulsion propagates much faster, which is attributed to its dual phase partition capacity before strong foam generation upstream, but to its superior film stabilization ability when it further propagates downstream. The better emulsion stability is also supported by the much faster pressure buildup and higher plateau pressure drops, which in turn facilitate CPS emulsion to achieve higher fluid displacement efficiency and CO2 storage.
  • Similar relative behaviors are observed in the two-phase unfractured Silurian dolomite system, with even sharper contrast in the displacement rate and CO2 storage. CPS emulsion could reduce brine saturation to less than 0.1 in 2.8 TIPV, and CO2 saturation could be as high as 97% eventually.
  • In the three-phase system with fractured Silurian dolomite, either continuous ScCO2 injection or co-injection of brine and ScCO2 provides relatively poor performances with negligible pressure drops, and oil recoveries are 24% and 35% respectively, even though MMP is achieved. It seems like here it is dominated by the lack of sufficient mobility control, and only the regions near the fracture are swept.
  • The selected ASS (CD-1045) indeed improves oil recovery to 54%, with more than a forty times increase of the pressure drop. When replacing the stabilizer agent with CPS, it is further enhanced to 70%, with another over 10 time pressure drop increase, which also indicates the far better CO2 storage.

5.2. Simulations

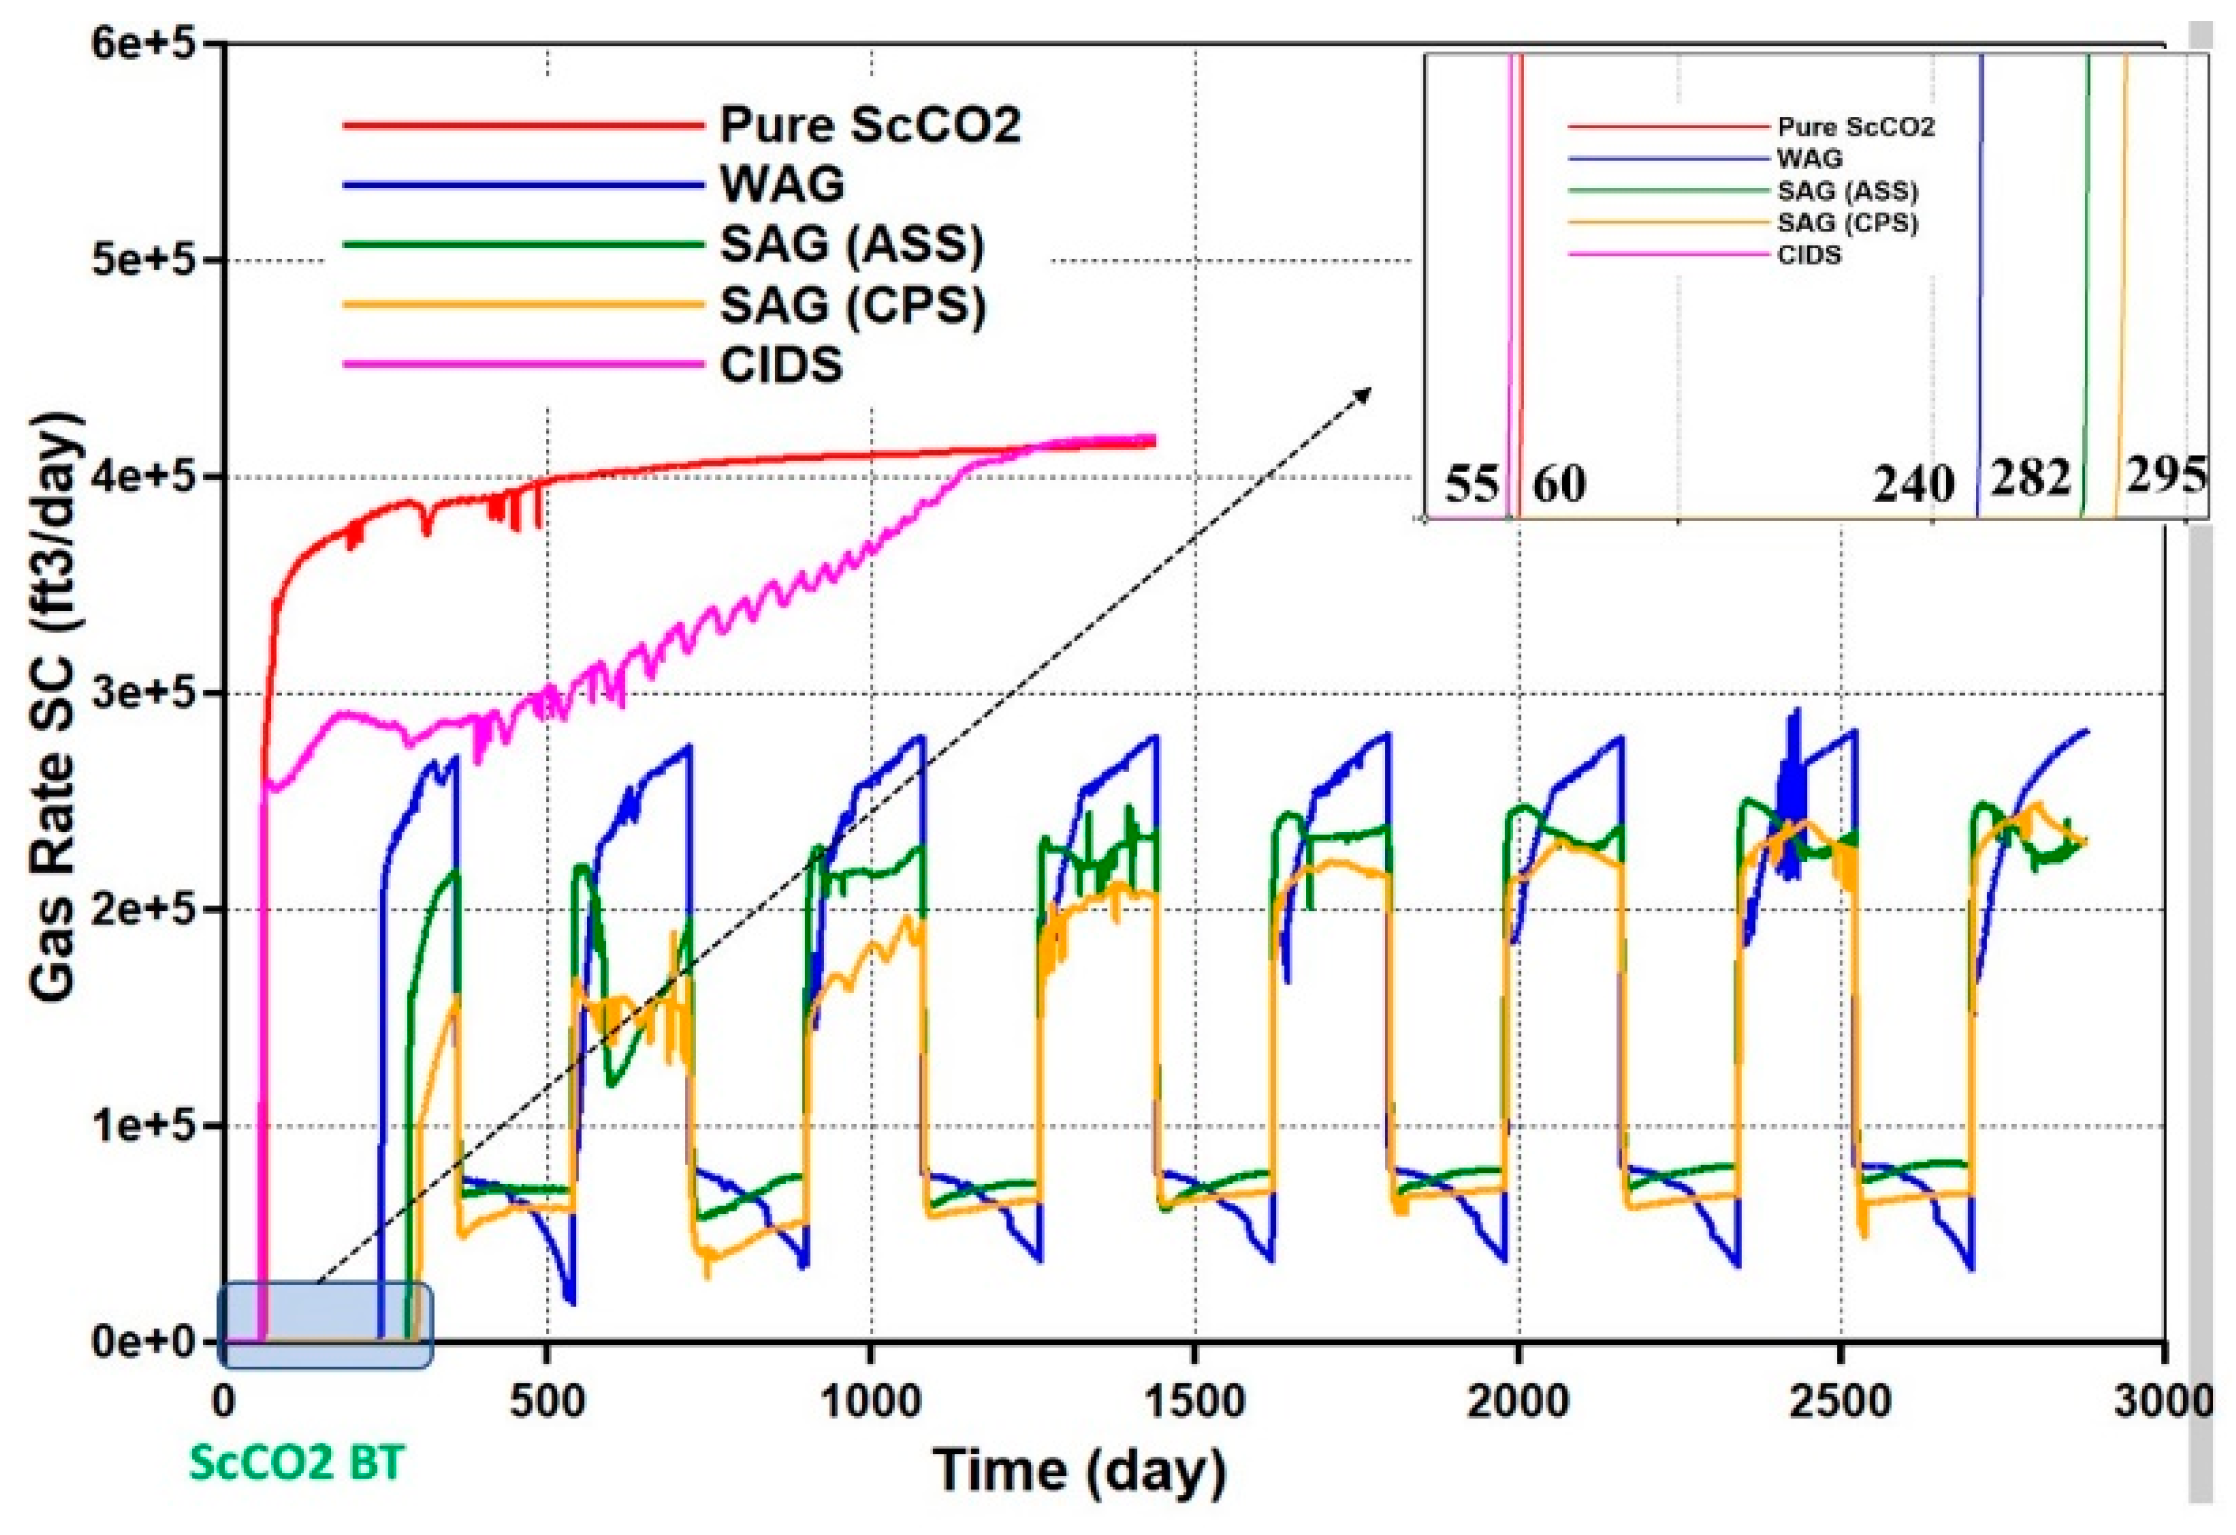
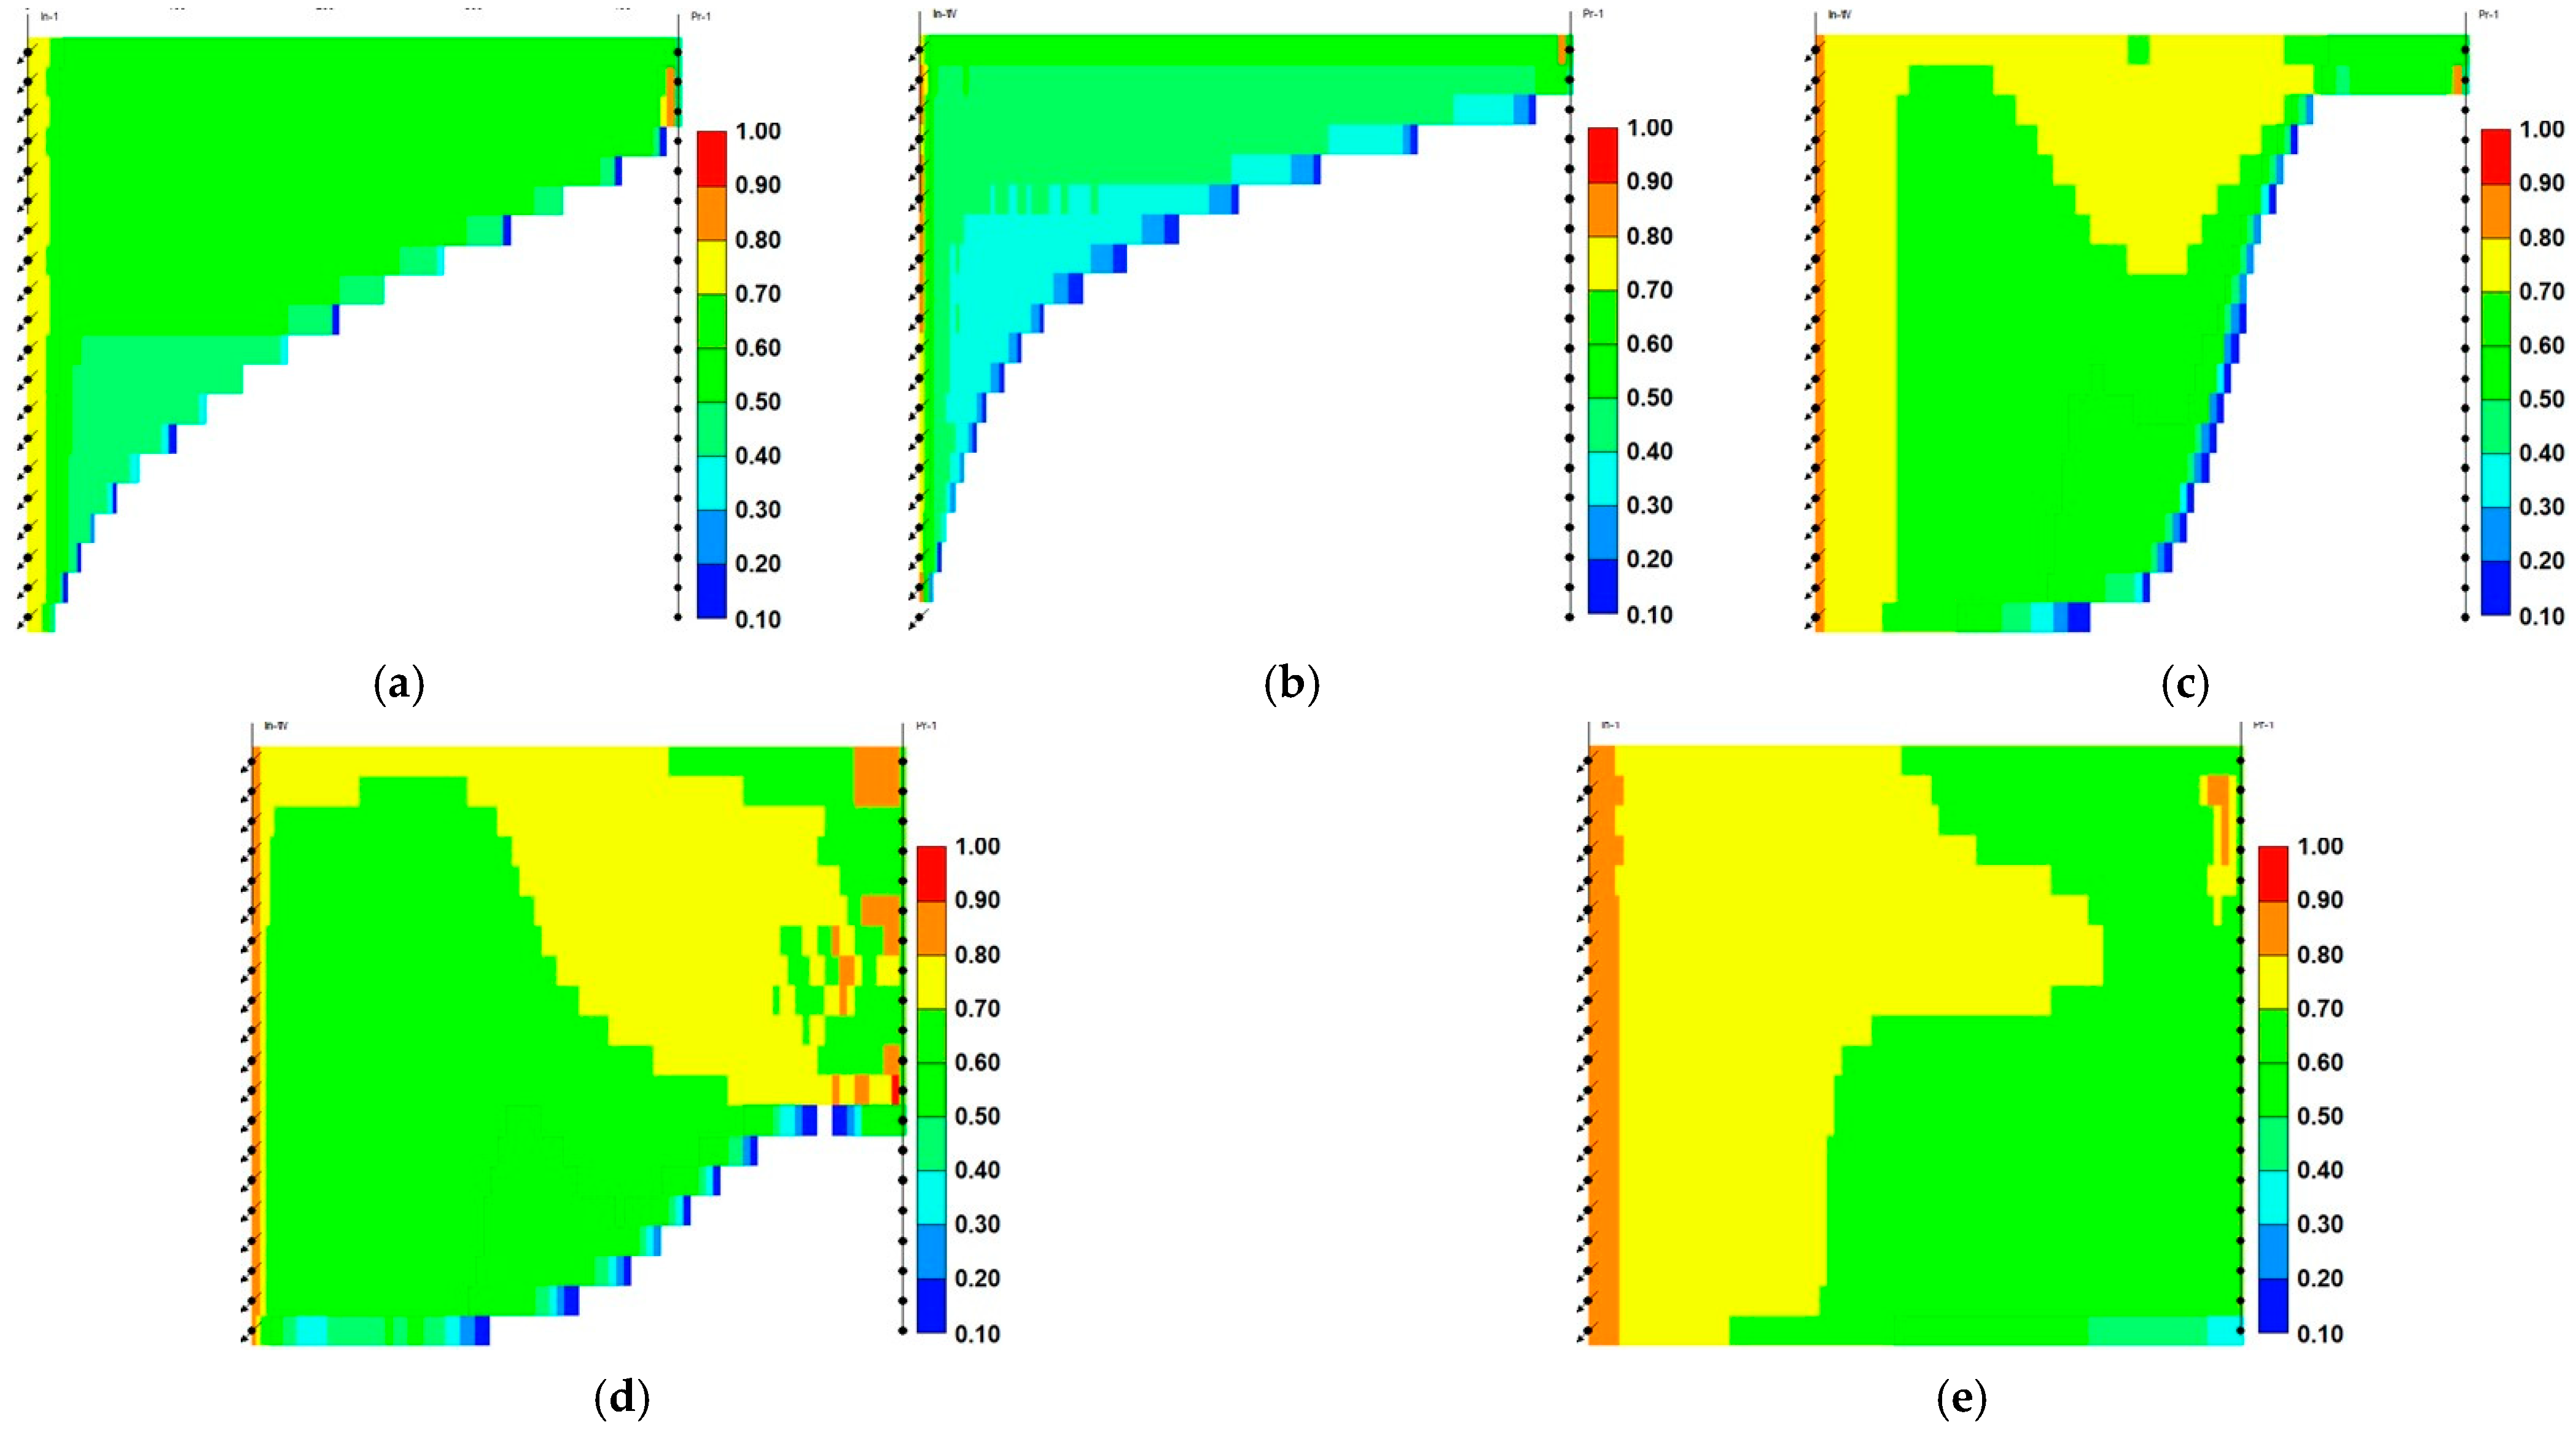
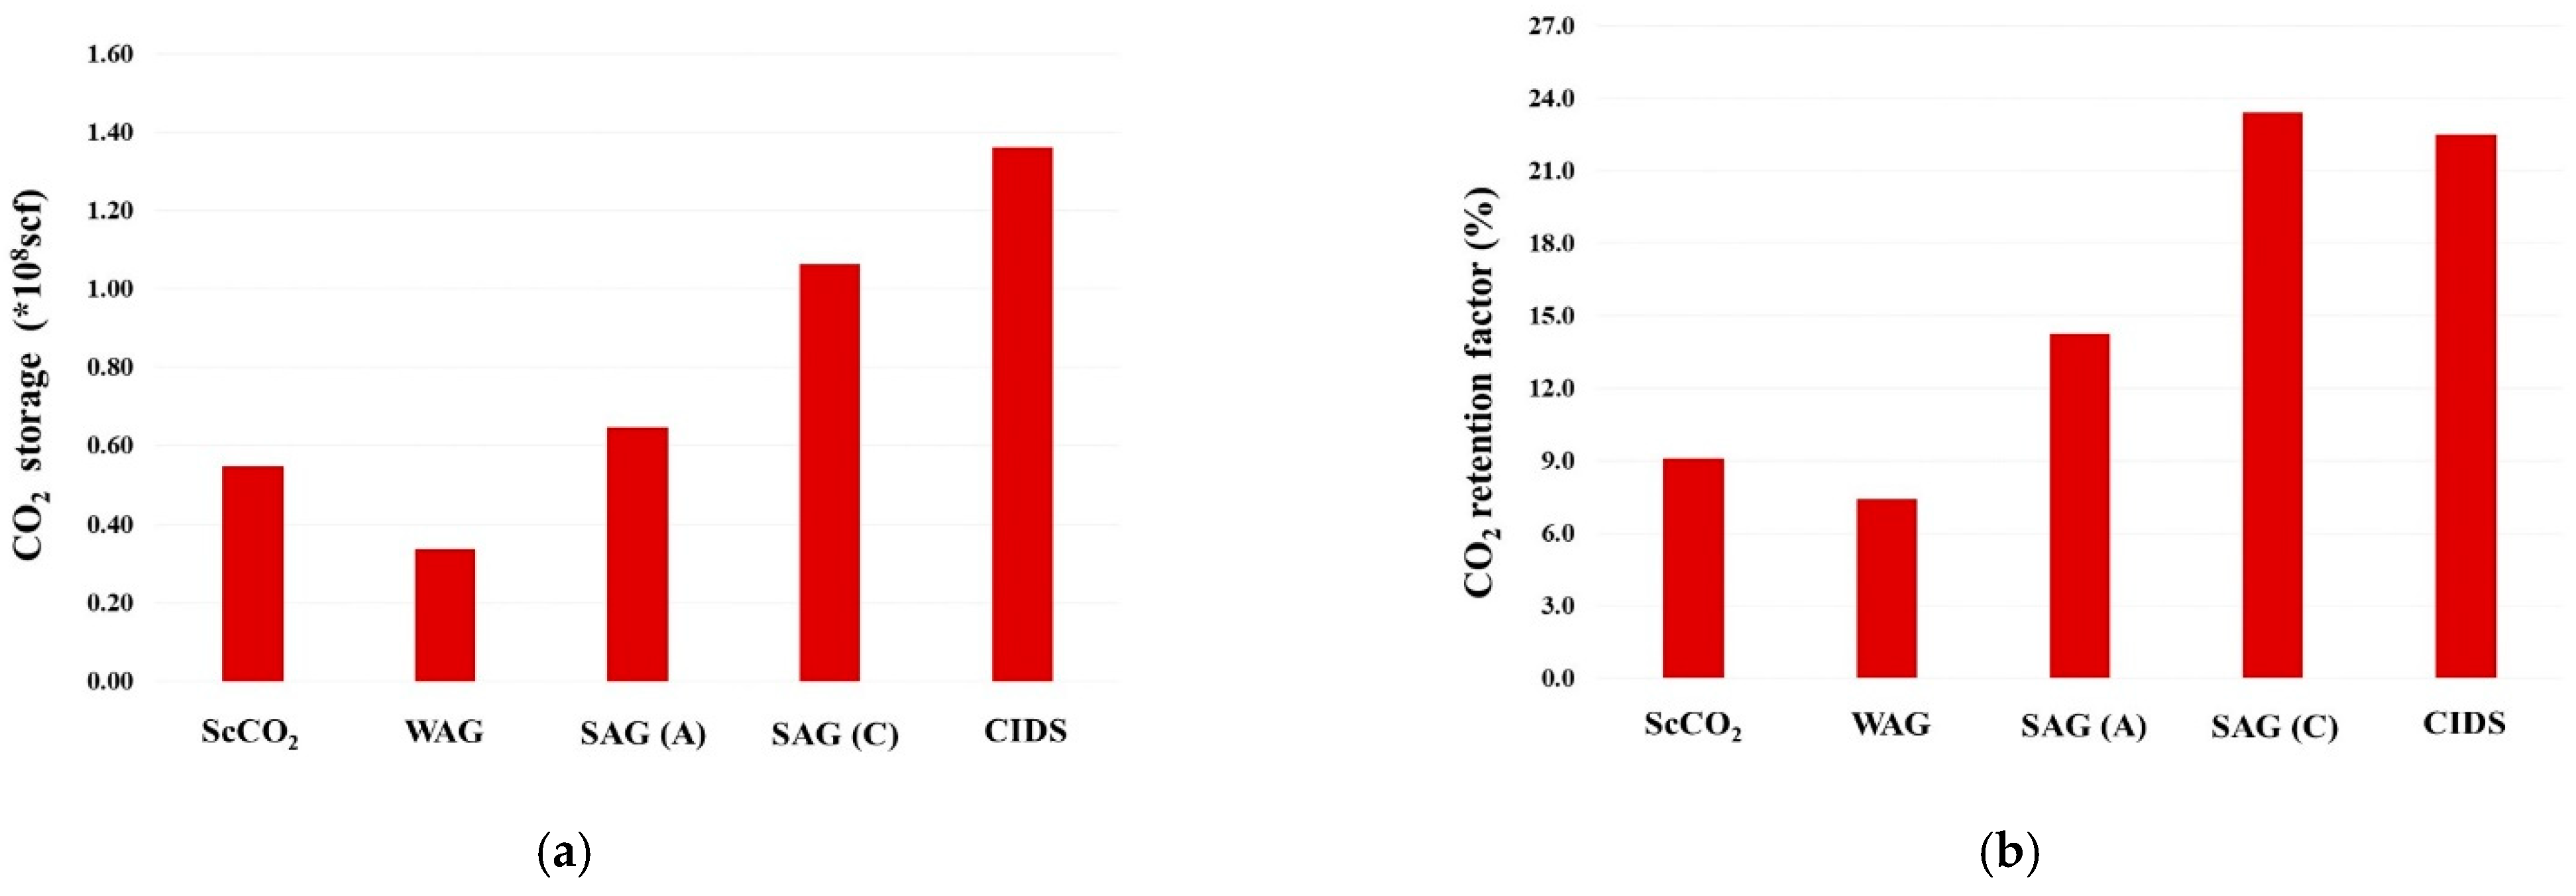
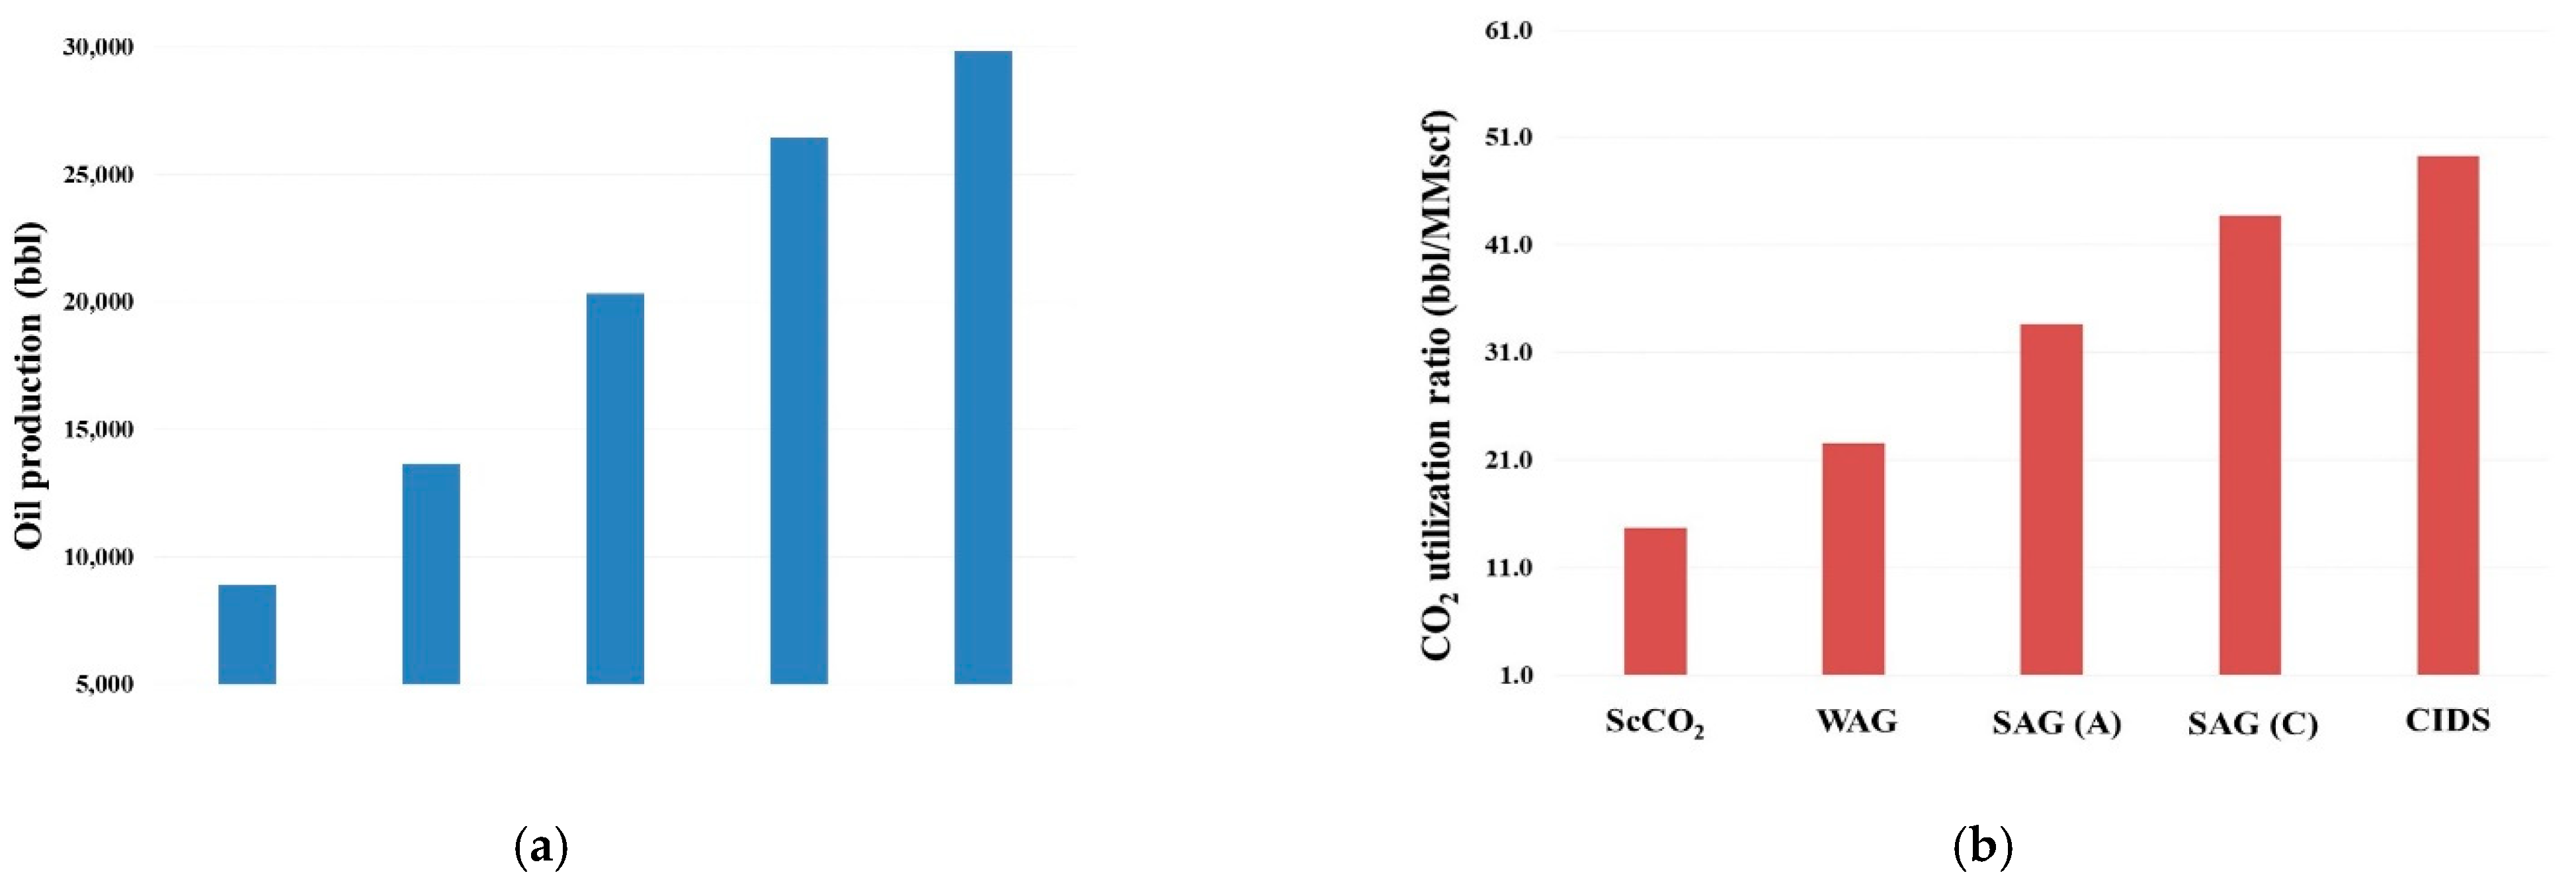
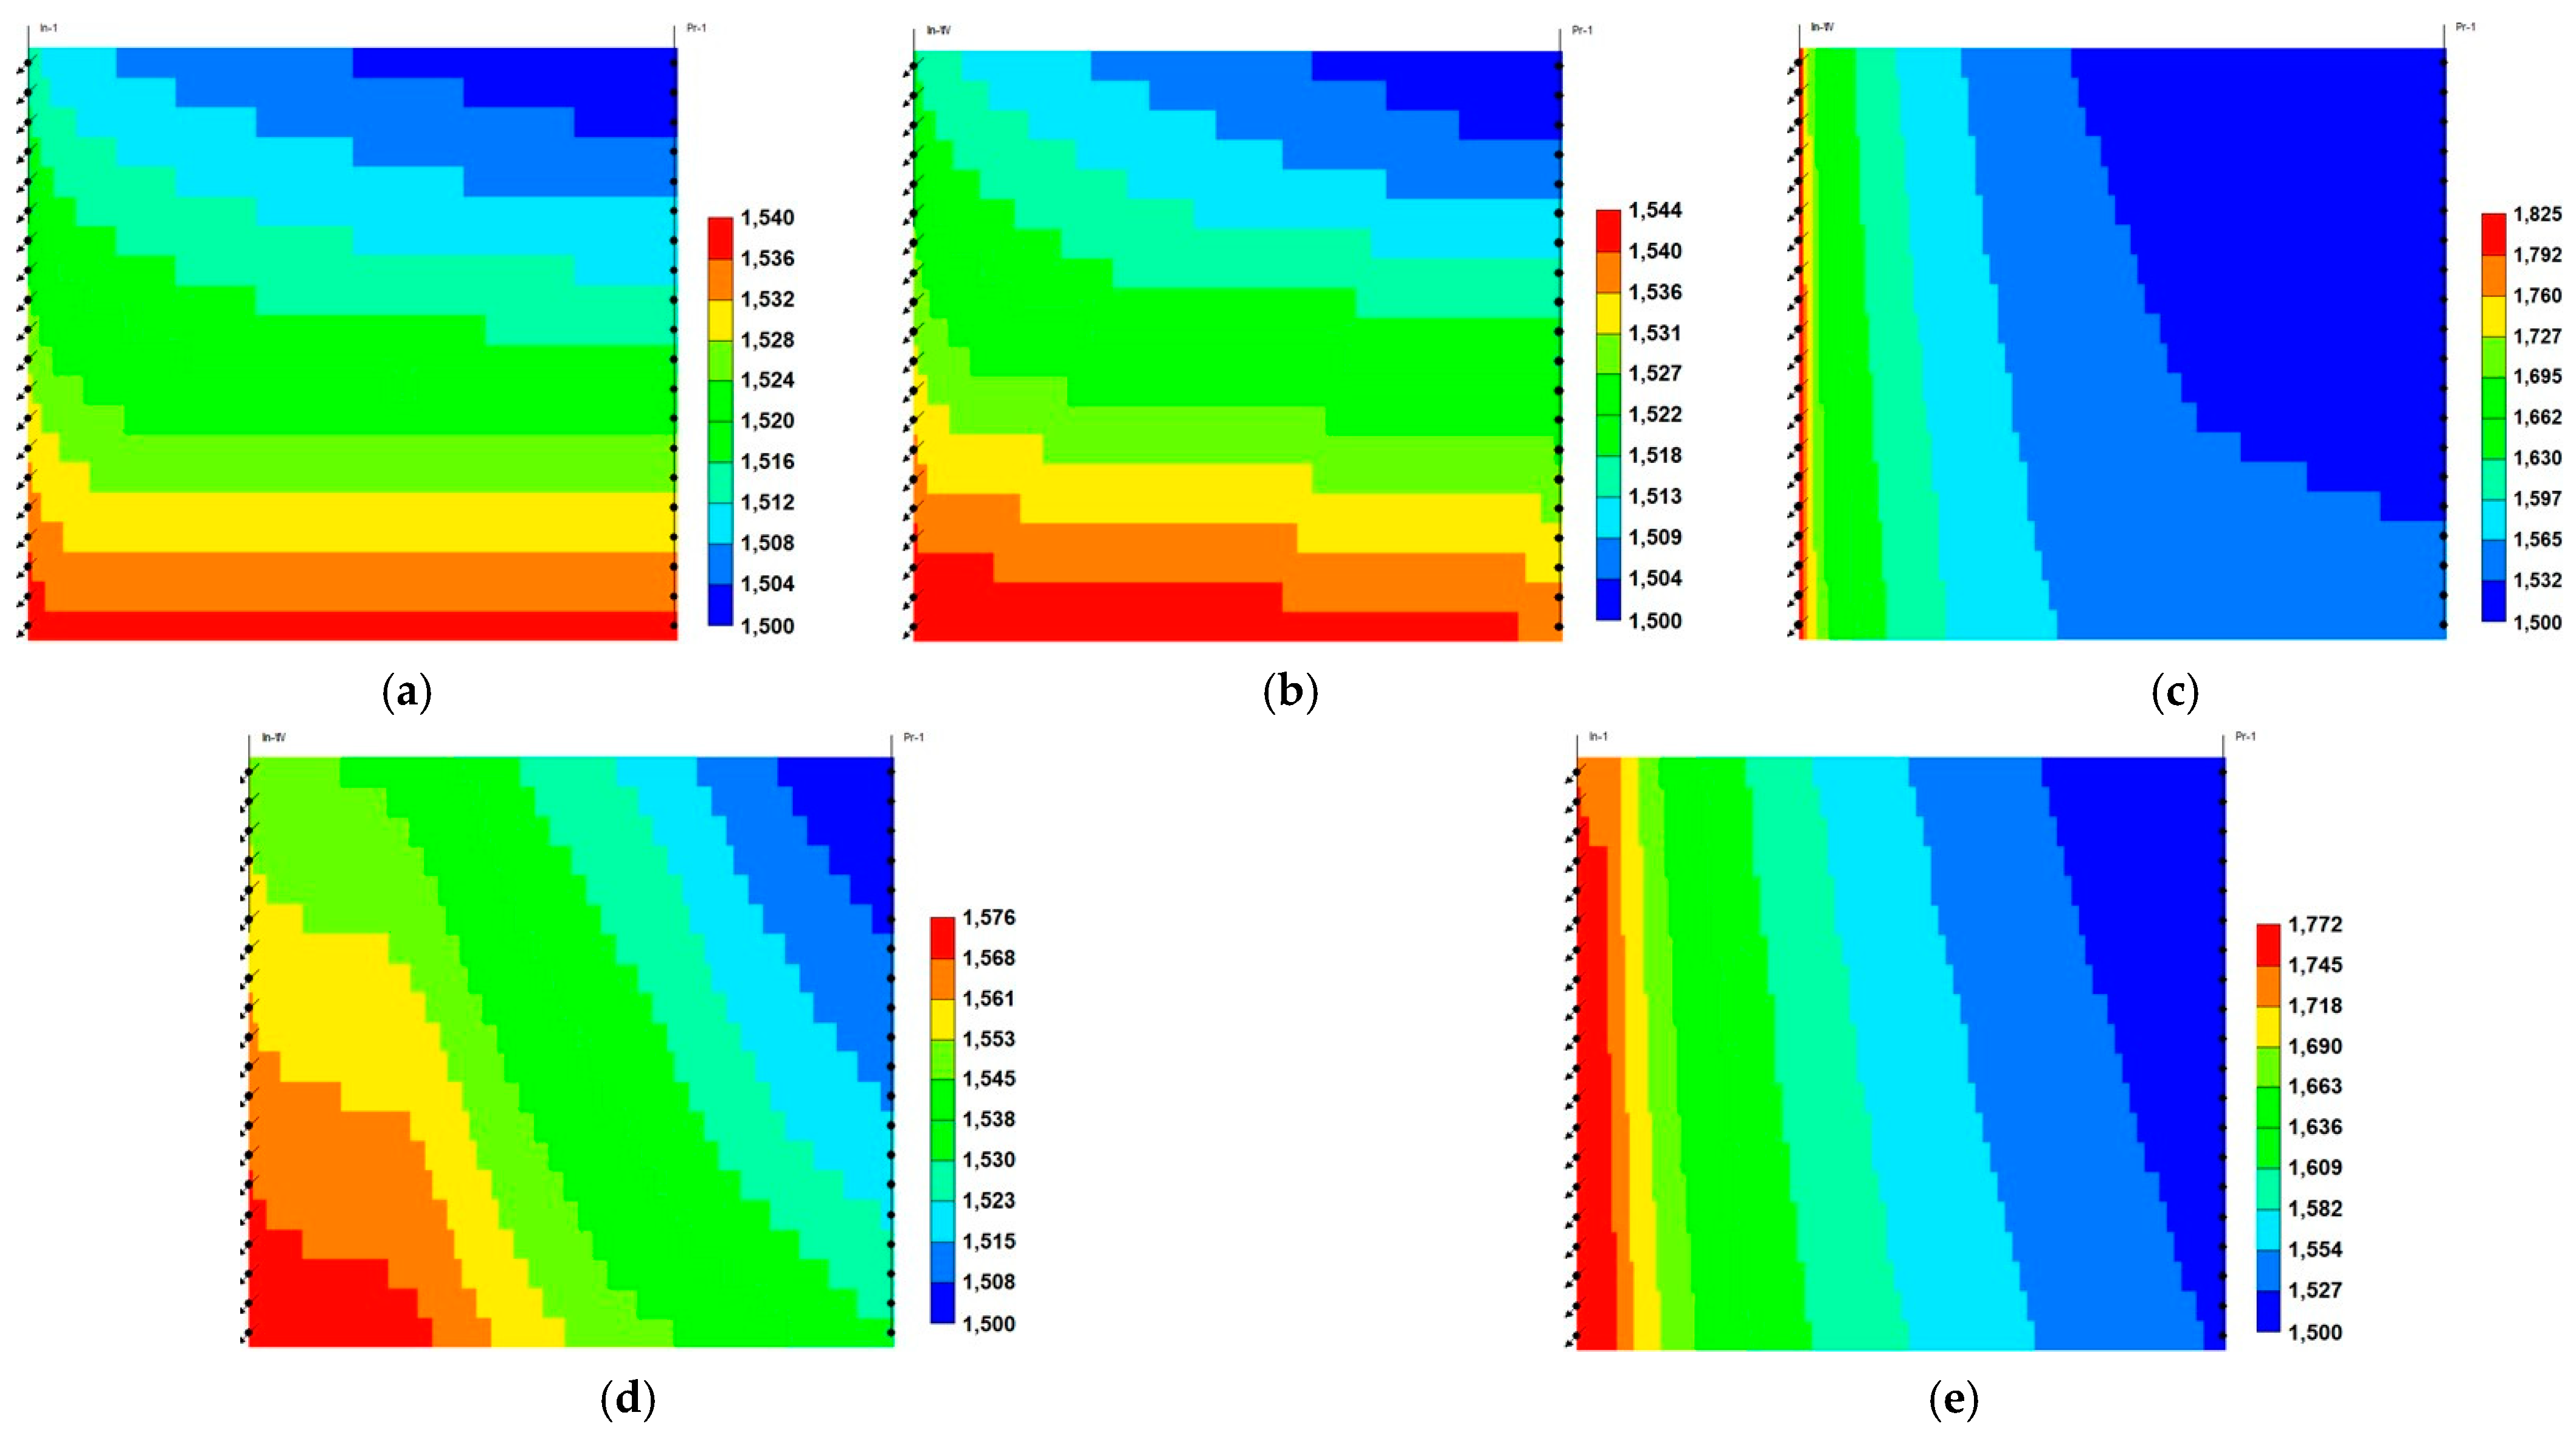
  • Relative to ScoCO2 and WAG injections, it is necessary to employ a surfactant for proper mobility control. CPS emulsion could further slow down the gas BT and reduce the CO2 production rate, relative to ASS emulsion. In particular, CPS emulsion not only extends the mixing zone pronouncedly deeper into the reservoir, but also pulls the override zone downwards to provide better conformance control there. CIDS injection could even sweep the entire reservoir area. Accordingly, CPS emulsion stores more than 63% CO2 than ASS emulsion, while another 28% improvement is achieved by novel CIDS injection. Meanwhile, CPS emulsion is also 65% more efficient on CO2 retention than a conventional one.
  • Conventional ASS emulsion would leave an unswept surfactant vacuum zone on the topmost layer, owing to water slumping, while the dual phase partition capacity of CPS endues its possibility to present in those layers to realize the mobility control and facilitate the CO2 diversion downwards. In turn, the alternating injection of CPS emulsion doubles the oil production than WAG, and produces 30% more than ASS emulsion, while CIDS injection could provide another 13% more oil recovery. The variation of the CO2 utilization ratio is consistent with oil production among tested cases.
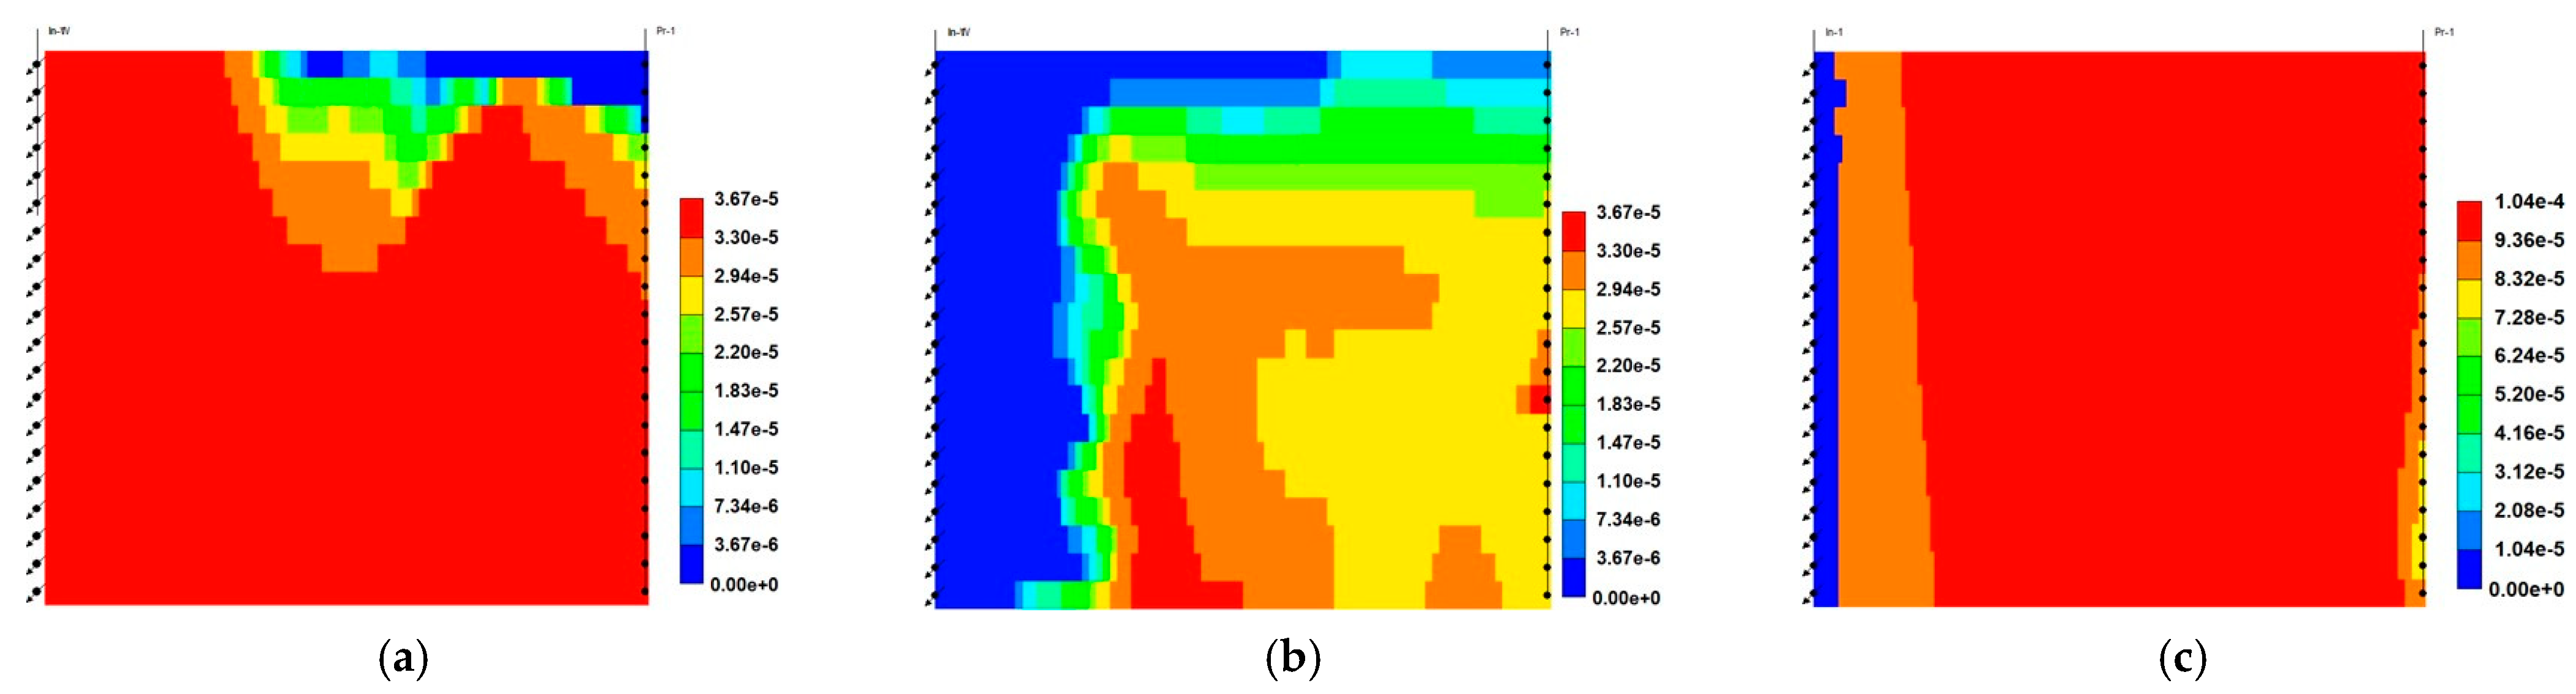
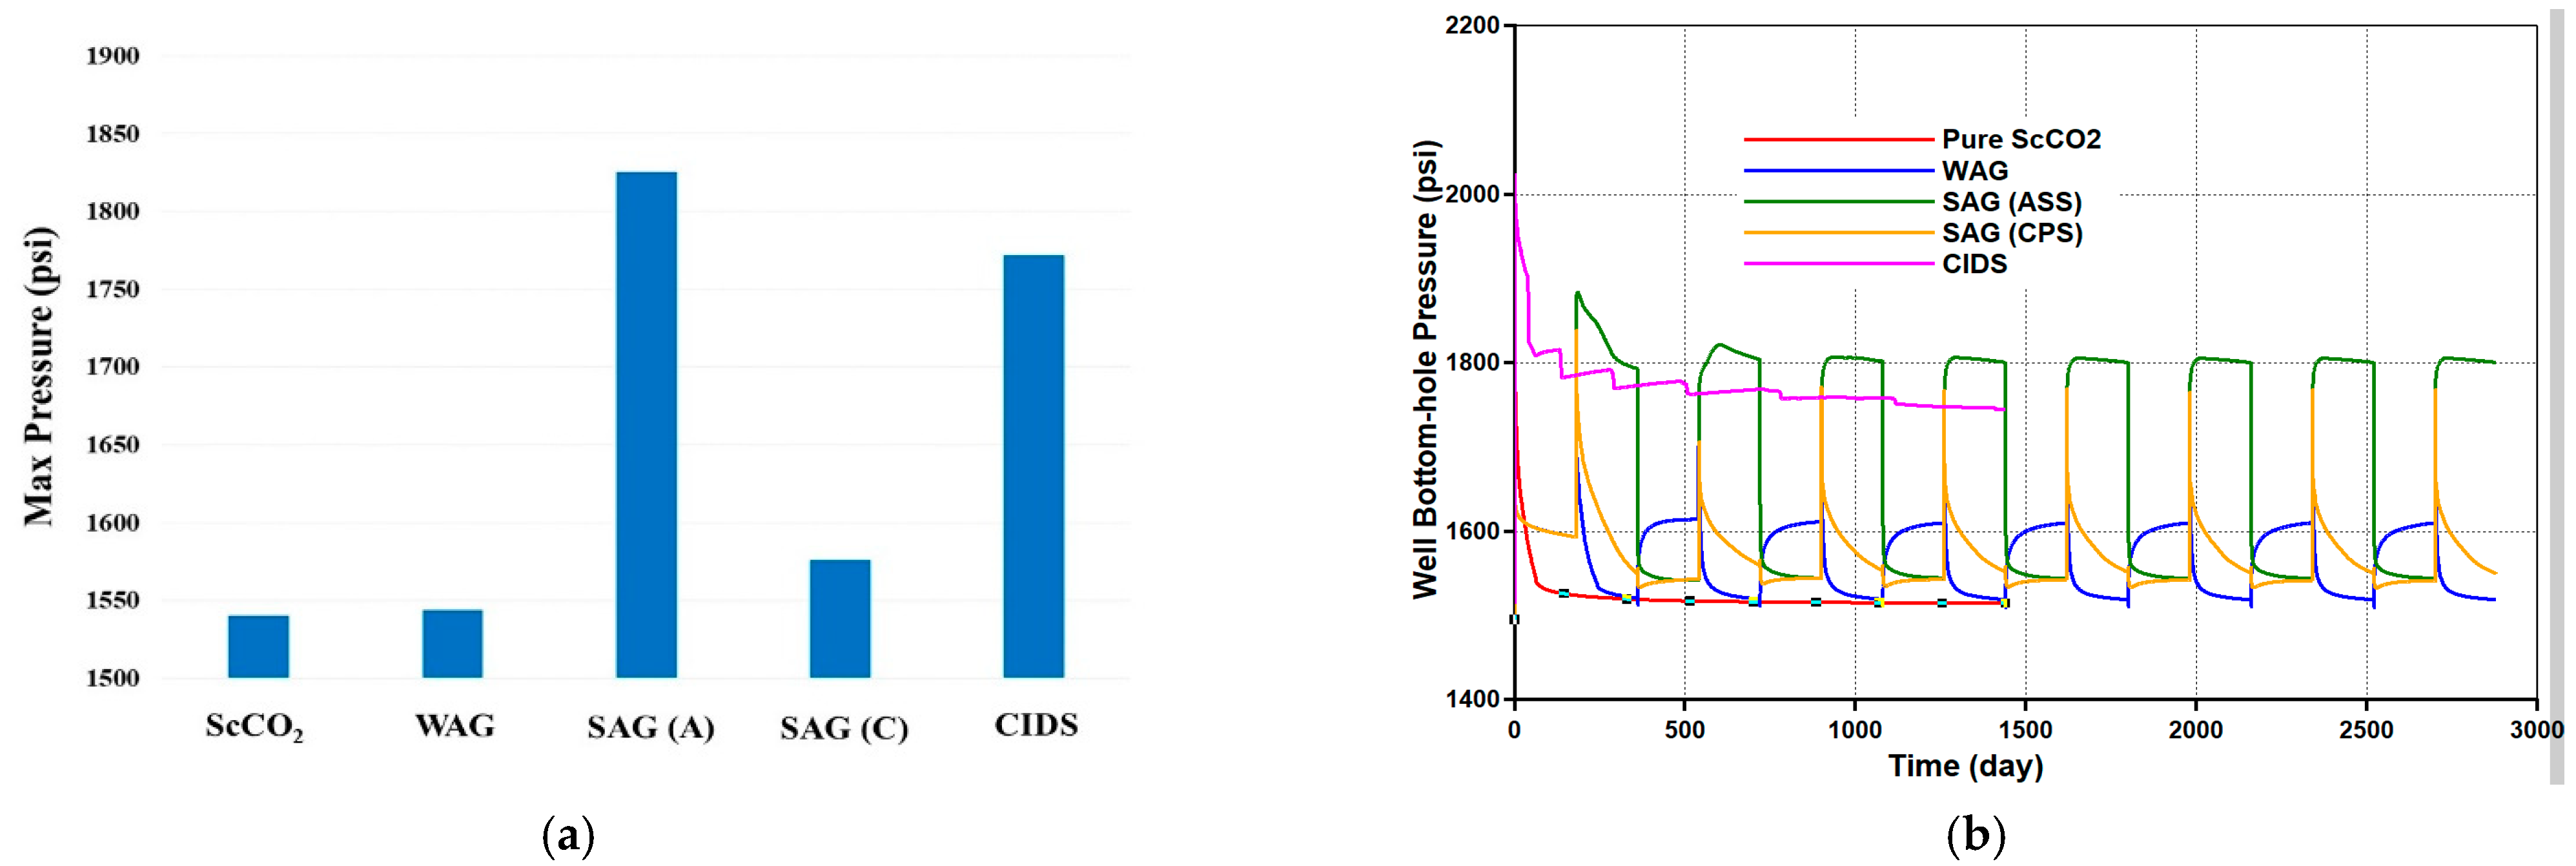
  • The pressure distribution of ASS emulsion is uneven and the pressure gradient is sharp near the wellbore, which implies low energy utilization efficiency. On the contrary, CPS emulsion provides a much more even pressure gradient. In addition, there exists a CPS vacuum zone near the wellbore, which is caused by the combination of ScCO2 extraction to water, the dynamic partition of CPS into injected ScCO2 stream and the foam dry-out effect. Thereby, CPS emulsion demonstrates significantly lower BHP and much higher injectivity.

Author Contributions

Conceptualization, G.R.; methodology, G.R.; software, G.R.; validation, G.R., B.R., S.L. and C.Z.; formal analysis, G.R., B.R., S.L. and C.Z.; investigation, G.R. and B.R.; resources, G.R.; data curation, G.R.; writing—original draft preparation, G.R.; writing—review and editing, G.R., B.R., S.L. and C.Z.; visualization, G.R.; supervision, G.R.; project administration, G.R.; funding acquisition, G.R. All authors have read and agreed to the published version of the manuscript.

Funding

This research received no external funding.

Data Availability Statement

Data will be available by request.

Conflicts of Interest

The authors declare no conflict of interest.

Nomenclature

epdryExponent in the equation for foam dry out effect
epsurfExponent in the equation for surfactant concentration effect
fmdryCritical water saturation for foam collapsing
fmmobReference mobility reduction factor
fmsurfCritical surfactant concentration for “strong” foam (mole fraction)
F1Effect of surfactant concentration for foam
F7Effect of foam dry out by waster saturation
FMFoam mobility reduction factor
KG/L partition coefficient

Appendix A. Selected CPS Thermodynamic Properties at 1500 psi and 35 °C (Ren et al. 2014)

Figure A1. (a) Solubility in ScCO2; (b) Partition coefficient between Brine/ScCO2.
Suschem 02 00009 g0a1

References

  1. Bejestani, D.Z.; Rostami, B.; Khosravi, M.; Kazemi, K. Effect of petrophysical matrix properties on bypassed oil recovery from a matrix-fracture system during CO2 near-miscible injection: Experimental investigation. Int. J. Multiph. Flow 2016, 85, 123–131. [Google Scholar] [CrossRef]
  2. Bond, D.C.; Holbrook, C.C. Gas Drive Oil Recovery Process. U.S. Patent No. 2866507, December 1958. [Google Scholar]
  3. Hiraski, G.J. The Steam-Foam Process. J. Pet. Technol. 1989, 41, 449–456. [Google Scholar] [CrossRef]
  4. M’Barki, O.; Ma, K.; Ren, G.; Mateen, K.; Bourdarot, G.; Morel, D.C.; Nguyen, Q.P. Repeatable Steady-State Foam Experimental Data and Investigations of Foam Hysteresis in a Sand Pack. In Proceedings of the SPE Annual Technical Conference and Exhibition, San Antonio, TX, USA, 9–11 October 2017. [Google Scholar]
  5. Hirasaki, G.; Lawson, J. Mechanisms of Foam Flow in Porous Media: Apparent Viscosity in Smooth Capillaries. Soc. Pet. Eng. J. 1985, 25, 176–190. [Google Scholar] [CrossRef]
  6. Falls, A.; Musters, J.; Ratulowski, J. The Apparent Viscosity of Foams in Homogeneous Bead Packs. SPE Reserv. Eng. 1989, 4, 155–164. [Google Scholar] [CrossRef]
  7. Dhanuka, V.V.; Dickson, J.L.; Ryoo, W.; Johnston, K.P. High internal phase CO2-in-water emulsions stabilized with a branched nonionic hydrocarbon surfactant. J. Colloid Interface Sci. 2006, 298, 406–418. [Google Scholar] [CrossRef]
  8. Alkan, H.; Goktekin, A.; Satman, A. A Laboratory Study of CO2-Foam Process for Bati Raman Field, Turkey. In Proceedings of the Middle East Oil Show, Bahrain, 16–19 November 1991; Available online: https://onepetro.org/SPEMEOS/proceedings-abstract/91MEOS/All-91MEOS/SPE-21409-MS/53677 (accessed on 24 December 2020).
  9. Lee, H.O.; Heller, J.P. Laboratory Measurements of CO2-Foam Mobility. SPE Reserv. Eng. 1990, 5, 193–197. [Google Scholar] [CrossRef]
  10. Wang, Y.; Liu, X.; Jiao, T.; Niu, J. Performance Comparison Between Internal Olefin Sulfonates and Alpha Olefin Sulfonates. J. Surfactants Deterg. 2016, 20, 183–191. [Google Scholar] [CrossRef]
  11. Tsau, J.-S.; Grigg, R.B. Assessment of Foam Properties and Effectiveness in Mobility Reduction for CO2-Foam Floods. In Proceedings of the 1997 SPE International Symposium on Oilfield Chemistry, Houston, TX, USA, 18–21 February 1997. [Google Scholar]
  12. Yin, G.; Grigg, R.B.; Svec, Y. Oil Recovery and Surfactant Adsorption during CO2-Foam Flooding. In Proceedings of the 2009 Offshore Technology Conference, Houston, TX, USA, 4–7 May 2009. [Google Scholar]
  13. Patil, P.D.; Knight, T.; Katiyar, A.; Vanderwal, P.; Scherlin, J.; Rozowski, P.; Ibrahim, M.; Sridhar, G.B.; Nguyen, Q.P. CO2 Foam Field Pilot Test in Sandstone Reservoir: Complete Analysis of Foam Pilot Response. J. Pet. Technol. 2018, 70, 70–71. [Google Scholar]
  14. Garrett, P.R. The Science of Defoaming—Theory, Experiment and Applications; Surfacing Science Series; Taylor & Francis Group: Abingdon, UK, 2020; Volume 155. [Google Scholar]
  15. Lobo, L.A.; Nikolov, A.D.; Wasan, D.T. Foam stability in the presence of oil: On the importance of the second virial coefficient. J. Dispers. Sci. Technol. 1989, 10, 143–161. [Google Scholar] [CrossRef]
  16. Denkov, N.D.; Marinova, K.G.; Tcholakova, S.S. Mechanistic understanding of the modes of action of foam control agents. Adv. Coll. Interface Sci. 2014, 206, 57–67. [Google Scholar] [CrossRef]
  17. Bergeron, V.; Fagan, M.E.; Radke, C.J. Generalized entering coefficients: A criterion for foam stability against oil in porous media. Langmuir 1993, 9, 1704–1713. [Google Scholar] [CrossRef] [Green Version]
  18. Koczo, K.; Lobo, L.; Wasan, D. Effect of oil on foam stability: Aqueous foams stabilized by emulsions. J. Colloid Interface Sci. 1992, 150, 492–506. [Google Scholar] [CrossRef]
  19. Henry, R.L.; Fisher, D.R.; Pennell, S.P.; Honnert, M.A. Field Test of Foam to Reduce CO2 Cycling. In Proceedings of the SPE/DOE Improved Oil Recovery Symposium, Tulsa, OK, USA, 21–24 April 1996. [Google Scholar]
  20. Chou, S.; Vasicek, S.; Pisio, D.; Jasek, D.; Goodgame, J. CO2 Foam Field Trial at North Ward-Estes. In Proceedings of the SPE Annual Technical Conference and Exhibition, Washington, DC, USA, 4–7 October 1992. [Google Scholar]
  21. Tsau, J.-S.; Heller, J. CO2 Foam Field Verification Pilot Test at EVGSAU: Phase IIIA—Surfactant Performance Characterization and Quality Assurance. In Proceedings of the SPE/DOE Improved Oil Recovery Symposium, Tulsa, OK, USA, 17–20 April 1994. [Google Scholar]
  22. Martin, F.D.; Stevens, J.E.; Harpole, K.J. CO2-Foam Field Test at the East Vacuum Grayburg/San Andres Unit. SPE Reserv. Eng. 1995, 10, 266–272. [Google Scholar] [CrossRef]
  23. Hoefner, M.L.; Evans, E.M. CO2 Foam: Results from Four Developmental Field Trials. SPE Reserv. Eng. 1995, 10, 273–281. [Google Scholar] [CrossRef]
  24. Mukherjee, J.; Nguyen, Q.P.; Scherlin, J.; Vanderwal, P.; Rozowski, P. CO2 Foam Pilot in Salt Creek Field, Natrona County, WY: Phase III: Analysis of Pilot Performance. In Proceedings of the SPE Improved Oil Recovery Conference, Tulsa, OK, USA, 14–18 April 2018. [Google Scholar]
  25. Sanders, A.W.; Jones, R.M.; Linroth, M.A.; Nguyen, Q.P. Implementation of a CO2 Foam Pilot Study in the SACROC Field: Performance Evaluation. In Proceedings of the SPE Annual Technical Conference and Exhibition, San Antonio, TX, USA, 8–10 October 2012. [Google Scholar]
  26. Svorstol, I.; Vassenden, F.; Mannhardt, K. Laboratory Studies for Design of a Foam Pilot in the Snorre Field. In Proceedings of the SPE/DOE Improved Oil Recovery Symposium, Tulsa, OK, USA, 21–24 April 1996. [Google Scholar]
  27. Xu, Q.; Rossen, W. Experimental Study of Gas Injection in a Surfactant-Alternating-Gas. SPE Reserv. Eval. Eng. 2004, 7, 438–448. [Google Scholar] [CrossRef]
  28. Xing, D.; Wei, B.; McLendon, W.J.; Enick, R.M.; McNulty, S.; Trickett, K.; Mohamed, A.; Cummings, S.; Eastoe, J.; E Rogers, S.; et al. CO2-Soluble, Nonionic, Water-Soluble Surfactants That Stabilize CO2-in-Brine Foams. SPE J. 2012, 17, 1172–1185. [Google Scholar] [CrossRef]
  29. McLendon, W.; Koronaios, P.; Enick, R.M.; Biesmans, G.; Salazar, L.C.; E Miller, A.; Soong, Y.; McLendon, T.; Romanov, V.; Crandall, D. Assessment of CO2-soluble non-ionic surfactants for mobility reduction using mobility measurements and CT imaging. J. Pet. Sci. Eng. 2014, 119, 196–209. [Google Scholar] [CrossRef]
  30. Le, V.Q.; Nguyen, Q.P.; Sanders, A. A Novel Foam Concept with CO2 Dissolved Surfactants. In Proceedings of the SPE Symposium on Improved Oil Recovery, Tulsa, OK, USA, 20–23 April 2008. [Google Scholar]
  31. Tiffin, D.L.; Sebastian, H.M.; Bergman, D.F. Displacement Mechanism and Water Shielding Phenomena for a Rich-Gas/Crude-Oil System. SPE Reserv. Eng. 1991, 6, 193–199. [Google Scholar] [CrossRef]
  32. Akbar, M.; Vissapragada, B.; Alghamdi, A.H.; Allem, D. A Snapshot of Carbonate Reservoir Evaluation. Oilfoeld Rev. 2000, 12, 20–21. [Google Scholar]
  33. Sloan, R. Quantification of Uncertainty in Recovery Efficiency Predictions: Lessons Learned from 250 Mature Carbonate Fields. In Proceedings of the SPE Annual Technical Conference and Exhibition, Denver, CO, USA, 5–8 October 2003. [Google Scholar]
  34. Chen, P.; Mohanty, K.K. Wettability Alteration in High Temperature Carbonate Reservoirs. In Proceedings of the SPE Improved Oil Recovery Symposium, Tulsa, OK, USA, 12–16 April 2014. [Google Scholar]
  35. Alshehri, A.J.; Kovscek, A.R. Experimental and Numerical Study of Gravity Effects on Oil Recovery in Fractured Carbonates. In Proceedings of the 7th International Petroleum Technology Conference, Doha, Qatar, 19–22 January 2014. [Google Scholar]
  36. Chahardowli, M.; Zholdybayeva, A.; Farajzadeh, R.; Bruining, H. Solvent-enhanced Spontaneous Imbibition in Fractured Reservoirs. In Proceedings of the 75th EAGE Conference & Exhibition incorporating SPE EUROPEC 2013, London, UK, 10–13 June 2013. [Google Scholar]
  37. Eide, O.; Ersland, G.; Brattekas, B.; Haugen, A.; Graue, A.; Ferno, M.A. CO2 EOR by Diffusive Mixing in Fractured Reservoirs. Petrophysics 2015, 56, 23–31. [Google Scholar]
  38. Farajzadeh, R.; Wassing, B.; Boerrigter, P. Foam assisted gas–oil gravity drainage in naturally-fractured reservoirs. J. Pet. Sci. Eng. 2012, 94–95, 112–122. [Google Scholar] [CrossRef]
  39. Alavian, S.A.; Whitson, C.H. Scale Dependence of Diffusion in Naturally Fractured Reservoirs for CO2 Injection. In Proceedings of the SPE Improved Oil Recovery Symposium, Tulsa, OK, USA, 24–28 April 2010. [Google Scholar]
  40. Morel, D.; Bourbiaux, B.; Latil, M.J.; Thiebot, B. Diffusion Effects in Gasflooded Light-Oil Fractured Reservoirs. SPE Adv. Technol. Ser. 1993, 1, 100–109. [Google Scholar] [CrossRef]
  41. Denney, D. History Matching Thermally Assisted Gas/Oil Gravity Drainage in Fractured Reservoirs. J. Pet. Technol. 2008, 60, 51–55. [Google Scholar] [CrossRef]
  42. Karimaie, H.; Torsæter, O. Low IFT gas–oil gravity drainage in fractured carbonate porous media. J. Pet. Sci. Eng. 2010, 70, 67–73. [Google Scholar] [CrossRef]
  43. Yan, W.; Miller, C.A.; Hirasaki, G.J. Foam sweep in fractures for enhanced oil recovery. Colloids Surf. A Physicochem. Eng. Asp. 2006, 282–283, 348–359. [Google Scholar] [CrossRef]
  44. Ferno, M.A.; Gauteplass, J.; Pancharoen, M.; Haugen, A.; Graue, A.; Kovscek, A.R.; Hirasaki, G.J. Experimental Study of Foam Generation, Sweep Efficiency and Flow in a Fracture Network. SPE J. 2016, 21, 1140–1150. [Google Scholar] [CrossRef]
  45. Abdalla, M.S. Appraisal of Techniques Applied to Stimulate the Deep Khuff Gas Wells. In Proceedings of the Middle East Oil Show, Bahrain, 11–14 March 1989. [Google Scholar]
  46. Fjelde, I.; Zuta, J.; Duyilemi, O.V. Oil Recovery from Matrix during CO2-Foam Flooding of Fractured Carbonate Oil Reservoirs. In Proceedings of the Europec/EAGE Conference and Exhibition, Rome, Italy, 9–12 June 2008. [Google Scholar]
  47. Zuta, J.; Fjelde, I. Transport of CO2-Foaming Agents during CO2-Foam Processes in Fractured Chalk Rock. SPE Reserv. Eval. Eng. 2010, 13, 710–719. [Google Scholar] [CrossRef]
  48. Castro, S.H.L.; Restrepo, A.; Ocampo, A. Use of Divergent Fluids as an Alternative for Enhanced Recovery in Naturally Fractured Cores. In Proceedings of the Latin American and Caribbean Petroleum Engineering Conference, Cartagena de Indias, Colombia, 31 May–3 June 2009. [Google Scholar]
  49. Zuta, J.; Fjelde, I.; Berenblyum, R. Oil Recovery during CO2-Foam in Fractured Chalk Rock at Reservoir Conditions. In Proceedings of the International Symposium of the Society of Core Analysts, Noordwijk, The Netherlands, 27–30 September 2009. [Google Scholar]
  50. Panahi, H. Improving the Recovery Factor of Heavy Crude Reservoirs by Co-injecting CO2 and Other Conventional Gaseous Injecting Materials at Immiscibility Condition with Foam. In Proceedings of the SPE International Petroleum Conference in Mexico, Puebla Pue, Mexico, 7–9 November 2004. [Google Scholar]
  51. Haugen, Å.; Fernø, M.A.; Graue, A.; Bertin, H.J. Experimental Study of Foam Flow in Fractured Oil-Wet Limestone for Enhanced Oil Recovery. SPE Reserv. Eval. Eng. 2012, 15, 218–228. [Google Scholar] [CrossRef]
  52. Consani, K.A.; Smith, R.D. Observations on the solubility of surfactants and related molecules in carbon dioxide at 50 °C. J. Supercrit. Fluids 1990, 3, 51–56. [Google Scholar] [CrossRef]
  53. Eastoe, J.; Paul, A.; Nave, S.; Steytler, D.C.; Robinson, B.H.; Rumsey, E.; Thorpe, M.; Heenan, R.K. Micellization of Hydeocarbon Surfactants in Supercritical Carbon Dioxide. J. Am. Chem. Soc. 2001, 123, 988–989. [Google Scholar] [CrossRef] [PubMed]
  54. Bernard, G.; Holm, L. Method for recovering oil from subterranean formations. U.S. Patent 3,342,256, 19 September 1967. [Google Scholar]
  55. Fink, R.; Hancu, D.; Valentine, R.; Beckman, J.E. Toward the Development of “CO2-philic” Hydrocarbons. 1. Use of Side-Chain Functionalization to Lower the Miscibility Pressure of Polydimethylsiloxanes in CO2. J. Phys. Chem. B 1999, 103, 6441–6444. [Google Scholar] [CrossRef]
  56. Hoefling, T.A.; Newman, D.A.; Enick, R.M.; Beckman, E.J. Effect of Strcuture on the Cloud-Point Curves of Silicone-Based Amphiphiles in Supercritical Carbon Dioxide. J. Supercrit. Fluids 1993, 6, 165–171. [Google Scholar] [CrossRef]
  57. Ryoo, W.; Webber, S.E.; Johnston, K.P. Water-in-Carbon Dioxide Microemulsions with Methylated Branched Hydrocarbon Surfactants. Ind. Eng. Chem. Res. 2003, 42, 6348–6358. [Google Scholar] [CrossRef]
  58. Sagisaka, M.; Ono, S.; James, C.; Yoshizawa, A.; Mohamed, A.; Guittard, F.; Enick, R.M.; Rogers, S.E.; Czajka, A.; Hill, C.; et al. Anisotropic reversed micelles with fluorocarbon-hydrocarbon hybrid surfactants in supercritical CO2. Colloids Surf. B Biointerfaces 2018, 168, 201–210. [Google Scholar] [CrossRef] [Green Version]
  59. Elhag, A.S.; Chen, Y.; Chen, H.; Reddy, P.P.; Cui, L.; Worthen, A.J.; Ma, K.; Hirasaki, G.J.; Nguyen, Q.P.; Biswal, S.L.; et al. Switchable Amine Surfactants for Stable CO2/Brine Foams in High Temperature, High Salinity Reservoirs. In Proceedings of the SPE Improved Oil Recovery Symposium, Tulsa, OK, USA, 12–16 April 2014. [Google Scholar]
  60. Sagir, M.; Tan, I.M.; Mushtaq, M.; Talebian, S.H. FAWAG Using CO2 Philic Surfactants for CO2 Mobility Control for Enhanced Oil Recovery Applications. In Proceedings of the SPE Improved Oil Recovery Symposium, Tulsa, OK, USA, 12–16 April 2014. [Google Scholar]
  61. Ren, G.; Sanders, A.W.; Nguyen, Q.P. New method for the determination of surfactant solubility and partitioning between CO2 and brine. J. Supercrit. Fluids 2014, 91, 77–83. [Google Scholar] [CrossRef]
  62. Hassanpouryouzband, A.; Yang, J.; Tohidi, B.; Chuvilin, E.; Istomin, V.; Bukhanov, B.; Cheremisin, A. CO2 Capture by Injection of Flue Gas or CO2–N2 Mixtures into Hydrate Reservoirs: Dependence of CO2 Capture Efficiency on Gas Hydrate Reservoir Conditions. Environ. Sci. Technol. 2018, 52, 4324–4330. [Google Scholar] [CrossRef]
  63. Hassanpouryouzband, A.; Joonaki, E.; Farahani, M.V.; Takeya, S.; Ruppel, C.; Yang, J.; English, N.J.; Schicks, J.M.; Edlmann, K.; Mehrabian, H.; et al. Gas hydrates in sustainable chemistry. Chem. Soc. Rev. 2020, 49, 5225–5309. [Google Scholar] [CrossRef] [PubMed]
  64. Pan, S.Y.; Chen, Y.H.; Fan, L.S.; Kim, H.; Gao, X.; Ling, T.C.; Chiang, T.C.; Pei, S.L.; Gu, G. CO2 mineralization and utilization by alkaline solid wastes for potential carbon reduction. Nat. Sustain. 2020, 3, 399–405. [Google Scholar] [CrossRef]
  65. Trogus, F.J.; Sophany, T.; Schechter, R.S.; Wade, W.H. Static and Dynamic Adsorption of Anionic and Nonionic Surfactants. Soc. Pet. Eng. J. 1977, 17, 337–344. [Google Scholar] [CrossRef]
  66. Princen, H.; Goddard, E. The effect of mineral oil on the surface properties of binary surfactant systems. J. Colloid Interface Sci. 1972, 38, 523–534. [Google Scholar] [CrossRef]
  67. Bourrel, M.; Schechter, R.S. Microemulsions and Related Systems; Marcel Dekker: New York, NY, USA, 1988. [Google Scholar]
  68. Ren, G.; Mateen, K.; Ma, K.; Luo, H.; Bourdarot, G.; Morel, D.; Nguyen, N.; Nguyen, Q. In-depth Experimental Studies of Low-Tension Gas (LTG) in High Salinity and High Temperature Sandstone Reservoir. In Proceedings of the IOR 2019—20th European Symposium on Improved Oil Recovery; European Association of Geoscientists & Engineers, Pau, France, 8–10 April 2019. [Google Scholar]
  69. McAuliffe, C.D. Crude-Oil-Water Emulsions to Improve Fluid Flow in an Oil Reservoir. J. Pet. Technol. 1973, 25, 721–726. [Google Scholar] [CrossRef]
  70. Zanganeh, M.N.; Rossen, W.R. Optimization of Foam Enhanced Oil Recovery: Balancing Sweep and Injectivity. SPE Reserv. Eval. Eng. 2013, 16, 51–59. [Google Scholar] [CrossRef]
  71. Vassenden, F.; Holt, T. Experimental Foundation for Relative Permeability Modeling of Foam. SPE Reserv. Eval. Eng. 2000, 3, 179–185. [Google Scholar] [CrossRef]
  72. Chen, M.; Yortsos, Y.; Rossen, W. A Pore-Network Study of the Mechanisms of Foam Generation. In Proceedings of the SPE International Petroleum Conference in Mexico, Puebla Pue, Mexico, 7–9 November 2004. [Google Scholar]
  73. Ashoori, E.; Van Der Heijden, T.L.; Rossen, W.R. Fractional-Flow Theory of Foam Displacements with Oil. SPE J. 2010, 15, 260–273. [Google Scholar] [CrossRef]
  74. Patzek, T.W. Description of Foam Flow in Porous Media by the Population Balance Method; American Chemical Society: Washington, DC, USA, 1988; pp. 326–341. [Google Scholar]
  75. Li, B.; Hirasaki, G.J.; Miller, C.A. Upscaling of Foam Mobility Control to Three Dimensions. In Proceedings of the SPE Symposium on Improved Oil Recovery, Tulsa, OK, USA, 26–29 April 2006. [Google Scholar]
  76. Mahani, H.; Keya, A.L.; Berg, S.; Nasralla, R. Electrokinetics of Carbonate/Brine Interface in Low-Salinity Waterflooding: Effect of Brine Salinity, Composition, Rock Type, and pH on?-Potential and a Surface-Complexation Model. SPE J. 2017, 22, 53–68. [Google Scholar] [CrossRef]
  77. Laurier, L.; Schramm, K.M.; Novosad, J.J. Electrokinetic properties of reservoir rock particles. Colloids Surf. 1991, 55, 309–333. [Google Scholar]
  78. Jian, G.; Puerto, M.C.; Wehowsky, A.; Dong, P.; Johnston, K.P.; Hirasaki, G.J.; Biswal, S.L. Static Adsorption of an Ethoxylated Nonionic Surfactant on Carbonate Minerals. Langmuir 2016, 32, 10244–10252. [Google Scholar] [CrossRef] [PubMed]
  79. Chen, Y.; Elhag, A.S.; Poon, B.M.; Cui, L.; Ma, K.; Liao, S.Y.; Omar, A.; Worthen, A.J.; Hirasaki, G.J.; Nguyen, Q.P.; et al. Ethoxylated Cationic Surfactants for CO2 EOR in High Temperature, High Salinity Reservoirs. In Proceedings of the SPE Annual Technical Conference and Exhibition, San Antonio, TX, USA, 8–10 October 2012. [Google Scholar]
  80. Mukherjee, J.; Norris, S.O.; Nguyen, Q.P.; Scherlin, J.M.; Vanderwal, P.G.; Abbas, S. CO2 Foam Pilot in Salt Creek Field, Natrona County, WY: Phase I: Laboratory Work, Reservoir Simulation, and Initial Design. In Proceedings of the SPE Improved Oil Recovery Symposium, Tulsa, OK, USA, 12–16 April 2014. [Google Scholar]
  81. Liu, Y.; Grigg, R.; Bai, B. Salinity, pH, and Surfactant Concentration Effects on CO2-Foam. In Proceedings of the SPE International Symposium on Oilfield Chemistry, Houston, TX, USA, 2–4 February 2005. [Google Scholar]
  82. Chen, Y.; Elhag, A.S.; Cui, L.; Worthen, A.J.; Reddy, P.P.; Noguera, J.A.; Ou, A.M.; Ma, K.; Puerto, M.; Hirasaki, G.J.; et al. CO2-in-Water Foam at Elevated Temperature and Salinity Stabilized with a Nonionic Surfactant with a High Degree of Ethoxylation. Ind. Eng. Chem. Res. 2015, 54, 4252–4263. [Google Scholar] [CrossRef]
  83. Rossen, W.R. Minimum pressure gradient for foam flow in porous media: Effect of interactions with stationary lamellae. J. Colloid Interface Sci. 1990, 139, 457–468. [Google Scholar] [CrossRef]
  84. Zeng, Y.; Ma, K.; Farajzadeh, R.; Puerto, M.; Biswal, S.L.; Hirasaki, G.J. Effect of Surfactant Partitioning Between Gaseous Phase and Aqueous Phase on CO2 Foam Transport for Enhanced Oil Recovery. Transp. Porous Media 2016, 114, 777–793. [Google Scholar] [CrossRef] [Green Version]
  85. Bernard, G.G.; Jacobs, W. Effect of Foam on Trapped Gas Saturation and on Permeability of Porous Media to Water. Soc. Pet. Eng. J. 1965, 5, 295–300. [Google Scholar] [CrossRef]
  86. Holm, L. The Mechanism of Gas and Liquid Flow Through Porous Media in the Presence of Foam. Soc. Pet. Eng. J. 1968, 8, 359–369. [Google Scholar] [CrossRef]
  87. Adkins, S.S.; Chen, X.; Nguyen, Q.P.; Sanders, A.W.; Johnston, K.P. Effect of branching on the interfacial properties of nonionic hy-drocarbon surfactants at the air-water and carbon dioxide-water interfaces. J. Colloid Interface Sci. 2010, 346, 455–463. [Google Scholar] [CrossRef] [PubMed]
  88. Grigg, R.B. Improving CO2 Efficiency for Recovering Oil in Heterogeneous Reservoirs; DOE Contract No. DE-FG26-01BC15364; National Petroleum Technology Program (U.S.): Tulsa, OK, USA, 2004.
  89. Chambers, K.T.; Radke, C.J. Capillary Phenomena in Foam Flow through Porous Media. In Interfacial Phenomena in Petroleum Recovery; Morrow, N.R., Ed.; Marcel Dekker Inc.: New York, NY, USA, 1991. [Google Scholar]
  90. Kovscek, A.; Radke, C. Fundamentals of foam transport in porous media. In Foams: Fundamentals and Applications in the Petroleum Industry; American Chemical Society: Washington, DC, USA, 1994; pp. 115–163. [Google Scholar]
  91. Uleberg, K.; Høier, L. Miscible Gas Injection in Fractured Reservoirs. In Proceedings of the SPE/DOE Improved Oil Recovery Symposium, Tulsa, OK, USA, 13–17 April 2002. [Google Scholar]
  92. Sanchez, N.L. Management of Water Alternating Gas (WAG) Injection Projects. In Proceedings of the Latin American and Caribbean Petroleum Engineering Conference, Caracas, Venezuela, 21–23 April 1999. [Google Scholar]
  93. Falls, A.; Hirasaki, G.; Patzek, T.; Gauglitz, D.; Miller, D.; Ratulowski, T. Development of a Mechanistic Foam Simulator: The Population Balance and Generation by Snap-Off. SPE Reserv. Eng. 1988, 3, 884–892. [Google Scholar] [CrossRef] [Green Version]
  94. Stone, H.L. Vertical, Conformance in An Alternating Water-Miscible Gas Flood. In Proceedings of the SPE Annual Technical Conference and Exhibition, New Orleans, LA, USA, 26–29 September 1982. [Google Scholar]
  95. Li, D.; Ren, B.; Zhang, L.; Ezekiel, J.; Ren, S.; Feng, Y. CO2-sensitive foams for mobility control and channeling blocking in enhanced WAG process. Chem. Eng. Res. Des. 2015, 102, 234–243. [Google Scholar] [CrossRef]
  96. Zhang, Y.; Wang, Y.; Xue, F.; Wang, Y.; Ren, B.; Zhang, L.; Ren, S. CO2 foam flooding for im-proved oil recovery: Reservoir simulation models and influencing factors. J. Pet. Sci. Eng. 2015, 133, 838–850. [Google Scholar] [CrossRef]
Figure 1. Schematic graph of coreflooding setup.
Suschem 02 00009 g001
Figure 2. Fractured core preparation: (a) Split core with Teflon film supports; and (b) Fixed composite core with tape.
Suschem 02 00009 g002
Figure 3. Reservoir simulation deck: (a) Permeabilities in I and J directions; (b) Permeability in K direction.
Suschem 02 00009 g003
Figure 4. Phase behaviors of selected surfactants and Wasson oil (@35 °C, 1 wt% to 15 wt% salinity). (a) CD-1045, (b) 2EH-PO5-EO15.
Suschem 02 00009 g004
Figure 5. Performance of CO2 emulsions in two-phase Berea sandstone system, (a) ASS pressure drop; (b) CO2-philic surfactants (CPS) pressure drop; and (c) average saturations in the cores.
Suschem 02 00009 g005
Figure 6. Performance of CO2 emulsions in two-phase Silurian dolomite system, (a) ASS pressure drop; (b) CPS pressure drop; and (c) average saturations in the cores.
Suschem 02 00009 g006
Figure 7. Oil recoveries and pressure drops of ScCO2 flooding and W&G co-injection in fractured Silurian dolomite cores.
Suschem 02 00009 g007
Figure 8. Oil recoveries and pressure drops of ASS and CPS CO2 emulsion with fractured Silurian dolomite.
Suschem 02 00009 g008
Figure 9. Gas production rates of variable tested scenarios.
Suschem 02 00009 g009
Figure 10. Gas saturations at end of injections, (a) pure ScCO2 injection; (b) water alternating gas (WAG); (c) surfactant solution alternating injection with gas (SAG) (ASS); (d) SAG (CPS); and (e) CO2 continuous injection with dissolved CO2-philic surfactant (CIDS).
Suschem 02 00009 g010
Figure 11. Gas retention analysis among tested injection scenarios, (a) CO2 storage; and (b) CO2 retention factor.
Suschem 02 00009 g011
Figure 12. Surfactant concentrations at end of injections, (a) SAG (ASS); (b) SAG (CPS); and (c) CIDS.
Suschem 02 00009 g012
Figure 13. Economics analysis among tested injection scenarios, (a) cumulative oil production; and (b) CO2 utilization ratio.
Suschem 02 00009 g013
Figure 14. Pressure distributions at end of injections, (a) pure ScCO2 injection; (b) WAG; (c) SAG (ASS); (d) SAG (CPS); and (e) CIDS.
Suschem 02 00009 g014
Figure 15. Injectivity analysis among tested injection scenarios: (a) max pressure in the reservoir; and (b) bottom hole pressure (BHP).
Suschem 02 00009 g015
Table 1. Summary of corefloodings.
EXPSurfactantInjection Gas FractionRock TypeMeasured Matrix Permeability (md)Measured Composite Core Permeability (md)Porosity (Fraction)Initial So (Fraction)
Two-phase without fractureCO2 EmulsionASS0.75Sandstone296N/A0.212N/A
CO2 EmulsionCPS0.75Sandstone312N/A0.202N/A
CO2 EmulsionASS0.75Dolomite146N/A0.172N/A
CO2 EmulsionCPS0.75Dolomite157N/A0.169N/A
Three-phase with fracturePure CO2N/A1Dolomite1328990.170.51
W&GN/A0.75Dolomite16710980.170.52
CO2 EmulsionASS0.75Dolomite1439670.1650.46
CO2 EmulsionCPS0.75Dolomite16010230.1650.49
Table 2. Parameters of foam model.
FmmobFmsurfEpsurfFmdryEpdry
1000.00003339910.151
Table 3. Summary of injection schemes.
Injection StrategyAqueous/CO2 Cycle RatioUsed SurfactantsUnit Slug Size (Day)Aqueous Rate (bbl/d)CO2 Rate (scf/d)Surfactant Concentration (Mole Fraction)Injection Time (Days)
Pure CO2----420,000-1440
WAG1:1-18045315,000-2880
SAG 1:1A or C18045315,0003.34 × 10−52880
Novel CIDS-C--420,0002.63 × 10−51440
Publisher’s Note: MDPI stays neutral with regard to jurisdictional claims in published maps and institutional affiliations.

