Article

Towards Tissue-Specific Stem Cell Therapy for the Intervertebral Disc: PPARδ Agonist Increases the Yield of Human Nucleus Pulposus Progenitor Cells in Expansion

by
Xingshuo Zhang
1,
Julien Guerrero
1,
Andreas S. Croft
1,
Katharina A.C. Oswald
2,
Christoph E. Albers
2,
Sonja Häckel
2 and
Benjamin Gantenbein
1,2,*
1
Tissue Engineering for Orthopaedics & Mechanobiology (TOM), Department for BioMedical Research (DBMR) of the Faculty of Medicine of the University of Bern, University of Bern, CH-3008 Bern, Switzerland
2
Department of Orthopaedic Surgery and Traumatology, Inselspital, Bern University Hospital, University of Bern, CH-3010 Bern, Switzerland
*
Author to whom correspondence should be addressed.
Submission received: 19 January 2021 / Revised: 5 February 2021 / Accepted: 12 February 2021 / Published: 16 February 2021
(This article belongs to the Special Issue New Approaches to Tissue Engineering for Musculoskeletal Repair)

Abstract

:
(1) Background: Low back pain (LBP) is often associated with intervertebral disc degeneration (IVDD). Autochthonous progenitor cells isolated from the center, i.e., the nucleus pulposus, of the IVD (so-called nucleus pulposus progenitor cells (NPPCs)) could be a future cell source for therapy. The NPPCs were also identified to be positive for the angiopoietin-1 receptor (Tie2). Similar to hematopoietic stem cells, Tie2 might be involved in peroxisome proliferator-activated receptor delta (PPARδ) agonist-induced self-renewal regulation. The purpose of this study was to investigate whether a PPARδ agonist (GW501516) increases the Tie2+ NPPCs’ yield within the heterogeneous nucleus pulposus cell (NPC) population. (2) Methods: Primary NPCs were treated with 10 µM of GW501516 for eight days. Mitochondrial mass was determined by microscopy, using mitotracker red dye, and the relative gene expression was quantified by qPCR, using extracellular matrix and mitophagy-related genes. (3) The NPC’s group treated with the PPARδ agonist showed a significant increase of the Tie2+ NPCs yield from ~7% in passage 1 to ~50% in passage two, compared to the NPCs vehicle-treated group. Furthermore, no significant differences were found among treatment and control, using qPCR and mitotracker deep red. (4) Conclusion: PPARδ agonist could help to increase the Tie2+ NPCs yield during NPC expansion.

Graphical Abstract

1. Introduction

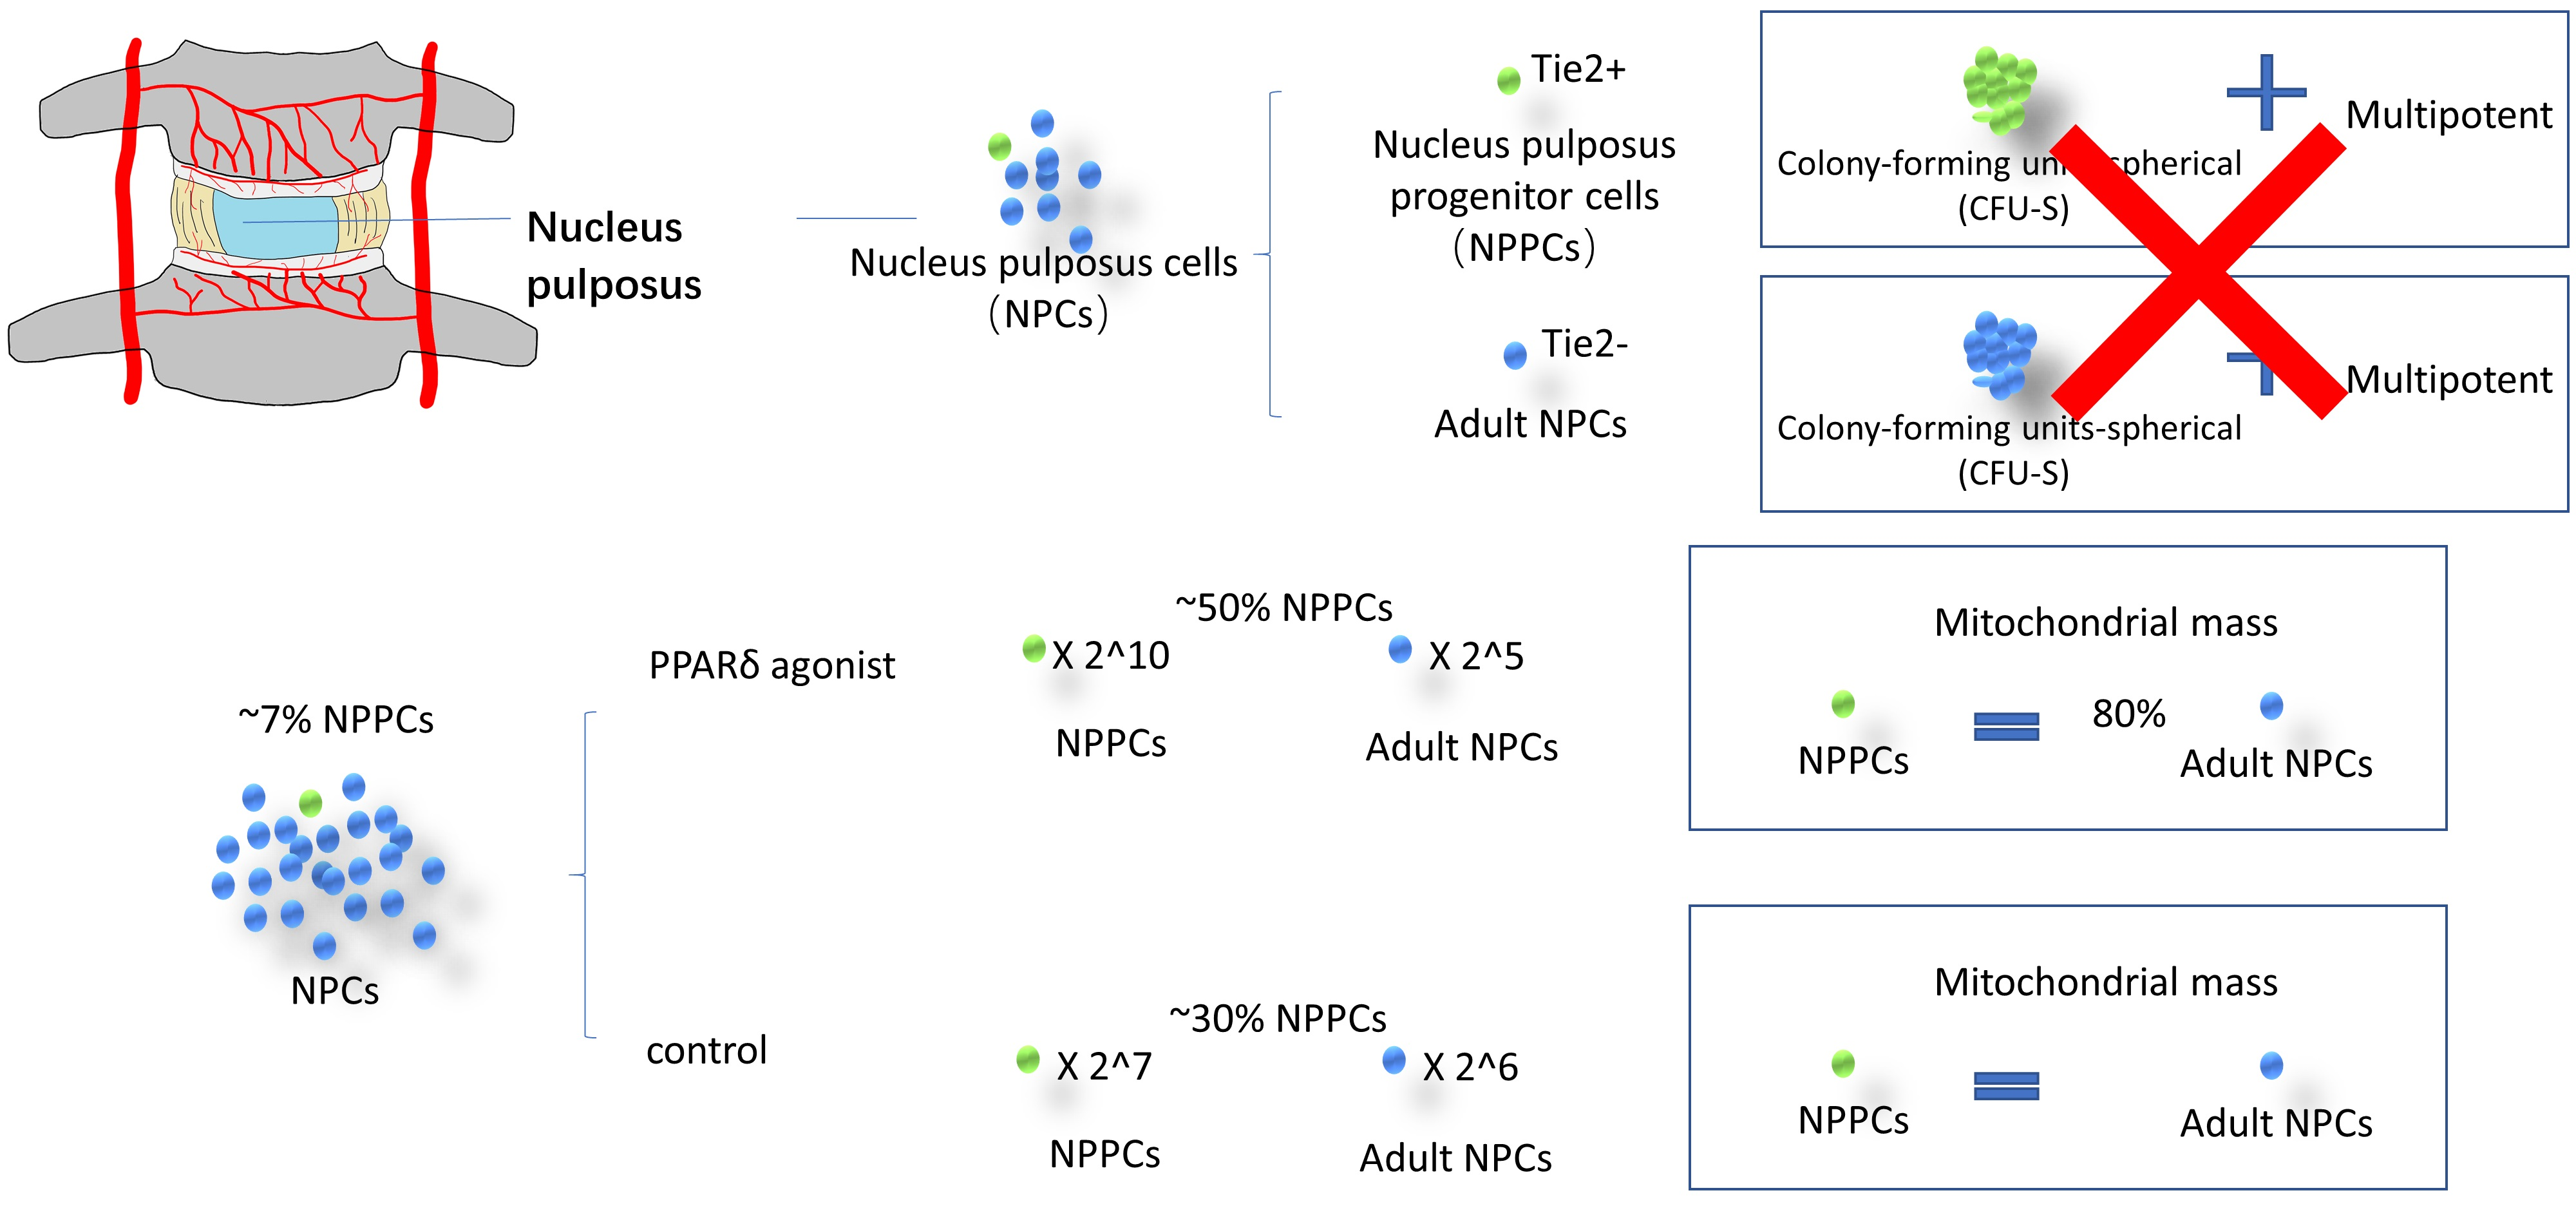
1.1. Nucleus Pulposus Cells and Their Progenitors

Nucleus pulposus (NP) tissue is located in the center of the intervertebral disc (IVD). NP tissue is in charge of the distribution of the loading compression forces in collaboration with the annulus fibrosus (AF) tissue [1]. It has been demonstrated that NP is derived from the notochord [2,3,4]. The notochordal cells are presented with chondrocyte-like “nucleopulpocytes” (nucleus pulposus cells (NPCs)) in early life and are progressively lost in adults [5,6]. The notochordal cells maintain homeostasis by stimulating the synthesis of extracellular matrix (ECM) [7]. The disappearance of notochordal cells with aging was often speculated to reflect a possible reason for intervertebral disc degeneration (IVDD) [7].
The NP progenitor cell (NPPC) from NP tissue might be the successor of notochordal cells to maintain homeostasis in NP tissue [8,9,10]. The main characteristics of these NPPCs are their self-renewal ability, their capability to form Colony-Forming Unit-spheroids (CFU-s) in semi-solid media, and their positivity for cell surface marker Angiopoietin receptor-1 (aka Tie2) [8,9,10]. The NPPCs (Tie2+ NPCs) are multipotential, but not the fully differentiated NPCs (Tie2-NPCs) [8,9,10]. Besides the absence of Tie2, differentiated NPCs can be distinguished from multipotent NPPCs by their lower clonogenic ability [8,9,10].
The adult multipotent stem cells play an important role in degenerative diseases. It could be a possibility that the shortage of these tissue-specific stem cells, especially in elderly people, is a main reason for tissue degeneration and malfunction [11]. The nervous system degeneration was considered irreversible. However, adult progenitor cells proved this paradigm wrong [12]. In the IVD, although NPPCs are indeed present in adults, this cell population decreases drastically with increasing age (>40 years) [13,14,15]. The recovery of NPPCs’ yield of the whole NPC population might be a possible way to reverse or at least slow down the process of IVDD. Therefore, new protocols for (i) how to maintain the number of initially cell-sorted NPPCs in cell culture and (ii) the protection of their stemness are urgently warranted. Recent work could clearly demonstrate that changing the expansion protocol from 2D to 3D can indeed increase the Tie2+ cell’s yield [16,17]. Moreover, NPPC protection through molecular injection could rebuild the cell’s homeostasis in IVDD; it could evolve as a new approach for IVDD therapy. A similar example is that, after spinal cord injury, the endogenous neural stem cells could help rebuild the spinal cord function [18]. A recent study by Wangler et al. (2019) could demonstrate that there is even a link between increased homing of mesenchymal stromal cells (MSCs) and an increase of the Tie2+ cell’s fraction inside the native cell population of the IVD; this has been shown in both bovine and human organ culture models, respectively. This connection unveals a possible additional value of MSCs cell therapy and seems to be a way to indirectly stimulate the proliferation of the Tie2+ fraction [19]. This observation certainly needs a closer investigation in the future.
Since the NPPCs are rare in the NP tissues, and as these cells do not seem to proliferate well, in vitro experiments are quite limited. The purified NPPCs are losing their phenotype on a monolayer culture only after 10 days [9]. However, the NPPC percentage in the whole NPC population expansion is relatively stable for 28 days [8]. To get enough NPPC for further research, it is important to increase the NPPC (Tie2+ NPCs) yield during NPC expansion. Another approach for IVDD therapy would be to increase the endogenous NPPC yield in vivo.

1.2. Tie2 and Self-Renewal

Hematopoietic stem cells (i.e., CD34+) are positive for the Tie2 marker and share many features with NPPCs, such as a fondness for a hypoxic environment and their origin from the mesoderm [20]. Recent evidence suggests that the PPARδ agonist could induce mitophagy and increase the self-renewal of Tie2+ hematopoietic stem cells but not Tie2- cells [20]. Mitophagy is the selective degradation of mitochondria by autophagy, and it often occurs in defective mitochondria, after damage or stress [21]. Recently, Ito et al. investigated the mitophagy pathway by treating the Tie2+ hematopoietic stem cells with the PPARδ agonist GW501516 and L-165041 [20]. The PPARδ is one of the main classes of peroxisome proliferator-activated receptor (PPAR); the activity of PPARδ can change the body’s fuel preference from glucose to lipids [13] and was formerly used in athletes as a doping substance, to increase their performance. Furthermore, the PPARδ agonist induces mitochondrial clearance and hence mediates the self-renewal capacity of hematopoietic cells [20]. This process could be inhibited by knockdown proteins of PARKIN (which is the product of the PARK2 gene) or PTEN-induced putative kinase 1 (which is the product of the PINK1 gene). The proteins PARKIN and PINK1 are two key players in the progress of mitophagy [20]. Moreover, with Tie2+ hematopoietic stem cells, PPARδ agonist can up-regulate the gene expression of PINK1 and PARK2. The upregulation of the PINK1 gene was through the upregulation of FOXO3 gene. Upregulation of these genes lead to an increase mitophagy. This mechanism enables self-renewal in Tie2 + hematopoietic stem cells to be increased by PPARδ agonists. Additionally, hematopoietic Tie2 + stem cells lose their ability to renew themselves when they prevent the mitophagy through the inhibition of the PINK1 and PARK2 proteins. On the contrary, this “self-renewal path of PPARδ agonist mitophagy” could not be demonstrated for hematopoietic Tie2- stem cells [20]. Furthermore, mitophagy induces stem cell behavior by a complex regulation of metabolism, calcium, and reactive oxygen species (ROS) [22].

1.3. Mitophagy in NPC

In this context, mitophagy-related gene and protein expression of PARKIN and PINK1 [23] showed a difference between healthy and disordered NPCs [24,25,26]. Accordingly, the lower gene expression level of PARK2 has been associated with disc-related disorders, and methylation of the PARK2 promoter may influence the degeneration of the IVD [14,15]. In line with this, an increase of mitophagy has recently been associated with aging in rats [24]. Some studies showed that cyclosporine A (CSA) and a knockdown of PARKIN eliminated the apoptosis protection by salidroside and melatonin, and increased the senescence of NPCs [25,26].

1.4. Hypothesis and Aims

We hypothesized that the PPARδ agonist GW501516 will increase the self-renewal ability of Tie2+ NPCs by the stimulation of the mitophagy pathway. In this study, the major aim was to investigate whether the addition of GW501516 to the basal culture medium would increase the Tie2+ NPPC’ yield of NPC (i.e., defined as the percentage of Tie2 + cells). The second major aim was to investigate whether this process was regulated by mitophagy, analyzed by relative expression of mitophagy-related genes and mitochondrial mass.

2. Materials and Methods

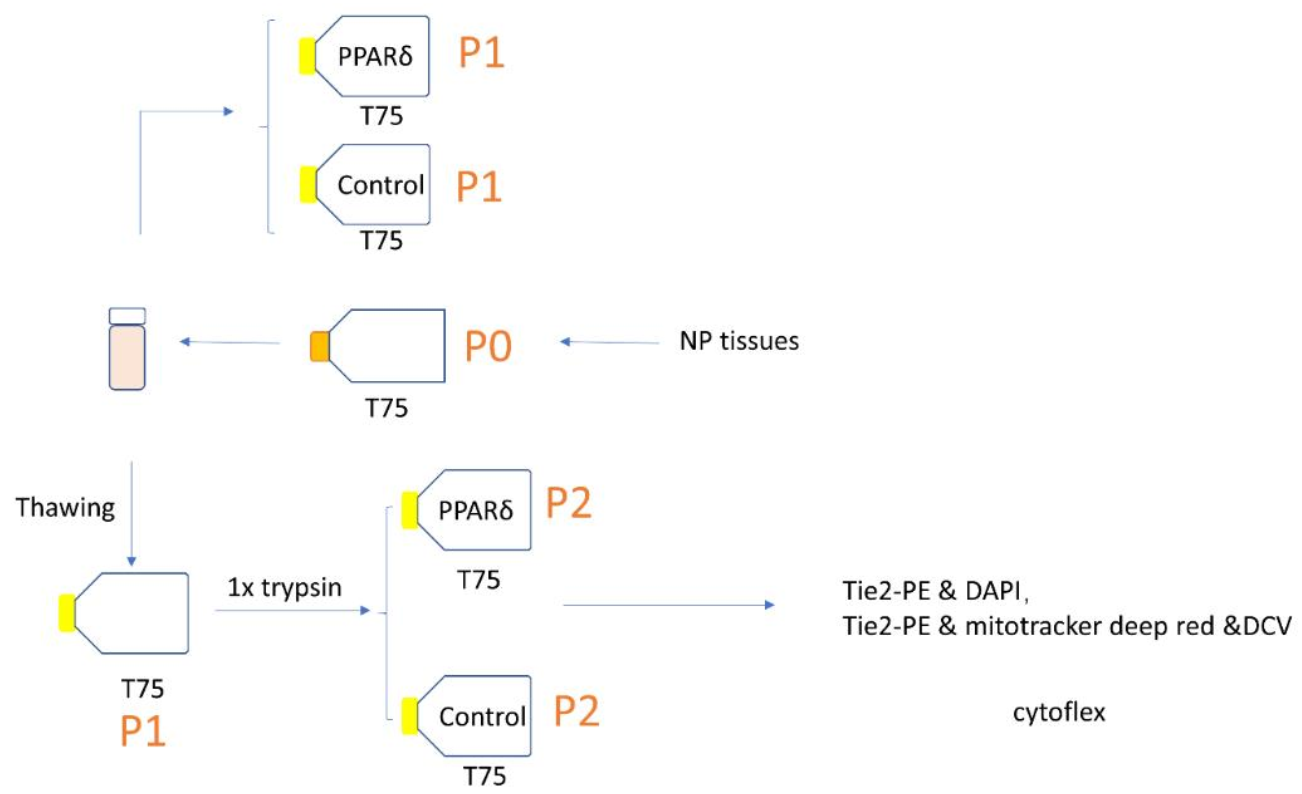
2.1. NPC Isolation and Culture

In this study, human NP tissues were obtained from eight patients with traumatic spine injuries (Pfirrmann gradings 1 and 2) who provided written consent and ethical approval from the local ethical committee (Reference # 2019-00097) (Table 1). After dissection of the NP tissue, it was washed twice with phosphate-buffered saline (PBS), to remove any kind of contamination from non-NP tissue cells that can occur during injury and surgery. NP cells were isolated as follows. A two-step digestion protocol was performed with 1.9 mg/mL pronase (Roche, Basel, Switzerland), for one hour, and 65 U/mL collagenase type II (Worthington, London, UK), overnight. The debris was cleared by filtration through a 100 µm cell strainer (Falcon; Becton & Dickinson, Allschwil, Switzerland). Cell numbers and viability were then assessed by using a Neubauer-improved chamber with trypan blue to stain dead cells. The primary NPCs at Passage zero (P0) were seeded on T150 or T300 flasks from TPP™ (cat# 90151 T150, cat# 90301 T300 Trasadingen, Switzerland) at a density of ~700–10,000 cells/cm2 (based on the number of cells harvested) within a basal culture media. The basal media consisted of low glucose Dulbecco’s Modified Eagle Medium (LG-DMEM) media (cat# 11885084 Gibco, Life Technologies, Zug, Switzerland) supplemented with 10% FCS (cat# F7524, Sigma-Aldrich, Buchs, Switzerland) and 1% Penicillin/Streptomycin/Glutamine (P/S/G) (cat# 10378016 Gibco). These P0 NPCs were then cultured until they reached 90% confluency in normoxia. Then, NPCs were detached with Trypsin-EDTA (1X) for 5 min. The cells were then resuspended in basal culture media medium supplemented with 10% dimethyl sulfoxide (DMSO). The NPCs were then frozen at −80 °C, using a freezing container (“Mr. Frosty freezing container” cat# 51000001; Thermo Fisher Scientific), and left for two days. Finally, the cells were transferred to −150 °C, for a long time storage.

2.2. PPARδ Agonist Treatment

At P3, PPARδ agonist treatment media included the basal culture media with 0.1 µM of GW501516 (cat# SML1491, Sigma, Buchs, Switzerland dissolved in Dimethyl sulfoxide (DMSO)) and supplemented with 2.5 ng/mL fibroblast growth factor-2 (FGF-2) (Peprotech, London, UK), to better maintain the progenitor phenotype [9,27]. The concentration of GW501516 used in our study refers to the research published by Ito et al. [20]. In the control medium, the GW501516 was replaced by DMSO vehicle (0.01% in volume). For our experiments, 100,000 cells were seeded in T75 flasks (Figure 1). All cells were cultured until 80% confluency (which corresponded to ~eight days of culture).

2.3. Visualisation of Cell’s Morphology

Cells’ morphology was quantified by using ImageJ v1.53c software on the microscopic pictures, using “cell body circularity” functionality [28,29]. An example of how the cells’ outlines were defined by manual segmentation can be found in a previous study [17].

2.4. Flow Cytometry

The cells were cultured for about eight days, based on the confluence. Then, the cells were trypsinized, using 0.25% Trypsin-EDTA solution, for 5 min, as recommended by the manufacturers. To assess the Tie2+ NPPC yield, the NPCs were stained with the Tie2-PE antibody (1:20) (cat# FAB3131P, R&D Systems, Muttenz, Switzerland), for 20 min, at 4 °C, and dead cells were stained with 4′,6-diamidino-2-phenylindole (DAPI) (0.1 µg/mL).
To assess the mitophagy mass of Tie2+ NPCs and Tie2- NPCs, the cells were stained with 0.5 µM of MitoTracker™ Deep Red FM (cat# M22426, Thermo Fisher Scientific Inc., Basel, Switzerland), for 30 min, at 37 °C. The cell cycle was assessed by Vybrant™ DyeCycle™ Violet Stain (10 μM) (cat#V35003, Thermo Fisher Scientific, Basel, Switzerland), which was incubated for 30 min, at 37 °C. Before the Tie2 stain, MitoTracker™ Deep Red FM and Vybrant™ DyeCycle™ Violet were applied as a single mix. Then, Tie2+ NPCs were stained with the Tie2-PE antibody (1:20) (cat# FAB3131P R&D Systems, Muttenz, Switzerland), for 20 min, at 4 °C. This staining protocol was strictly followed according to the manufacturer’s instructions. The flow cytometer (CytoFLEX S 5350, Indiana, United States) was used to analyze and quantify the Tie2+ NPC yield and mitochondria mass. The flow cytometric data were analyzed with FlowJo software, version 10.4.2, for Mac OS X (Treestar, Ashland, OR, USA).

2.5. qPCR

The expression of the mitophagy-related genes Parkin RBR E3 Ubiquitin Protein Ligase (PARK2), phosphatase and tensin homolog deleted on chromosome ten (PTEN)-induced putative kinase 1 (PINK1), Forkhead Box O3 (FOXO3), silent mating type information regulation 2 homolog 1 (SIRT1), silent mating type information regulation 2 homolog 1 (SIRT3), and peroxisome proliferator-activated receptor delta (PPARD) were analyzed. Likewise, the expression of the “nucleopulpocytic”-phenotype-related genes Aggrecan (ACAN), Collagen type I (COL1), Collagen type II (COL2), and Keratin 19 (KRT19), as well as angiopoietin-1 receptor (Tie2) (TEK), were assessed [8,30].
Total RNA was extracted with the GenElute™ Mammalian total RNA purification kit, including DNA digestion (cat# RNB100 Sigma-Aldrich, Buchs, Switzerland). The RNA was reverse-transcribed into cDNA, using the high-capacity cDNA Kit (cat# 4368814, Thermo Fisher). The primer sequences used are listed in Table 2. The qPCR was performed in duplicates (CFX96 Touch, Bio-Rad) with mixed cDNA and (250 nM) forward and reverse primers (Microsynth, Switzerland) in iTaq™ universal SYBR® Green Supermix (Bio-Rad). Relative expression was computed, using the 2−ΔΔCq method, with two reference genes, i.e., 18S ribosomal RNA gene (18S) and Glyceraldehyde 3-phosphate dehydrogenase (GAPDH), respectively. The 2−ΔΔCq method was calculated with Microsoft Excel (Microsoft 356 MSO, Microsoft, Redmond, USA). The data were normalized to the control group.

2.6. Population Doubling Level (PDL)

The population growth was estimated by the cumulative population doubling level (PDL), according to the following formula [1]:
  P D L   =   log N t N 0 / l o g 2
where N0 = initially seeded cell number and Nt = cell number at time point, t.

2.7. Statistics

Statistical analysis was performed, using Prism 7.0d for Mac OS X (GraphPad, La Jolla, California, US). A Shapiro–Wilk test was performed on all data prior to analysis, to check for normal distribution. Nonparametric distribution was assumed. As a consequence, statistical significance was determined, using the Mann–Whitney U test and Kruskal–Wallis (K–W) signed-rank test, followed by a Dunn’s multiple comparison test (for three or four groups). Values are given as means ± SD. A p-value <0.05 was considered to be significant.

3. Results

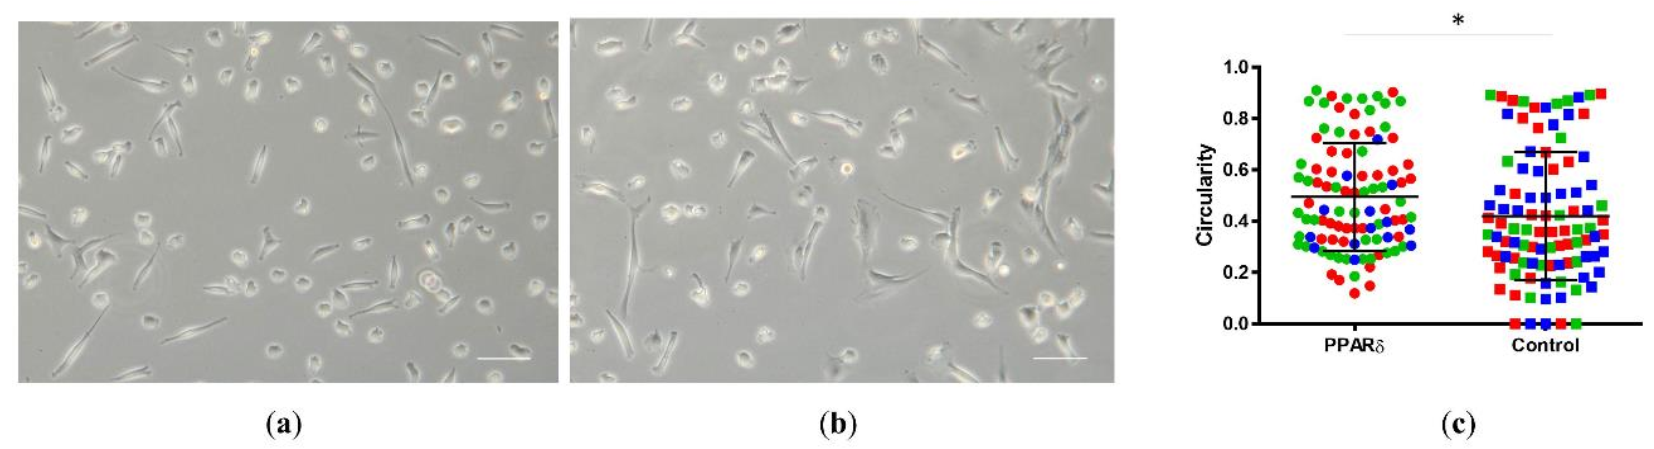
3.1. PPARδ Agonist Treatment Changed the Morphology of NPCs

We thawed the NPCs and seeded the cells with and without PPARδ agonist treatment (Figure 2). After seven days, we compared the morphology of NPCs from the PPARδ agonist treatment group (Figure 2a) and the control group (Figure 2b). Under the light microscope (10x), there were, at first, no obvious differences in morphology. However, quantification of cell circularity (Figure 2c) revealed that PPARδ agonist treatment resulted in overall more rounded cell shapes, as compared to cells cultured within the control group.

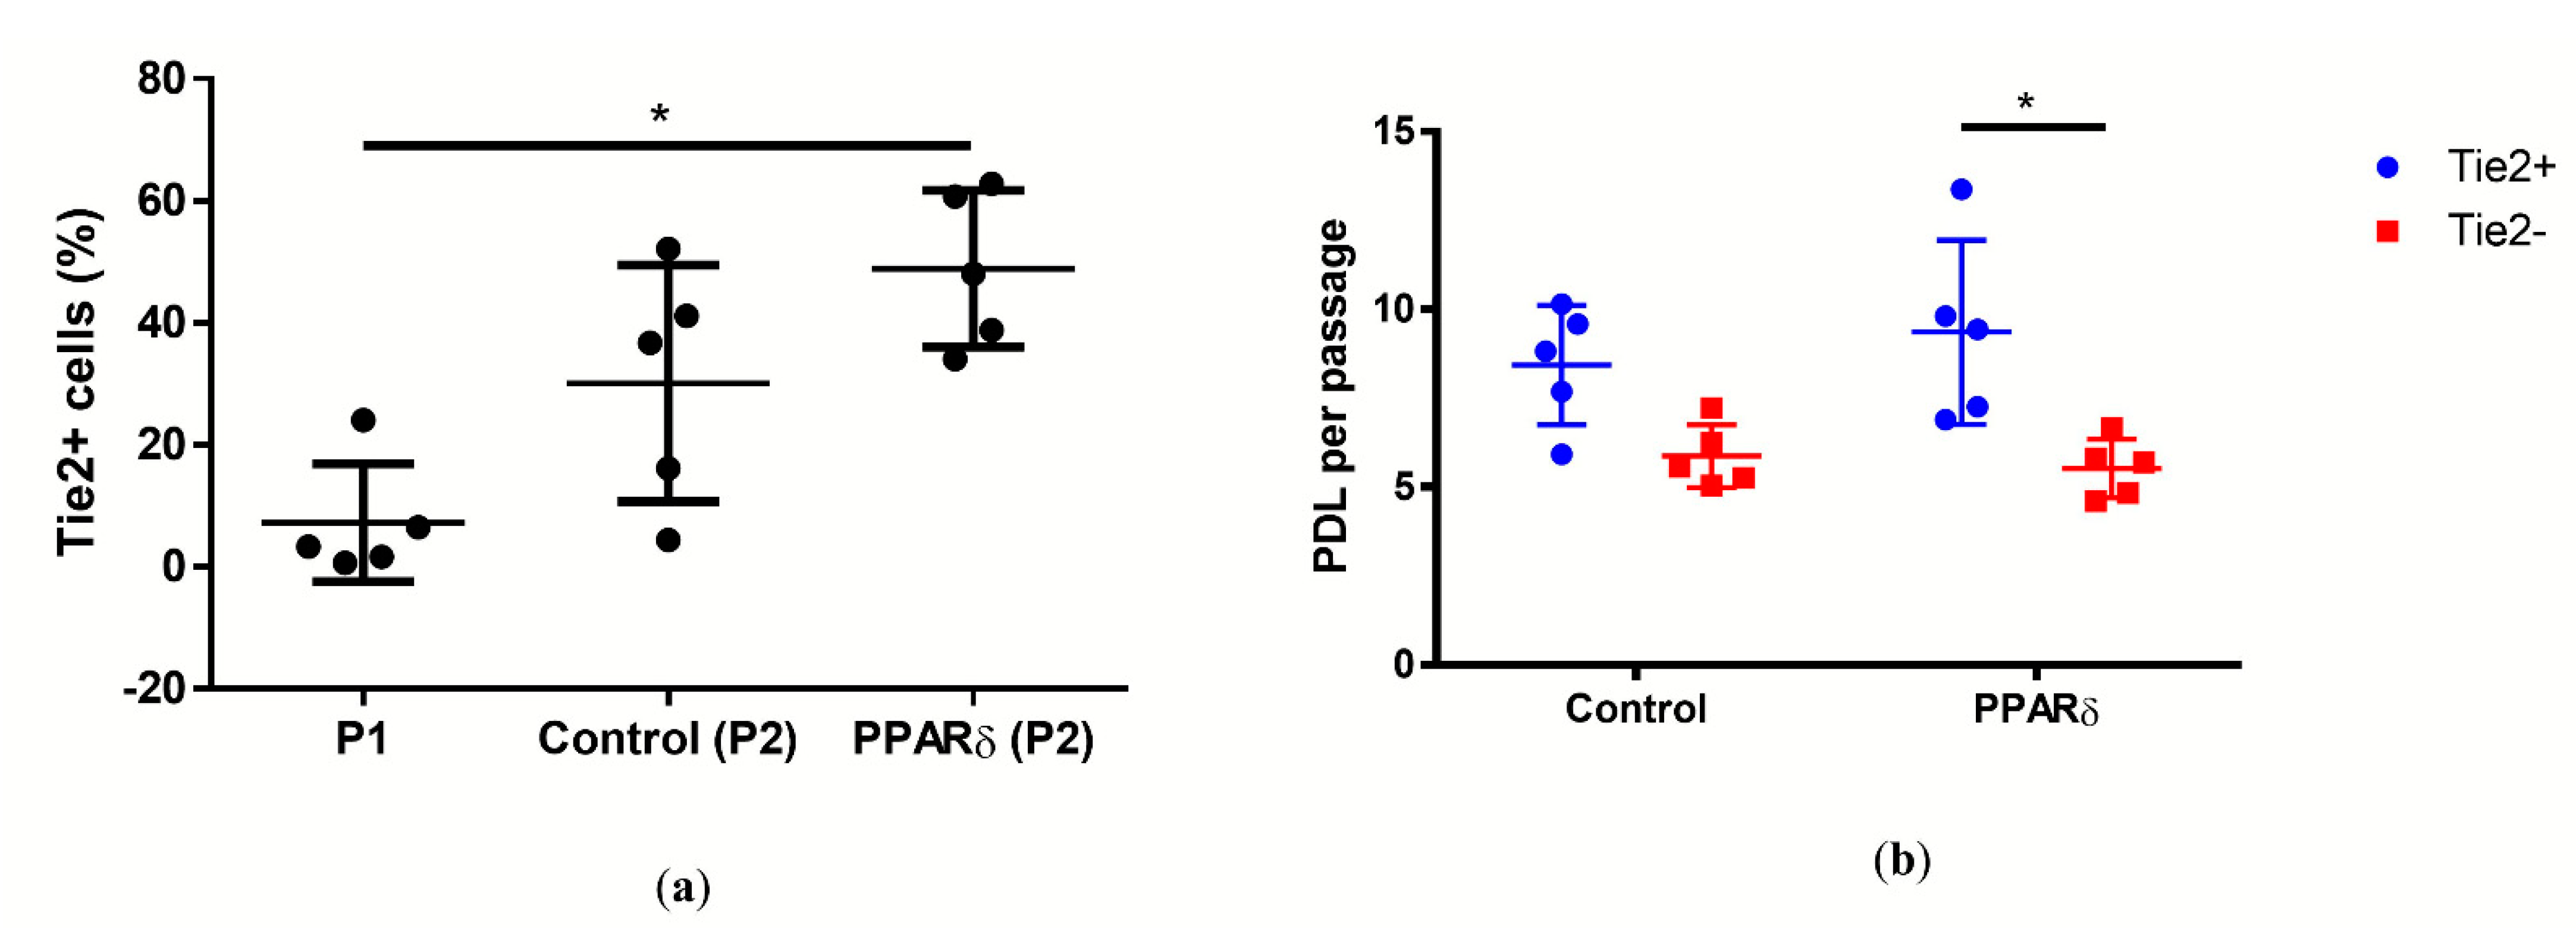
3.2. PPARδ Agonist Treatment Increased the Tie2+ NPC Yield of NPCs

The Tie2+ yield of the NPCs population at day 0 was 7.1 ± 9.6% (mean ± SD). The Tie2+ yield of PPARδ agonist treated and vehicle control group was 48.9 ± 12.8% (mean ± SD) and 30 ± 19.4% (mean ± SD), respectively (Figure 3a). After about eight days of culture, both passage two NPCs from the PPARδ-agonist-treated group (significantly, p = 0.01) and vehicle control group (p = 0.231) increased the Tie2+ NPC yield, compared with day 0. The Tie2+ yield between the PPARδ-agonist-treated group, and the vehicle group was not statistically different (p = 0.773).
The population doubling level (PDL) was assessed as an indicator for proliferation (Figure 3b). We compared the PDL of Tie2+ NPCs and the Tie2- NPCs of PPARδ-agonist-treated group and vehicle group. Only the PPARδ-agonist-treated group between Tie2+ and Tie2- presented a significant difference (p = 0.033). With PPARδ-agonist treatment, the Tie2+ NPCs had a significant higher PDL of 9.3 ± 2.5 (mean ± SD), compared with Tie2- NPCs with 5.5 ± 0.8 (mean ± SD).

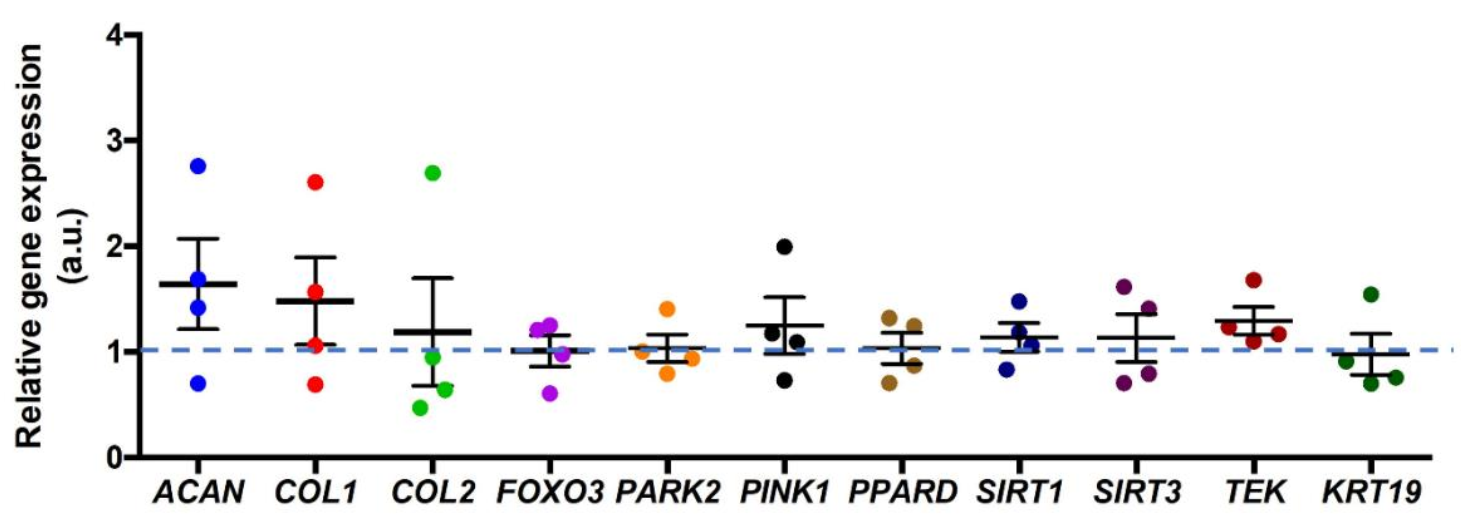
3.3. Correlation between mRNA Expression and PPARδ Agonist Treatment

We compared the relative gene expression between NPCs with PPARδ-agonist treatment and vehicle control (assigned to 1.0) (Figure 4). Overall, there were no significant differences in relative gene expression between these two groups. The PPARδ-agonist treatment did not change significantly the ECM-relevant, mitophagy-relevant, and “nucleopulpocytic”–relevant relative gene expression.

3.4. Correlation between Mitochondrial Mass and PPARδ Agonist Treatment

To assess if the PPARδ agonist treatment will influence the mitochondria mass which usually decreases when mitophagy is stimulated, we quantified the mitochondria mass with mitotracker deep red (Figure 5). The mitochondria mass of Tie2+ NPCs was expressed relative to the Tie2- NPCs. In more detail, the Tie2+ NPCs with PPARδ agonist treatment showed a significant decrease in relative mitochondria mass, compared to the control group.

4. Discussion

In this study, we compared the Tie2+ fraction among three groups; i.e., in thawed primary NPCs in P1, in control in P2, and in PPARδ-treated cells in P2. The PPARδ agonist treatment significantly increased the Tie2+ NPCs’ yield largely in PPARδ (P2) cells, compared with the P1 cells, whereas this was not the case in the control group (Figure 3). Unfortunately, the comparison of PPARδ (P2) and vehicle control (P2) did not show any significant difference after eight days of monolayer culture. We also tested the PPARδ (P1) versus vehicle control (P1) at day 13 and PPARδ (P1) versus untreated control (P1) at day 15. Overall, the PPARδ-agonist-treated NPCs had a significantly higher Tie2 percentage, compared to the control (Supplementary Figure S1 and Table S1). Future research should focus whether prolongued passaging would even reveal a more pronounced effect of PPARδ agonist treatment. However, over confluence of cells also may decrease cell viability. Additionally, the circularity of NPCs with PPARδ agonist treatment showed a more “naïve” morphology, as compared to the control [29].
The increase of Tie2 yield could be due to two reasons. The first one is the proliferation of Tie2+ NPCs; the other one is the loss of Tie2- NPCs cells. The PPARδ agonist treatment induced significantly higher proliferation in the Tie2+ NPCs, compared with the Tie2- NPCs. With the PPARδ agonist treatment, we revealed an increase from ~7% to ~50% (which translates to ~7 times boost) of Tie2+ NPCs after ~8 days of monolayer culture.
In contradiction to the PDL measurements, the PPARδ agonist treatment induced significantly lower mitochondrial mass in the Tie2+ NPCs, compared with the Tie2- NPCs. This mitochondrial mass was most likely regulated by mitochondrial biogenesis and mitophagy. However, the result of this study could not exclude biogenesis. In the future, the biogenesis of mitochondria should be further assessed by the inhibition of mitophagy, using cyclosporine A (CSA) or hydroxychloroquine (HCQ), both inhibitors of mitophagy [31].
The ECM-, mitophagy-, NPPC-phenotype-, and IVD-phenotype-related relative gene expressions between the PPARδ agonist treatment and the control group did not show any significant differences. However, there was a slight trend of increased ACAN, COL1, COL2, PINK1, and TEK gene expressions, respectively.
Many researchers believe that the mitochondrial mass correlates to the stemness of cells [32]. In the hematopoietic stem cells, the relative low mitochondria mass related to high self-renewal ability [33,34]. Our data revealed that, after PPARδ agonist treatment, the Tie2+ NPCs population showed a decrease of mitochondria mass and an increase of proliferation, compared with the Tie2- NPCs population. We assumed that, in NPCs, the low mitochondrial mass also reflects proliferation, as it is the case in hematopoietic stem cells. However, one detail still needs to be elucidated, whether the low mitotracker deep red medians of fluorescence intensity (MFI) were due to the ATP-binding cassette (ABC) transporters. Many kinds of stem cells have nucleus ABC transporters across cellular membranes, to efflux molecules.
The protective role of mitophagy in NPCs has been demonstrated in several studies [24,25,26]. In contrast to earlier findings, recent publications have contributed to a raising debate as to whether inhibition of mitophagy by cyclosporine A (CSA), a mitophagy inhibitor, and parkin-shRNA could prevent cell senescence in rats’ NPCs [35]. However, these studies did not consider the difference between NPPC, i.e., Tie2+ cells, and NPC, i.e., Tie2- cells. We suppose that mitophagic function is different in NPPC and Tie2- cells. The mitophagy might have a protective effect or even might decrease senescence, which might be again dependent on the proportion of NPPC (Tie2+ cells) and Tie2- NPC. Previous research showed contradictory results [24,25,26,35]. These differing results in the literature may potentially be explained by variation of different percentages of NPPCs in these expeirments.
The aim of our research was to increase the Tie2+ NPCs percentage of the whole NPC population during expansion. The classic and common culture conditions are based on 2D culture and normoxic environment [13,14,15]. In this research, we primarily wanted to compare the impact of chemical treatments on the Tie2+ NPPCs population [16,17]. For this reason, the cells were cultured within a normoxic environment. However, the comparison between hypoxia and normoxia could be taken into account for future analyses.

5. Conclusions

  • The PPARδ agonist treatment significantly changed the cell’s morphology towards more rounded cells in 2D culture.
  • The PPARδ agonist significantly accelerated cell proliferation in NPPCs, i.e., Tie2+ cells, compared to Tie2- cells, by a factor of ~7.
  • The PPARδ agonist increased the Tie2+ yield after ~day eight of monolayer culture.
  • The PPARδ agonist significantly decreased the mitochondria mass in NPPCs, i.e., Tie2+ cells, compared to Tie2- cells.
  • The PPARδ agonist did not cause any significant changes in mitophagy-related relative gene expression, such as PARKIN and PINK1, nor in other ECM-related genes.

Supplementary Materials

The following are available online, at https://0-www-mdpi-com.brum.beds.ac.uk/2673-4095/2/1/8/s1.

Author Contributions

X.Z. performed the data collection and data interpretation and wrote the main draft of the manuscript; J.G. assisted in the statistical analysis and edited and reviewed the manuscript; A.S.C. and K.A.C.O. edited the manuscript; S.H. provided clinical samples and edited the manuscript; C.E.A. provided surgical samples and edited the manuscript; B.G. provided the funding, was involved in the study design, and edited extensively and approved the final manuscript. All authors have read and agreed to the published version of the manuscript.

Funding

Financial support was received from the iPSpine H2020 project (https://ipspine.eu), under the grant agreement #82592 (https://cordis.europa.eu/project/id/825925), and from a fellowship by the China Scholarship Council to X.Z. Further funds were received from the Swiss Society of Orthopaedics (SGOT), the Clinical Trials Unit (CTU) of Bern University Hospital, and by a Eurospine Task Force Research grant #2019_22, all to C.E.A.

Institutional Review Board Statement

Not applicable.

Informed Consent Statement

All human primary cells presented in this article, where obtained with written consent from the donors. The study was conducted in accordance with the Declaration of Helsinki, and the protocol was approved by the Ethics Committee of the Canton of Bern (Ref. 2019-00097) for the project iPSpine.

Data Availability Statement

All data presented in this manuscript can be obtained upon request from the corresponding author.

Acknowledgments

X.Z. was supported by a fellowship from the China Scholarship Council. The cytometer equipment was from Flow Cytometry Laboratory (FACS Lab) ore facility of University of Bern (www.facslab.unibe.ch). The microscopes were provided by the microscope core facility of the University of Bern (www.mic.unibe.ch). Andrea Oberli assisted in molecular assays.

Conflicts of Interest

The authors declare no conflict of interest.

Abbreviations

AFAnnulus fibrosus
bFGFFibroblast growth factor-basic
CEPCartilage endplates
CFUColony-forming unit
CFU-sSpheroid colony-forming unit
CSACyclosporine A
DAPI4′,6-diamidino-2-phenylindole
DCVVybrant™ DyeCycle™ Violet
DMSODimethyl sulfoxide
ECMExtracellular matrix
EGFEpidermal growth factor
EDTAEthylenediaminetetraacetic acid
K-WKruskal–Wallis signed-rank
LG-DMEMLow-glucose Dulbecco’s Modified Eagle Medium
IVDIntervertebral disc
IVDDIntervertebral disc degeneration
MFIMedians of fluorescence intensity
MSCMesenchymal stromal cell
NPNucleus pulposus
NPCNucleus pulposus cell
NPPCNucleus pulposus progenitor cell
PPassage
PBSPhosphate-buffered saline
P/S/GPenicillin/Streptomycin/Glutamine
SDStandard deviation

References

  1. Frost, B.A.; Camarero-Espinosa, S.; Foster, E.J. Materials for the spine: Anatomy, problems, and solutions. Materials 2019, 12, 253. [Google Scholar] [CrossRef] [PubMed] [Green Version]
  2. Roberts, S.; Evans, H.; Trivedi, J.; Menage, J. Histology and pathology of the human intervertebral disc. J. Bone Joint Surg. 2006, 88, 10–14. [Google Scholar] [CrossRef] [PubMed] [Green Version]
  3. Mohanty, S.; Dahia, C.L. Defects in intervertebral disc and spine during development, degeneration, and pain: New research directions for disc regeneration and therapy. Dev. Biol. 2019, 8. [Google Scholar] [CrossRef]
  4. Williams, S.; Alkhatib, B.; Serra, R. Development of the axial skeleton and intervertebral disc. Curr. Top. Dev. Biol. 2019, 133, 49–90. [Google Scholar]
  5. Risbud, M.V.; Shapiro, I.M. Notochordal cells in the adult intervertebral disc: New perspective on an old question. Crit. Rev. Eukaryot. Gene Express. 2011, 21, 29–41. [Google Scholar] [CrossRef] [Green Version]
  6. Colombier, P.; Clouet, J.; Boyer, C.; Ruel, M.; Bonin, G.; Lesoeur, J.; Moreau, A.; Fellah, B.-H.; Weiss, P.; Lescaudron, L.; et al. TGF-beta 1 and GDF5 act synergistically to drive the differentiation of human adipose stromal cells toward nucleus pulposus-like cells. Stem Cells 2016, 34, 653–667. [Google Scholar] [CrossRef] [PubMed] [Green Version]
  7. McCann, M.R.; Seguin, C.A. Notochord cells in intervertebral disc development and degeneration. J. Dev. Biol. 2016, 4, 3. [Google Scholar] [CrossRef]
  8. Sakai, D.; Nakamura, Y.; Nakai, T.; Mishima, T.; Kato, S.; Grad, S.; Alini, M.; Risbud, M.V.; Chan, D.; Cheah, K.S. Exhaustion of nucleus pulposus progenitor cells with ageing and degeneration of the intervertebral disc. Nat. Commun. 2012, 3, 1264. [Google Scholar] [CrossRef] [PubMed] [Green Version]
  9. Tekari, A.; Chan, S.C.W.; Sakai, D.; Grad, S.; Gantenbein, B. Angiopoietin-1 receptor Tie2 distinguishes multipotent differentiation capability in bovine coccygeal nucleus pulposus cells. Stem Cell Res. Ther. 2016, 7. [Google Scholar] [CrossRef] [Green Version]
  10. Frauchiger, D.A.; Tekari, A.; May, R.D.; Dzafo, E.; Chan, S.C.W.; Stoyanov, J.; Bertolo, A.; Zhang, X.; Guerrero, J.; Sakai, D.; et al. Fluorescence-activated cell sorting is more potent to fish intervertebral disk progenitor cells than magnetic and beads-based methods. Tissue Eng. Part C Methods 2019, 25, 571–580. [Google Scholar] [CrossRef] [Green Version]
  11. Boyette, L.B.; Tuan, R.S.J.J. Adult stem cells and diseases of aging. J. Clin. Med. 2014, 3, 88–134. [Google Scholar] [CrossRef] [Green Version]
  12. Zhao, X.Y.; Moore, D.L. Neural stem cells: Developmental mechanisms and disease modeling. Cell Tissue Res. 2018, 371, 1–6. [Google Scholar] [CrossRef] [Green Version]
  13. Williams, F.M.; Bansal, A.T.; Van Meurs, J.B.; Bell, J.T.; Meulenbelt, I.; Suri, P.; Rivadeneira, F.; Sambrook, P.N.; Hofman, A.; Bierma-Zeinstra, S. Novel genetic variants associated with lumbar disc degeneration in northern Europeans: A meta-analysis of 4600 subjects. Ann. Rheumat. Dis. 2013, 72, 1141–1148. [Google Scholar] [CrossRef] [PubMed] [Green Version]
  14. Näkki, A.; Battié, M.C.; Kaprio, J. Genetics of disc-related disorders: Current findings and lessons from other complex diseases. Eur. Spine J. 2014, 23, 354–363. [Google Scholar] [CrossRef]
  15. Madhu, V.; Boneski, P.K.; Silagi, E.; Qiu, Y.; Kurland, I.; Guntur, A.R.; Shapiro, I.M.; Risbud, M.V. Hypoxic regulation of mitochondrial metabolism and mitophagy in nucleus pulposus cells is dependent on HIF-1alpha-BNIP3 axis. J. Bone Min. Res. 2020. [Google Scholar] [CrossRef] [PubMed]
  16. Guerrero, J.; Häckel, S.; Croft, A.S.; Albers, C.E.; Gantenbein, B.J.J.S. The effects of 3D culture on the expansion and maintenance of nucleus pulposus progenitor cell multipotency. JOR Spine 2020, 1131. [Google Scholar] [CrossRef]
  17. Zhang, X.; Guerrero, J.; Croft, A.S.; Albers, C.E.; Häckel, S.; Gantenbein, B. Spheroid-like cultures for expanding angiopoietin receptor-1 (aka. Tie2) positive cells from the human intervertebral disc. Int. J. Mol. Sci. 2020, 21, 9423. [Google Scholar] [CrossRef]
  18. Teng, Y.D.; Liao, W.L.; Choi, H.; Konya, D.; Sabharwal, S.; Langer, R.; Sidman, R.L.; Snyder, E.Y.; Frontera, W.R. Physical activity-mediated functional recovery after spinal cord injury: Potential roles of neural stem cells. Regen Med. 2006, 1, 763–776. [Google Scholar] [CrossRef]
  19. Wangler, S.; Peroglio, M.; Menzel, U.; Benneker, L.M.; Haglund, L.; Sakai, D.; Alini, M.; Grad, S. Mesenchymal stem cell homing into intervertebral discs enhances the Tie2-positive progenitor cell population, prevents cell death, and induces a proliferative response. Spine 2019, 44, 1613–1622. [Google Scholar] [CrossRef]
  20. Ito, K.; Turcotte, R.; Cui, J.; Zimmerman, S.E.; Pinho, S.; Mizoguchi, T.; Arai, F.; Runnels, J.M.; Alt, C.; Teruya-Feldstein, J. Self-renewal of a purified Tie2+ hematopoietic stem cell population relies on mitochondrial clearance. Science 2016, 354, 1156–1160. [Google Scholar] [CrossRef] [PubMed] [Green Version]
  21. Brunmair, B.; Staniek, K.; Dörig, J.; Szöcs, Z.; Stadlbauer, K.; Marian, V.; Gras, F.; Anderwald, C.; Nohl, H.; Waldhäusl, W. Activation of PPAR-δ in isolated rat skeletal muscle switches fuel preference from glucose to fatty acids. Diabetologia 2006, 49, 2713–2722. [Google Scholar] [PubMed] [Green Version]
  22. Cairns, G.; Thumiah-Mootoo, M.; Burelle, Y.; Khacho, M. Mitophagy: A new player in stem cell biology. Biology 2020, 9, 481. [Google Scholar] [CrossRef]
  23. Ding, W.X.; Yin, X.M. Mitophagy: Mechanisms, pathophysiological roles, and analysis. Biol. Chem. 2012, 393, 547–564. [Google Scholar] [CrossRef] [PubMed] [Green Version]
  24. Chen, Y.; Wu, Y.; Shi, H.; Wang, J.; Zheng, Z.; Chen, J.; Chen, X.; Zhang, Z.; Xu, D.; Wang, X.; et al. Melatonin ameliorates intervertebral disc degeneration via the potential mechanisms of mitophagy induction and apoptosis inhibition. J. Cell. Mol. Med. 2019, 23, 2136–2148. [Google Scholar] [CrossRef] [PubMed] [Green Version]
  25. Wang, Y.; Shen, J.; Chen, Y.; Liu, H.; Zhou, H.; Bai, Z.; Hu, Z.; Guo, X. PINK1 protects against oxidative stress induced senescence of human nucleus pulposus cells via regulating mitophagy. Biochem. Biophys. Res. Commun. 2018, 504, 406–414. [Google Scholar] [CrossRef]
  26. Zhang, Z.; Xu, T.; Chen, J.; Shao, Z.; Wang, K.; Yan, Y.; Wu, C.; Lin, J.; Wan, H.; Gao, W.; et al. Parkin-mediated mitophagy as a potential therapeutic target for intervertebral disc degeneration. Cell Death Dis. 2018, 9. [Google Scholar] [CrossRef] [PubMed]
  27. Redondo-Castro, E.; Cunningham, C.J.; Miller, J.; Cain, S.A.; Allan, S.M.; Pinteaux, E. Generation of Human Mesenchymal Stem Cell 3D Spheroids Using Low-binding Plates. Bio Protoc. 2018, 8. [Google Scholar] [CrossRef] [PubMed] [Green Version]
  28. Rasband, W.S. ImageJ, U.S. National Institutes of Health, Bethesda, MD, USA. Available online: http://imagej.nih.gov/ij/ (accessed on 15 February 2021).
  29. Barcellona, M.N.; Speer, J.E.; Fearing, B.V.; Jing, L.; Pathak, A.; Gupta, M.C.; Buchowski, J.M.; Kelly, M.; Setton, L.A. Control of adhesive ligand density for modulation of nucleus pulposus cell phenotype. Biomaterials 2020, 250, 120057. [Google Scholar] [CrossRef] [PubMed]
  30. Gantenbein-Ritter, B.; Benneker, L.M.; Alini, M.; Grad, S. Differential response of human bone marrow stromal cells to either TGF-β(1) or rhGDF-5. Eur. Spine J. 2011, 20, 962–971. [Google Scholar] [CrossRef] [Green Version]
  31. Mauro-Lizcano, M.; Esteban-Martínez, L.; Seco, E.; Serrano-Puebla, A.; Garcia-Ledo, L.; Figueiredo-Pereira, C.; Vieira, H.L.; Boya, P. New method to assess mitophagy flux by flow cytometry. Autophagy 2015, 11, 833–843. [Google Scholar] [CrossRef]
  32. Farnie, G.; Sotgia, F.; Lisanti, M.P. High mitochondrial mass identifies a sub-population of stem-like cancer cells that are chemo-resistant. Oncotarget 2015, 6, 30472–30486. [Google Scholar] [CrossRef] [PubMed] [Green Version]
  33. Vannini, N.; Girotra, M.; Naveiras, O.; Nikitin, G.; Campos, V.; Giger, S.; Roch, A.; Auwerx, J.; Lutolf, M.P. Specification of haematopoietic stem cell fate via modulation of mitochondrial activity. Nat. Commun. 2016, 7, 13125. [Google Scholar] [CrossRef] [PubMed]
  34. Takihara, Y.; Nakamura-Ishizu, A.; Tan, D.Q.; Fukuda, M.; Matsumura, T.; Endoh, M.; Arima, Y.; Chin, D.W.L.; Umemoto, T.; Hashimoto, M.; et al. High mitochondrial mass is associated with reconstitution capacity and quiescence of hematopoietic stem cells. Blood Adv. 2019, 3, 2323–2327. [Google Scholar] [CrossRef] [PubMed]
  35. Huang, D.; Peng, Y.; Li, Z.; Chen, S.; Deng, X.; Shao, Z.; Ma, K. Compression-induced senescence of nucleus pulposus cells by promoting mitophagy activation via the PINK1/PARKIN pathway. J. Cell. Mol. Med. 2020, 24, 5850–5864. [Google Scholar] [CrossRef] [PubMed] [Green Version]
Figure 1. Schematic representation of the study experimental design; P = passage.
Surgeries 02 00008 g001
Figure 2. Light microscopy phase-contrast pictures of nucleus pulposus cells (NPCs) growth with PPARδ agonist treatment (a) and control (b). Here, “Control” represents cells cultured within control media without PPARδ agonist, “PPARδ” refers to cells cultured with PPARδ agonist treatment. Scale bar = 100 µm. The measure using ImageJ showed the cells’circularity (c). Each dot represents one cell (n = 100), taken from three donors marked in red, green, and blue for both groups, respectively. Mann–Whitney U test p = 0.01 * = p-value < 0.05. Lines in (c) represent means ± standard deviation (SD).
Surgeries 02 00008 g002
Figure 3. Plot of individual values of percentage of Tie2+ cells in the human NPC population (a), and population doubling level (PDL) of Tie2+ NPCs and Tie2- NPCs (b). Here, “P1” refers to the cells before seeding, “Control” represents cells cultured in control media without PPARδ agonist, “PPARδ” refers to cells cultured with PPARδ agonist treatment, “Tie2+” represents the NPCs that were stained positive to Tie2, and “Tie2+” represents the NPCs negative to Tie2; n = 5 (a,b), Kruskal–Wallis signed-rank (K–W) test with Dunn’s multiple comparison test; p = 0.0112 (a), 0.0327 (b); * = p-value < 0.05. Lines in (ad) represent means ± standard deviation (SD).
Surgeries 02 00008 g003
Figure 4. Relative gene expression of primary NPCs after PPARδ agonist exposure after eight days of culture normalized to vehicle (DMSO) control (assigned to 1.0). ACAN stands for aggrecan, COL1 represents collagen type I, COL2 stands for collagen type II, FOXO3 stands for Forkhead Box O3, PARK2 stands for Parkin RBR E3 Ubiquitin Protein Ligase, PINK1 stands for Phosphatase and tensin homolog deleted on chromosome ten (PTEN)-induced putative kinase 1, PPARD stands for peroxisome proliferator-activated receptor delta, SIRT1 stands for silent mating type information regulation 2 homolog 1, SIRT3 stands for silent mating type information regulation 2 homolog 3, TEK stands for TEK receptor tyrosine kinase (Tie2), and KRT19 stands for Keratin 19; “a.u.” refers to arbitrary units; n = 4 donors, Mann–Whitney U test. Lines represent means ± standard deviation (SD).
Surgeries 02 00008 g004
Figure 5. Plot of individual values and median of fluorescence intensities (MFIs) of mitochondria mass in Tie2+ NPCs relative to Tie2- NPCs measured, using mitotracker™ deep red and flow cytometry. “Control” represents cells cultured with control media without PPARδ agonist, “PPARδ” refers to cells cultured with PPARδ agonist treatment; “a.u.” refers to arbitrary units. Mann–Whitney U test, p = 0.0079; ** p-value < 0.01. Lines represent means ± SD; n = 5 donors.
Surgeries 02 00008 g005
Table 1. Donor list with gender, age, Pfirrmann grade, tissue weight, and the number of isolated cells.
No.GenderAgePfirrmann
Grade *
Location
1female371T12/L1
2female392L2/L3
3male402L2/L3
4male191T12/L1
5male281L4/L5
6male382L4/5
7male231-2T11/12
8male402T11/T1
* The grading was performed by two spine surgeons, i.e., Christoph E. Albers and Sonja Häckel. Figure 2 (donors 1, 2, and 6), Figure 3 and Figure 5 (donors 3, 4, 5, 6, and 8), and Figure 4 (donors 3, 4, 5, and 7).
Table 2. Primers list.
Name.DescriptionPrimer ForwardPrimer Reverse
18SRibosomal 18s RNA geneCGA TGC GGC GGC GTT ATT CTCT GTC AAT CCT GTC CGT GTC C
GAPDHGlyceraldehyde-3-phosphate dehydrogenaseATC TTC CAG GAG CGA GATGGA GGC ATT GCT GAT GAT
ACANAggrecan core proteinCAT CAC TGC AGC TGT CACAGC AGC ACT ACC TCC TTC
COL1Collagen type 1GTG GCA GTG ATG GAA GTGCAC CAG TAA GGC CGT TTG
COL2Collagen type 2AGC AGC AAG AGC AAG GAG AAGTA GGA AGG TCA TCT GGA
KRT19Keratin 19TGT GTC CTC GTC CTC CTCGCG GAT CTT CAC CTC TAG C
TEKTEK receptor tyrosine kinaseTTA GCC AGC TTA GTT CTC TGT GGAGC ATC AGA TAC AAG AGG TAG GG
PARK2Parkin RBR E3 Ubiquitin Protein LigaseGTC TTT GTC AGG TTC AAC TCC AGAA AAT CAC ACG CAA CTG GTC
PINK1Phosphatase and tensin homolog deleted on chromosome ten (PTEN)-induced putative kinase 1CTCCAGCGAAGCCATCTTTCTGTAAGTGACTGCTCCATAC
PPARDPeroxisome proliferator-activated receptor deltaCAG GGC TGA CTG CAA ACG ACTG CCA CAA TGT CTC GAT GTC
SIRT1Silent mating type information regulation 2 homolog 1TAGCCTTGTCAGATAAGGAAGGAACAGCTTCACAGTCAACTTTGT
SIRT3Silent mating type information regulation 2 homolog 3CAG CAA CCT CCA GCA GTACGT GTA GAG CCG CAG AAG
FOXO3Forkhead Box O3CGG ACA AAC GGC TCA CTC TGGA CCC GCA TGA ATC GAC TAT
Publisher’s Note: MDPI stays neutral with regard to jurisdictional claims in published maps and institutional affiliations.

