
Monitoring of Cardiac Output Using a New Smartphone Application (Capstesia) vs. Vigileo FloTrac System

 ,
,  ,
,
Abstract
:1. Introduction
2. Materials and Methods
2.1. Patients
2.2. Perioperative Management and Monitoring
2.3. Capstesia and Vigileo Recording
2.4. Statistical Analysis
2.4.1. Sample Size Calculation
2.4.2. Agreement between the Two Devices
3. Results
4. Discussion
4.1. Limitations
4.2. Caveats
5. Conclusions
Author Contributions
Funding
Institutional Review Board Statement
Informed Consent Statement
Conflicts of Interest
References
- Shah, S.B.; Hariharan, U.; Bhargava, A.K. Capstesia: The smart hemodynamic monitor!, Trends Anaesth. Crit. Care. 2016, 10, 15–19. [Google Scholar] [CrossRef]
- Vasdev, S.; Chauhan, S.; Choudhury, M.; Hote, M.P.; Malik, M.; Kiran, U. Arterial pressure waveform derived cardiac output FloTrac/Vigileo system (third generation software): Comparison of two monitoring sites with the thermodilution cardiac output. J. Clin. Monit. Comput. 2012, 26, 115–120. [Google Scholar] [CrossRef] [PubMed]
- De Backer, D.; Marx, G.; Tan, A.; Junker, C.; Van Nuffelen, M.; Hüter, L.; Ching, W.; Michard, F.; Vincent, J.-L. Arterial pressure-based cardiac output monitoring: A multicenter validation of the third-generation software in septic patients. Intensive Care Med. 2011, 37, 233–240. [Google Scholar] [CrossRef] [PubMed] [Green Version]
- Mayer, J.; Boldt, J.; Poland, R.; Peterson, A.; Manecke, G.R. Continuous Arterial pressure waveform–based cardiac output using the FloTrac/Vigileo: A review and meta-analysis. J. Cardiothorac. Vasc. Anesth. 2009, 23, 401–406. [Google Scholar] [CrossRef] [PubMed]
- Manecke, G.R. Edwards FloTracTM sensor and VigileoTM monitor: Easy, accurate, reliable cardiac output assessment using the arterial pulse wave. Expert Rev. Med. Devices 2005, 2, 523–527. [Google Scholar] [CrossRef] [PubMed]
- Headley, J.M. Arterial pressure-based technologies: A new trend in cardiac output monitoring. Crit. Care Nurs. Clin. North. Am. 2006, 18, 179–187. [Google Scholar] [CrossRef] [PubMed]
- Larraza, B.B.; Guerras, O.A. Capstesia, una nueva APP para la monitorización/Capstesia, a new APP for advanced hemodynamic monitoring. Rev. Española Anestesiol. Reanim. 2016, 61, 535–536. [Google Scholar] [CrossRef] [PubMed]
- Desebbe, O.; Joosten, A.; Suehiro, K.; Lahham, S.; Essiet, M.; Rinehart, J.; Cannesson, M. A novel mobile phone application for pulse pressure variation monitoring based on feature extraction technology: A method comparison study in a simulated environment. Anesth. Analg. 2016, 123, 105–113. [Google Scholar] [CrossRef] [PubMed] [Green Version]
- Guay, J.; Kopp, S. Epidural pain relief versus systemic opioid-based pain relief for abdominal aortic surgery. Cochrane Database Syst. Rev. 2016. [Google Scholar] [CrossRef] [PubMed]
- Joosten, A.; Jacobs, A.; Desebbe, O.; Vincent, J.L.; Sarah, S.; Rinehart, J.; Van Obbergh, L.; Hapfelmeier, A.; Saugel, B. Monitoring of pulse pressure variation using a new smartphone application (Capstesia) versus stroke volume variation using an uncalibrated pulse wave analysis monitor: A clinical decision-making study during major abdominal surgery. J. Clin. Monit. Comput. 2019, 33, 787–793. [Google Scholar] [CrossRef] [PubMed]
- Shah, S.B.; Bhargava, A.K.; Hariharan, U.; Vishvakarma, G.; Jain, C.R.; Kansal, A. Cardiac output monitoring: A comparative prospective observational study of the conventional cardiac output monitor vigileoTM and the new smartphone-based application capstesiaTM. Indian J. Anaesth. 2018, 62, 584–591. [Google Scholar] [CrossRef] [PubMed]
- Koo, T.K.; Li, M.Y. A guideline of selecting and reporting intraclass correlation coefficients for reliability research. J. Chiropr. Med. 2016, 15, 155–163. [Google Scholar] [CrossRef] [PubMed] [Green Version]
- Critchley, L.A.; Critchley, J.A. A meta-analysis of studies using bias and precision statistics to compare cardiac output measurement techniques. J. Clin. Monit. Comput. 1999, 15, 85–91. [Google Scholar] [CrossRef] [PubMed]
- Barrachina, B.; Cobos, R.; Mardones, N.; Castañeda, A.; Vinuesa, C. Assessment of a smartphone app (Capstesia) for measuring pulse pressure variation. Eur. J. Anaesthesiol. 2017, 34, 75–80. [Google Scholar] [CrossRef] [PubMed]
- Santiago-López, J.; León-Ramírez, V.; Hernández-Ramírez, S.; Vásquez-Márquez, P.I.; Castellanos-Olivares, A. Concordance in the measurement of cardiac output. Vigileo vs. Capstesia. Rev. Med. Inst. Mex. Seguro Soc. 2018, 56, 136–142. [Google Scholar] [PubMed]
- Joosten, A.; Boudart, C.; Vincent, J.L.; Vanden Eynden, F.; Barvais, L.; Van Obbergh, L.; Rinehart, J.; Desebbe, O. Ability of a new smartphone pulse pressure variation and cardiac output application to predict fluid responsiveness in patients undergoing cardiac surgery. Anesth. Analg. 2019, 128, 1145–1151. [Google Scholar] [CrossRef] [PubMed]
- Bland, J.M.; Altman, D.G. Statistical methods for assessing agreement between two methods of clinical measurement. Lancet 1986, 1, 307–310. [Google Scholar] [CrossRef]
- Camporota, L.; Beale, R. Pitfalls in haemodynamic monitoring based on the arterial pressure waveform. Crit. Care 2010, 14, 124. [Google Scholar] [CrossRef] [PubMed] [Green Version]
- Sistema FloTrac|Edwards Lifesciences. 2019. Available online: https://www.edwards.com/it/devices/Hemodynamic-Monitoring/FloTrac (accessed on 19 November 2019).
- Anaesthesia West; Western Anesthesia Society Ireland. Flotrac-Vigileo—Useful Tool or Toy? 2012, pp. 2–6. Available online: https://anaesthesiawest.com/2012/03/12/flotrac-vigileo-useful-tool-or-toy/ (accessed on 22 November 2019).


| Variables | Patients (n = 22) |
|---|---|
| Age (years) | 72 ± 6 |
| Sex: male | 21 (95%) |
| Weight (kg) | 77 ± 11 |
| BMI (kg/m2) | 26 ± 3 |
| BSA (m2) | 1.88 ± 0.15 |
| ASA grade | |
| I | 3 (14%) |
| II | 4 (18%) |
| III | 8 (36%) |
| IV | 7 (32%) |
| V-POSSUM | 17 ± 2 |
| Comorbidities: | |
| Coronary artery disease | 9 (41%) |
| DCM | 5 (23%) |
| Hypertension | 18 (82%) |
| Diabetes mellitus | 4 (18%) |
| Chronic Kidney Disease | 1 (5%) |
| COPD | 3 (14%) |
| Stroke or TIA | 2 (9%) |
| Hemodynamic Data | Capstesia (n = 236) | Vigileo (n = 236) | ||
|---|---|---|---|---|
| Median | Interquartile Range | Median | Interquartile Range | |
| Cardiac output | 4.48 | (3.40–5.40) | 4.70 | (4.10–5.50) |
| Cardiac Index | 2.44 | (1.81–2.96) | 2.60 | (2.30–3.00) |
| PPV | 10.50 | (5.48–23.63) | - | - |
| SVV | - | - | 9.00 | (7.00–12.00) |
| Stroke volume | 65.00 | (51.00–82.00) | 71.50 | (63.00–80.00) |
| Stroke volume index | 35.50 | (28.00–44.00) | 39.00 | (34.75–43.00) |
| Systemic vascular resistance | 1111.00 | (939.75–1307.00) | 1088.50 | (915.25–1288.50) |
| Systemic vascular resistance index | 2042.50 | (1753.00–2419.75) | 1983.50 | (1613.00–2387.00) |
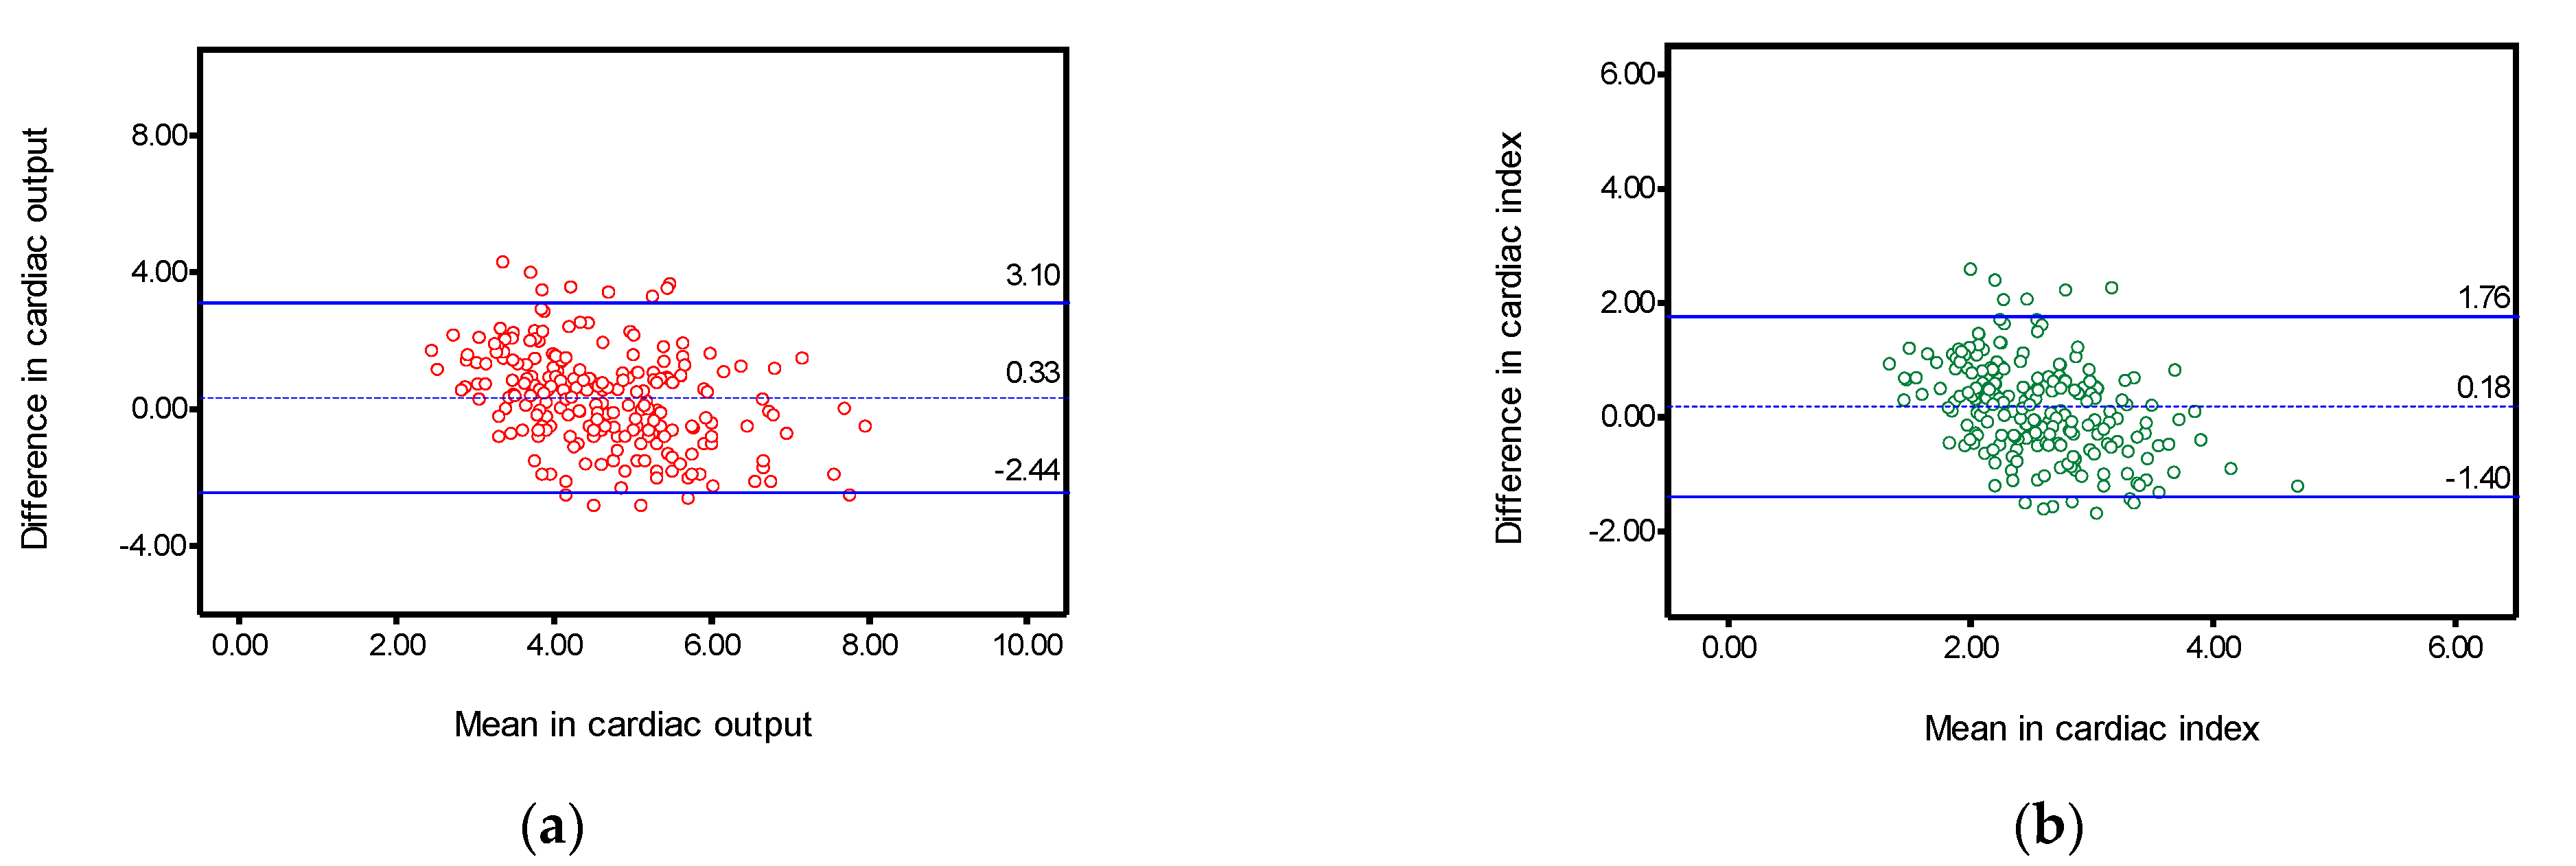
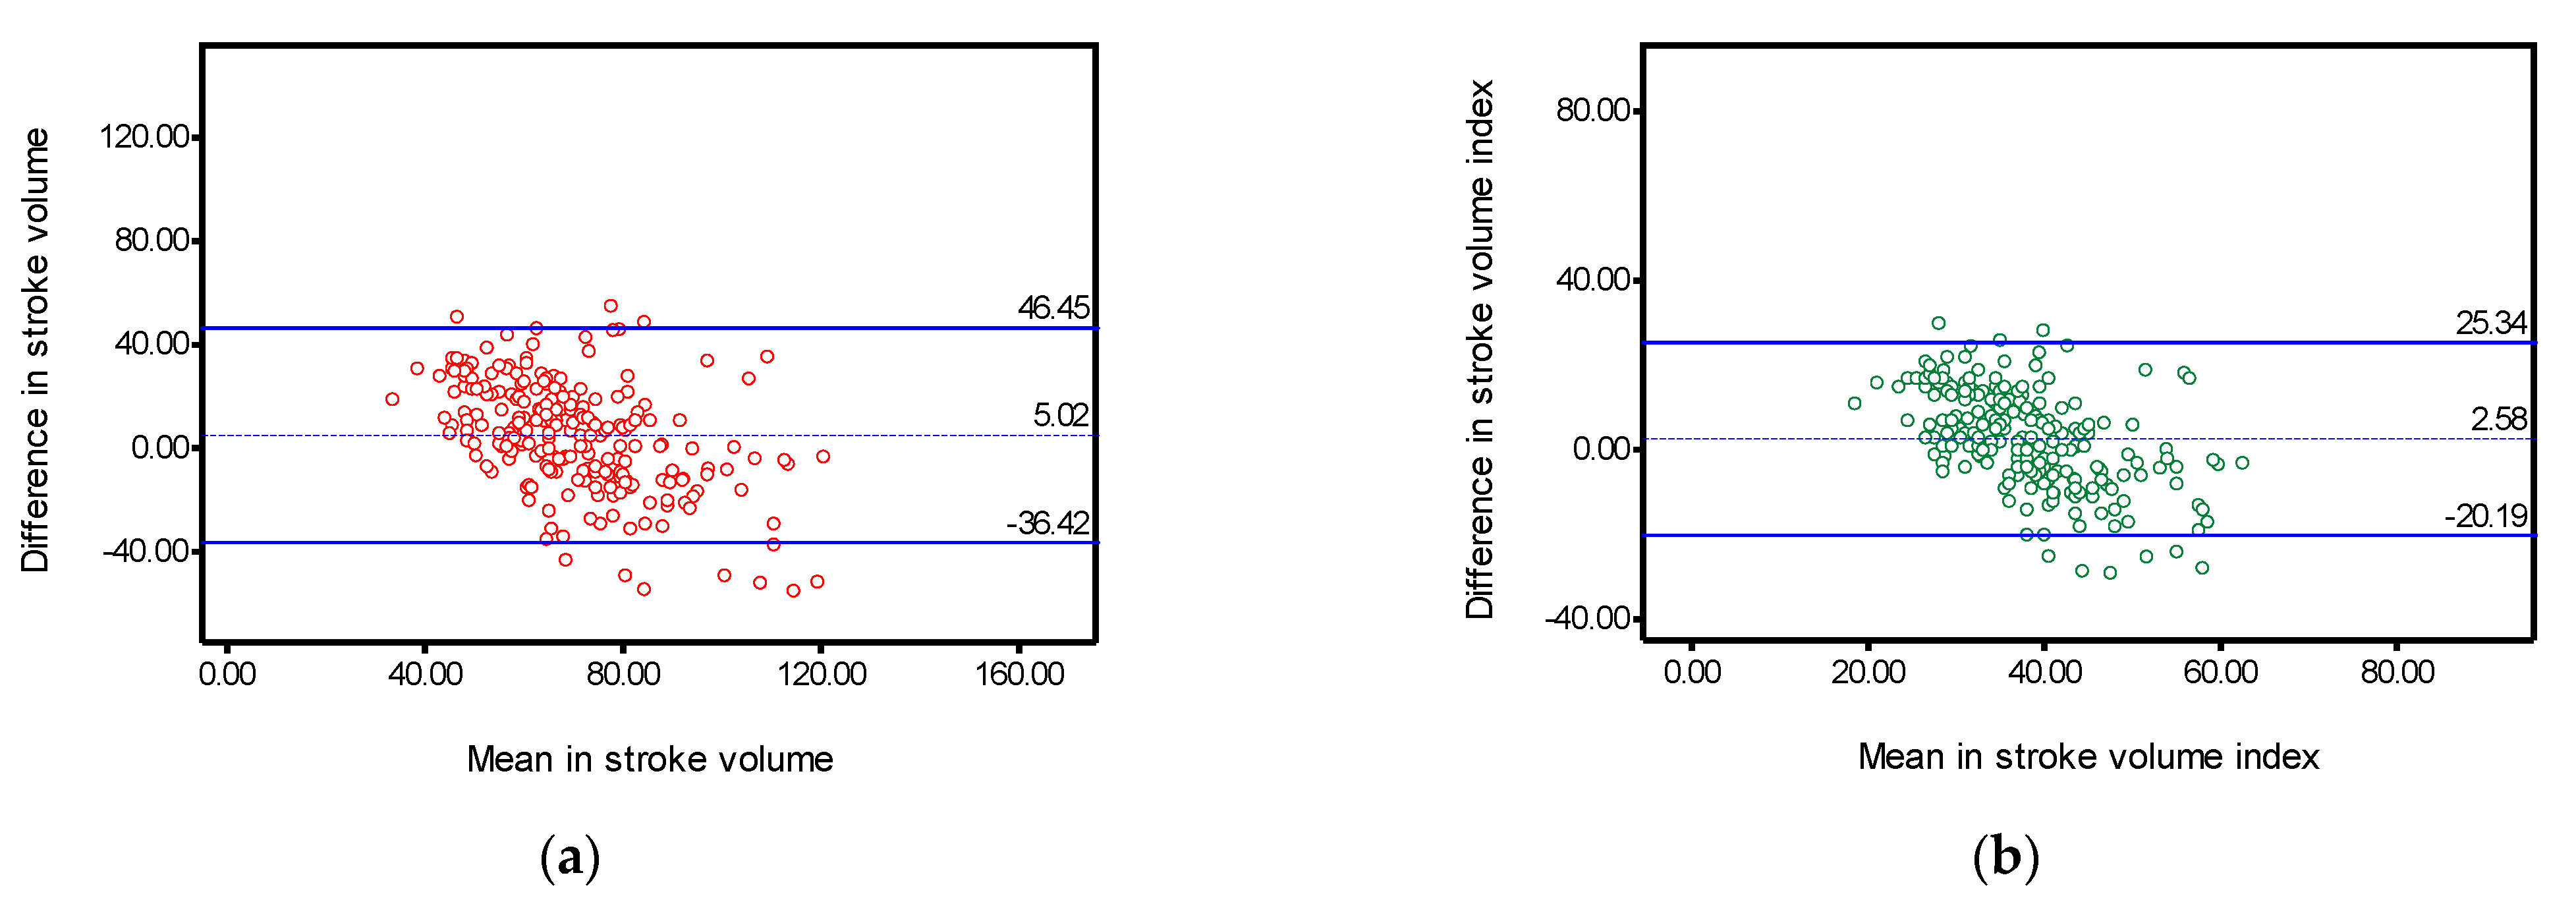
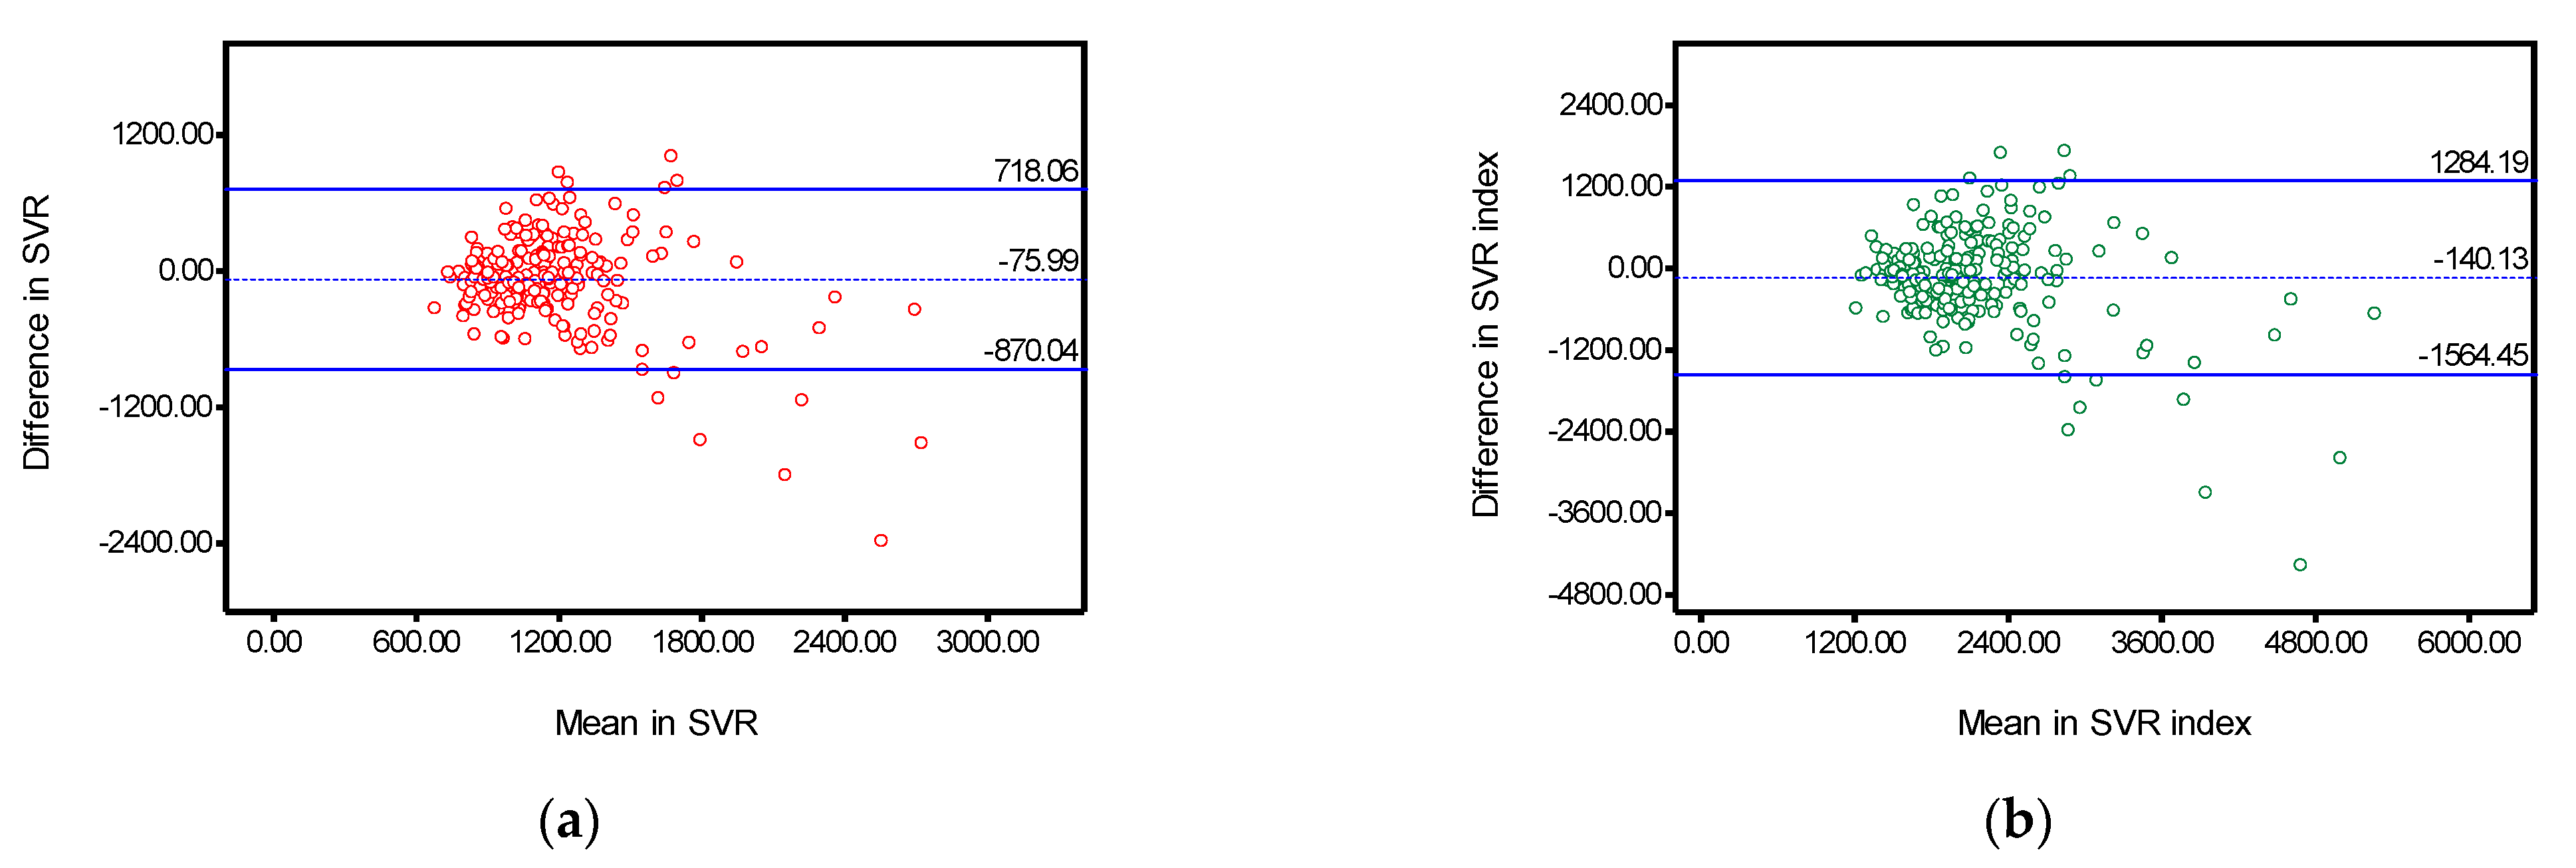
| ICC | (95% CI) | Mean of the Differences (%) | SD of the Differences (%) | Limits of Agreement (%) | Error Percentage (1.96 * SD/Mean) (%) | ||
|---|---|---|---|---|---|---|---|
| Cardiac output | 0.527 | (0.387–0.634) | 0.33 | 1.41 | −2.44 | 3.10 | 61.91 |
| Cardiac Index | 0.434 | (0.270–0.561) | 0.18 | 0.81 | −1.40 | 1.76 | 59.82 |
| Stroke volume | 0.580 | (0.454–0.676) | 5.02 | 21.14 | −36.42 | 46.45 | 57.19 |
| Stroke volume index | 0.478 | (0.326–0.595) | 2.58 | 11.61 | −20.19 | 25.34 | 57.68 |
| Systemic vascular resistance | 0.609 | (0.495–0.698) | −75.99 | 405.13 | −870.04 | 718.06 | 69.94 |
| Systemic vascular resistance index | 0.663 | (0.563–0.740) | −140.13 | 726.70 | −1564.45 | 1284.19 | 68.55 |
Publisher’s Note: MDPI stays neutral with regard to jurisdictional claims in published maps and institutional affiliations. |
© 2021 by the authors. Licensee MDPI, Basel, Switzerland. This article is an open access article distributed under the terms and conditions of the Creative Commons Attribution (CC BY) license (https://creativecommons.org/licenses/by/4.0/).
Share and Cite
Nisi, F.; Melchiorri, C.; Di Grigoli, P.; Giustiniano, E.; Cerutti, E.; Rispoli, P.; Balagna, R. Monitoring of Cardiac Output Using a New Smartphone Application (Capstesia) vs. Vigileo FloTrac System. Surgeries 2021, 2, 347-356. https://0-doi-org.brum.beds.ac.uk/10.3390/surgeries2040034
Nisi F, Melchiorri C, Di Grigoli P, Giustiniano E, Cerutti E, Rispoli P, Balagna R. Monitoring of Cardiac Output Using a New Smartphone Application (Capstesia) vs. Vigileo FloTrac System. Surgeries. 2021; 2(4):347-356. https://0-doi-org.brum.beds.ac.uk/10.3390/surgeries2040034
Chicago/Turabian StyleNisi, Fulvio, Chiara Melchiorri, Paola Di Grigoli, Enrico Giustiniano, Elisabetta Cerutti, Paolo Rispoli, and Roberto Balagna. 2021. "Monitoring of Cardiac Output Using a New Smartphone Application (Capstesia) vs. Vigileo FloTrac System" Surgeries 2, no. 4: 347-356. https://0-doi-org.brum.beds.ac.uk/10.3390/surgeries2040034