
A Risk Management Database Framework Implementation for Transportation Asset Management


Civil, Construction and Environmental Engineering/Center for Transportation Research and Education, Iowa State University, Ames, IA 50010, USA
*
Author to whom correspondence should be addressed.
CivilEng 2021, 2(1), 193-213; https://0-doi-org.brum.beds.ac.uk/10.3390/civileng2010011
Submission received: 27 October 2020
/
Revised: 16 February 2021
/
Accepted: 18 February 2021
/
Published: 2 March 2021
(This article belongs to the Special Issue Addressing Risk in Engineering Asset Management)
Abstract
:A 2017 survey of the state of practice on how agencies are developing their risk-based asset management plan shows that state highway agencies are increasingly adapting the way they do business to include explicit considerations of risks. At the moment, this consideration of risk is not linked to data. Hence, there is a lack of integration of risk management in driving strategic cross-asset programming and decision-making. This paper proposes and implements a risk management database framework as the missing piece in the full implementation of a risk-based transportation asset management program. This risk management database framework utilizes Geographic Information Systems (GIS) and Application Programming Interface (API) to implement a risk management database of all the relevant variables an agency needs for risk modeling to improve risk monitoring, risk register updates, and decision-making. This approach allows the use of existing enterprise as well as legacy data collection systems, which eliminates the need for any capital-intensive implementation cost. Furthermore, it provides transportation agencies with the ability to track risk in quantitative terms, a framework for prioritizing risk, and the development of an actionable plan for risk mitigation. In this paper, the implementation of the fully integrated GIS-enabled risk management database employs the Iowa department of transportation (DOT) data and risk register.
Keywords:
risk management database; TAMP; framework; data integration; database design; risk registers; GIS1. Background
Transportation is the mainstay of economic activity, connecting producers with supply chains; customers with products and tourism; and people with their workplaces, homes, and communities across both urban and rural areas. In 2017, the transportation sector added over $400 billion to the U.S. gross domestic product [1], while moving more than 19 trillion dollars of shipment value, about 60% of which was moved on roads. The demands on the transportation system lead to the ongoing deterioration of roadways and bridges that must be repaired, rehabilitated, or replaced to preserve the integrity and reliability of the transportation system. Transportation managers must continually evaluate system safety, performance, condition, and vulnerabilities in the context of available funding to make good transportation investment decisions. The ongoing costs associated with preserving the condition and performance of existing transportation assets are significant. Billions of dollars are spent each year by state and local government agencies to hold deterioration at bay so that the transportation system can continue to support user reliability and safety with minimal disruption. The need to efficiently manage transportation system investments has led to a recognition of the benefits of managing assets using a data-driven systematic approach generally referred to as Transportation Asset Management (TAM). The American Association of State Highway And Transportation Officials (AASHTO) defines TAM as an intentional and systematic process of operating, maintaining, upgrading, and expanding the capacity of physical assets throughout its lifecycle [2]. TAM forces state transportation agencies which are public institutions to adopt the same business practices that the private sector is defined by in its stewardship of public funds. According to the International Standards Organization (ISO) documents in ISO 55000 and ISO 31000 [3,4], risk management is the core principle of asset management. Hence, TAM cannot be effectively conducted without quantifying and qualifying risk and how it will be managed to accommodate community values related to accepting and managing risks. To that end, on 6 July 2012, the Moving Ahead for Progress in the 21st Century Act (MAP-21) was signed into law by President Obama. MAP-21 requires states to develop a risk-based asset management plan for the National Highway System (NHS) to improve or preserve the condition of the assets and the performance of the system. MAP-21 sparked a paradigm shift from traditional formula-based emphasis to a performance-based approach for TAM [5]. Hence, the business of all state departments of transportation (DOTs) is to identify, manage, and communicate acceptable risk, risks strategies, and what can and cannot be accomplished given the available resources. This process of risk management by nature is very data-intensive, since you cannot manage what you cannot measure [6,7].
As a result, state DOTs and other transportation agencies collect, exchange, manage, and use substantial quantities of data and information for project development and the subsequent management of the physical assets for which they are responsible. These agencies devote considerable resources to data collection and storage and often face challenges such as duplicating effort or gaps in data collected by various organizational units; ensuring that data sources are well documented and data are current; and providing the various units responsible for the planning, design, construction, operation, and maintenance of system assets with access to reliable and current information for decision-making.
The persistent evolution of data and information technologies presents challenges as agencies seek to ensure that the transportation system delivers high performance and the agency performs its functions effectively and efficiently. Remote sensing, Lidar, geographic information system (GIS), 3-D graphic displays, and virtual reality (to name a few of the newer developments) are supplementing or replacing data acquisition and information management practices once based on physical measurements and storage and display in large-format print media. Many agencies must deal with legacy data while avoiding obsolescence in their management practices. Typically, fragmented DOT business practices and the decades-long processes of asset development and life-cycle service have produced disparate data sets that are poorly suited to effective long-term system asset and risk management [2,8,9].
2. The State of Risk Based Asset Management Implementation
MAP-21 requires that each state must have a risk-based TAM plan in place to preserve the condition of its assets and improve the performance of the National Highway System. Many requirements of MAP-21, including requirements for state DOTs to develop risk-based asset management plans and to establish performance-based planning processes, remain unaffected with the passage of the Fixing America’s Surface Transportation (FAST) Act, signed into law in 2015. However, the state of the practice for U.S. transportation agencies’ use of enterprise risk management is still emergent and evolving. Although agency officials informally manage risks constantly, there are few examples of formal, documented enterprise risk management among U.S. transportation agencies [10]. A National Cooperative Highway Research Program (NCHRP) report released in 2016 to identify and evaluate successful implementation of enterprise risk management programs among state DOTs, international transportation agencies, and non-transportation organizations found that a majority of state DOTs did not have a formal risk management process compared to their international transportation and non-transportation counterparts that were surveyed [11]. In a 2017 national scan of how state DOTs were integrating risk management in their TAM, it was found that most agencies were using risk registers for their risk management [12]. It did not allude to any identification of data or data gaps for updating the risk registers or how that translates to program development or overall decision-making. However, it also found that state DOTs were putting in place policies and structures for risk management and the only thing missing was a working implementation of risk-based TAMP to drive decision-making.
In addition, a literature review of the TAMP documents uploaded to the AASHTO TAM portal [13] revealed that all the state DOTs stopped at risk registers identified through workshops with internal and external stakeholders. But that process was not integrated with TAM and some did not factor in external events in their risk management. In other words, these initial TAMP documents acknowledged risks but did not address, for the most part, how the risk management process was fully integrated into the overall TAMP.
The need for a risk management database as the missing piece to full implementation of the risk management framework required to satisfy the intent of the MAP-21 act has already been established [14]. In this paper, the focus is on the implementation of the risk management database using the Iowa DOT data and risk register. In addition, this paper will focus on how to expand this approach to be used by any state DOT.
3. Implementation Overview
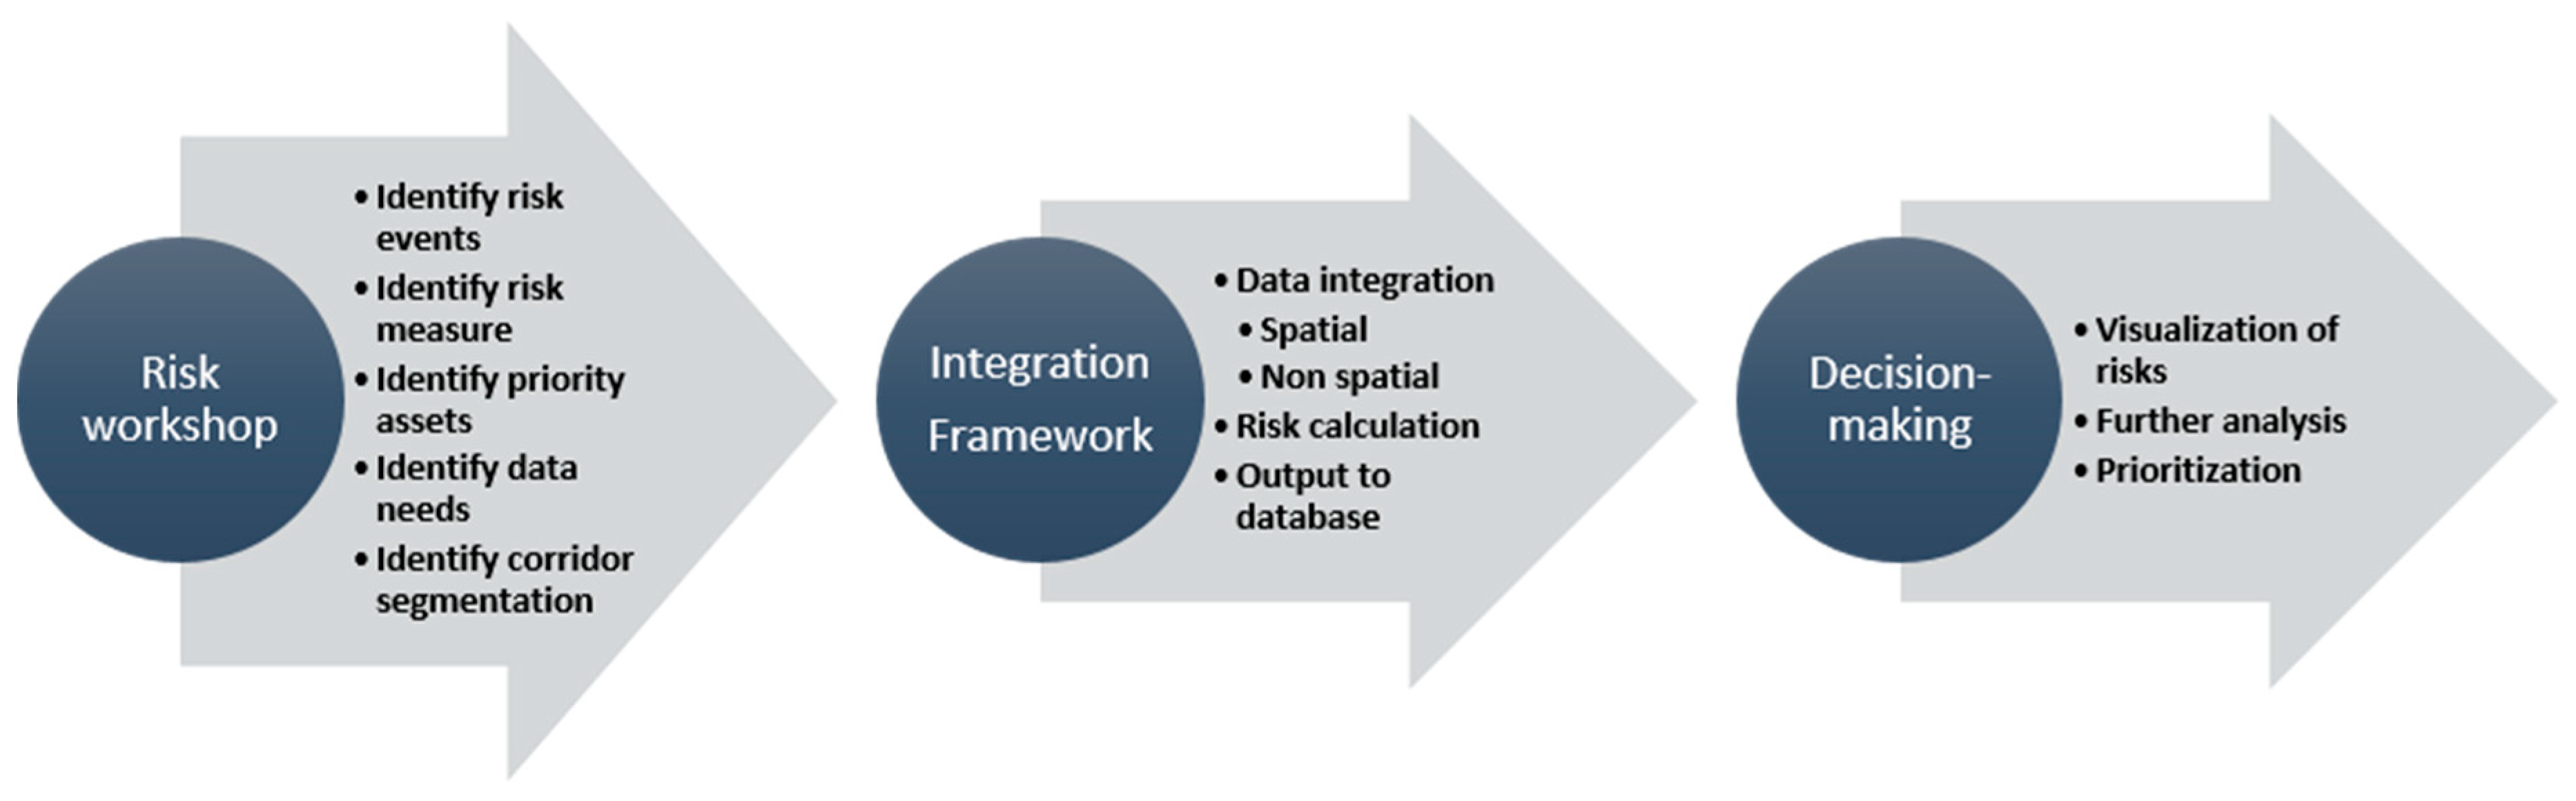
Figure 1 is a summary of the implementation process. It begins with data elicitation [14], which identifies what risk events are of interest to the agency, the assets being considered, and the sources of available data. This is followed by data integration, which involves spatial integration for data sources with spatial information and non-spatial data integration for data sources that can be linked by a unique identifier. Finally, this results in a risk management database that provides the basis for mapping or visualization and further analyses. The arrows in the diagram represents the application programming interface (API) that translates one process to the other. In the following sections, each process will be broken down.
4. Data Elicitation
This is the process of identifying what risk events the agencies are interested in including in their risk registers, along with the critical asset types and data sources. The risk register workshop can be improved upon to include the process for providing the inputs for a successful risk management database. Hence, risk registers from TAMP documents submitted by agencies per MAP-21 requirements on the AASHTO portal were reviewed to gauge common risks that agencies had identified [13]. The following are the common risk categories identified by the state DOTs TAMP:
- Financial risks related to the long-term stability of asset management programs;
- Information and decision risks related to the implementation of asset management programs;
- External risks involving both human-induced and naturally occurring threats;
- Asset condition risks associated with asset failure.
4.1. Financial Risk
Financial risks are risks related to the long-term stability of asset management programs, such as unmet needs in long term budgets, funding stability, and exposure to financial losses by the state DOTs. Table 1 summarizes the sources of the financial risk as explicitly identified in the agencies’ TAMP documents. The top three financial risk sources from Table 1 are revenue variation or uncertainty, federal funding, and inflation. The biggest driver for revenue variations were attributed to increased fuel efficiency from newer electric and hybrid cars and from decreases in vehicle miles travelled as a result of rural to urban migration. Some agencies such as Iowa DOT identified in their risk register that a 15% or more drop in revenue will lead to dropping some of their asset management projects, while for Montana a decrease of more than 3% in revenue will alter their TAM programming. For simplicity, these top three financial sources will be used in estimating a financial risk measure as they are readily available. Past revenue from each state is available as well as forecasted revenue from the state DOTs budget office. Federal aid funding information is readily available from U.S. DOT, and inflation numbers are also available from the Federal Reserve.
Financial metrics are not commonly used by U.S. state DOTs compared to their international counterparts in Europe and Australia, and also compared to private sector businesses. These metrics provide transparency and are useful as another set of tools for risk tracking and ensuring that the investment strategies of states DOTs are adequate in the face of risk events [15]. The Federal Highway Administration (FHWA) proposed in 2012 the asset sustainability ratio or index as a simple measure that provides decision makers a comparative idea of the level to which assets are sufficiently funded to reach a desired condition target [15,16]. The sustainability index or the financial risk measure (FRM) is calculated thus [16]:
To add credibility to the calculation while still keeping it simple, an inflation term will be added to the equation above to yield a new FRM thus:
where g = inflation in decimal.
A ratio of 1 means that there are no funding gaps, which implies that the level of funding is sufficient to meet the set condition target. It is not expected that the ratio from Equation (1) will be more than one, but in the event that this happens it should be made equal to one. They further proposed that for one asset, the metric will be called a sustainability ratio and if a class of assets are measured it will be referred to as a sustainability index [16]. For the purpose of this study, only pavements will be considered—hence, a sustainability index.
Since the FRM is a network measure, to calculate a risk probability at the analysis segmentation or aggregation level, which in this case is the highway corridor, the FRM will be weighted by the last measured condition of the corridor, the vehicle miles traveled (VMT) carried by the segment, and the system of the segment—that is, if the corridor carries an interstate, U.S., or state route. The highway corridor can be defined by the state agencies based on traffic volume, freight corridors, population density, or land use. This will lead to a risk probability (financial) calculation, PFinance, thus:
where s = system weight and c = condition weight, and the values for c are derived from Table 2 based on the condition of the corridor.
Factoring in the system and condition provides a measure that is reflective of the DOTs’ investment priorities and the current state of their network.
4.2. Information and Decision Risk
Information and decision risk is related to the implementation of the asset management program, such as the lack of critical asset information, the quality of data, and modeling or forecasting tools for decision-making. Risk management is data-intensive, as a variety of asset management functions within transportation agencies produce, process, and analyze a substantial amount of data daily [8,9]. With the rapid evolution of data and information technologies, transportation agencies are cashing in on the promise of data-driven decision-making. The size and complexity of the data are growing over time with challenging implications as agencies seek to ensure that the transportation system delivers high performance and the agency functions effectively and efficiently [9]. Extensive lists of IT challenges and data issues are documented in the literature ([9,17,18]). From the TAMP document submitted by the state DOTs, the following are the biggest issues that the agencies explicitly identified as driving the information and decision-related risk:
- the availability and quality of data;
- data management system;
- inability of the IT department to support decision-making and analysis of business needs;
- performance models not factoring in climate change and other relevant variables that indirectly impact performance and operations;
- lack of performance and forecasting models.
Another driver of this risk that was not stated in the TAMP documents is the fact that fragmented DOT business practices and the decades-long processes of asset development and life-cycle service have produced disparate data sets that are not well suited for effective long-term system asset and performance management. To remedy the situation, AASHTO has developed a set of Core Data Principles for transportation data [19] in addition to an official data self-assessment guide that includes data management modules, with an emphasis on quality data, association with strategic goals, regular audits of data, well-defined organizational roles, and mechanisms for security and privacy [9]. To qualitatively understand the degree to which their data processes may be at risk, state DOTs can submit to the self-assessment guide. However, for the purpose of the risk management database, the analysis of variances between results and expected targets can become an excellent source of risk information, as it helps to explain conditions that are changing suddenly [20], which can be an indication of the inconsistencies in the data or an external event or missing variables not factored in the performance estimation. Thus, the consistency of all the variables that are used in the performance estimation must be evaluated to determine the validity and quality of the data before the performance is calculated [21]. The variances in the variables between recent collection cycles can capture the reliability of the data for long-term performance evaluation while accounting for resurfacing or other extenuating factors. For example, looking at the variance between the last four collections of roughness (IRI) on a road corridor with the typical maintenance and preservation regimen can provide a measure of the reliability of using IRI in the performance model. That variance can be a measure of the probability of the model not capturing the current condition of the network given a target confidence interval. Including all the other variables that make up the performance model, the product of their variances becomes the risk probability for tracking the information and decision risk metric, as shown in Equation (5).
PIDR = Var(Variable 1) * Var(Variable 2)*…*Var(Variable N)
This important metric can also inform the need for changing data collection processes and/or technology. Hence, the risk probability of information and decision-related risk event is developed to quantify the impact of the data quality and performance or forecasting model.
An agency can also evaluate its performance or forecasting model by looking at how well the model is predicting new values from data collection based on a target confidence interval. Therefore, the risk probability becomes a measure of the ratio of correction predictions, given a confidence interval, compared to the entire network, as shown in Equation (6).
where CP = correct predictions and NC = total number of corridors in the network.
4.3. External Risks
These are risks involving both human-induced (terrorism) and naturally occurring threats, such as climatic or seismic events, slope failures, rock falls, lightning strikes, and winter weather operations. Natural events such as floods, fire, and earthquakes are unpredictable and have the potential to cause extensive damage, undermining transportation systems and in some cases severing vital links in the highway network leading to significant holdups to commuters, commerce, and potentially to emergency services. Extreme weather events impact nearly every state in the U.S. In 2012, a total of 133 disaster events occurred resulting in about $881 billion in damages [22]. There is strong evidence to suggest that events related to climate change such as increasing temperature, heavy precipitation, and coastal flooding will continue to grow in frequency and severity in the coming decades [23,24,25,26]. Table 3 is a revised summary of the risk events that state DOTs identified in their TAMP documents and it shows that external events is one of the biggest risk events impacting agencies abilities to deliver on their financial and investment strategies.
A standard set of risk events provide a common basis for risk assessment, which can then be applied to local and regional conditions during a transportation risk analysis [27]. For example, earthquakes would not be considered for risk management in Iowa as it is extremely unlikely for the region. Equation (7) shows the general form of a single functional equation for a variable, Y that is a function of N parameters. In practice, the systems described will have many variables and will need several functional relationships to be satisfied. However, for simplicity, the systems will be defined by their frequency of occurrence.
where N = number of external risk events identified by agencies and X is the frequency of occurrence.
Based on a 2013 Florida DOT study [28], it can be assumed that number of external events follows a Poisson distribution [28]:
where P is the probability that k number of events will occur per interval of time and λ is the event rate. The recurrence time between two consecutive events can be expressed in a probability distribution function of T, such that [28]:
where λ = average rate or number of occurrence per year and the average recurrence time = 1/λ (27).
The average number of events can be obtained from historic data kept by the agency or from an external national agency. For rare events, where there is an effective small sample size or no data, the estimation of a probability of occurrence will benefit from the introduction of a small a priori probability utilizing Bayesian networks [29].
4.4. Asset Condition Risk
Asset condition risks are associated with asset failure, such as structural, capacity, or utilization; reliability of performance; aging; soil and subsurface utilities; and maintenance or operation. According to NCHRP Report 08–93 [10], failure is not only “acute and complete, but also as incremental failure including:
- Structural: where the physical condition of the asset is the measure of deterioration, service potential or remaining life;
- Capacity/utilization: where it is necessary to understand the degree to which an asset is under-or-over-utilized compared to the desired level of service;
- Level of service failures: where reliability or performance targets cannot be met;
- Obsolescence: when technological change or lack of replacement parts render the asset uneconomic to operate;
- Cost or economic impact: where the cost to maintain and operate an asset is likely to exceed the economic return expected, or is more than the customer is willing to pay.”
Before MAP–21, there was no explicit mandate for state DOTs to show how their TAMP maintained national performance outcomes. There was no requirement to track condition or performance, set up targets, measure progress toward targets, or report on condition or performance in a manner that FHWA could use to evaluate the entire system. This final MAP-21 rule creates performance measures to assess pavement and bridge conditions on the NHS for the purpose of achieving consistent national performance outcomes. The four pavement performance measures are [30]:
- percentage of pavements on the interstate system in good condition;
- percentage of pavements on the interstate system in poor condition;
- percentage of pavements on the NHS (excluding the interstate system) in good condition; and percentage of pavements on the NHS (excluding the interstate system) in poor condition.
The two performance measures for assessing bridge condition are:
- percentage of NHS bridges classified as in good condition;
- percentage of NHS bridges classified as in poor condition.
At the network level, a set of measures that evaluate both condition and risk are ones that predict the percentage of assets that meet the targets defined by MAP-21 into the future based on anticipated funding levels [15]. To capture this risk at the corridor level, the percentage of assets that meet the targets will be weighted by the rate of deterioration of the corridor. Additionally, this can be accomplished by weighting it with one or more of these variables that drive pavement deterioration such as heavy truck traffic growth on the corridor segment, maintenance history, and winter weather operations to capture some of the climate risk factor.
4.5. Risk Consequences
The goal of risk analysis is to identify the various elements of risk and combining them into some quantifiable estimate of risk. The intent of this research is to provide that estimate of risk in monetary terms. Equation (10) is the basic formula for calculating risk, R:
where R and C (consequences) is measured in dollars and T (threat) is expressed as probability [27].
R = C * T
Since transportation networks are usually broken into corridors for planning purposes, the importance of each corridor then becomes a function of the traffic it carries, the urban centers it connects, and the development that it drives. Breaking out the consequences terms in Equation (10) will result in the following formula [27]:
C = human impact (fatalities + injuries) + user cost (vehicle running cost + lost wages) + owner cost (asset damage + asset loss) + impact1 + impact2 + … + impactn
The value of human life and serious injury is calculated by each state DOT. Owner costs are the replacement value of each asset. Vehicle running costs can be determined from the federal allowable rates [31]. User wage costs are available from National Occupational Employment and Wage Estimates [32]. Vehicle occupancy rates are available from the National Household Travel Survey [33]. Equation (11) can be modified to add additional variables such as the value of goods carried on the corridor. Value of goods carried by the corridor can be obtained from FHWA Freight Analysis Framework, FAF [34]. Obtaining the data required for calculating the risk consequences will require the integration of data not captured by the state DOTs such as socio-economic data from US Census Bureau.
Replacement Cost
Owner costs that only focus on the replacement value of the asset do not capture the relative implications of each asset in terms of its importance, condition, or stage in its lifecycle. For example, the current replacement cost for a four-lane road in the 20th period of its lifecycle, will be the same as another four-lane road in the same area but in the first period of lifecycle. What is missing that is crucial for decision-making is the opportunity cost of the later is greater than the former. A road that fails in its first year will cost the agency more in terms of missed investments in roads that are nearing their replacement schedule that will need to be moved around to accommodate the failed road. However, a road in its 20th period is much closer to its replacement schedule and will be easier to accommodate without adversely affecting the entire system. Hence, it is important for Equation (11) to capture the opportunity cost that is appropriate for the replacement decision to ensure that the risk management process is relevant to addressing and informing the investment and funding decisions of the agency.
5. Data Integration
Effective and efficient risk management relies heavily on the availability of objective data. The data required to run complex risk analysis resides in multiple systems across the state DOTs departments and in different schemas. The difficulty associated with organization and normalization often presents the biggest challenge in receiving relevant and timely risk information. Tactical database and spreadsheet tools are inflexible, difficult to maintain and generally unreliable. The lack of integration between systems poses big challenges to transportation agencies’ efforts to integrate risk management in their TAM. However, since data collection is capital intensive, the aim of the risk database framework is not to force agencies into a specific data management system but instead using the existing agencies DOT enterprise data systems.
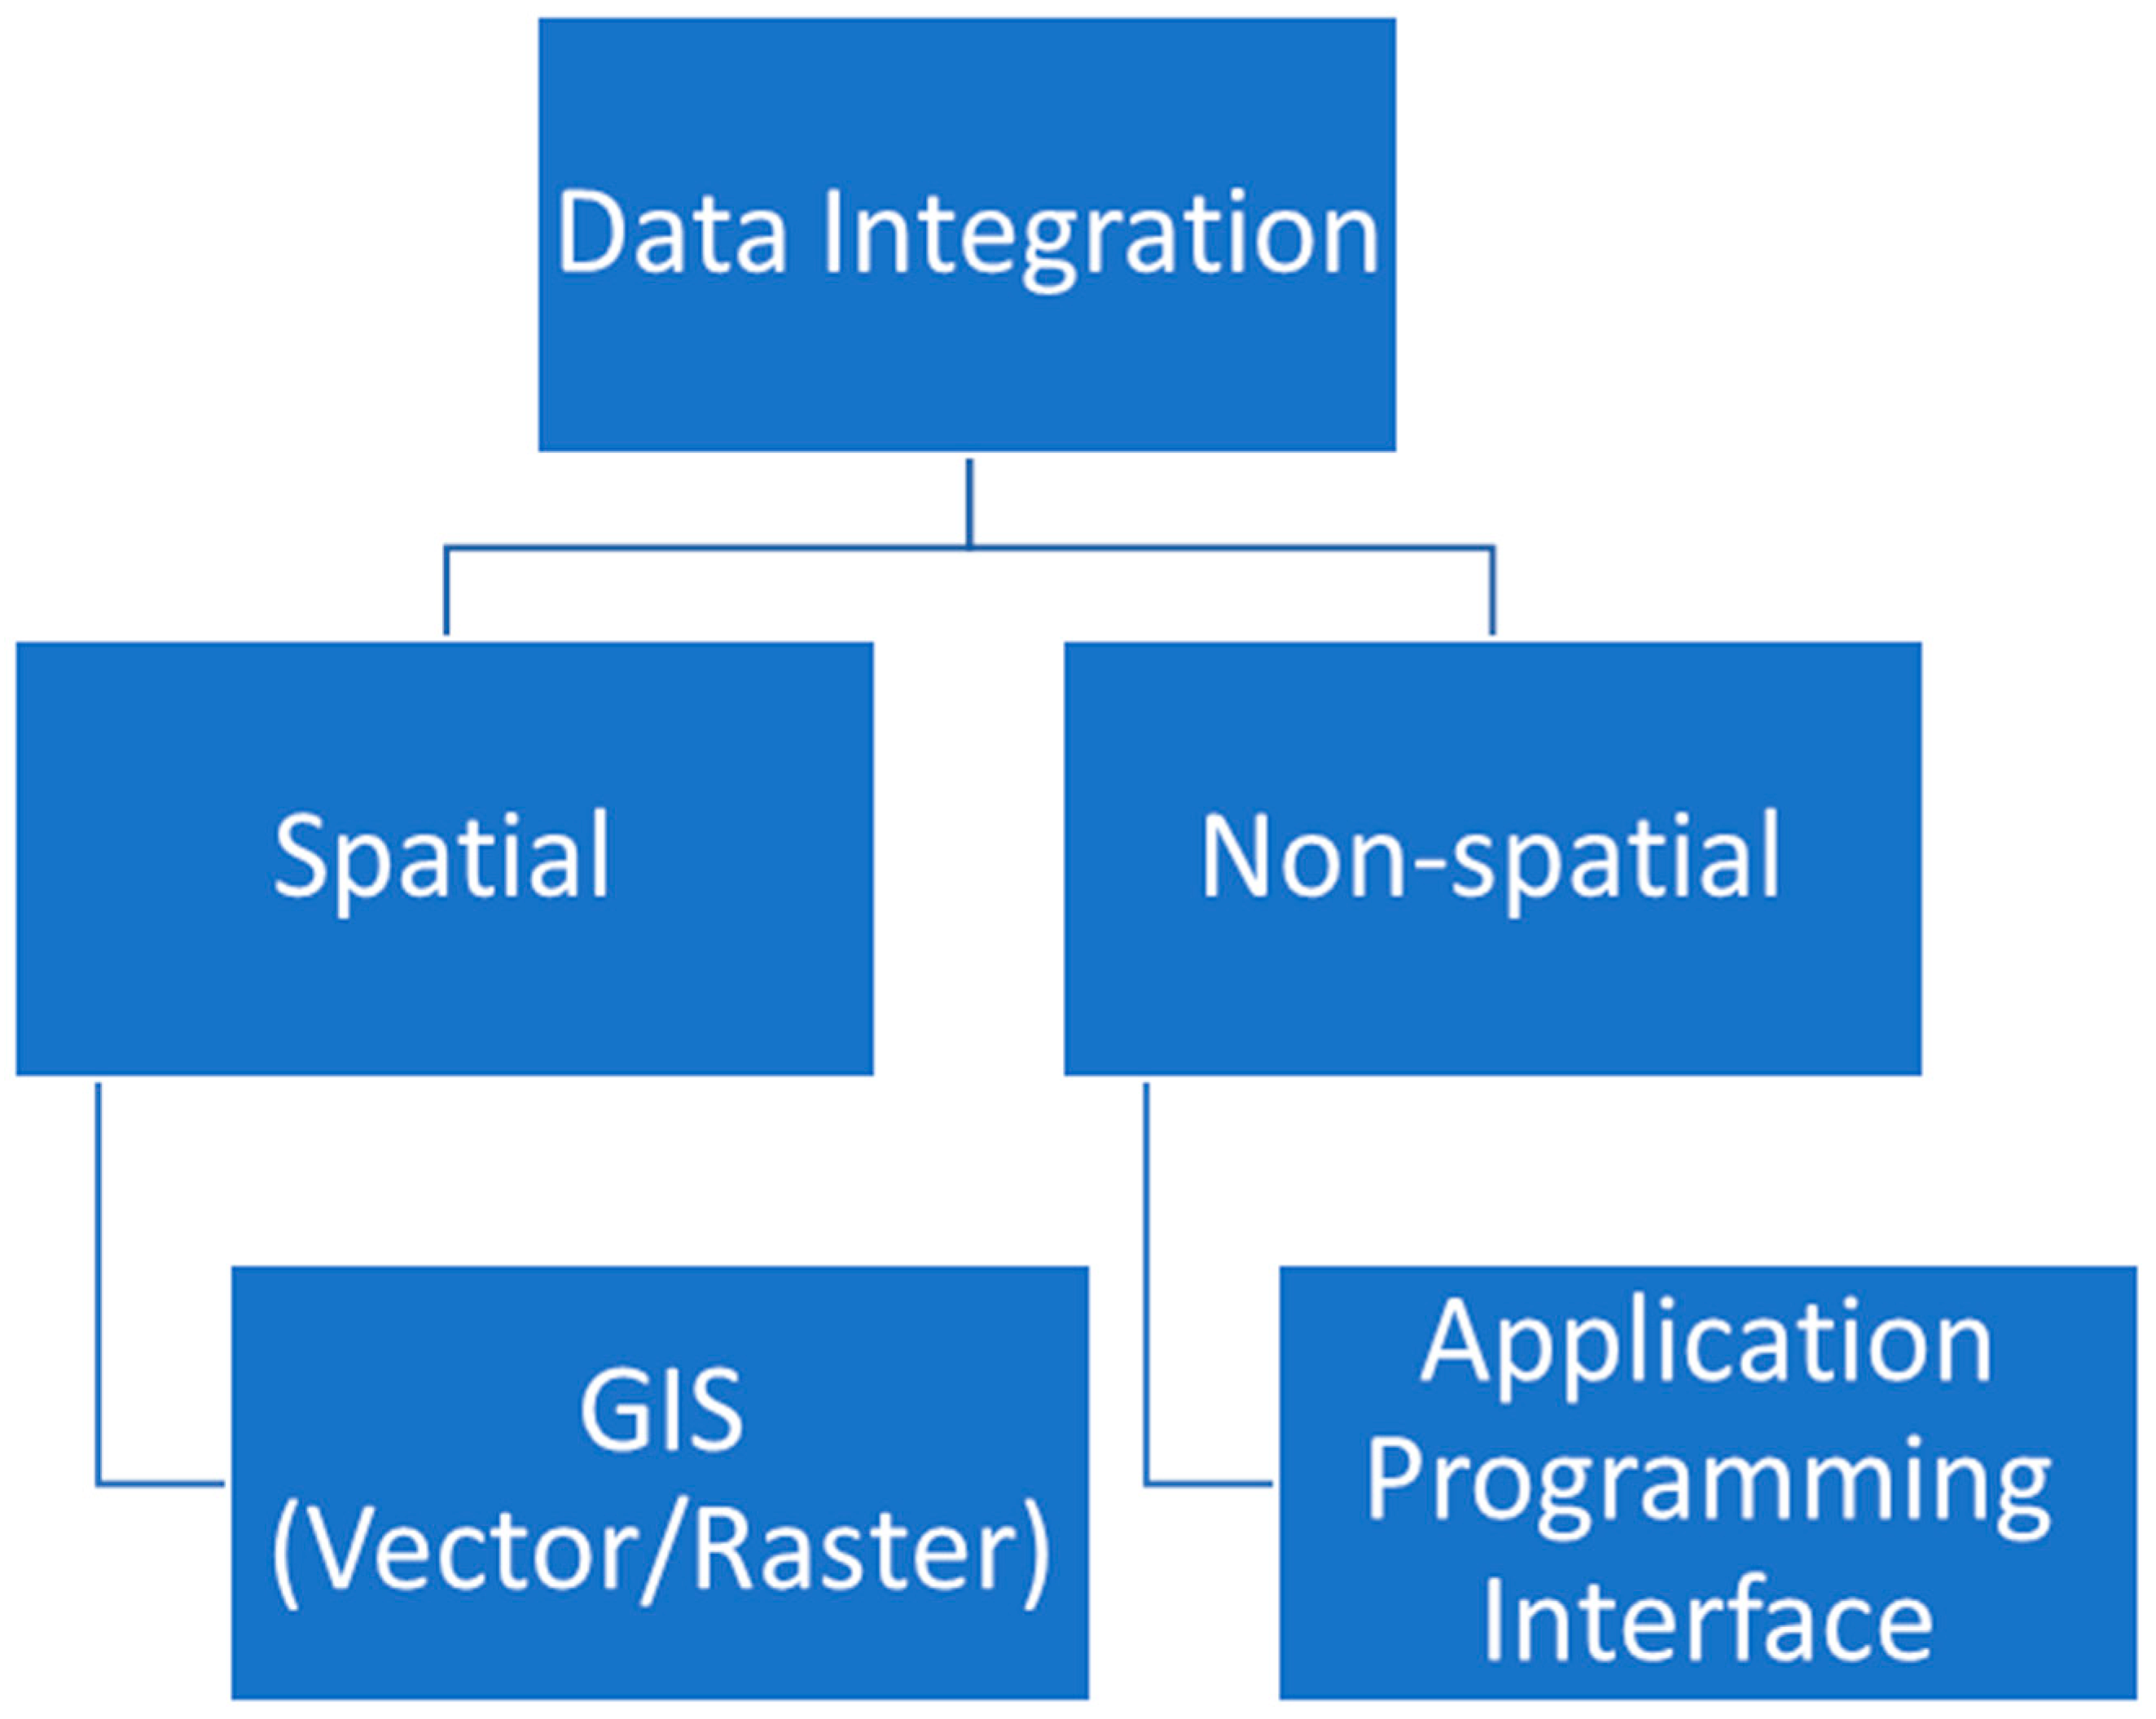
Accomplishing this integration requires a spatial and non-spatial approach, as shown in Figure 2, to integrate all available inventory, measurement, reporting, and financial planning data. These two approaches are discussed in the following sub-sections.
5.1. Spatial Integration
A key characteristic of spatial data is reflective of the technologies that are used to collect them, technologies such as global positioning systems (GPS) and remote sensing [8,26]. With rapid evolution in these technologies, the accuracy of the positional location of the data collection has greatly improved, especially for the level of accuracy required for state DOTs’ decision-making. In general, state DOTs employ the following three methods of location referencing as culled from NCHRP Research Report 903 [35]:
- 1D location referenced to a known location, such as a mile point or offset point from stationing;
- 2D shape with X and Y lateral dimensions, similar polygon outline on a plan view;
- 3D extent that incorporates an elevation (z-dimension).
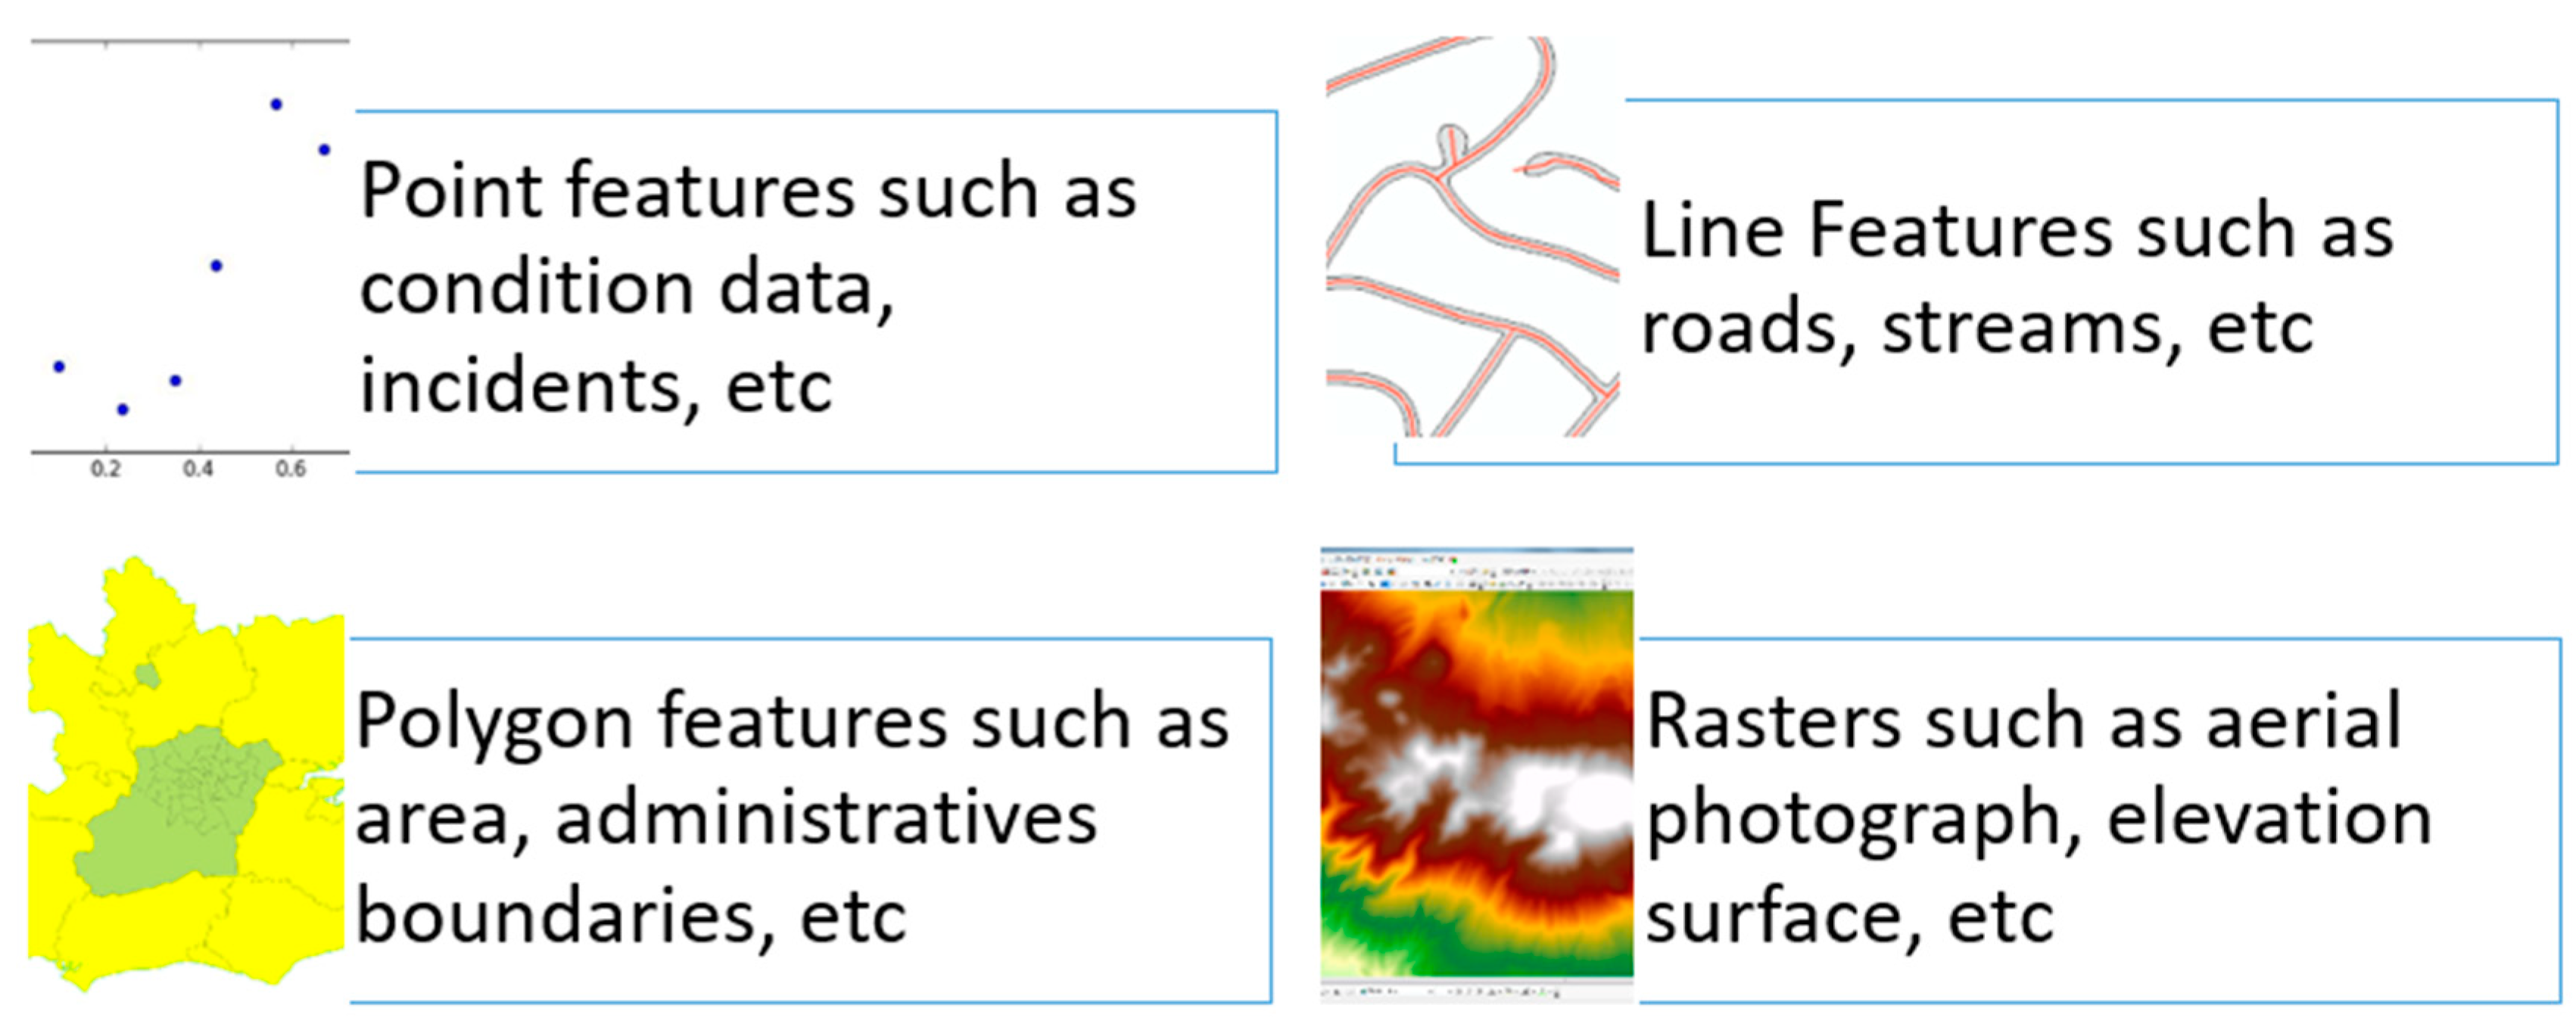
Another consideration of spatial integration is how data collection is encapsulated using GIS data models such as vector and raster data models, as shown in Figure 3. For instance, in pavement management, condition data collection intervals are often standardized at 1/100th of a mile. Hence, the data are then aggregated to pavement management analysis segment that can range from one to several miles.
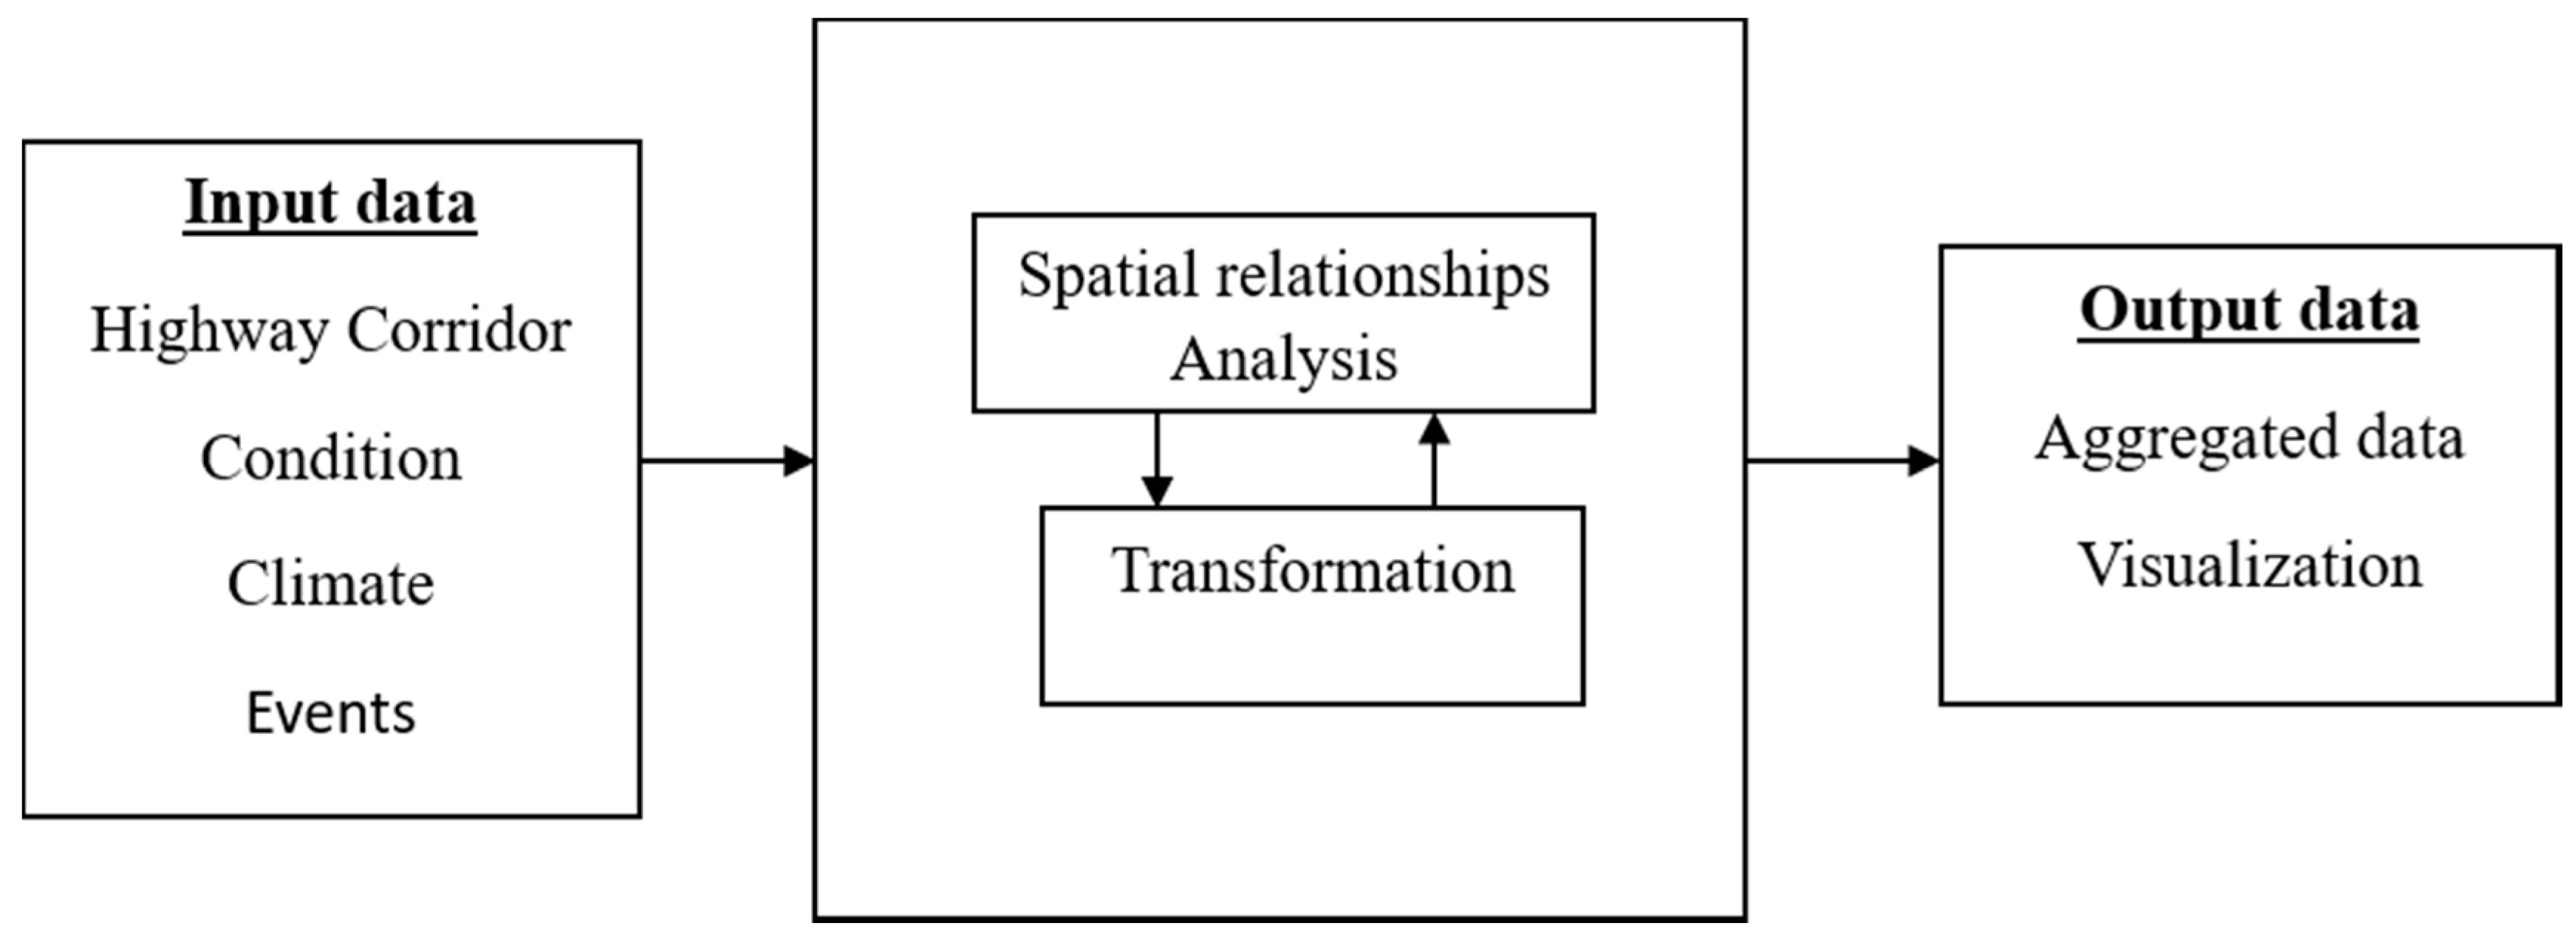
For an ambitious project such as a risk management database, the data will invariably come in various geographic extents requiring a combination of the locational referencing methods as well as spatial data assignment in a GIS environment. From the NCHRP Report on Successful Practices in GIS-Based Asset Managements, GIS facilitates “the integration of disparate data entities using location as the common denominator, visualization of multiple data layers for a selected area or network location, map-based data access for viewing and editing, and spatial analysis involving queries of information based on proximity, route, or geospatial feature.” [8] Hence, GIS can take the various data entities whether modeled as point, line, or polygon feature and transforms the data using spatial relationship functions to produce a resulting dataset that aggregates the desired spatial outcomes as shown in Figure 4. The resulting dataset then has all the variables required for estimating the risk measures discussed in the preceding sections.
5.2. Non-Spatial Integration
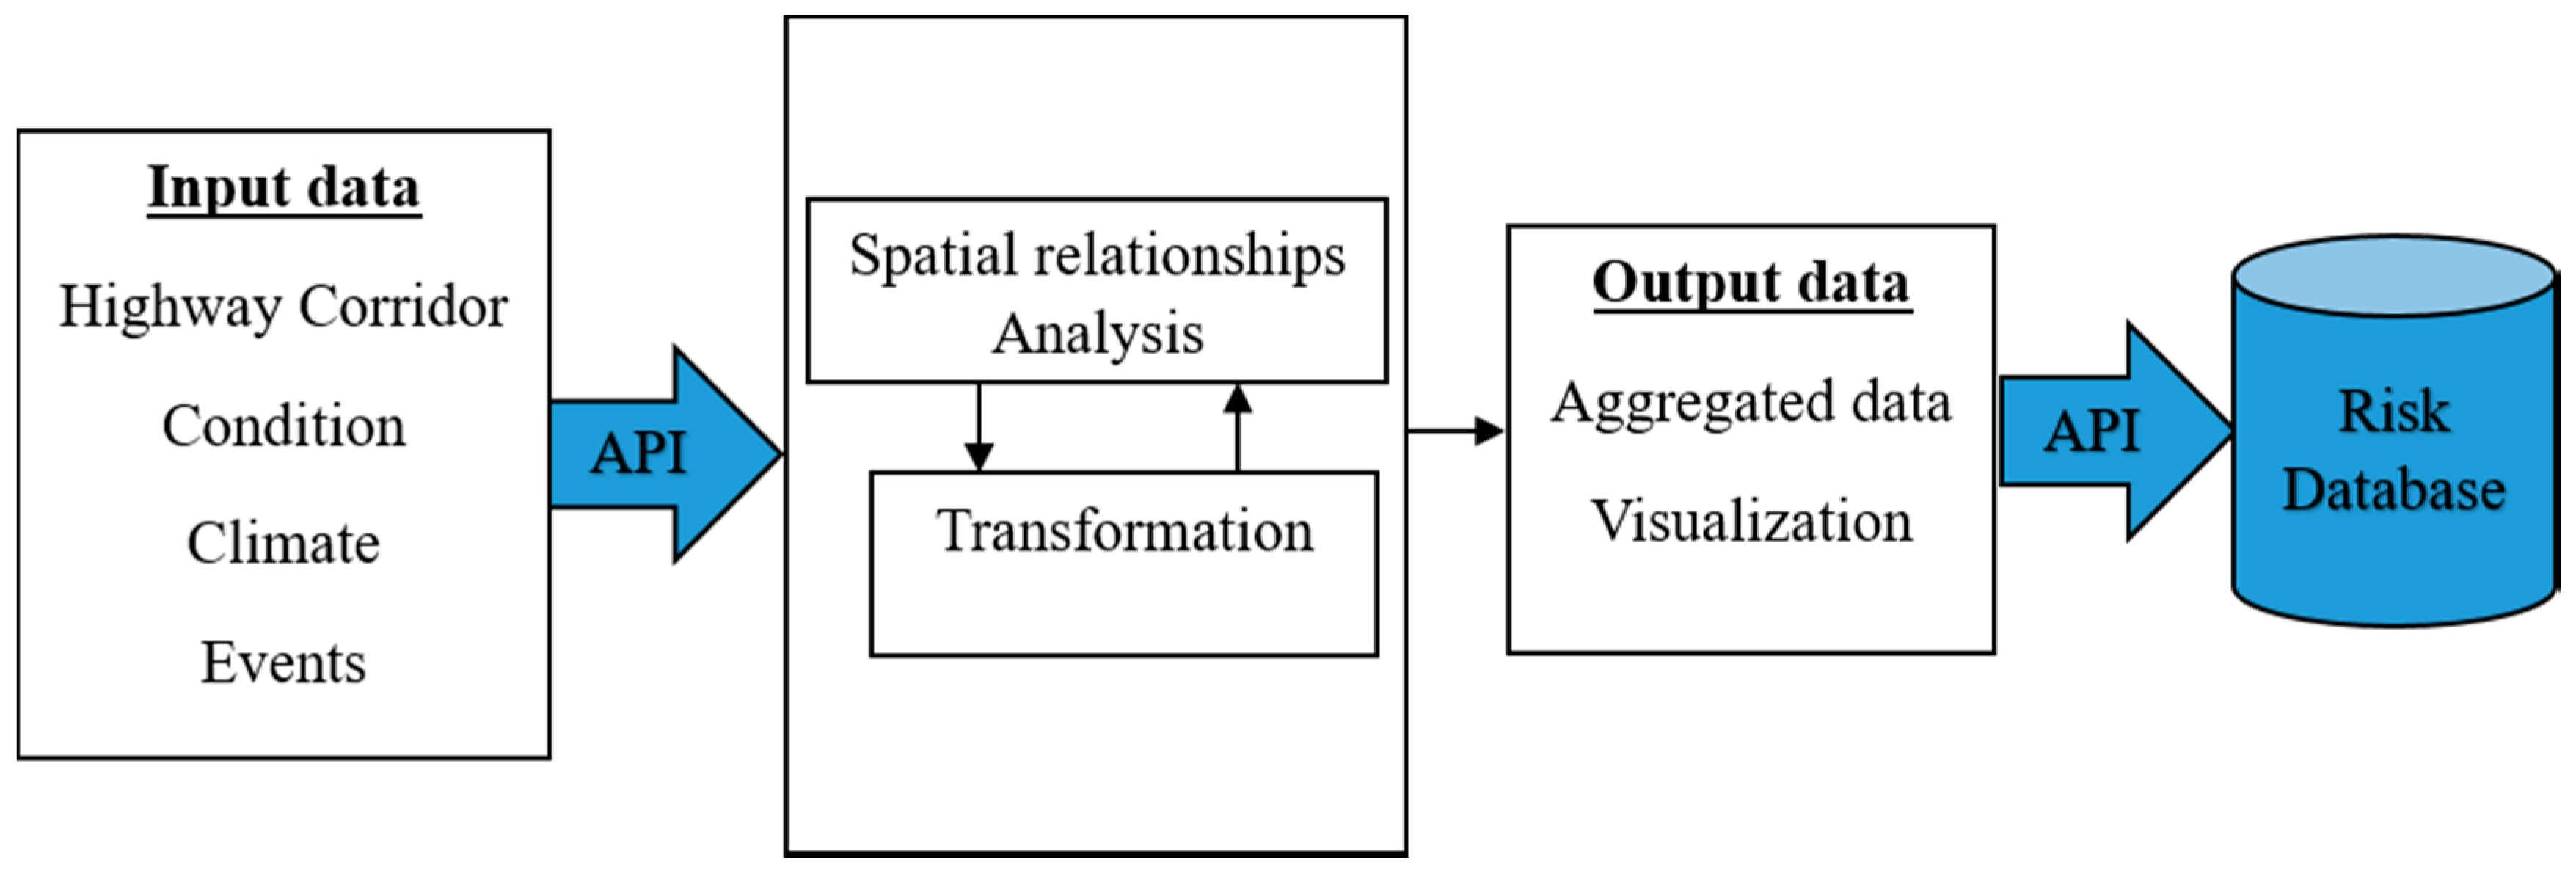
From Figure 4, the input data are usually disparate data entities. While a GIS application can integrate these data by virtue of their spatial location, it employs a tightly coupled system architecture which implies that the input must be predefined. However, these input data, especially for a risk management database, can come from sources outside of the agency or could be legacy systems within the state DOT that would require a fair amount of data pre-processing before it can be input into the GIS application. This data pre-processing is where the non-spatial data integration comes in to arrange the data into a format that can be consumed by the GIS application with the desired outcomes. In a technical sense, this is the functionality of an application programming interface, API. APIs are employed in software engineering to define permissible inputs, outputs, and controls. It is basically a set of specifications that define how disparate elements can communicate with each other [36,37]. In this risk database implementation, the API is used to prepare inputs into the GIS module as well as to package the output for integration with other analytical tools for knowledge discovery to support the decision-making. Hence, Figure 4 becomes modified by the addition of the API to result in Figure 5. The inclusion of the API enables the overall application to be packaged into an extensible single standalone program with plugin for other analytical tools or third-party visualization package. In addition, it minimizes the learning curve for state DOT risk manager by hiding all the complex programming using the API. In addition to minimizing the learning curve, it also allows for easy updates and the addition of new functionalities.
6. The Risk Database
The risk database is populated by the following information, as discussed in [14]:
- Risk Identification Number: ties all corridors with the same risk as well as tracking risk dependencies;
- Brief explanation of the risk;
- Asset inventory: number and type of assets on the corridor;
- Condition of assets based on agreed upon performance measures;
- Environmental-level data: physical attributes, proximity to watershed, geographic properties, soil type, etc.;
- Socio-economic indicators: population, land use, traffic volume;
- Probability value: probability or likelihood of the risk occurring, estimated during the risk calculation stage of the data integration framework;
- Risk measures: based on the elicitation stage and determined during the risk calculation stage;
- Impact measure: impact of the risk in monetary terms value determined during the risk calculation stage;
- Area of impact: estimated as a function of the geographic area as well as the socio-economic markers near the corridor;
- Severity of the risk event: function of the area of impact;
- Ranking of each individual risk within the corridor: Ranked risks are those with a high severity and high consequence within the corridor;
- Total risk on the corridor: weighted sum of all the risks in the corridor;
- Risk monitor: indicates if the risk has increased, remained the same or decreased in severity since last available data collection;
- Risk owner: which agency is responsible for the risk;
- Risk mitigation plans: based on risk management and data elicitation workshop;
- Risk status: indicates whether the risk is active or whether it has been mitigated;
- Risk potential: indicates whether the risk can lead to other risk and the potential for a cascade effect;
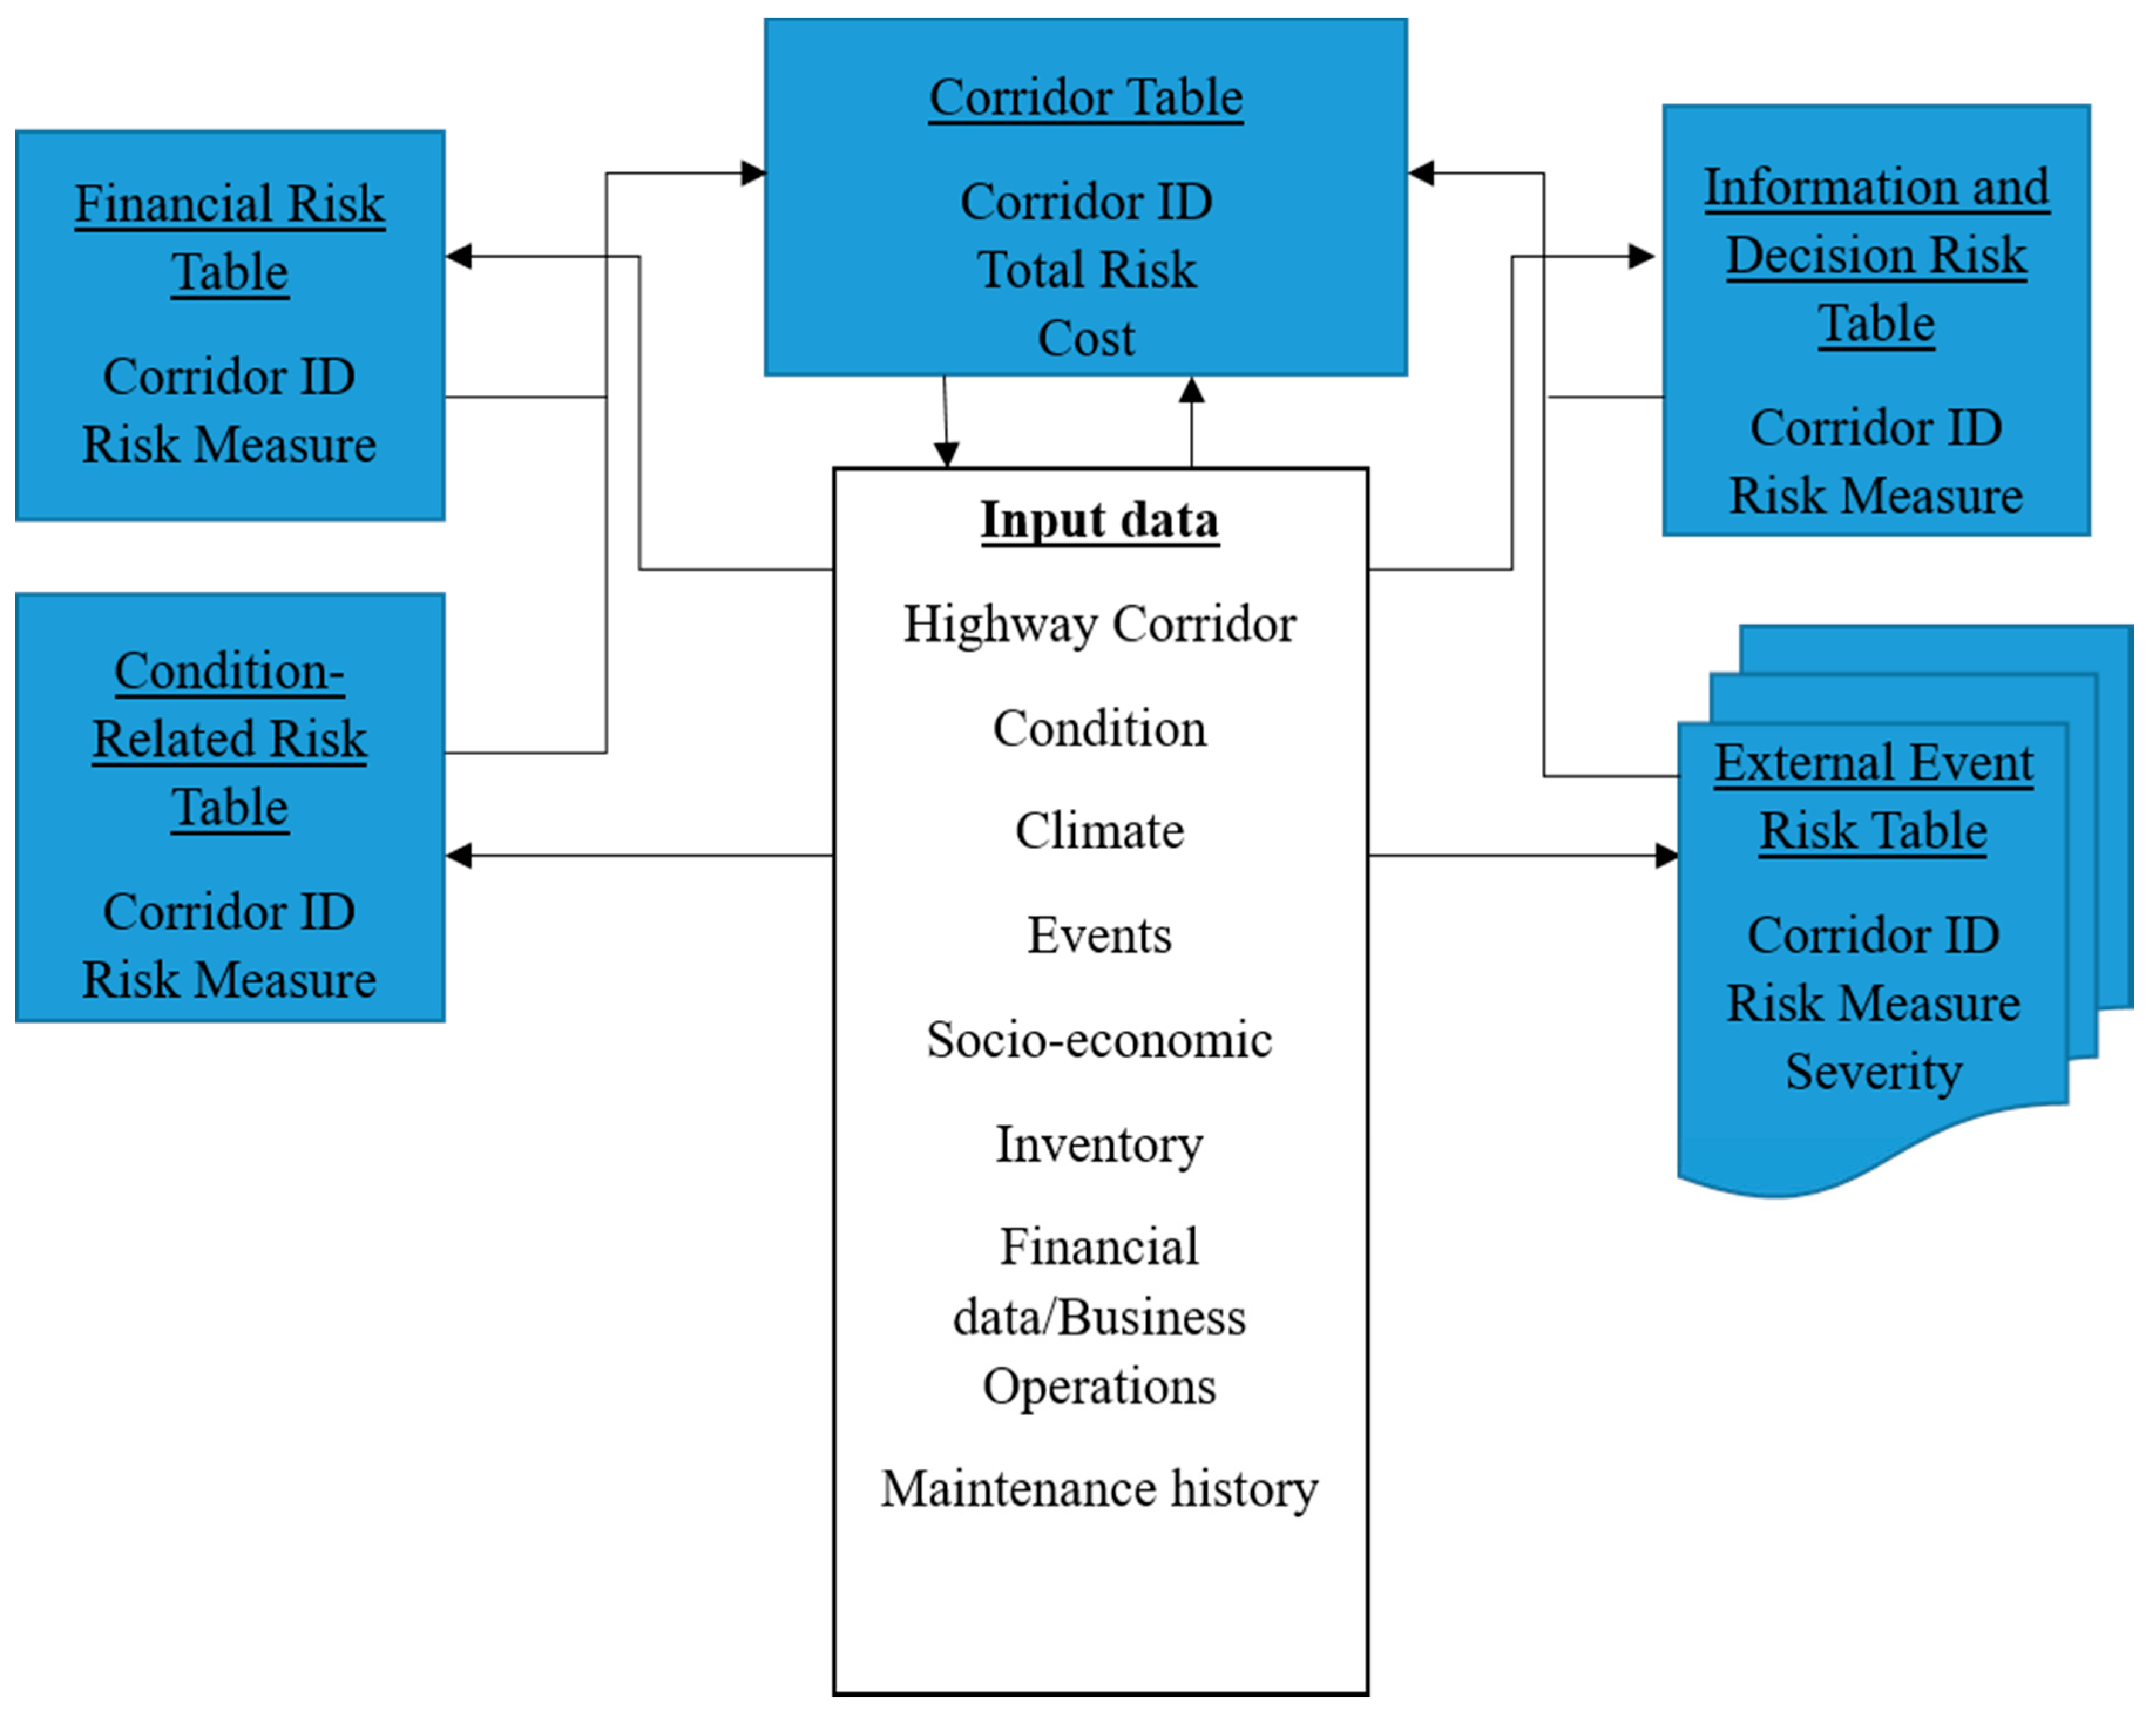
These are spread out over several database tables as shown in Figure 6. The number of database tables depends on how many external events that the state DOT identifies in its risk elicitation process. Each table is populated following the results of the spatial integration and can be populated by data from various input sources. For example, the financial risk table is populated from the highway corridor inventory data, as well as the financial/business operations data. The role of the API in Figure 5 is to map each table with the relevant fields from the aggregated data.
Figure 7 shows a flowchart of how an agency can implement the proposed database integration framework. It begins from a very collaborative workshop whose main goal is to synthesize the risk events, assets, and data needs to be aggregated and how to measure the risk impacts using the identified data as well as the granularity level of the analysis that the agency desires to drive its decision-making.
6.1. Risk Management Data Implementation
A demonstration of the risk management database integration framework is implemented using Iowa data on its pavement management program as well as supplementary data. Iowa was chosen based on the accessibility and availability of data that could be used to develop a realistic demonstration of the capabilities.
From the NCHRP 800 Report, “the Iowa DOT has an active and mature GIS program and is well placed to leverage a variety of data sources” [8] that can be used for asset management decision support. The department collects and maintains geospatial data sets that can provide additional information that can be tapped for a rich risk management database. Available pavement data include condition data, international roughness index (IRI), rutting, friction, cracking, faulting, and material tests for specific projects. Other available data include traffic, economic drivers, land use, and weather information.
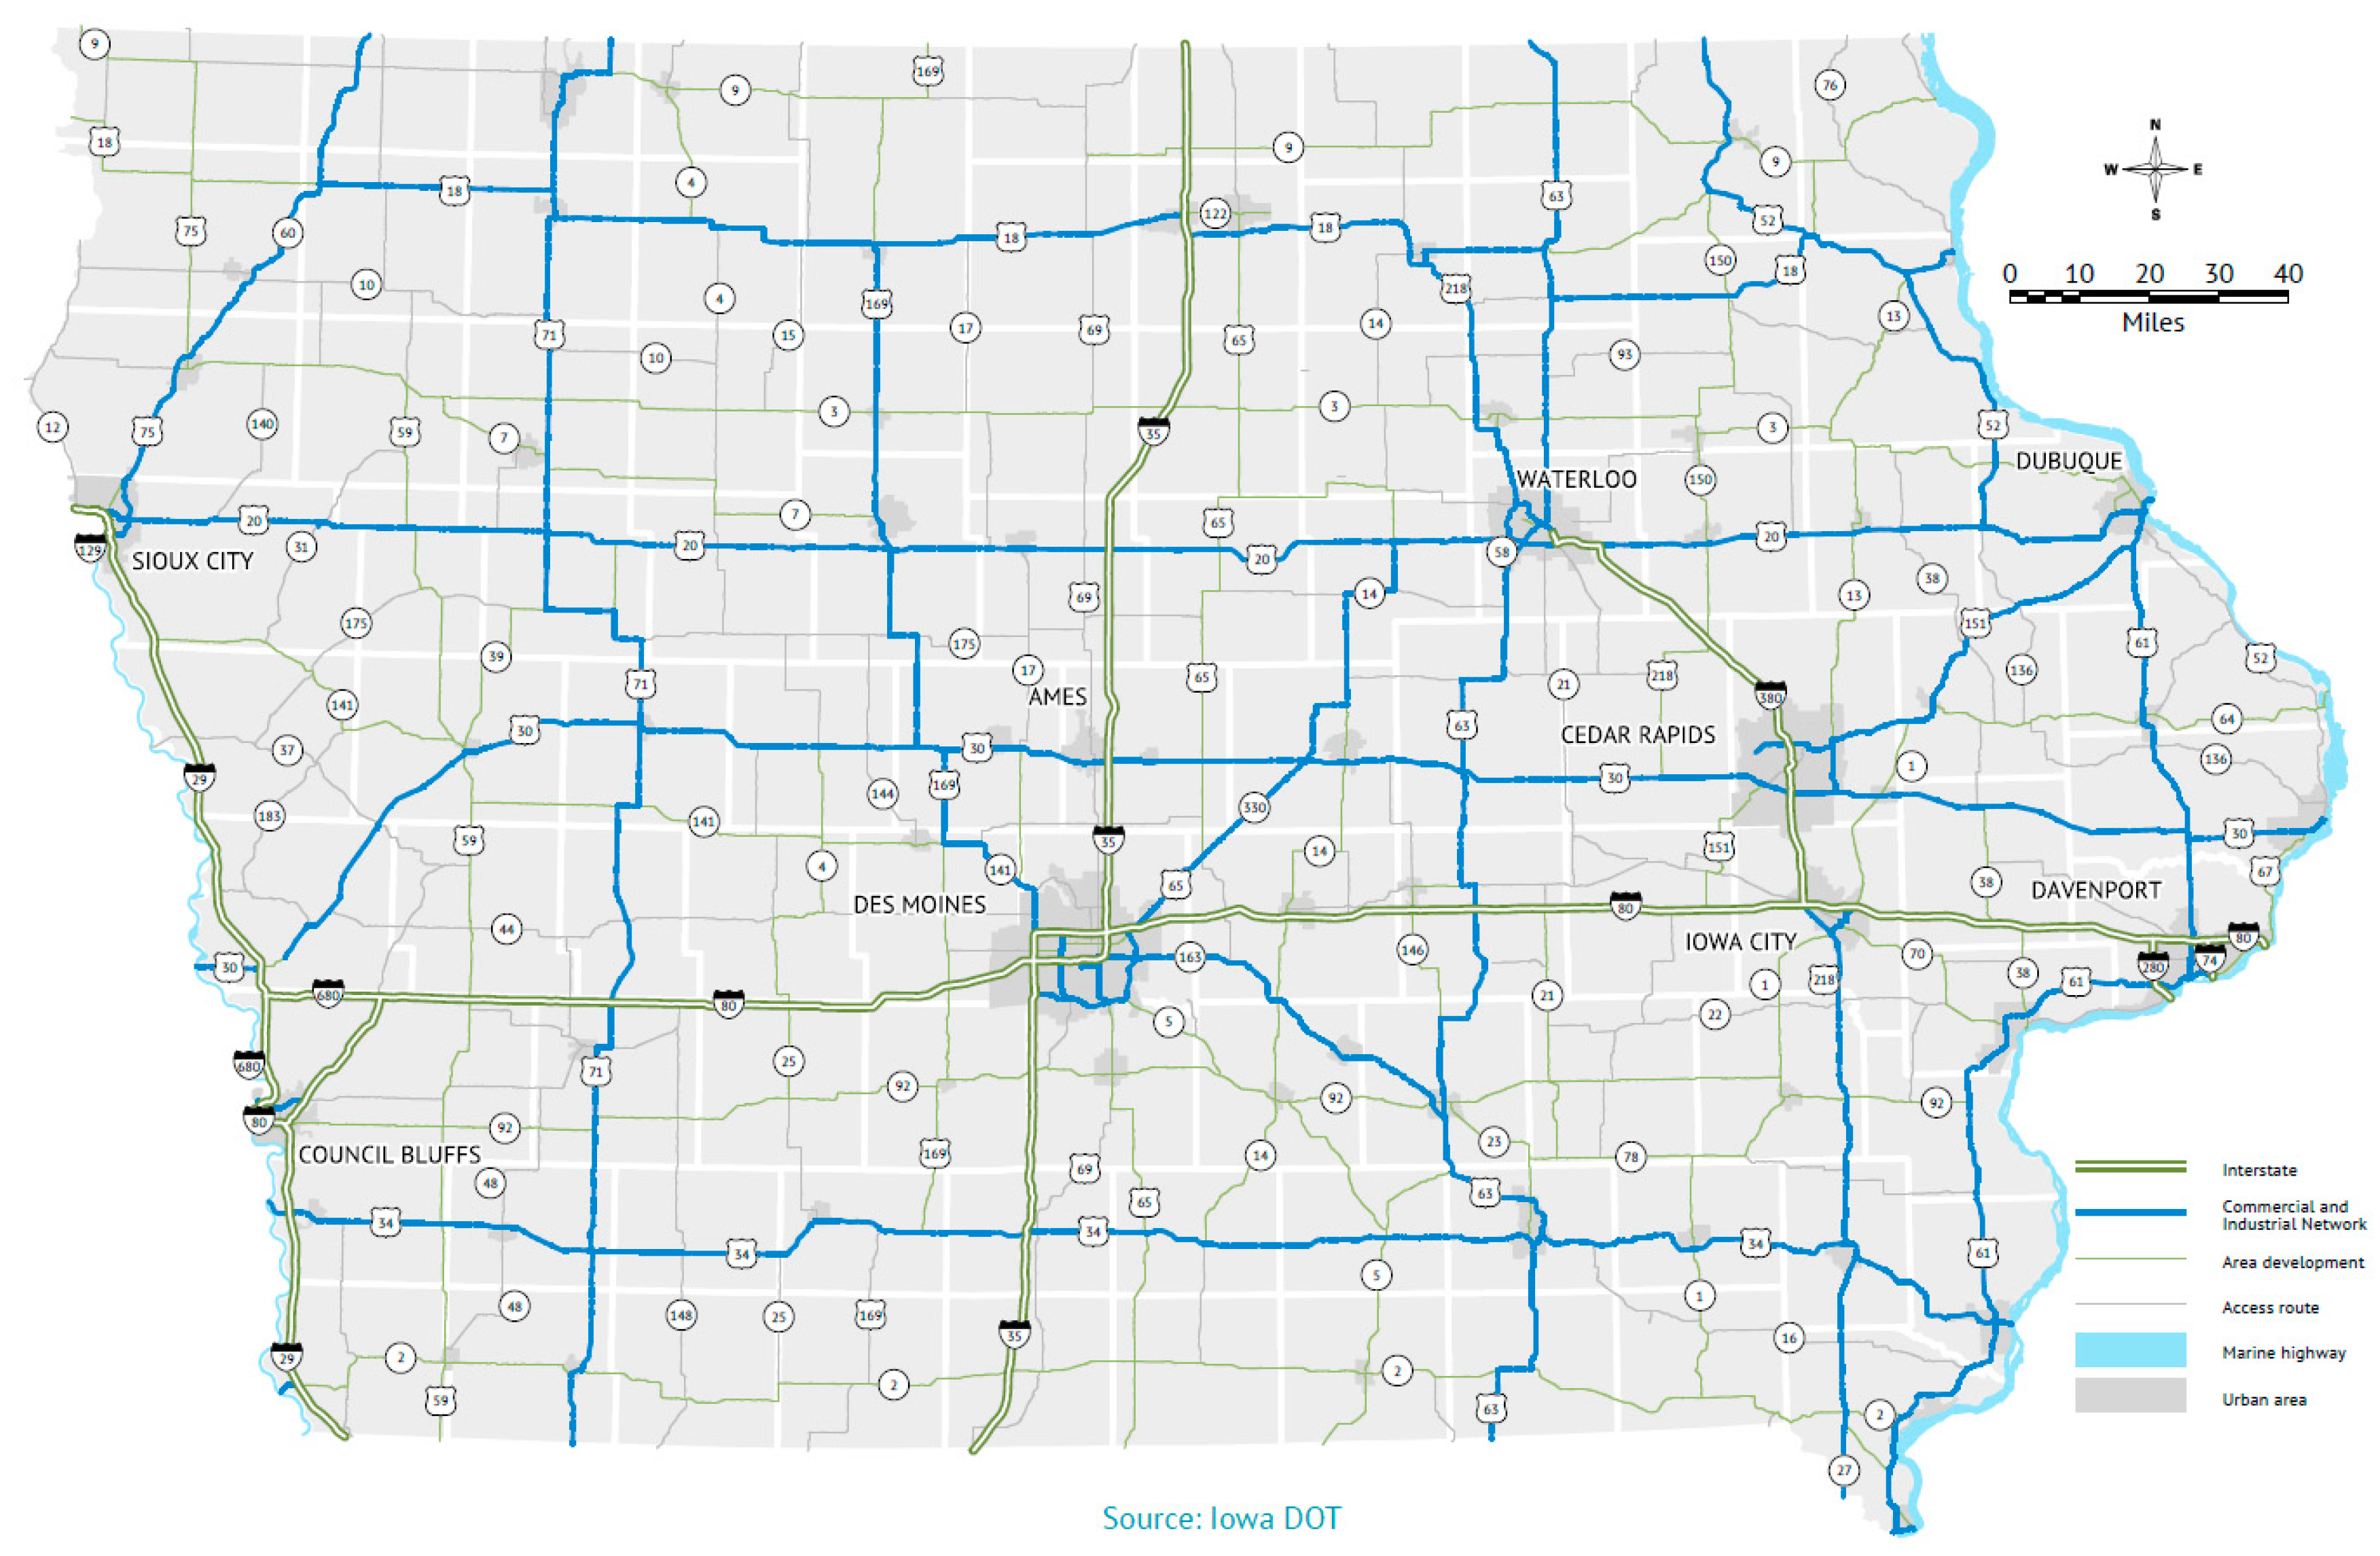
While the network level information is aggregated to planning corridors as shown in Figure 8 from the Planning Division, the demonstration illustrates the use of GIS to integrate network- and project-level data that have been identified via the risk identification process to be relevant to the risk management process to produce a risk management database to support trend analysis and pattern detection—and communicate results of these analyses in order to identify an appropriate mitigation response.
6.2. Methods and Materials
The data integration framework for populating the risk management database is implemented using two applications—namely, Feature Manipulation Engine (FME) and the ESRI suite of geospatial tools.
6.2.1. Feature Manipulation Engine
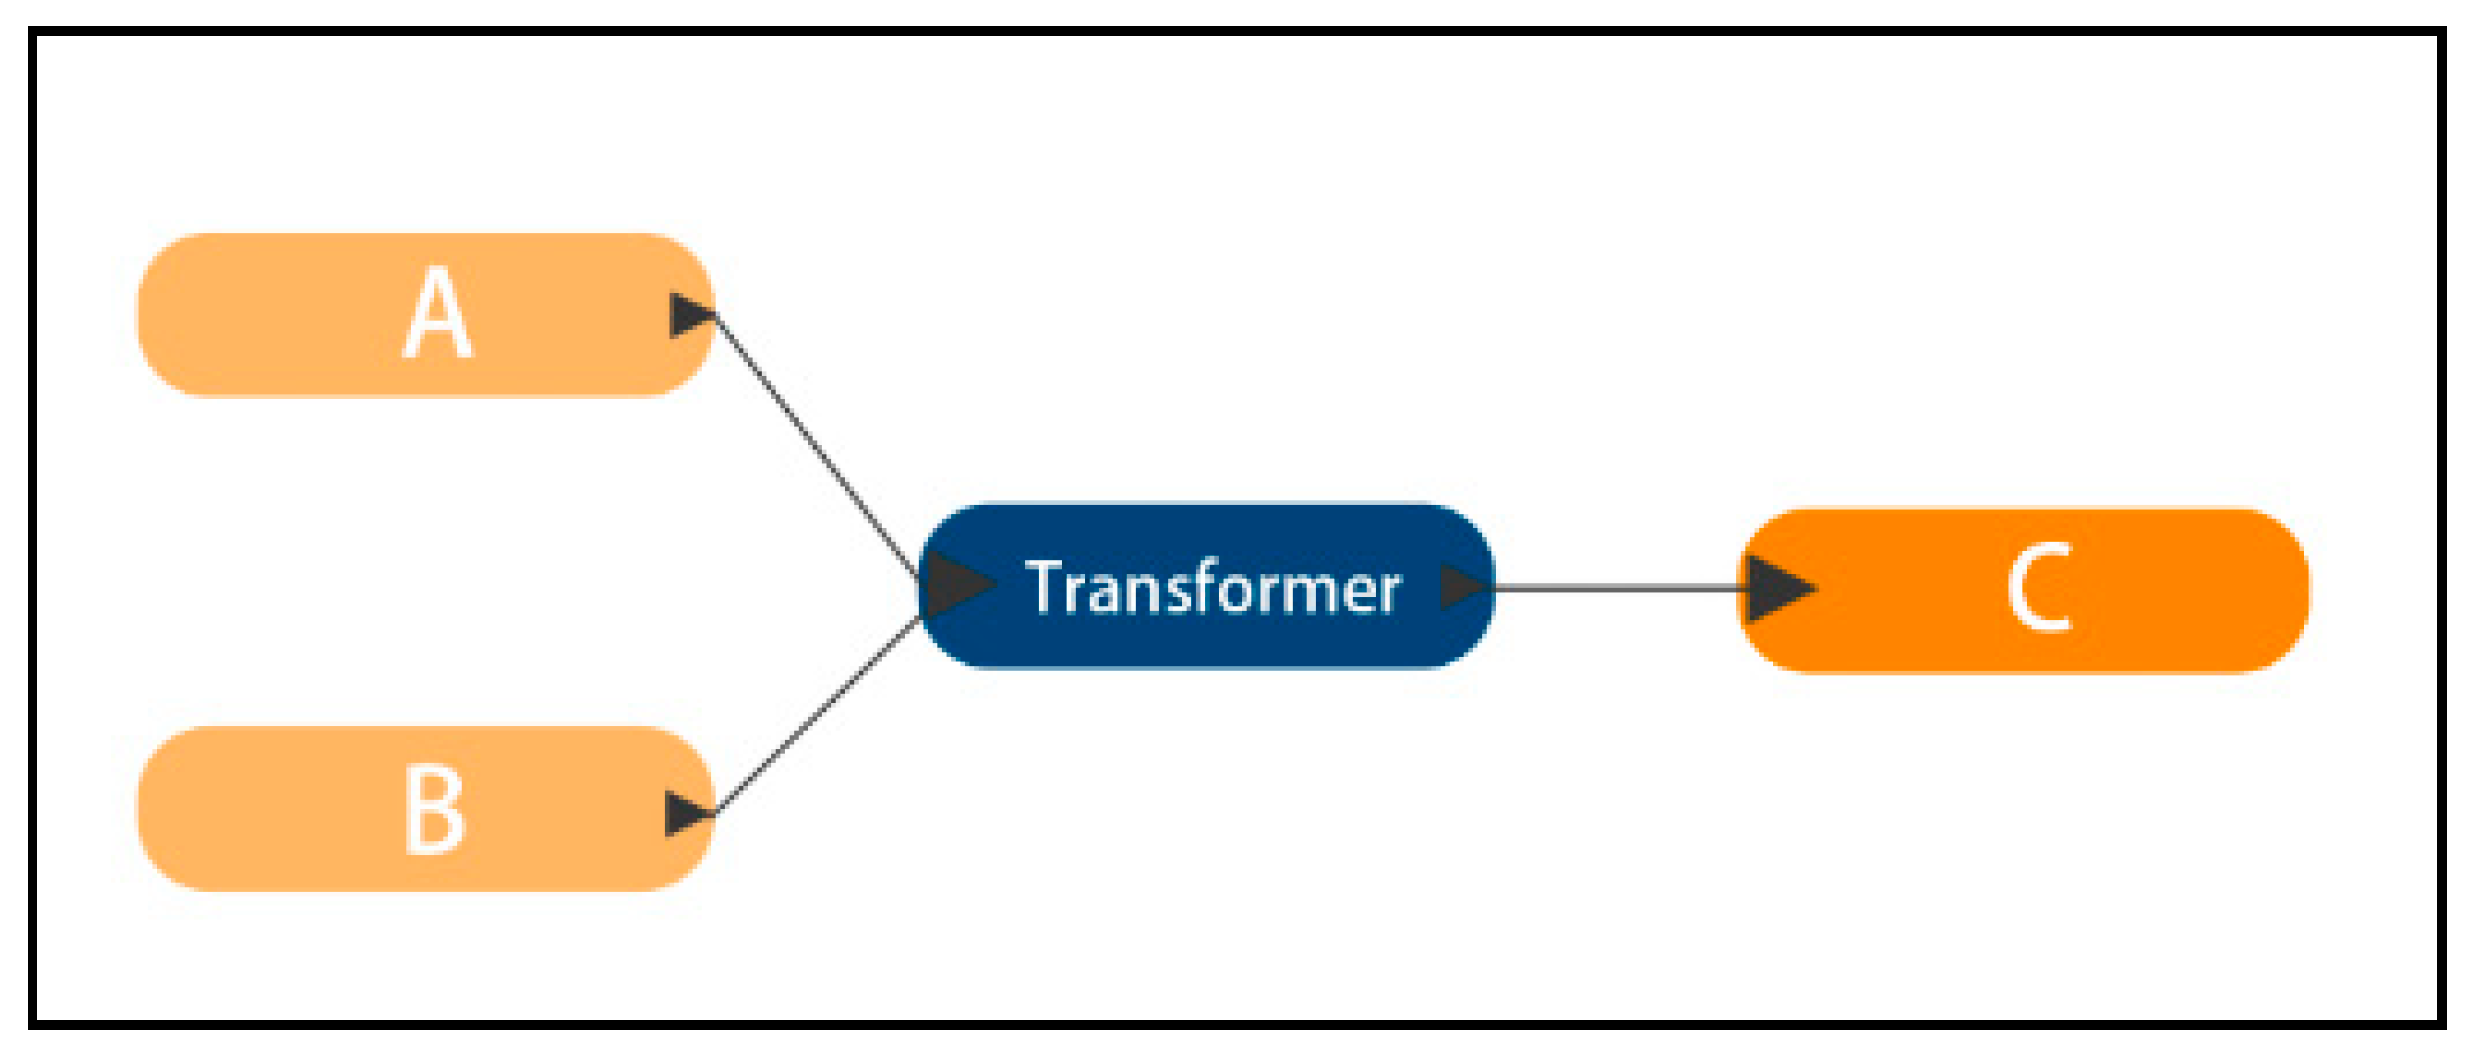
The Feature Manipulation Engine (FME) is a proprietary product from Safe Software. FME is a data integration and transformation tool for automating data processing workflows. It is the engine responsible for the spatial integration component. It can read and transform data from various popular formats. In addition, even though coding is not required to build the processes, it provides the ability to write programs using Python and R to extend the functionality of the workflow. This is very important, as it provides the option of designing the API using inbuilt functionality or using the programming language support to design an efficient process for the API to communicate with the spatial integration module. As a result, FME makes cross-platform development simpler with the availability of programming using Python, while allowing developers to create seamless user experiences for the end-users. In addition, it enables declarative data fetching where a client can specify exactly what data it needs from an API. As a result, the API allows for fine-grained insights about the data that is requested on the backend. As each client specifies exactly what information it is interested in, it is possible to gain a deep understanding of how the available data is being used. This can help in evolving an API and deprecating specific fields that are no longer used. Figure 9 shows a generic workflow of how the FME works. In the example, it reads data from two sources, A and B, and integrates the data into one dataset C via built-in or customized transformation tools appropriate for the data sources and the desired outcomes.
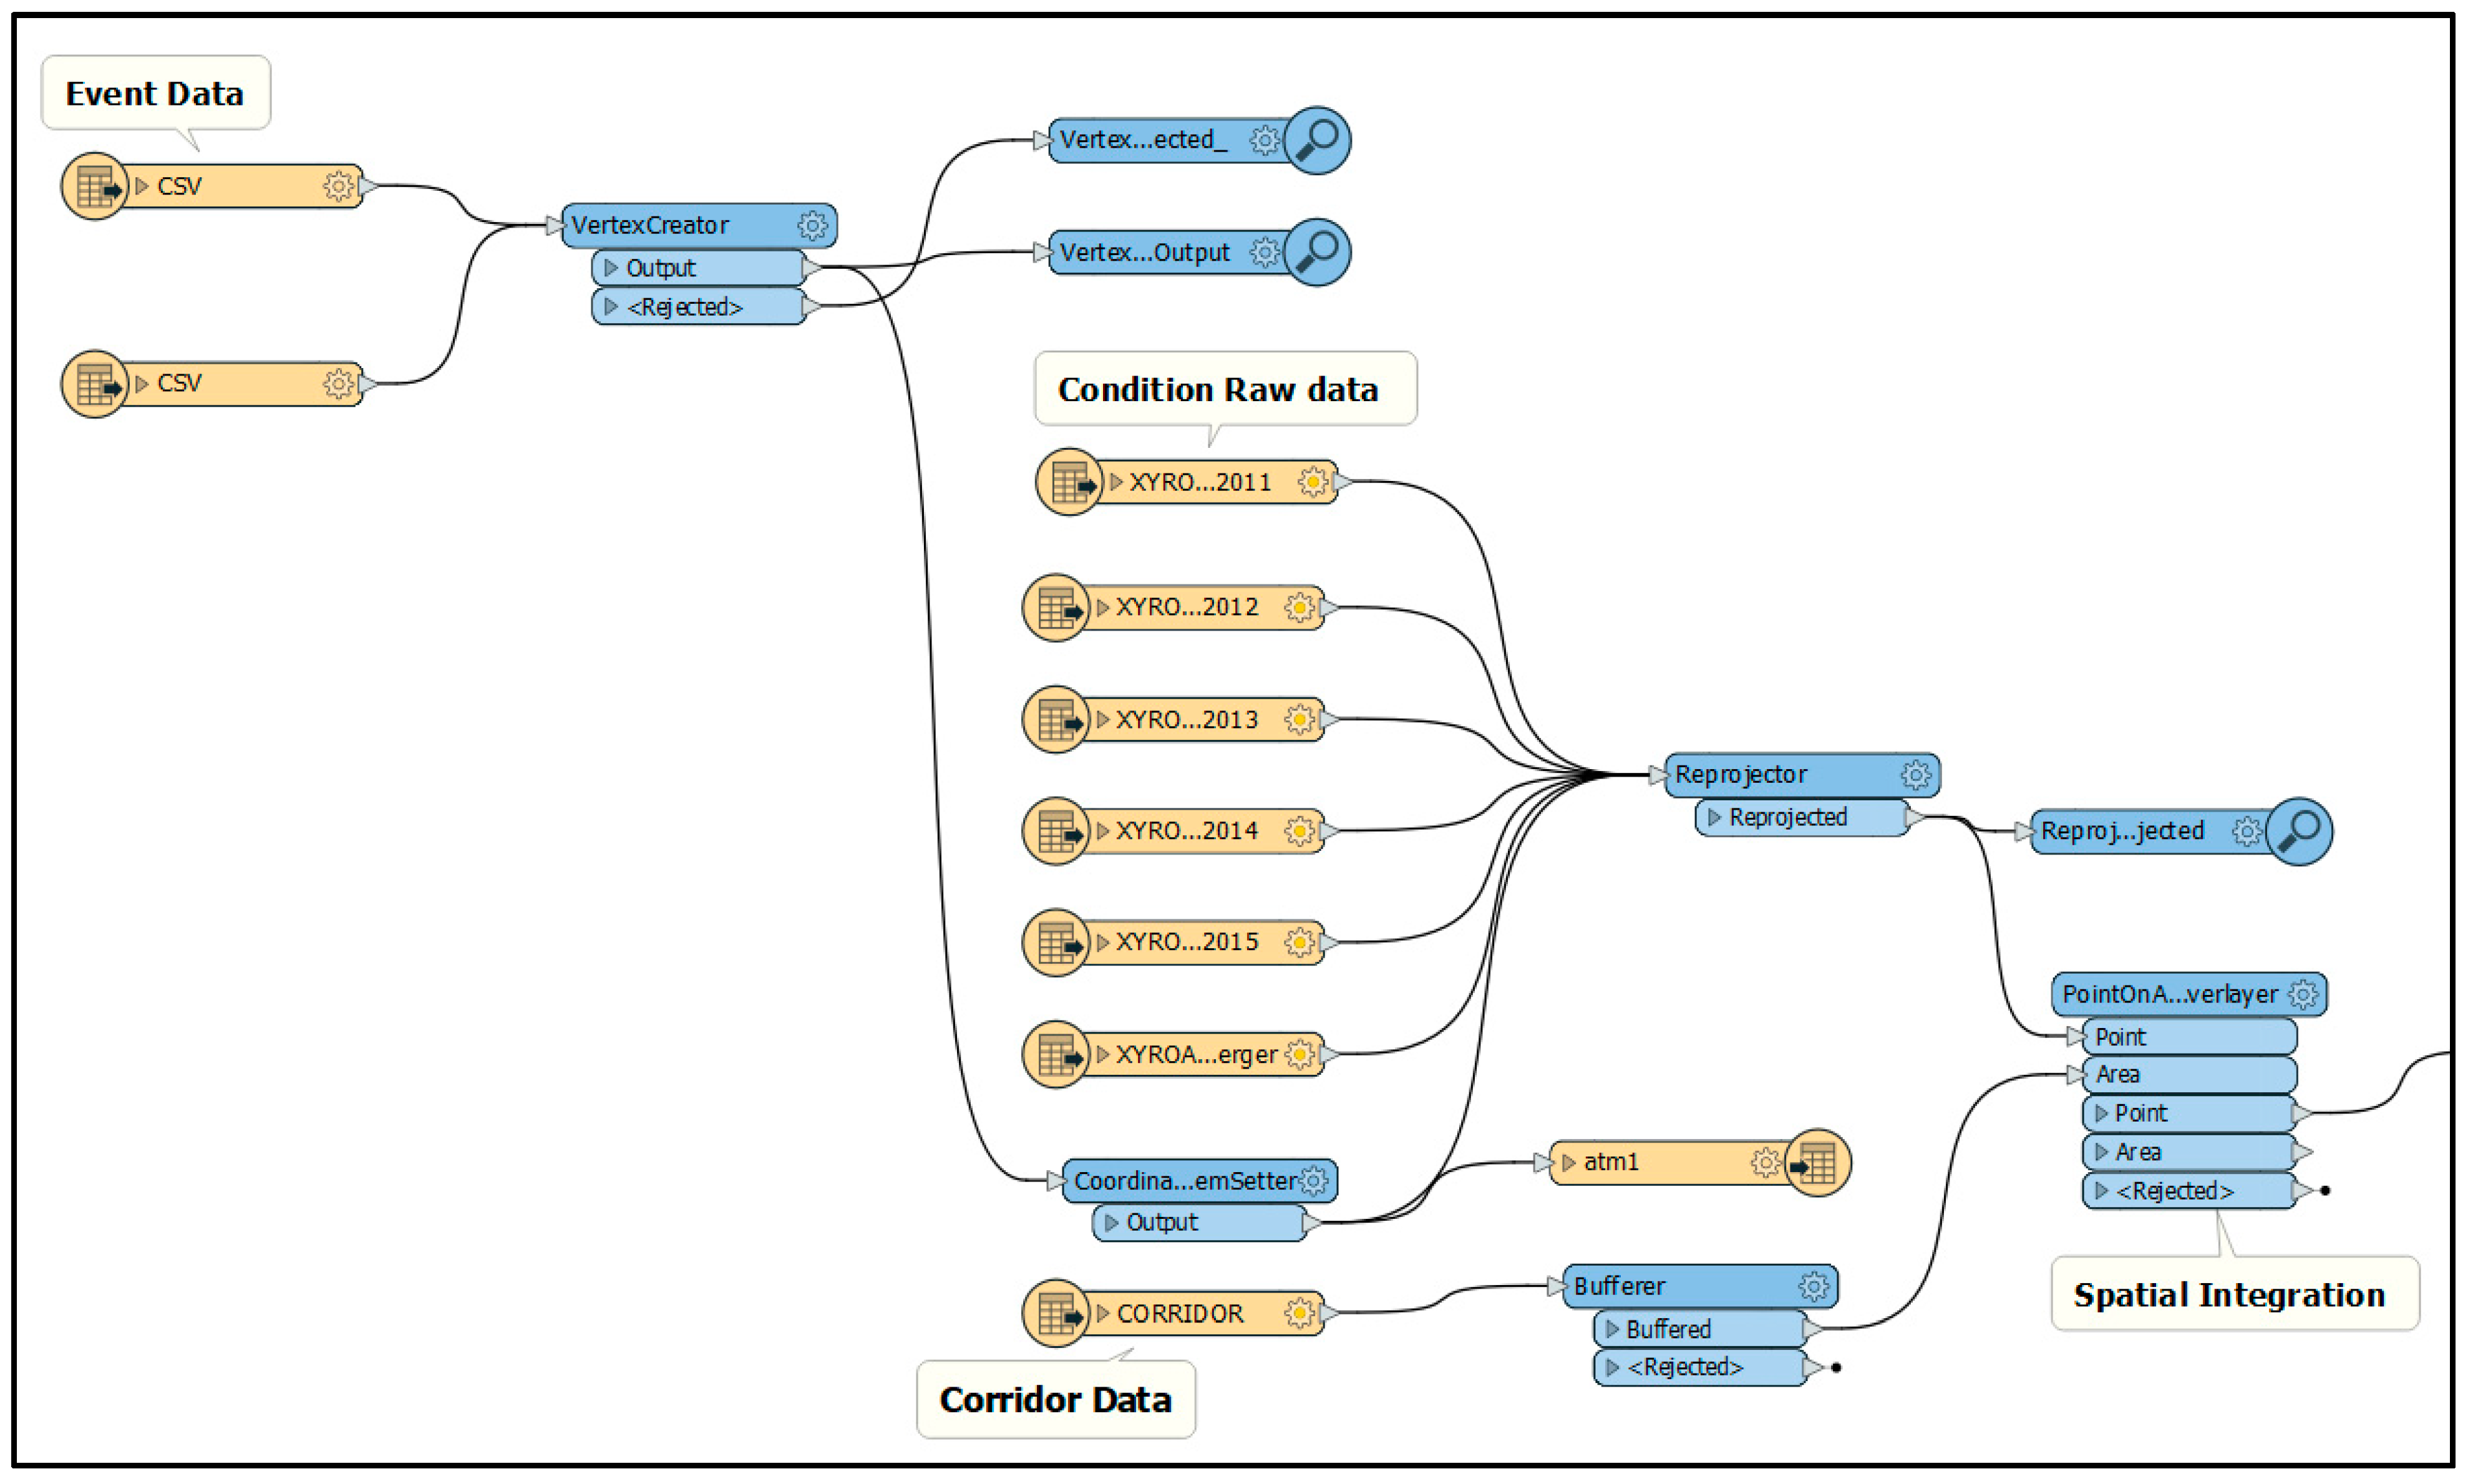
In this implementation, the FME is used as the API as it allows different data formats and sources to be consumed on the same platform. Figure 10 is an example of the API design workflow that was implemented in FME. Most transportation agencies data are already geo-enabled as point, linear (line), or areal (polygon) data. Other data includes comma-delimited files (CSV), Extensible Markup Language (XML) formats, etc. These will need to be added geometry to facilitate aggregation to the study sites (corridors). The transformation nodes in Figure 10 are where the FME implements routines for extracting only the relevant information from the data sources. This improves efficiency, as the system is not bugged down with unnecessary data processing.
6.2.2. ESRI Tools
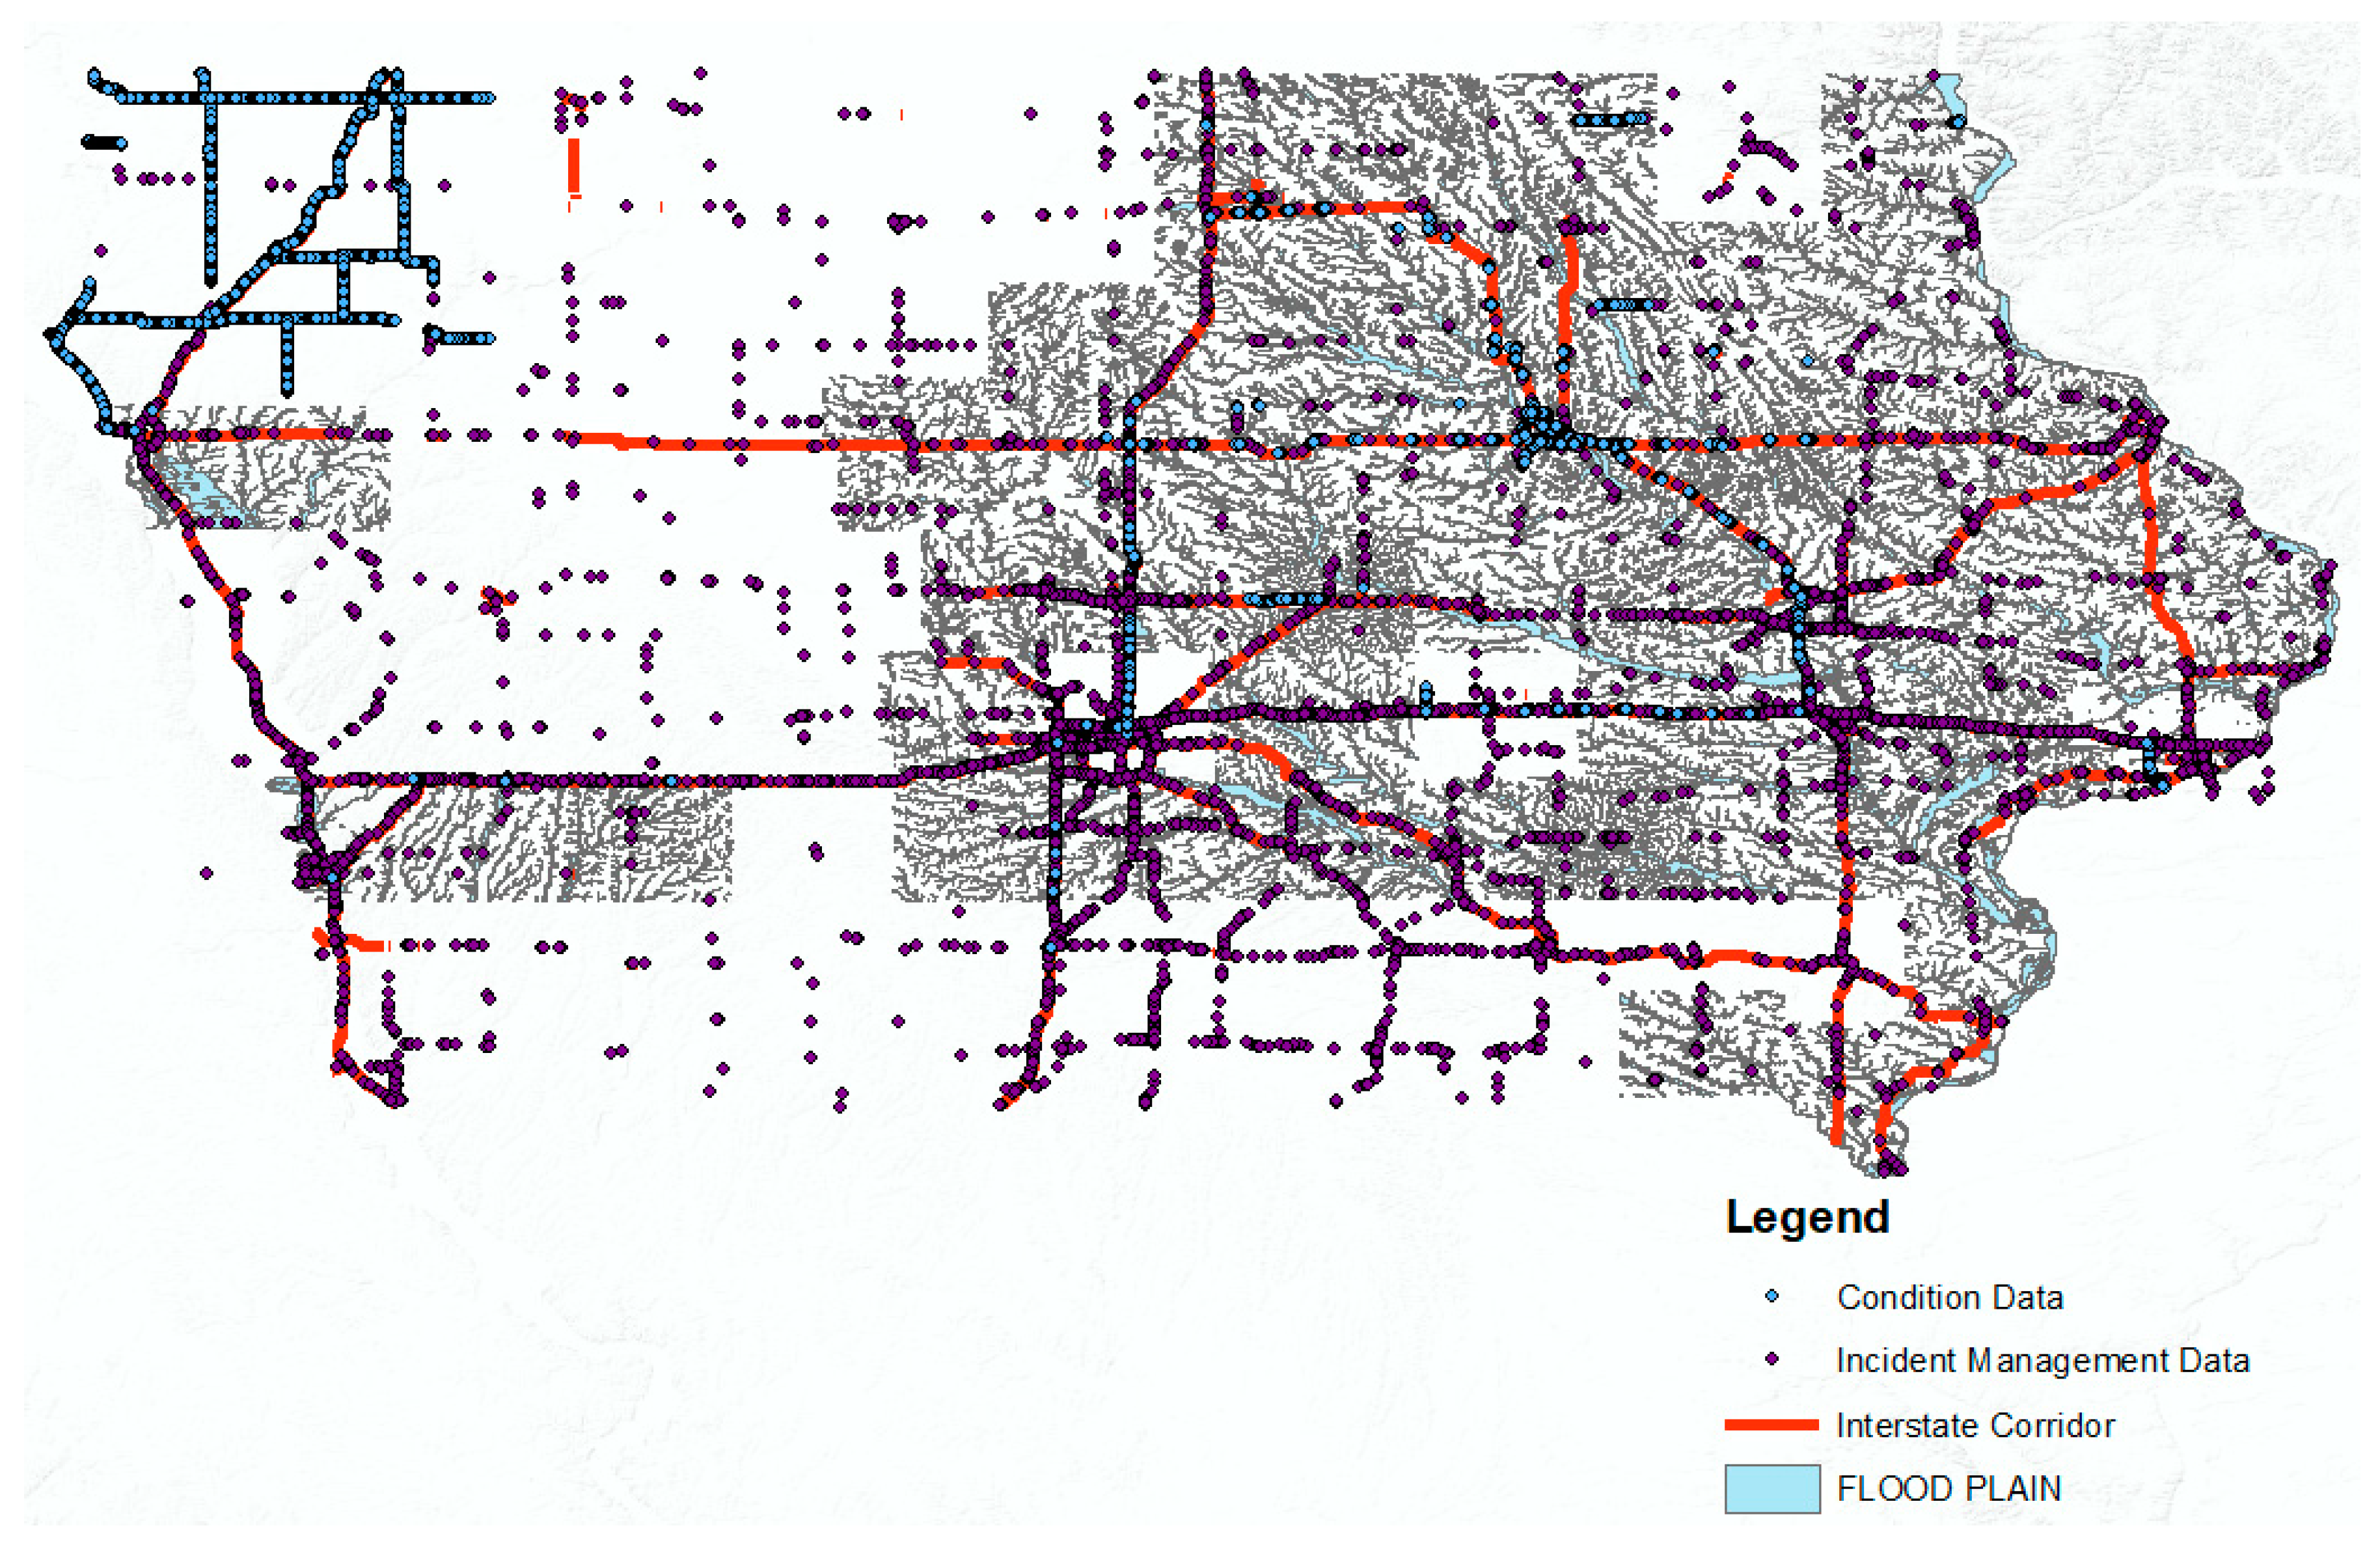
While the FME does provide a map display for visualization, it is not built for the robust visualization of spatial data, as it is intended to be used for transformation. Figure 11 shows the overlay of all the sample input data from the Iowa demonstration using ESRI’s ArcGIS Desktop®. ESRI is the most popular GIS vendor for state DOTs and most state DOTs have one or several of its desktop applications already in use. Like FME, it also comes with programmable GIS functionality for extending its application.
6.2.3. Data Processing
As with any data from disparate sources and collected for different applications, there is need for data cleaning to streamline the integration process. First and foremost, the data are checked for the data model and the metadata that will determine how the data extraction and integration API will be designed. In addition, missing data, incomplete records, or invalid data are evaluated as well as the coordinate system of data collection or archival. For example, point data such as events with latitude and longitude information will need to be re-projected to match the coordinate system of corridor features that have been integrated to ensure that the points are aggregated to the correct corridor.
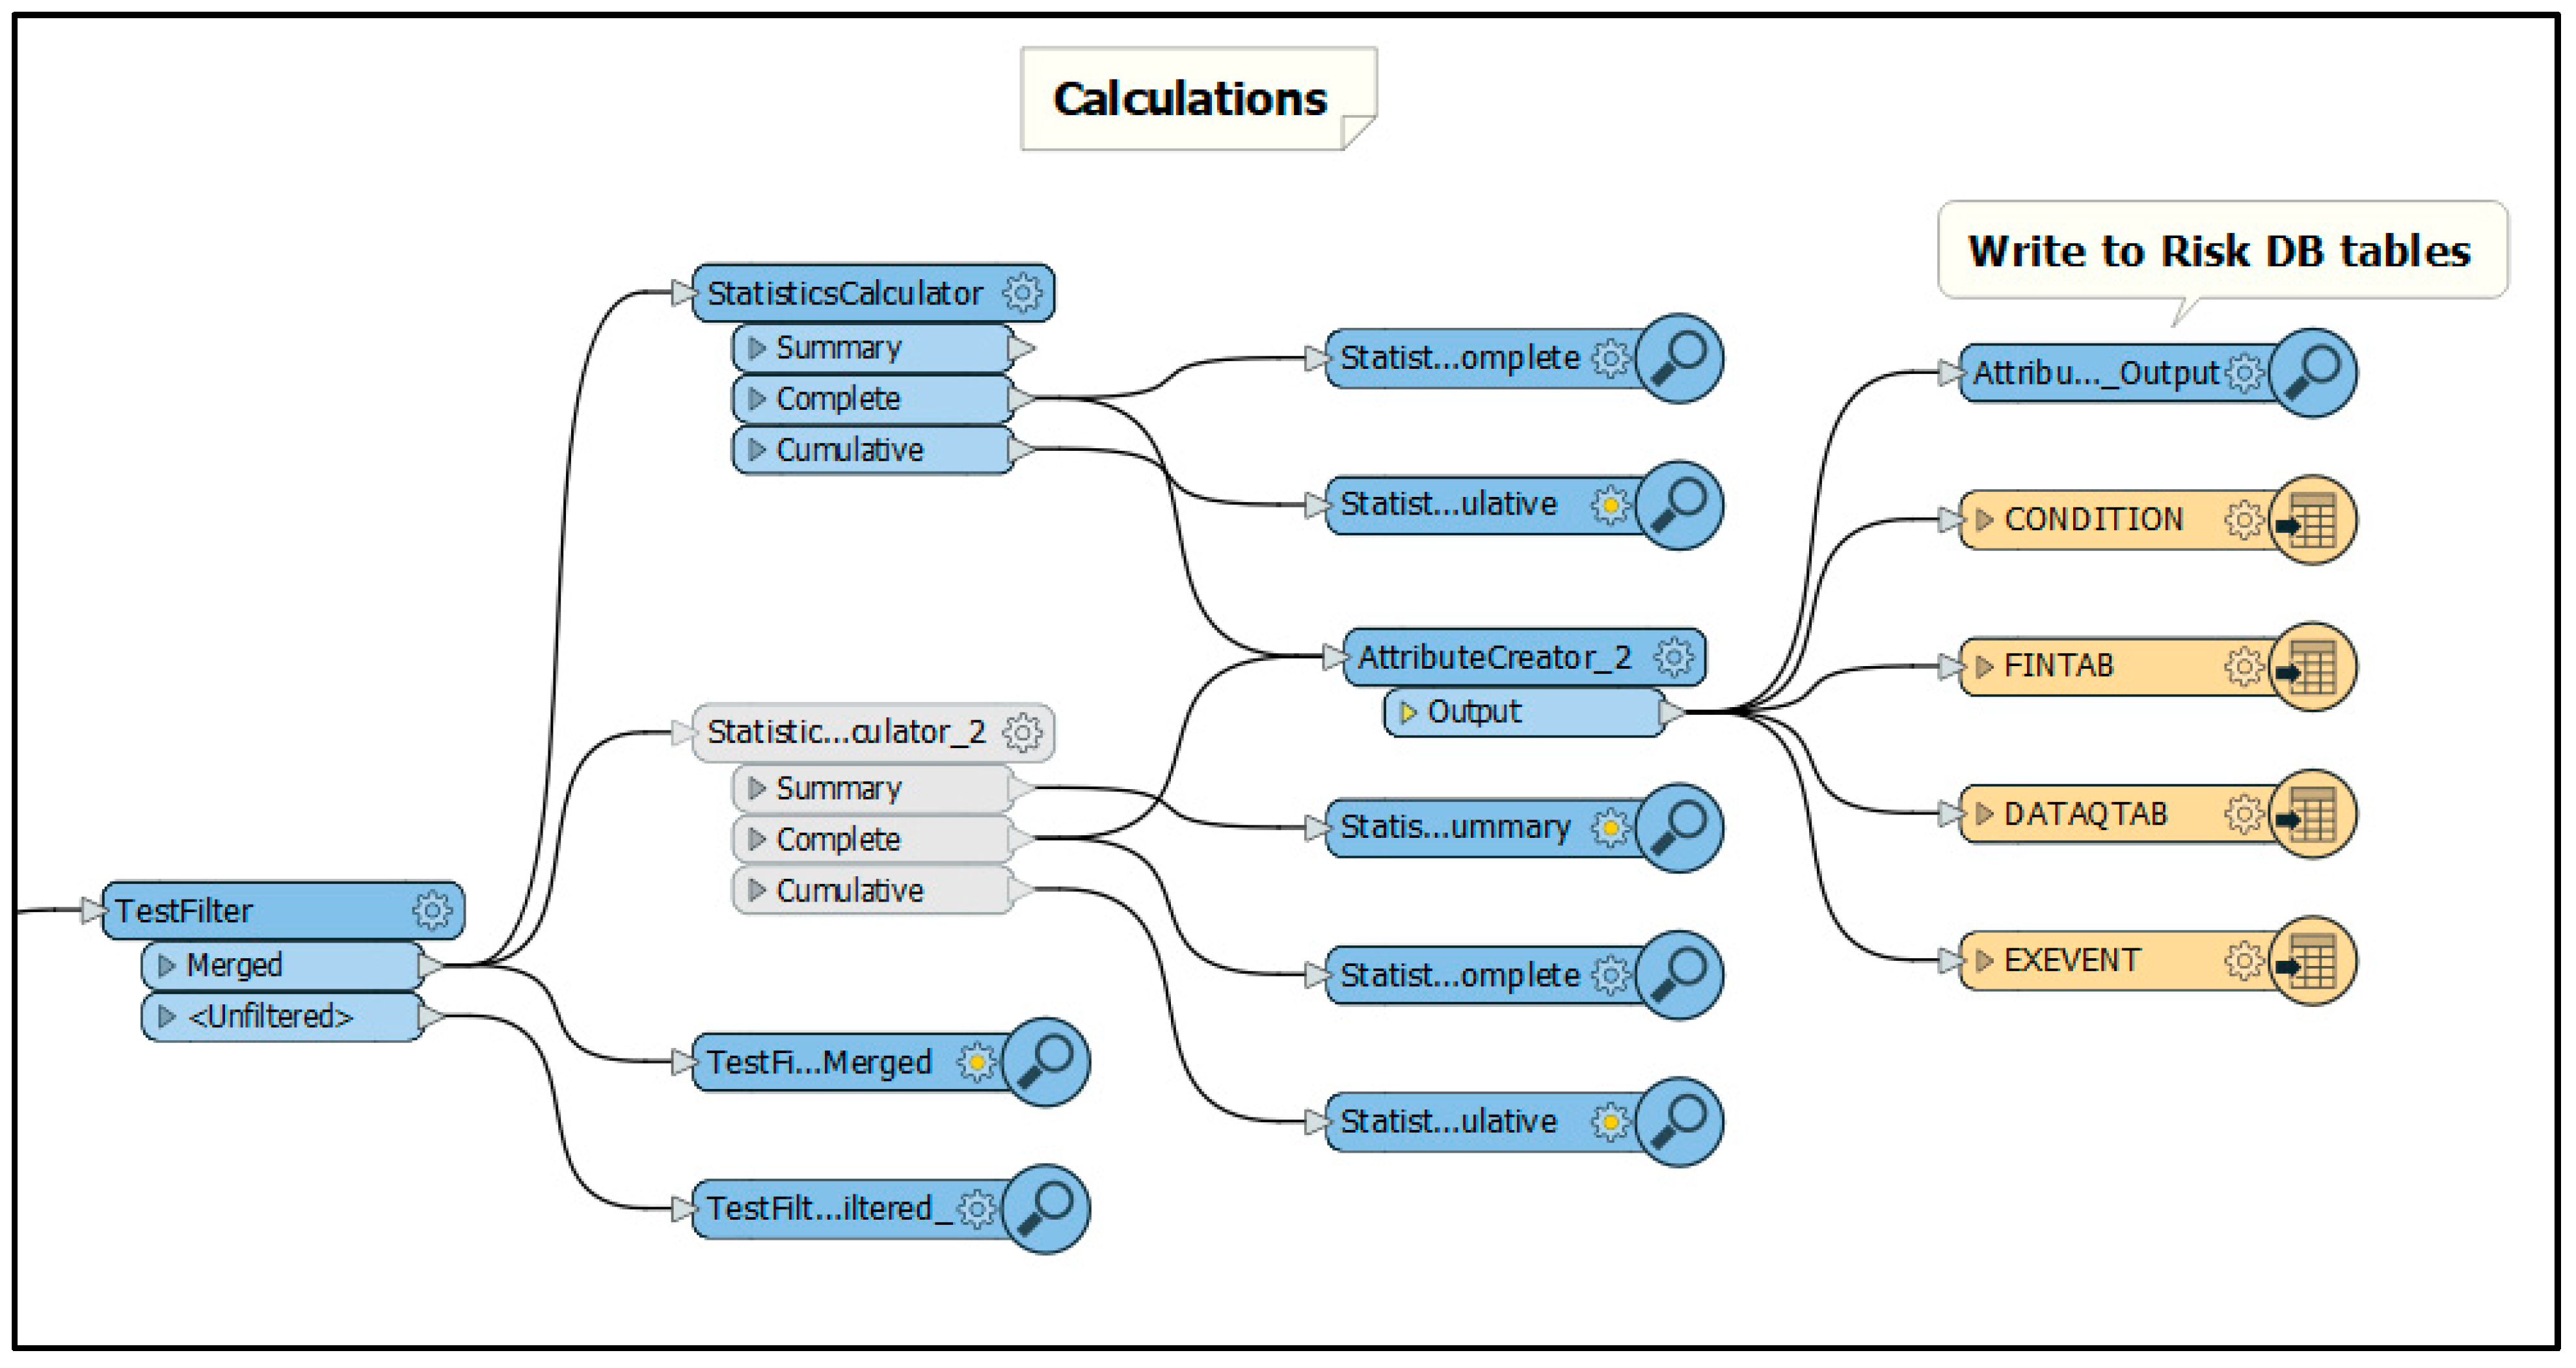
Figure 12 shows the workflow for the point data sources. The event data are archived using CSV files with latitude and longitude fields that are passed through the vertex creator to add geometry and are then re-projected to match the coordinate system of the corridor as shown. Additionally, the pavement condition data which are already in points are passed directly to be re-projected. Both streams of data are then integrated to the corridor by spatial assignment. There is a buffer application that ensures that whatever points that gets assigned to the corridor are within 20 m. The output of the spatial integration is passed through a filter that enables further quality control/quality assurance to ensure the integrity of the process as shown in Figure 13. In Figure 13, data passing the filter are then summarized by corridor and then the risk database tables are populated accordingly.
Not all data sources are point data; some are area data, such as the weather information from the Iowa Mesonet [38] that breaks the state into geographic grids, and climate data are aggregated to these grids. The same overall process, as shown in Figure 12 and Figure 13, will still apply to their integration with the corridor but with a different spatial assignment protocol that takes into account the areal characteristics.
6.3. Decision-Making
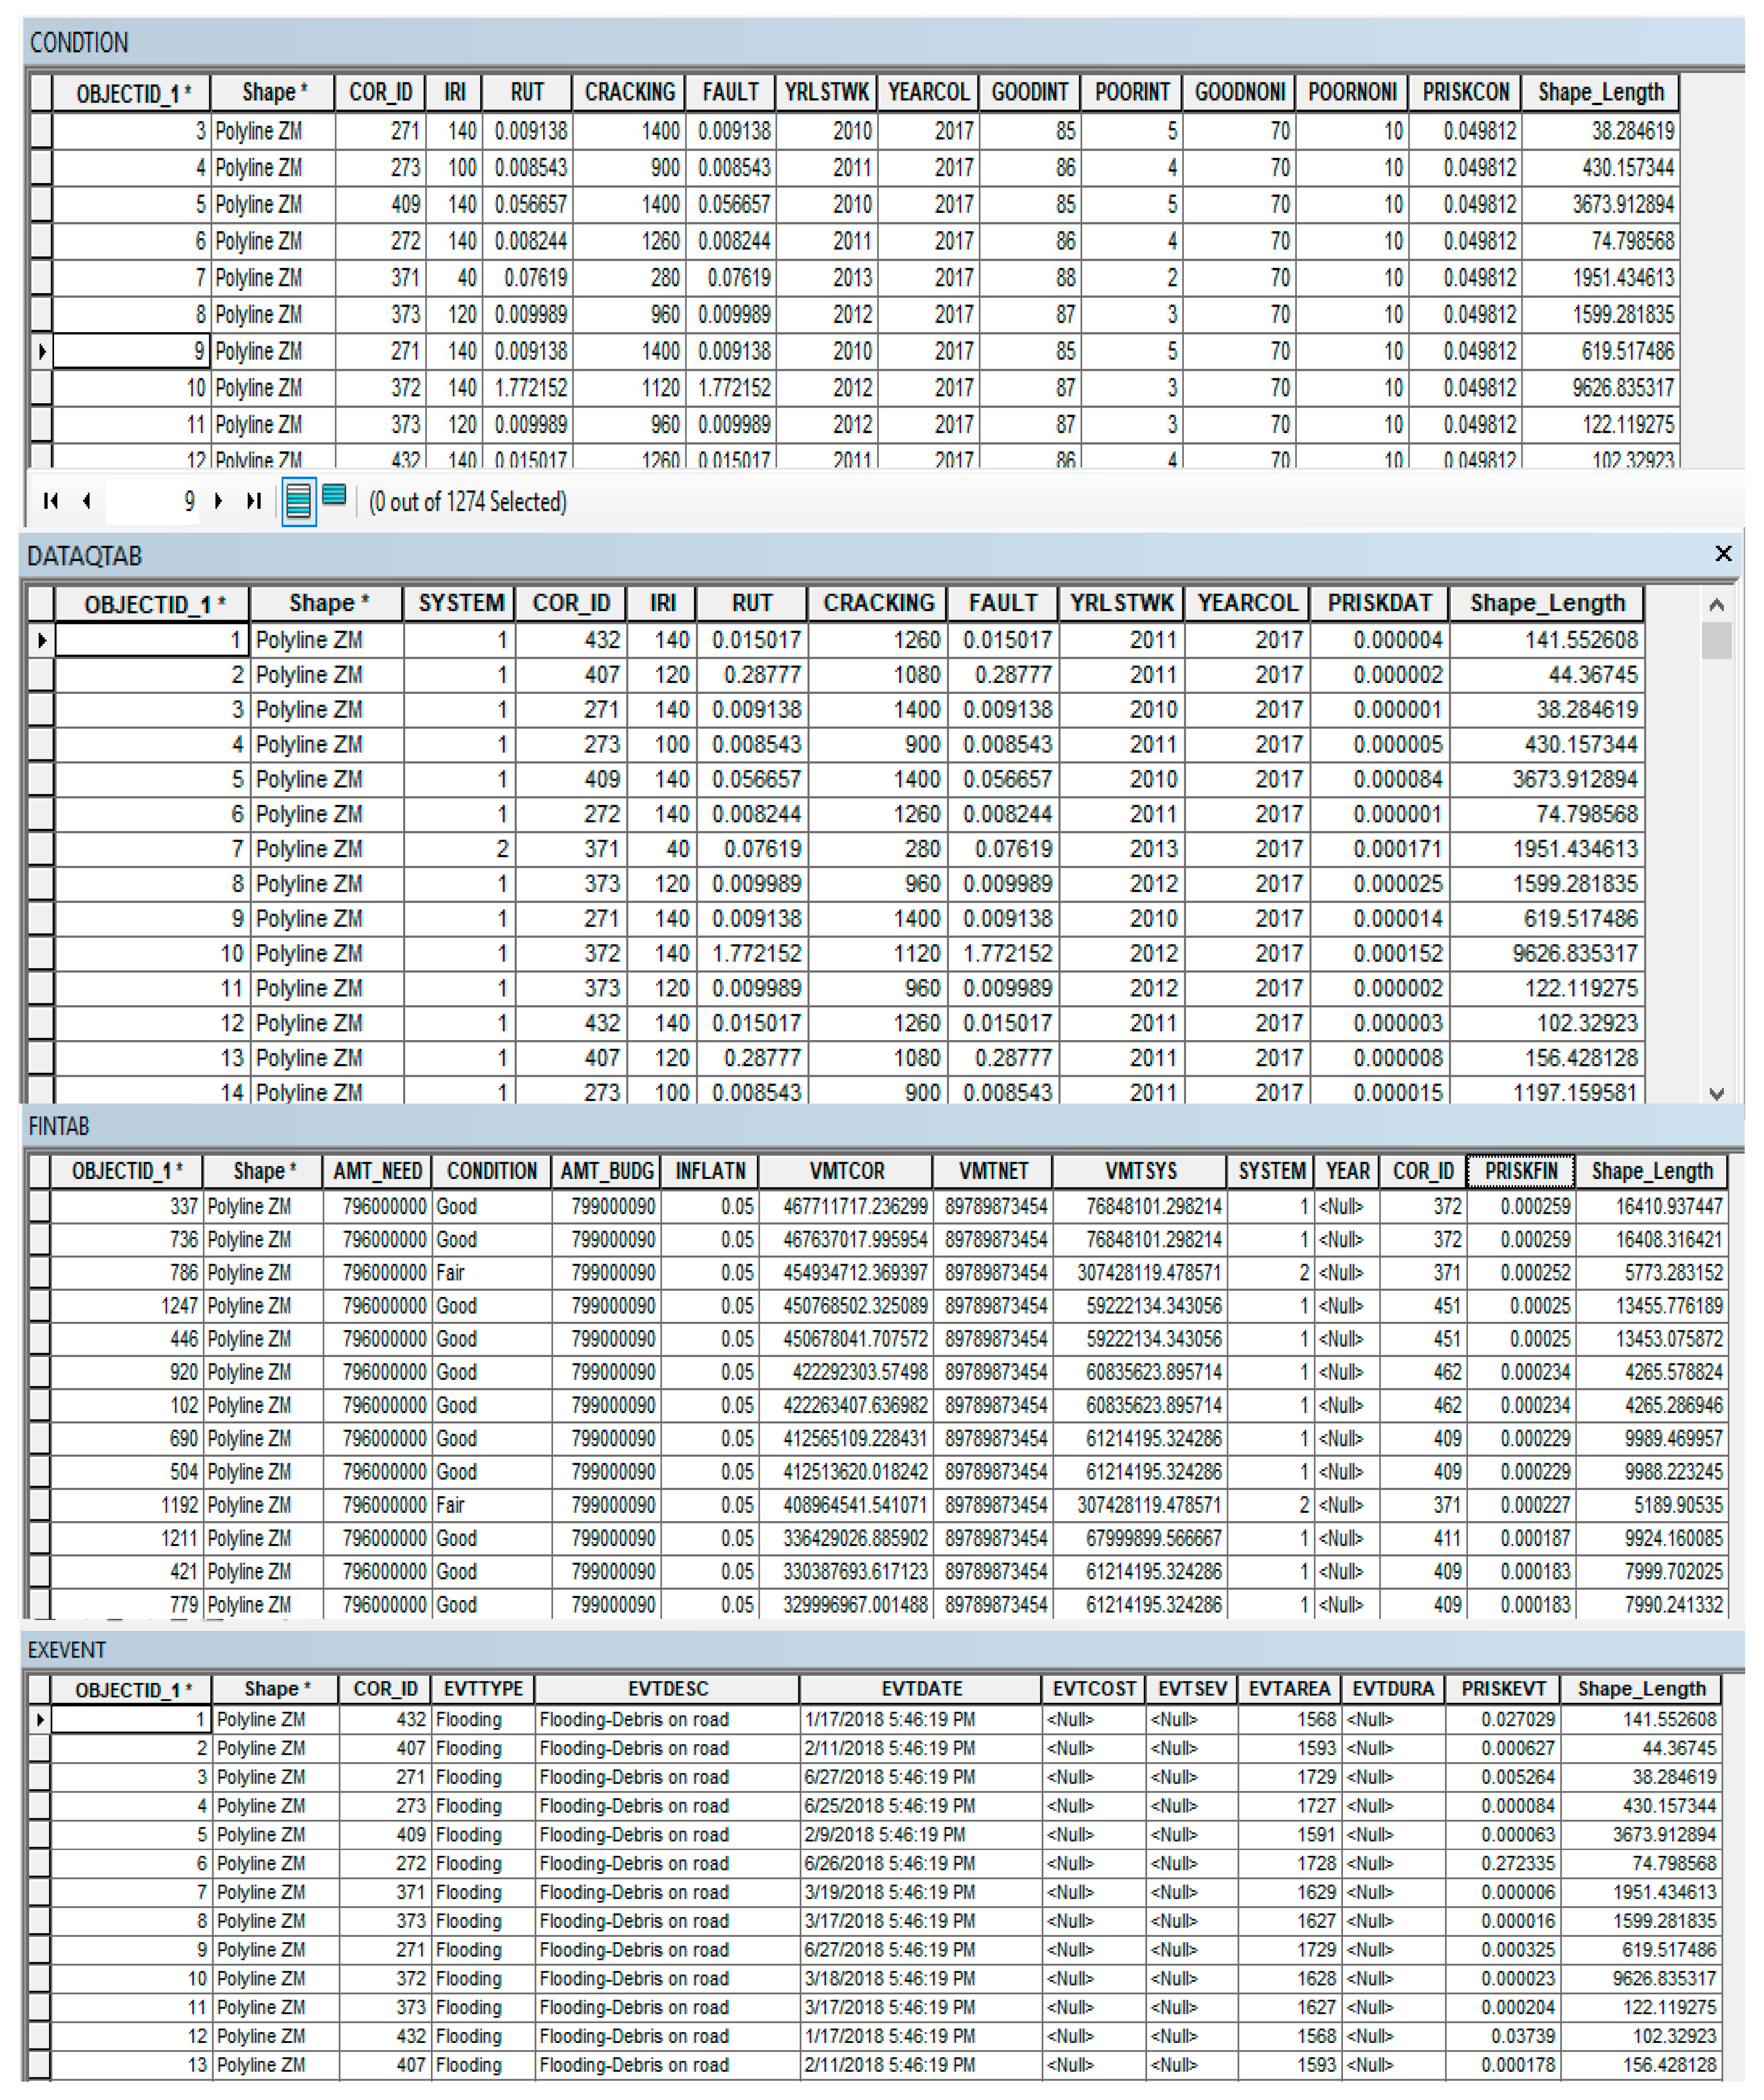
At the core of the need for a risk management database is to be able to integrate data from various relevant sources and show the results in a form that enables further analysis and decision-making. Figure 14 shows the results of the data integration with the risk database table populated with sample values. The risk data base in this demonstration is a file geodatabase. A file geodatabase is an ESRI proprietary database that provides all the functionality of an object relational database for spatial as well as non-spatial attributes. Additional tables can be synthesized based on any desired outcome.
The integration of historical and current data can be an effective tool to understand past and existing system performance. The results can be very important for analyzing the causes of asset failures and understanding the spatial and temporal dynamics of such in order to help prioritize the types of risks identified. This can be very useful for developing a quantitative measurement of risk that can go a long way to help track, monitor, and continuously update evolving risk registers for state DOTs.
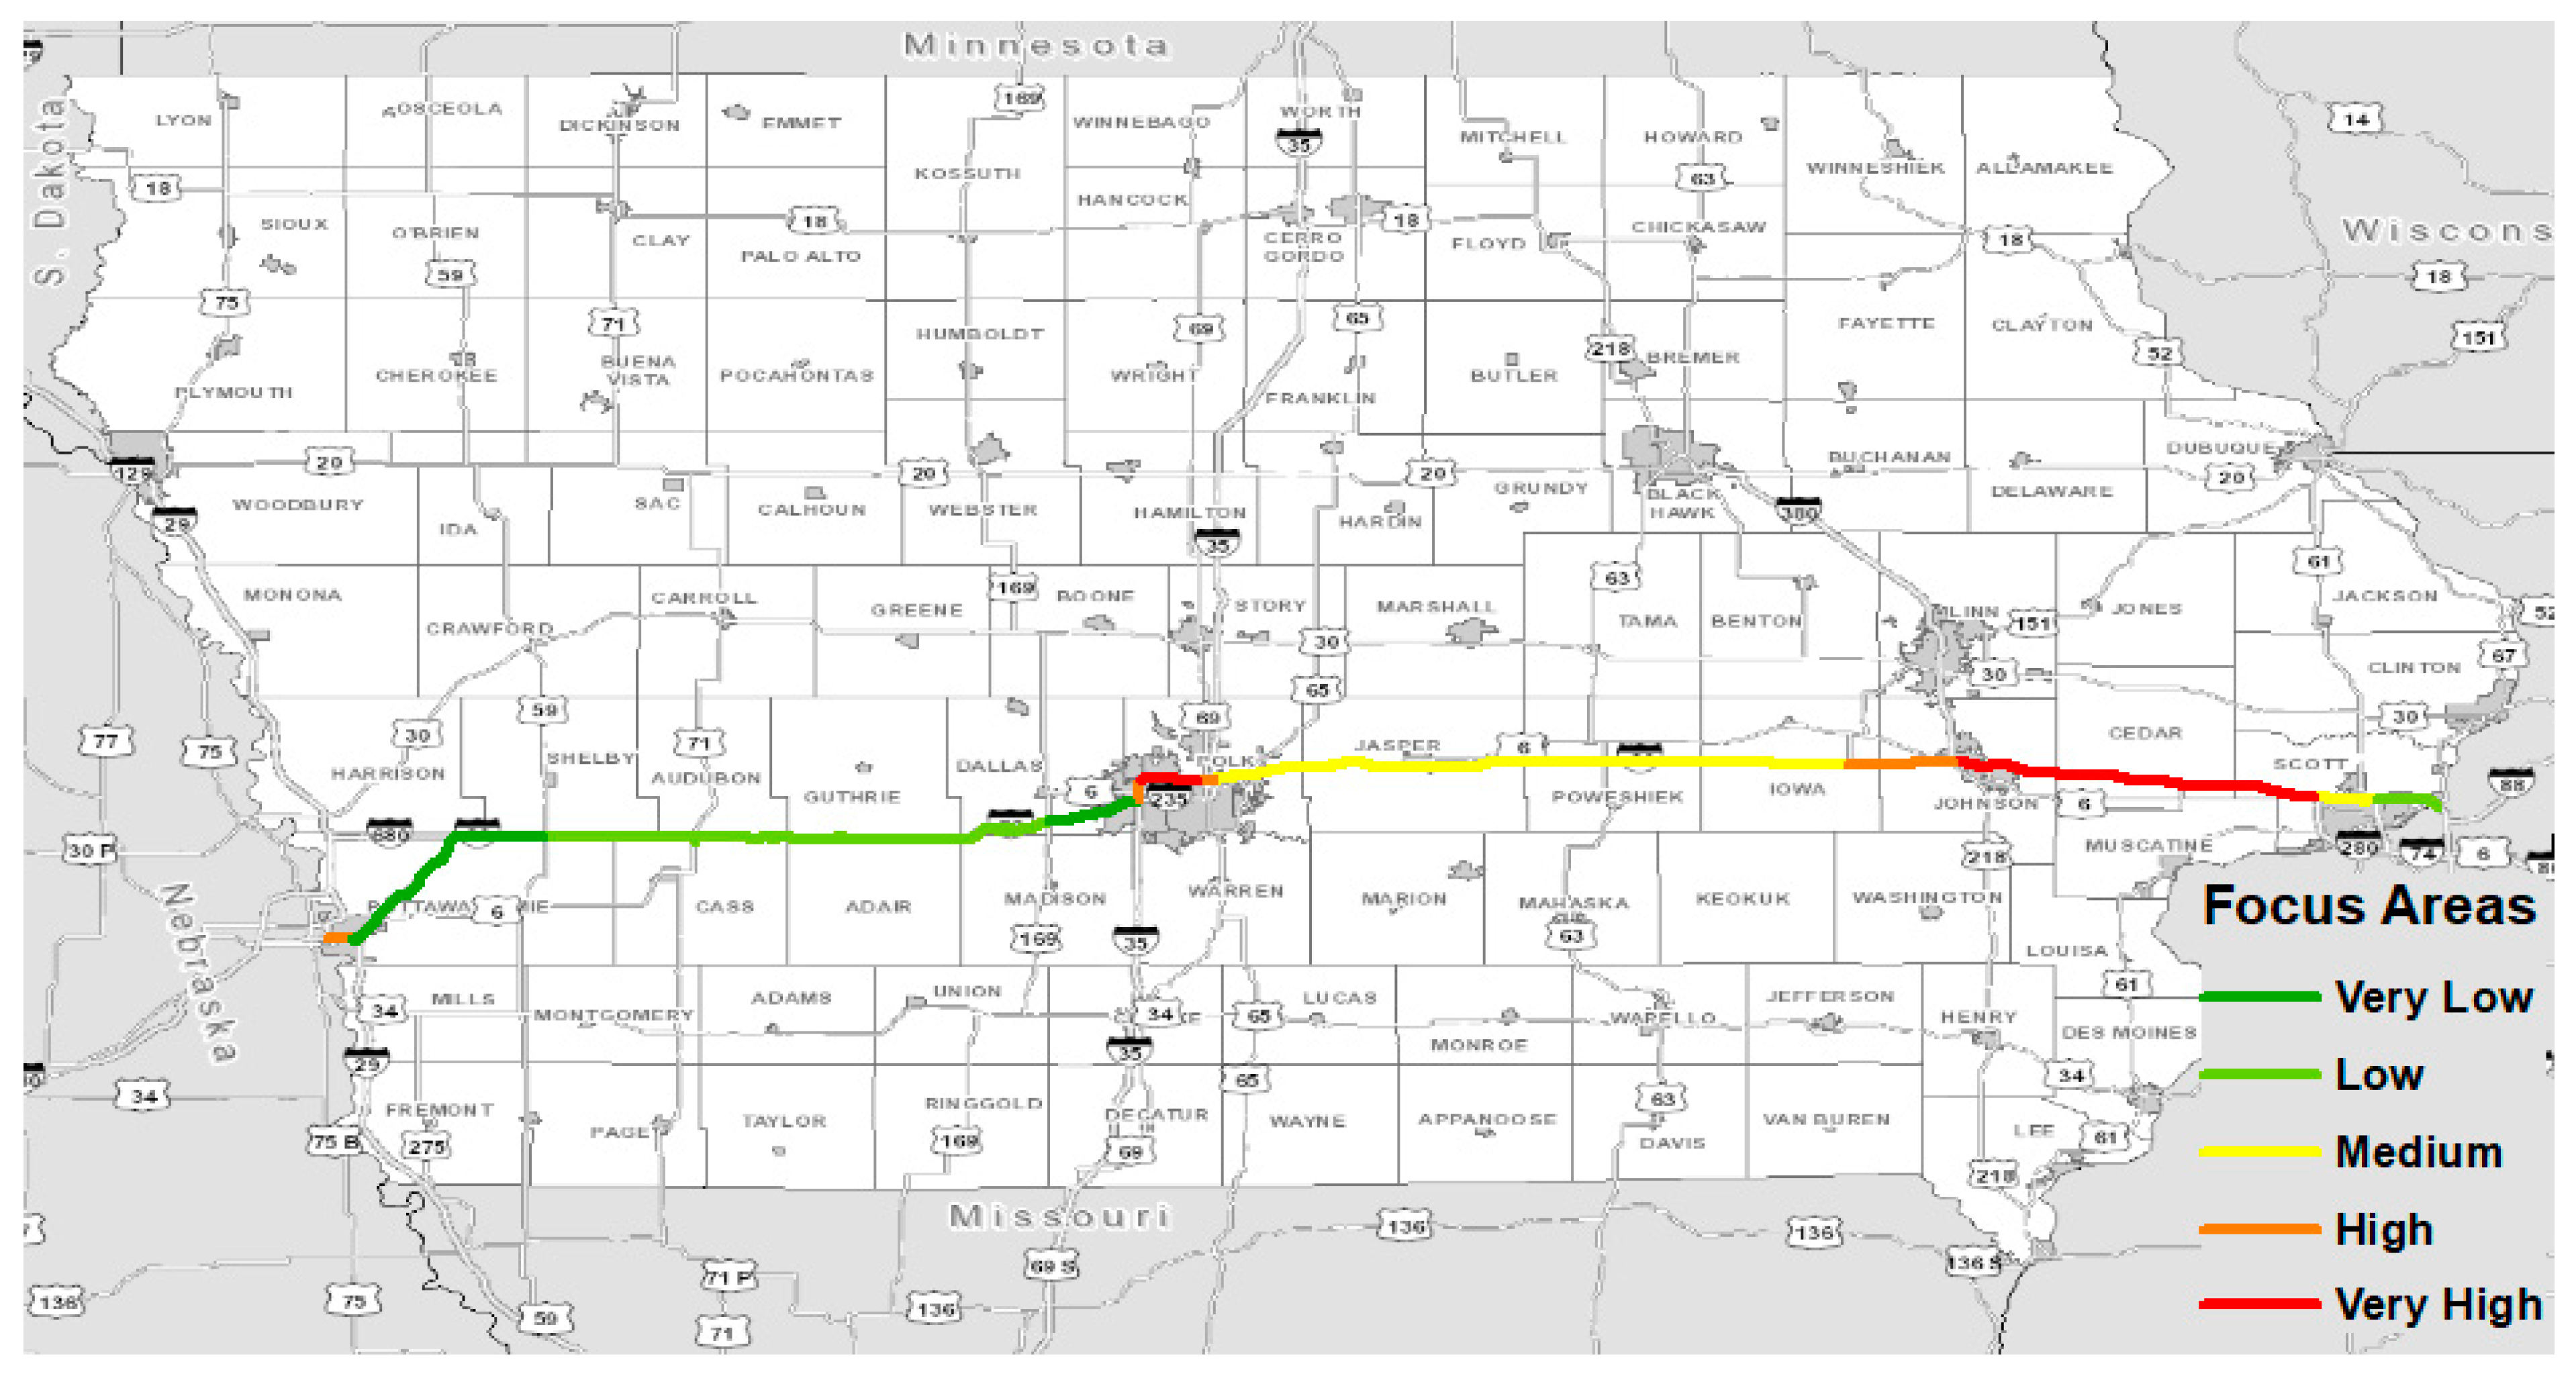
In addition, the data can be used to create a benchmark of asset performance as a very useful tool for understanding the impacts of the identified risks. In fact, using the available data to track for the identified risks is the essence of risk analysis. Statistical tools can then be employed to assess the expected performance of the transportation system under different risk scenarios. Figure 15 shows how the results of the data integration can be used for decision-making. Figure 15 presents a categorical method of presenting quantitative data to show areas of interest on the I-80 corridor. These are areas of high impact to freight travel should any risk event take place on those corridors shown in red. Additional maps can be produced based on all the underlying datasets that have been integrated to show what is driving the issue, providing decision-makers with options in their risk mitigation approaches and the benefit–cost implications of each option.
Within the context of risk-based TAMP, leveraging available data and analysis tools helps visualize and articulate, in both qualitative and quantitative terms, how the combination of various risks and mitigation strategies would impact performance targets. It paves the way for the consideration of how various factors, such as revenue constraints, demographic trends, economic shifts, or technological innovation can affect a state or region and its transportation system performance [39].
7. Conclusions
The goal of transportation asset management is the development of a decision-support framework that is integrated with quantitative data that measures how an organization’s financial plan and investments strategies impact its assets’ current and future performance in the face of uncertainty. The state of practice on how agencies are developing their risk-based asset management plans show that state highway agencies are increasingly adapting the way they do business to include explicit considerations of these uncertainties. However, while risk is acknowledged it is not yet integrated in TAM and this is because of the lack of data linkages and the absence of an actionable risk management framework. Therefore, since the documentation of agency risks was required as part of MAP-21, a risk management database system was implemented. This database will improve the still-emergent risk management methodology among state DOTs. It provides a tool by which the risks within the agency can be effectively visualized and managed as part of the ongoing process of risk-based TAMP. Many agencies must deal with legacy data while avoiding the loss of continuity in their management practices. Usually, disparate DOT business practices and the decades-long processes of asset development and life-cycle services have produced varied datasets that need data integration for effective risk management. To mitigate this, the risk management database framework utilizes GIS and APIs to implement a risk management database that is able to integrate varied datasets from enterprise as well as legacy data collection systems to provide a unified risk management database.
While GIS aids in the integration of the data, the use of APIs allows for a transformation of the information within the data to paint a common risk picture of the network. This synergy between GIS and APIs in the risk management database implementation provides a way for risks identified by the agency to be easily added, updated, and modified irrespective of their spatial nature as new data become available, ensuring that the risk calculations are up to date and relevant.
In addition, along with the implementation of the risk management database framework, practical approaches for risk calculations were developed. The risk calculations were included using the API, therefore making it easy for state DOTs to add to their functionality as well as remove obsolete functions. Hence, in terms of evaluation the contribution of this framework is to enable agencies make the best decision given the data available. As a result, as new questions arise or improvements in data collection technologies or new knowledge in terms of updating risk calculations appear, the framework is designed to accommodate them. An integrated risk database provides agencies the ability to constantly ask questions about the quality of the information that is driving their decision-making and identify additional data that can improve that quality or value of the information driving the decision.
Finally, the rapid evolution of data and information technologies present both opportunities and challenges as agencies seek to ensure that the transportation system continues to perform effectively and efficiently. A risk management database provides a vital step to increasing the returns on investment of all the data collection investments both in new technologies and new initiatives and to translate the information to actionable intelligence for ensuring the good stewardship of public funds.
Author Contributions
Conceptualization, I.N.; methodology, I.N. and O.S.; software, I.N.; writing—original draft preparation, I.N.; writing—review and editing, I.N. and O.S.; supervision, O.S. All authors have read and agreed to the published version of the manuscript.
Funding
This research received no external funding.
Conflicts of Interest
The authors declare no conflict of interest.
References
- Bureau of Economic Analysis. 2017 GDP by Industry | U.S. Bureau of Economic Analysis (BEA). Available online: https://dev.bea.gov/data/gdp/gdp-industry (accessed on 28 July 2020).
- Boadi, R.S.; Amekudzi, A.A. Risk-Based Corridor Asset Management. Transp. Res. Rec. J. Transp. Res. Board 2013, 2354, 99–106. [Google Scholar] [CrossRef] [Green Version]
- International Organization for Standardization. ISO 55000: Asset Management-Overview, Principles and Terminology; International Organization for Standardization: Vernier, Switzerland, 2014. [Google Scholar]
- International Standards Organization. International Standard: Risk Management: Principles and Guidelines. ISO 31000. Principes Et Lignes Directrices; International standards Organization: Vernier, Switzerland, 2009. [Google Scholar]
- U.S. Congress. Moving Ahead for Progress in the 21st Century (MAP-21). In 112th Congress Public Law; U.S. Congress: Washington, DC, USA, 2012; Volume 141. [Google Scholar]
- Amir-Heidari, P.; Maknoon, R.; Taheri, B.; Bazyari, M. A new framework for HSE performance measurement and monitoring. Saf. Sci. 2017, 100, 157–167. [Google Scholar] [CrossRef]
- Govan, P.; Damnjanovic, I. The Resource-Based View on Project Risk Management. J. Constr. Eng. Manag. 2016, 142, 04016034. [Google Scholar] [CrossRef]
- Hall, J.P. Successful Practices in GIS-Based Asset Management; Transportation Research Board: Washington, DC, USA, 2015. [Google Scholar]
- Arlington, M.; Santa Ana, C. Transportation Agency Self-Assessment of Data to Support Business Needs: Final Research Report; Transportation Research Board: Washington, DC, USA, 2015. [Google Scholar]
- Proctor, G.; Varma, S.; Roorda, J. Managing Risk Across the Enterprise: [FINAL] A Guide for State Departments of Transportation; Transportation Research Board: Washington, DC, USA, 2016. [Google Scholar]
- O’Har, J.P.; Senesi, C.W.; Molenaar, K.R. Development of a Risk Register Spreadsheet Tool for Enterprise- and Program-Level Risk Management. Transp. Res. Rec. 2017, 2604, 19–27. [Google Scholar] [CrossRef]
- Nlenanya, I.; Smadi, O. Risk Management and Data Needs: A State of the Practice Survey of State Highway Agencies. Transp. Res. Rec. 2018, 2672, 55–61. [Google Scholar] [CrossRef]
- AASHTO TAM Portal. AASHTO TAMP Library. Available online: https://www.tamptemplate.org/existing-tamp/ (accessed on 3 July 2018).
- Nlenanya, I. GIS-Based Risk Management Database Integration and Implementation Framework for Transportation Agencies. Ph.D. Thesis, Iowa State University, Ames, IA, USA, 2019; pp. 32–57. Available online: https://lib.dr.iastate.edu/etd/17067 (accessed on 22 February 2021).
- Saadatmand, N.; Gaj, S.; Proctor, G.; Varma, S. Managing Risks and Using Metrics in Transportation Asset Management Financial Plans; U.S. Federal Highway Administration: Washington, DC, USA, 2015.
- Proctor, G.D.; Varma, S.; Varnedoe, S. Asset Sustainability Index: A Proposed Measure for Long-Term Performance; United States. Federal Highway Administration: Washington, DC, USA, 2012.
- Kandhal, P.S.; Cooley, L.A. Accelerated Laboratory Rutting Tests: Evaluation of the Asphalt Pavement Analyzer; Transportation Research Board: Washington, DC, USA, 2003; Volume 508. [Google Scholar]
- Systematics C Inc. NCHRP Report 706: Uses of Risk Management and Data Management to Support Target-Setting for Performance-Based Resource Allocation by Transportation Agencies; Transportation Research Board of the National Academies: Washington, DC, USA, 2011. [Google Scholar]
- Miller, K.; Miller, M.; Moran, M.; Dai, B. Data Management Life Cycle; Final Report; Texas A&M Transportation Institute: San Antonio, TX, USA, 2018. [Google Scholar]
- Palermo, T. Integrating Risk and Performance in Management Reporting; Chartered Institute of Management Accountants: London, UK, 2011. [Google Scholar]
- Abdelaty, A.; Jeong, H.D.; Smadi, O. Barriers to Implementing Data-Driven Pavement Treatment Performance Evaluation Process. J. Transp. Eng. Part B Pavements 2018, 144, 04017022. [Google Scholar] [CrossRef]
- Smith, A.B.; Katz, R.W. US billion-dollar weather and climate disasters: Data sources, trends, accuracy and biases. Nat. Hazards 2013, 67, 387–410. [Google Scholar] [CrossRef]
- Pryor, S.C.; Scavia, D.; Downer, C.; Gaden, M.; Iverson, L.; Nordstrom, R.; Patz, J.; Robertson, G.P. Midwest. Climate change impacts in the United States: The third national climate assessment. In National Climate Assessment Report; Melillo, J.M., Richmond, T.C., Yohe, G.W., Eds.; US Global Change Research Program: Washington, DC, USA, 2014; pp. 418–440. [Google Scholar]
- U DOT. US Department of Transportation Climate Adaptation Plan 2014. Ensuring Transportation Infrastructure and System Resilience; U.S. Department of Transportation Climate Adaptation Plan: Washington, DC, USA, 2014.
- Schweikert, A.; Chinowsky, P.; Espinet, X.; Tarbert, M. Climate Change and Infrastructure Impacts: Comparing the Impact on Roads in ten Countries through 2100. Procedia Eng. 2014, 78, 306–316. [Google Scholar] [CrossRef] [Green Version]
- Nlenanya, I. Building an Environmental GIS Knowledge Infrastructure. In Data Mining Applications for Empowering Knowledge Societies; IGI Global: Hershey, PA, USA, 2009; pp. 260–277. [Google Scholar]
- Herrera, E.K.; Flannery, A.; Krimmer, M. Risk and Resilience Analysis for Highway Assets. Transp. Res. Rec. 2017, 2604, 1–8. [Google Scholar] [CrossRef]
- Sobanjo, J.O.; Thompson, P.D. Development of Risk Models for Florida’s Bridge Management System; Final Report; Florida Department of Transportation: Tallahassee, FL, USA, 2013.
- Gerssen, S.G.; Rothkrantz, L.J. Bayesian Network Learning for Rare Events. In Proceedings of the International Conference on Computer Systems and Technologies—CompSysTech ’06, Tarnovo, Bulgaria, 11–14 June 2006. [Google Scholar]
- Federal Register Vol. 82, No.11, 18 January 2017—Content Details—FR-2017-01-18. Available online: https://%3A%2F%2Fwww.govinfo.gov%2Fapp%2Fdetails%2FFR-2017-01-18 (accessed on 28 July 2020).
- U.G.S. Administration. Privately Owned Vehicle (POV) Mileage Reimbursement Rates. Available online: https://www.gsa.gov/travel/plan-book/transportation-airfare-pov-etc/privately-owned-vehicle-pov-mileage-reimbursement-rates (accessed on 28 July 2020).
- May 2019 National Occupational Employment and Wage Estimates. Available online: https://www.bls.gov/oes/current/oes_nat.htm (accessed on 28 July 2020).
- National Household Travel Survey. Available online: https://nhts.ornl.gov/ (accessed on 28 July 2020).
- FAF4 Network Database and Flow Assignment: 2012 and 2045—FHWA Freight Management and Operations. Available online: https://ops.fhwa.dot.gov/freight/freight_analysis/faf/faf4/netwkdbflow/index.htm (accessed on 28 July 2020).
- Vessely, M.; Robert, W.; Richrath, S.; Schaefer, V.R.; Smadi, O.; Loehr, E.; Boeckmann, A. Geotechnical Asset Management for Transportation Agencies, Volume 1: Research Overview; Transportation Research Board: Washington, DC, USA, 2019. [Google Scholar]
- Band, J.; Katoh, M. Interfaces on Trial: Intellectual Property and Interoperability in the Global Software Industry; Westview Press: Boulder, CO, USA, 1995; Volume 424, pp. 51–53. [Google Scholar]
- Brockschmidt, K. Inside Ole; Microsoft Press: Fort Collins, CO, USA, 1995. [Google Scholar]
- Herzmann, D. IEM: ISU Soil Moisture Network. Available online: https://mesonet.agron.iastate.edu/agclimate/ (accessed on 28 July 2020).
- Grant, M.; D’Ignazio, J.; Bond, A.; McKeeman, A. Performance-Based Planning and Programming Guidebook; United States, Federal Highway Administration: Washington, DC, USA, 2013.
Figure 1.
Implementation process.

Figure 2.
Data integration approach.

Figure 3.
GIS feature types.

Figure 4.
Data integration workflow.

Figure 5.
Data integration workflow showing the API.

Figure 6.
Risk database model.

Figure 7.
Implementation framework for agency.

Figure 8.
Map of Iowa showing the interstate corridors.

Figure 9.
Generic FME workflow.

Figure 10.
API design workflow.

Figure 11.
Map showing data overlay for select risk data.

Figure 12.
Workflow showing data preprocessing.

Figure 13.
Workflow showing data aggregation.

Figure 14.
Risk database showing sample values.

Figure 15.
The Iowa Interstate 80 corridor freight capacity.


Table 1.
Summary of financial risks.
| Financial Risk Source | Agency Count |
|---|---|
| Revenue variations/uncertainties | 22 |
| Federal funding/ new mandates | 14 |
| Inflation | 8 |
| Unfunded maintenance requirements – e.g., regulatory | 7 |
| Construction costs | 6 |
| Climate change | 5 |
| Public perception/support | 5 |
| Uneven age distribution | 1 |
| Debt servicing | 1 |
Table 2.
Condition weight table.
| Condition | Weight |
|---|---|
| Good | 1 |
| Fair | 2 |
| Poor | 3 |
Table 3.
Revised summary of risk events [14].
Table 3.
Revised summary of risk events [14].
| Risk Events | Agency Count |
|---|---|
| Financial risks | 21 |
| Business operations risks (personnel changes and knowledge gap) | 21 |
| External event | 20 |
| Information and decision risks | 18 |
| Bridge failure: structural, other than hits, scour, resulting in loss of service | 13 |
| Condition related risks/performance related risks | 13 |
| Heavy truck volume growth/weight increase | 9 |
| Bridges are damaged or destroyed due to scour | 7 |
| ITS or traffic control failure resulting in safety impact | 6 |
| Scope growth/growth in size of network relative to funding | 6 |
| Culverts and other drainage facilities fail (blockages or overtopping) unexpectedly. | 6 |
| Capacity improvements projects are delayed/deferred maintenance | 5 |
| Retaining walls (requiring maintenance but no mobility impacts)/slope failure | 4 |
| Bubble in asset replacement needs due to uneven asset age distribution | 4 |
| Negative public opinion/public involvement delay killing projects | 4 |
| Sinkholes emerge under or near roadway sections compromising foundation. | 3 |
| Winter weather treatments and impacts on pavement deterioration | 3 |
| Socioeconomic risks- population growth/ shift to urban areas/land use | 3 |
| Avalanche requiring maintenance but no/minimal delay | 2 |
| Travel mode changes | 2 |
| Highway safety | 2 |
| Tunnel collapse/closure due to safety incident | 1 |
| Subsurface utilities impacts by others in ROW (and below roadways) | 1 |
| Make projects more complex | 1 |
Publisher’s Note: MDPI stays neutral with regard to jurisdictional claims in published maps and institutional affiliations. |
© 2021 by the authors. Licensee MDPI, Basel, Switzerland. This article is an open access article distributed under the terms and conditions of the Creative Commons Attribution (CC BY) license (http://creativecommons.org/licenses/by/4.0/).
Share and Cite
MDPI and ACS Style
Nlenanya, I.; Smadi, O. A Risk Management Database Framework Implementation for Transportation Asset Management. CivilEng 2021, 2, 193-213. https://0-doi-org.brum.beds.ac.uk/10.3390/civileng2010011
AMA Style
Nlenanya I, Smadi O. A Risk Management Database Framework Implementation for Transportation Asset Management. CivilEng. 2021; 2(1):193-213. https://0-doi-org.brum.beds.ac.uk/10.3390/civileng2010011
Chicago/Turabian StyleNlenanya, Inya, and Omar Smadi. 2021. "A Risk Management Database Framework Implementation for Transportation Asset Management" CivilEng 2, no. 1: 193-213. https://0-doi-org.brum.beds.ac.uk/10.3390/civileng2010011