
Preliminary Investigation of the Mechanical and Physical Properties of Natural Hydraulic Lime Grouts with Nano-Silica


Department of Civil Engineering, NOVA School of Science and Technology|FCT NOVA, Caparica, 2829-516 Almada, Portugal
*
Author to whom correspondence should be addressed.
CivilEng 2021, 2(2), 421-441; https://0-doi-org.brum.beds.ac.uk/10.3390/civileng2020024
Submission received: 13 April 2021
/
Revised: 23 May 2021
/
Accepted: 30 May 2021
/
Published: 1 June 2021
Abstract
:Natural hydraulic lime-based grouts are often used in the structural consolidation of old stone masonry walls, mainly to re-establish the monolithic behaviour of masonry constructions. To ensure an adequate grouting operation, it is essential to have good fresh and hardened grout properties. The motivation of the present study was to examine the fresh and hardened properties of natural hydraulic lime grouts with nano-silica (NS) and silica fume (SF). The contribution of these materials and the dosage of a high range water reducer admixture (HRWR) were investigated on the rheological properties, water capillarity, open porosity and mechanical strength of injection grouts. The effects on rheology were analysed through plastic viscosity and yield stress. The results indicated that, even for reduced NS content, an increase in plastic viscosity and yield stress occurred, which required a higher HRWR content in order to not compromise the grout’s rheological performance. The results also showed that, when NS and SF were combined, a beneficial joint effect occurred, resulting in a substantial and positive change on the mechanical strength and microstructure of the hardened injection grouts. Taguchi’s method was used to optimize the grout’s formulation and to fulfil the required performance concerning the fresh and hardened state.
1. Introduction
Ordinary or historical buildings in most European cities were built of old stone masonry walls [1]. Old stone masonry is very heterogeneous in its constitution, mainly built of stone or a mixture of stone and earth, using lime-based mortars. Regardless of the type of building made, stone masonry walls can present very different cross section features; some are made of a single leaf, while others are multi-leaf. It should be highlighted that the cross section of stone masonry walls strongly influences the bearing capacity of the wall, so each cross-section type has its own behaviour, and thus each of them needs a careful investigation in order to know the geometry, the crack pattern and the damage survey [2]. Due to their irregular morphology (both in texture and thickness) and the presence of voids and loose adhesive material-infill material (mainly concentrated in the internal core), they are sensitive to brittle collapse mechanisms [1,2,3,4,5].
Based on the above mentioned, it can be stated that the performance of old stone masonry relies on their monolithic behaviour rather than on the mechanical properties of individual elements. This means that the good condition of the connections between elements is crucial towards masonry integrity, especially under horizontal actions [4,5]. Unfortunately, several seismic events have shown the weaknesses of existing stone masonry buildings [6].
For improving the mechanical performance of existing stone masonry buildings, different retrofitting procedures could be implemented. An efficient and commonly used technique for the repair and/or strengthening of the masonry constructions is by grout injection (grouting) [2,4,5], where the grout is injected into the wall through pipes placed in holes previously made in the masonry under moderate pressure (0.5–1.5 bar). The injection normally starts from the lowest level and progresses first sideways and then upwards in a systematic manner.
The poor characteristics of multi-leaf masonry walls can be improved to a certain extent by injecting into the voids, a grout which can fill them, produce a connection between masonry leaves and provide a better cohesion to the mortars and a better adhesion between the masonry elements [7]. Indeed, the grouting re-establishes or even increases the adhesion forces between the elements of the masonry [8].
Considering the historical value of old masonry buildings and the fact that the injection of grouts is an irreversible technique, a special attention on the design of injection grouts is needed in order to ensure a successful consolidation intervention [9,10]. Grouts can be seen as suspensions made of binder with water. However, these simple formulations are unable to perform efficient consolidation, therefore requiring the use of additional products. According to other studies [10,11,12,13,14,15,16], some grout properties can be improved with the use of additives in the grout composition, in particular pozzolans that can be added to the base grout. Even though the influence of incorporation of pozzolans as supplementary materials in grouts production has been investigated widely in the last two decades [10,15,16,17,18,19], the influence of materials with a nano-size in grouts for old stone masonry consolidation has not been investigated to a great extent.
In this study, an effort has been made to study the performance of natural hydraulic lime-based grouts with nano-silica; wherefore it is believed that this kind of nano-material can be very useful for producing a better interfacial bond between grout and masonry elements. Several research works are going on to improve the performance of various building materials; however, the advent of nanotechnology has brought in numerous kinds of nano-materials, which may have interesting applications in civil engineering due to their size effect, surface effect and interface effect [20,21,22].
Among these nano-materials, nano-silica (NS), with a high purity of SiO2, has become one of the most popular research materials [23]. NS is finer in size than ordinary silica and therefore has a greater specific surface area. Hence, the pozzolanic reactivity of NS should be even higher than that of silica fume. Being much finer in size than traditional binders should be effective in filling into the voids between binder particles to increase the packing density, which positively influence the physico-mechanical properties of the materials.
Regarding the effect of NS on the rheological behaviour of the cementitious mixes, most researchers agree that the addition of NS greatly increases the water demand of cementitious mixes. The workability loss with NS was assigned to higher surface area [24]. On the other hand, the influence of NS on the mechanical strength development of cementitious materials was positive, increasing the compressive strength [25,26,27]. It is worth noting that, up to date, there is only minimal reporting on the effect of NS on the properties of NHL-based materials [28].
In order to improve the fresh and hardened performance of injection grouts based on natural hydraulic lime (NHL), this study examines the performance of NHL-based grouts proportioned with NS. This examination was done by analysing the results obtained from the rheological measurements through rotational rheometer, water absorption by capillarity, open porosity and compressive strength. The influence of NS on these properties of injection grouts was analysed using the Taguchi method.
The Taguchi method is a procedure based on the concept of design of experiments (DOE) [29], which provides an efficient way to optimise the performance of grouts [14,30]. Moreover, the number of experiments can be substantially reduced with this method, thus only a small group of combinations are necessary to study the individual effect of each factor on the grout performance, which is an asset when it is intended to optimize material consumption, as in the case of NS. Finally, the knowledge gained of the NHL-based grouts with NS will be used to better understand their contribution in future studies related to the optimization of injectability of grouts.
2. Materials and Methods
2.1. Materials
According to some authors [9,31], who studied the compatibility of materials used for the repair of old masonry buildings, the compatibility between the grout and the substrate should be assured.
Hence, natural hydraulic lime (NHL) was chosen as a binder to be used in this study. The NHL used, which has the characteristics presented in Table 1, is labelled as NHL5 and is produced according to the European Standard EN459-1:2010 [32].
One of the key points in the design of grouts is the use of dispersant admixtures such as high range water reducer (HRWR) because of its useful influence upon the fluidity and performance of cementitious materials [33]. ViscoCrete 225 powder, a polycarboxylate-based polymer HRWR, was chosen as the one that most facilitated the mixing process by being in powder form and also being more efficient in improving the grout fluidity or, in order words, this HRWR provides a grout with a better ability to flow and fill up the voids inside the masonry. Additionally, HRWR can also help to reduce the particle agglomeration mechanism of grouts with nano-silica.
Silica fume (SF) is a highly pozzolanic powder from electrometallurgy industry, which has been mainly used as a binder replacement to improve the durability and mechanical strength of cementitious materials. Several studies [34,35] have shown that the properties of cementitious materials can be improved when SF is used and, especially, when it is combined with other additives such as HRWRs.
The SF used in this study was an undensified one produced by Mapei, and its characteristics are shown in Table 2. The particle size was found to be between 2 and 30 µm, with 80% being below 10 µm.
NS powder, with particle size range of 20–30 nm and bulk density of 0.10 g/cm3, was produced by the US Research Nanomaterials, Inc, whose characteristics are presented in Table 3.
2.2. Taguchi Method
The first step in the Taguchi design of experiments is the selection of factors and their levels. In this research, three factors were used: NS dosage, SF dosage and HRWR dosage. For each factor, three levels were considered, as shown in Table 4.
The Taguchi method uses tables of orthogonal arrays (OA) and analysis of variance as tools. Taguchi orthogonal arrays are a set of tables of numbers, each of which can be used to lay out experiments for a number of experimental situations. Use of these arrays to design experiments is the key of the Taguchi approach because the factorial experiments, together with orthogonal arrays, allows us to make the DOE technique more applicable by reducing the size of the experiments [29].
Several orthogonal arrays are available with the objective of reducing the number of combinations. Each array can be used to suit a number of experimental situations.
Orthogonal arrays are typically designed with the representation L and a subscript, which indicates the number of combinations that will be performed. In an orthogonal array, numbers represent factor levels, rows represent trial conditions and columns represent factors.
The standard notation for an orthogonal arrays is:
where n = Number of experiments
Symbol Ln (XY)
X=Number of levels
Y=Number of factors
For instance: L9 (34), where 9 = number of experiments, 3 = number of levels and 4 = number of factors.
According to this combination of 3 three level factors, a standard L9 orthogonal array was used (Table 5). This means that only nine experiments are necessary to analyse the influence of grout composition in their rheological behaviour, whereas one-factor-at-a-time experimentation would require 27 possible combinations, which represents a considerable reduction, especially when it is intended to reduce the consumption of some raw material, as is the case of this study. The OA allows studying the different design factors simultaneously and can be used to estimate the effects of each factor on each parameter independently. The columns of the OA correspond to the factors, each one containing the three levels assigned to the column, while the rows represent the trial conditions with the factor levels to be tested.
After conducting all the experiments, analysis of the results was made using a performance characteristic, whereby it can evaluate the effect of changing a design factor (NS dosage, SF dosage or HRWR content) on the performance of each parameter studied [29]. The Taguchi method states that the standard analysis (based on average values) alone is not an adequate procedure when there are two or more specimens (as is the case with this study) for each experiment condition [29].
So, in this study the concept of consistency of performance was adopted to measure the performance of the samples in terms of its consistency. For that, a quantity called mean-squared deviation (MSD) was defined [29]. MSD can be expressed by signal to noise (S/N) ratio (the unit of S/N ratio is decibel (dB)). The S/N ratios are defined differently according to the type of quality characteristics. The method foresees three quality characteristics (smaller is better, bigger is better and nominal is better); in this research, only the first two were used as consequence of the type of parameter under analysis.
These quality characteristics (QC) are evaluated by using the following equations [29]:
Smaller is better
Bigger is better
where S/N is the signal to noise ratio (dB), n is the number of the samples for each experiment and Yi is the measured value of each specimen of each experiment. For all QC, the maximum S/N ratio is desirable, as the variability of characteristics is in inverse proportion to the S/N ratio. Consequently, the Taguchi method can determine the condition of least variability by the S/N ratio. Then, to distinguish which factors (NS, SF and HRWR) are statistically significant in each parameter studied, the ANOVA process was used. The statistical analysis of the results was carried out using Qualitek-4 (Nutek) software.
There is no doubt that Taguchi’s method is a simple tool and is easy to apply to experimental design. Nevertheless, because orthogonal arrays do not test all variable combinations, this method should be reconsidered when all relationships between all variables are needed. Notwithstanding, it is a straightforward method to identify the parameters that have the most effect on the performance characteristic so that further experimentation on these parameters can be carried out [29].
2.3. Experimental Methods
2.3.1. Grout Preparation
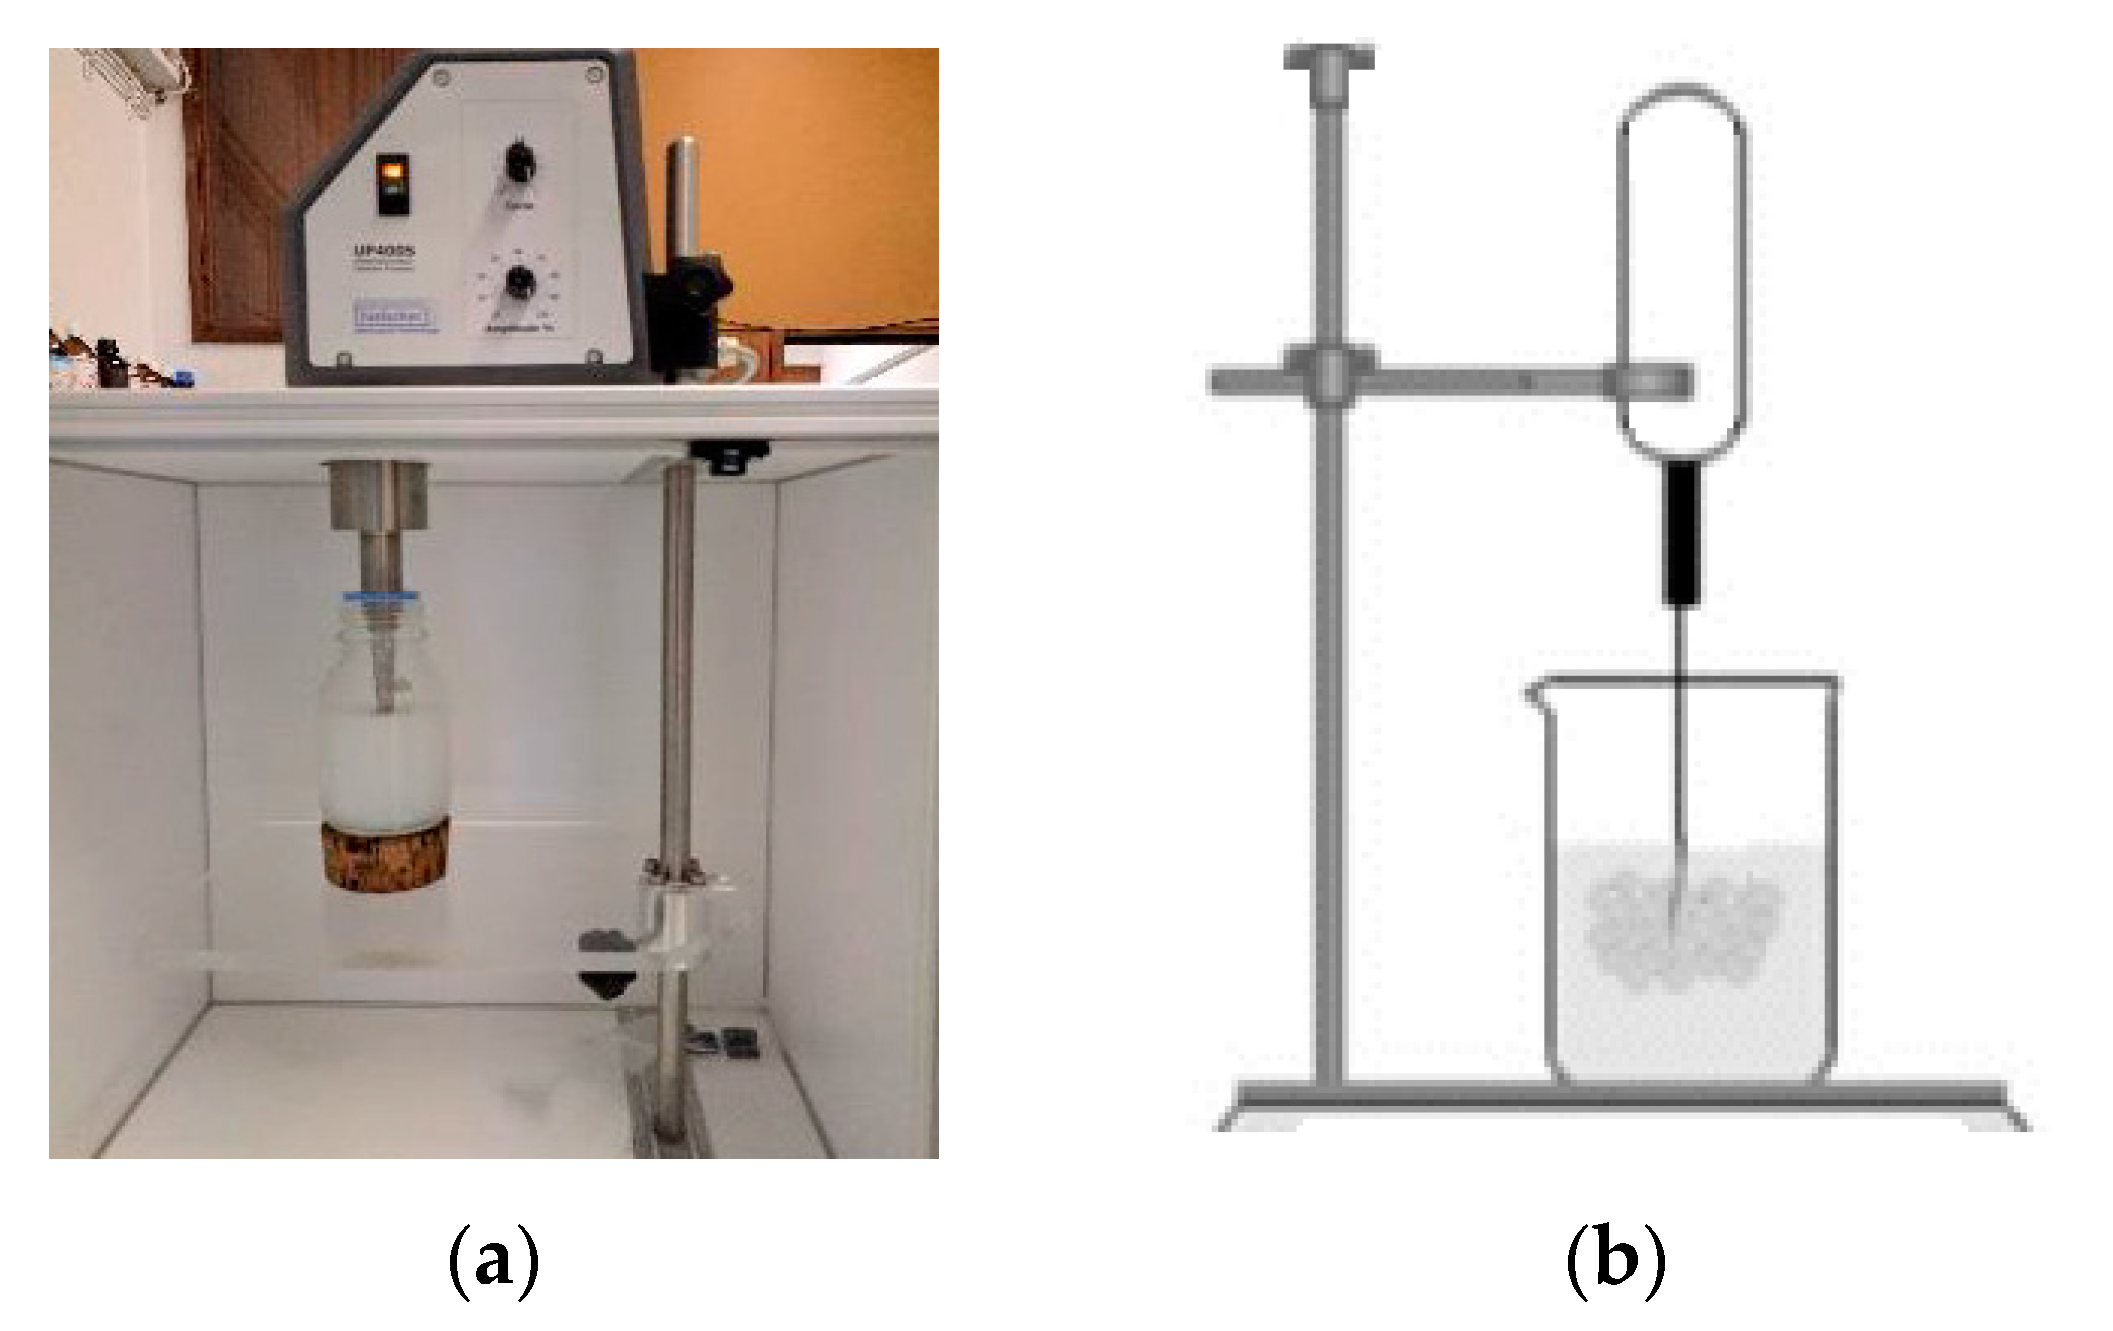
The grouts were prepared at a room temperature of 20 ± 2 °C and a relative humidity of 53%. All the mixes used a w/b ratio of 0.5. For the preparation of grouts, ordinary tap water was used, and before the mix process the NS was ultrasonically dispersed in water for 10 min (Figure 1).
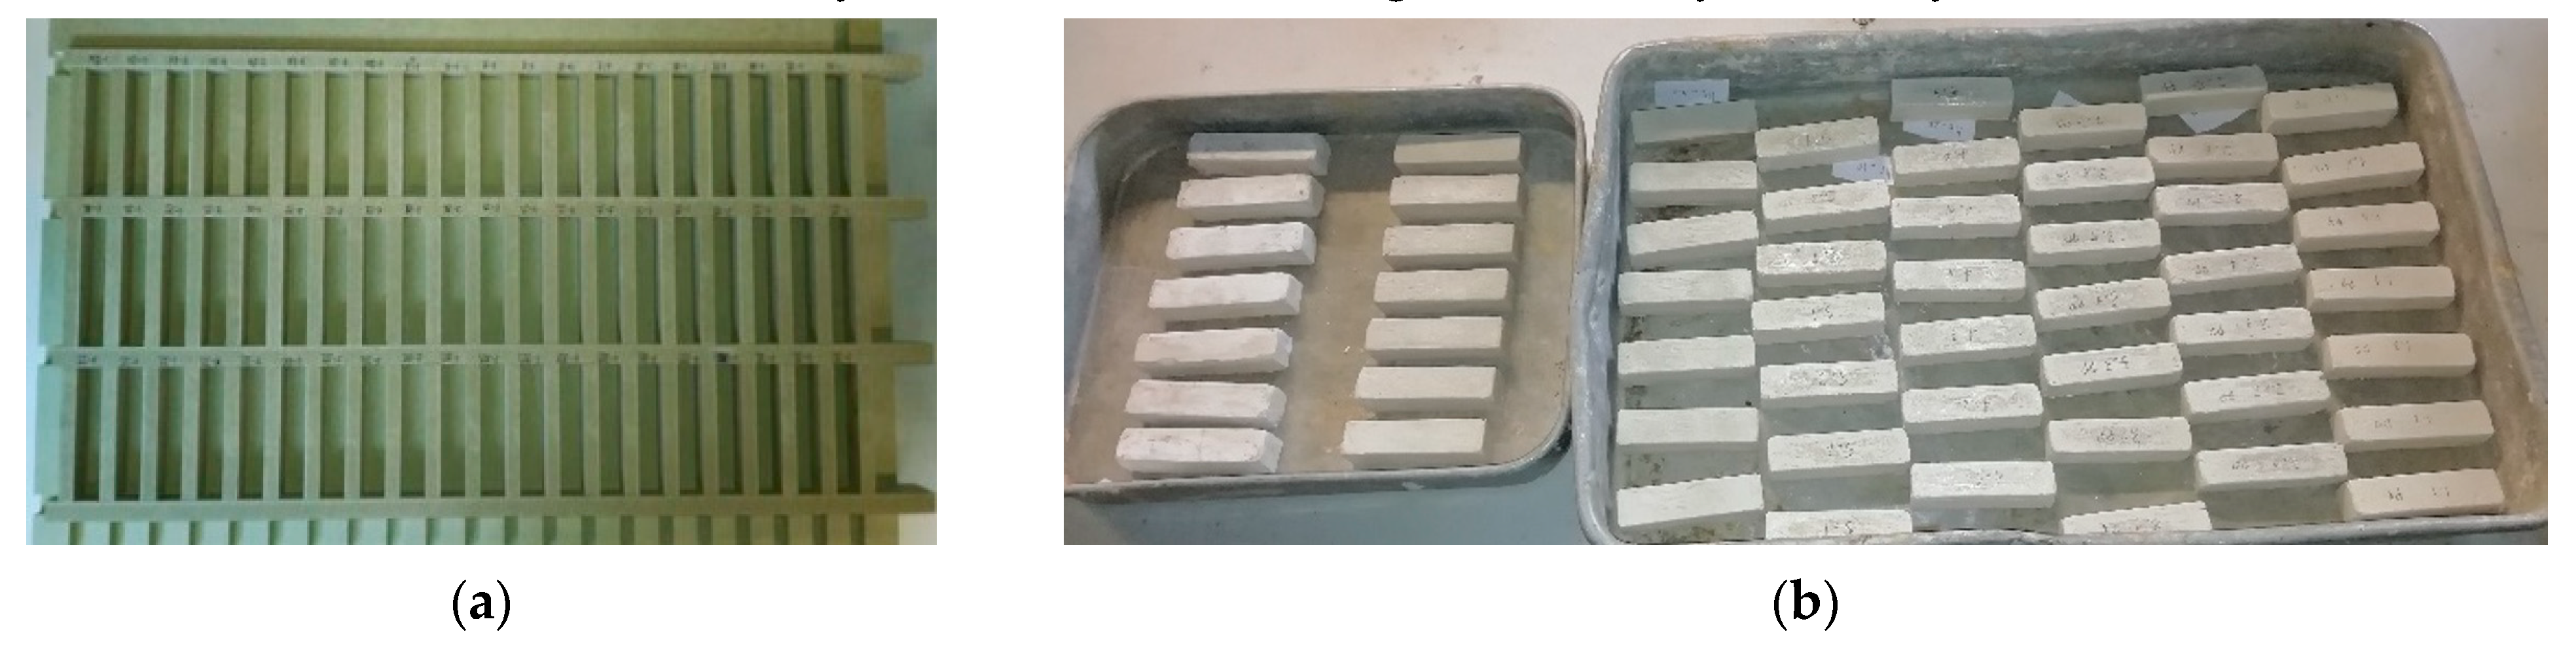
The entire NHL and HRWR powders were then added to the solution containing NS. A high shear mechanical mixer was used to mix the grout for 3 min. For each grout composition (Table 6), seven prismatic specimens (20 × 20 × 80 mm3) were prepared (Figure 2). The reduced size specimens (non-standard) were used to optimise the amount of material used, especially the NS (due to the reduced amount of NS available for the high number of specimens and tests that were carried out). The influence of the size of test specimen on experimental results have been previously analysed [16]. All the specimens were cured in a controlled-environment room with a temperature of 20 ± 2 °C and a relative humidity of 60 ± 5% until the age of maturity of 28 days.
Characterization of hardened grout properties were carried out at 28 days for all grouts and were performed as follows: four specimens out of seven were initially tested for compressive strength. After that, an open porosity test was carried out with the intact halves of the samples, which were mechanically tested. However, open porosity tests were performed on a minimum of three half samples of each grout composition. The other three samples (out of seven) were subjected to another set of tests, such as water absorption capillarity and drying.
2.3.2. Rheological Measurements
Rheological properties were evaluated with a Bohlin Gemini HRnano rotational rheometer (Malvern), equipped with parallel-plate geometry. The diameter of the plate was 40 mm, and the gap was set to 2 mm. To avoid any undesirable influence from mechanical histories, fresh samples were subjected to a pre-shearing at an identical shear rate of 1 s−1 for 1 min and left standing for an additional 1 min before measurements took place. Then, the sample was subjected to a stepped ramp with shear rates from 1 to 300 s−1. Each shear rate was applied long enough to ensure the attendance of the steady state. All grout samples were analysed at a constant temperature of 20 °C, maintained by means of a temperature control unit.
2.3.3. Compressive Strength
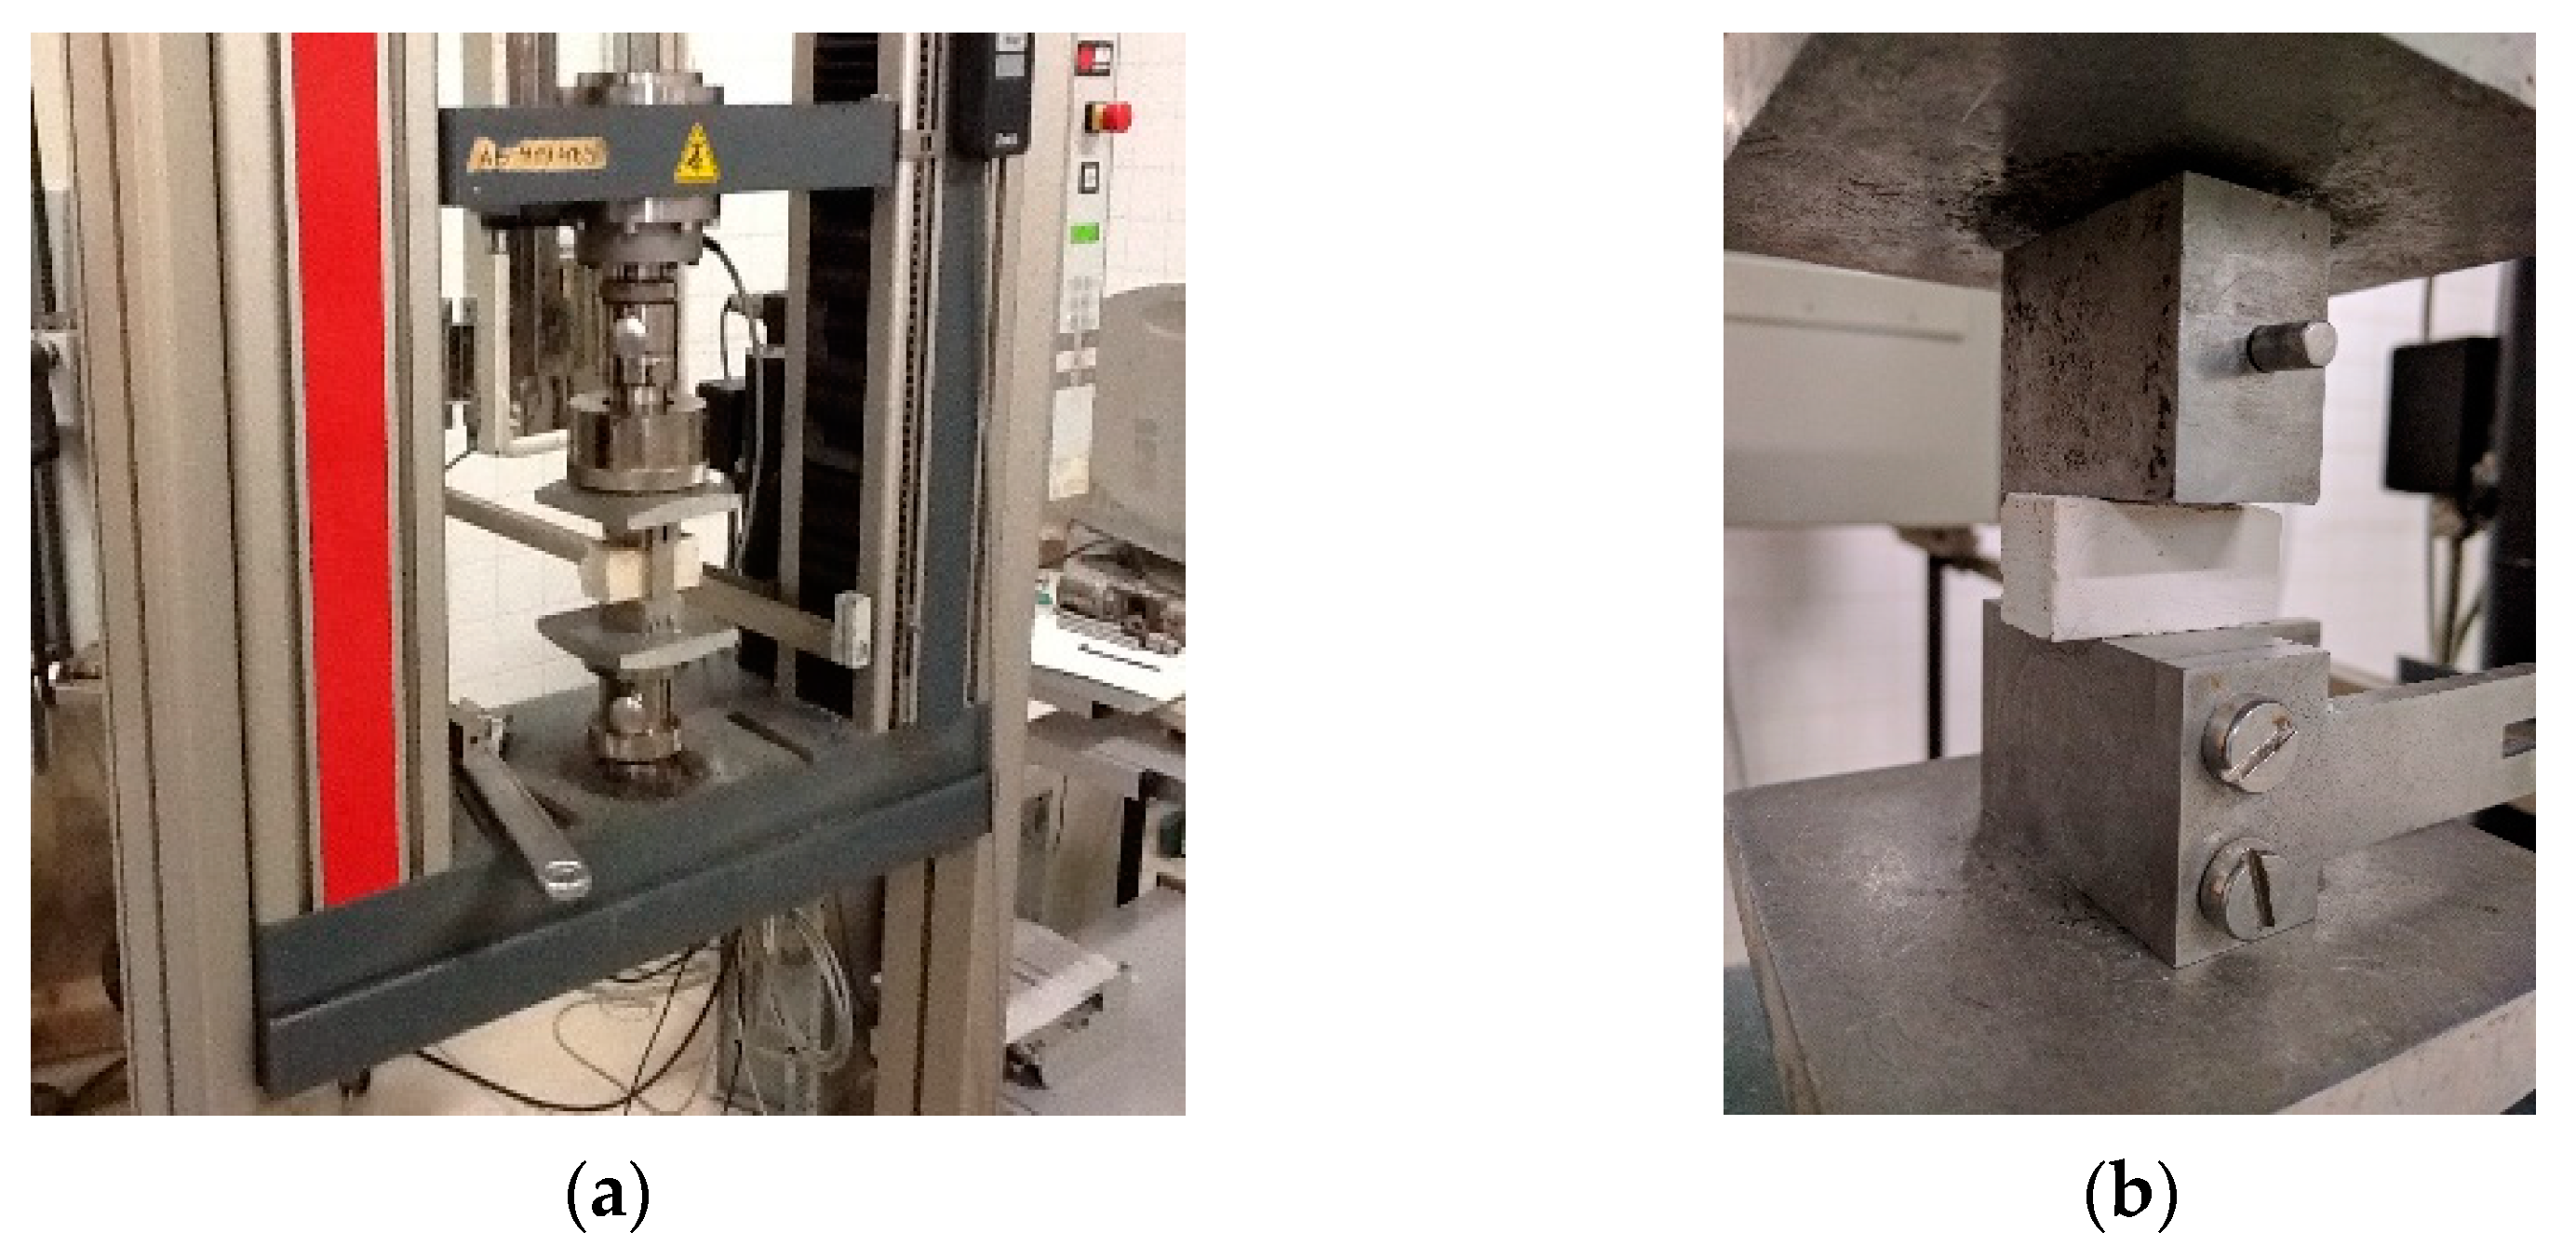
Compressive strength was determined following standard EN 1015-11:1999 [38]. It is noteworthy to mention that the aforementioned standard is for specimens with standard dimensions (40 × 40 × 160 mm3) and the specimens used in this study have reduced size (20 × 20 × 80 mm3); this means this standard was followed but with non-standard size specimens. Compressive strengths of grouts at the age of 28 days were obtained using a universal traction machine, Zwick Z050 (Figure 3), with a load cell of 50 kN and displacement rate of 0.7 mm/min.
2.3.4. Open Porosity
Open porosity was measured by saturation with water of the samples of each grout under vacuum and hydrostatic weighting based on EN 1936:2006 [39]. It should be noted that there is no specific standard for this type of test in grouts. So, the choice of the natural stone standard is due, on the one hand, to the fact that they have already been used successfully in these materials and, on the other hand, to allow comparison of the results of this study with previous ones. The intact half of the specimens from the mechanical tests (on a minimum of three samples of each grout) were dried and placed under vacuum for 24 h (Figure 4a), then maintained under vacuum but immersed in water for another 24 h, and finally left for 24 h immersed at ambient pressure. After this procedure, the samples were hydrostatically (Figure 4b) and saturated weighed.
2.3.5. Water Absorption by Capillarity
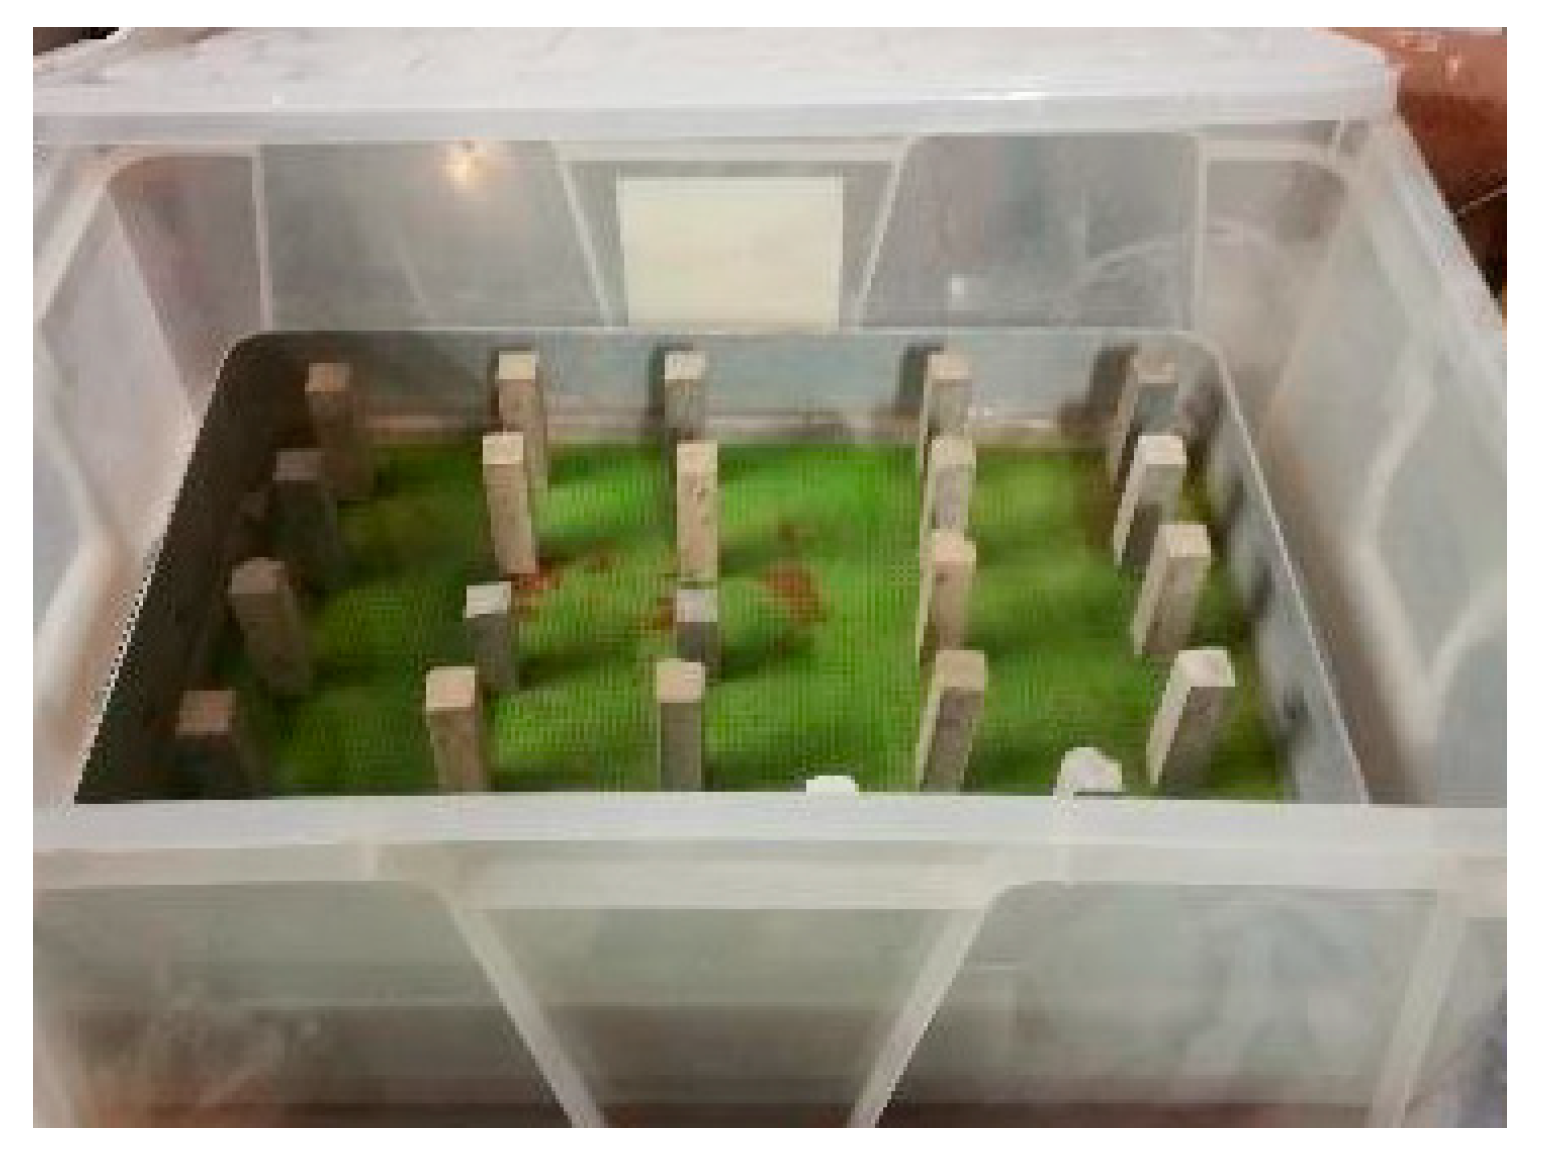
The test of water absorption by capillarity was performed based on EN 1015-18:2002 [40]. For each grout composition (Table 6), three specimens (out of seven), previously cured for 28 days, were used. The samples were vertically placed in a watertight box with a water depth of 2 mm (Figure 5), which was kept constant. The box was covered to maintain constant hygrothermal conditions. The grout specimens were weighed after 5, 10, 15 and 30 min and at each hour during the first 6 h of testing, and then weighed every 24 h. The capillary water absorption coefficient was determined by the angular coefficient of the linear part of the capillary absorption curve (i.e., absorbed water mass per unit of the surface versus time).
2.3.6. Drying
The drying test was performed based on RILEM specification, Test no. II.5 [41]. The test was conducted in a stable environment in terms of temperature and humidity (T = 20 ± 3 °C and RH = 65 ± 5%). This test was carried out after the capillary test was completed, and for this test the same test specimens of the capillary water absorption were used. Only the top of the samples were not waterproofed, and the test began when the capillary test stopped. The samples were weighed in the first hours and daily thereafter until all the samples met equilibrium with the environmental conditions. The drying curve was built, relating to, in the x-axis, the time in hours and, in the y-axis, the water content in kg/m2. The drying rate was calculated by the slope of the initial portion of the drying curve and represents the velocity of water drying.
3. Results and Discussion
The experimental results (see Table A1) obtained for each experiment defined in Table 6 were analysed using the S/N ratio by the Taguchi method. The calculated S/N ratios and the average values of each property studied are presented in Table 7.
In the following paragraphs, the evaluation of the analyses of variance (ANOVA) and the influence of the level of each factor on the properties under study is presented and discussed.
3.1. Rheological Measurements
The rheological properties of injection grouts are critical parameters because they affect the fresh performance and therefore the success of the consolidation operation because grouts need to flow in the grouting pipe and in the masonry’s flow channels until they reach the voids in the masonry inner core. Factors such as mineralogical composition, admixtures, w/b ratio and solid particle size distribution will affect the rheological properties of injection grouts [42,43,44]. Thus, an understanding and control of the rheology evolution of grout is essential to ascertain their optimal grout injection technique as well as their strength and durability after hardening. The rheological parameters, yield stress and plastic viscosity were obtained through the fitting of the rheological models to the flow curves.
In Figure 6, the level average graphs are shown or, in other words, the evolution trend of yield stress is shown as a function of the level of each factor studied. The y-axis values were defined according to the range of results experimentally obtained for each parameter. Each point in the graphs of Figure 6 represents the mean yield stress value of a level, and the line is the cubic spline interpolation between points. The yield stress enables us to evaluate if a grout will flow or not because it represents that threshold. This important property affects the flow behaviour of the grout and its capacity to flow inside the masonry core, because a smaller yield stress means an easier injection process, with lower pressures [45].
In Figure 6, it is evident that a considerable increase of yield stress occurs between the levels 1–2 of NS dosage, whereas between levels 2–3, the curve slope tends to stabilize. In the case of SF, a similar increase trend was obtained between level 1–2; however, in this case the increase continued between levels 2–3. SF caused a 100-fold increase in yield stress when the dosage increased from 0% (level 1) to 0.5% (level 2). These values are consistence with the observations of Mohammed [46] that an increase in yield stress around 20 to 105% was obtained in the presence of SF. An increase of NS or SF content will promote the packing of particles, decreasing the volume between them and decreasing the free water. Therefore, there is a higher internal friction between solid particles [47]. From these results, the necessity of a dispersing agent, as is the case of the HRWR, is confirmed. The dispersant action of the HRWR is quite obvious, because the increase of the HRWR dosages from 0.1% (level 1) to 0.35% (level 3) significantly reduces the yield stress value (see Figure 6).
The yield stress values were analyzed using descriptive statistics, being subjected to an analysis of variance (ANOVA), whose results are presented in Table 8. The analysis of the contribution of each factor considered in this study reveals that HRWR dosage is the factor with the highest impact on yield stress values. SF is the parameter with the second major influence, followed by the NS.
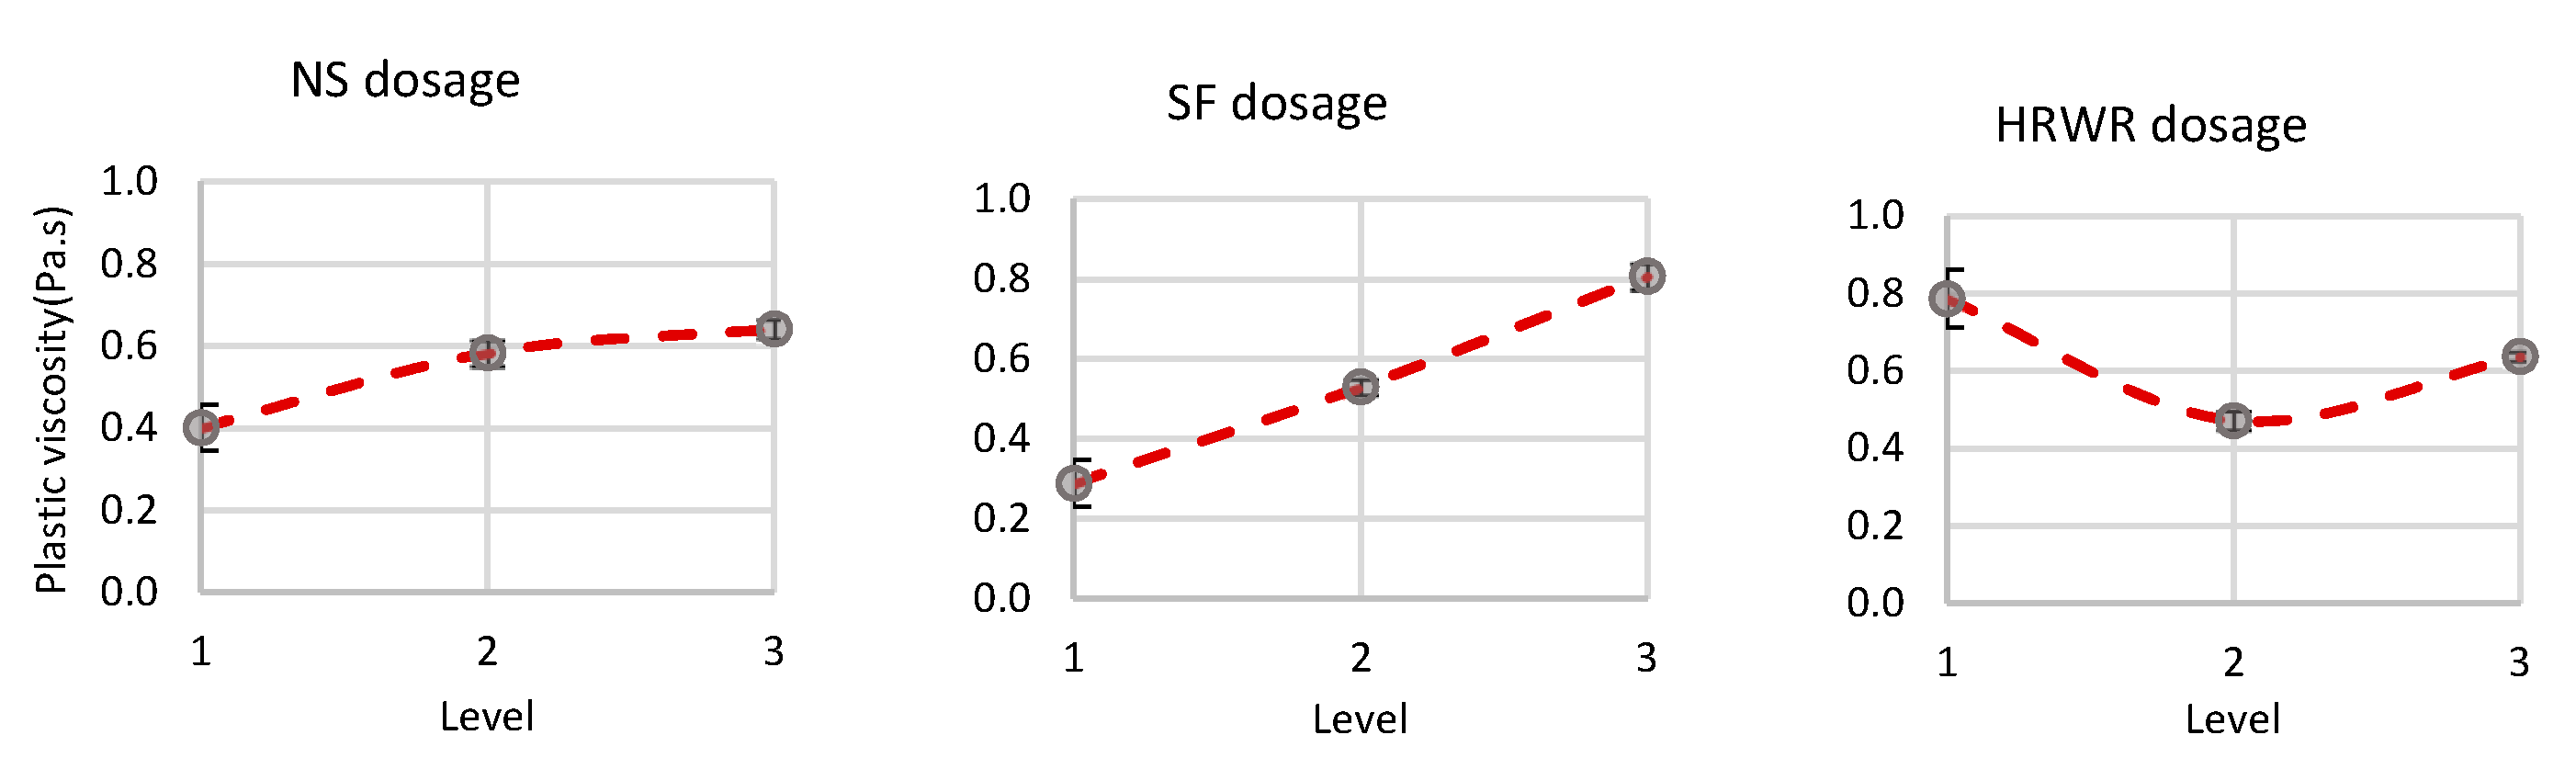
Plastic viscosity is associated with the flow resistance once flow is initiated. Figure 7 presents the evolution of the plastic viscosity; the increase of the dosages of the three factors studied has a similar influence on that shown in the yield stress. Increasing the dosages of the NS and SF contributes to increasing the values of plastic viscosity (Figure 7), which is not desirable in a grout for masonry consolidation. Even for the lowest dosage of NS and SF, it can be observed that plastic viscosity increased in relation to the reference grout (level 1). The addition of NS leads to an increase of specific surface, causing a decrease of grout flowability, and therefore lower injectability will be obtained [48,49]. The same effect was observed by Senff et al. [50], which showed a considerable change in the plastic viscosity of the cementitious pastes proportioned with NS.
From Table 9 it is clear that the NS dosage is the factor with the greatest influence on viscosity values. As reported elsewhere [15,30], the addition of particles with a high specific surface promotes a great influence in the rheological parameters, namely in the plastic viscosity.
The introduction of small-sized particles as NS and SF is the source of additional surface area, resulting in an increase of contact forces among fine particles, leading to easier coagulation due to interparticle interactions (Van-der-Waal’s interactions). The penetration capacity of such grouts is significantly decreased, making their injection at low pressure rather difficult. Thus, to overcome this negative consequence, the w/b ratio can be increased. Notwithstanding, the simple addition of water to make the grout more fluid is an inappropriate option because a higher w/b ratio will weaken the grout in the hardened state, and it will increase the shrinkage deformations and increase the free water amount that also contributes to instability phenomena [51]. This negative contribution can be compensated by the introduction of HRWR that decreases the plastic viscosity, as shown in Figure 7. The second most influential factor is the HRWR dosage (see Table 9). The slight increase in plastic viscosity caused by increasing the HRWR between levels 2–3 can be explained by some instability (segregation and bleeding) of the grout caused by the excessive dosage of the HRWR agent. Some authors have suggested that HRWR, when used at a higher dosage, has the reverse effect [51].
3.2. Mechanical Strenght
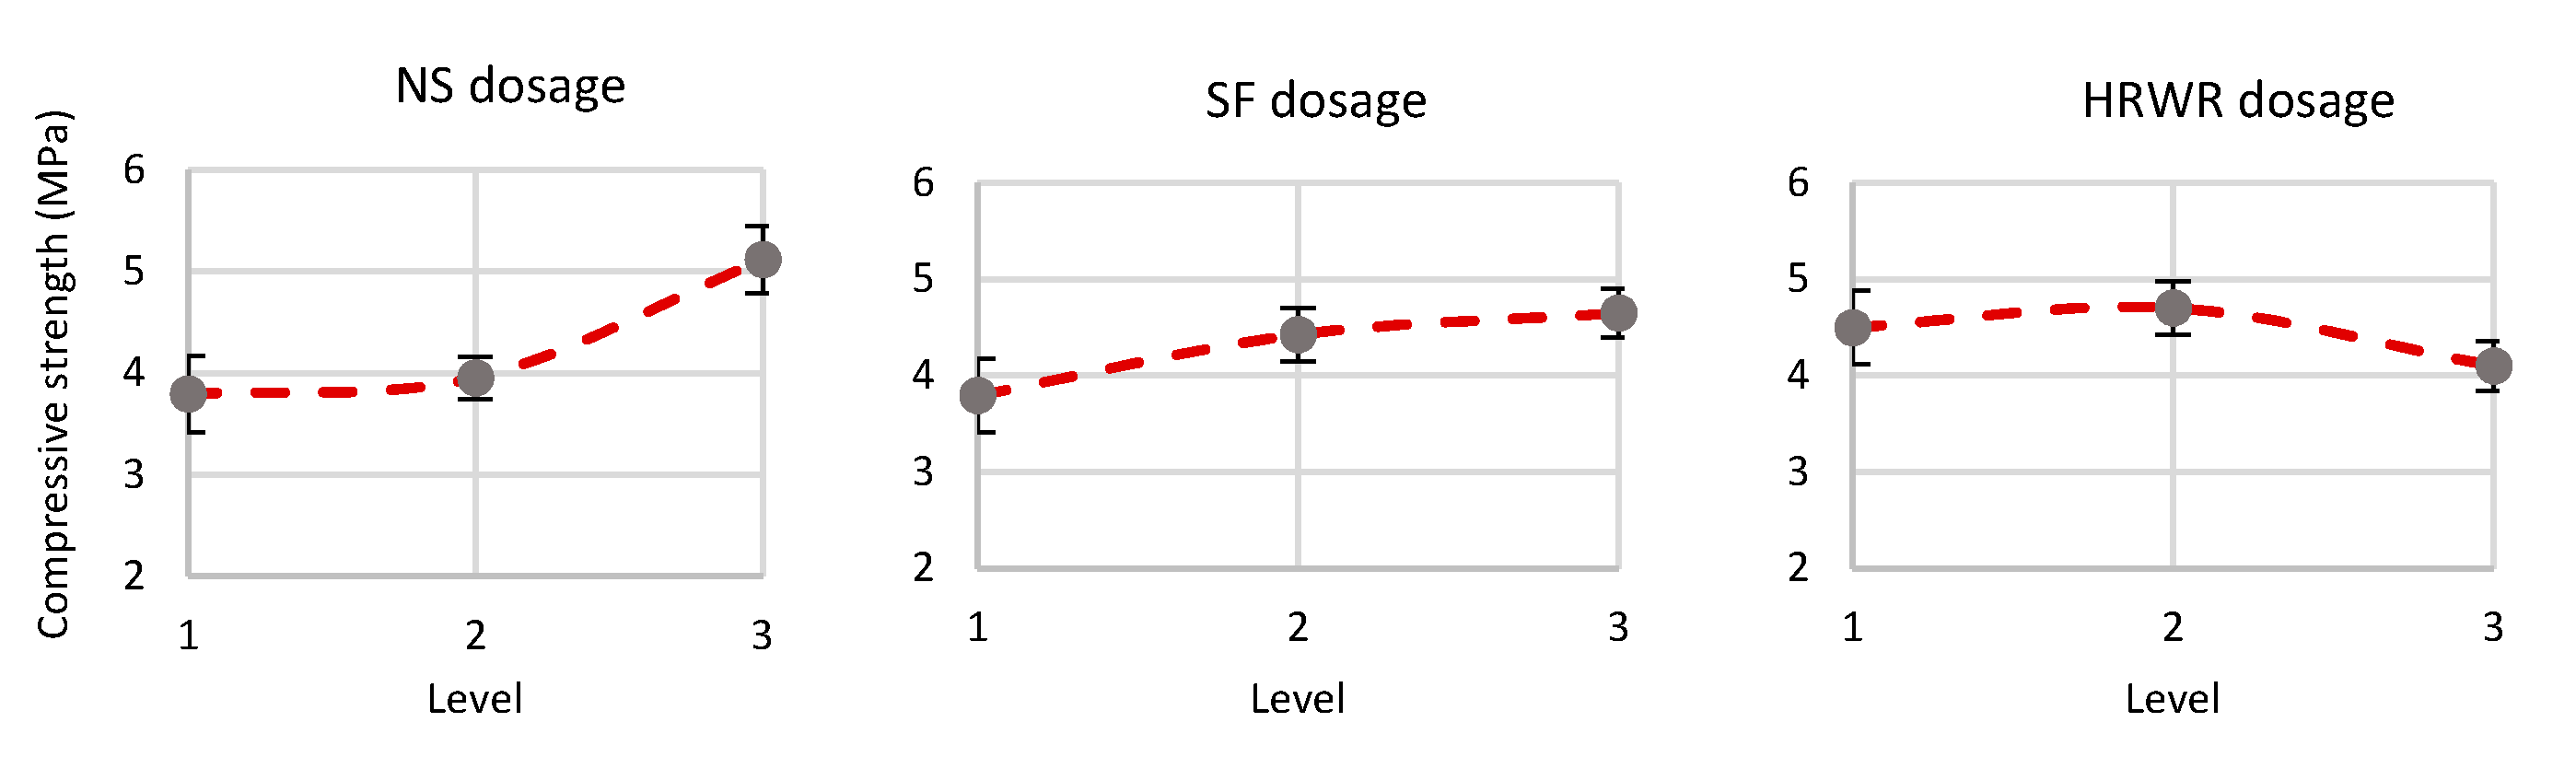
The compressive strength of injection grouts is an important parameter because old stone masonry walls are resistant walls, i.e., they must support all the floors and roof loads. In this sense, it should be ensured that the grouts are able to improve the load bearing capacity of the wall, in particular the compressive strength. Figure 8 shows the evolution of the compressive strength at 28 days as a function of the factors under study. Firstly, it is worth pointing out that these values were obtained with non-standard specimens, so the direct comparison with other studies, whose results were obtained for standard specimens, must be done carefully. In any case, a previous study [16] has shown a good correlation coefficient between the mechanical strength results of standard and nonstandard specimens. Even though the values of compressive strength may be slightly different from those that would have been obtained with standard specimens, the tendency to increase or decrease the mechanic strength would be the same regardless of the size of the specimens [16].
Through the analysis of Figure 8, an increasing trend of compressive strength values can be noticed, insofar as there is an increase in NS and SF dosage. However, by analysing the values of Table 10, it is possible to verify that NS and SF are the factors that have the greatest influence on the mechanical strength. So, it is expected that the combined effect of NS and SF brings many advantages to the mechanical strength of the consolidated walls, giving them the necessary mechanical resistance to withstand the compression loads. NS content of only 1 wt% (level 3) leads to compressive strength of around 5.2 MPa, while the maximum dosage (10%) of SF leads to 4.9 MPa. The explanation for this behaviour is based on the high amorphous silicon dioxide contend of NS and its high pozzolanic reactivity that consume and react with the Ca(OH)2 and produce additional calcium silicate hydrate (C-S-H) structures [52]. Similar behaviour has been obtained elsewhere [28]. Similar results were observed by Li et al. [53] and Jo et al. [54], who reported that compressive strength of cementitious mortar with NS increases, even though they also suggested that the use of higher contents of NS must be accompanied by adjustments to water and HRWR dosage in order to ensure the specimens do not suffer excessive self-desiccation and cracking.
It should be highlighted, however, that HRWR does not show a clear trend. As can be noted in Figure 8, increasing the dosage of HRWR from 0.1% (level 1) to 0.25% (level 2) represents a small increase in the compressive strength of the grouts. However, when the dosage increases to 0.35% (level 3) a reduction of approximately 0.6 MPa in the compressive strength was obtained. This can be justified by considering that higher HRWR content has a greater tendency to increase the incorporated air content as well as the phenomena of instability, which may weaken the microstructure of the grout [15,55]. In their study, Koohestani et al. [56] confirmed this behaviour. According to these authors, the polycarboxylate-based HRWR increases the dispersion of the NS, improving the performance in the fresh state but promoting the reduction of the compressive strength due to the reduction of the compactness of the materials in the hardened state.
3.3. Water Absorption and Open Porosity
The water absorption by capillarity is a parameter that depends on the open porosity of the materials. The smaller the amount of open porosity in the grouts, the lower the absorption of capillary water will be. Due to the extremely small dimensions of the NS, it promotes microstructures with higher compactness due to the ease of filling of voids between NHL particles. As previously described, the presence of NS is synonymous of higher concentration of C-S-H products that increase the compactness of the gouts, which reduces the porosity and makes the grouts’ microstructure more compact. In order to better understand the water absorption results, the grouts’ open porosity was determined by the hydrostatic method. In Figure 9, the evolution of the open porosity as a function of the parameters studied, and their levels, is presented, and it is possible to conclude that open porosity decreases with the increase of the NS dosage as well as with the increase of SF dosage.
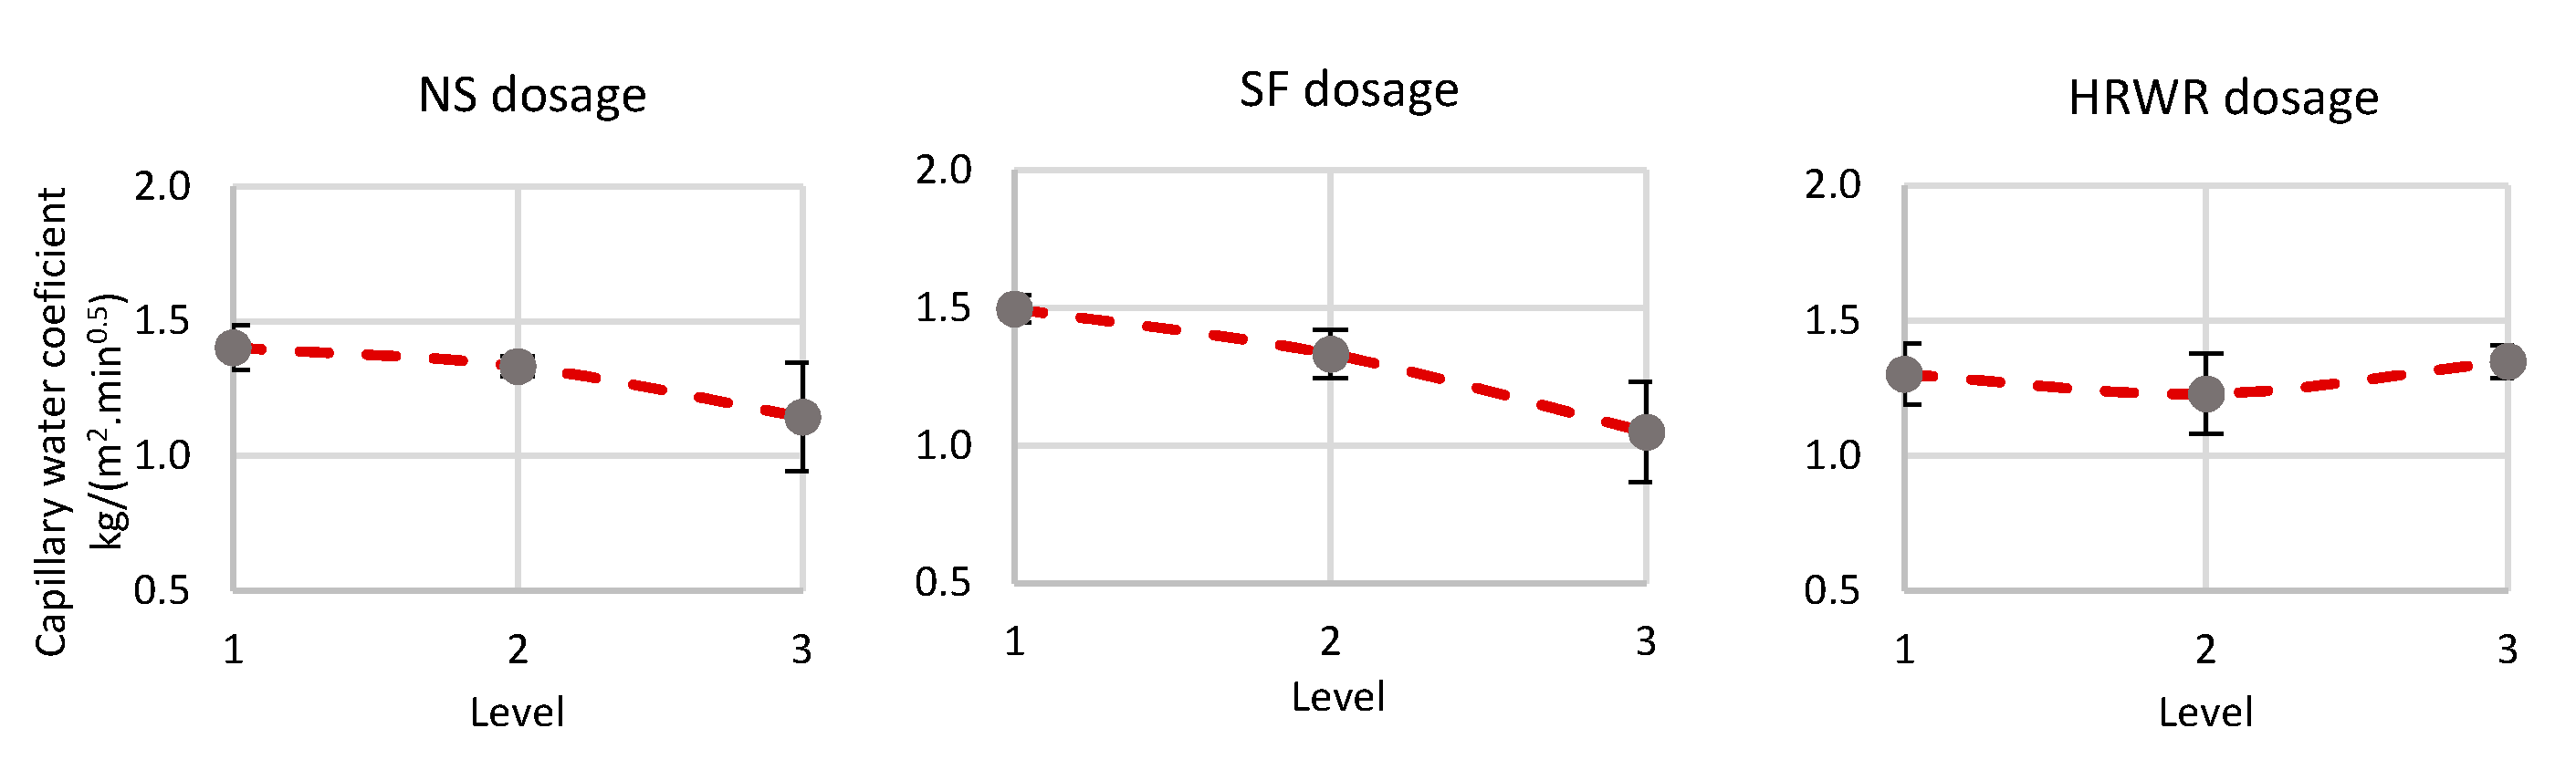
On the other hand, the increase of the HRWR dosage (namely between levels 2–3) leads to the increase of the open porosity. Such behaviour can be justified by the increase of the incorporated air caused by the high content of HRWR. The evolution of the capillary coefficient as a function of the dosage of the parameters under analysis is shown in Figure 10.
From the analysis of Figure 10, it is worth noting that NS has a similar contribution to SF, having the same filler effect. In this sense, the higher NS and SF dosage produces grouts with lower water absorption coefficients. This comes from the fact that NS and SF contribute to pore size refinement and matrix densification, and, consequently, the capillary pores are reduced. From a practical point of view, this effect can be understood considering that the SF fills the larger voids while those of smaller dimensions are filled by NS as a result of their nano size. Notwithstanding, SF dosage was the factor with the greatest contribution to the change in the water absorption coefficient by capillarity, followed by NS dosage (see Table 11); such results may be related to the contribution of these materials in changing the size of capillary pores.
The reduction of water absorption with increasing NS dosage was also reported in another study by Palla et al. [57], in which there was a reduction between 25 and 40% of the coefficient of water absorption by capillarity, converging with the results obtained in this study. In relation to HRWR, it can be seen that, for the intermediate dosage (level 2), it causes a slight reduction in the water absorption coefficient by capillarity, but between levels 2–3, an increase occurs, which corroborates the phenomenon described above, in which, for high HRWR dosages, the grout has a less compact microstructure.
3.4. Drying
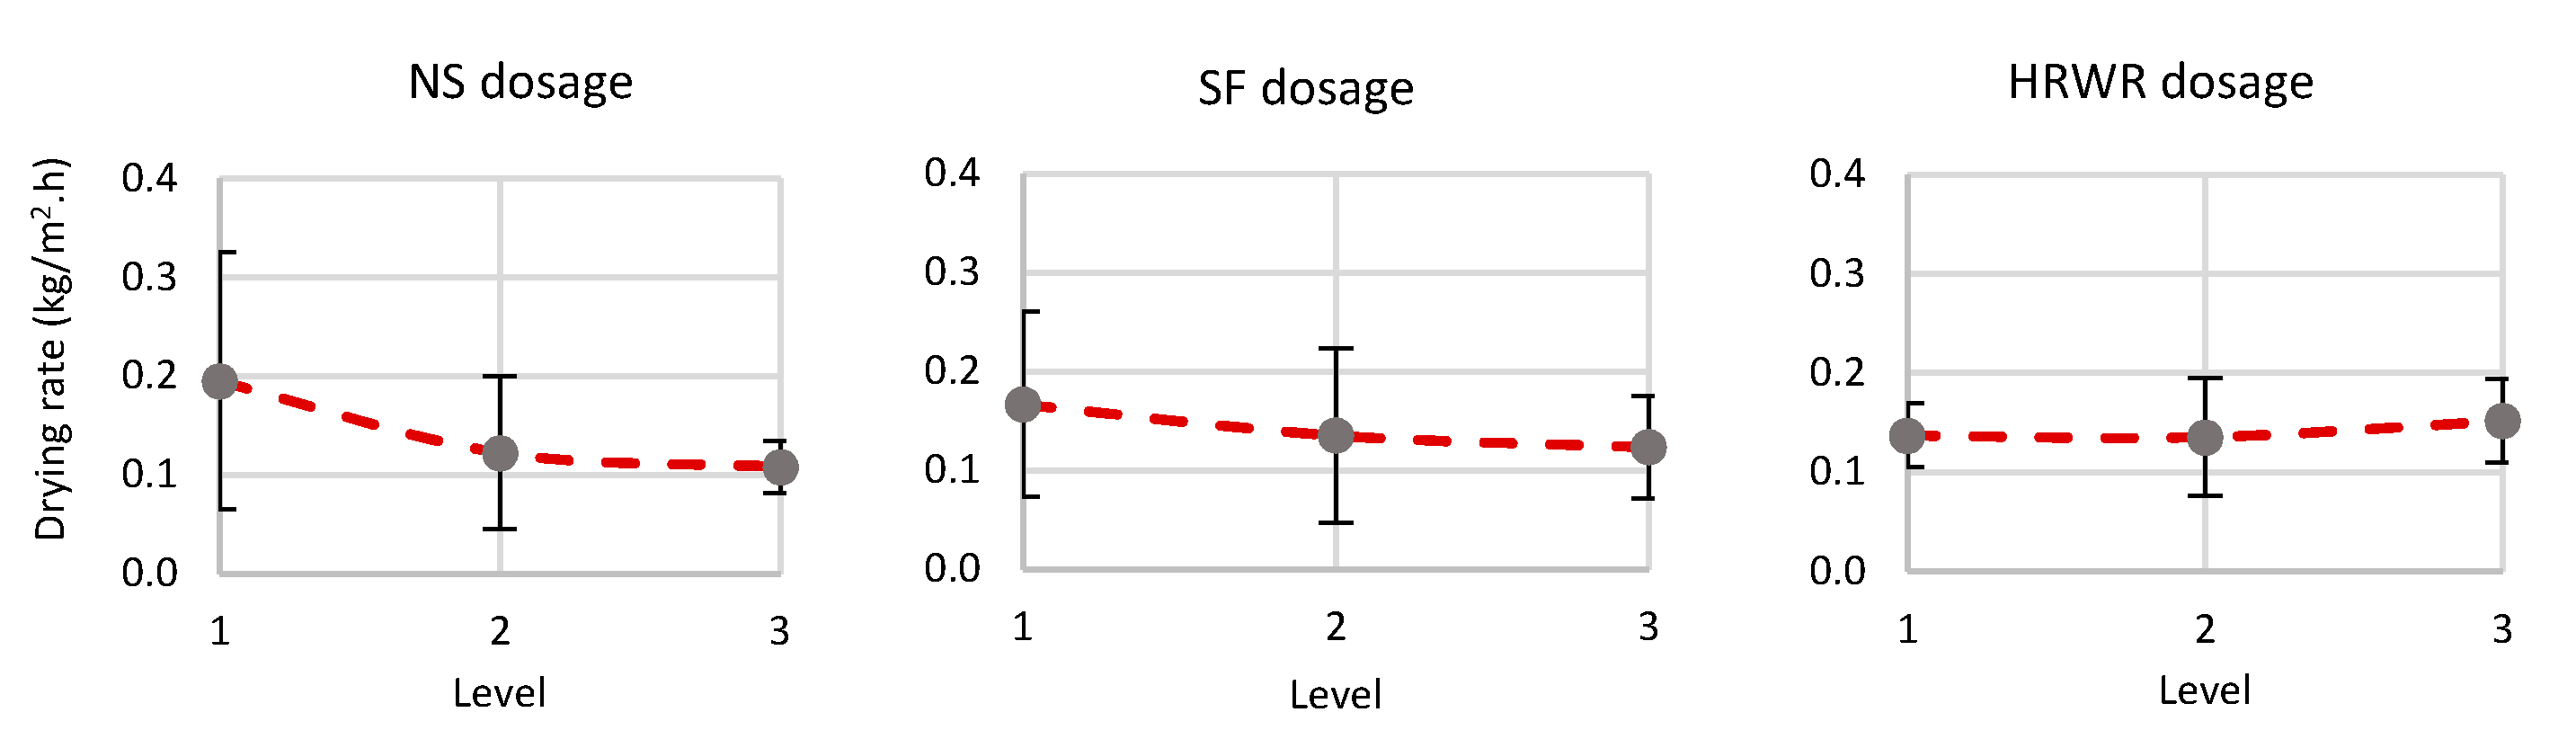
In Figure 11, it is possible to observe the evolution of the drying rate according to the levels of each factor analysed.
The increase of both NS and SF dosage shows a downward trend of the drying capacity of grouts (Figure 11). However, the presence of NS causes a higher reduction of the drying rate in contrast with SF. This may be due to its greater reactivity and consequent reduction of the porometry.
Noteworthy is the fact that, even though SF has caused a greater reduction of porosity (see Figure 9), the ease of drying is greater in the grout with SF. This effect may be due to the tortuosity of the pore system. The tortuosity depends on the shape of pores and, in an indirect way, on the connections of the pore system [58]. This means that, for the same or higher open porosity, it is possible to have a very complex network of pores with very narrow throats and a greater length of the path described by the pore space, which hinders the water vapor transport and, thereby, the drying process. NS is the most relevant factor in the drying rate, followed by SF, as shown in Table 12.
The HRWR dosage is the less significant factor, but its effect leads to a slight increase in drying capacity with increasing HRWR dosage, being the higher drying rate achieved for the HRWR dosage of 0.35 wt% (level 3). This slight change in drying rate may be associated, once again, with changes in the microstructure of the hardened grout caused by the HRWR. In fact, the HRWR does not react by a chemical action on hydrated products, but it affects the microstructure of the grout and changes the morphology and size of NHL hydration products [15,59]. On the other hand, for a higher dosages, a small increase in the drying rate was observed. It is believed this is due to some entrained air caused by the HRWR.
4. Conclusions
In this study, the Taguchi design of experiment (L9) was employed to study the contribution of different dosages of NS, SF and HRWR on the rheology, compressive strength, open porosity and water absorption of NHL-based grouts for old stone masonry consolidation. With the Taguchi method, the contribution of several factors (NS dosage, HRWR content, etc.) on different grout properties was investigated simultaneously. Moreover, with this method, the number of variable combinations was substantially reduced compared to one-factor-at-a-time experiments, which is an asset when it is intended to optimize the consumption of some raw materials. The conclusions drawn from this study, which are valid over the range of materials and experimental conditions used in this study, are summarized as follows:
- The increase in the dosage of NS and SF promotes the increase of yield stress and plastic viscosity. NS causes a 10-fold increase in yield stress when the dosage is increased from 0 wt% to 0.5 wt%.
- The rheological results confirmed the necessity and importance of a HRWR. Moreover, HRWR dosage is the factor with the highest impact on yield stress values.
- A slight increase in plastic viscosity with the increase of HRWR between the dosage of 0.25 and 0.35 wt% was obtained, which may be due to some instability phenomena.
- The compressive strength shows a tendency to grow with an increasing dosage of NF and SF. Nevertheless, these mechanical strength values were obtained with non-standard specimens, so the direct comparison with other studies must be done carefully because the values of compressive strength may be slightly different from those that would have been obtained with standard-size specimens.
- The open porosity decreases with the increase of the NS dosage as well as increasing the dosage of SF. On the other hand, the increase of the HRWR dosage leads to the increase of the open porosity, especially for dosages above 0.25 wt%.
- The presence of NS and SF produces grouts with lower water absorption coefficients. A 40% reduction in the water absorption coefficient was obtained for an NF dosage of 1 wt%. This comes from the fact that NS and SF contribute to pore size refinement and hardened matrix densification.
- NS causes a more pronounced reduction of the drying rate compared to SF. HRWR dosages higher than 0.25 wt% lead to an increase in the drying capacity, which is believed to be due to some entrained air caused by the HRWR.
Thanks to this study, it is possible to have a perspective on the contribution of NS in the behavior of NHL-based grouts for masonry consolidation. The authors would like to stress that the results summarised in this manuscript are part of a larger study and precede the analysis of the performance of those grouts when injected into different porous media that simulate old stone masonries.
Author Contributions
Conceptualization, L.G.B. and J.C.; methodology, L.G.B.; writing—original draft preparation, L.G.B. and J.C.; writing—review and editing, L.G.B. All authors have read and agreed to the published version of the manuscript.
Funding
This research was funded by Portuguese National Funds through FCT—Portuguese Foundation for Science and Technology, Reference UID/CTM/50025/2019 and FCT/MCTES under the Grant SFRH/BPD/108427/2015.
Data Availability Statement
Not applicable.
Conflicts of Interest
The authors declare no conflict of interest.
Appendix A
This appendix presents a table containing all the experimental data obtained for each parameter studied.

Table A1.
Experimental results of each sample/measurement for each experiment.
| Experiment | Yield Stress (Pa) | Plastic Viscosity (Pa.s) | Compressive Strength (MPa) | Open Porosity (%) | Water Absorption Coefficient (kg/(m2.min0.5)) | Drying Rate (kg/m2.h) | ||||||||||||||
|---|---|---|---|---|---|---|---|---|---|---|---|---|---|---|---|---|---|---|---|---|
| Measurement 1 | Measurement 2 | Measurement 3 | Measurement 1 | Measurement 2 | Measurement 3 | Sample 1 | Sample 2 | Sample 3 | Sample 4 | Sample 1.2 | Sample 2.2 | Sample 3.2 | Sample 4.2 | Sample 5 | Sample 6 | Sample 7 | Sample 5 | Sample 6 | Sample 7 | |
| I | 14.57 | 14.29 | 14.43 | 0.40 | 0.11 | 0.25 | 3.43 | 4.22 | 2.67 | 3.44 | 46.18 | 47.12 | 46.39 | 46.17 | 1.67 | 1.73 | 1.52 | 0.12 | 0.12 | 0.24 |
| II | 7.58 | 7.53 | 7.56 | 0.45 | 0.40 | 0.42 | 4.31 | 4.76 | 3.86 | 4.31 | 44.69 | 44.52 | 44.85 | 45.21 | 1.32 | 1.38 | 1.34 | 0.12 | 0.51 | 0.11 |
| III | 0.39 | 0.35 | 0.37 | 0.53 | 0.53 | 0.52 | 3.63 | 3.47 | 3.79 | 3.63 | 45.84 | 44.96 | 41.07 | 44.81 | 1.17 | 1.14 | 1.36 | 0.14 | 0.11 | 0.29 |
| IV | 6.08 | 5.94 | 6.01 | 0.31 | 0.28 | 0.30 | 3.25 | 2.97 | 3.11 | 3.11 | 46.25 | 45.96 | 46.85 | 46.28 | 1.48 | 1.50 | 1.46 | 0.10 | 0.09 | 0.45 |
| V | 0.01 | 0.002 | 0.005 | 0.27 | 0.24 | 0.26 | 3.83 | 4.12 | 3.54 | 3.83 | 45.62 | 45.49 | 45.61 | 44.99 | 1.50 | 1.44 | 1.41 | 0.02 | 0.05 | 0.02 |
| VI | 232.28 | 231.32 | 231.80 | 1.26 | 1.14 | 1.20 | 5.26 | 4.57 | 4.93 | 4.92 | 43.59 | 43.86 | 43.65 | 43.15 | 1.10 | 1.07 | 1.03 | 0.12 | 0.13 | 0.11 |
| VII | 0.06 | 0.04 | 0.04 | 0.34 | 0.30 | 0.32 | 4.83 | 5.32 | 4.34 | 4.83 | 46.09 | 46.07 | 48.12 | 46.27 | 1.37 | 1.35 | 1.39 | 0.12 | 0.12 | 0.14 |
| VIII | 184.14 | 183.62 | 183.04 | 0.93 | 0.89 | 0.91 | 5.42 | 4.84 | 5.13 | 5.13 | 44.07 | 44.19 | 43.96 | 43.97 | 1.11 | 1.07 | 1.42 | 0.12 | 0.12 | 0.15 |
| IX | 102.90 | 102.30 | 102.60 | 0.73 | 0.66 | 0.70 | 5.39 | 4.96 | 5.82 | 5.39 | 42.66 | 42.47 | 43.00 | 41.60 | 0.89 | 0.45 | 1.24 | 0.09 | 0.11 | 0.01 |
References
- Carocci, C.F. Guidelines for the safety and preservation of historical centres in seismic areas. In Historical Constructions; Lourenço, P.B., Roca, P., Eds.; University of Minho: Guimares, Portugal, 2001; pp. 145–166. [Google Scholar]
- Miranda, L.; Milosevic, J.; Bento, R. Cyclic behaviour of stone masonry walls strengthened by grout injection. Mater. Struct. 2017, 50, 1–17. [Google Scholar] [CrossRef]
- Valluzzi, M.R.; Porto, F.; Modena, C. Behavior and modeling of strengthened three-leaf stone masonry walls. Mater. Struct. 2004, 37, 184–192. [Google Scholar] [CrossRef]
- Ferretti, F.; Incerti, A.; Tilocca, A.R.; Mazzotti, C. In-plane shear behavior of stone masonry panels strengthened through grout injection and fibre-reinforced cementitious matrices. Int. J. Archit. Herit. 2019, 1–20. [Google Scholar] [CrossRef]
- Penelis, G.; Karaveziroglou, M.; Papayanni, J. Grouts for repairing and strengthening old masonry structural. In Structural Repair and Maintenance of Historical Buildings; Brebbia, C.A., Ed.; Computational Mechanics Publications: Basel, Switzerland, 1989; pp. 79–188. [Google Scholar]
- Antonacci, E.; Aloisio, A.; Galeota, D.; Alaggio, R.; The, S. Maria di Collemaggio basilica: From vulnerability assessment to first results of SHM. J. Archit. Eng. 2020, 26, 05020007. [Google Scholar] [CrossRef]
- Miltiadou, A. Contribution à l’étude des Coulis Hydraulique pour la Réparation et le Renforcement des Structures et des Monuments Historiques en Maçonnerie. Ph.D. Thesis, ENPC Paris, Marne-la-Vallée, France, 1990. [Google Scholar]
- Vintzileou, E.; Mouzakis, C.; Adami, C.-E.; Karapitta, L. Seismic behavior of three-leaf stone masonry buildings before and after interventions: Shaking table tests on a two-storey masonry model. Bull. Earthq. Eng. 2015, 13, 3107–3133. [Google Scholar] [CrossRef]
- Collepardi, M. Degradation and restoration of masonry walls of historical buildings. Mater. Struct. 1990, 23, 81–102. [Google Scholar] [CrossRef]
- Binda, L.; Penazzi, D.; Saisi, A. Historic Masonry Buildings: Necessity of a Classification of Structures and Masonries for the Adequate Choice of Analytical Models. In Proceedings of the VI International Symposium Computer Methods in Structural Masonry-STRUMAS, Rome, Italy, 22–24 September 2003; pp. 168–173. [Google Scholar]
- Mirza, J.; Mirza, M.S.; Roy, V.; Saleh, K. Basic rheological and mechanical properties of high-volume fly ash grouts. Science 2002, 16, 353–363. [Google Scholar] [CrossRef]
- Eriksson, M.; Friedrich, M.; Vorschulze, C. Variations in the rheology and penetrability of cement-based grouts—An experimental study. Cem. Concr. Res. 2004, 34, 1111–1119. [Google Scholar] [CrossRef]
- Fernàndez-Altable, V.; Casanova, I. Influence of mixing sequence and superplasticiser dosage on the rheological response of cement pastes at different temperatures. Cem. Concr. Res. 2006, 36, 1222–1230. [Google Scholar] [CrossRef]
- Bras, A. Grout Optimization for Masonry Consolidation. Ph.D. Thesis, NOVA University of Lisbon, Lisbon, Portugal, 2011. [Google Scholar]
- Baltazar, L.G.; Henriques, F.M.A.; Cidade, M.T. Contribution to the design of hydraulic lime-based grouts for masonry consolidation. J. Civ. Eng. Manag. 2015, 21, 698–709. [Google Scholar] [CrossRef]
- Baltazar, L.G.; Henriques, F.M.A.; Cidade, M.T. Grouts with improved durability for masonry consolidation: An experimental study with non-standard specimens. Key Eng. Mater. 2017, 747, 480–487. [Google Scholar] [CrossRef]
- Binda, L.; Modena, C.; Baronio, G.; Abbaneo, S. Repair and investigation techniques for stone masonry walls. Constr. Build. Mater. 1997, 11, 133–142. [Google Scholar] [CrossRef]
- Van Rickstal, F.; Toumbakari, E.-E.; Ignoul, S.; Van Gement, D.A. Development of mineral grouts for consolidation injection. In Consolidation of Masonry, Advances in Materials Science and Restoration; Van Gemert, D., Ed.; Aedificatio: Freiburg, Germany, 2003; pp. 61–75. [Google Scholar]
- Luso, E.; Lourenço, P.-B. Experimental characterization of commercial lime based grouts for stone masonry consolidation. Constr. Build. Mater. 2016, 2, 216–225. [Google Scholar] [CrossRef] [Green Version]
- Antonovic, V.; Pundiene, I.; Stonys, R.; Cesniene, J.; Keriené, J. A review of the possible applications of nanotechnology in refractory concrete. J. Civ. Eng. Manag. 2010, 16, 595–602. [Google Scholar] [CrossRef]
- Hosseini, P. Toward green revolution in concrete industry: The role of nanotechnology (a review). Aust. J. Basic Appl. Sci. 2011, 5, 2768–2782. [Google Scholar]
- Pacheco-Torgal, F.; Miraldo, S.; Ding, Y.; Labrincha, J.A. Targeting HPC with the help of nanoparticles: An overview. Constr. Build. Mater. 2013, 38, 365–370. [Google Scholar] [CrossRef] [Green Version]
- Aleem, S.A.E.; Heikal, M.; Morsi, W.M. Hydration characteristic, thermal expansion and microstructure of cement containing nano-silica. Constr. Build. Mater. 2014, 59, 151–160. [Google Scholar] [CrossRef]
- Senff, L.; Labrincha, J.A.; Ferreira, V.M.; Hotza, D.; Repette, W.L. Effect of nano-silica on rheology and fresh properties of cement pastes and mortars. Constr. Build. Mater. 2009, 23, 2487–2491. [Google Scholar] [CrossRef]
- Berra, M.; Carassiti, F.; Mangialardi, T.; Paolini, A.E.; Sebastiani, M. Effects of nanosilica addition on workability and compressive strength of Portland cement pastes. Constr. Build. Mater. 2012, 35, 666–675. [Google Scholar] [CrossRef]
- Qing, Y.; Zenan, Z.; Deyu, K.; Rongshen, C. Influence of nano-SiO2 addition on properties of hardened cement paste as compared with silica fume. Constr. Build. Mater. 2007, 21, 539–545. [Google Scholar] [CrossRef]
- Stefanidou, M. Influence of nano-SiO2 on the Portland cement pastes. Compos. Part B Eng. 2012, 43, 2706–2710. [Google Scholar] [CrossRef]
- Luo, K.; Li, J.; Lu, J.; Jiang, J.; Niu, Y. Effect of nano-SiO2 on early hydration of natural hydraulic lime. Constr. Build. Mater. 2019, 216, 119–127. [Google Scholar] [CrossRef]
- Roy, R.K. Design of Experiments Using Taguchi Approach: 16 Steps to Product and Process Improvement; Wiley: Hoboken, NJ, USA, 2011. [Google Scholar]
- Baltazar, L.G.; Henriques, F.M.A.; Jorne, F.; Cidade, M.T. The use of rheology in the study of the composition effects on the fresh behaviour of hydraulic lime grouts for injection of masonry walls. Rheol. Acta 2013, 52, 127–138. [Google Scholar] [CrossRef]
- Binda, L.; Saisi, A.; Tedeschi, C. Compatibility of materials used for repair of masonry buildings: Research and applications. In Fracture and Failure of Natural Building Stone; Springer: Amsterdam, The Netherlands, 2006; pp. 167–182. [Google Scholar]
- EN 459–1. Building Lime. Part 1: Definitions, Specifications and Conformity Criteria; CEN, European Committee for Standardization: Brussels, Belgium, 2015. [Google Scholar]
- Prince, W.; Edwards-Lajnef, M.; Aitcin, P.C. Interaction between Ettringite and a Polynaphthalene Sulfonate Superplasticizer in a Cementitious Paste. Cem. Concr. Res. 2002, 32, 79–85. [Google Scholar] [CrossRef]
- Shannag, M.J. High strength concrete containing natural pozzolan and silica fume. Cem. Concr. Compos. 2000, 22, 399–406. [Google Scholar] [CrossRef]
- Wei-Hsing, H. Properties of cement-fly ash grout admixed with ben- tonite, silica fume, or organic fiber. Cem. Concr. Res. 1997, 27, 395–406. [Google Scholar]
- Baltazar, L.G.; Henriques, F.M.A.; Cidade, M.T. Rheological characterization of injection grouts using rotational rheometry. In Advances in Rheology Research; Nova Science Publishers: New York, NY, USA, 2017; pp. 13–42. [Google Scholar]
- Baltazar, L.G.; Henriques, F.M.A. Rheology of grouts for masonry injection. Key Eng. Mater. 2015, 624, 283–290. [Google Scholar] [CrossRef]
- EN 1015–11. Methods of Test for Mortar for Masonry. Determination of Flexural and Compressive Strength of Hardened Mortar; CEN, European Committee for Standardization: Brussels, Belgium, 2019. [Google Scholar]
- EN 1936. Natural Stone Test Methods–Determination of Real Density and Apparent Density, and of Total and Open Porosity; CEN, European Committee for Standardization: Brussels, Belgium, 2006. [Google Scholar]
- EN 1015–18. Methods of Test for Mortar for Masonry–Part 18: Determination of Water Absorption Coefficient Due to Capillary Action of Hardened Rendering Mortar; CEN, European Committee for Standardization: Brussels, Belgium, 2002. [Google Scholar]
- RILEM. Recommended tests to measure the deterioration of stone and to assess the effectiveness of treatment methods. Test no. II.5–Evaporation curve. Mater. Struct. 1980, 75, 175–253. [Google Scholar]
- Jorne, F.; Henriques, F.M.A.; Baltazar, L.G. Injection capacity of hydraulic lime grouts in different porous media. Mater. Struct. 2014, 48, 2211–2233. [Google Scholar] [CrossRef]
- Palacios, M.; Alonso, M.M.; Varga, C.; Puertas, F. Influence of the alkaline solution and temperature on the rheology and reactivity of alkali-activated fly ash pastes. Cem. Concr. Compos. 2018, 95, 277–284. [Google Scholar] [CrossRef]
- Baltazar, L.G.; Henriques, F.M.A.; Cidade, M.T. Rheology of natural hydraulic lime grouts for conservation of stone masonry-influence of compositional and processing parameters. Fluids 2019, 4, 13. [Google Scholar] [CrossRef] [Green Version]
- Jorne, F.; Henriques, F.M.A.; Baltazar, L.G. Influence of superplasticizer, temperature, resting time and injection pressure on hydraulic lime grout injectability. Correlation analysis between fresh grout parameters and grout injectability. J. Build. Eng. 2015, 4, 140–151. [Google Scholar] [CrossRef]
- Mohammed, A.S. Effect of temperature on the rheological properties with shear stress limit of iron oxide nanoparticle modified bentonite drilling muds. Egypt. J. Pet. 2017, 26, 791–802. [Google Scholar] [CrossRef] [Green Version]
- Ltifi, M.; Guefrech, A.; Mounanga, P.; Khelidj, A. Experimental study of the effect of addition of nano-silica on the behaviour of cement mortars Mounir. Procedia Eng. 2011, 10, 900–905. [Google Scholar] [CrossRef] [Green Version]
- Toumbakari, E.-E. Lime-Pozzolan-Cement Grouts and Their Structural Effects on Composite Masonry Walls. Ph.D. Thesis, Katholieke Universiteit Leuven, Leuven, Belgium, 2002. [Google Scholar]
- Assaad, J.; Daou, Y. Cementitious grouts with adapted rheological properties for injection by vacuum. Cem. Concr. Res. 2014, 59, 43–54. [Google Scholar] [CrossRef]
- Senff, L.; Ascensão, G.; Hotza, D.; Ferreira, V.M.; Labrincha, J.A. Assessment of the single and combined effect of superabsorbent particles and porogenic agents in nanotitania-containing mortars. Energy Build. 2016, 127, 980–990. [Google Scholar] [CrossRef]
- Banfill, P.F.G. Additivity effects in the rheology of fresh concrete containing water-reducing admixtures. Constr. Build. Mater. 2011, 25, 2955–2960. [Google Scholar] [CrossRef]
- Shihada, S.; Arafa, M. Effects of silica fume, ultrafine and mixing sequences on properties of ultra high performance concrete. Asian J. Mater. Sci. 2010, 2, 137–146. [Google Scholar] [CrossRef] [Green Version]
- Li, H.; Xiao, H.G.; Ou, J.P. A study on mechanical and pressure-sensitive properties ofcement mortar with nanophase materials. Cem. Concr. Res. 2004, 34, 435–438. [Google Scholar] [CrossRef]
- Jo, B.W.; Kim, C.H.; Tae, G.H.; Park, J.B. Characteristics of cement mortar with nano-SiO2 particles. Constr. Build. Mater. 2007, 21, 1351–1355. [Google Scholar] [CrossRef]
- Baltazar, L.G.; Henriques, F.M.A.; Cidade, M.T. Experimental study and modeling of rheological and mechanical properties of NHL grouts. J. Mater. Civ. Eng. 2015, 27. [Google Scholar] [CrossRef]
- Koohestani, B.; Belem, T.; Koubaa, A.; Bussière, B. Experimental investigation into the compressive strength development of cemented paste backfill containing Nano-silica. Cem. Concr. Compos. 2016, 72, 180–189. [Google Scholar] [CrossRef]
- Palla, R.; Karade, S.R.; Mishra, G.; Sharma, U.; Singh, L.P. High strength sustainable concrete using silica nanoparticles. Constr. Build. Mater. 2017, 138, 285–295. [Google Scholar] [CrossRef]
- Hall, C.; Hoff, W. Water Transportation in Brick, Stone and Concrete; Taylor and Francis: London, UK, 2002. [Google Scholar]
- Demir, I.; Baspinar, M.S. Effect of silica fume and expanded perlite addition on the technical properties of the fly ash–lime–gypsum mixture. Constr. Build. Mater. 2008, 22, 1299–1304. [Google Scholar] [CrossRef]
Figure 1.
Grout preparation: (a) Sonicator for dispersion of NS; (b) Sonicator apparatus used.

Figure 2.
Prismatic specimens: (a) Molds for samples with 20 × 20 × 80 mm3; (b) Illustration of some specimens after demolding.
Figure 2.
Prismatic specimens: (a) Molds for samples with 20 × 20 × 80 mm3; (b) Illustration of some specimens after demolding.

Figure 3.
Set-up of the mechanical testing machine: (a) Mechanical test machine; (b) Compressive test.
Figure 3.
Set-up of the mechanical testing machine: (a) Mechanical test machine; (b) Compressive test.

Figure 4.
Set-up of open porosity test: (a) Desiccator to create vacuum; (b) Hydrostatic weighing apparatus.
Figure 4.
Set-up of open porosity test: (a) Desiccator to create vacuum; (b) Hydrostatic weighing apparatus.

Figure 5.
Box where the capillarity test took place.

Figure 6.
Influence of factors on yield stress values.

Figure 7.
Influence of factors on plastic viscosity values.

Figure 8.
Influence of factors on compressive strength values.

Figure 9.
Influence of factors on open porosity values.

Figure 10.
Influence of factors on water absorption coefficient by capillarity values.

Figure 11.
Influence of factors on drying rate values.

Table 1.
Natural hydraulic lime characteristics (data provided by the manufacturer).
| Fineness | 90 µm | 24.8% |
| 200 µm | 2.9% | |
| Setting time | Start | 2 h |
| End | 6 h | |
| Specific surface area | 480 m2/kg | |
| Al2O3 | 2.00% | |
| CaO | 85.00% | |
| Fe2O3 | 2.00% | |
| MgO | 1.00% | |
| MnO | 0.03% | |
| SiO2 | 8.00% | |
| SiC | 0.01% | |
| SO3 | 1.00% | |
| SrO | 0.05% | |
| K2O | 0.70% | |
Table 2.
Silica fume characteristics.
| Product Form | Undensified Powder |
|---|---|
| Colour | dark grey |
| Bulk density (g/cm3) | 2.20 |
| Specific surface area | 17.5 m2/g |
| Al2O3 | 0.15% |
| SiO2 | 97% |
| Fe2O3 | 0.03% |
| Na2O | 0.05% |
| MgO | 0.30% |
| CaO | 0.20% |
| SiC | 0.50% |
| K2O | 0.80% |
Table 3.
Nano-silica characteristics (data provided by the manufacturer).
| Product Form | Powder |
|---|---|
| Colour | white |
| Specific surface area | 235 m2/g |
| Principal action | pozzolanic |
| Secondary action | filler |
| Purity | >96.3% |
| Ti | <120 ppm |
| Ca | <20 ppm |
| Na | <50 ppm |
| Fe | <200 ppm |
Table 4.
Factors and their levels for this study.
| Factor | Designation | Level | ||
|---|---|---|---|---|
| 1 | 2 | 3 | ||
| NS dosage (wt%) | NS | 0 | 0.5 | 1 |
| SF dosage (wt%) | SF | 0 | 5 | 10 |
| HRWR dosage (wt%) | HRWR | 0.1 | 0.25 | 0.35 |
| wt% = per weight of binder | ||||
Table 5.
Orthogonal array L9 with factors levels assignment for the experiments.
| Experiment | Factors | ||
|---|---|---|---|
| NS | SF | HRWR | |
| I | 1 | 1 | 1 |
| II | 1 | 2 | 2 |
| III | 1 | 3 | 3 |
| IV | 2 | 1 | 2 |
| V | 2 | 2 | 3 |
| VI | 2 | 3 | 1 |
| VII | 3 | 1 | 3 |
| VIII | 3 | 2 | 1 |
| IX | 3 | 3 | 2 |
Table 6.
Experimental grout mix design.
| Experiment I | Experiment IV | Experiment VII | |||
|---|---|---|---|---|---|
| NS (wt%) | 0 | NS (wt%) | 0.5 | NS (wt%) | 1 |
| SF (wt%) | 0 | SF (wt%) | 0 | SF (wt%) | 0 |
| HRWR (wt%) | 0.1 | HRWR (wt%) | 0.25 | HRWR (wt%) | 0.35 |
| Experiment II | Experiment V | Experiment VIII | |||
| NS (wt%) | 0 | NS (wt%) | 0.5 | NS (wt%) | 1 |
| SF (wt%) | 5 | SF (wt%) | 5 | SF (wt%) | 5 |
| HRWR (wt%) | 0.25 | HRWR (wt%) | 0.35 | HRWR (wt%) | 0.1 |
| Experiment III | Experiment VI | Experiment IX | |||
| NS (wt%) | 0 | NS (wt%) | 0.5 | NS (wt%) | 1 |
| SF (wt%) | 10 | SF (wt%) | 10 | SF (wt%) | 10 |
| HRWR (wt%) | 0.35 | HRWR (wt%) | 0.1 | HRWR (wt%) | 0.25 |
Table 7.
S/N ratio and the average values of parameters for each experiment.
| Yield Stress | Plastic Viscosity | Compressive Strength | Open Porosity | Water Absorption Coefficient | Drying Rate | |||||||
|---|---|---|---|---|---|---|---|---|---|---|---|---|
| S/N (dB) | (Pa) | S/N (dB) | (Pa.s) | S/N (dB) | (MPa) | S/N (dB) | (%) | S/N (dB) | kg/(m2·min0.5) | S/N (dB) | kg/m2·h | |
| I | −23.19 | 14.43 | 11.11 | 0.25 | 10.39 | 3.44 | −33.34 | 46.47 | −4.29 | 1.64 | 15.44 | 0.16 |
| II | −17.57 | 7.56 | 7.43 | 0.42 | 12.62 | 4.31 | −33.03 | 44.82 | −2.60 | 1.35 | 10.23 | 0.25 |
| III | 8.60 | 0.37 | 5.53 | 0.53 | 11.19 | 3.63 | −32.91 | 44.17 | −1.77 | 1.23 | 14.14 | 0.18 |
| IV | −15.58 | 6.01 | 10.53 | 0.30 | 9.84 | 3.25 | −33.32 | 46.34 | −3.42 | 1.48 | 11.34 | 0.22 |
| V | 46.51 | 0.0004 | 11.82 | 0.26 | 11.63 | 3.83 | −33.15 | 45.43 | −3.23 | 1.45 | 29.32 | 0.01 |
| VI | −47.30 | 231.80 | −1.58 | 1.20 | 13.81 | 5.26 | −32.78 | 43.56 | −0.57 | 1.07 | 18.32 | 0.12 |
| VII | 25.41 | 0.050 | 9.89 | 0.32 | 13.61 | 4.83 | −33.38 | 46.65 | −2.76 | 1.37 | 18.04 | 0.13 |
| VIII | −45.28 | 183.60 | 0.81 | 0.91 | 14.18 | 5.42 | −32.88 | 44.05 | −1.66 | 1.21 | 17.66 | 0.13 |
| IX | −40.22 | 102.60 | 3.14 | 0.70 | 14.59 | 5.39 | −32.55 | 42.44 | 0.76 | 0.92 | 22.01 | 0.07 |
Table 8.
Analyses of variance (ANOVA) for yield stress.
| Factor | Degree of Freedom | Sum of Squares | Mean Squares | Contribution of Factor (%) |
|---|---|---|---|---|
| NS dosage | 2 | 1.32 104 | 6.58 103 | 21.5 |
| SF dosage | 2 | 1.65 104 | 8.25 103 | 26.6 |
| HRWR dosage | 2 | 1.32 104 | 6.58 103 | 21.5 |
Table 9.
Analyses of variance (ANOVA) for plastic viscosity.
| Factor | Degree of Freedom | Sum of Squares | Mean Squares | Contribution of Factor (%) |
|---|---|---|---|---|
| NS dosage | 2 | 0.094 | 0.047 | 13.3 |
| SF dosage | 2 | 0.403 | 0.202 | 48.3 |
| HRWR dosage | 2 | 0.285 | 0.142 | 38.5 |
Table 10.
Analyses of variance (ANOVA) for compressive strength.
| Factor | Degree of Freedom | Sum of Squares | Mean Squares | Contribution of Factor (%) |
|---|---|---|---|---|
| NS dosage | 2 | 3.130 | 1.565 | 50.5 |
| SF dosage | 2 | 1.175 | 0.587 | 37.0 |
| HRWR dosage | 2 | 0.241 | 0.121 | 12.5 |
Table 11.
Analyses of variance (ANOVA) for absorption coefficient by capillarity.
| Factor | Degree of Freedom | Sum of Squares | Mean Squares | Contribution of Factor (%) |
|---|---|---|---|---|
| NS dosage | 2 | 0.107 | 0.054 | 26.8 |
| SF dosage | 2 | 0.309 | 0.154 | 60.8 |
| HRWR dosage | 2 | 0.022 | 0.011 | 12.4 |
Table 12.
Analyses of variance (ANOVA) for drying rate.
| Factor | Degree of Freedom | Sum of Squares | Mean Squares | Contribution of Factor (%) |
|---|---|---|---|---|
| NS dosage | 2 | 0.013 | 0.007 | 29.0 |
| SF dosage | 2 | 0.003 | 0.002 | 31.7 |
| HRWR dosage | 2 | 0.006 | 0.003 | 39.4 |
Publisher’s Note: MDPI stays neutral with regard to jurisdictional claims in published maps and institutional affiliations. |
© 2021 by the authors. Licensee MDPI, Basel, Switzerland. This article is an open access article distributed under the terms and conditions of the Creative Commons Attribution (CC BY) license (https://creativecommons.org/licenses/by/4.0/).
Share and Cite
MDPI and ACS Style
Baltazar, L.G.; Cardoso, J. Preliminary Investigation of the Mechanical and Physical Properties of Natural Hydraulic Lime Grouts with Nano-Silica. CivilEng 2021, 2, 421-441. https://0-doi-org.brum.beds.ac.uk/10.3390/civileng2020024
AMA Style
Baltazar LG, Cardoso J. Preliminary Investigation of the Mechanical and Physical Properties of Natural Hydraulic Lime Grouts with Nano-Silica. CivilEng. 2021; 2(2):421-441. https://0-doi-org.brum.beds.ac.uk/10.3390/civileng2020024
Chicago/Turabian StyleBaltazar, Luis G., and João Cardoso. 2021. "Preliminary Investigation of the Mechanical and Physical Properties of Natural Hydraulic Lime Grouts with Nano-Silica" CivilEng 2, no. 2: 421-441. https://0-doi-org.brum.beds.ac.uk/10.3390/civileng2020024