
Influence of Different Fiber Dosages on the Behaviour of Façade Anchors in High-Performance Concrete


Abstract
:1. Introduction
2. Research Significance
3. Experimental Program
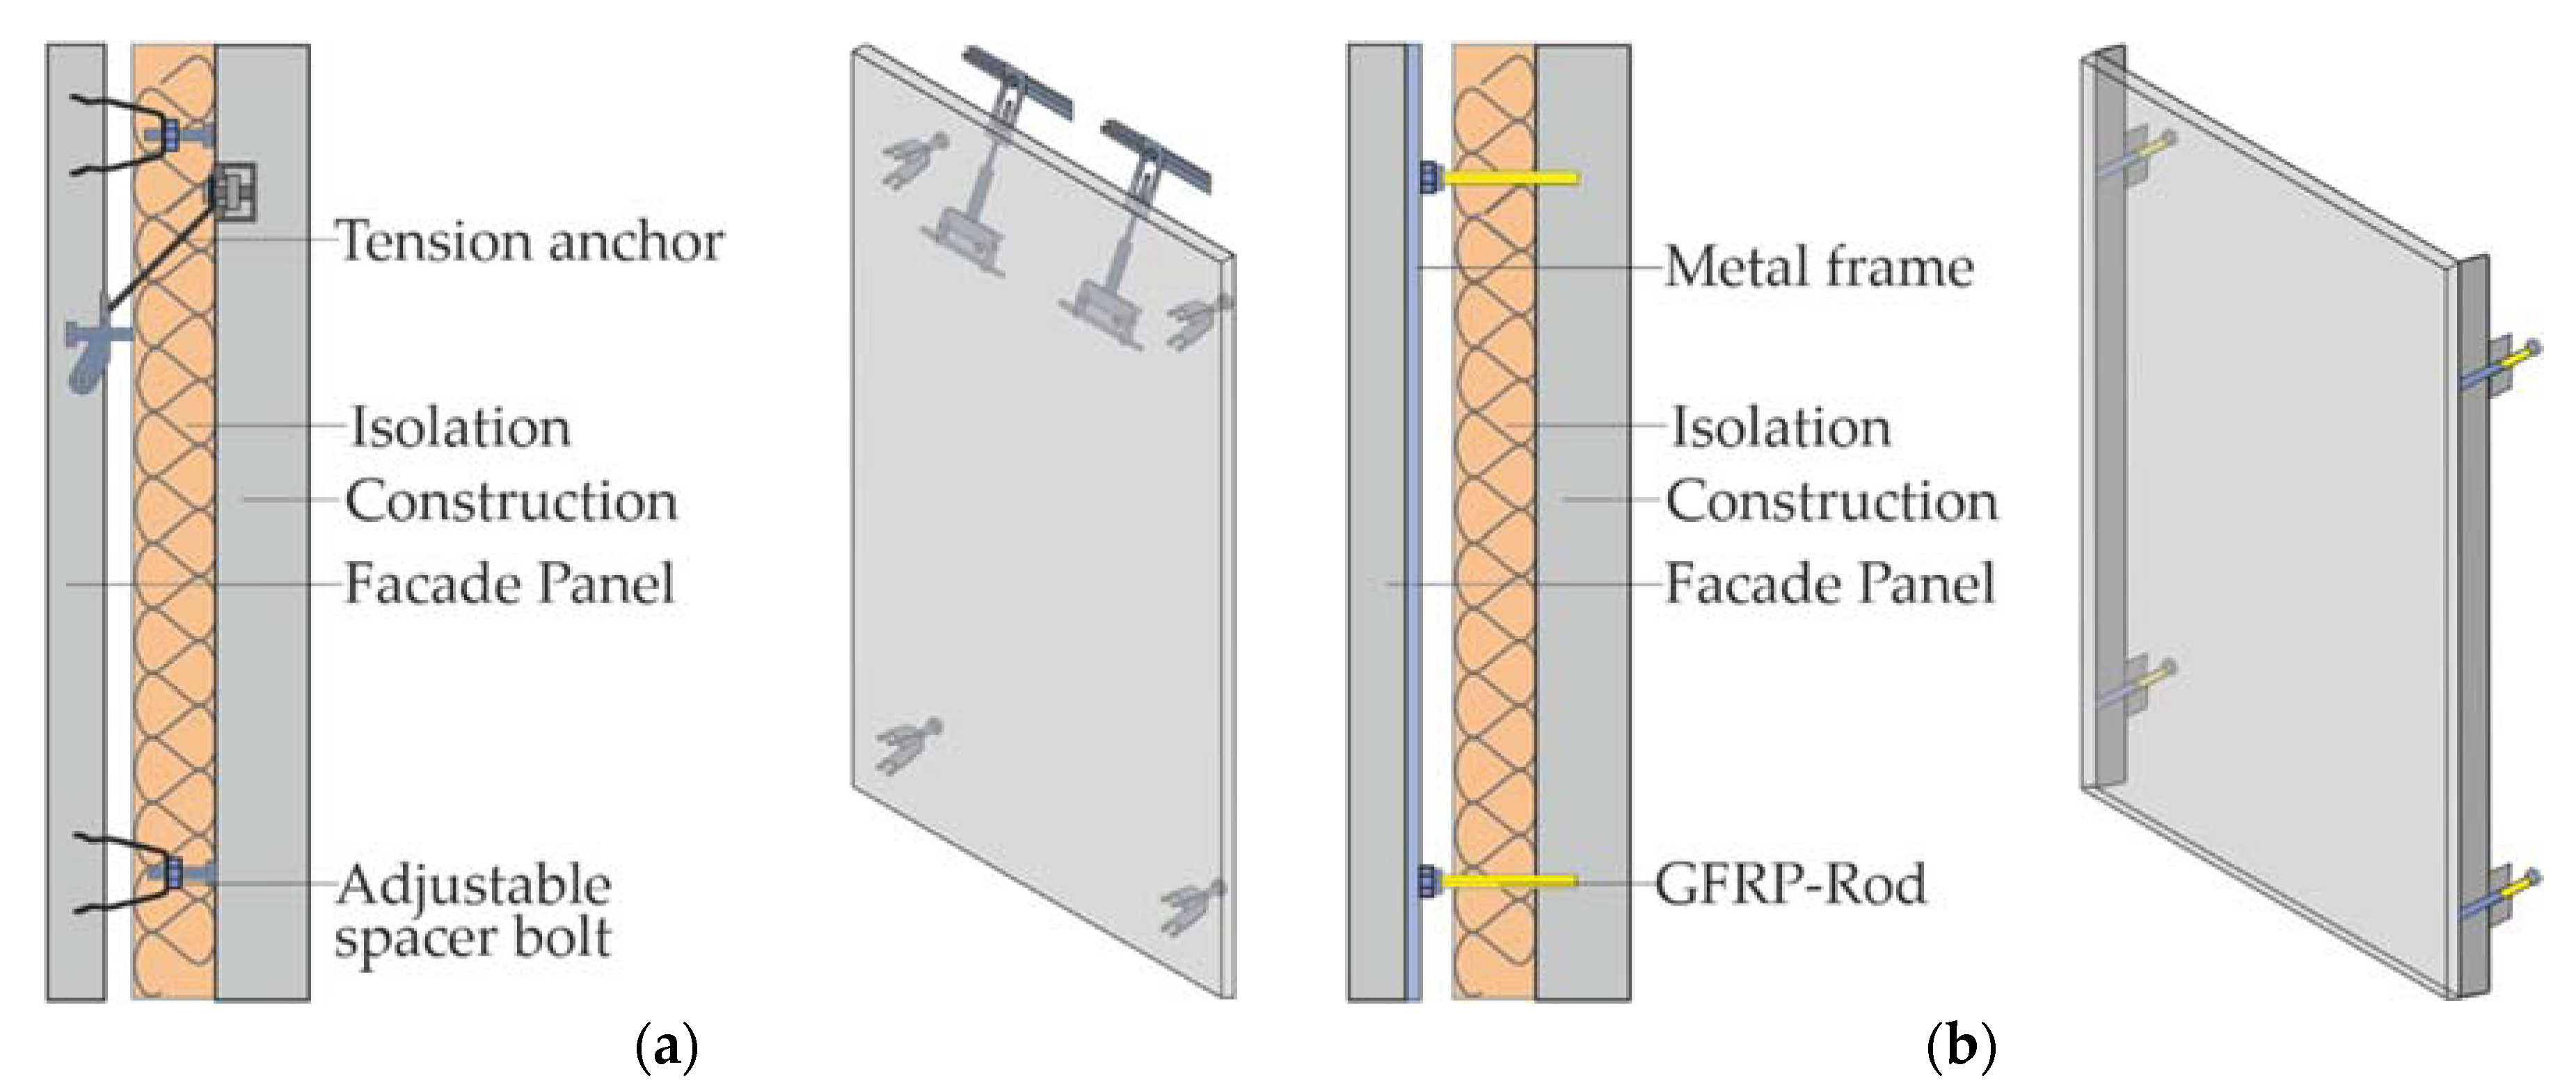
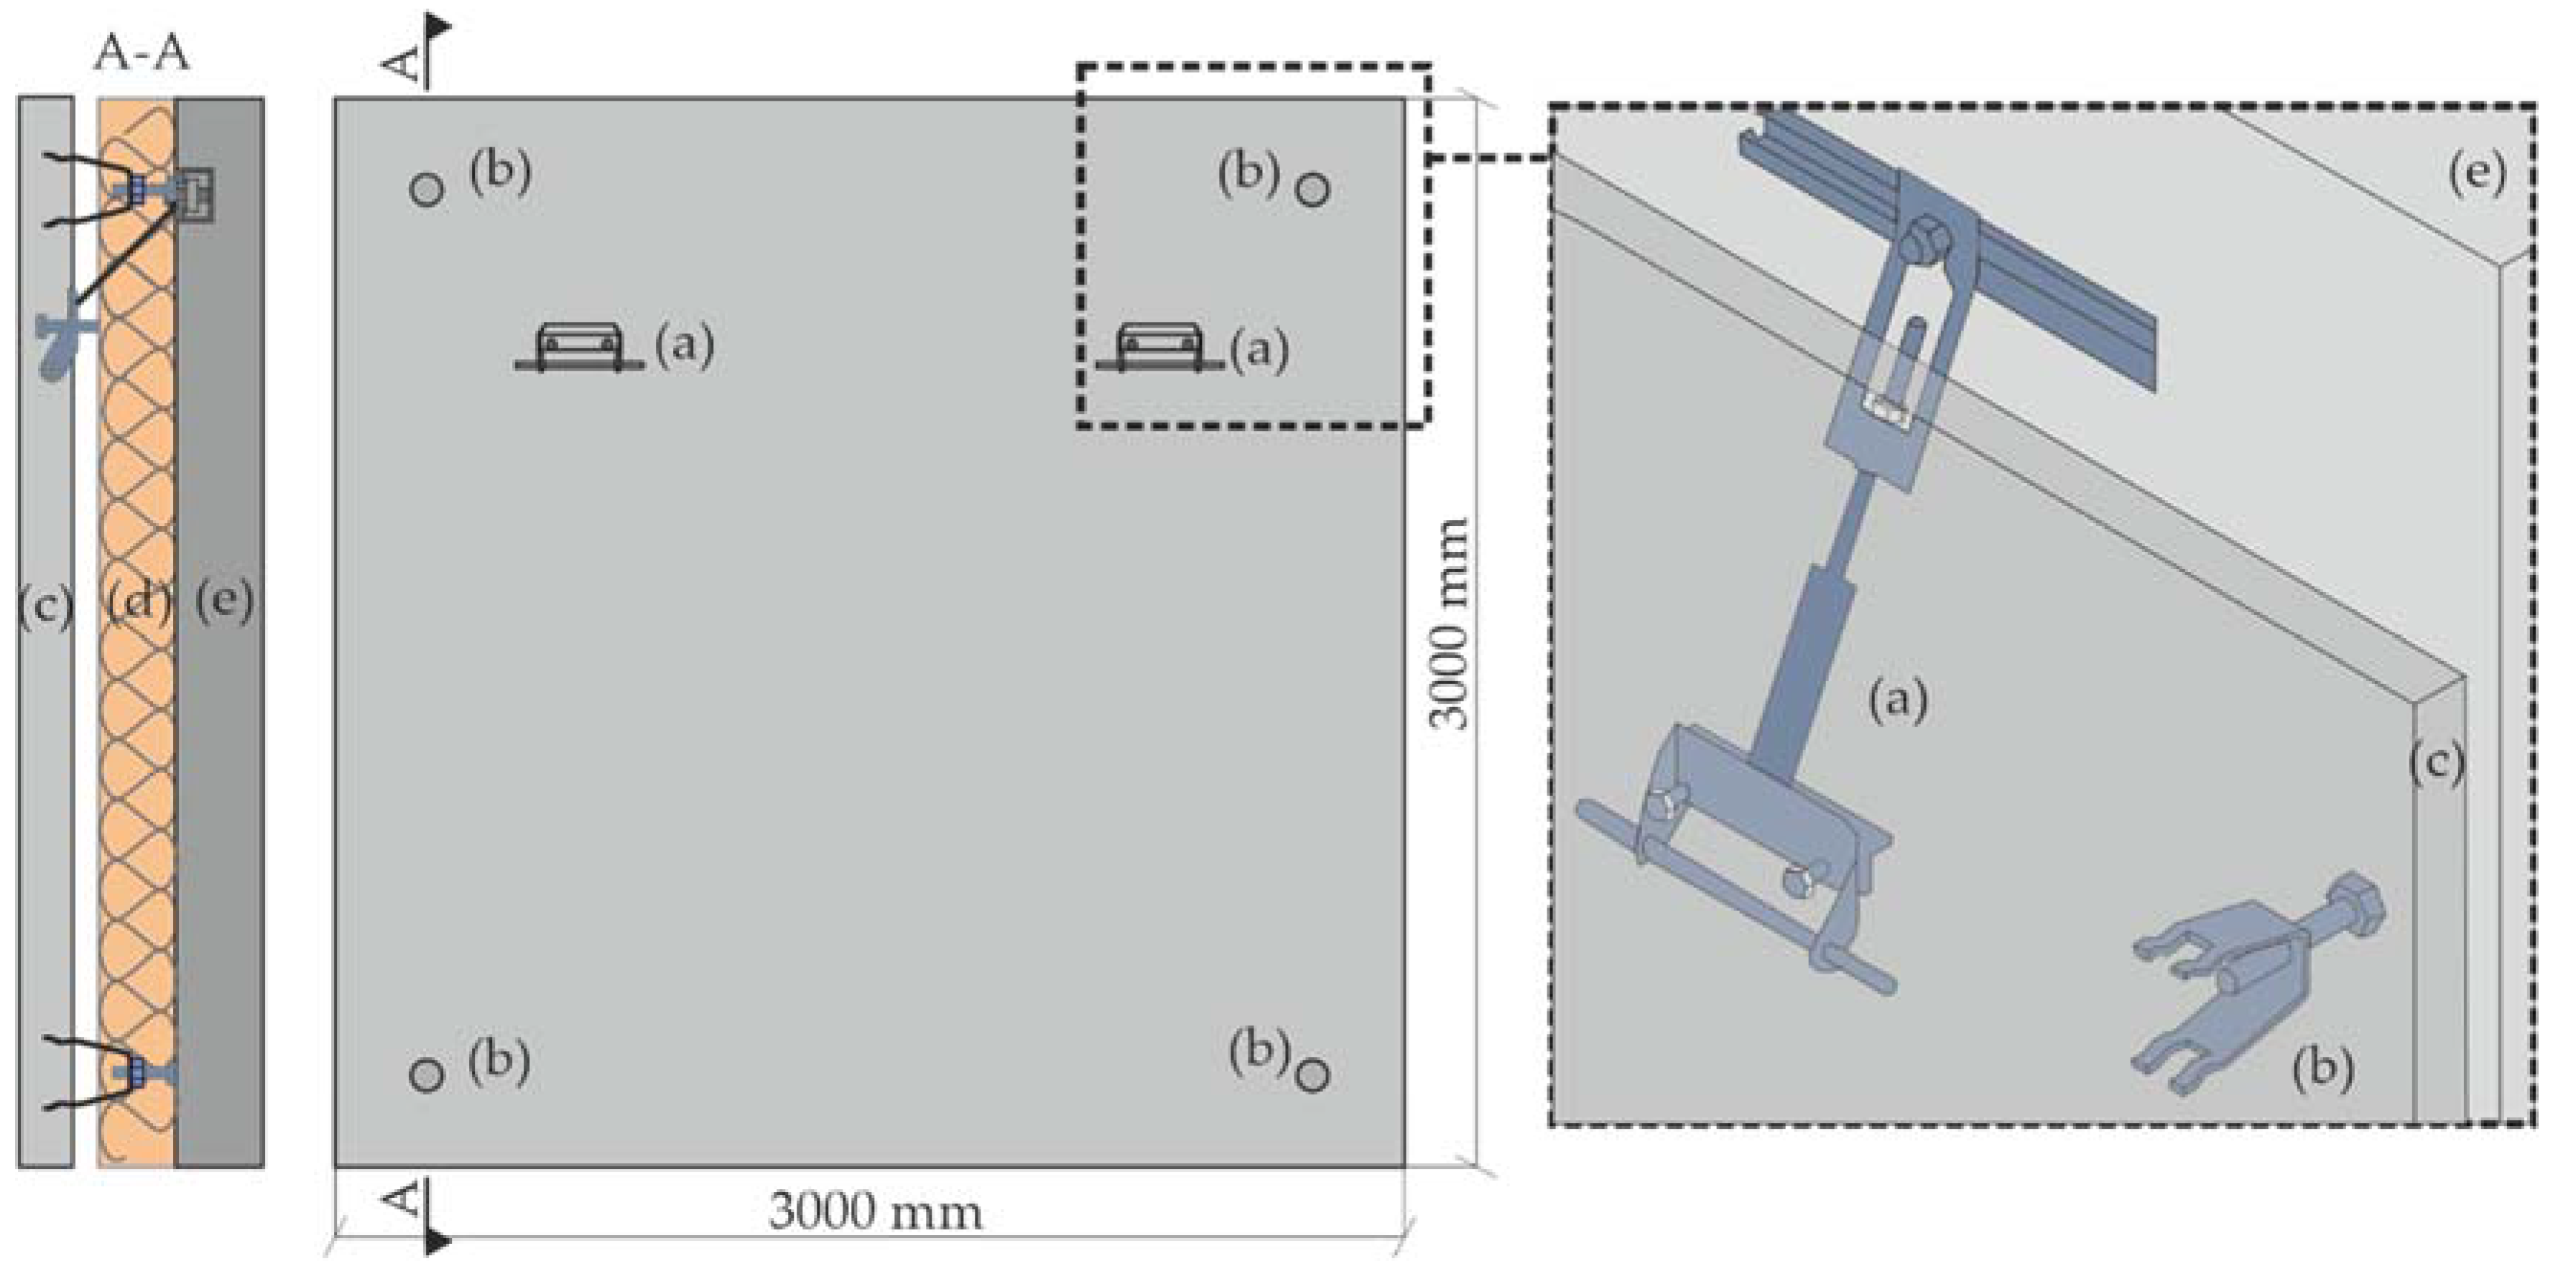
3.1. Overview of the Anchoring Concept
3.2. Materials
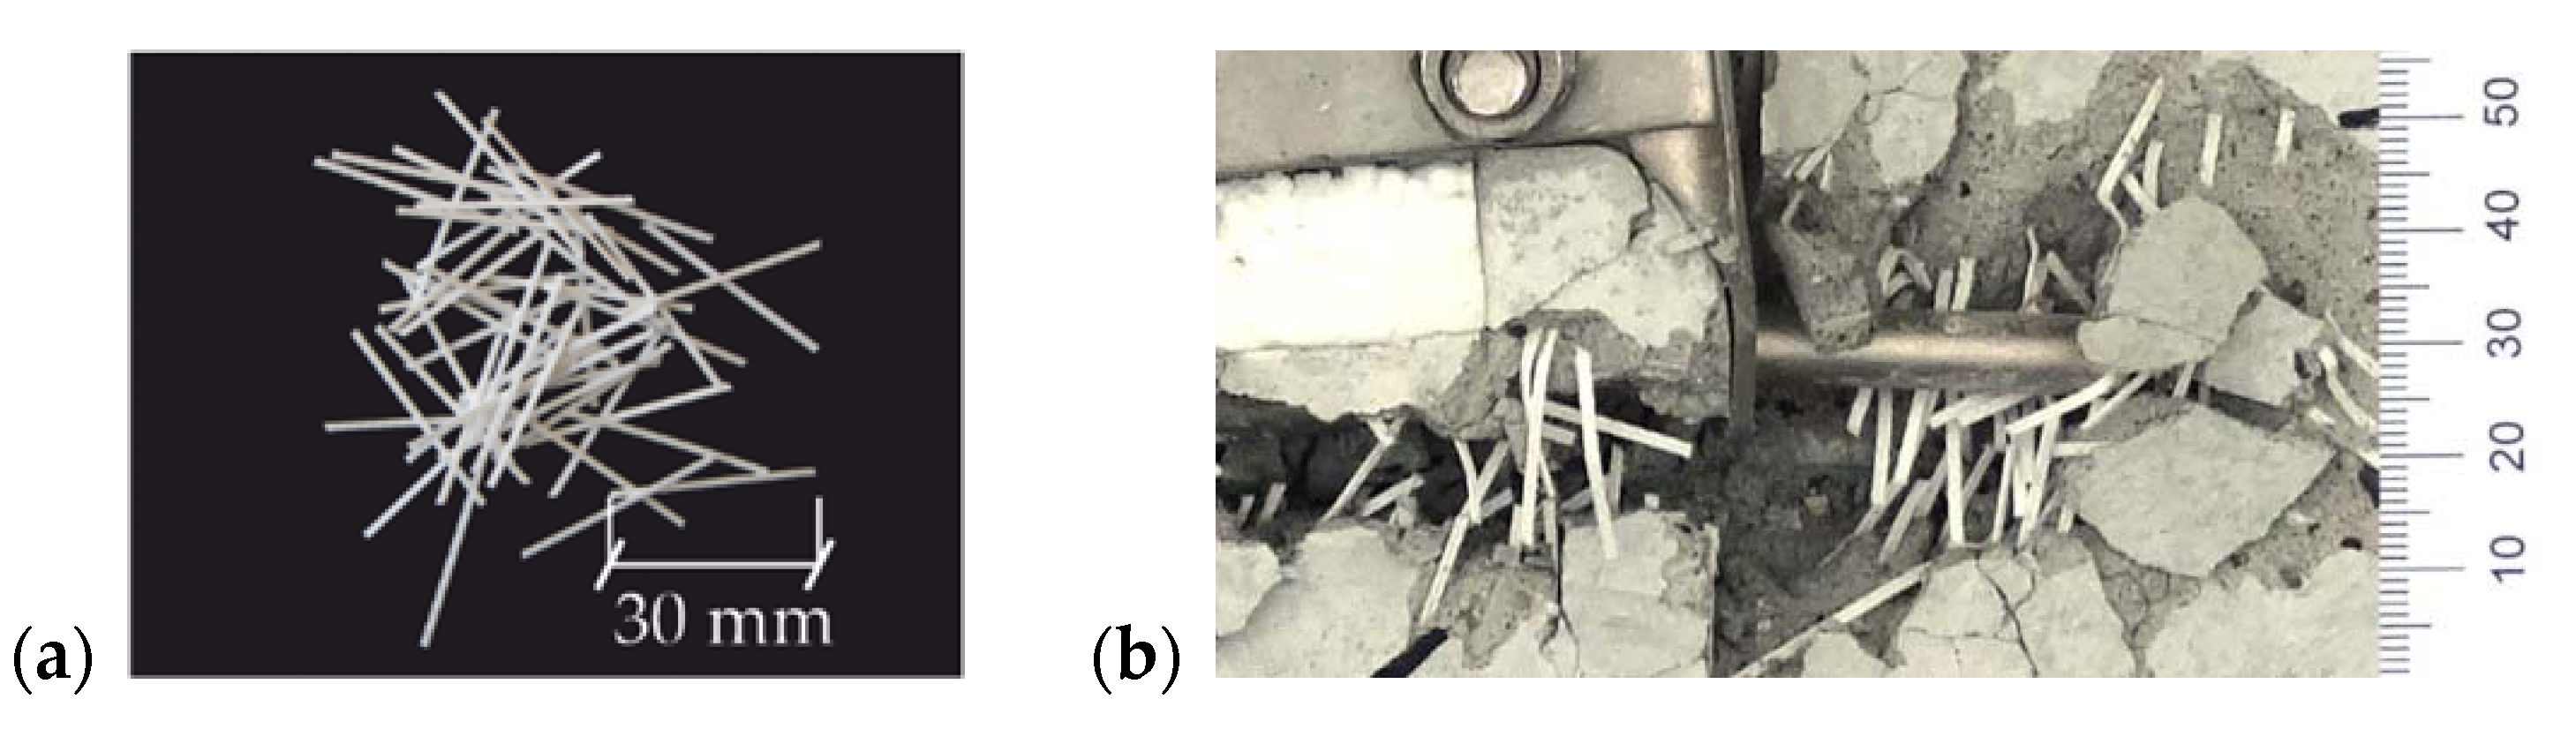
3.2.1. Fiber
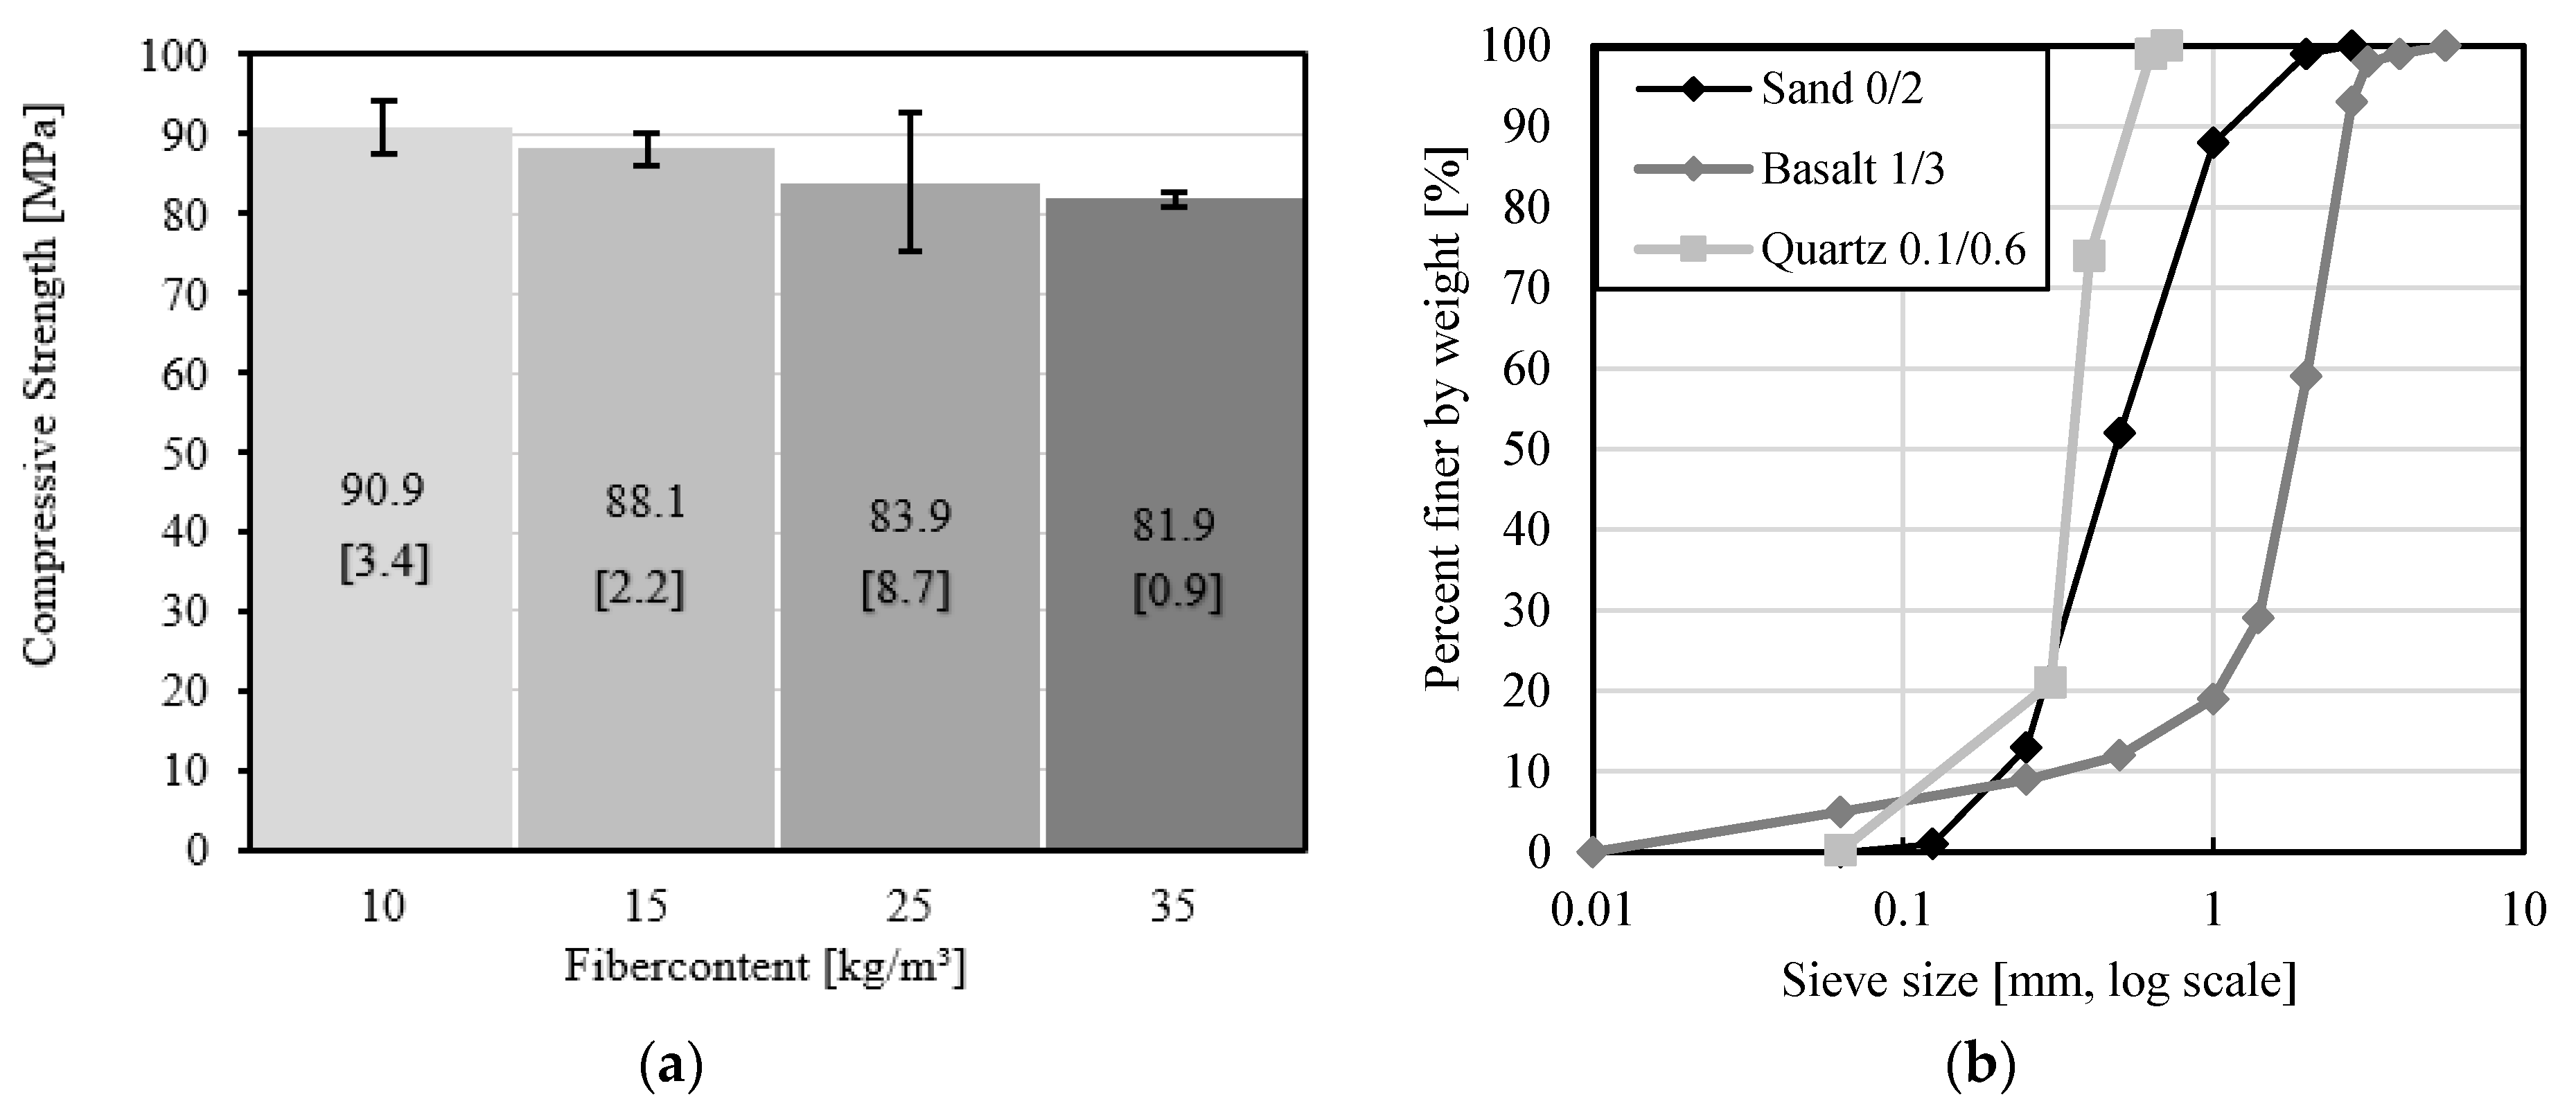
3.2.2. Concrete Mix Design

| Mix ID | Type of Fiber | Weight (kg/m3) |
|---|---|---|
| 1 | MasterFiber® 235 (PP) | 10 |
| 2 | MasterFiber® 235 (PP) | 15 |
| 3 | MasterFiber® 235 (PP) | 25 |
| 4 | MasterFiber® 235 (PP) | 35 |
| Material | Raw Density | Weight |
|---|---|---|
| (kg/m3) | (kg/m3) | |
| Cement (CEM I 42.5 R) | 3100 | 650 |
| Aggregate 0 to 3 mm | 2600 | 990 |
| Silica fume | 700 | 50 |
| Limestone powder | 2700 | 415 |
| Plasticiser MasterGlenium ACE 430 | 1060 | 18 |
| Water | 1000 | 210 |
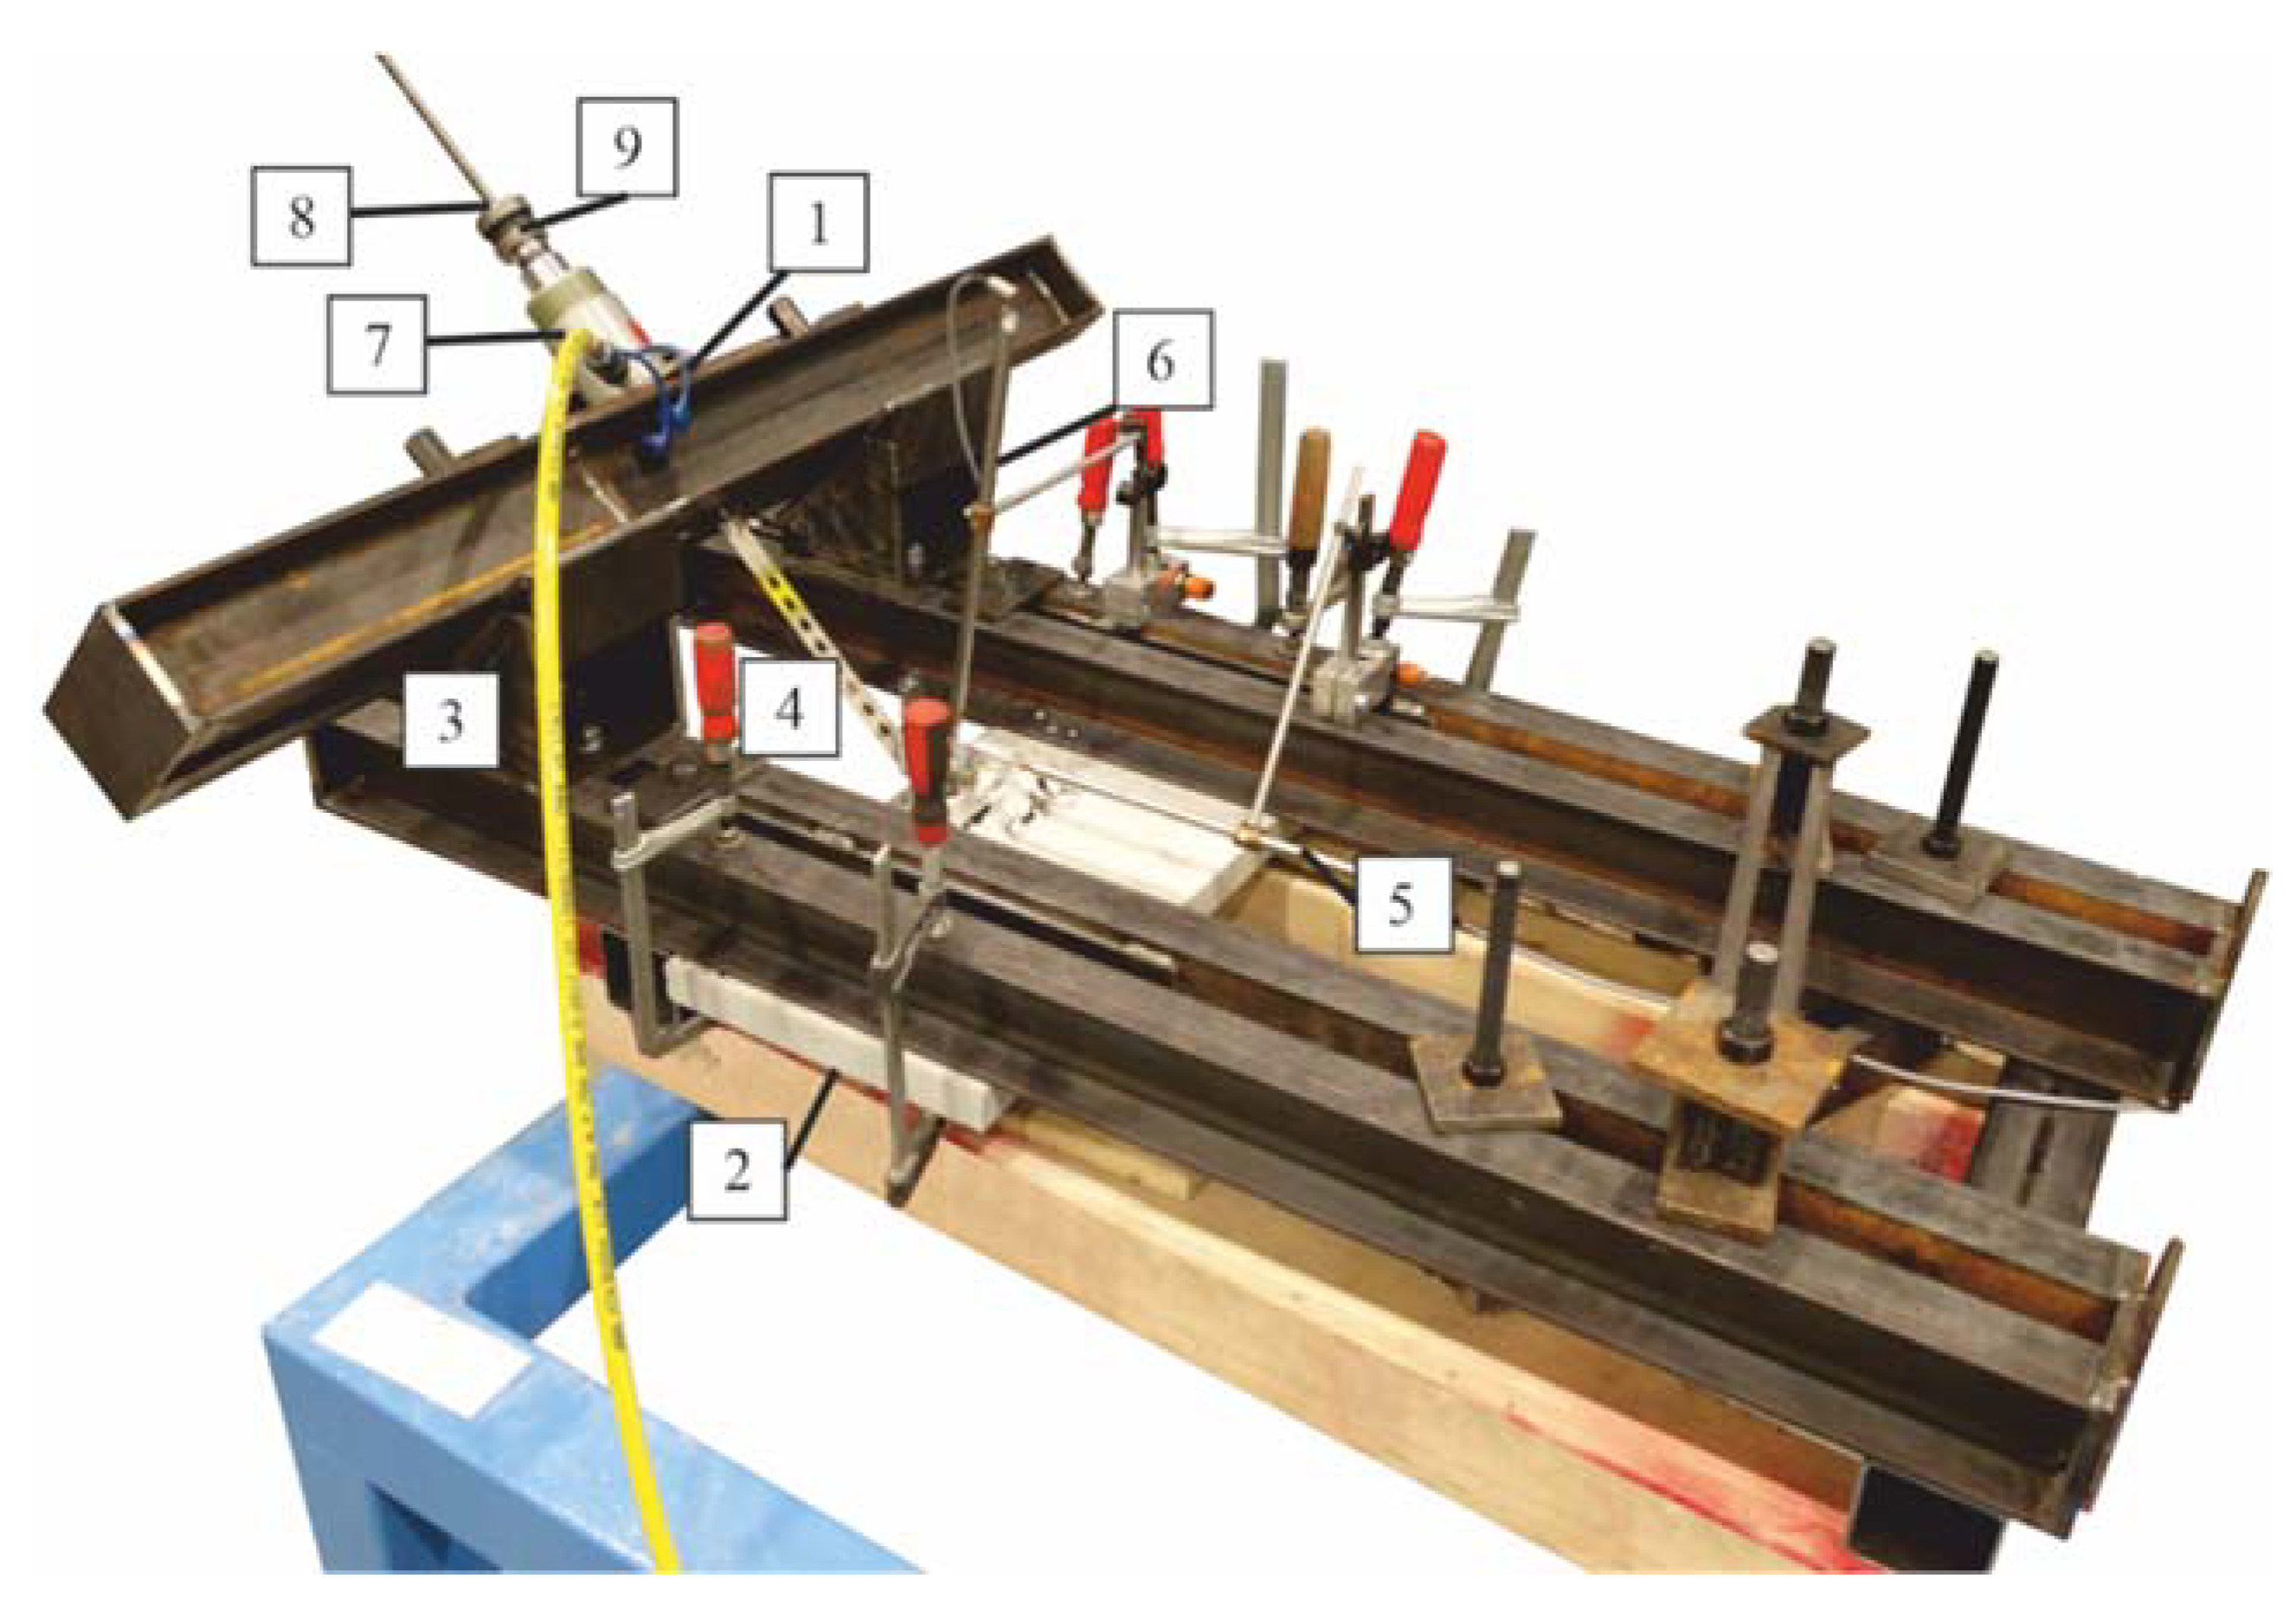
3.3. Testing Procedure
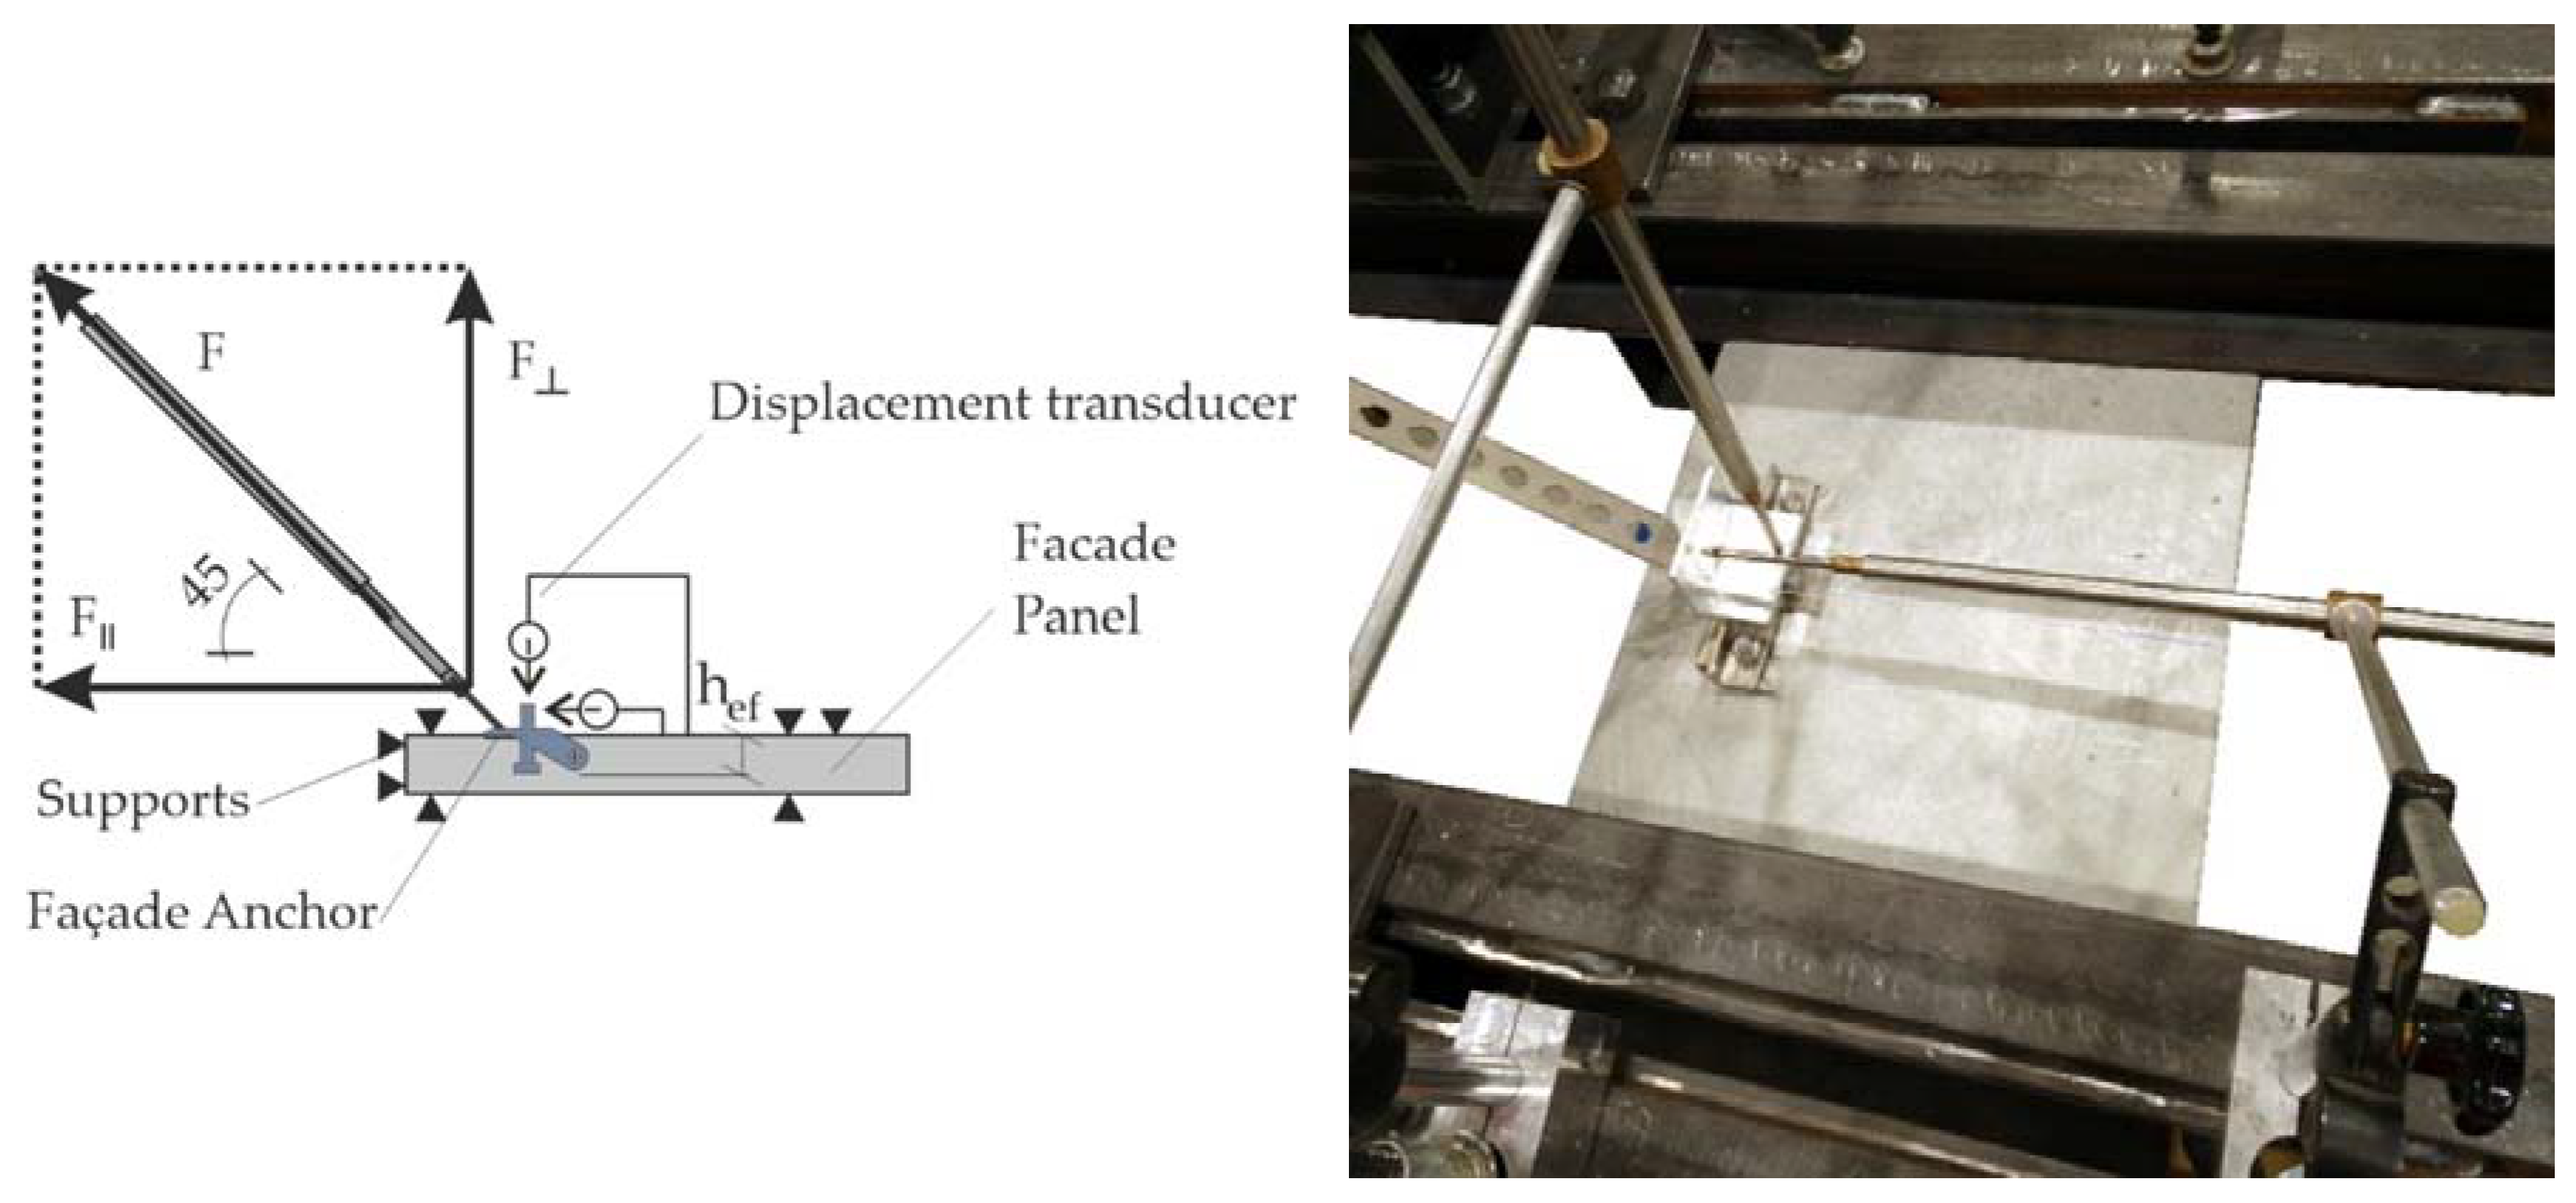
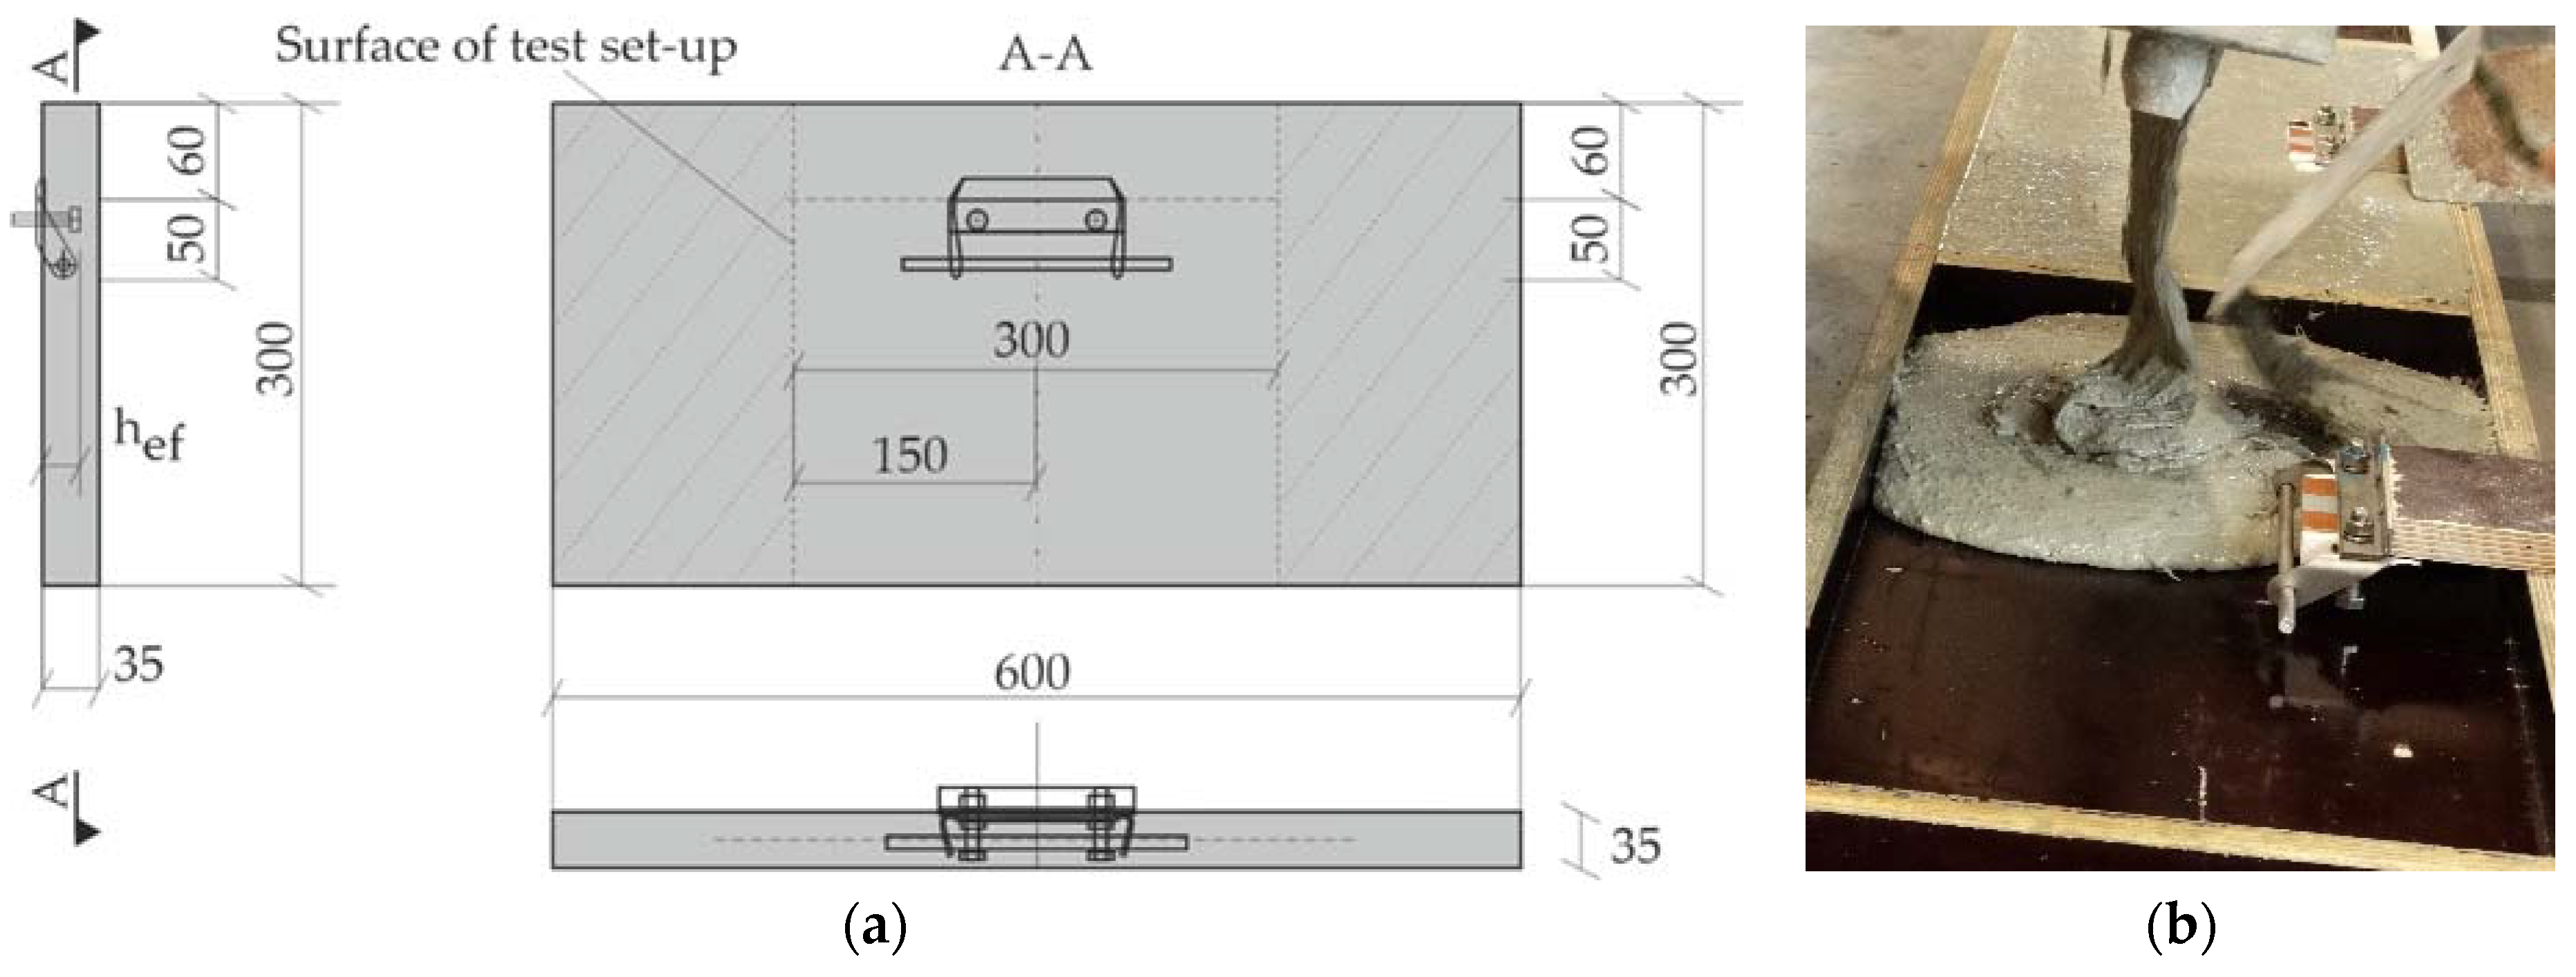
3.3.1. Determination of Pull-Out Resistance
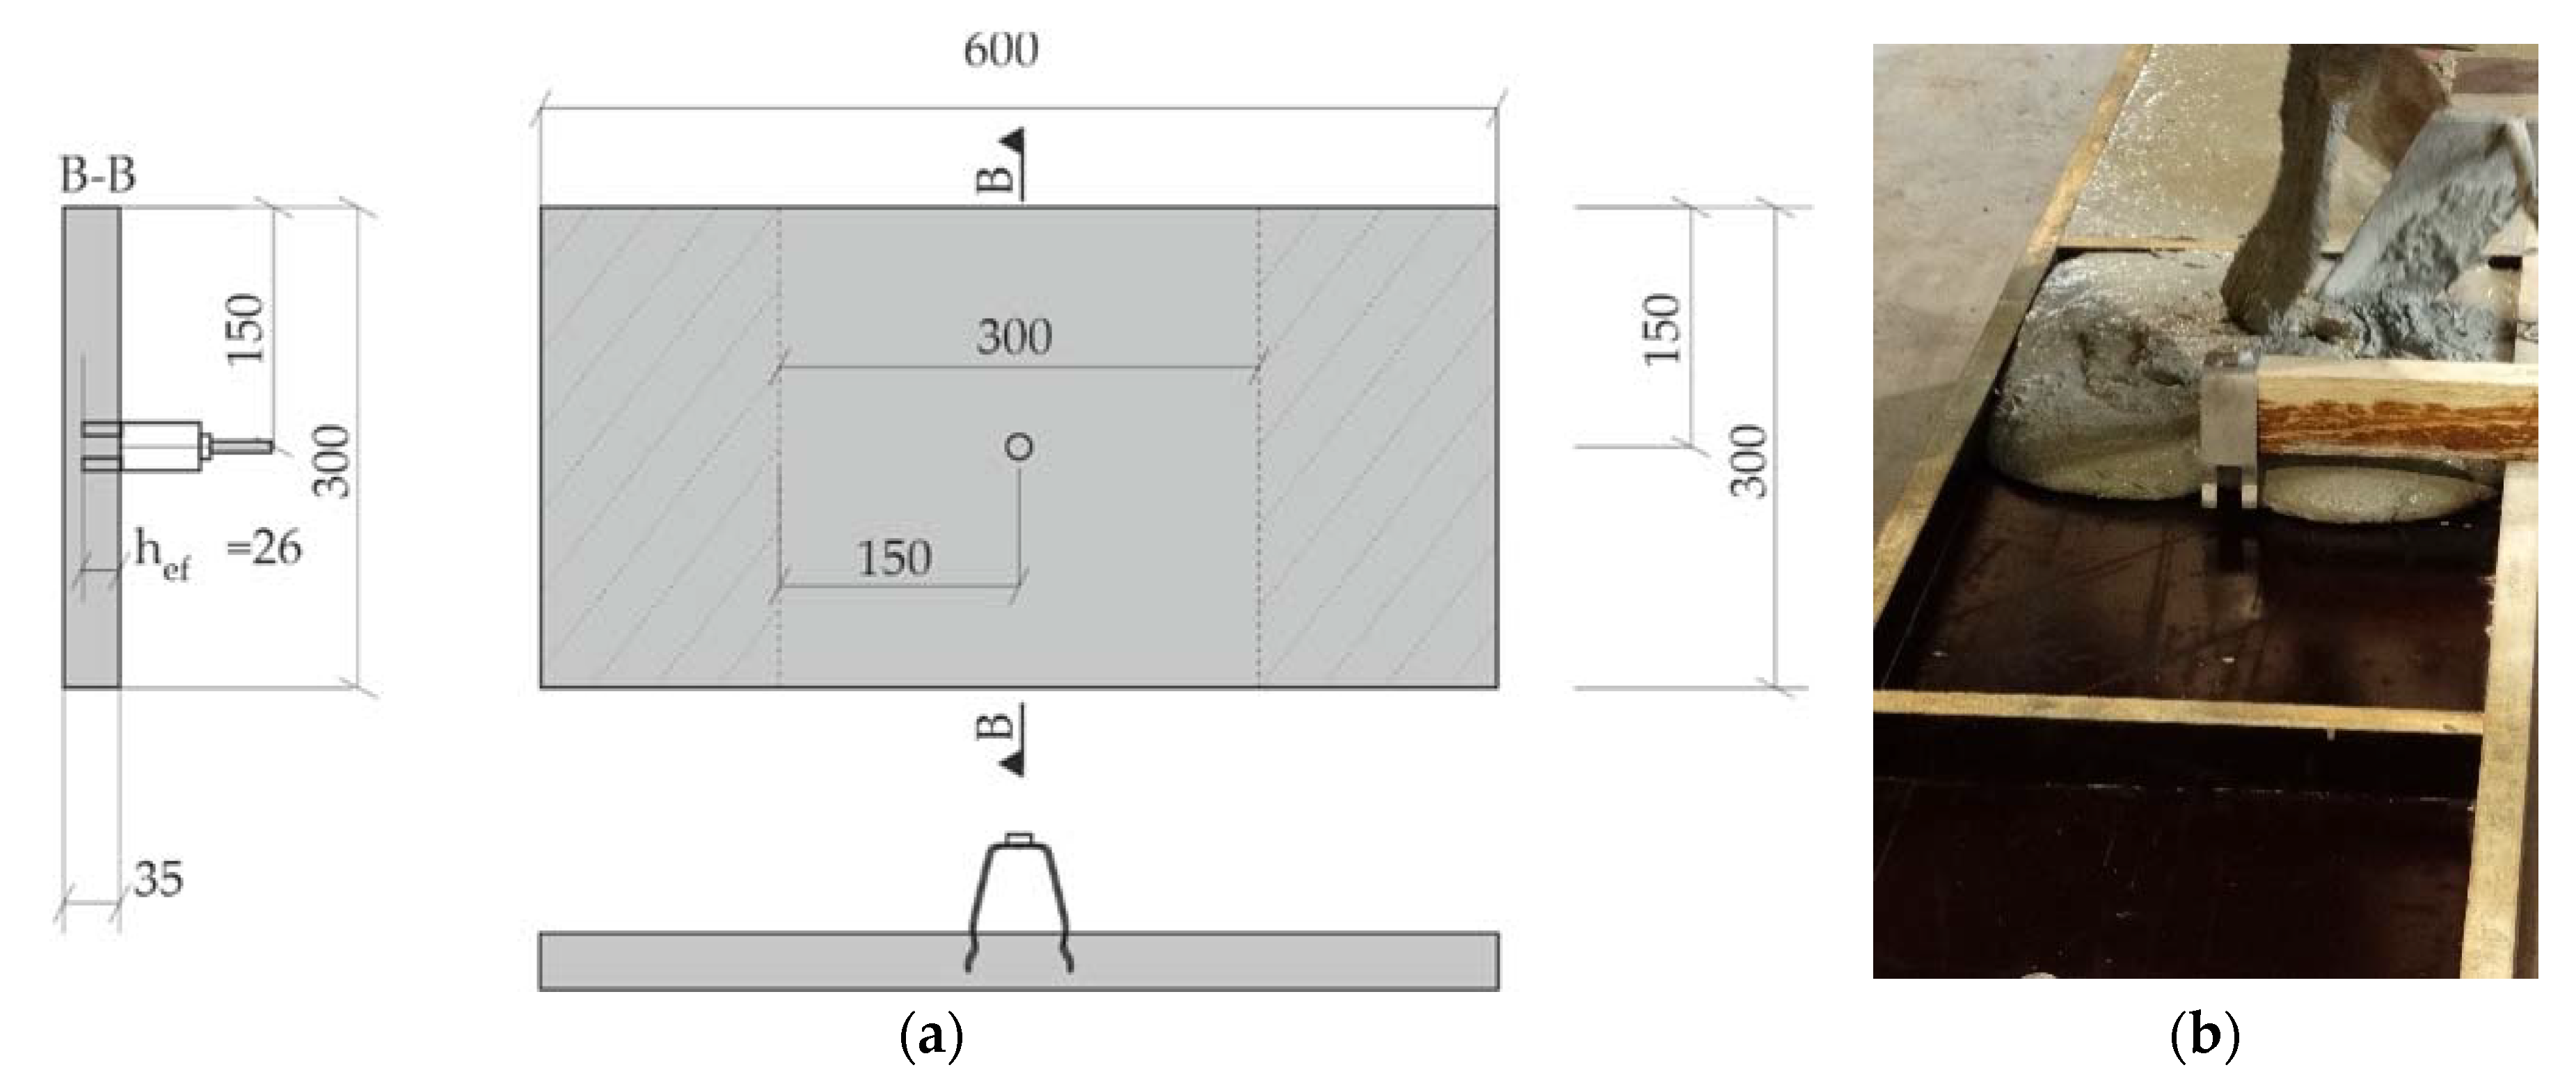
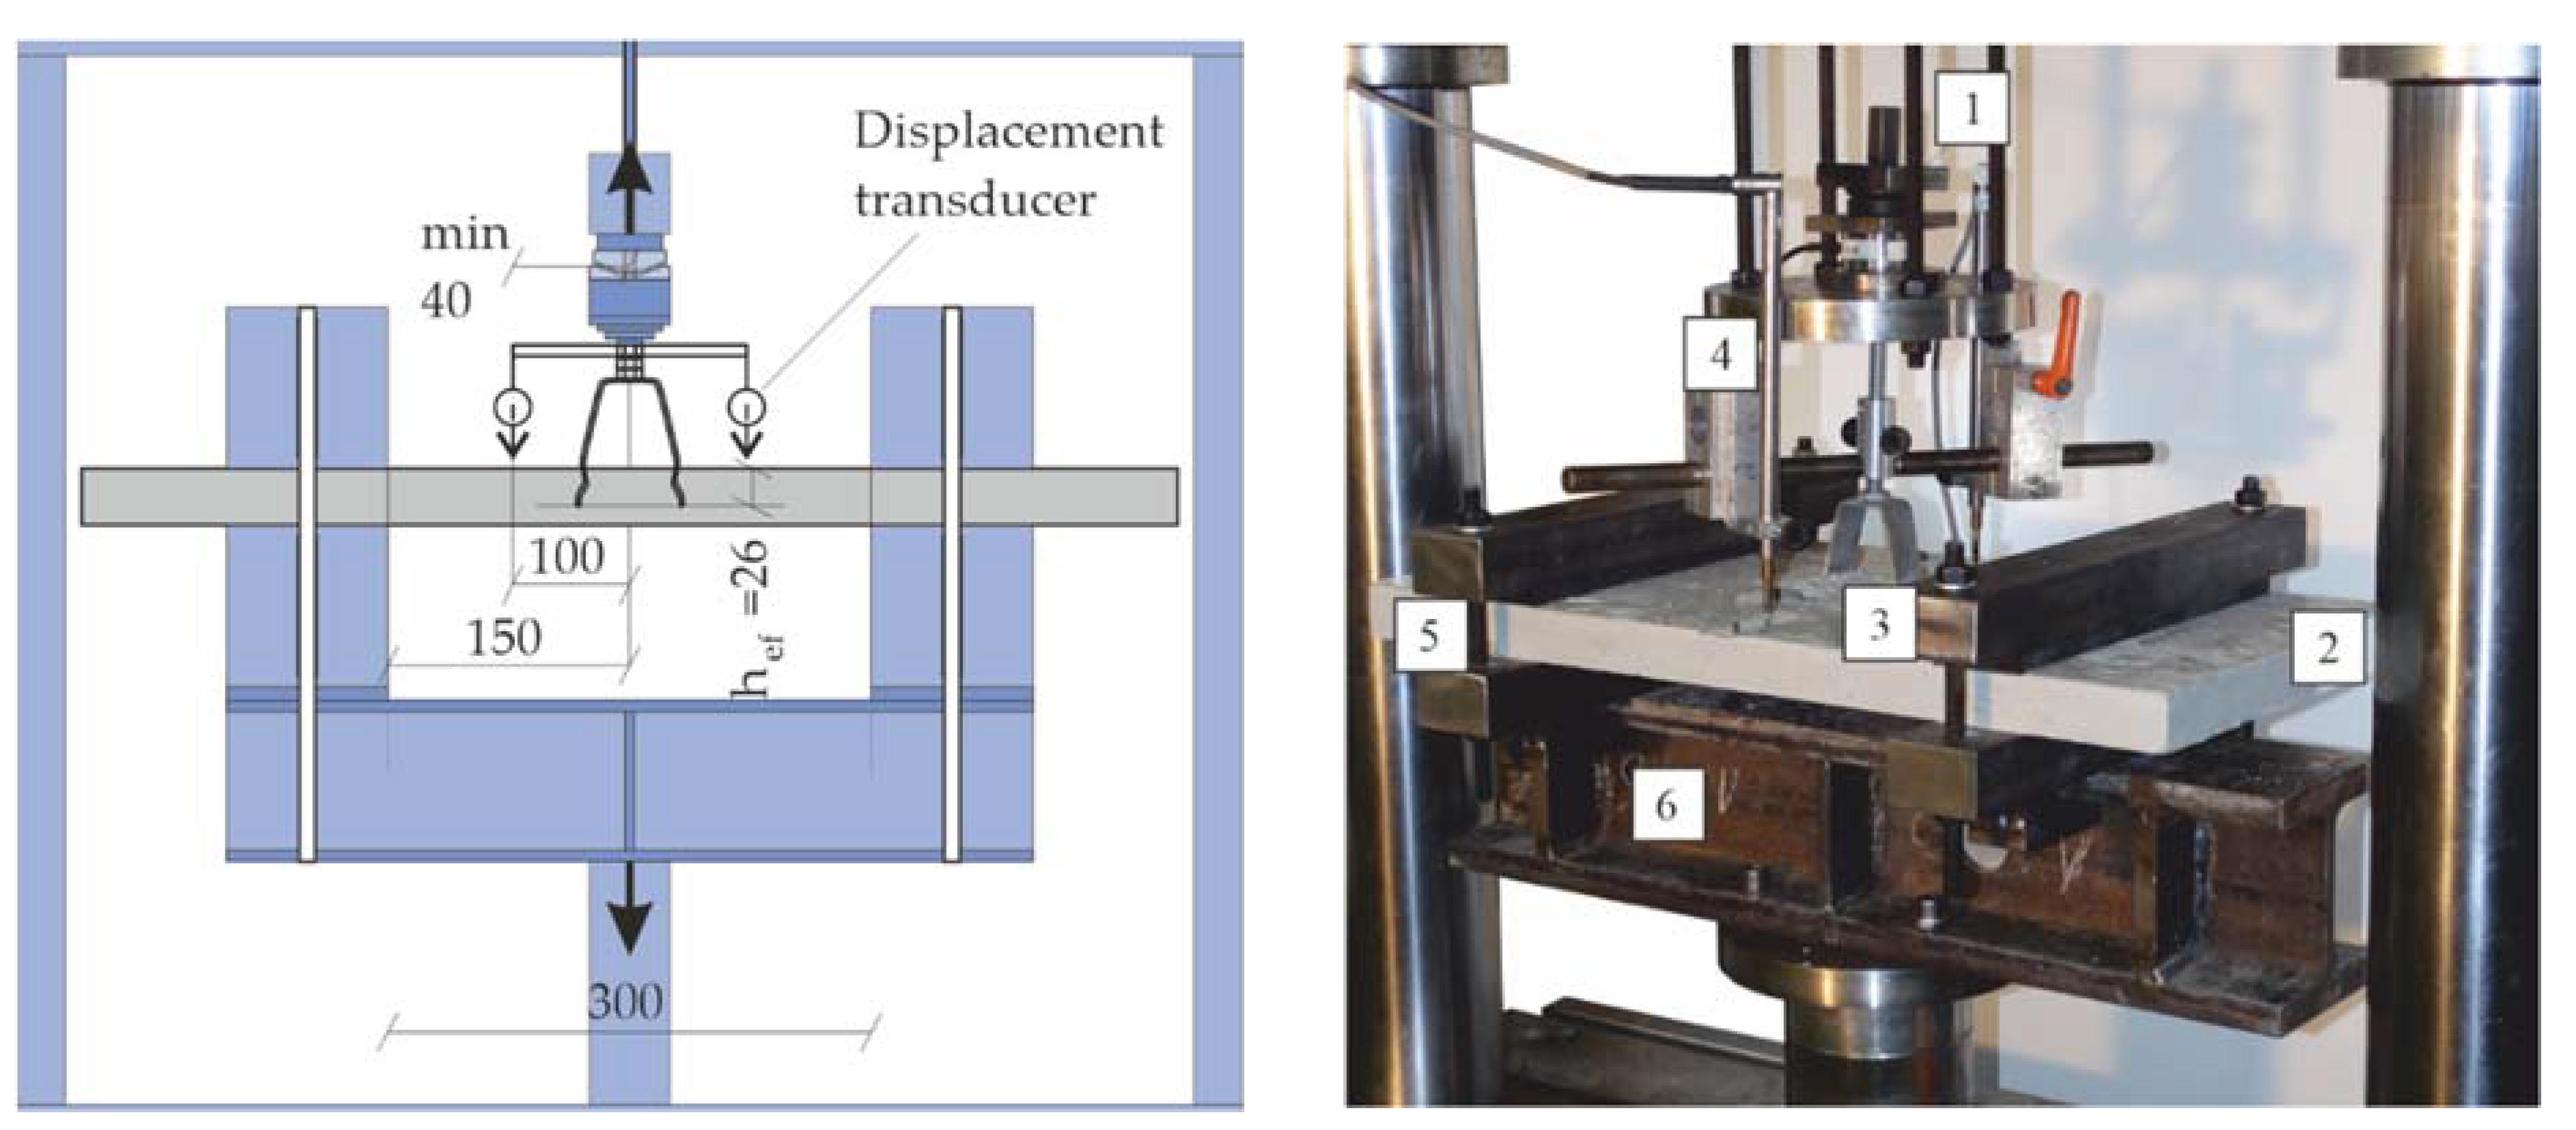
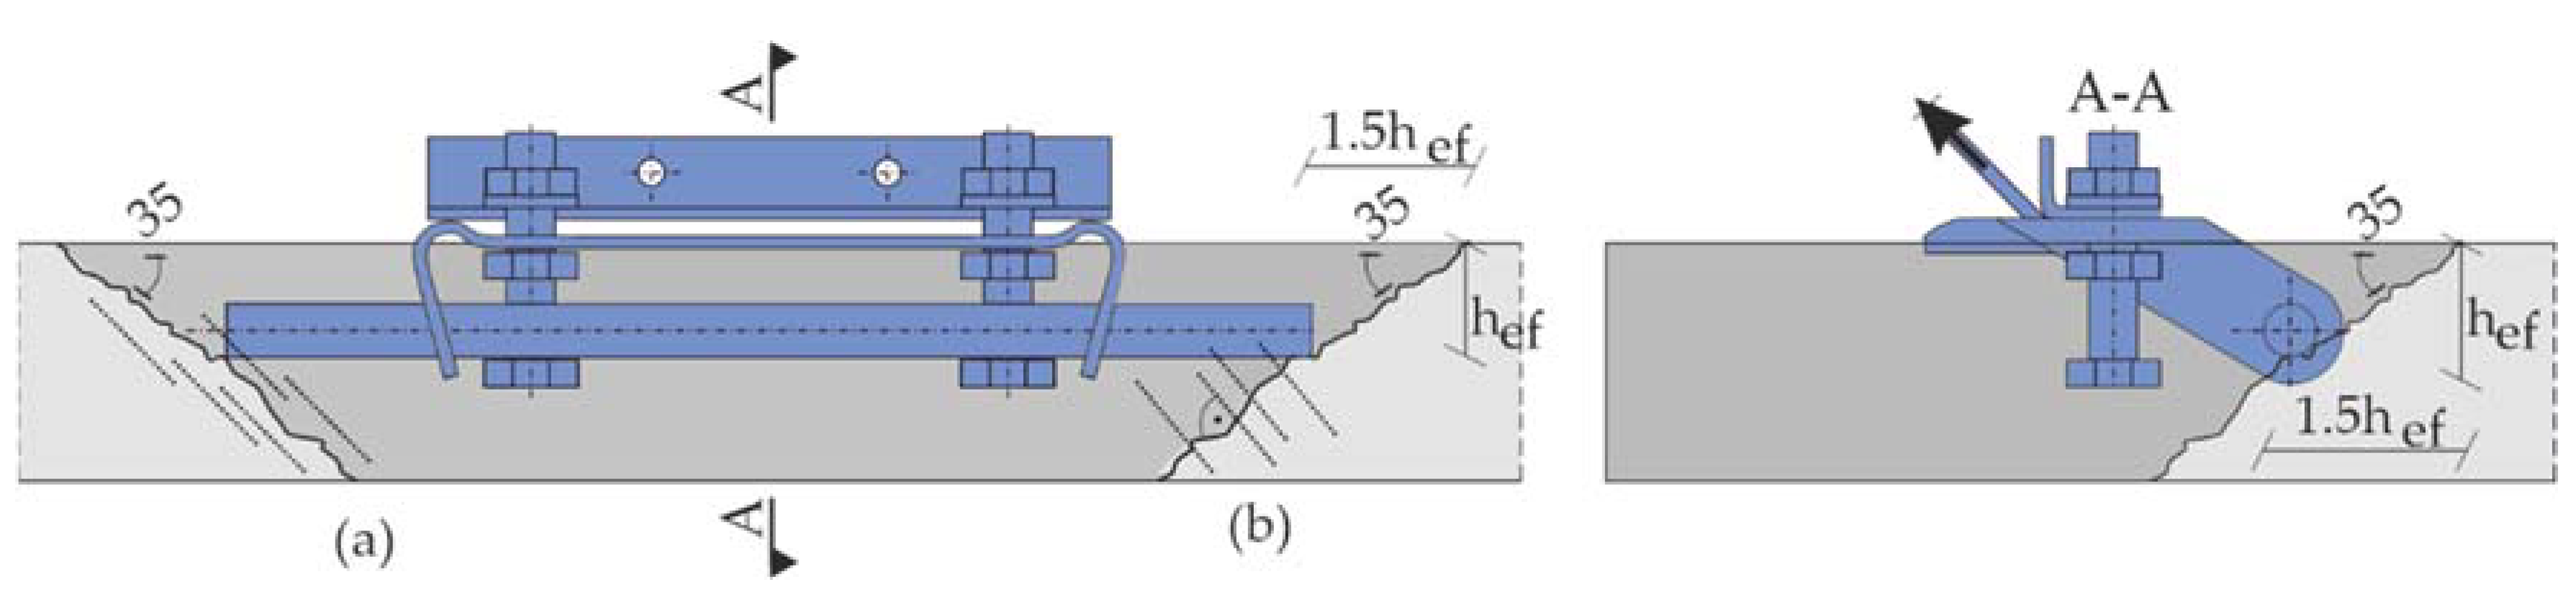
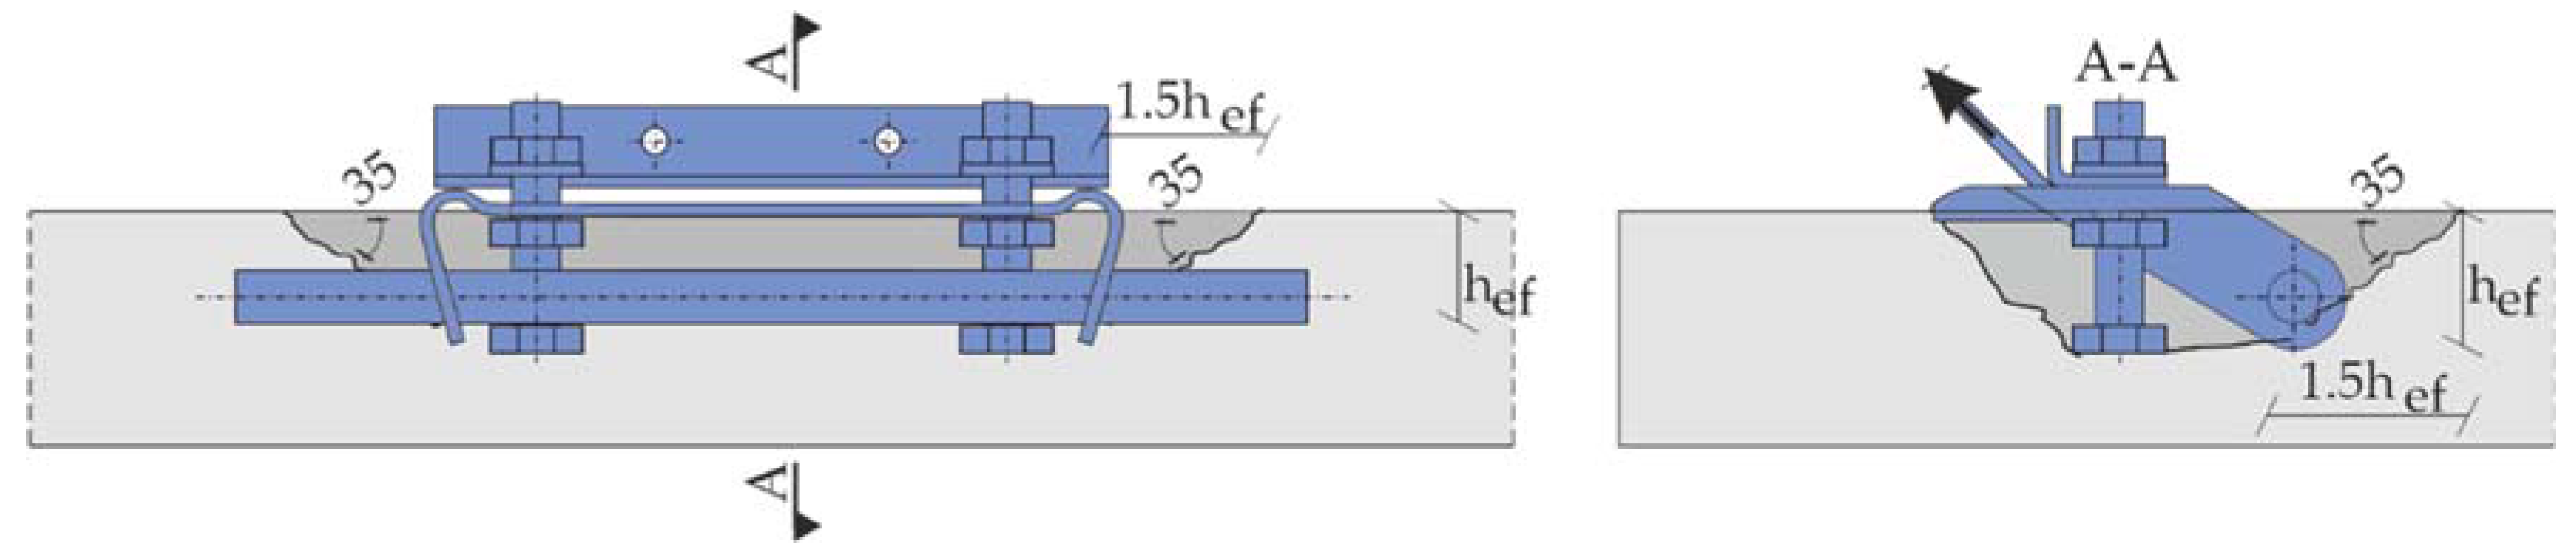
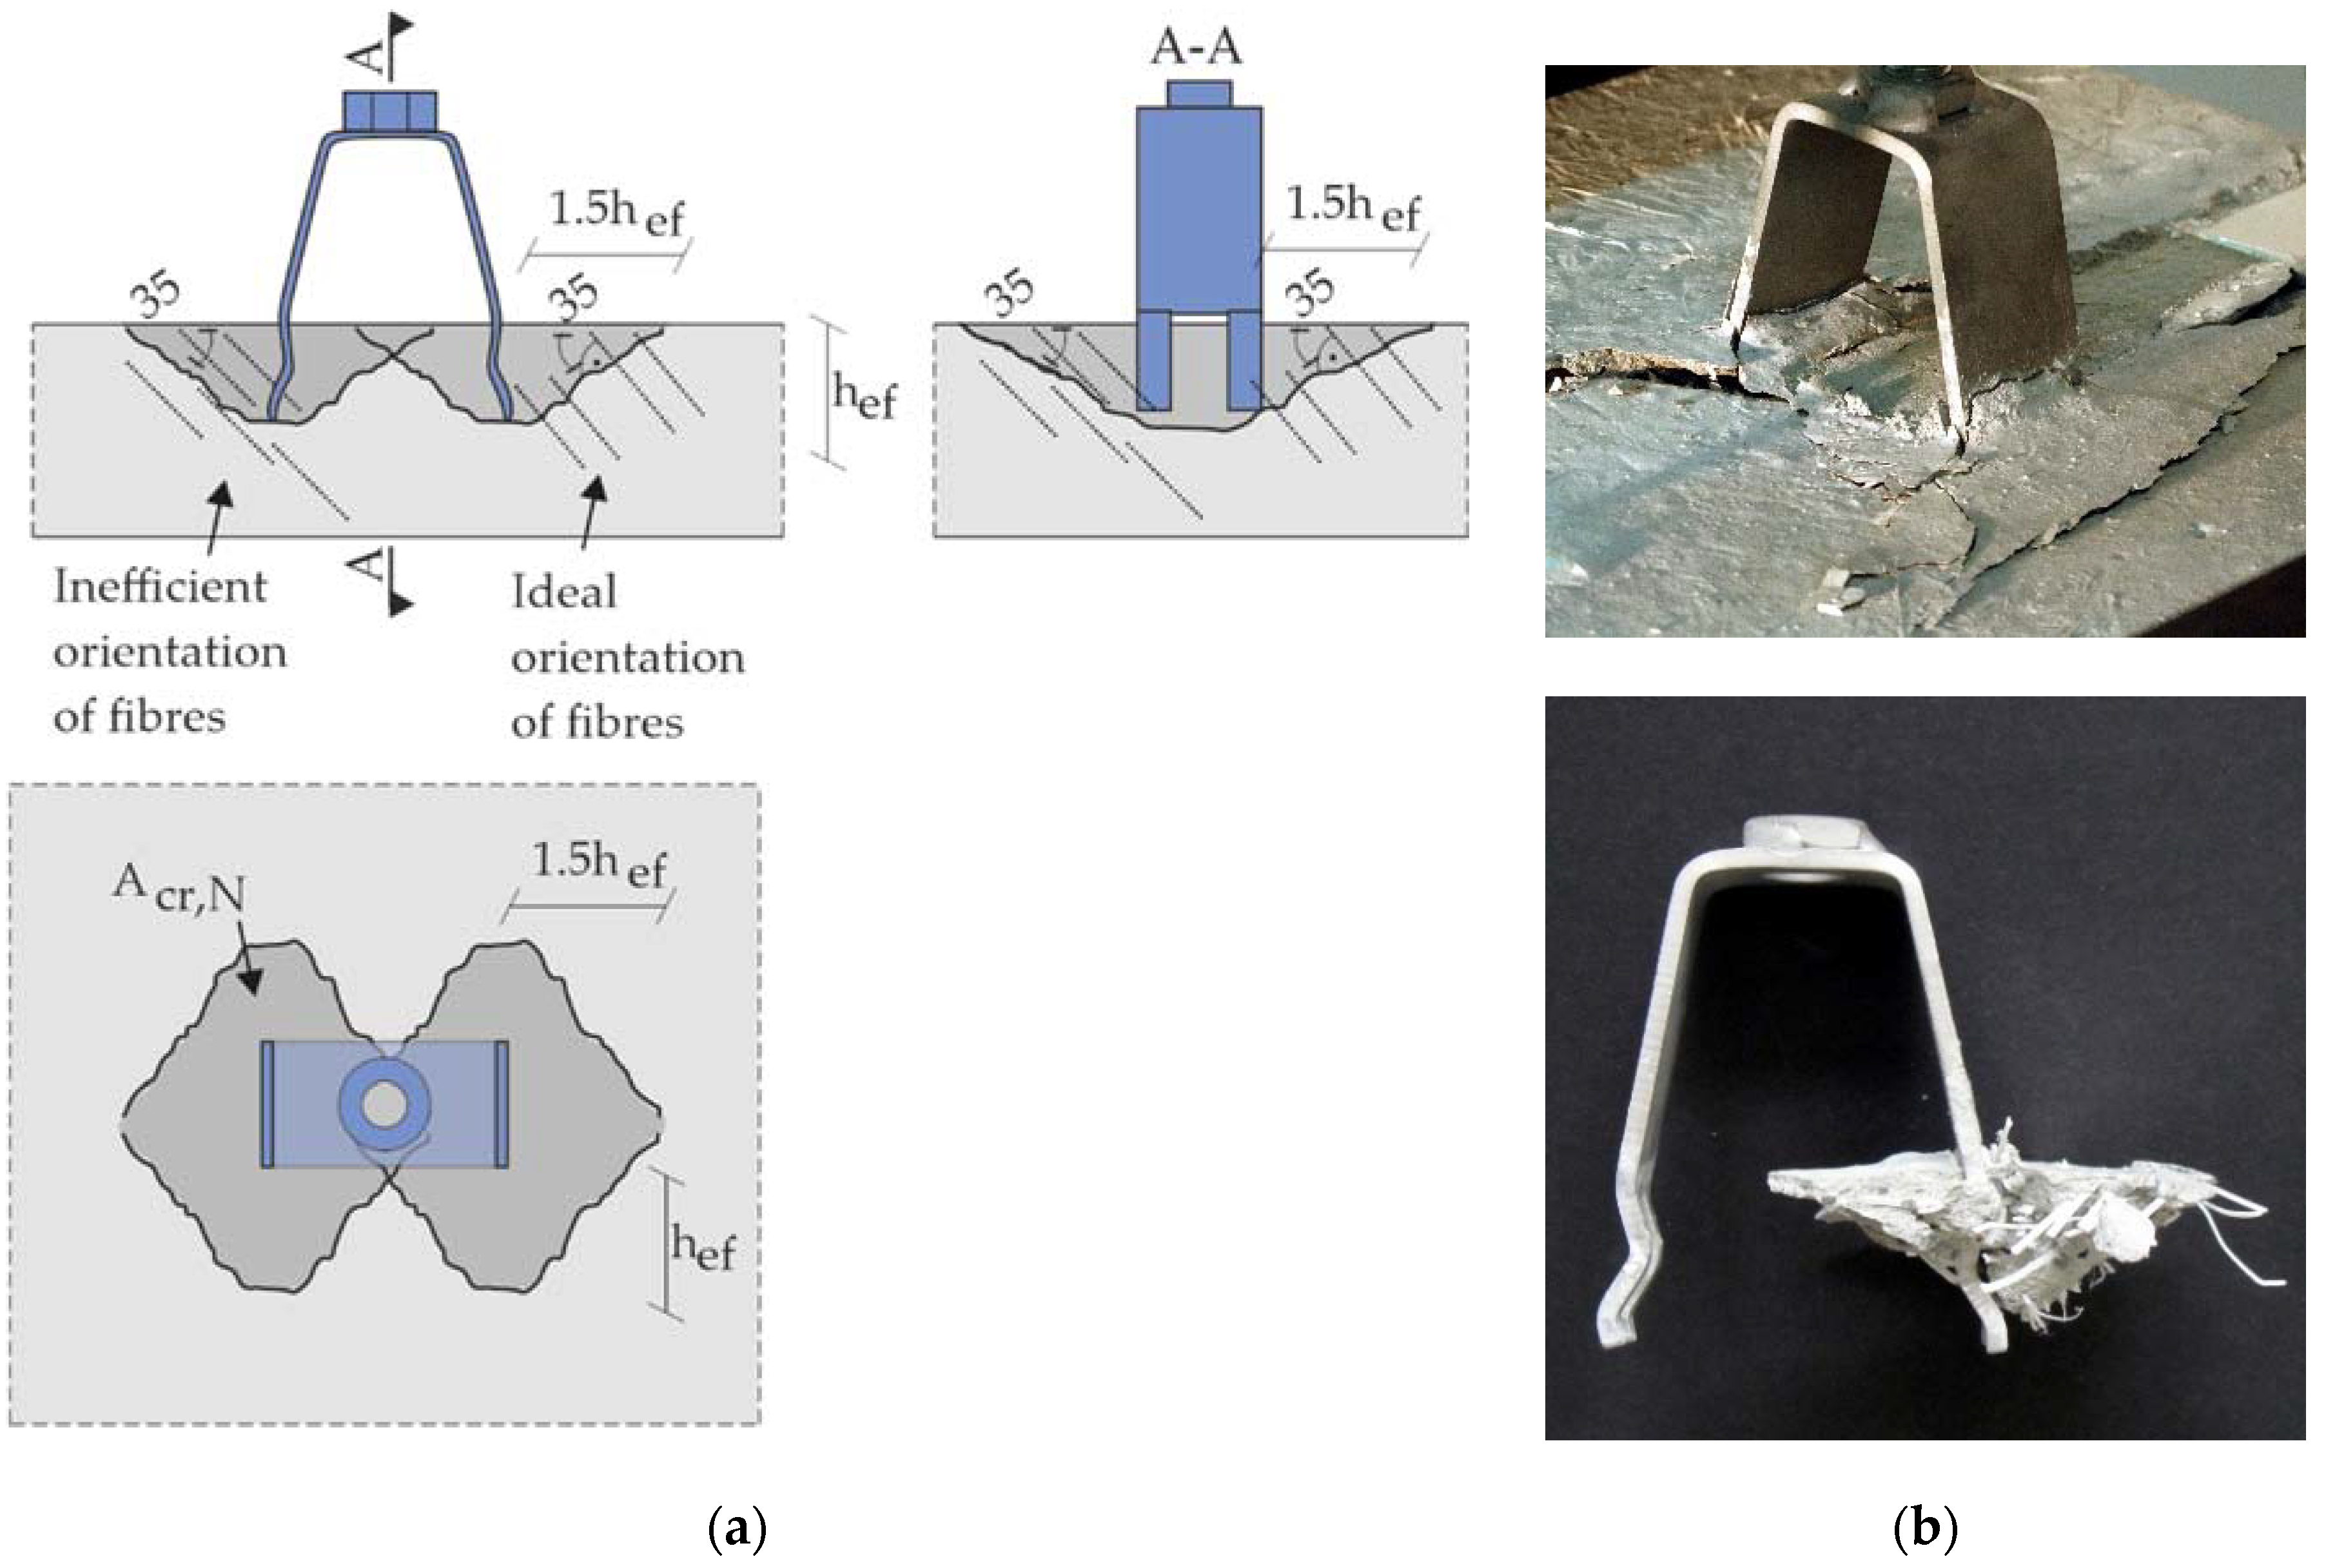
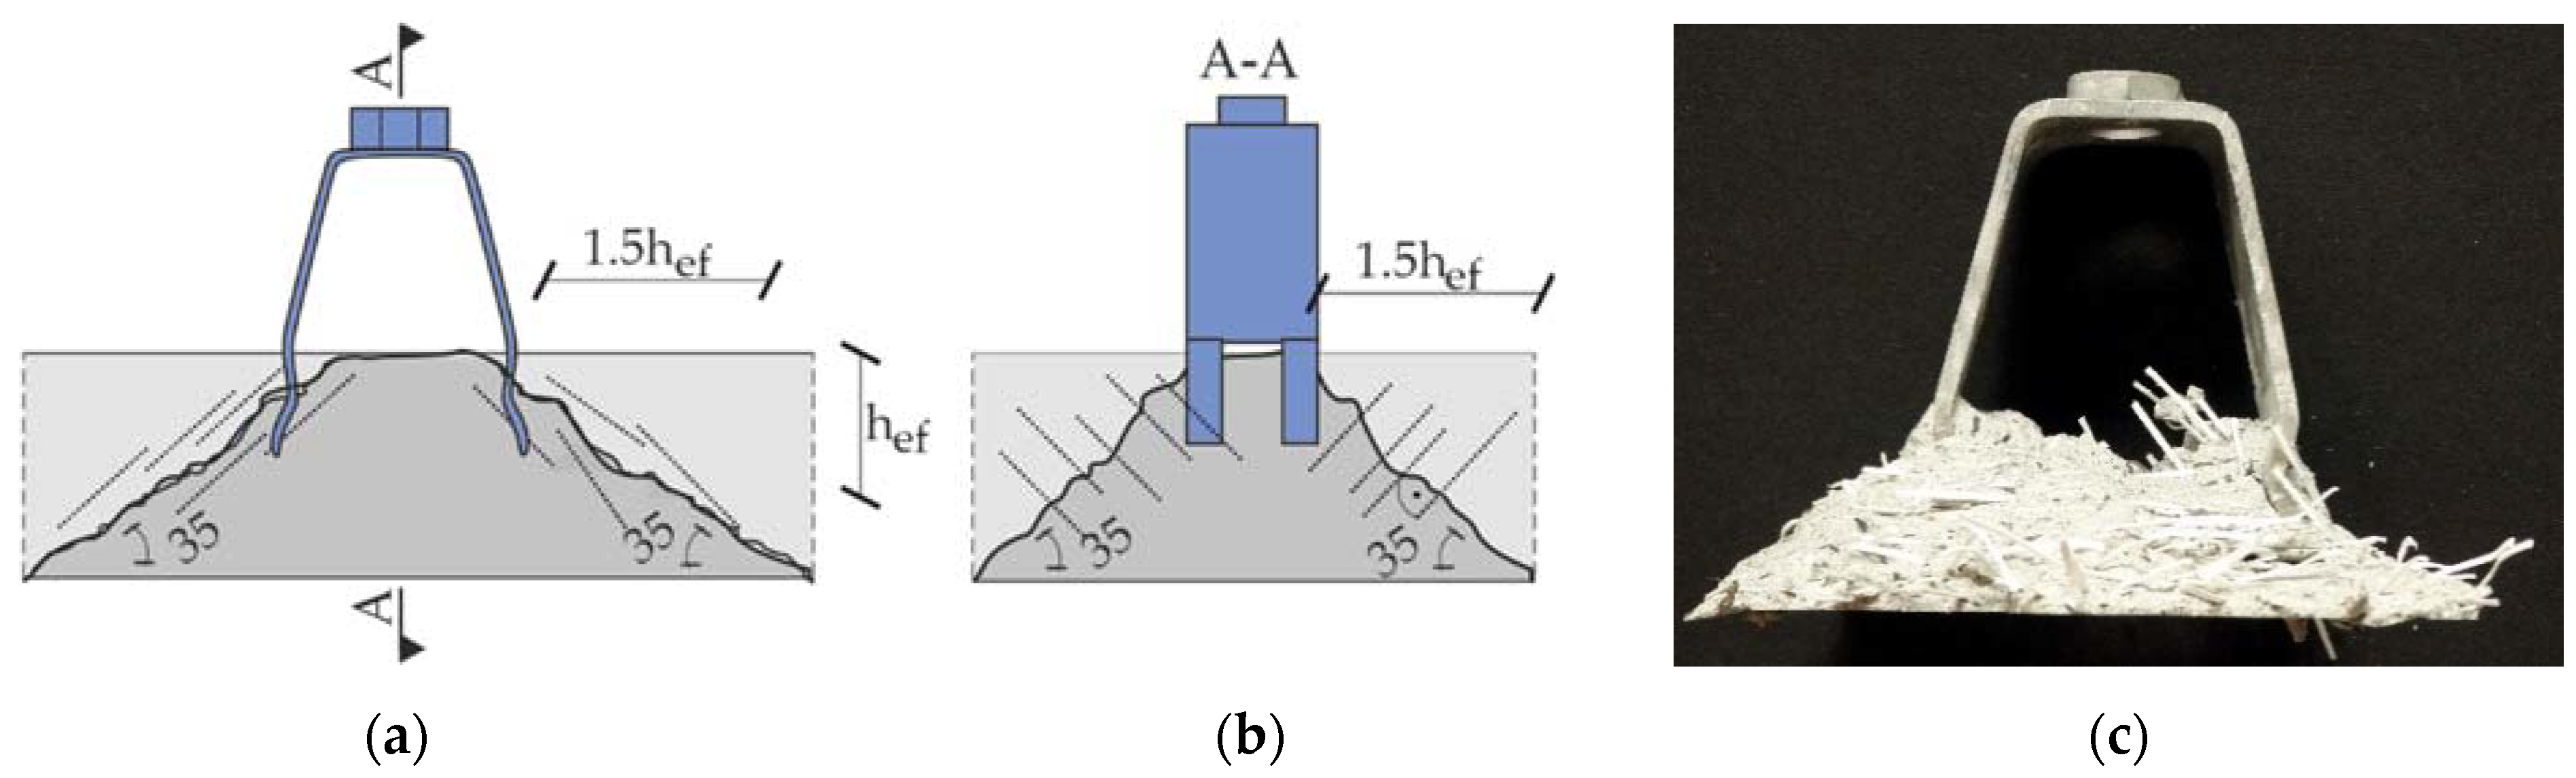
3.3.2. Determination of Punching Resistance
4. Results
4.1. Results of Pull-Out Resistance Tests on Adjustable Suspended Tension-Anchor
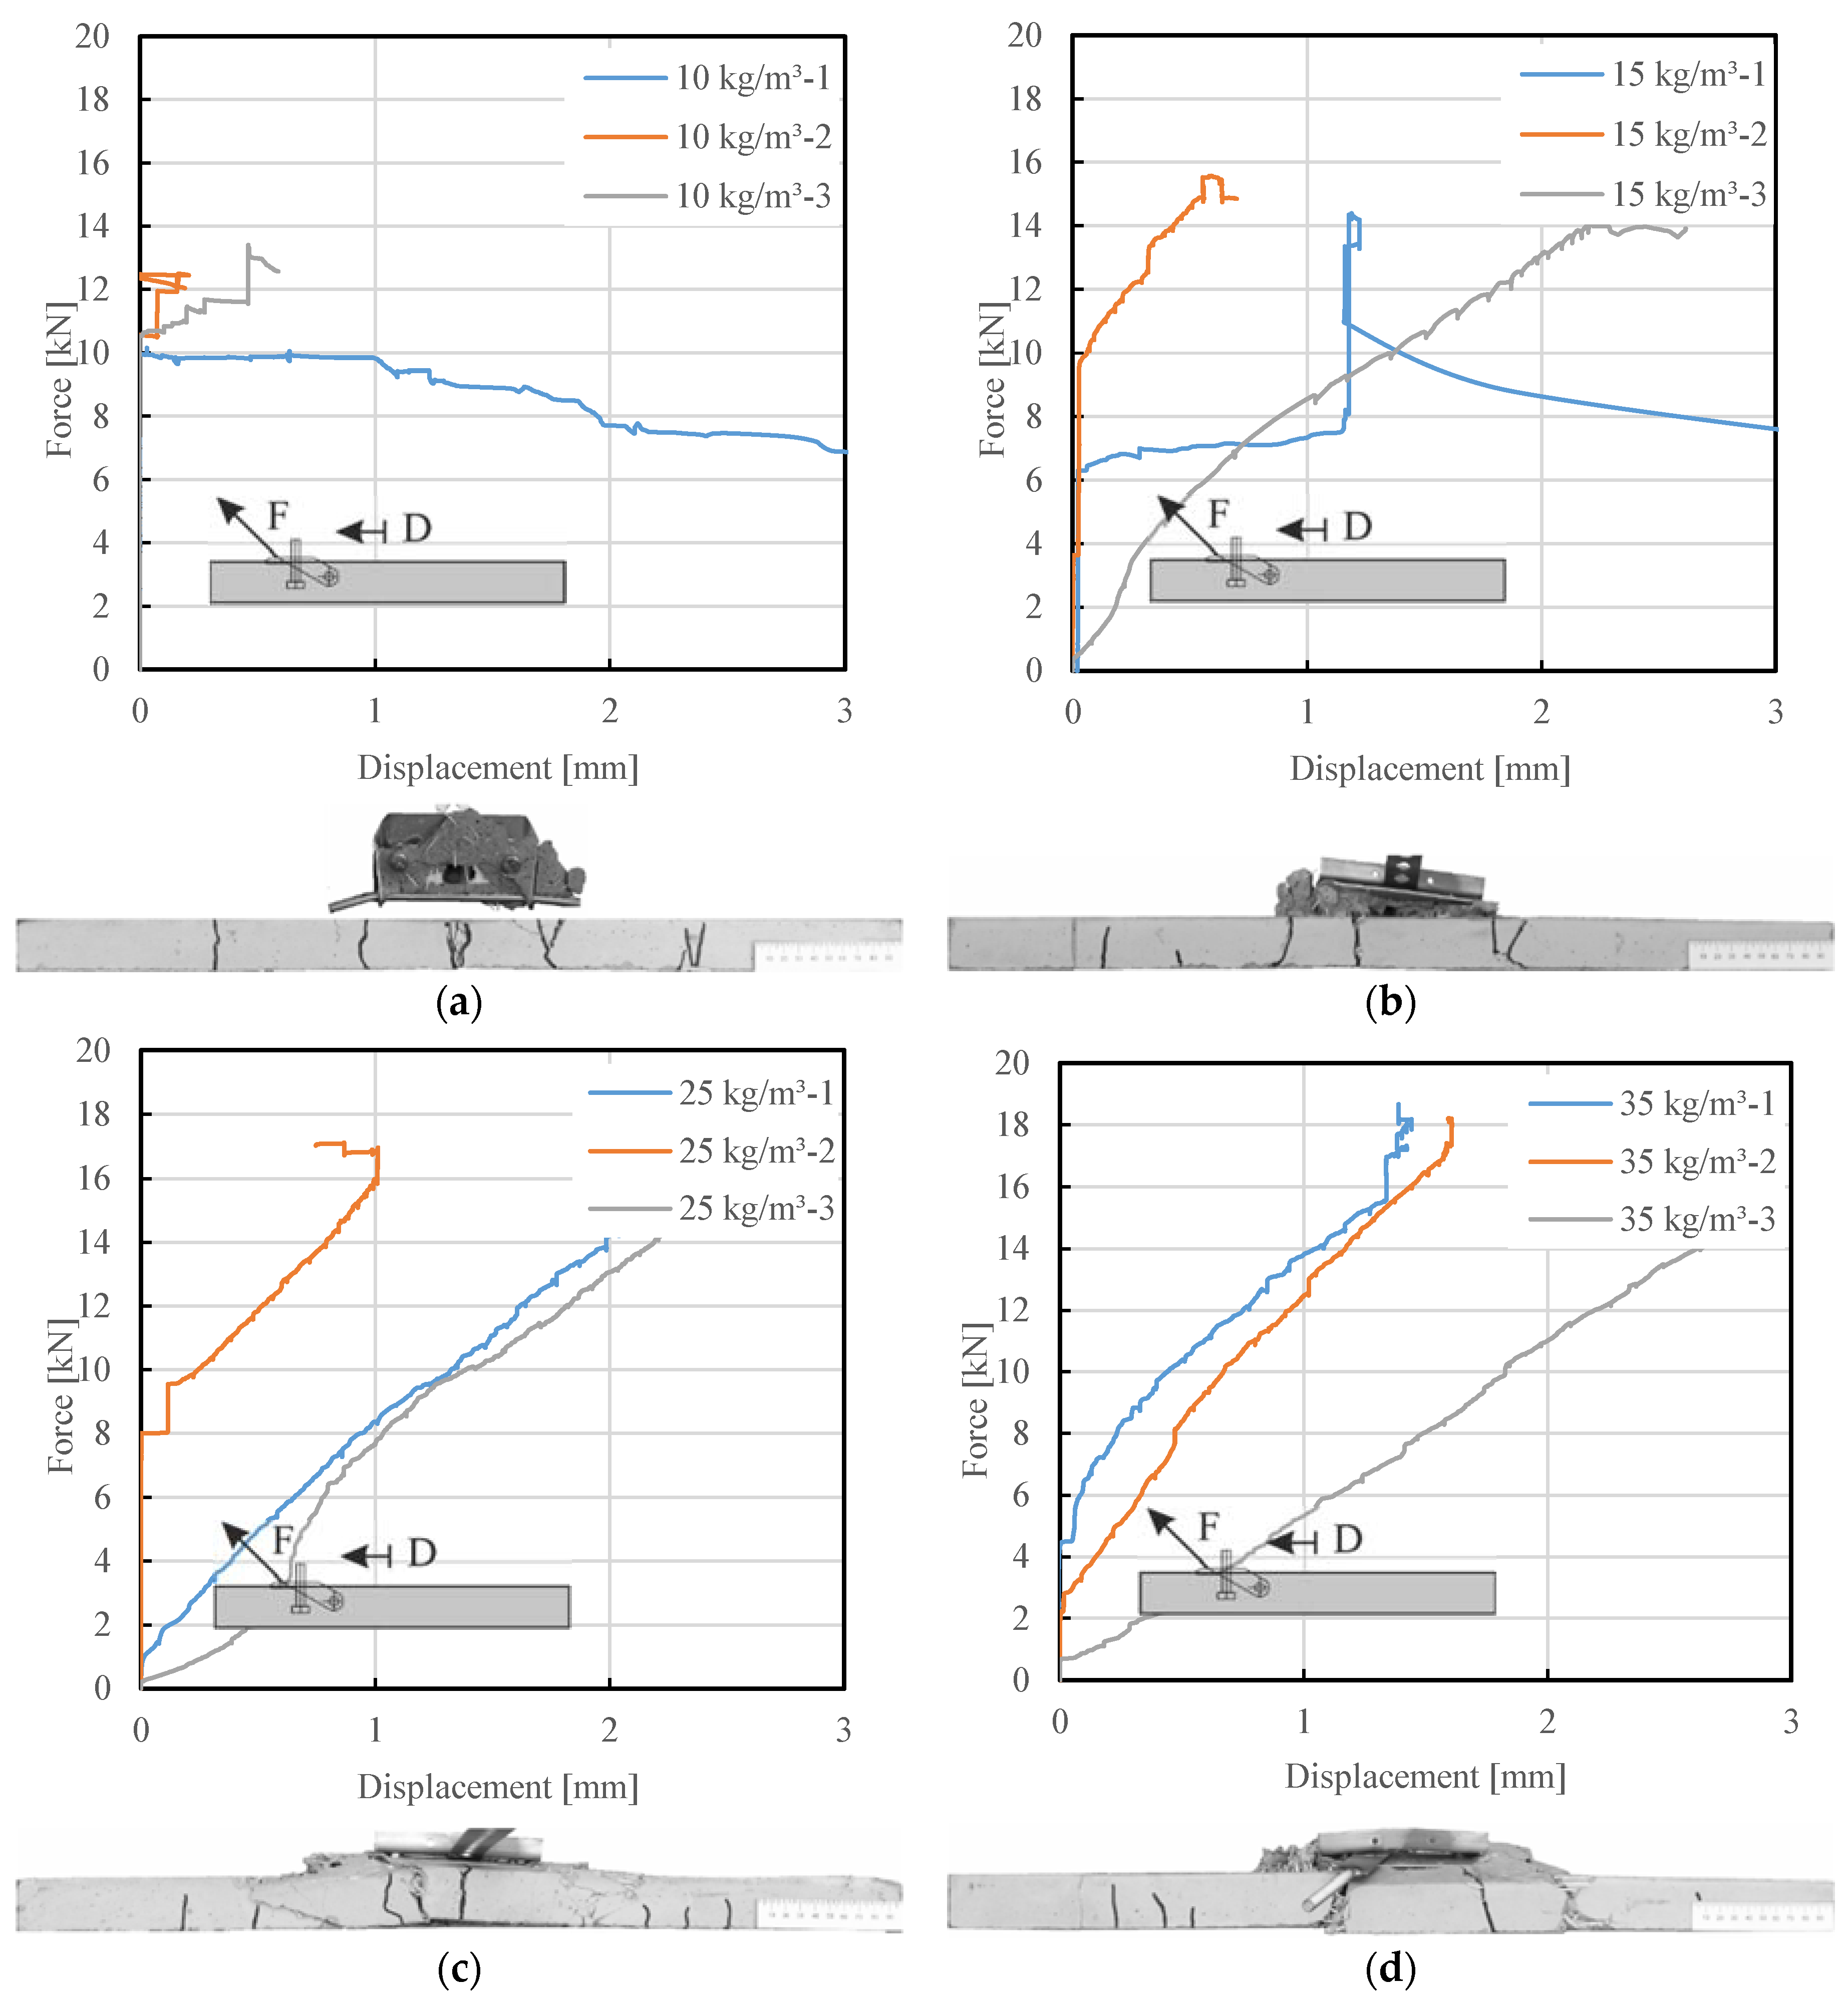
4.2. Results of Pull-Out Tests on Adjustable Spacer Bolt
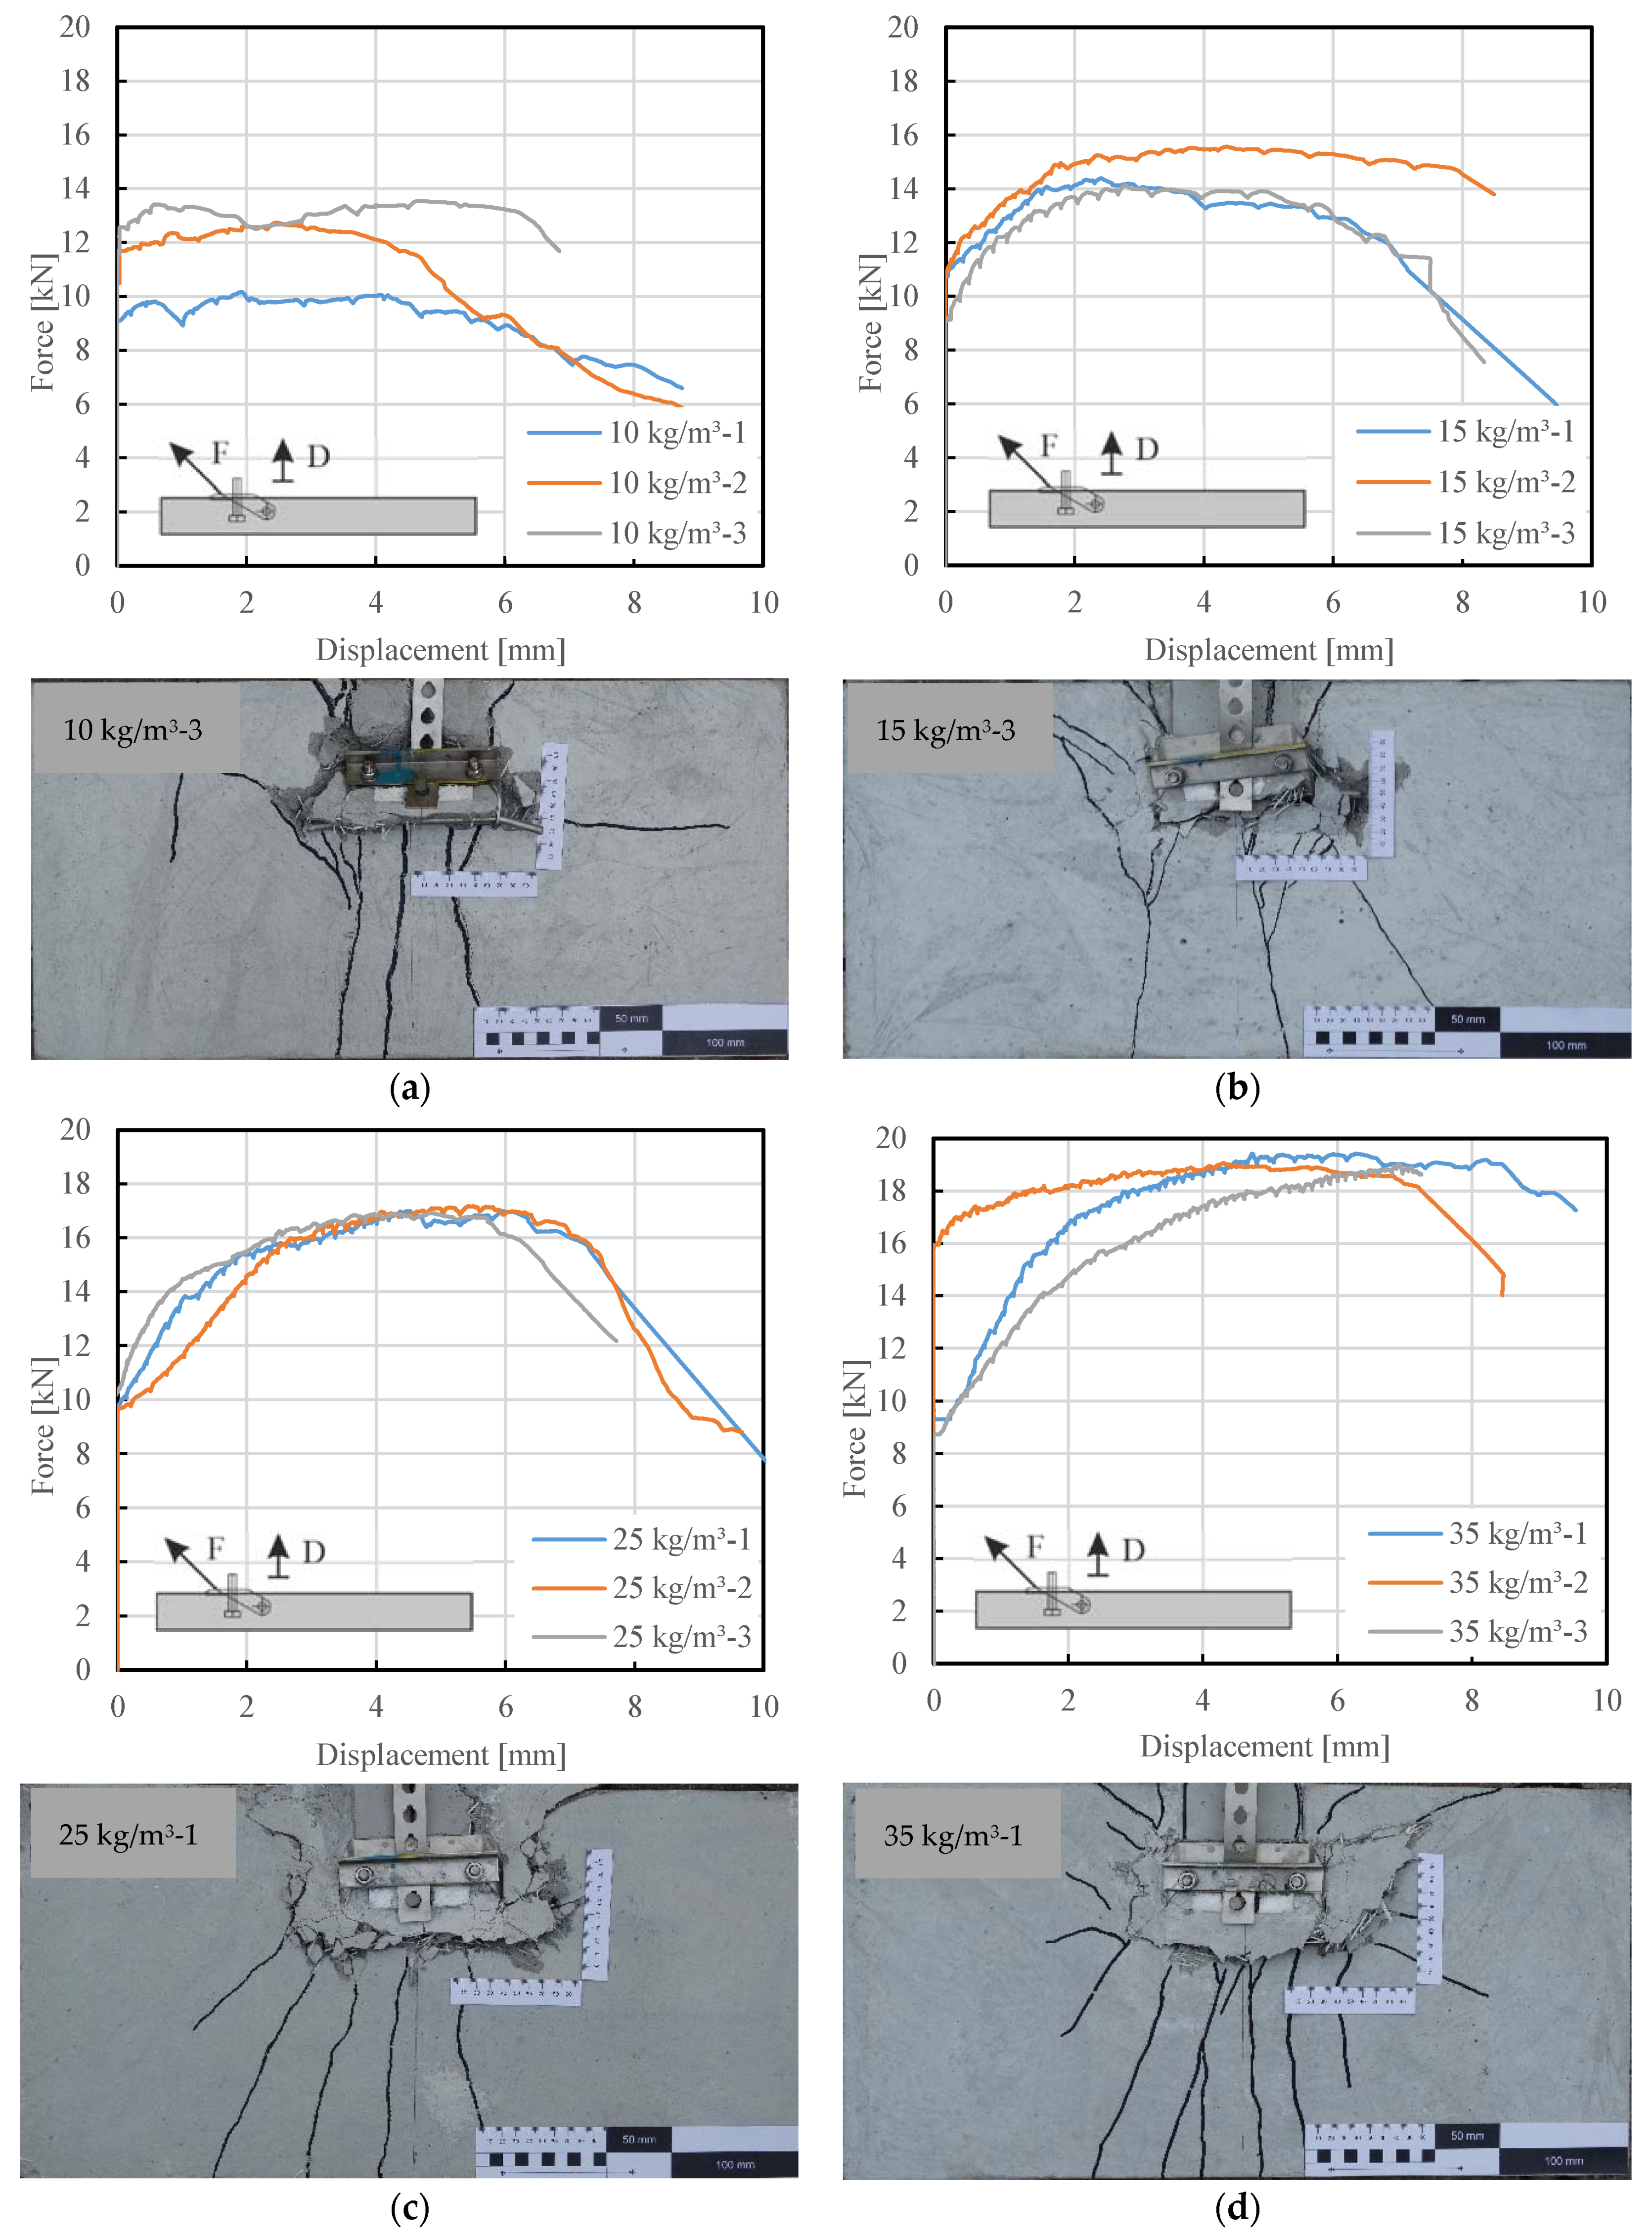
4.3. Results of Punching Resistance Tests on Adjustable Spacer Bolt
5. Discussion
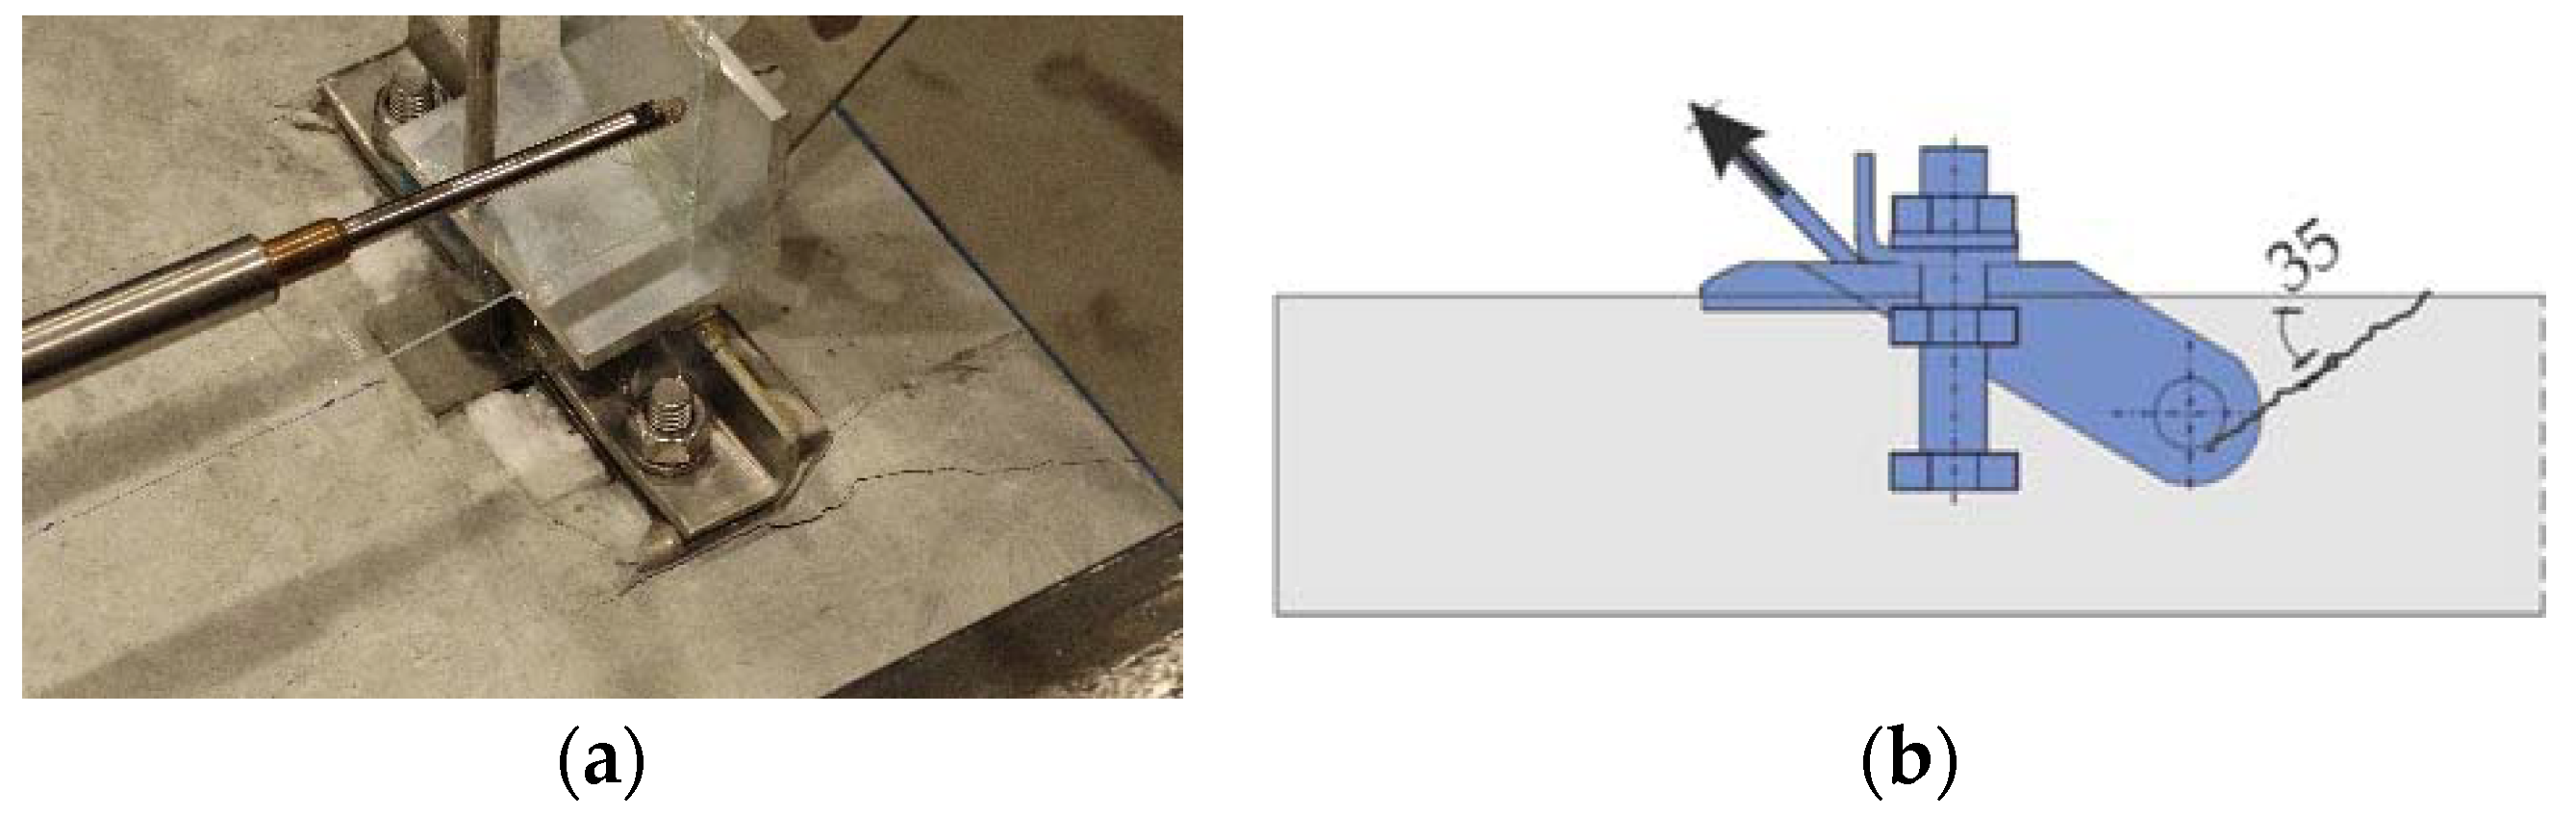
5.1. Pull-Out Resistance of Adjustable Suspended Tension-Anchor
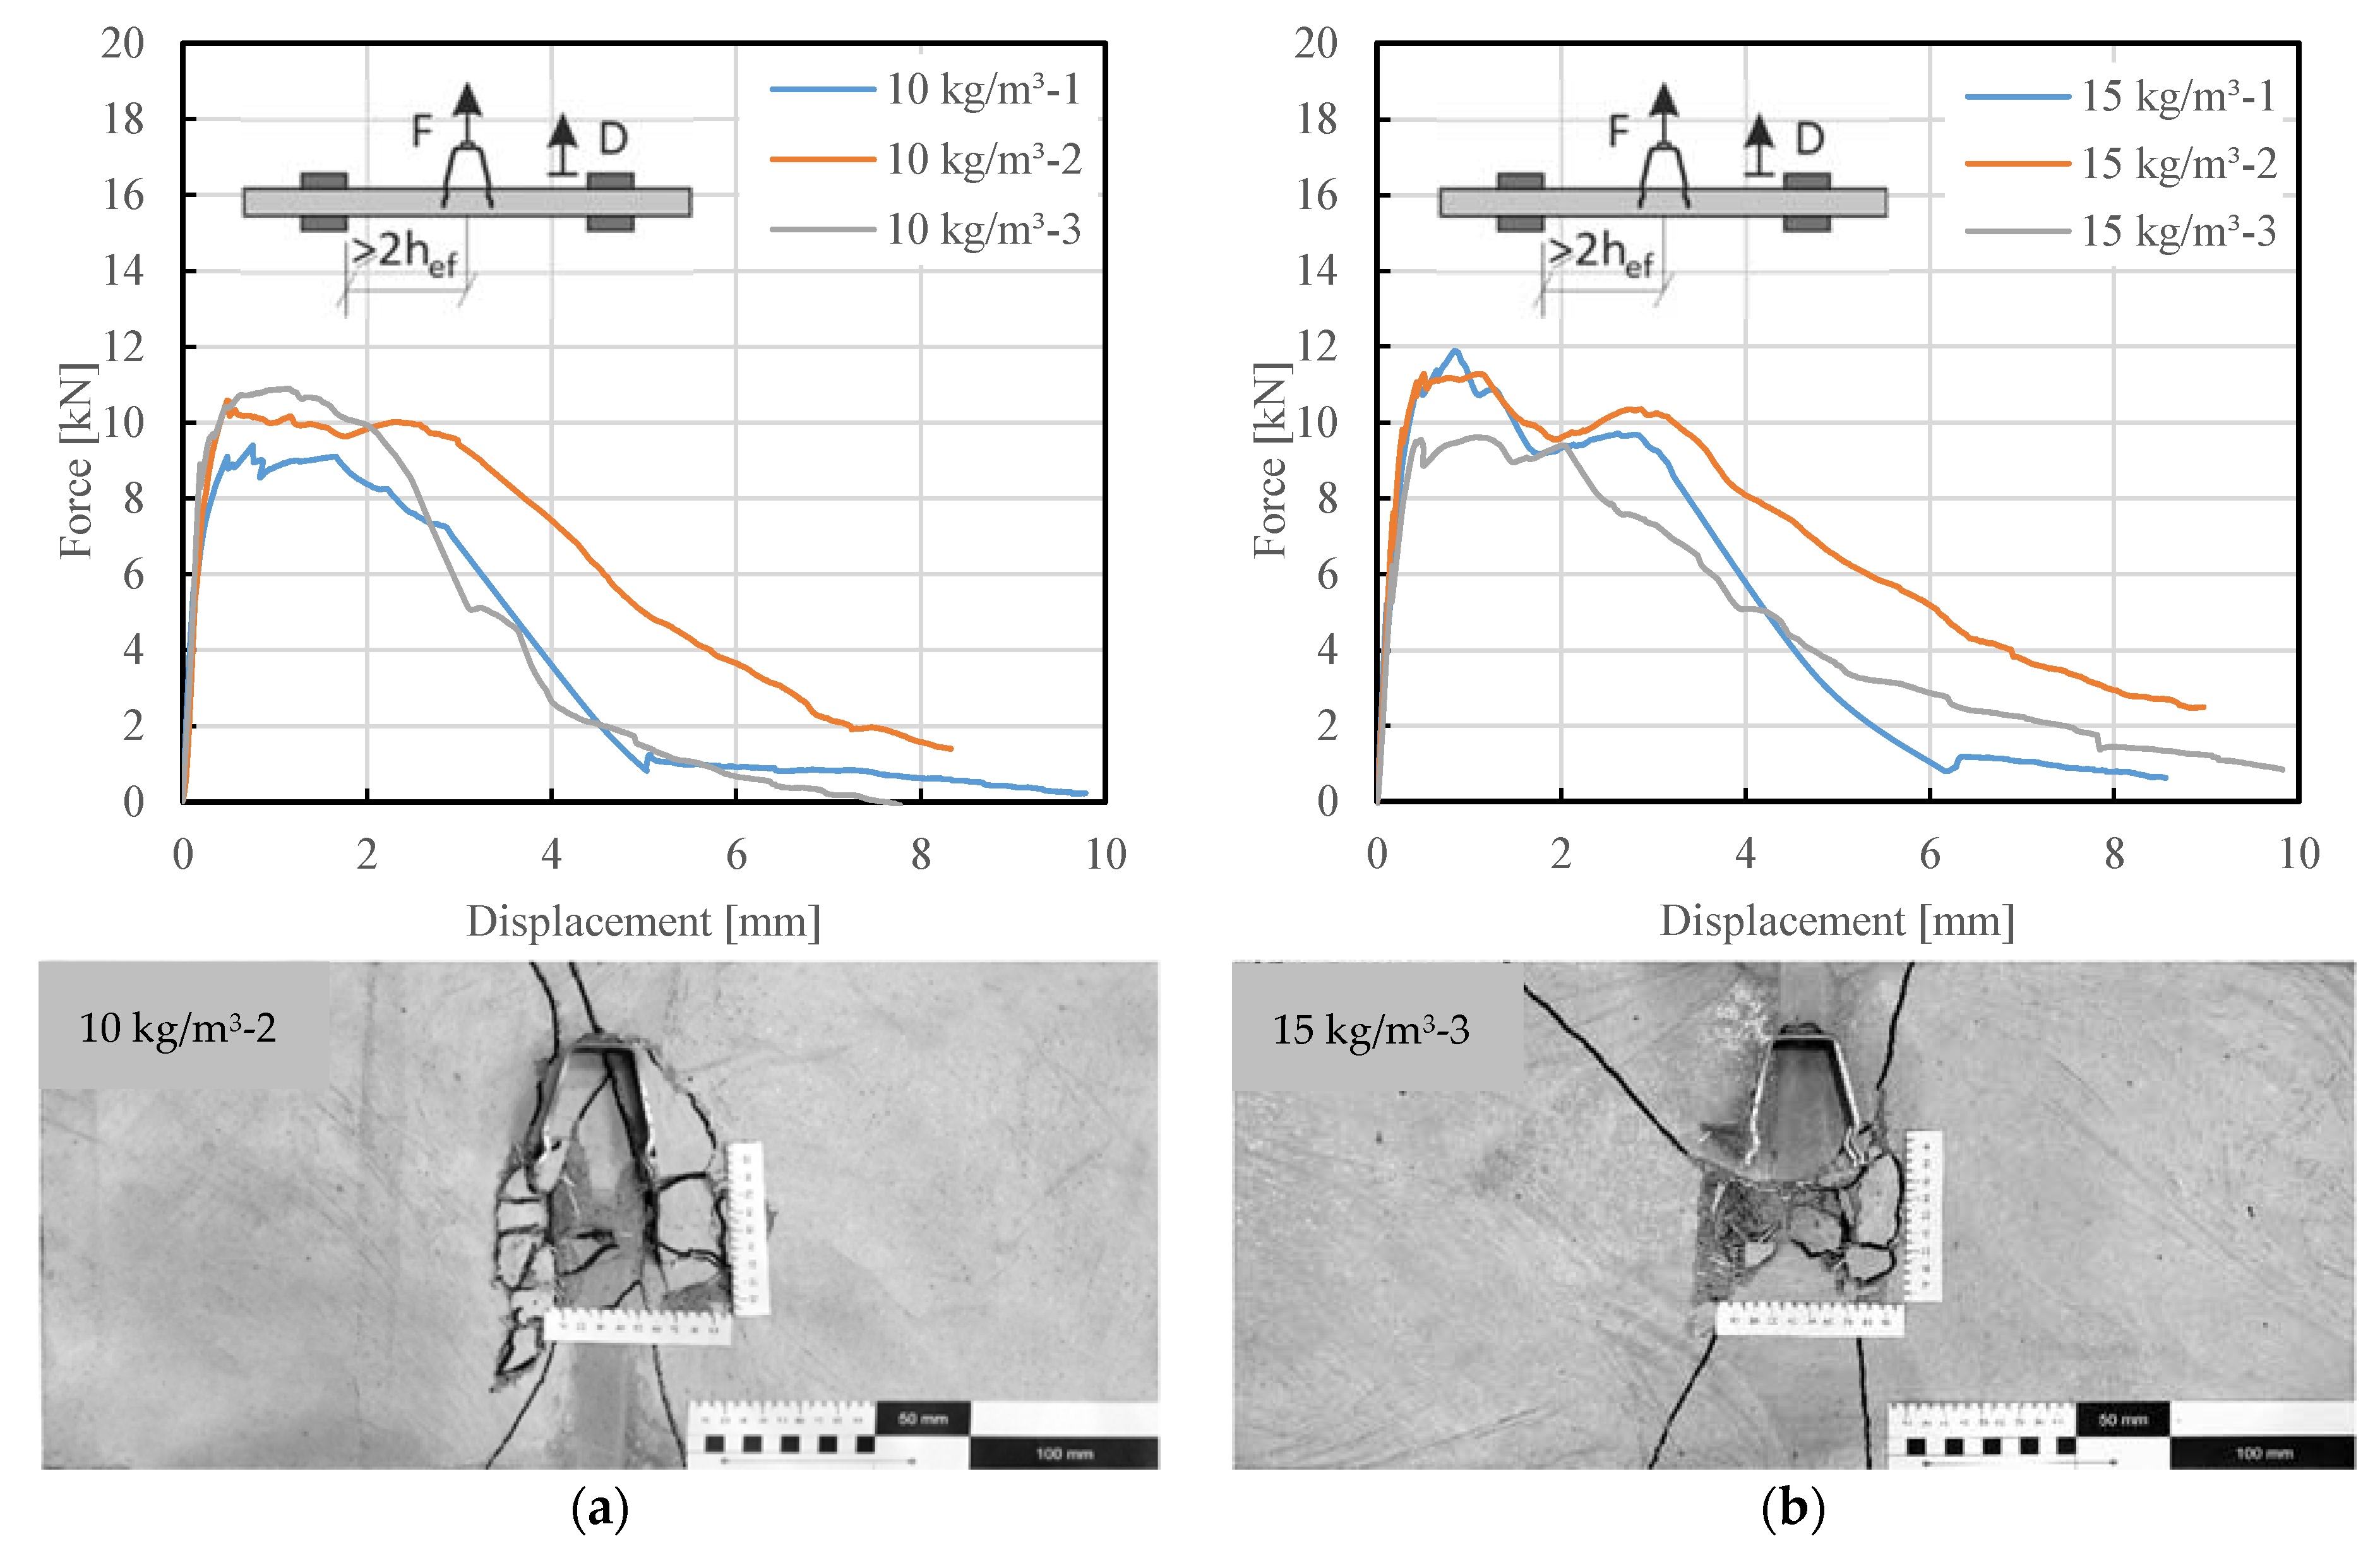
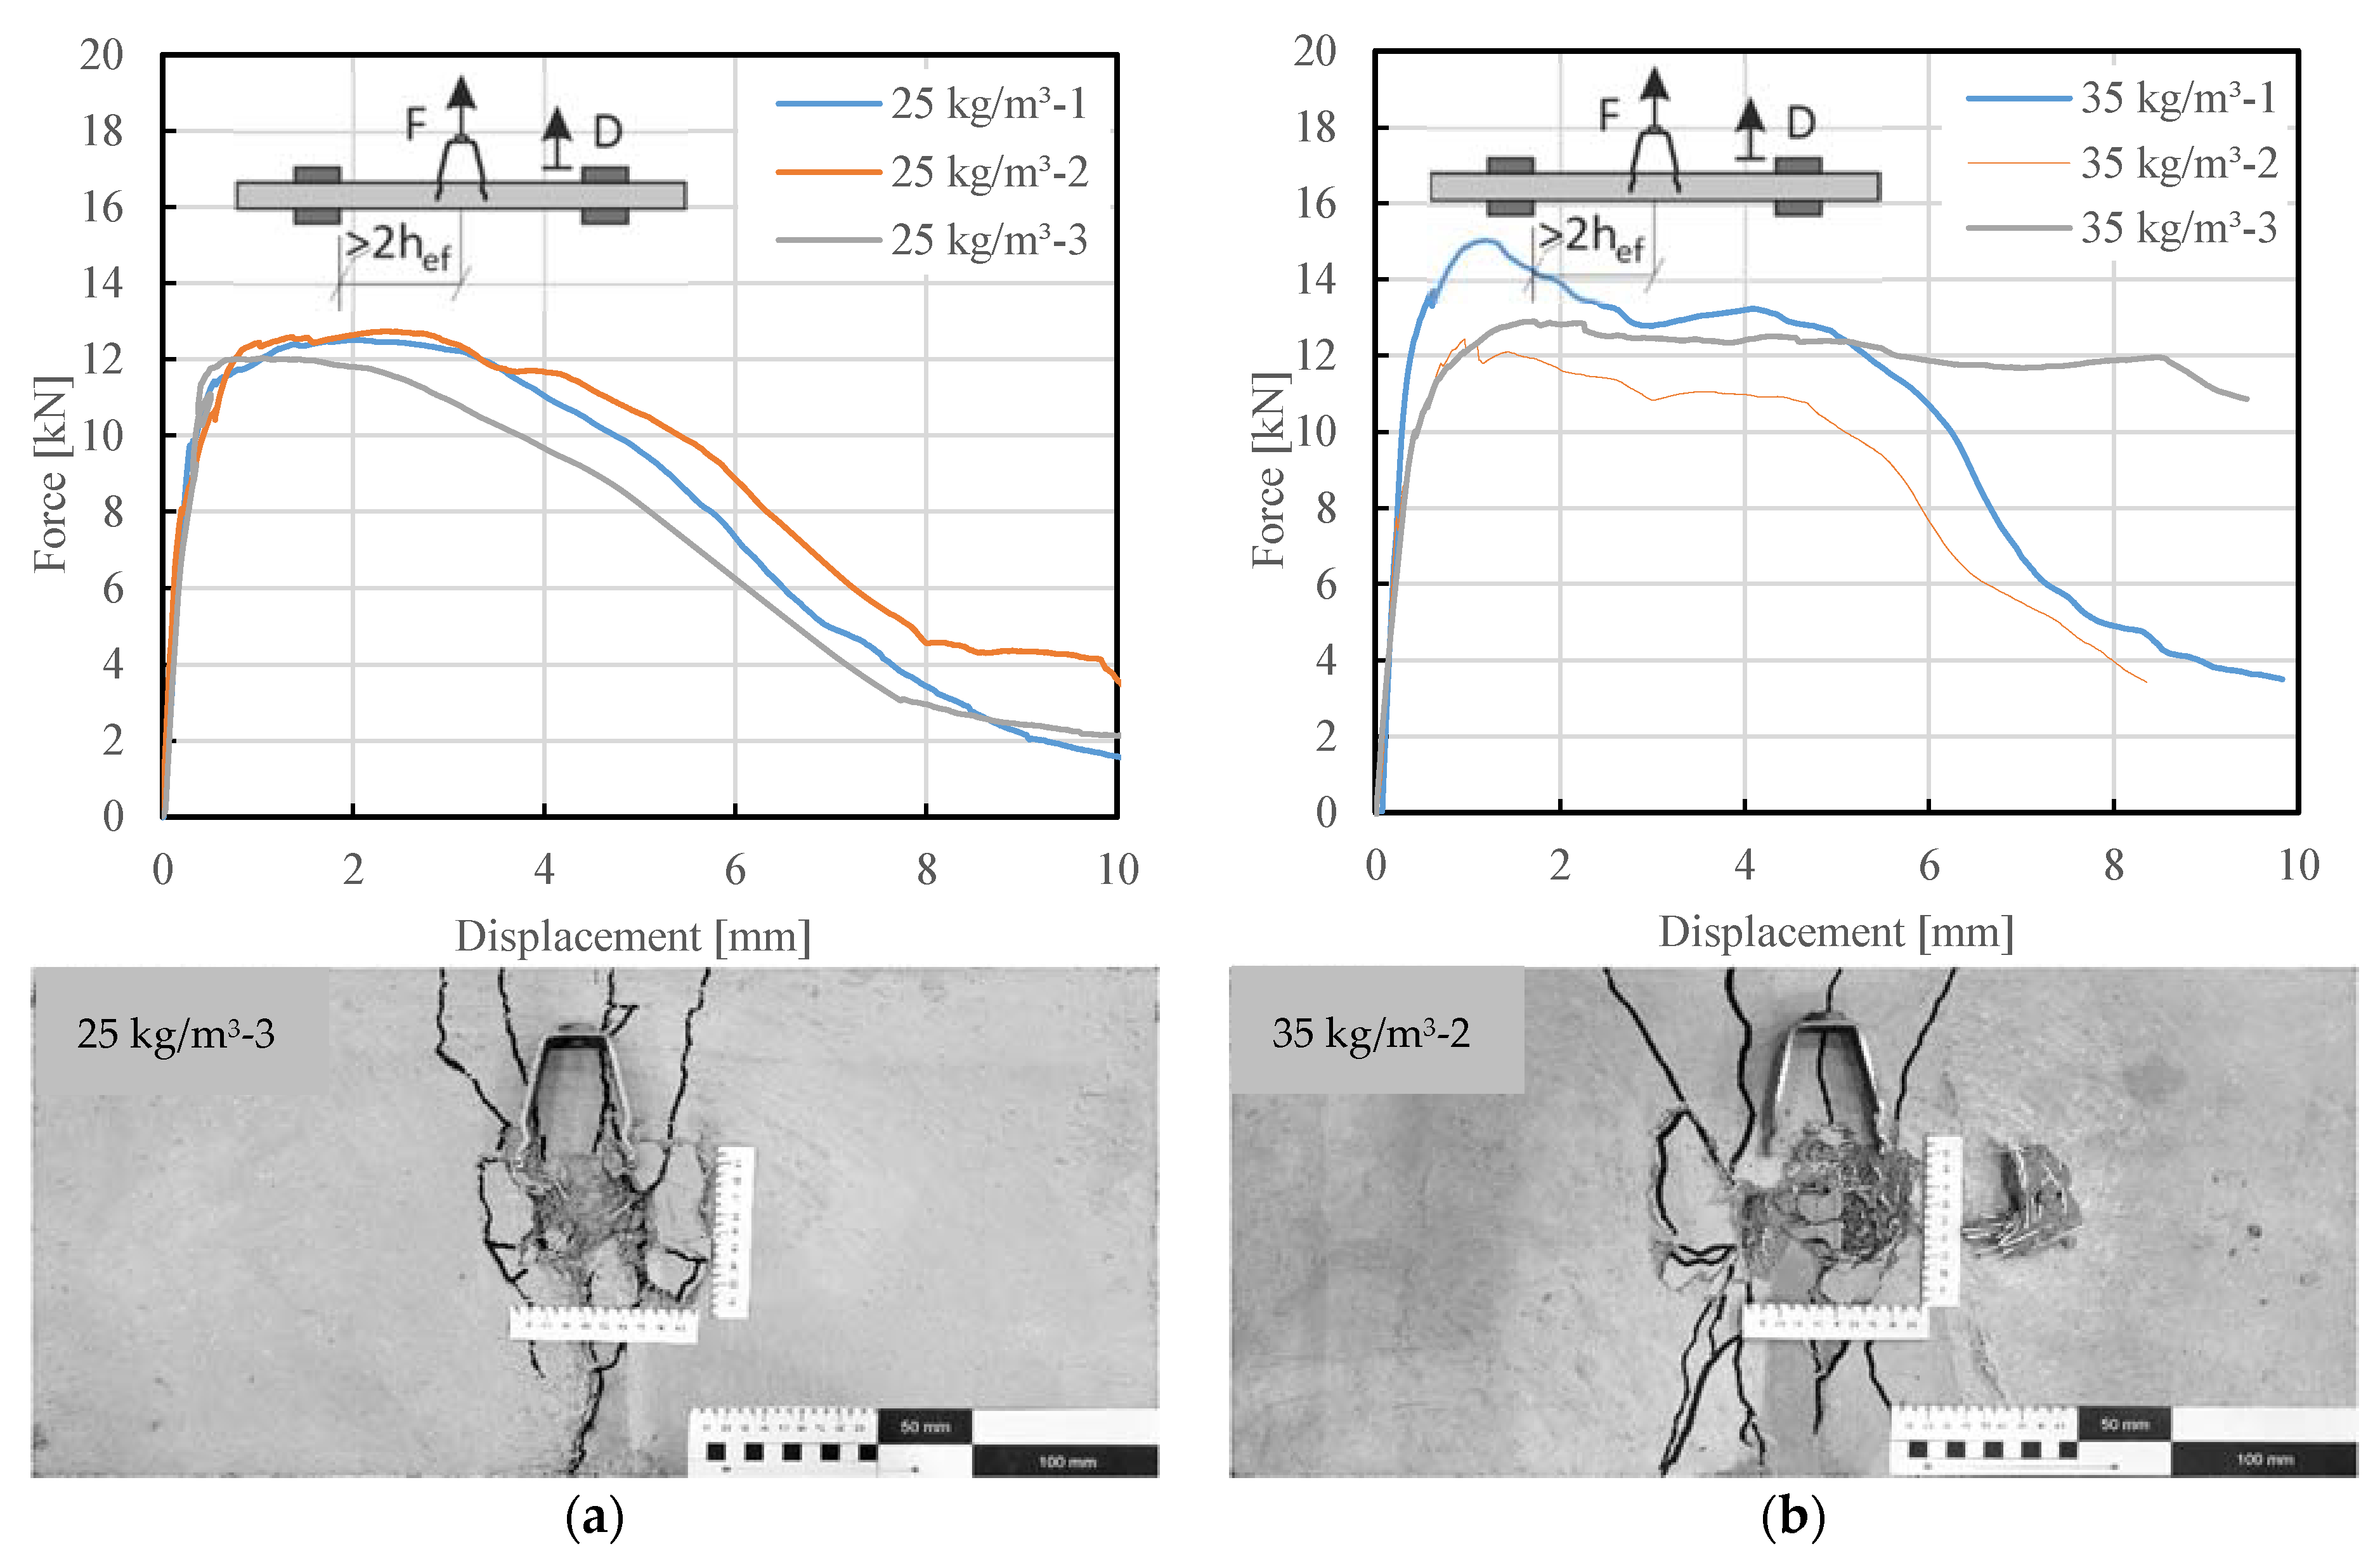
5.2. Pull-Out Resistance of Adjustable Spacer Bolt
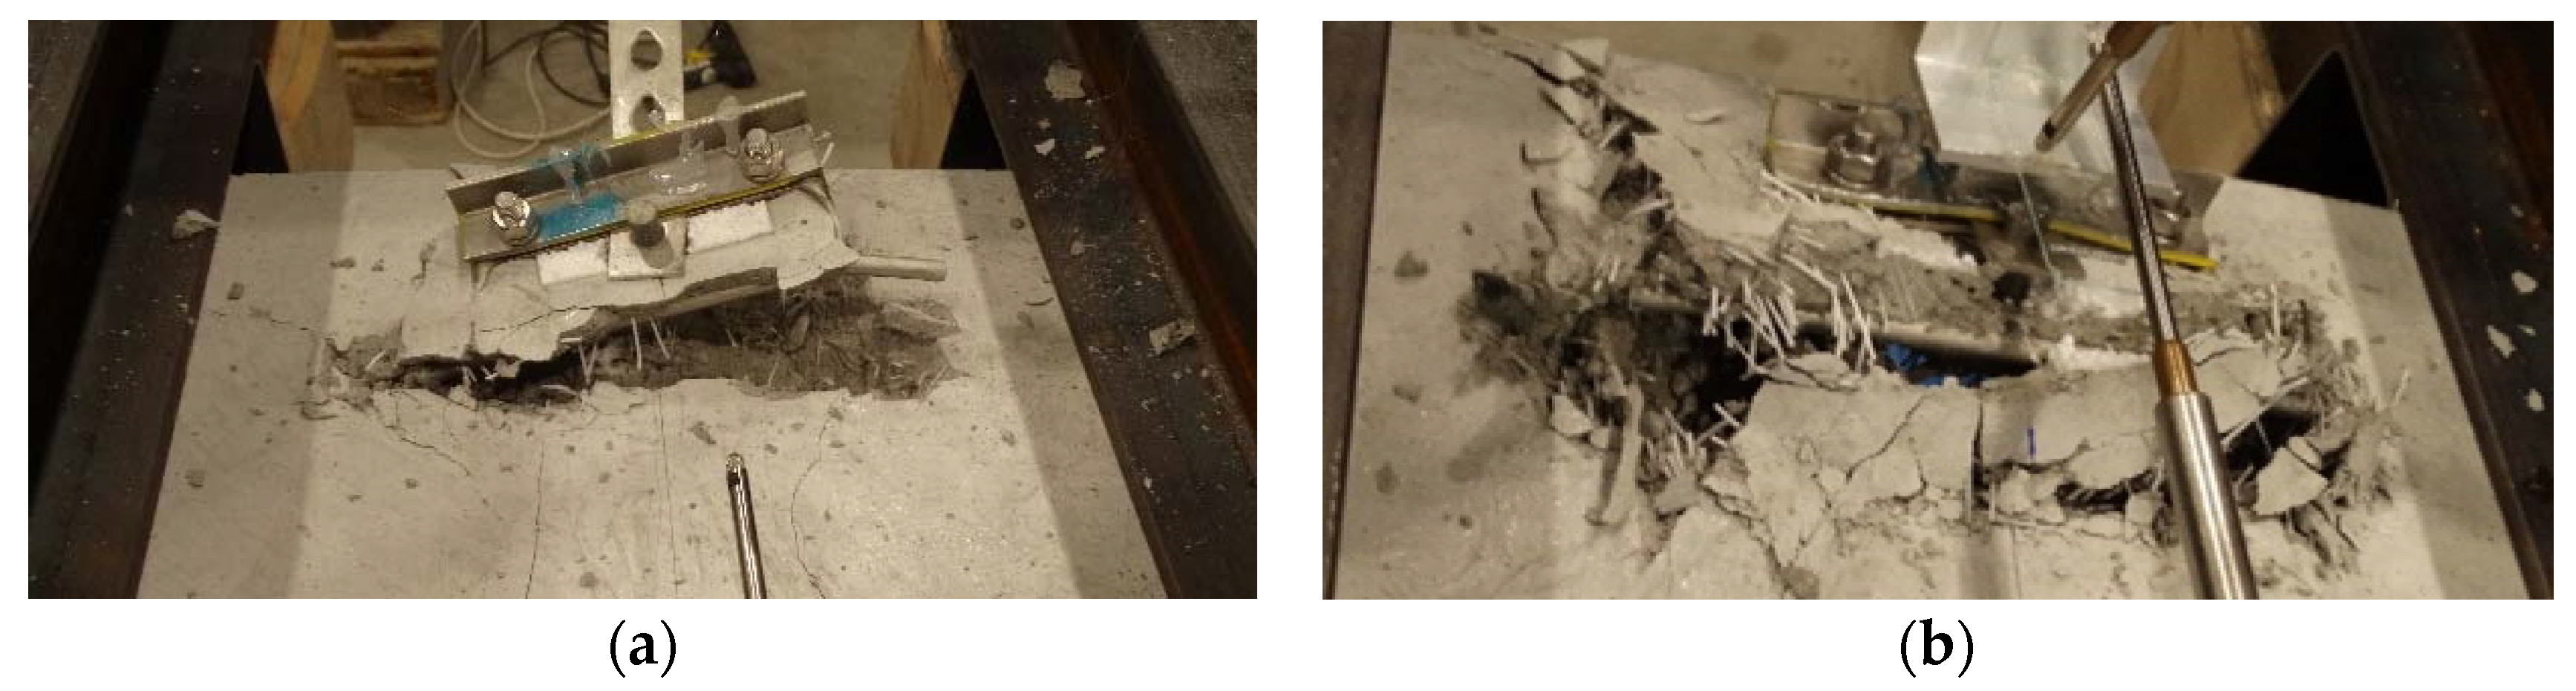
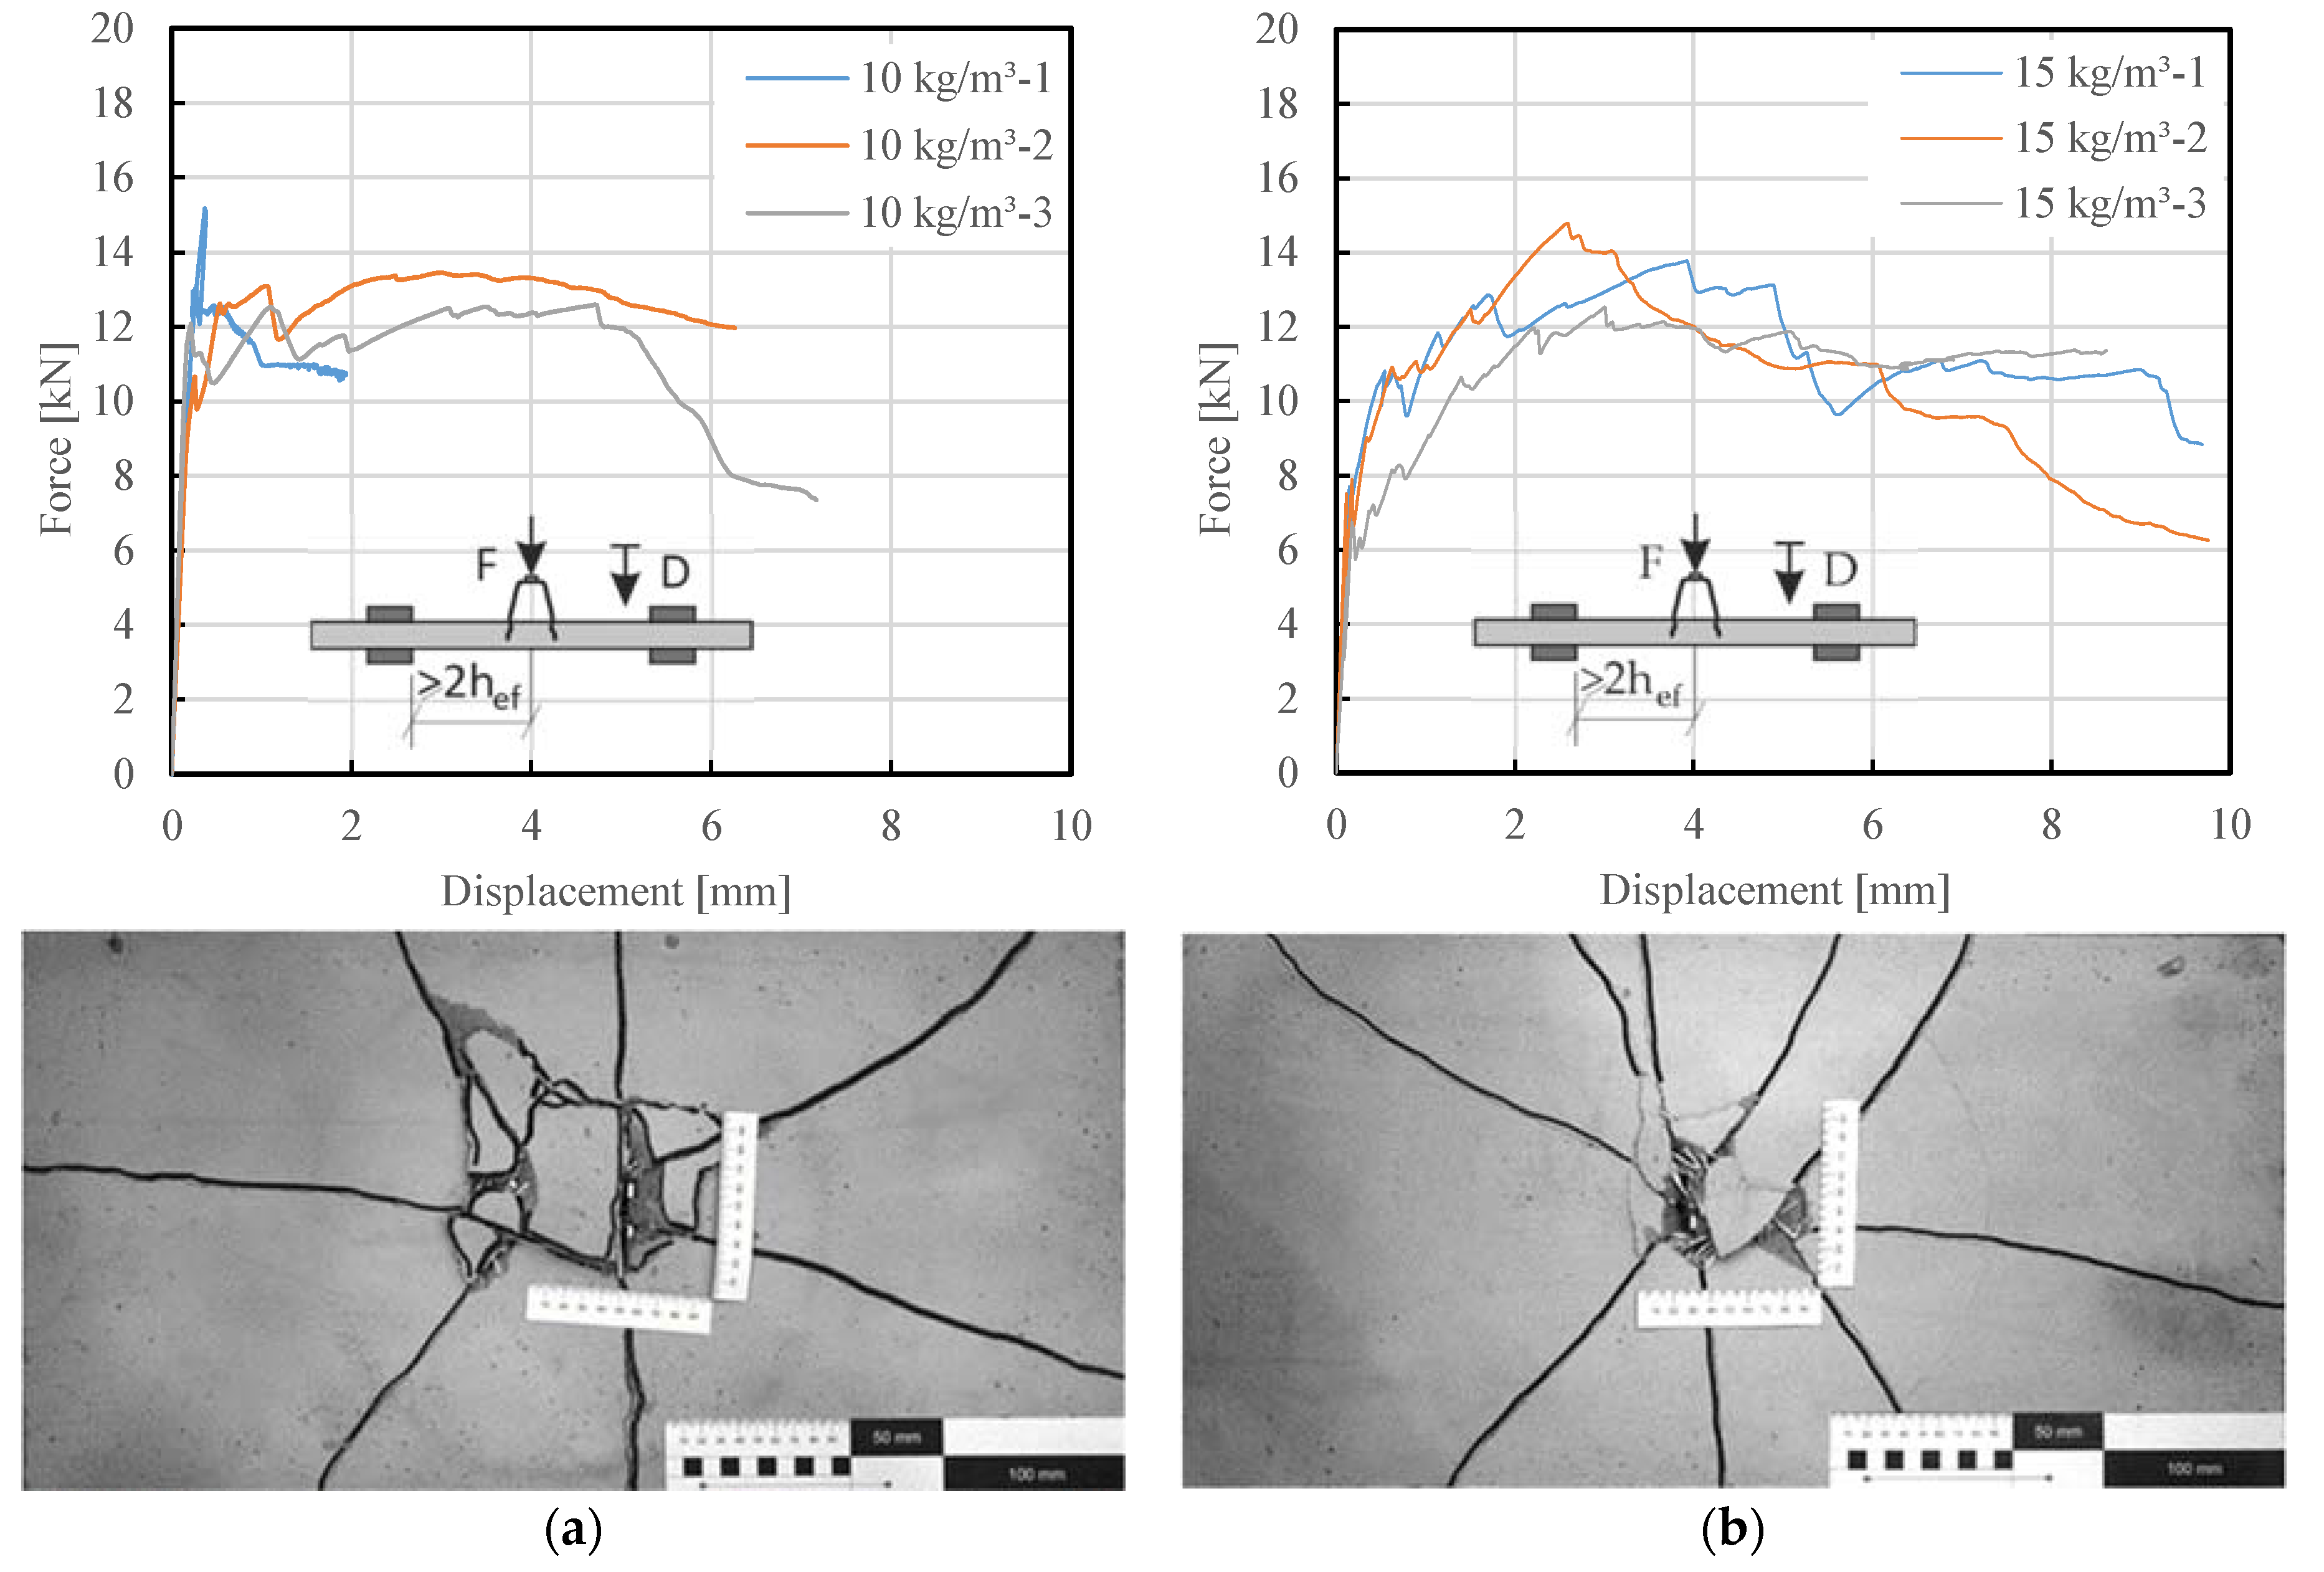
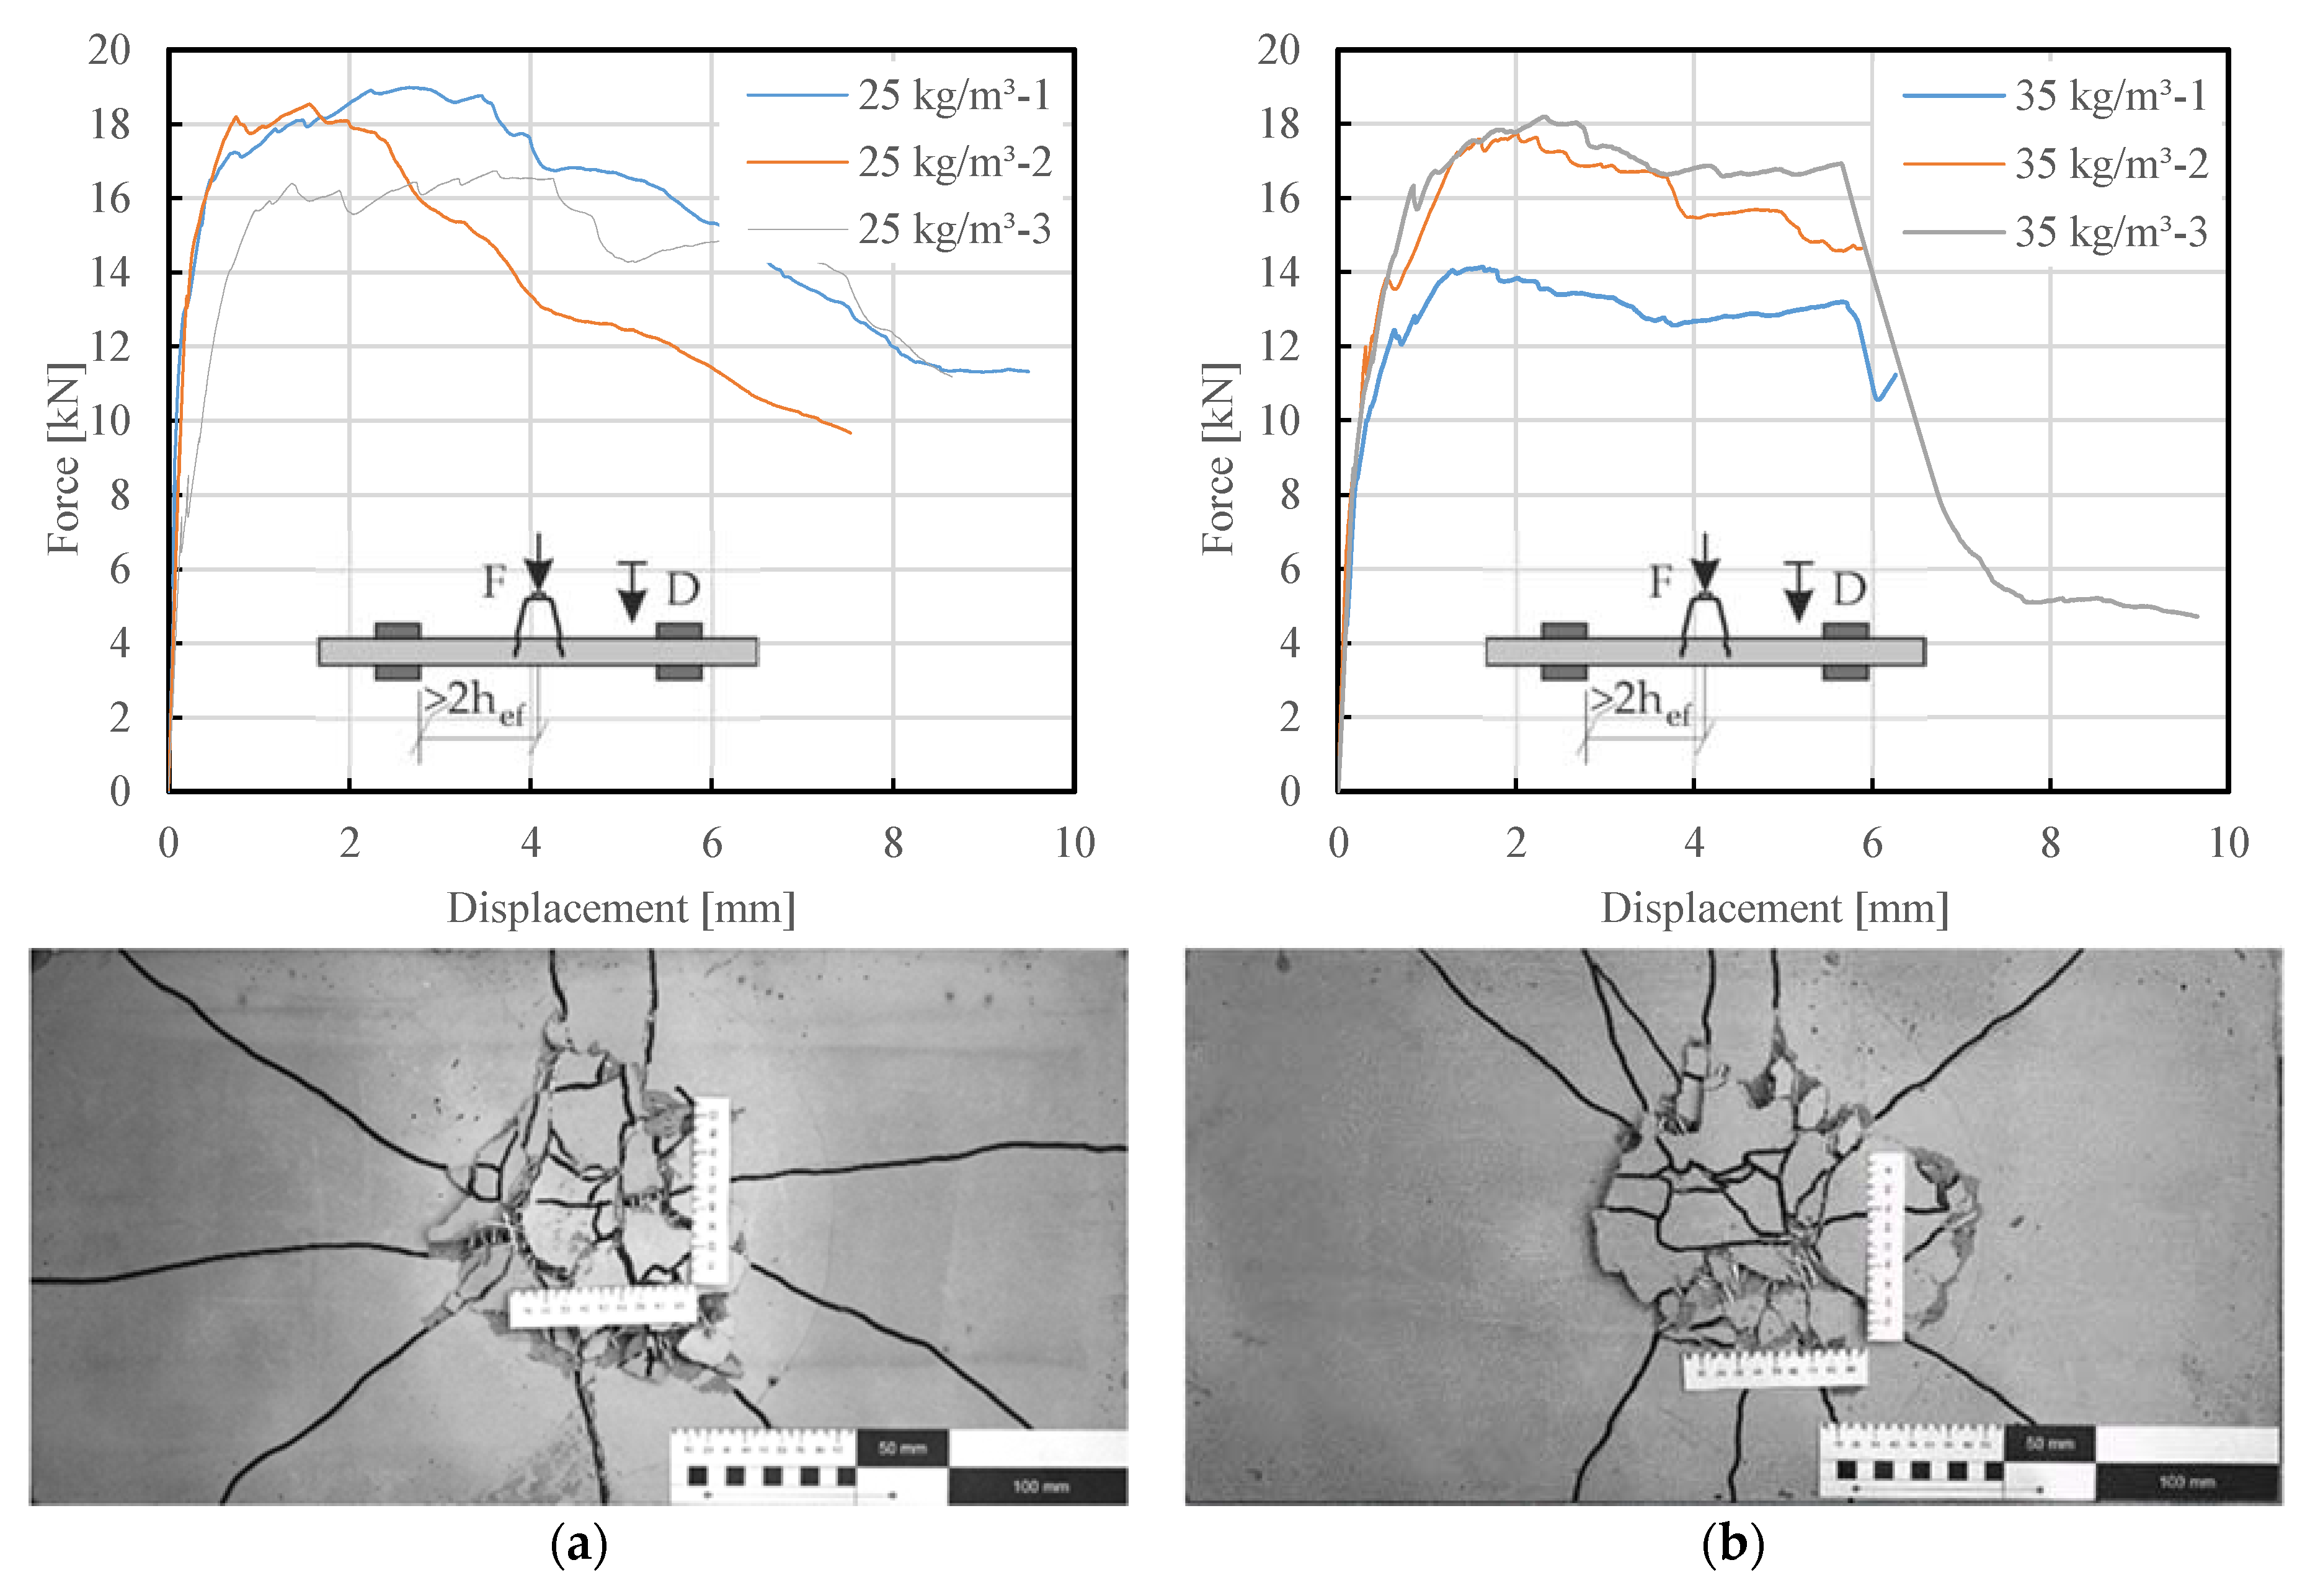
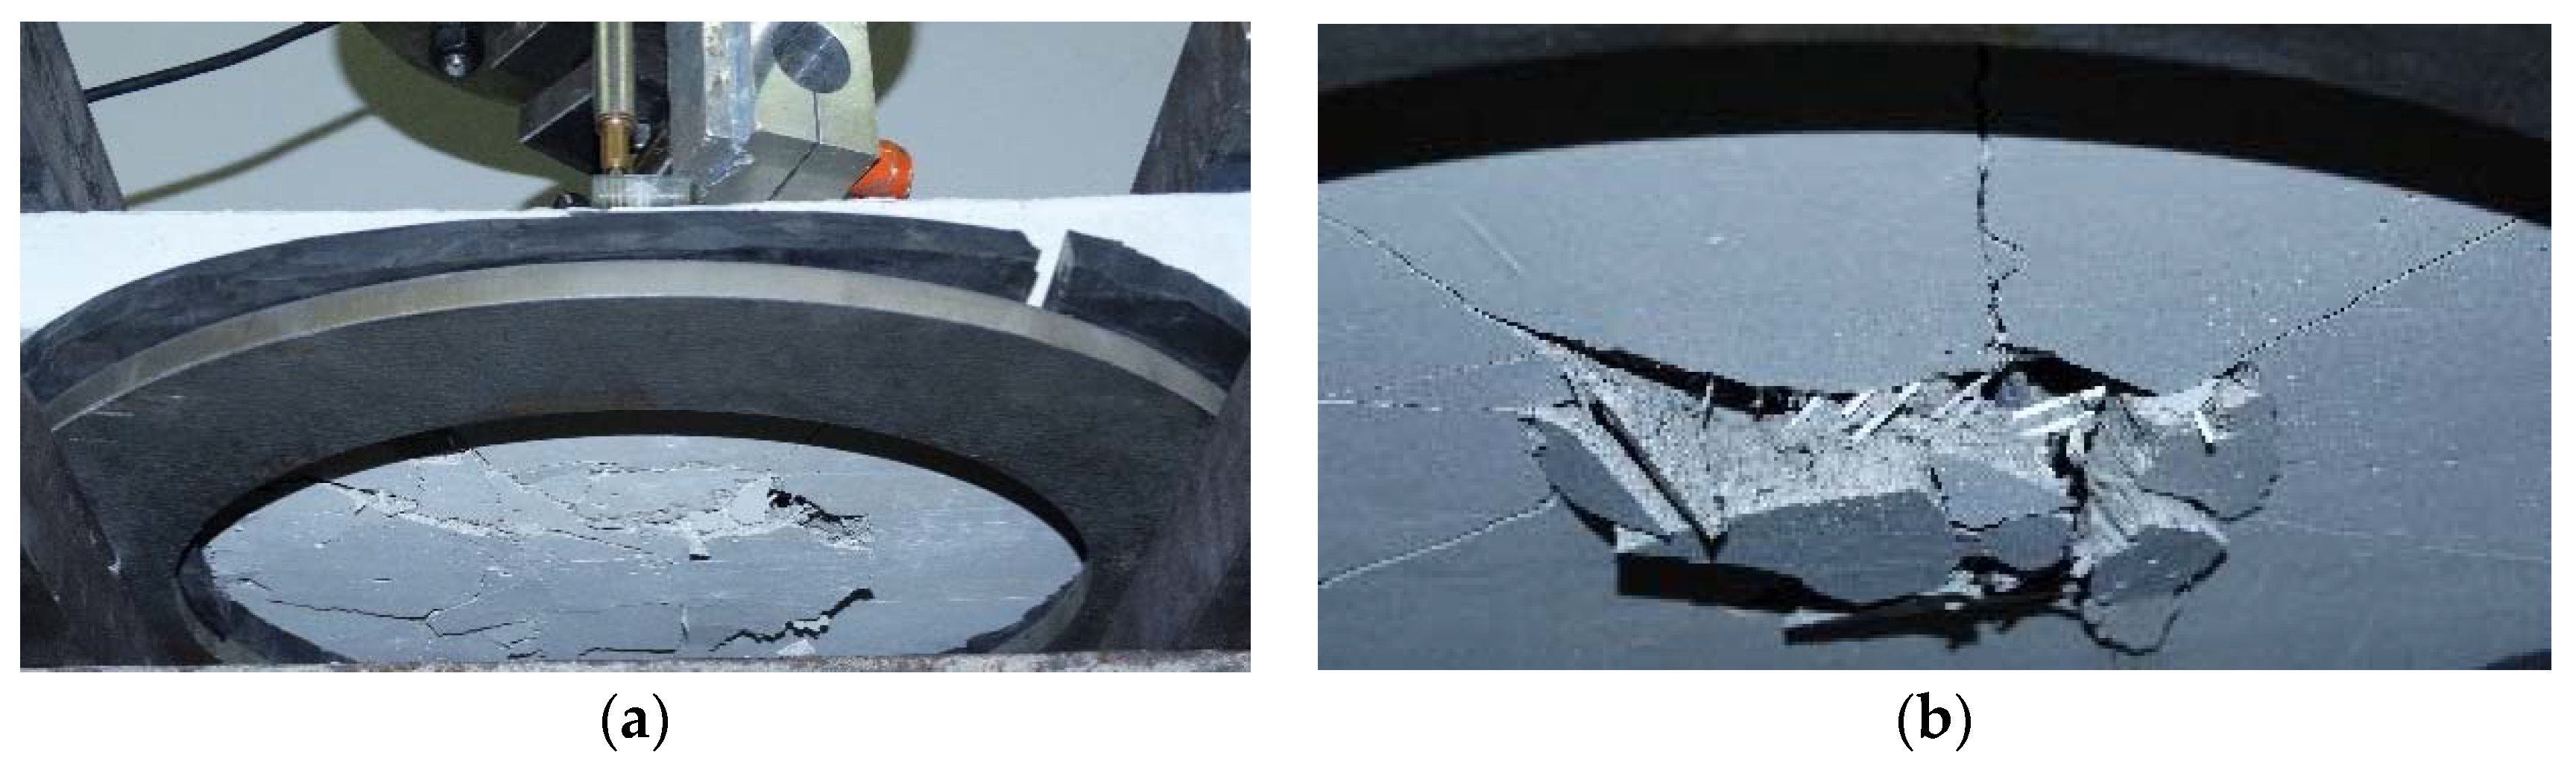
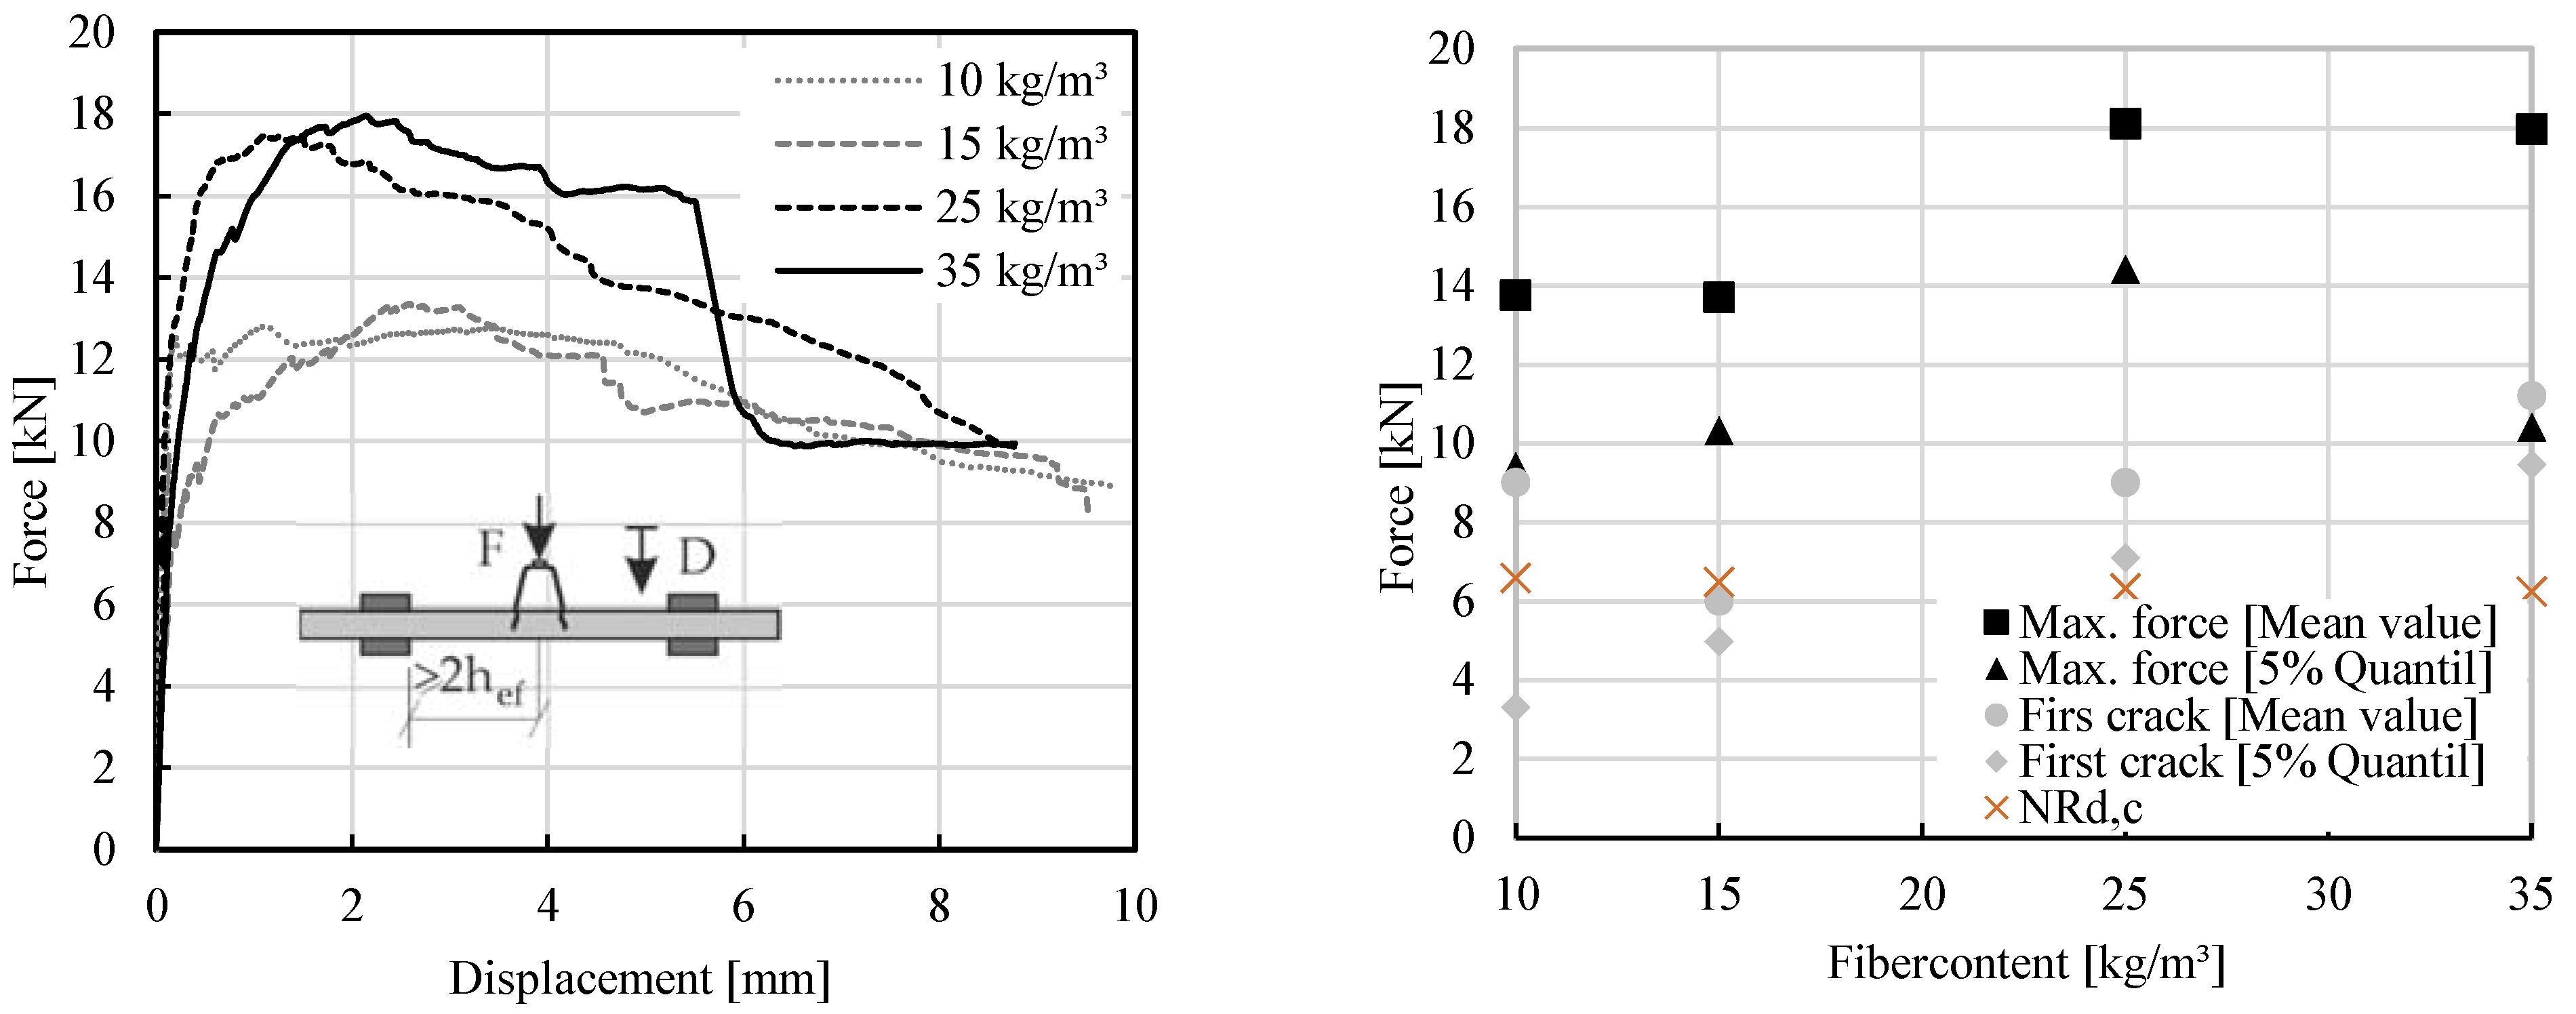
5.3. Punching Resistance of Adjustable Spacer Bolt
6. Conclusions
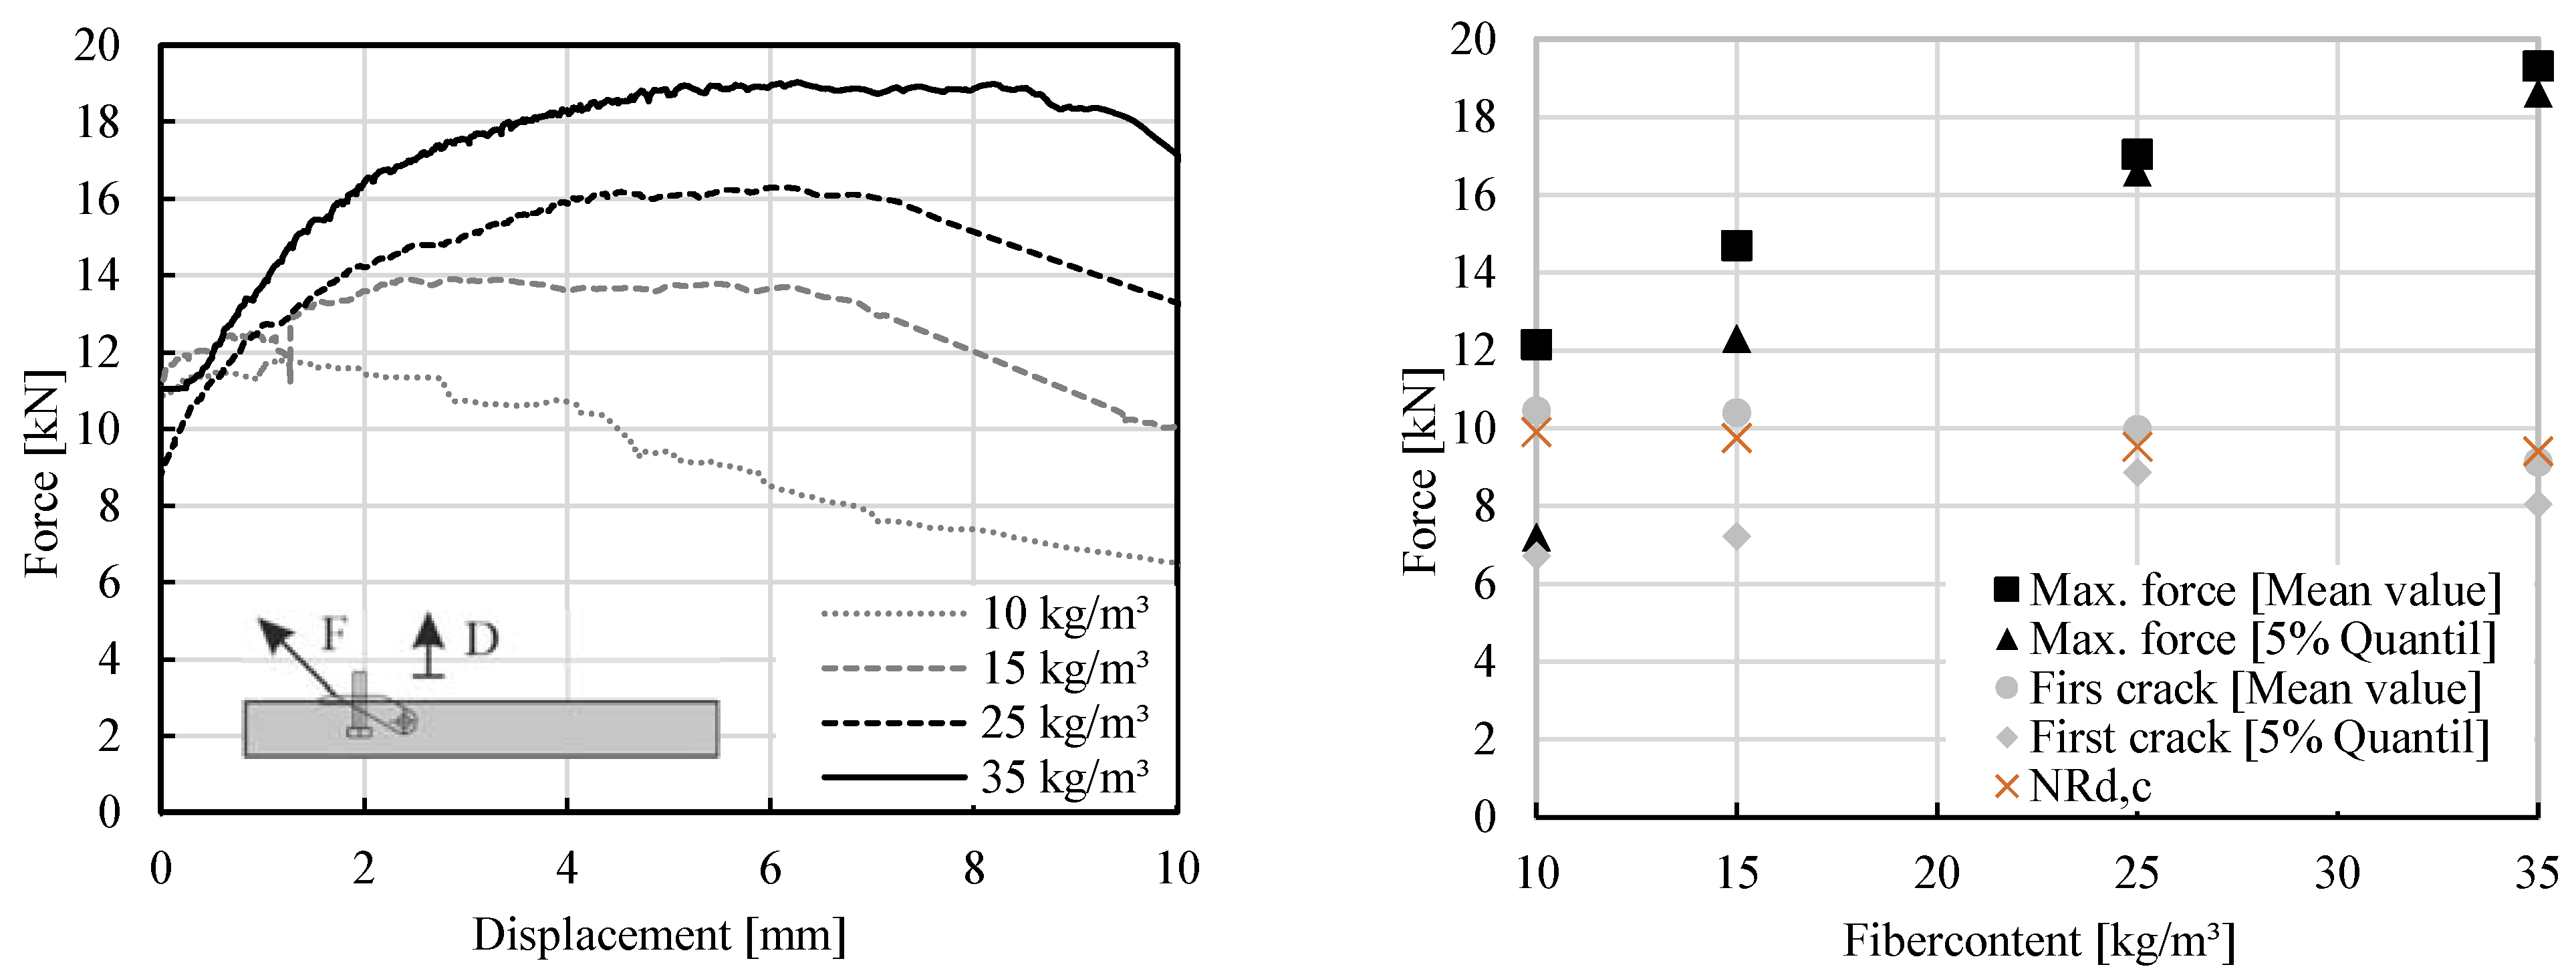
- The pull-out resistance of adjustable suspended tension-anchor is affected by different fiber dosages. The higher the fiber content, the greater the force was at the moment of the first deviation from the linearity in the linear elastic response. The force increases from 6.71 kN for 10 kg/m3 to 8.86 kN for 25 kg/m3. In general, it can be stated that fibers have a positive effect in the concrete’s post crack behaviour. It has been shown for the samples with fiber dosage 10 kg/m3 that the maximal force reaches the value of 7.20 kN and, for the samples 35 kg/m3, the value of 18.60 kN is reached.
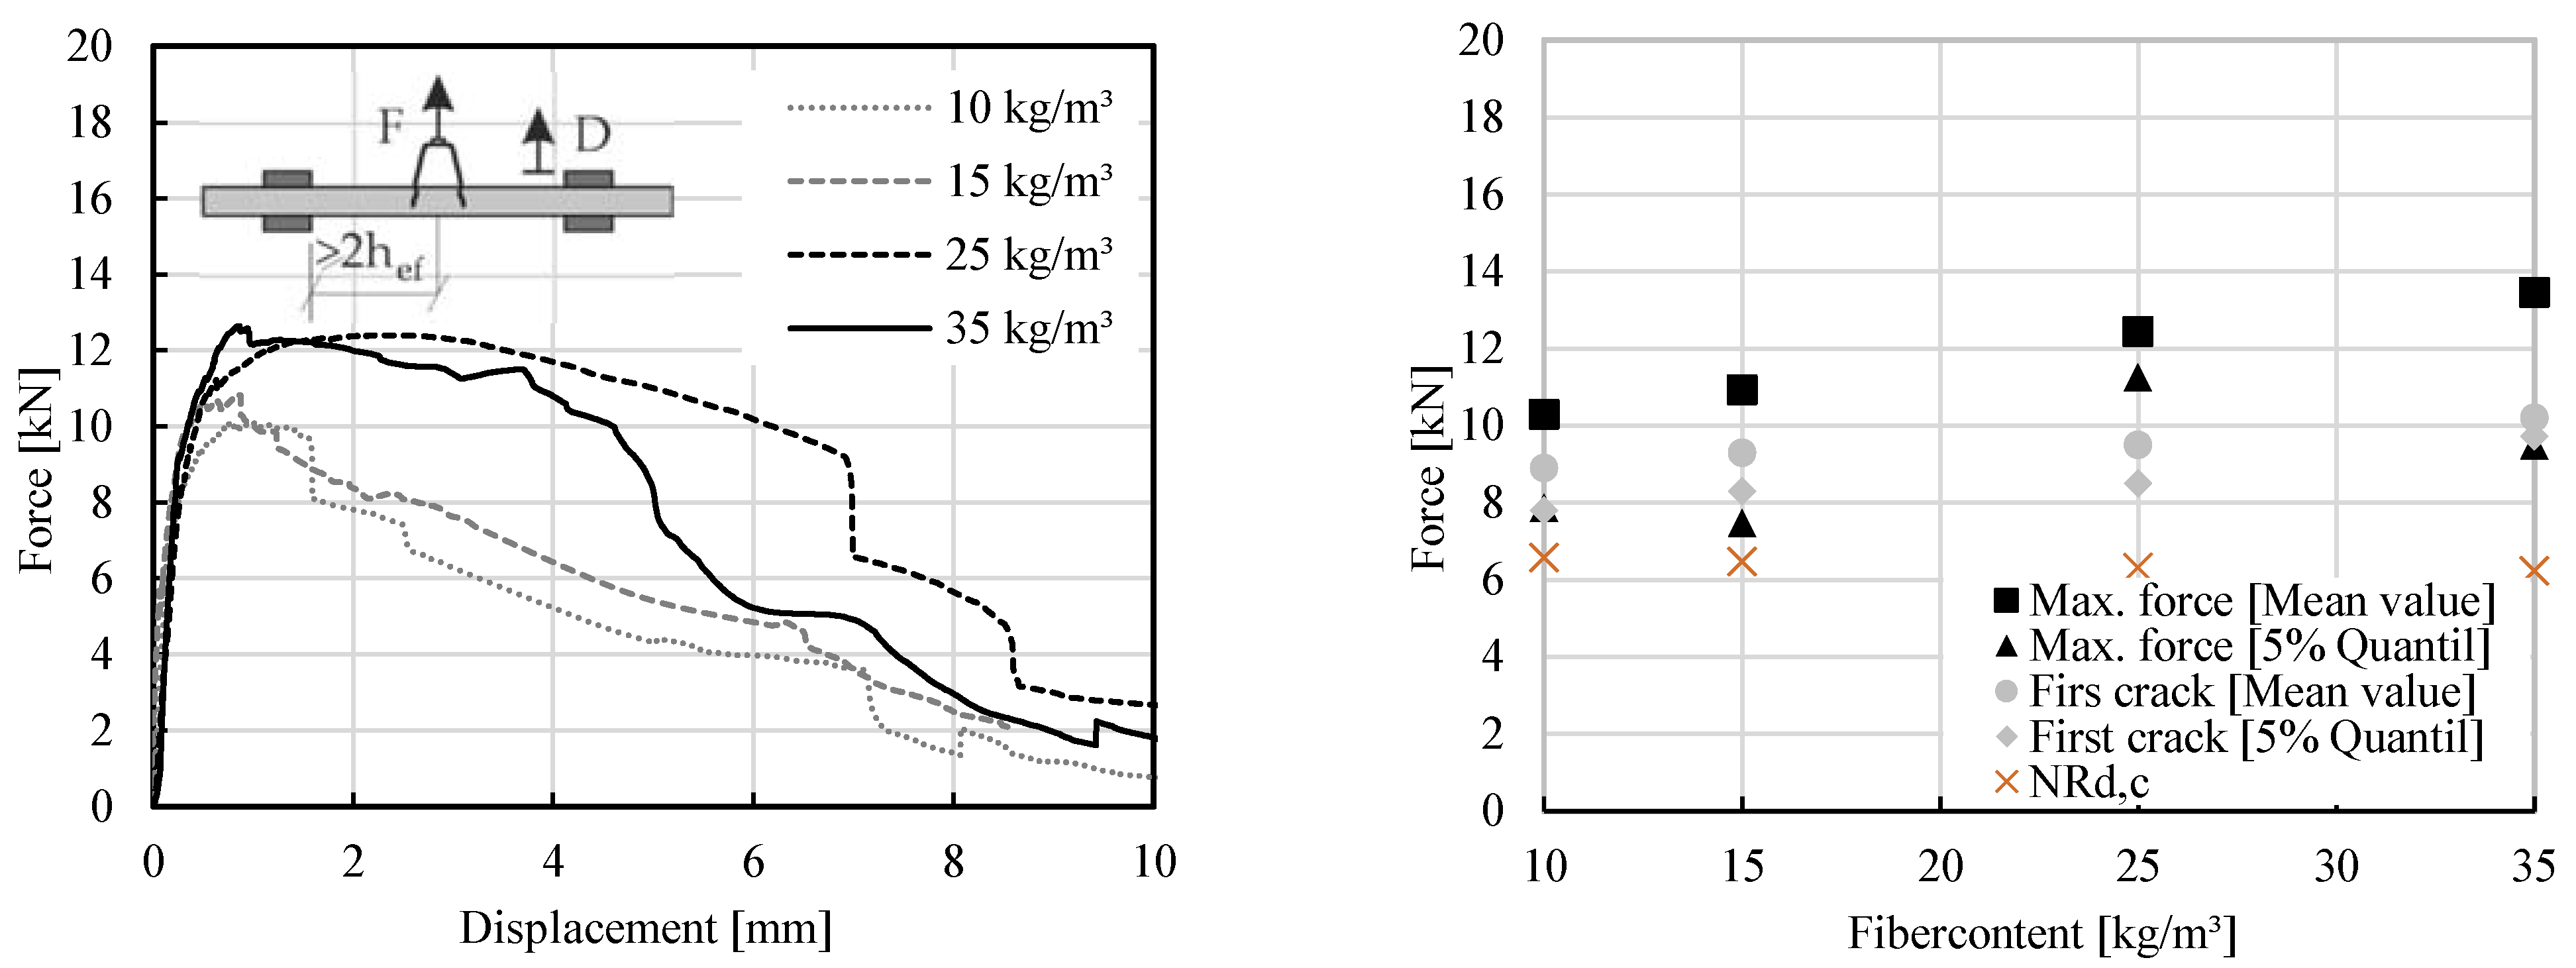
- Comparing the results of pull-out tests on adjustable spacer bolt shows an influence of the varying fiber dosage. With a fiber addition of 10 kg/m3 and 35 kg/m3, the maximum force was varied between 10.29 kN and 13.46 kN. The first higher increment of deformation in time increment varied between force 7.80 kN and 9.72 kN for fiber additions between 10 kg/m3 and 35 kg/m3. Therefore, experimental tests show that the amount of fibers does not significantly influence the post-crack behaviour of concrete in pull-out resistance of adjustable spacer bolt.
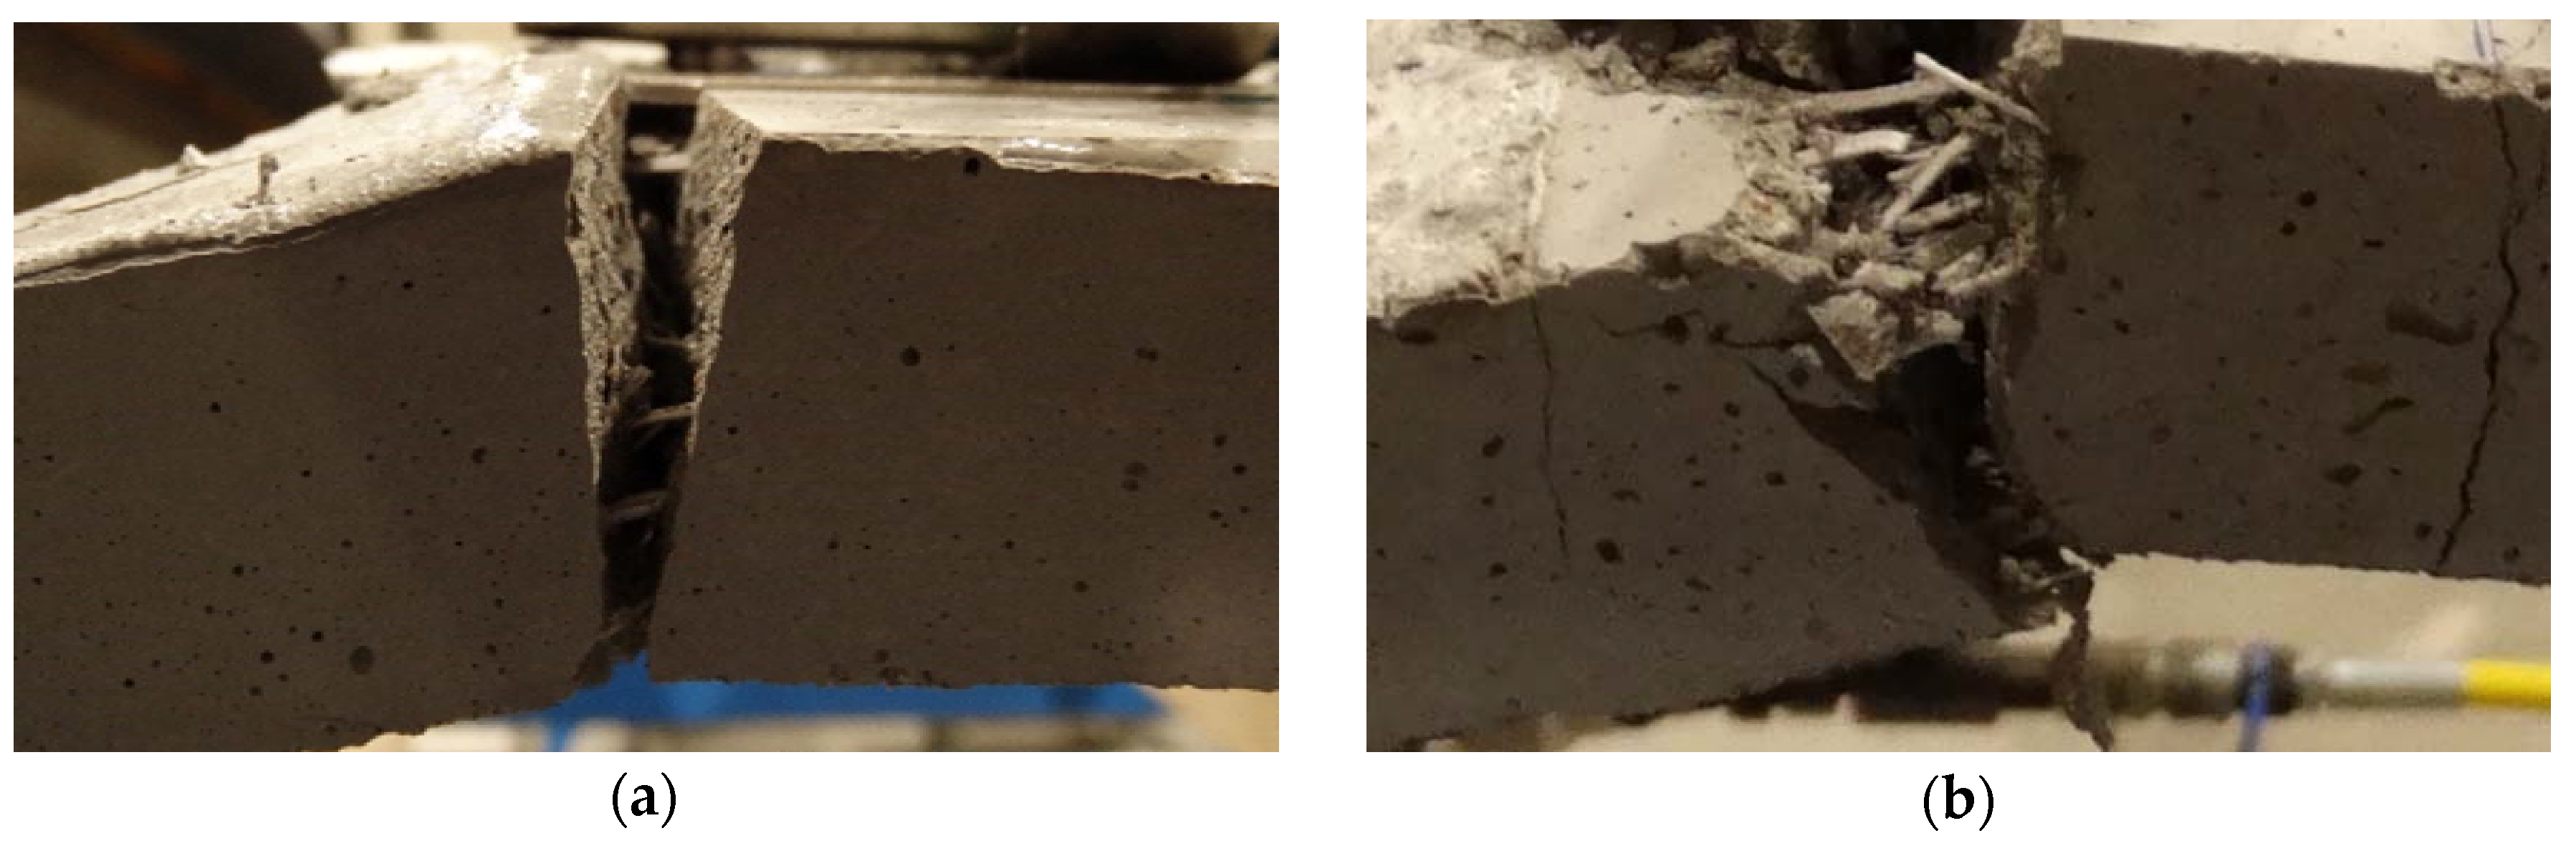
- The punching resistance of adjustable spacer bolt is strongly influenced by the fiber dosage in the concrete mix. The first deviation from the linearity in the linear elastic anchor behaviour for the fiber addition of 35 kg/m3 is equal to force 9.44 kN and is greater than force 3.30 kN for the specimen with a fiber addition of 10 kg/m3. The correlation of the force-displacement curves shows that with a fiber addition of 25 kg/m3 and 35 kg/m3, the results are similar. The maximal force is 18.09 kN and 17.96 kN, respectively. Differences in punching resistance can also be seen in the magnitude of cone failure. With a fiber content of 35 kg/m3, the fractured part of the concrete is formed in a larger specimen area than with a fiber content of 15 kg/m3. Due to the higher fiber dosage, larger volumes of concrete are integrated and the diameter of concrete cone around the anchor increases.
Author Contributions
Funding
Institutional Review Board Statement
Informed Consent Statement
Data Availability Statement
Acknowledgments
Conflicts of Interest
References
- Herr, C.M.; Lombardi, D.; Galobardes, I. Parametric design of sculptural fibre reinforced concrete facade components. In Proceedings of the 23rd International Conference of the Association for Computer-Aided Architectural Design Research in Asia, Beijing, China, 17–19 May 2018. [Google Scholar]
- Hegger, J.; Zell, M.; Horstmann, M. Textile Reinforced Concrete—Realization in applications. In Proceedings of the International FIB Symposium Tailor Made Concrete Structures: New Solutions for Our Society, Amsterdam, The Netherlands, 19–21 May 2008. [Google Scholar]
- Harenberg, S.; Pahn, M.; Malárics-Pfaff, V.; Dehn, F.; Caggiano, A.; Schicchi, D.; Yang, S.; Koenders, E. Digital image correlation strain measurement of ultra-high-performance concrete-prisms under static and cyclic bending tensile stress. Struct. Concr. 2019, 20, 1220–1230. [Google Scholar] [CrossRef] [Green Version]
- Aguilar, G.; Villamizar, S.; Ramirez, J. Evaluation of Shear Reinforcement Design Limits in High-Strength Concrete Beams. ACI Struct. J. 2018, 115, 401–414. [Google Scholar] [CrossRef]
- Schultz-Cornelius, M. Konzept zur Bemessung von Unbewehrten Fassadenplatten aus Ultrahochleistungsbeton in Mehrschichtigen Stahlbetonwandtafeln. Ph.D. Thesis, Technische Universität Kaiserslautern, Kaiserslautern, Germany, 2020. [Google Scholar]
- Schultz-Cornelius, M.; Pahn, M. GFRP Reinforcement and Anchorage Concepts for GFRP Reinforcement and Anchorage Concepts for filigree Energy-Efficient Façades made of UHPC. In Proceedings of the PowerSkin Conference, München, Germany, 19 January 2017. [Google Scholar]
- Chorzepa, M.G.; Masud, M.; Yaghoobi, A.; Jiang, H. Impact Test: Multiscale Fiber-Reinforced Concrete Including Polypropylene and Steel Fibers. ACI Struct. J. 2017, 114, 1429–1444. [Google Scholar] [CrossRef]
- Al-Taan, S.A.; Al-Jaffal, A. Tensile Capacity of Short Headed Anchor Bolts Embedded in High Strength Fibrous Concrete. Int. J. Appl. Eng. Res. 2011, 6, 235–247. [Google Scholar] [CrossRef]
- Afroughsabet, V.; Biolzi, L.; Ozbakkaloglu, T. High-performance fiber-reinforced concrete: A review. J. Mater. Sci. 2016, 51, 6517–6551. [Google Scholar] [CrossRef] [Green Version]
- Pahn, M. Beitrag zur Ermittlung von Schnitt- und Verformungsgrößen bei Mehrschichtigen Stahlbetonwandtafeln mit Verbindungsmitteln aus Glasfaserverstärktem Kunststoff. Ph.D. Thesis, Technische Universität Kaiserslautern, Kaiserslautern, Germany, 2011. [Google Scholar]
- Deutscher Ausschuss für Stahlbeton—DAfStb. Steel Fiber Reinforced Concrete (Version 614); Beuth Verlag: Berlin, Germany, 2010. [Google Scholar]
- Fib Model Code for Concrete Structures. 2010. Available online: https://www.fib-international.org/publications/model-codes.html (accessed on 7 July 2021).
- Brühwiler, E. Swiss Standard SIA 2052 UHPFRC: Materials, Design and Application. In Proceedings of the 4th International Symposium on Ultra-High Performance Concrete and High Performance Materials, Kassel, Germany, 9–11 March 2016. [Google Scholar]
- Association Francaise de Genie Civil. Bétons Fibrés á Ultra-Hautes Performances; AFGC: Paris, France, 2013. [Google Scholar]
- Hadi, M.N.S.; Balanji, E.K.; Sheikh, M.N. Behavior of steel Fiber-Reinforced High-Strength Concrete Columns under Different Loads. ACI Struct. J. 2017, 114. [Google Scholar] [CrossRef]
- Simõesa, T.; Costaa, H.; Dias-da-Costad, D.; Júlio, E. Influence of fibres on the mechanical behaviour of fibre reinforced concrete matrixes. Constr. Build. 2017, 137, 548–556. [Google Scholar] [CrossRef] [Green Version]
- Baby, F.; Marchand, P.; Toutlemonde, F. Analytical Modeling of Ultra-High-Performance Fiber-Reinforced Concrete Behavior in Ribbed Plates. ACI Struct. J. 2017, 114. [Google Scholar] [CrossRef]
- Carstens, S.; Pahn, M. Auszugtragfähigkeit von GFK-Sandwichankern in gerissenem Normalbeton. BWI—BetonWerk Int. 2019, 4, 2–9. [Google Scholar]
- HALFEN FPA-SL30 SYSTEM. Zulassung Z-21.8-2067. Available online: https://downloads.halfen.com/catalogues/de/media/approvals/precastsystems/Z_FPA-SL30_Leviat_12-18.pdf (accessed on 7 July 2021).
- Klug, Y.; Holschemacher, K.; Wittmann, F. Tragverhalten von Befestigungselementen in Stahlfaserbeton. In Faserbeton; König, G., Holschemacher, K., Dehn, K., Eds.; Bauwerk Verlag: Berlin, Germany, 2002; pp. 89–106. [Google Scholar]
- Kurz, C.; Thiele, C.; Schnell, J.; Reuter, M.; Vitt, G. (Eds.) Tragverhalten von Dübeln in Stahlfaserbeton. In Bautechnik; Ernst & Sohn: Berlin, Germany, 2012. [Google Scholar]
- Ivorra, S.; García-Barba, J.; Mateo, M.; Pérez-Carramiñana, C.; Maciá, A. Partial collapse of a ventilated stone façade: Diagnosis and analysis of the anchorage system. Eng. Fail. Anal. 2013, 31, 290–301. [Google Scholar] [CrossRef]
- Poveda, E.; Ortega, J.J.; Ruiz, G.; Porras, R.; Carmona, J.R. Normal and tangential extraction of embedded anchor plates from precast façade concrete panels. Eng. Struct. 2015, 110, 21–35. [Google Scholar] [CrossRef]
- Dizhur, D.; Ingham, J.M.; Campbell, J.; Schultz, A. Experimental Pull-Out Test Program of Wall-to-Diaphragm Adhesive Connections and Observations from 2010/2011 Canterbury Earthquakes. In Proceedings of the 2013 NZSEE Conference, Wellington, New Zealand, 26–28 April 2013. [Google Scholar]
- Tóth, M.; Bokor, B.; Sharma, A. Anchorage in steel fiber reinforced concrete—concept, experimental evidence and design recommendations for concrete cone and concrete edge breakout failure modes. Eng. Struct. 2019, 181, 60–75. [Google Scholar] [CrossRef]
- Bokor, B.; Tóth, M.; Sharma, A. Fasteners in Steel Fiber Reinforced Concrete Subjected to Increased Loading Rates. Fibers 2018, 6, 93. [Google Scholar] [CrossRef] [Green Version]
- Mahrenholtz, C.; Ayoubi, M.; Müller, S.; Bachschmid, S. Tension and shear performance of anchor channels with channel bolts cast in Fibre Reinforced Concrete (FRC). In Proceedings of the 7th International Conference on Euro Asia Civil Engineering Forum, Stuttgart, Germany, 30 September–2 October 2019. [Google Scholar]
- Sofi, A. Mechanical properties of concrete containing polypropylene fibre and silica fume. Int. J. Civ. Eng. Technol. (IJCIET) 2017, 8, 143–151. [Google Scholar]
- Kaiser, W. Kunststoffchemie für Ingenieure: Von der Synthese bis zur Anwendung, 4th ed.; Hanser: München, Germany, 2016. [Google Scholar]
- Ehrenstein, G. Polymer Werkstoffe: Struktur-Eigenschaften-Anwendung, 3rd ed.; Hanser: München, Germany, 2011. [Google Scholar]
- Frick, A.; Stern, C. Einführung in die Kunststoffprüfung: Prüfmethoden und Anwendungen; Hanser: München, Germany, 2017. [Google Scholar]
- Master Builder Solutions. MasterFiber 235 SPA Data Sheet: The High-Performance Polypropylene Fiber, Class II EN 14889-2; Master Builder Solutions: Staßfurt, Germany, 2019. [Google Scholar]
- Reinhardt, H.-W. Ingenieurbaustoffe, 2nd ed.; Wiley-VCH: Weinheim, Germany, 2012; ISBN 978-3-433-02920-6. [Google Scholar]
- Maier, C.; Calafut, T. Polypropylene: The Definitive User’s Guide and Databook; William Andrew: Norwich, NY, USA, 1998. [Google Scholar]
- Tripathi, D. Practical Guide to Polypropylene; Rapra Technology Ltd.: Shrewsbury, UK, 2002; pp. 1–8. [Google Scholar]
- Juhasz, P.K.; Schaul, P. Design of Industrial Floors—TR34 and Finite Element Analysis (Part 2). J. Civ. Eng. Archit. 2019, 13, 512–522. [Google Scholar] [CrossRef]
- Boita, I.E.; Dan, D.; Stoian, V. Seismic Behaviour of Composite Steel Fibre Reinforced Concrete Shear Walls. Mater. Sci. Eng. 2017, 245, 022006. [Google Scholar] [CrossRef]
- British Standards Institution. Tests for Geometrical Properties of Aggregates—Part 1: Determination of Particle Size Distribution—Sieving Method, EN 933-1; Beuth Verlag: Berlin, Germany, 2012. [Google Scholar]
- Gökçe, H.S.; Andiç-Çakır, Ö. Bleeding characteristics of high consistency heavyweight concrete mixtures. Constr. Build. Mater. 2019, 194, 153–160. [Google Scholar] [CrossRef]
- British Standards Institution. EN 12390-1: Testing Hardened Concrete–Part 1: Shape, Dimensions and Other Requirements for Speci-Mens and Moulds; Beuth Verlag: Berlin, Germany, 2019. [Google Scholar]
- Aslani, F.; Hou, L.; Nejadi, S.; Sun, J.; Abbasi, S. Experimental analysis of fiber-reinforcement recycled aggregate self-compacting concrete using waste recycled concrete aggregates. Struct. Concr. 2019, 20, 1670–1683. [Google Scholar] [CrossRef]
- Meesala, C.R. Influence of different types of fibreon the properties of recycled aggregate concrete. Struct. Concr. 2019, 20, 1656–1669. [Google Scholar] [CrossRef]
- Zhang, R.; Jin, L.; Tian, Y.; Dou, G.; Du, X. Static and dynamic mechanical properties of eco-friendly polyvinyl alcohol fiber-reinforced ultra-high-strength concrete. Struct. Concr. 2019, 20, 1051–1063. [Google Scholar] [CrossRef]
- Richardson, A.E. Compressive strength of concrete with polypropylene fibre additions. Struct. Surv. 2006, 24, 138–153. [Google Scholar] [CrossRef]
- EOTA (European Organization for Technical Approvals). Guideline for European Technical Approval of Metal Anchors for Use in Concrete; EOTA: Brussels, Belgium, 2008. [Google Scholar]
- Chopin, D.; de Larrard, F.; Cazacliu, B. Why do HPC and SCC require a longer mixing time? Cem. Concr. Res. 2004, 34, 2237–2243. [Google Scholar] [CrossRef]
- British Standards Institution. EN 14651:2005+A1:2007: Test Method for Metallic Fiber Concrete-Measuring the Flexural Tensile Strength (Limit or Proportionality (LOP), Residual); Beuth Verlag: Berlin, Germany, 2007. [Google Scholar]
- European Committee for Standardization. Eurocode: Basis of Structural Design; GERMAN Version EN 1990:2002 + A1:2005 + A1:2005/AC:2010; Beuth Verlag: Berlin, Germany, 2010. [Google Scholar]
- Deutsches Institut für Normung. DIN EN 1992-4.: Eurocode 2-Design of Concrete Structures-Part 4: Design of Fastenings for Use in Concrete; Beuth Verlag: Berlin, Germany, 2019. [Google Scholar]
- Cattaneo, S.; Muciaccia, G. Adhesive anchors in high performance concrete. Mater. Struct. 2016, 49, 2689–2700. [Google Scholar] [CrossRef]
- Farhan, N.; Sheikh, M.N.; Hadi, M.N.S. Experimental Investigation on the Effect of Corrosion on the Bond Between Reinforcing Steel Bars and Fibre Reinforced Geopolymer Concrete. Structures 2018, 14, 251–261. [Google Scholar] [CrossRef]
- Nilforoush, R.; Nilsson, M.; Elfgren, L. Experimental evaluation of tensile behaviour of single cast-in-place anchor bolts in plain and steel fibre-reinforced normal- and high-strength concrete. Engineering 2017, 147, 195–206. [Google Scholar] [CrossRef]


| Series | Anchor and Tests | hef (mm) | Fiber Dosage (kg/m3) | Number of Specimens |
|---|---|---|---|---|
| 1 | Tension anchor (pull-out resistance tests) | 26 | 10 | 3 |
| 15 | 3 | |||
| 25 | 3 | |||
| 35 | 3 | |||
| 2 | Adjustable spacer bolt (pull-out resistance tests) | 25 | 10 | 3 |
| 15 | 3 | |||
| 25 | 3 | |||
| 35 | 3 | |||
| 3 | Adjustable spacer bolt (punching resistance tests) | 25 | 10 | 3 |
| 15 | 3 | |||
| 25 | 3 | |||
| 35 | 3 |
| Type of Fiber | Tensile Strength | Modulus of Elasticity | Diameter | Length | Specific Gravity |
|---|---|---|---|---|---|
| (MPa) | (MPa) | (mm) | (mm) | (kg/m3) | |
| MasterFiber® 235 (PP) | 500 | >8000 | 0.70 | 30 | 910 |
| Mix ID | Fiber Dosages | Max. Force (st. dev) | First Crack (st. dev) | ||
|---|---|---|---|---|---|
| (kN) | [kN] | ||||
| Mean Value | 5% Quantil | Mean Value | 5% Quantil | ||
| 1 | 10 kg/m3 | 12.14 | 7.20 (0.15) | 10.44 | 6.71 (0.13) |
| 2 | 15 kg/m3 | 14.69 | 12.31 (0.05) | 10.39 | 7.21 (0.11) |
| 3 | 25 kg/m3 | 17.02 | 16.57 (0.01) | 9.96 | 8.86 (0.03) |
| 4 | 35 kg/m3 | 19.29 | 18.60 (0.01) | 9.11 | 8.03 (0.04) |
| Mix ID | Fiber Dosages | Max. Force (st. dev) | First Crack (st. dev) | ||
|---|---|---|---|---|---|
| (kN) | (kN) | ||||
| Mean Value | 5% Quantil | Mean Value | 5% Quantil | ||
| 1 | 10 kg/m3 | 10.29 | 7.86 (0.08) | 8.90 | 7.80 (0.04) |
| 2 | 15 kg/m3 | 10.93 | 7.47 (0.11) | 9.30 | 8.29 (0.03) |
| 3 | 25 kg/m3 | 12.44 | 11.25 (0.03) | 9.50 | 8.50 (0.03) |
| 4 | 35 kg/m3 | 13.46 | 9.49 (0.10) | 10.20 | 9.72 (0.01) |
| Mix ID | Fiber Dosages | Max. Force (st. dev) | First Crack (st. dev) | ||
|---|---|---|---|---|---|
| (kN) | (kN) | ||||
| Mean Value | 5% Quantil | Mean Value | 5% Quantil | ||
| 1 | 10 kg/m3 | 13.74 | 9.40 (0.09) | 9.00 | 3.30 (0.30) |
| 2 | 15 kg/m3 | 13.70 | 10.30 (0.08) | 6.00 | 4.96 (0.07) |
| 3 | 25 kg/m3 | 18.09 | 14.40 (0.07) | 9.00 | 7.09 (0.07) |
| 4 | 35 kg/m3 | 17.96 | 10.40 (0.14) | 11.20 | 9.44 (0.05) |
Publisher’s Note: MDPI stays neutral with regard to jurisdictional claims in published maps and institutional affiliations. |
© 2021 by the authors. Licensee MDPI, Basel, Switzerland. This article is an open access article distributed under the terms and conditions of the Creative Commons Attribution (CC BY) license (https://creativecommons.org/licenses/by/4.0/).
Share and Cite
Grzesiak, S.; Pahn, M.; Schultz-Cornelius, M.; Bies, N.S. Influence of Different Fiber Dosages on the Behaviour of Façade Anchors in High-Performance Concrete. CivilEng 2021, 2, 556-579. https://0-doi-org.brum.beds.ac.uk/10.3390/civileng2030031
Grzesiak S, Pahn M, Schultz-Cornelius M, Bies NS. Influence of Different Fiber Dosages on the Behaviour of Façade Anchors in High-Performance Concrete. CivilEng. 2021; 2(3):556-579. https://0-doi-org.brum.beds.ac.uk/10.3390/civileng2030031
Chicago/Turabian StyleGrzesiak, Szymon, Matthias Pahn, Milan Schultz-Cornelius, and Nora Susanne Bies. 2021. "Influence of Different Fiber Dosages on the Behaviour of Façade Anchors in High-Performance Concrete" CivilEng 2, no. 3: 556-579. https://0-doi-org.brum.beds.ac.uk/10.3390/civileng2030031