
A Review of Seven Tunnel Face Stability Models


Department of Civil and Environmental Engineering, Universitätsstr. 150, 44780 Bochum, Germany
*
Author to whom correspondence should be addressed.
CivilEng 2022, 3(1), 116-134; https://0-doi-org.brum.beds.ac.uk/10.3390/civileng3010008
Submission received: 10 December 2021
/
Revised: 1 February 2022
/
Accepted: 5 February 2022
/
Published: 10 February 2022
(This article belongs to the Special Issue Early Career Stars in Civil Engineering)
Abstract
:This paper presents a review of selected tunnel stability models that have been developed and used in calculating the minimum tunnel face pressure as described by original authors. Furthermore, this paper provides a comparison of required tunnel face pressure obtained from analytical models, based either on limit equilibrium method or the limit analysis method (upper bound theorem) and numerical models using the finite element method. The numerical results are presented in charts for the comparative study to discuss the influence of cover depth to tunnel diameter ratio (C/D), internal friction of the soil (), and cohesion (c) on normalized support pressure () for each model. To verify the accuracy of the selected models, a comparison of the results of seven tunnel stability models with the results of the physical models is carried out. In a ground composed of two layers, a comparison of the required tunnel face pressure is presented. The results show that the wedge–silo models provide higher support pressure than the conical block models. Moreover, the support pressure using the conical block models is only dependent on the friction angle and not on the C/D ratio. Finally, the results of wedge-silo models indicate more significant dependence of the required support pressure on the C/D ratio especially for the lower friction angle.
1. Introduction
During excavation and construction of a tunnel, the stress history of in situ soil surrounding the excavation area is disturbed. Thereafter, a new stress redistribution is induced in the vicinity of the tunnel face due to deformation of the soil mass. The mechanism that leads to this stress redistribution is the so-called arching phenomena (Terzaghi [1]). This mechanism yields a reduction of vertical stress. The arching soil effect has been reported by Terzaghi [2] in trap door experiments and also by Chambon and Corte [3] and Chen et al. [4] conducting a series of physical model tests to investigate the stability of tunnel face.
For preventing the collapse of the tunnel face during the excavation process, adequate support pressure (e.g., compressed air, slurry, or earth pressure support) at the tunnel face is required. Meanwhile, the soil arching effect is associated with a decrease in the required support pressure. To consider the 3D arching soil effect in evaluating the required support pressure, analytical methods are commonly used. The analytical approaches can basically be divided into two groups, namely, Limit Equilibrium Method (LEM) and Limit Analysis Method (LAM). The Limit Equilibrium Method is widely used as a theoretical analysis technique for the stability of the tunnel face. On the other hand, the Limit Equilibrium Method applies the static equilibrium between the forces acting on the soil mass for the critical collapse mechanism. In order to assess the required support pressure, many types of limit equilibrium models have been setup on a 3D wedge-silo mechanism (e.g., Horn [5]; Jancsecz and Steiner [6]; Anagnostou and Kovari [7]; Broere [8]; Kirsch and Kolymbas [9]; Chen et al. [10] ), see Figure 1. However, to incorporate the contribution of the 3D soil arching effect in the calculation of required support pressure, the activation of shear forces on the silo slip surfaces, as well as consideration of shear forces acting on the flanks of the prismatic wedge, are taken into account in the static equilibrium of the forces. The main problem of equilibrium is associated with estimating the shear forces at the slip surfaces. Indeed, the value of shear forces/ stresses depends on the horizontal stresses, which cannot be calculated from equilibrium conditions (Anagnostou [11]). Thus, to overcome this statically indeterminate task, the horizontal stress () is assumed to be proportionally dependent on the vertical stress (). The ratio between the horizontal stress and the corresponding vertical stress represents what is known as the lateral earth pressure coefficient. The value of the lateral earth pressure coefficient must be assumed in advance.
Recently, the upper bound theorem of limit analysis became an effective method for studying the stability of the tunnel face. The kinematic approach of this theorem is based on constructing admissible failure mechanisms. To apply the upper bound theorem, some assumptions must be specified (Chen [12]): (1) The strain rates resulting from the velocity field must satisfy the flow rule; (2) For a kinematically admissible failure mechanism, the velocity along a plastic deformed surface must make an angle with the discontinuity velocity, which fulfils the normality rule; (3) The rate of work of the external forces is equal to the rate of internal energy dissipation. Nevertheless, due to the assumptions in the upper bound theorem, it is difficult to simulate the 3D arching phenomena at the front of the tunnel face. To overcome this difficultly in the analysis, one or more truncated conical sliding wedges is assumed to be the failure mechanism, leading to a reduction of the self weight and thereby to include the 3D soil arching effect in evaluation of the support pressure (e.g., Leca and Dormieux [13]; Mollon et al. [14]; Tang et al. [15]; Ibrahim et al. [16]; Zou et al. [17]; Li and Zhang [18]).
The application of numerical methods with advanced constitutive models has been shown to substantially improve the analysis of the tunnel face stability, using different scenarios for the 3D aspect of tunnel. Finite Element Method (FEM), Discrete Element Method (DEM) and Finite Difference Method (FDM) have proven useful tools in simulating the stability of tunnel face (e.g., Peila [19]; Ohta and Kiya [20]; Vermeer et al. [21]; Kirsch [22]). However, the simulation of the tunnel face failure, using three dimensional DEM, FEM or FDM models, is very time consuming and expensive to model.
More recently, the Kinematical Element Method (KEM) has been utilized to calculate the active pressure of the tunnel face for three-dimensional analysis (e.g., Qarmout et al. [23]; Qarmout et al. [24]).
For investigating the ground soil respond to tunneling, various physical model tests were conducted, using centrifuge model or small scale model tests (e.g., Chambon and Corte [3]; Takano et al. [25]; Kirsch [22]; Idinger et al. [26]; Lü et al. [27]). The physical models provide a beneficial information about ground surface settlement, the required face support and insight view into the 3D arching failure mechanism at the front of the tunnel face. Moreover, the results of the experimental model tests can be used to validate the numerical and analytical models.
This paper presents a review of seven tunnel face stability models that have been used to calculate the minimum support pressure, covering three different approaches, Limit Equilibrium Method (LEM), Limit Analysis Method (LAM) and Finite Element Method (FEM). Using the results for selected tunnel face stability models as described by the original authors, compression results were assembled to enable an assessment of each model. The comparative study includes the cover depth to tunnel diameter ratio (C/D), internal friction of the soil () and cohesion (c). Besides, the results given by each model are compared with the results of physical model tests available in the literature. Furthermore, in the case of a ground composed of two soil layers, a comparison of the required support pressure of these models is presented.
2. Overview of Recent Advances in Tunnel Face Stability Analysis
As mention before, a variety of modeling strategies have been introduced by researchers for simulating the stability of the tunnel face, such as analytical approaches, numerical methods, and experimental model tests. The research activities for each method will be briefly summarized in the following subsections.
Limit Equilibrium Method (LEM)
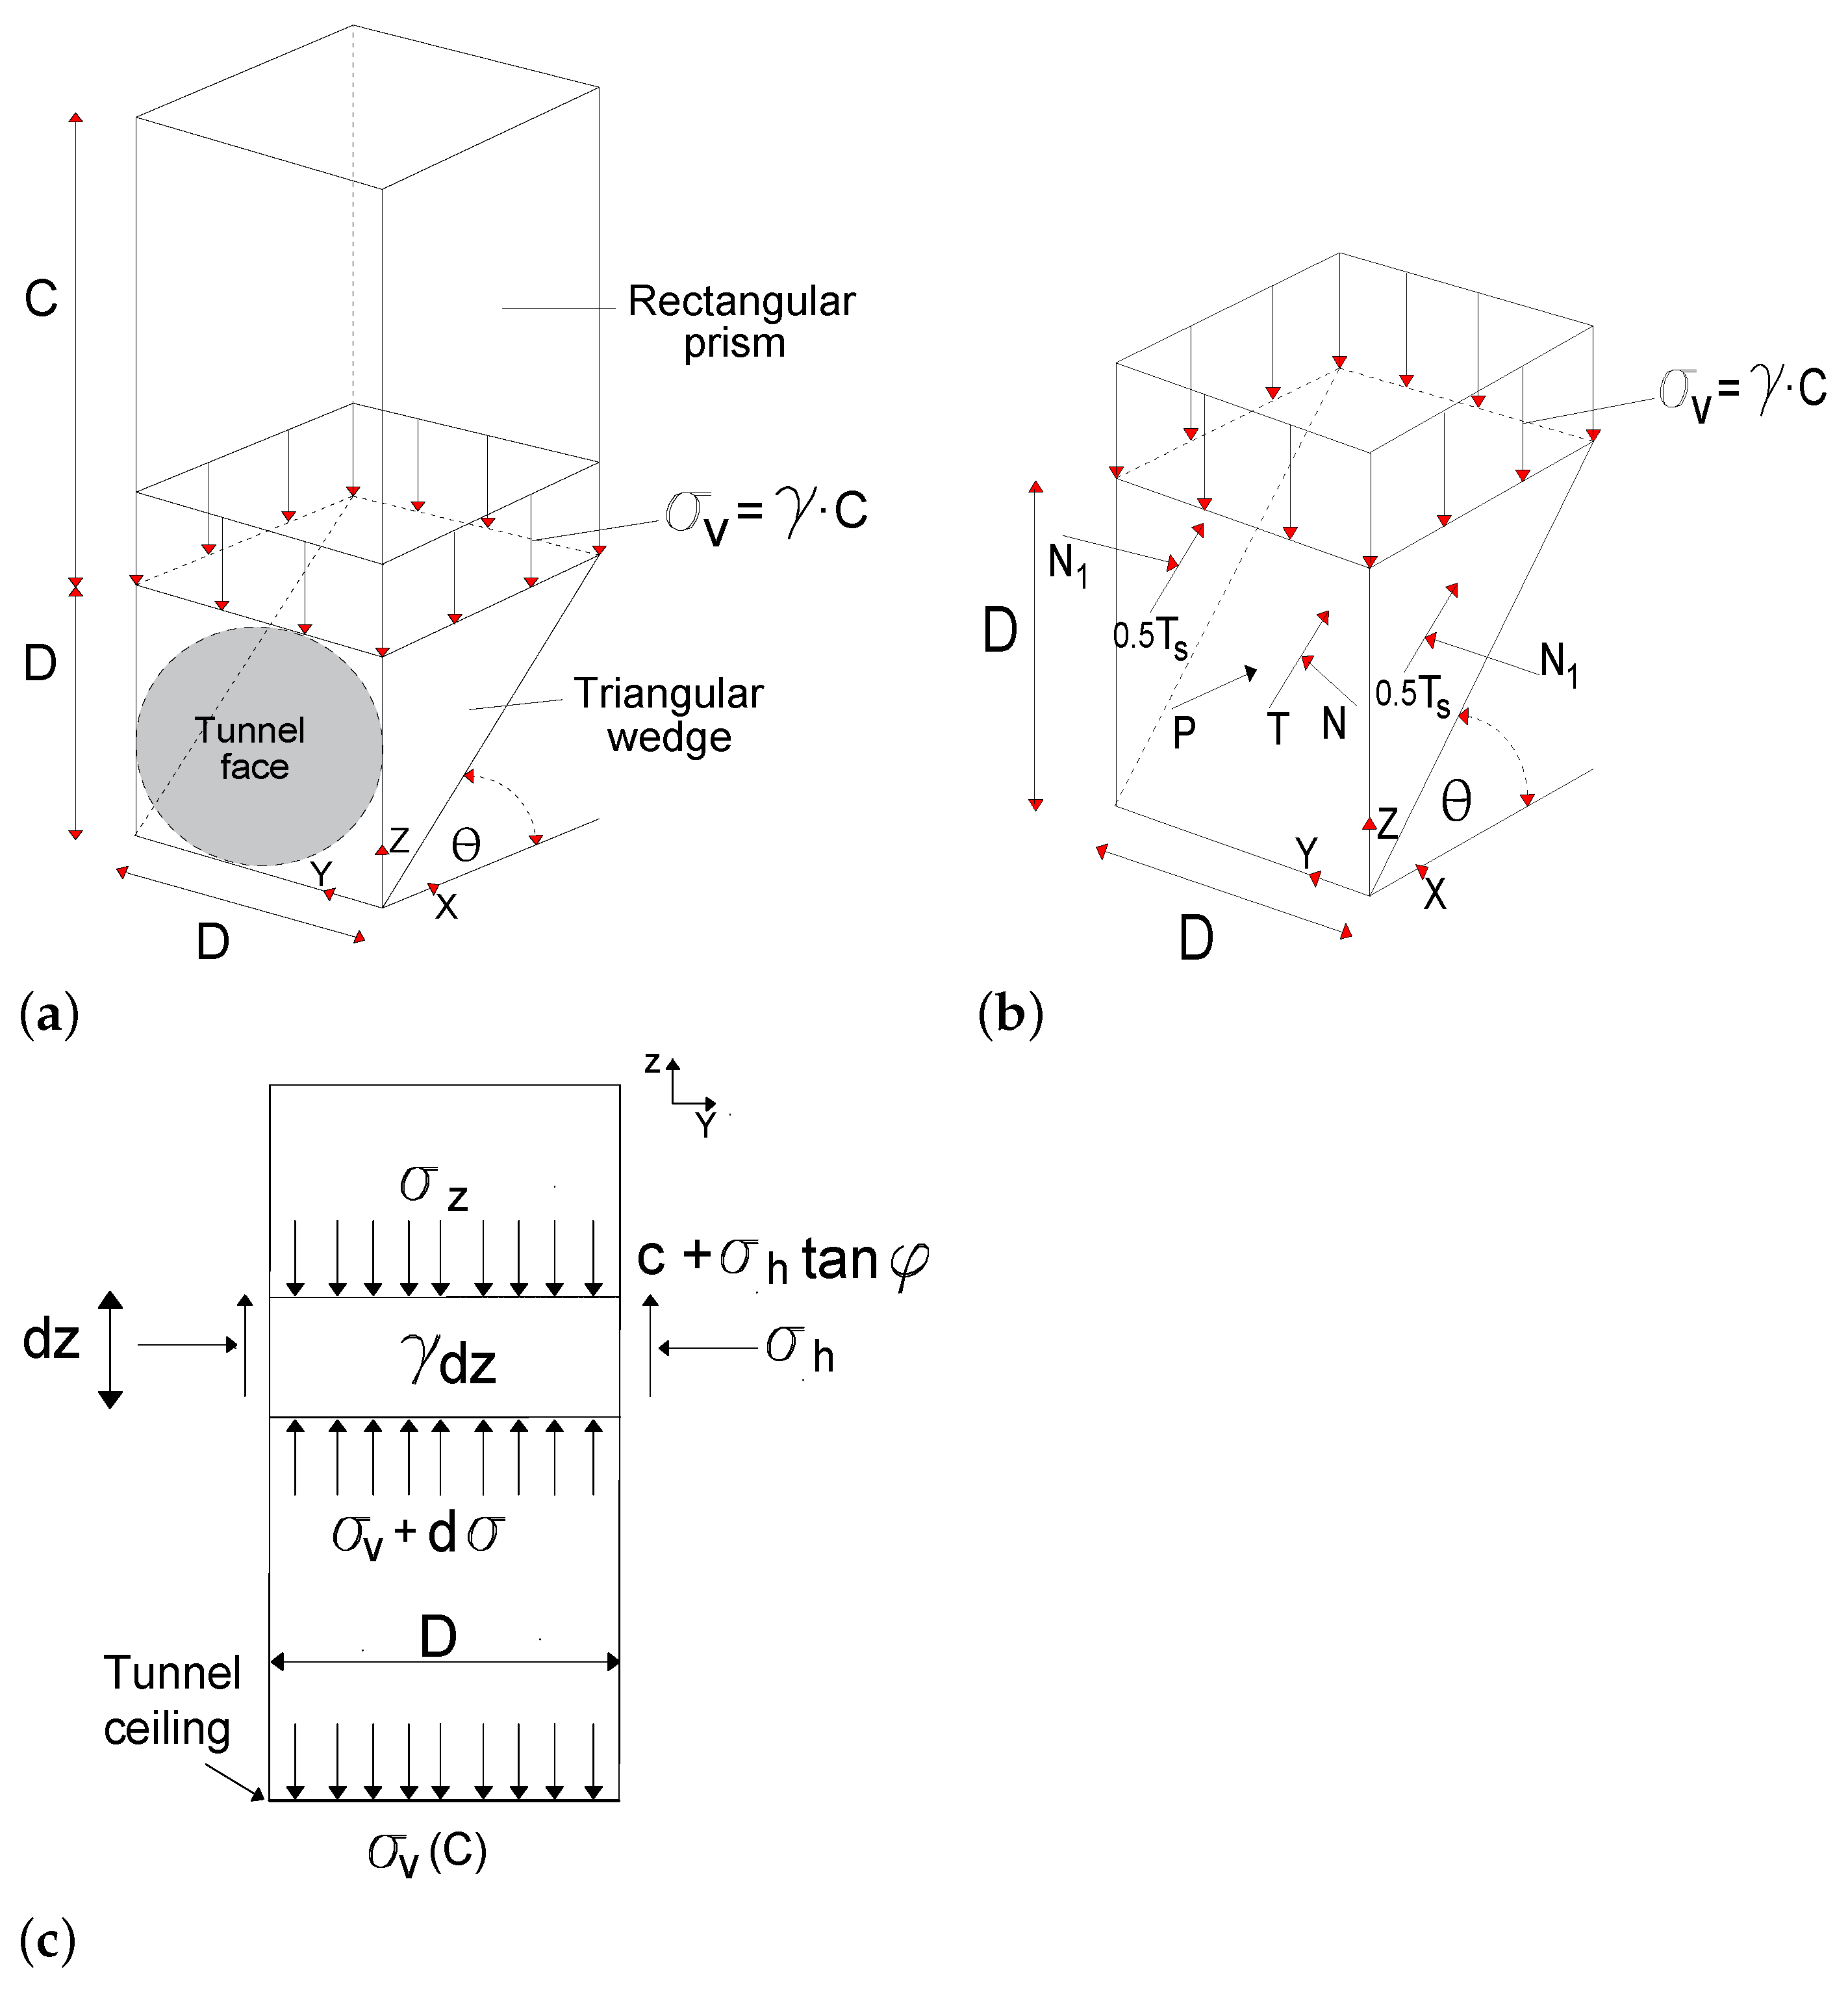
The first systematic study for 3D face stability of the tunnel was performed by Horn [5]. Horn [5] presented a 3D wedge-silo failure mechanism, replacing the circular shape of the tunnel face with a square shape, as shown in Figure 1a. The horn failure mechanism consists of a prismatic wedge and a vertical silo above the wedge. In the horn failure mechanism a number of proper choices are proposed for adopting the distribution of vertical stress with depth. Latterly, the wedge-silo model has been used by several researchers as a basis for further development. Using the Limit Equilibrium Method, Anagnostou and Kovari [7], Jancsecz and Steiner [6], Broere [8], and Anagnostou [11] proposed a 3D tunnel face stability model based on the Horn failure mechanism, including the effect of soil arching in the silo by using Janssen’s silo theory [28].
The silo theory composed the following equation for calculating the vertical stress acting on the base of the silo:
where is the density of the soil, is the friction angle, a is the ratio of the area over circumference of horizontal plane of the silo, is the lateral pressure coefficient and z is the soil depth from the ground surface.
Two assumptions are adopted in the wedge-silo model based on Janssen’s analysis of soil arching. The first assumption is that the lateral earth pressure coefficient of the soil in the silo is assumed in advance; it is also constant over the tunnel depth. The second assumption is that the vertical stresses are uniformly distributed across any horizontal section of the silo as well as at the base of the silo. In addition to the previous assumptions, the shear force between the silo and the wedge is omitted in the equilibrium of the forces.
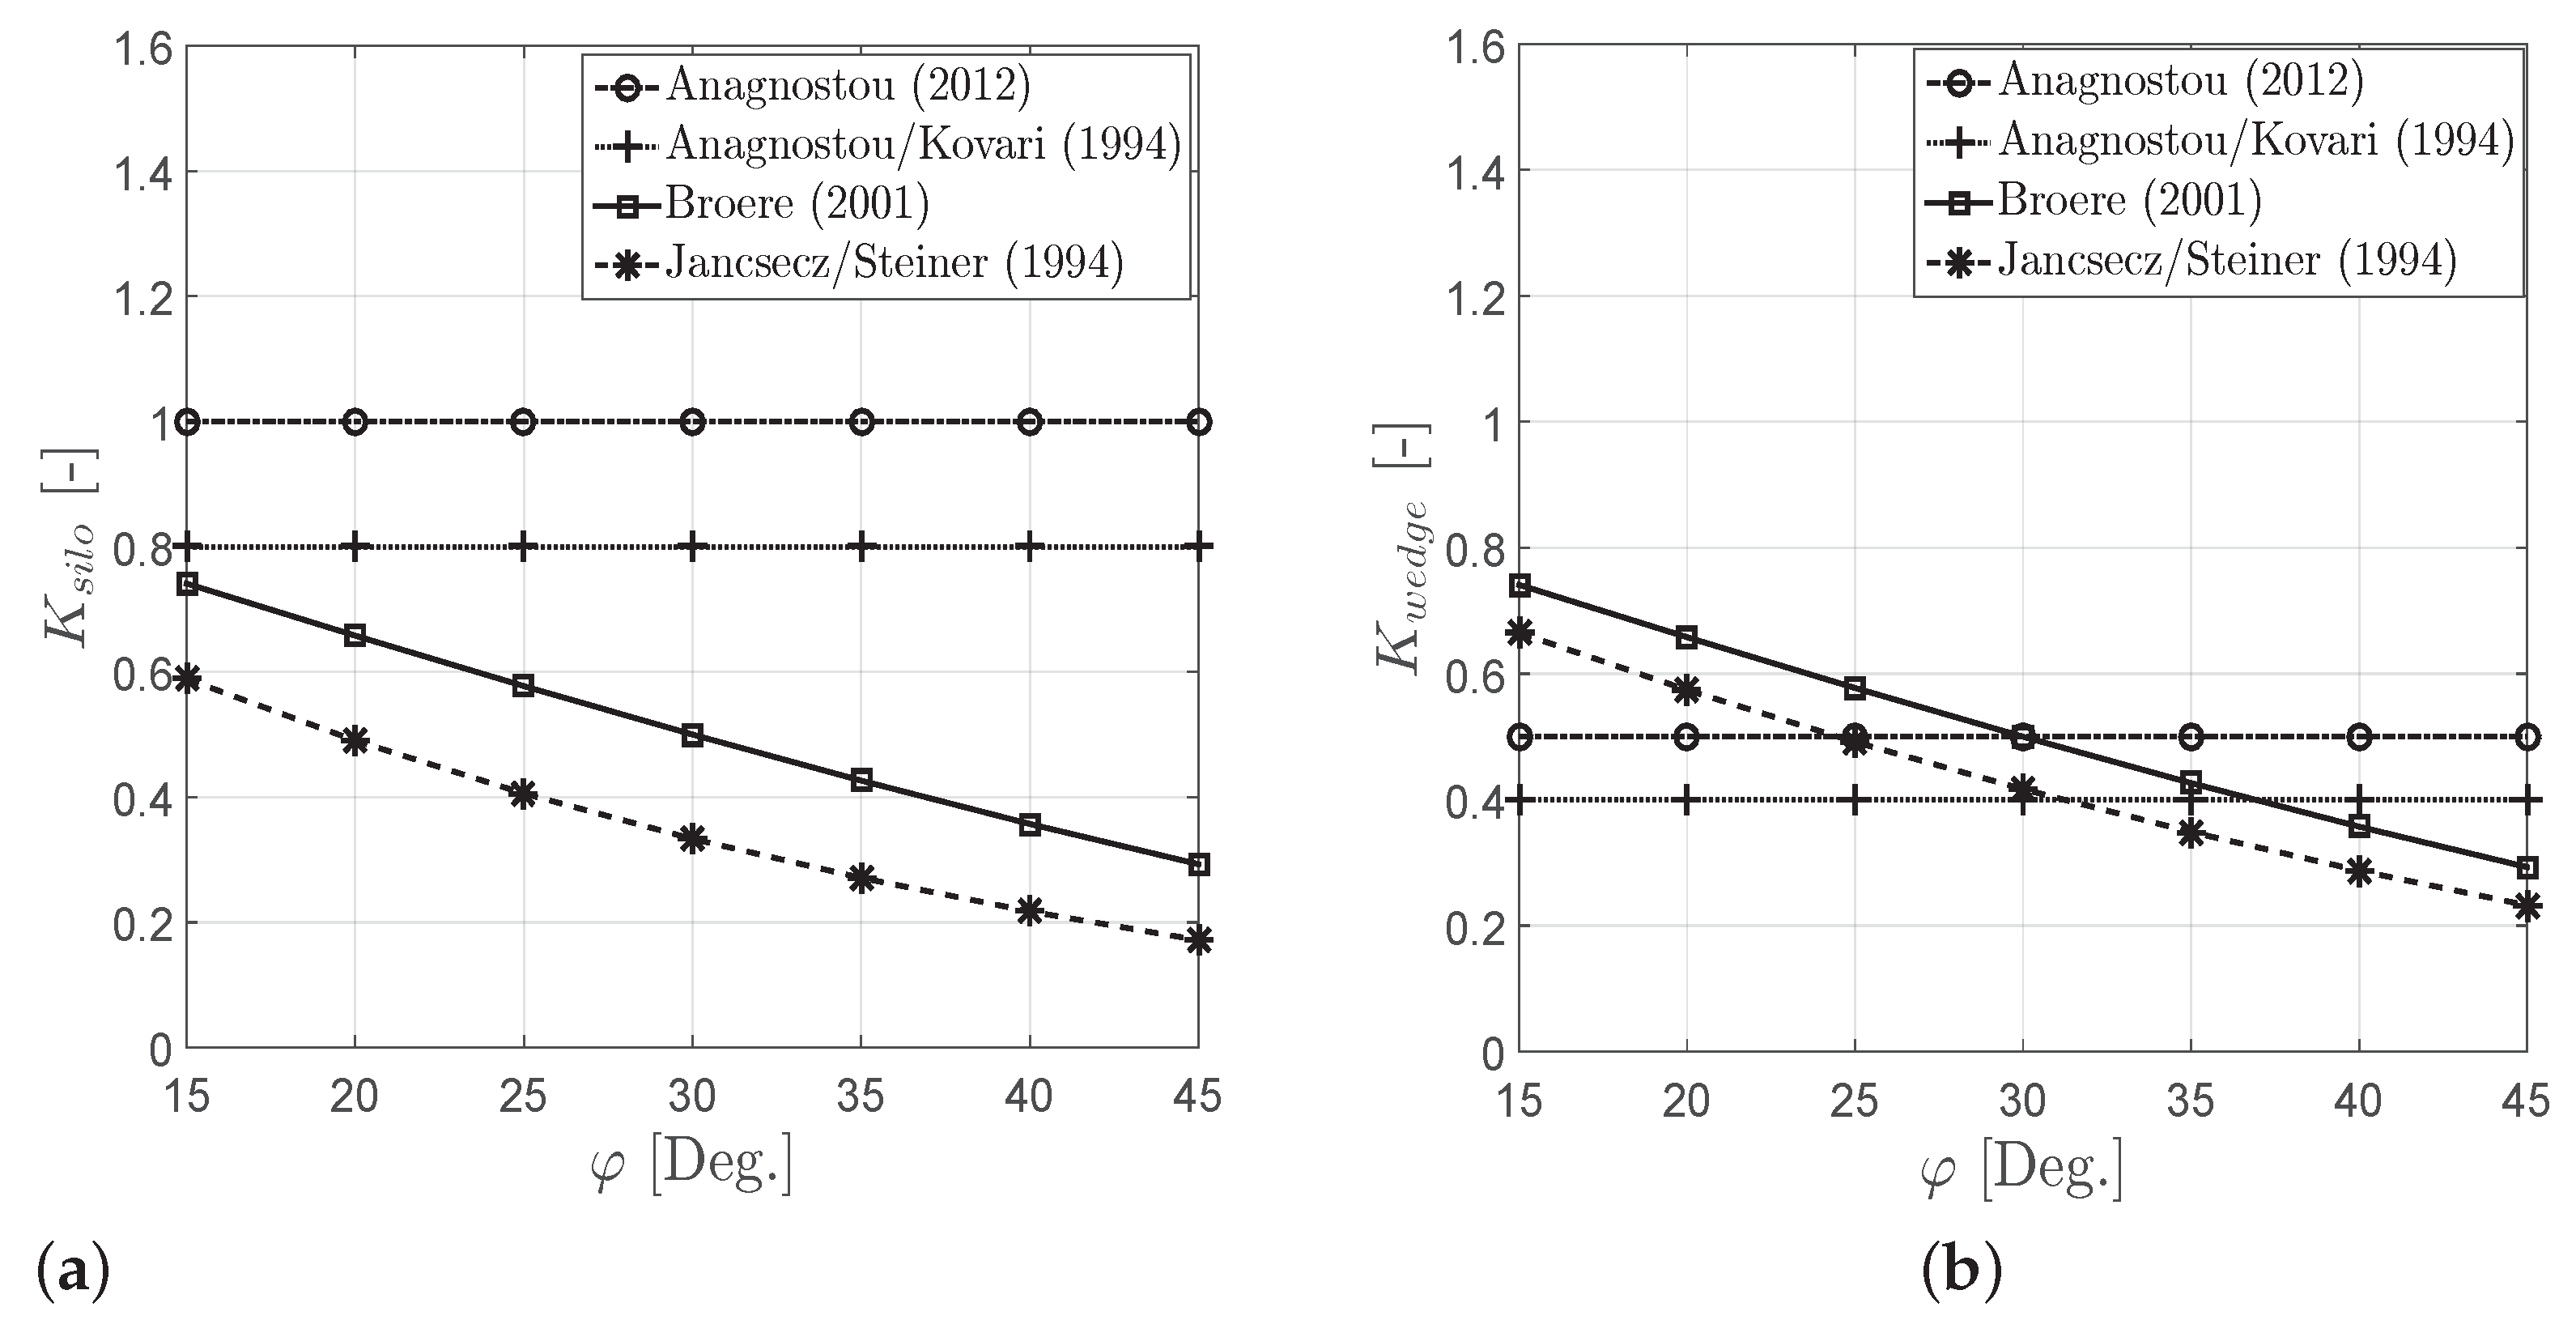
Different assumptions have been made by various researchers for . Anagnostou and Kovari [7] assumed = 0.8. Jancsecz and Steiner [6] used a 2D active earth pressure coefficient for the silo, = , ), Broere [8] used the lateral earth pressure coefficient at rest proposed by Jaky [29]. Anagnostou [11] suggested = 1.0.
A number of authors have suggested a different value for based on practical experience. Anagnostou and Kovari [7] assumed = 0.4. Jancsecz and Steiner [6] suggested the lateral earth pressure coefficient for the wedge as the average of and (, Jaky [29], = (+ )/2, see Figure 2.
Figure 2 shows the value of and with different friction angles using various methods. According to Jancsecz and Steiner [6] model, the and values decrease with the increase in friction angle, this tendency is also revealed by Broere [8]. Whereas, in the Anagnostou and Kovari [7] and Anagnostou [11] models, and are assumed to be a constant where they are independent of friction angle. As shown in Figure 2a, the value of obtained from the Anagnostou and Kovari [7] model is larger than the other models for the same friction angle.
In order to figure out the distribution of horizontal stress inside the wedge, Anagnostou and Kovari [7] and Jancsecz and Steiner [6] were assumed to be linearly proportional between the horizontal stress and the vertical stress . The vertical stress inside the wedge is calculated as follows:
where C is the cover depth. The average shear stress () acting on each triangle slip surfaces of the sliding wedge is obtained by integrating tan over the slip surfaces. The average shear stress over triangle slip surfaces is calculated using the following equation:
Anagnostou and Kovari [7] assumed = 0.4. Jancsecz and Steiner [6] suggested the lateral earth pressure coefficient for the wedge as the average of the summation of and (; Jaky [29]), = (+ )/2, see Figure 2b. Jancsecz and Steiner [6] described the relation between horizontal and vertical stress at the tunnel axis by 3D earth pressure coefficient, the minimum support pressure (p) can be calculated as:
Broere [8] and Anagnostou [11] used the infinitesimal slices method in the wedge, described by Walz and Prager [30] for slurry-filled trenches. The wedge is subdivided into smaller horizontal slices bodies i ( i is the number of each slices), possibly of different soil conditions, see Figure 1c. The forces equilibrium on each horizontal slices are formulated. The minimum support pressure is calculated based on integrating the horizontal and vertical forces equilibrium over the whole wedge for each horizontal slice. The method of slices assumed linear proportion between the horizontal stress and the vertical stress .
Broere [8] proposed = [29]. Anagnostou [11] assumed = 0.5. Kirsch and Kolymbas [9] considered the horizontal shear force into the wedge model between the wedge and silo. Kirsch and Kolymbas [9] constructed a simple equation for calculating the support pressure, which follows from the equilibrium condition by assuming a quadratic parabolic distribution of vertical stress above the tunnel crown. Kirsch and Kolymbas [9] assumed = = (). The vertical stress distribution and the failure mechanism for different arching implementations shown in Figure 3. Unlike the wedge-silo models, Krause [31] established a 3D shell failure mechanism regarding the internal stability of the soil at front of the tunnel face. The shear and cohesion forces along the sliding surface set up the resistance against the collapse. Based on equilibrium of the forces on the 3D failure body, he deduced a formula for calculating the minimum support pressure.
The wedge-silo model has also been investigated by several researchers considering seepage flow (e.g., Perazzelli et al. [32], Zingg and Anagnostou [33]), tunnel face reinforcement (e.g., Anagnostou and Perazzelli [34], Anagnostou and Serafeimidis [35]), excess pore pressure at the tunnel face (e.g., Broere [8], Dias and Bezuijen [36]) and the influence of the slurry infiltration process (e.g., Dias and Bezuijen [36], Broere and van Tol [37]).
3. Limit Analysis Method (LAM)
The limit analysis method is applied to materials which can be idealized as perfectly plastic with the associated plastic flow rule. The concept of limit analysis is based on the theorems of plasticity developed by Drucker et al. [38], namely the lower and upper bound theorem. By using the lower and upper bound theorems, the range in which true collapse load is expected can be found.
The principle of the upper bound theorem is based on the work done by external load in an increment of displacements for a kinematically admissible mechanism being equal to the energy dissipated by internal stresses. This external load is not lower than the true collapse load. For this reason, it represents an upper bound on the actual solution.
The lowest possible upper bound solution is determined with an optimization scheme by trying various possible kinematically admissible failure mechanisms. The lower bound theorem states that if an internal stress field is in equilibrium with external loads without overcoming the yield criterion in the soil mass, the external load is not higher than the true collapse load. The highest possible lower bound solution can be determined by trying different possible statically admissible stress fields.
Many researchers have also used the upper bound method to examine the stability of the tunnel face. A number of authors has assumed different shapes of the failure mechanism to obtain the upper bound solution for calculating the minimum support pressure.
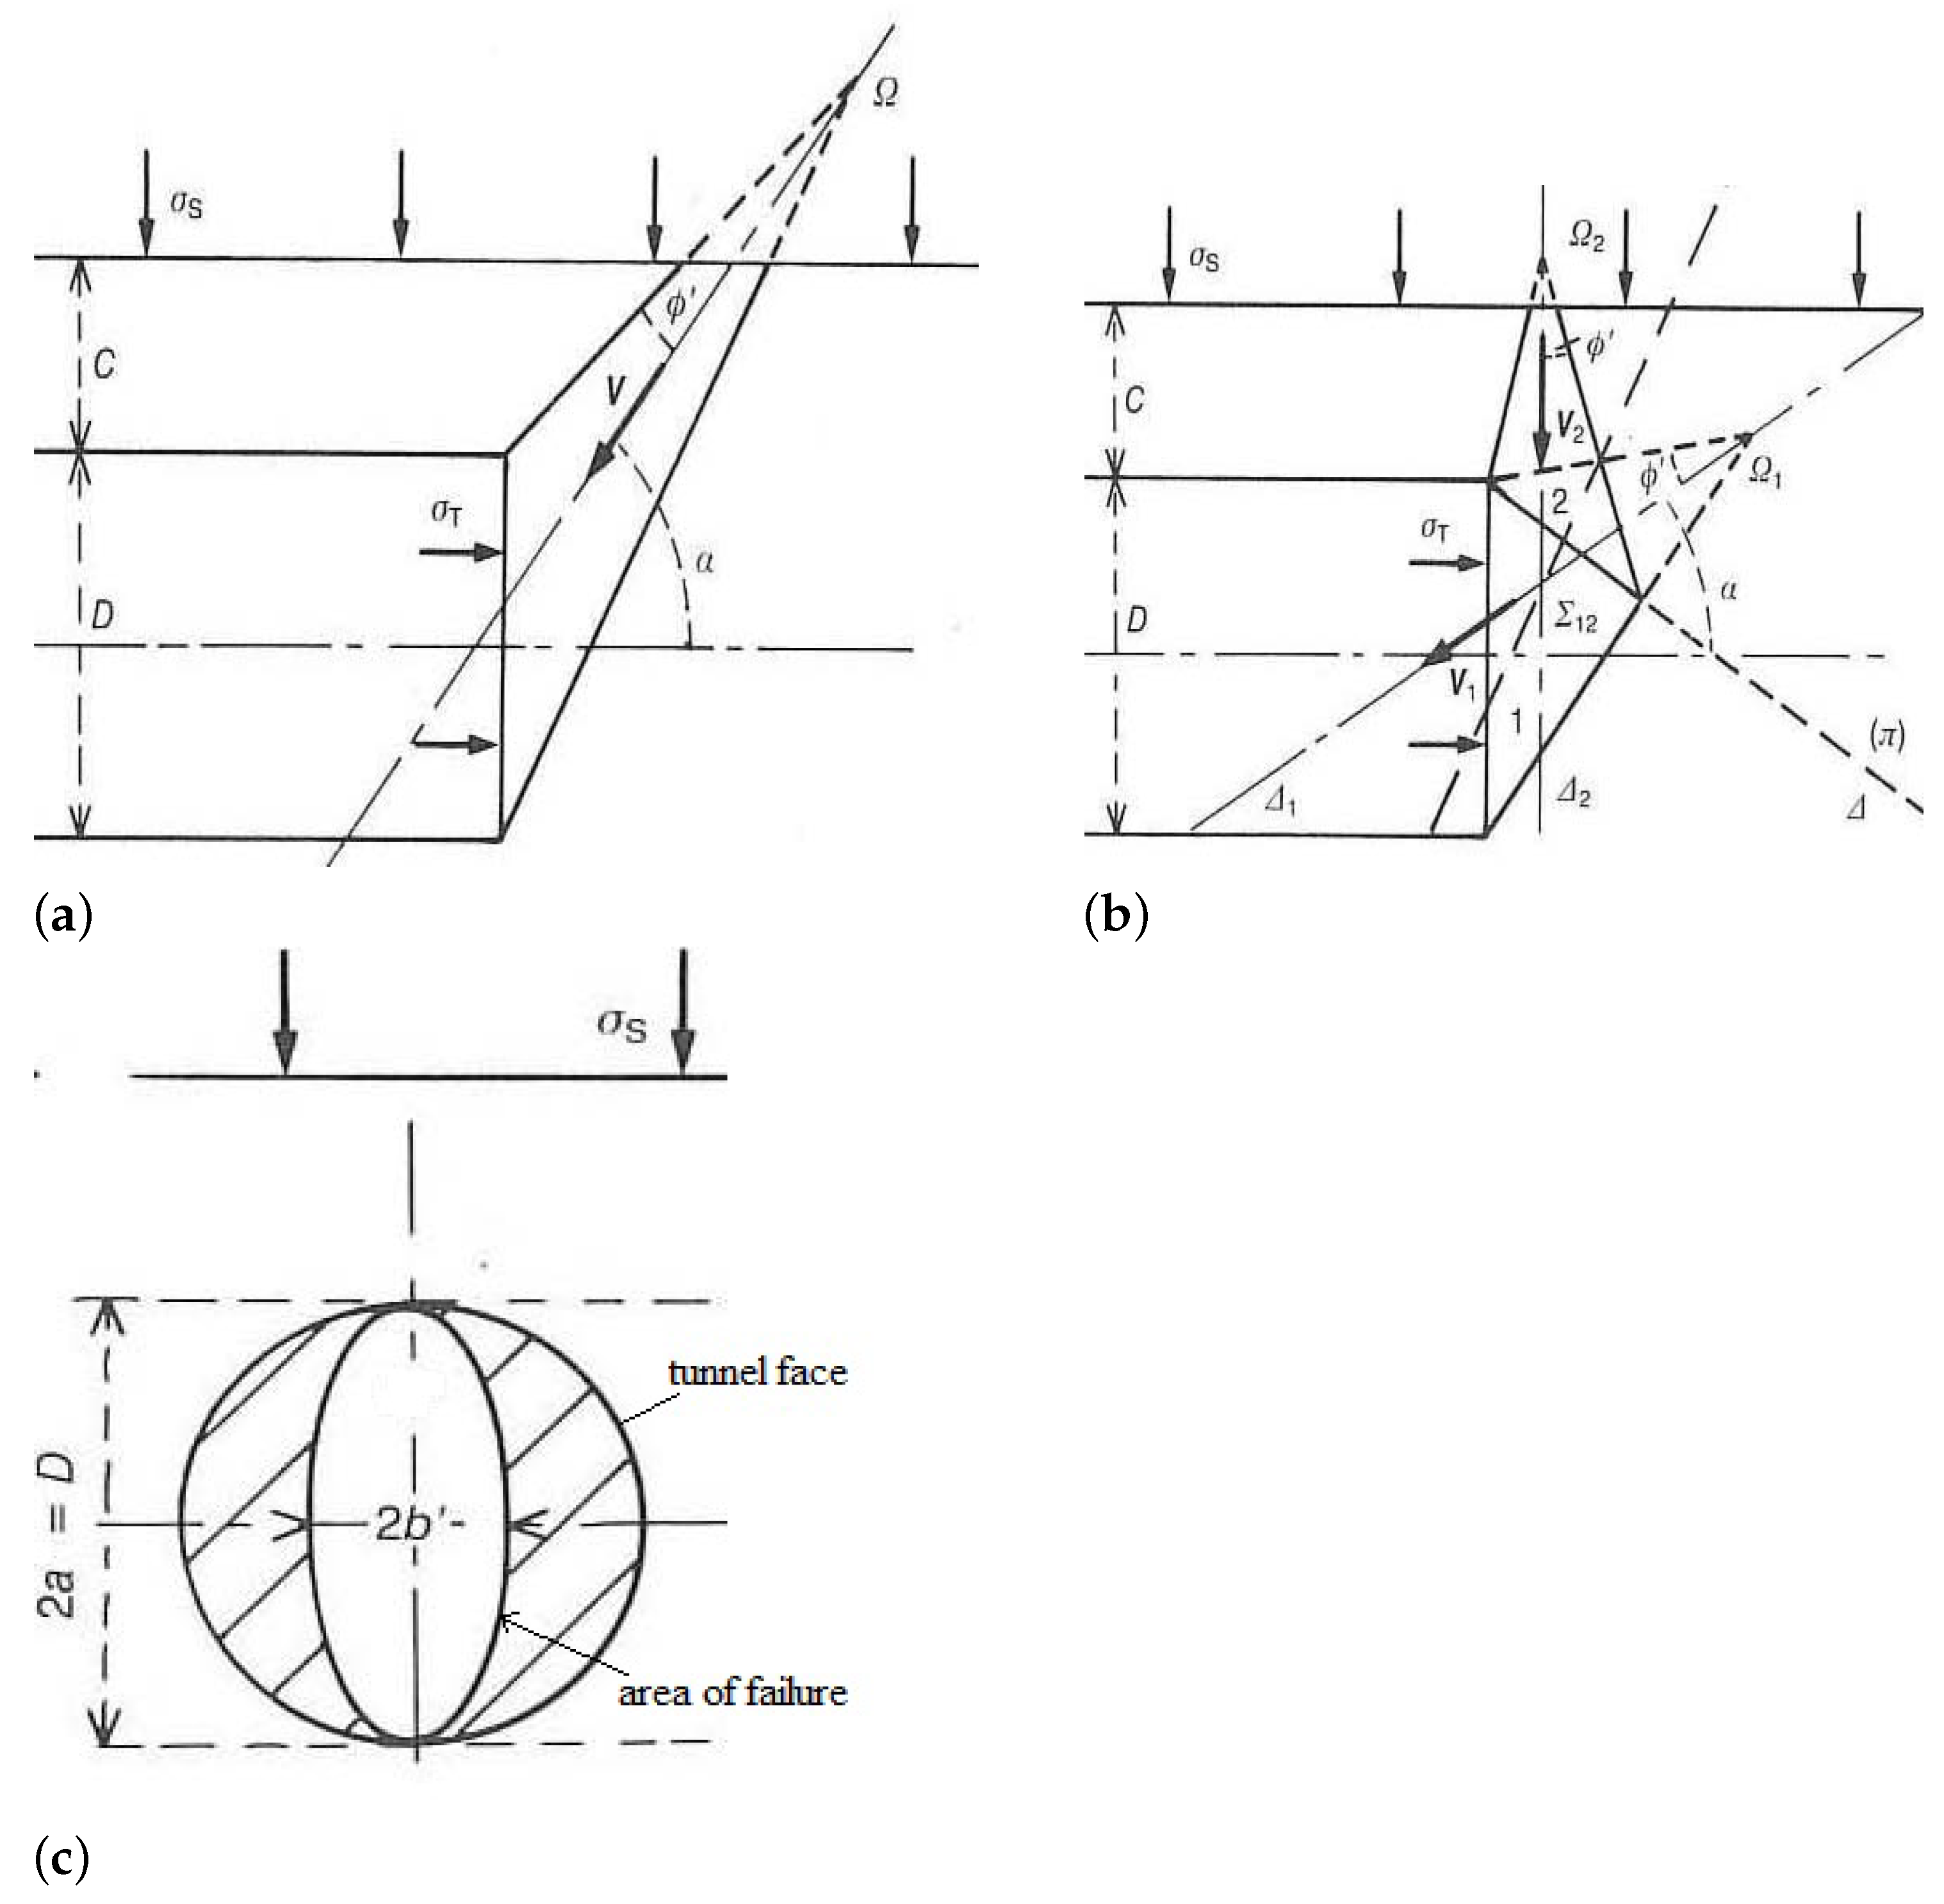
Leca and Dormieux [13] proposed two mechanisms for the failure zone at the front of the tunnel face; one consists of a single conical block and other is composed of two solid conical wedges with elliptic cross sections at the intersection of the tunnel face, see Figure 4. Both failure mechanisms are characterized by only one parameter, namely, the angle between the axis of the cone and the horizontal tunnel axis.
Leca and Dormieux [13] assumed the velocity of each rigid block collinear with the axis of each linked cone. This implies that the plastic energy dissipation along the discontinuities obeys the associated flow rule. The two-blocks mechanism given by Leca and Dormieux [13] is constrained by the normality condition required by plasticity theory. However, this condition does not allow the three-dimensional slip surfaces to develop more freely.
The minimum support pressure at the tunnel axis is expressed by the following equation:
where and are the non-dimensional coefficients and is the surcharge pressure. Leca and Dormieux [13] present two sets of graphs for non-dimensional coefficients and with respect to friction angle.
An improved failure mechanism composed of several rigid conical blocks was proposed by Mollon et al. [14]. This failure mechanism is an extension of the 3D failure mechanism developed by Leca and Dormieux [13], see Figure 5. Mollon et al. [14] found that a total number of five blocks is sufficient to calculate the minimum support pressure. The improvement of the solution by Mollon et al. [14] is due to the increase in the degree of freedom of the failure mechanism. Moreover, the mechanism is able to account for the whole circular tunnel face.
The results obtained by Leca and Dormieux [13] and Mollon et al. [14] indicated that for cohesionless or a frictional-cohesive soil with a friction angle greater than or equal to 20, the minimum support pressure is independent of the tunnel cover depth.
More recently, the upper bound model used by Leca and Dormieux [13] was evolved for investigating the effect of layered soil on the minimum support pressure. Tang et al. [15] amended the solution of Leca and Dormieux [13] to be applicable in a layered soil. Tang et al. [15] studied the influence of soil properties of the crossed layered soil and the cover layered soil on the minimum support pressure. Their results indicated that the minimum support pressure is highly influenced by the shear strength of crossed soil more than the shear strength of the cover soil.
Zhang et al. [39] proposed a new 3D failure mechanism using the kinematic approach of limit analysis. The new 3D failure mechanism was composed of four conical blocks. The failure mechanisms only consider a portion of the tunnel face (an ellipse on a circular tunnel face). In addition, the numerical simulations using an FLAC3D were performed to analyze the stability of a tunnel with different tunnel cover to diameter ratios. Finally, the minimum support pressure obtained through the FLAC3D were compared to results obtained by the upper bound solution. It was found that the results from the upper bound solution were in very good agreement with the results of numerical simulations. Moreover, the failure zones are compared and the results corresponded with one another.
Using an FLAC3D, Li et al. [40] carried out numerical simulations to investigate the characteristics of the velocity distribution at the front of the tunnel face. Based on the velocity field obtained from the numerical simulations, an improved failure mechanism is constructed using the spatial discretization technique, which takes into account the soil arching effect. Both the minimum support pressure and the failure pattern were compared with the results of the numerical simulations. It was found that the critical face pressure provided by the improved failure mechanism corresponded well to that of the numerical simulation.
Ibrahim et al. [16] improved the 3D failure mechanism of Mollon et al. [14] to compute the minimum support pressure in dry multilayered purely frictional soil. The improved 3D failure mechanism is proposed for two and three soil layers.
Senent and Jimenez [41] extended the solution of Mollon et al. [14] to study the possibility of partial collapse in layered soils. The proposed model by Senent and Jimenez [41] examined the influence of soil properties of the crossed soil and the cover soil on the minimum support pressure.
Khezri et al. [42] investigated the effect of linear variation of cohesion with depth on the minimum support pressure. Their results show that adopting the mean soil cohesion that does not vary with depth would lead to conservative predictions for tunnel face support pressure. However, adopting the cohesive determined for the centreline of the tunnel underestimating the tunnel face support pressure and leads to an unsafe design.
Based on the kinematic approach of limit analysis, Pan and Dias [43] proposed a 3D failure mechanism to study the effect of anisotropy and cohesion on the stability of the tunnel face, including two types of non-homogeneous cohesion—linear variation with depth and layered soil. The results obtained from the presented approach show that both anisotropy and non-homogeneity have a significant effect on the support pressure, especially when the cohesion is relatively large.
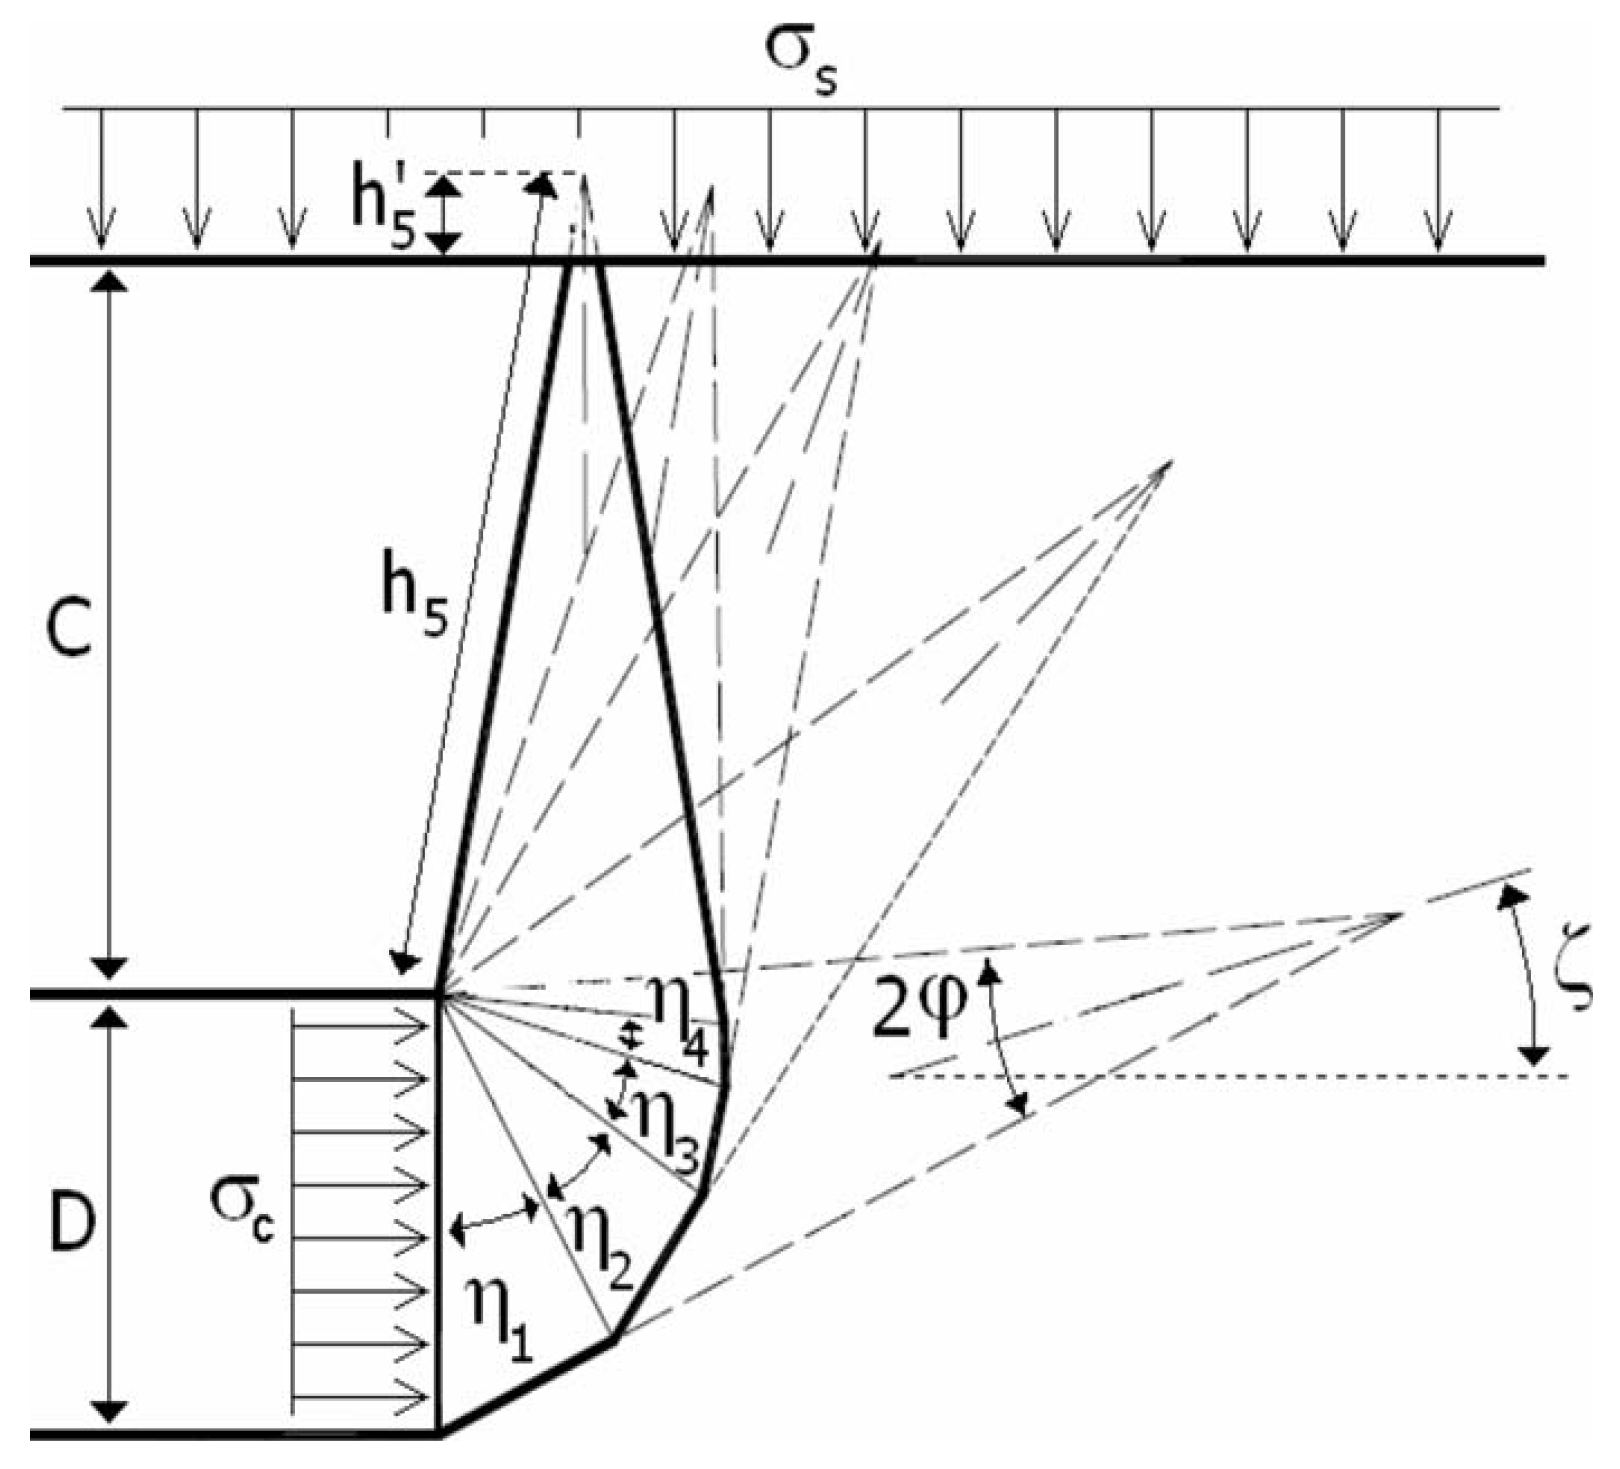
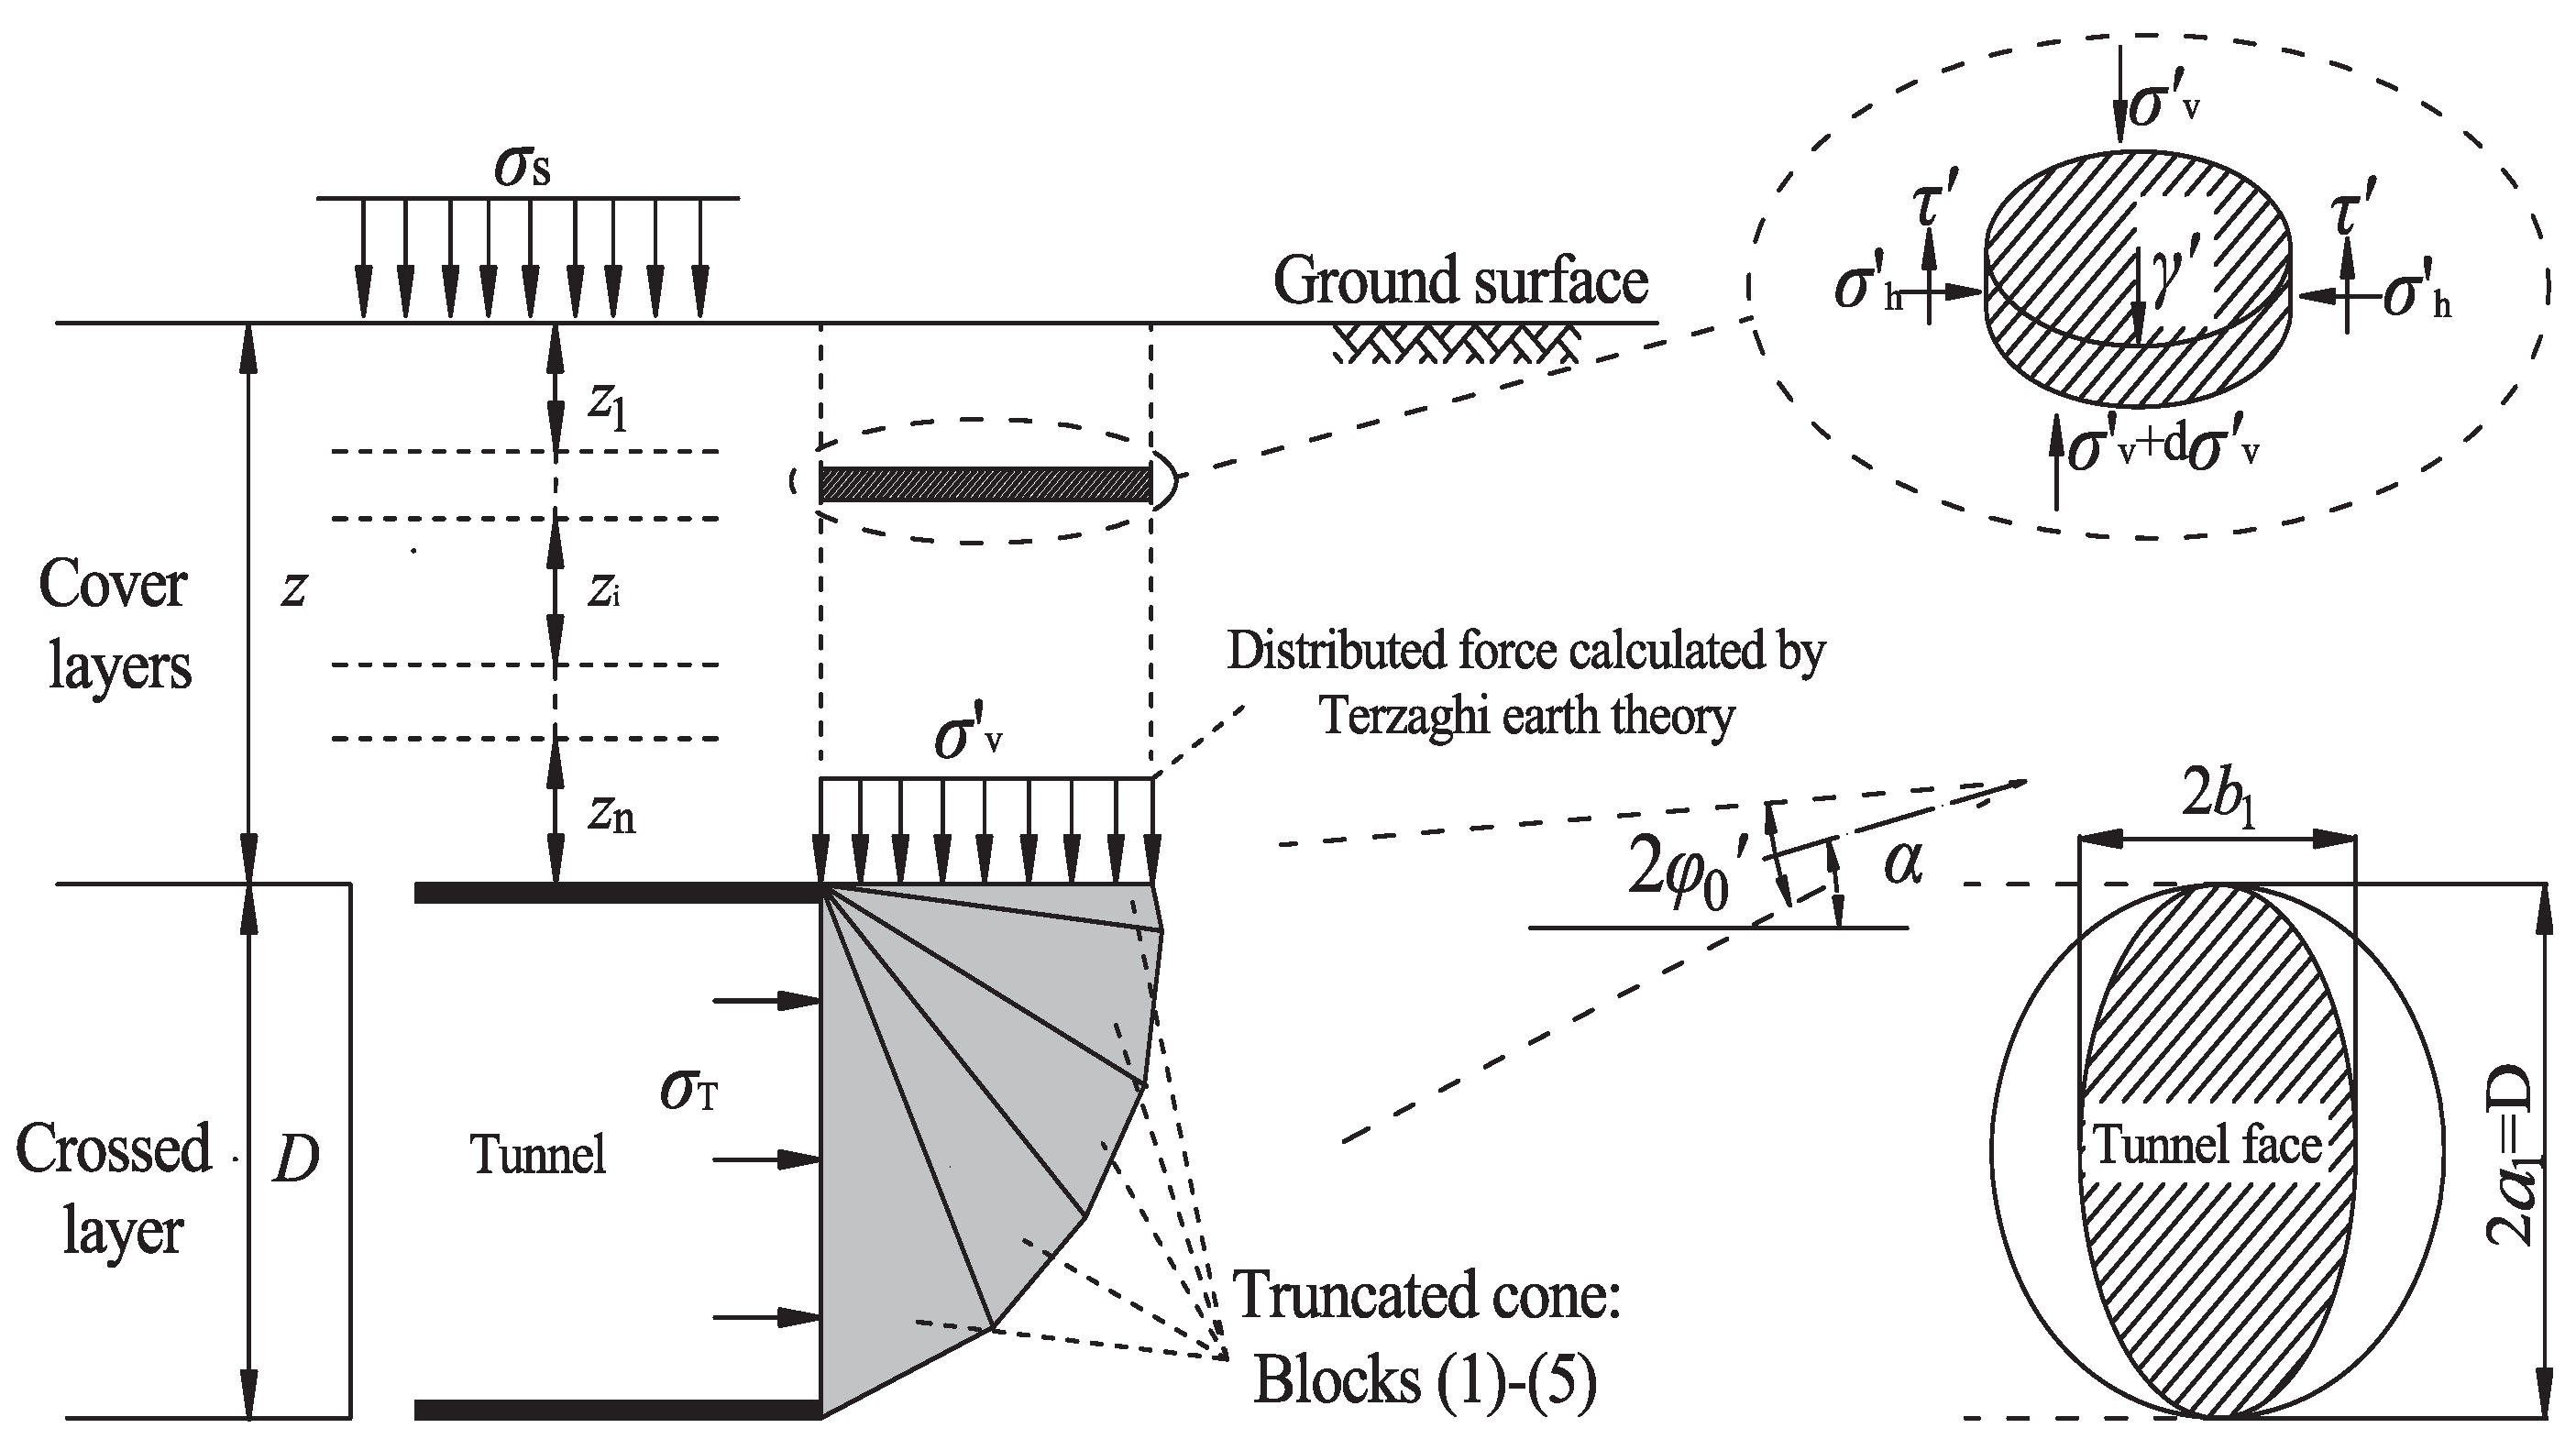
Han et al. [44] proposed a 3D multiblocks failure mechanism for multilayered cohesive-frictional soils (see Figure 6). Their failure mechanism combines the silo theory (upper part) with the upper bound solution (lower part). The failure mechanism is composed of five truncated cones in the wedge. The distributed force acting on top of the truncated cone is calculated using silo theory with = . The minimum support pressure is obtained using the upper bound solution in failure mechanism of the wedge.
Lee and Nam [45] included the effect of seepage forces emerging from the groundwater flow in the upper bound solution. They found that the minimum support pressure for the face stability is equal to the sum of the effective support pressure obtained from the upper bound solution and the seepage pressure acting on the tunnel face.
Pan and Dias [46] studied the stability of the tunnel face in water-bearing ground under steady seepage flow conditions. The distributions of to pore water pressure resulting from numerical calculation by FLAC3D are adopted to interpolate on the 3D failure mechanism of Mollon et al. [14]. The results indicated that the effective support pressure increases with water table elevation. The influence of anisotropic permeability on tunnel face stability is also discussed, showing that the isotropic model leads to an overestimation of the necessary tunnel face pressure for anisotropic soils.
4. Comparative Calculations Concerning Minimum Support Pressure
Analogous to the method proposed by Terzaghi [1] for bearing capacity analysis, the normalized support pressure () is represented by the following form (Anagnostou [11], Mollon et al. [14], Vermeer et al. [21]):
where the contribution of different loads and soil parameters including self-weight (), internal friction angle (), surface surcharge (q) and cohesion (c) are expressed by the non-dimensional bearing capacity coefficients , and as a function of the friction angle of the soil. Due to the active conditions around the tunnel face the cohesion is reducing the necessary support pressure.
4.1. Homogeneous Soil
The comparative studies are performed on seven tunnel stability models, covering three different approaches—Limit Equilibrium Method (LEM), Limit Analysis Method (LAM), and Finite Element Method (FEM) calculations. The effect of friction angle (), cohesion (c), and depth to diameter ratio (C/D) on normalized support pressure () will be discussed in the following subsections. The soil conditions are assumed to be homogeneous. The dry unit weight is set to = 20 kN/m, and the tunnel diameter is set to D = 10 m. For simplicity, the surcharge is neglected (q = 0 kPa).
4.1.1. Influence of the Friction Angle and Cohesion
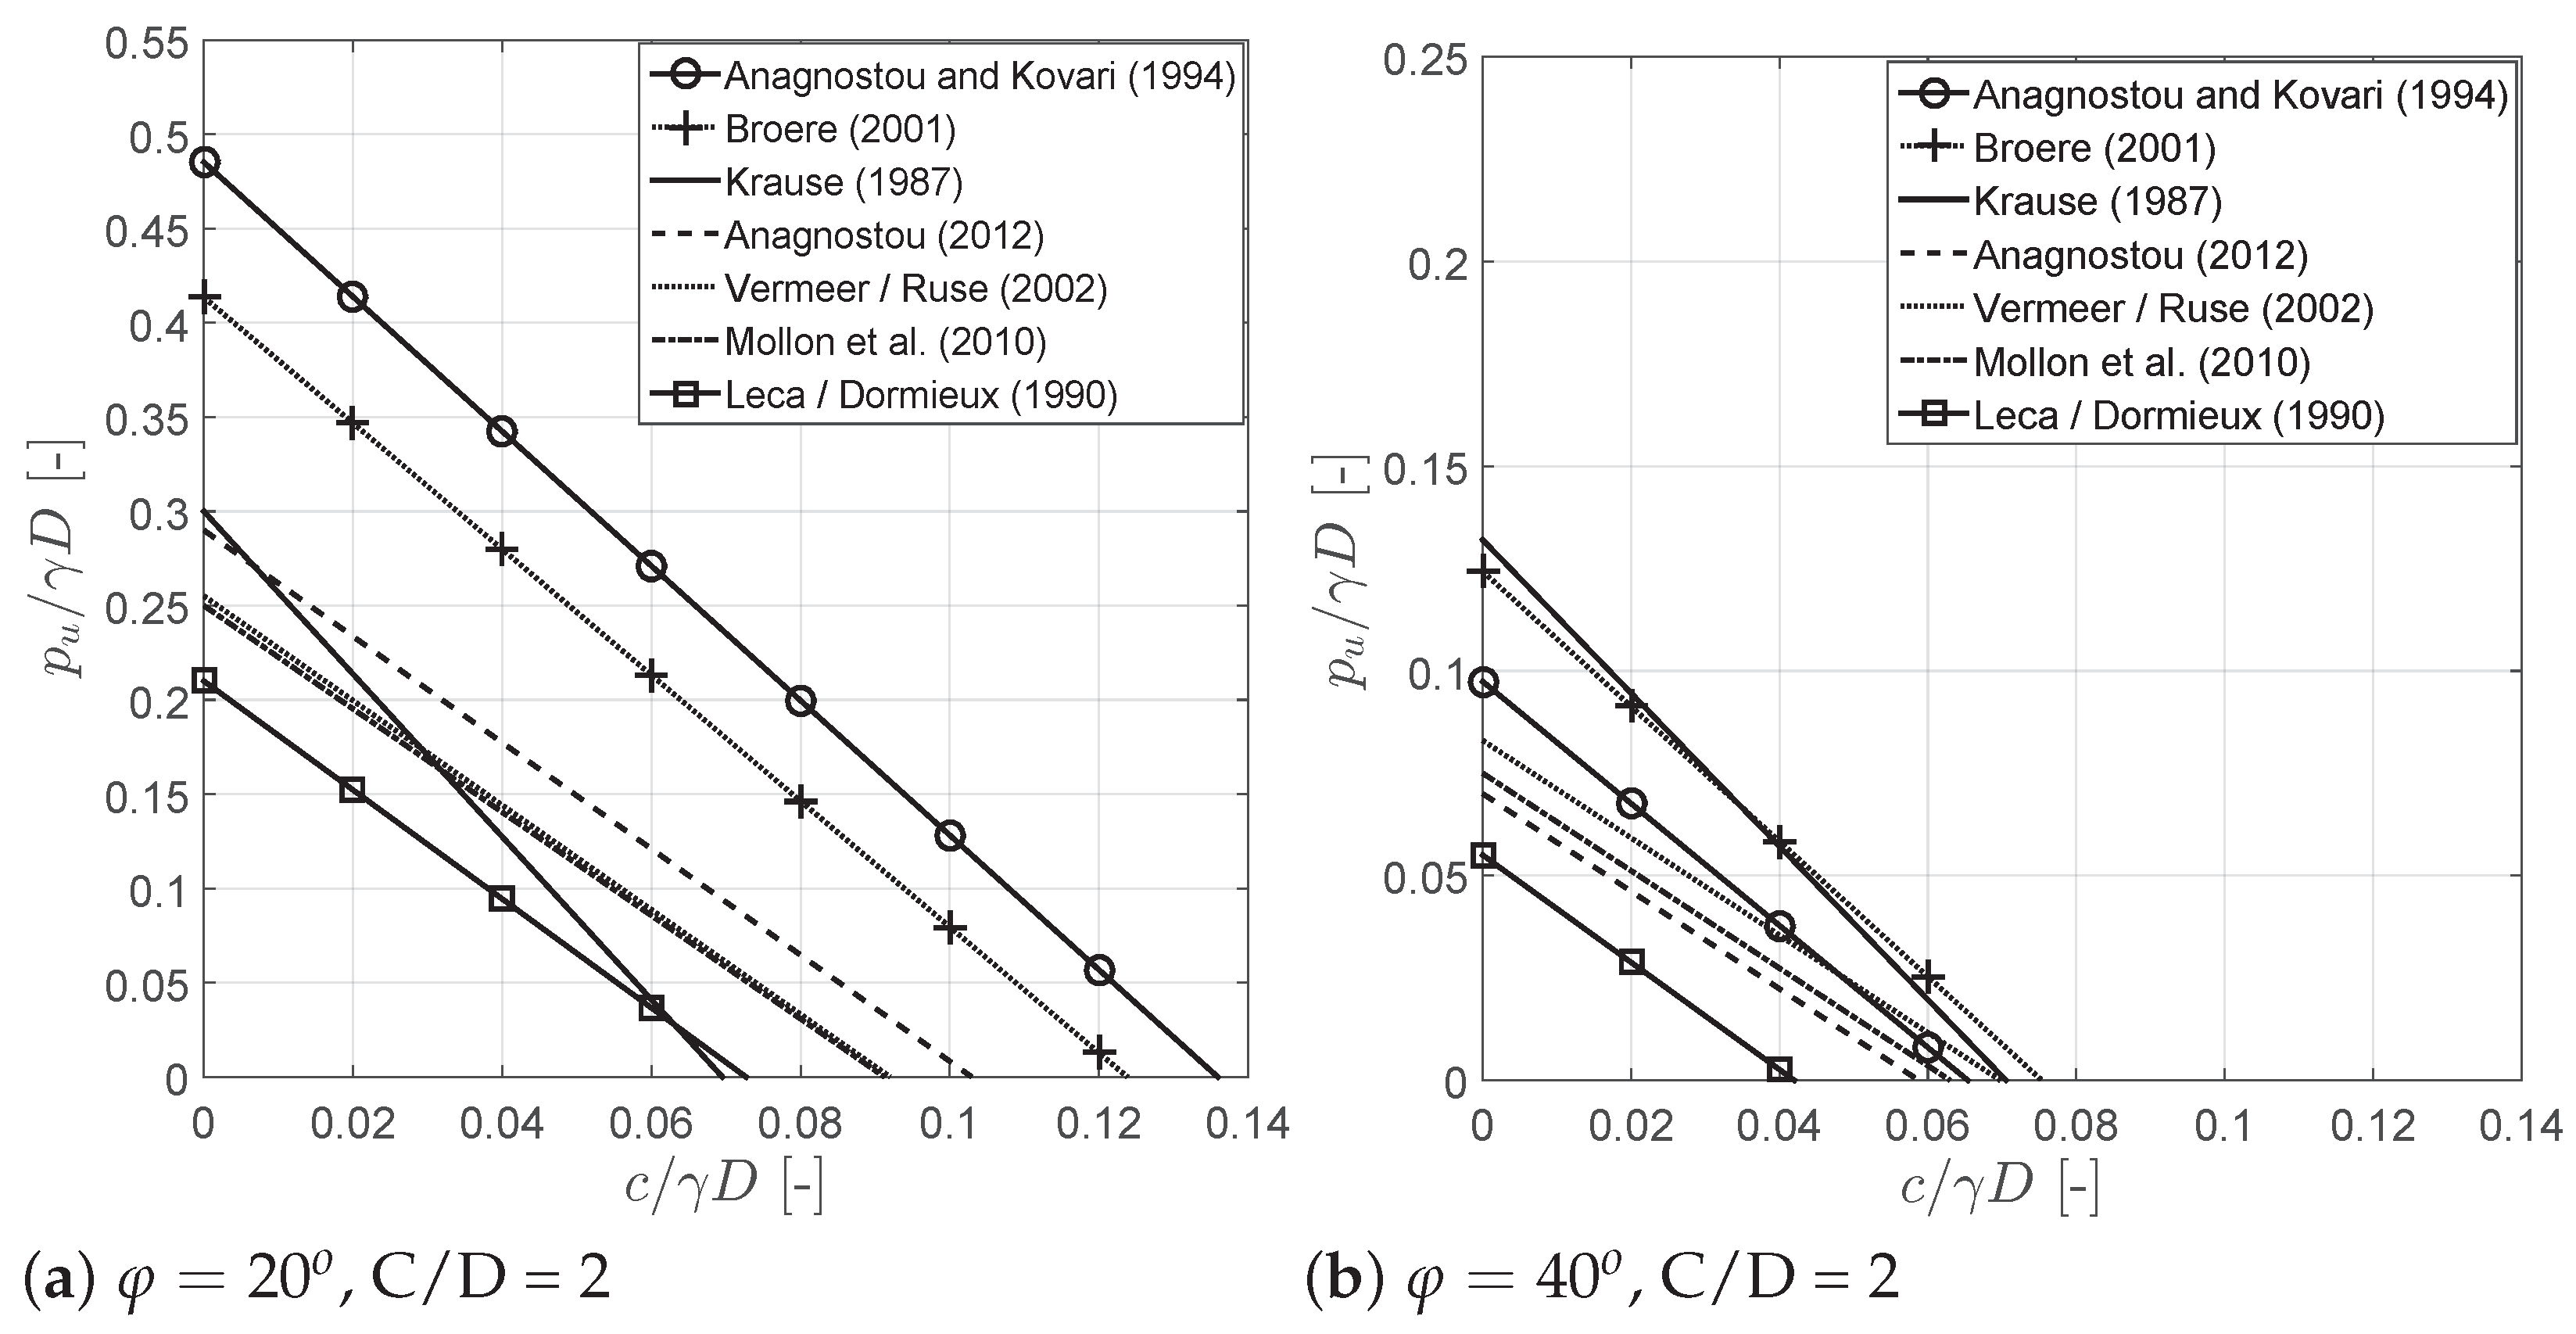
Using the results calculated from seven tunnel stability models, Figure 7 represents the relationship between the normalized support pressure () and normalized cohesion (). The analysis of the normalized support pressure is conducted for and 40. C/D ratio is assumed to be 2.
Figure 7 shows that for and , the slope of the line represents the solution of Krause [31] has higher value than the other solutions indicating that the value of has much more effect on the support pressure compared to the other approaches.
In addition, the solutions of Broere [8], Anagnostou and Kovari [7] and Anagnostou [11] have a close slope value. Therefore, the value of for these models has a very close effect on the support pressure.
It can be seen from Figure 7 that for and ≥ 0 (cohesionless and frictional-cohesive soil), the solution of Anagnostou and Kovari [7] using the limit equilibrium method overestimates the value with regard to the other approaches. However, at and ≥ 0, the solution of Broere [8] is above the solution of Anagnostou and Kovari [7]. The alteration of Anagnostou and Kovari [7] results comparing to Broere [8] results can be attributed to two reasons; firstly, the simplified way of considering the vertical stress distribution along the sides of the wedge, i.e. linear vertical stress distribution. Secondly, for Anagnostou and Kovari [7] assumed = 0.4 which is higher than the assumed value of Broere [8] (). Consequently, in the Anagnostou and Kovari [7] model, the vertical stress and the frictional resistance acting on the wedge are considerably higher than vertical stress and the frictional resistance acting on the wedge obtained using Broere [8] model. Finally, at , the integration of the two previews reasons during the optimization process leads to reduce distinctly the calculated minimum support pressure for Anagnostou and Kovari [7] model comparing to Broere [8] model.
Moreover, for , the values of obtained from Vermeer et al. [21] are much more close to Mollon et al. [14] model, the difference of between these two methods is less than 5%. Whereas, for , the values of obtained from Vermeer et al. [21] and Mollon et al. [14] results are almost identical.
According to Figure 7, for cohesionless and frictional-cohesive soil with the two friction angles ( and 40), the numerical results of Anagnostou [11] which are based on the infinitesimally thin slices method and the results of Mollon et al. [14] using multi-blocks mechanism are located between the results of Broere [8] and the upper bound solution of Leca and Dormieux [13].
For the two friction angles ( and 40) and ≥ 0, the values of obtained from Leca and Dormieux [13] using the upper bound method are clearly below the results given by the others, this is due to the shape of the tunnel face being considered as an elliptic cross section inscribed to the circular face. The two-blocks mechanism given by Leca and Dormieux [13] is constrained by the normality condition, required by plasticity theory, the velocity vector must make an angle with discontinuity surfaces along the sliding surfaces. However, this condition does not allow the three-dimensional slip surfaces to develop more freely.
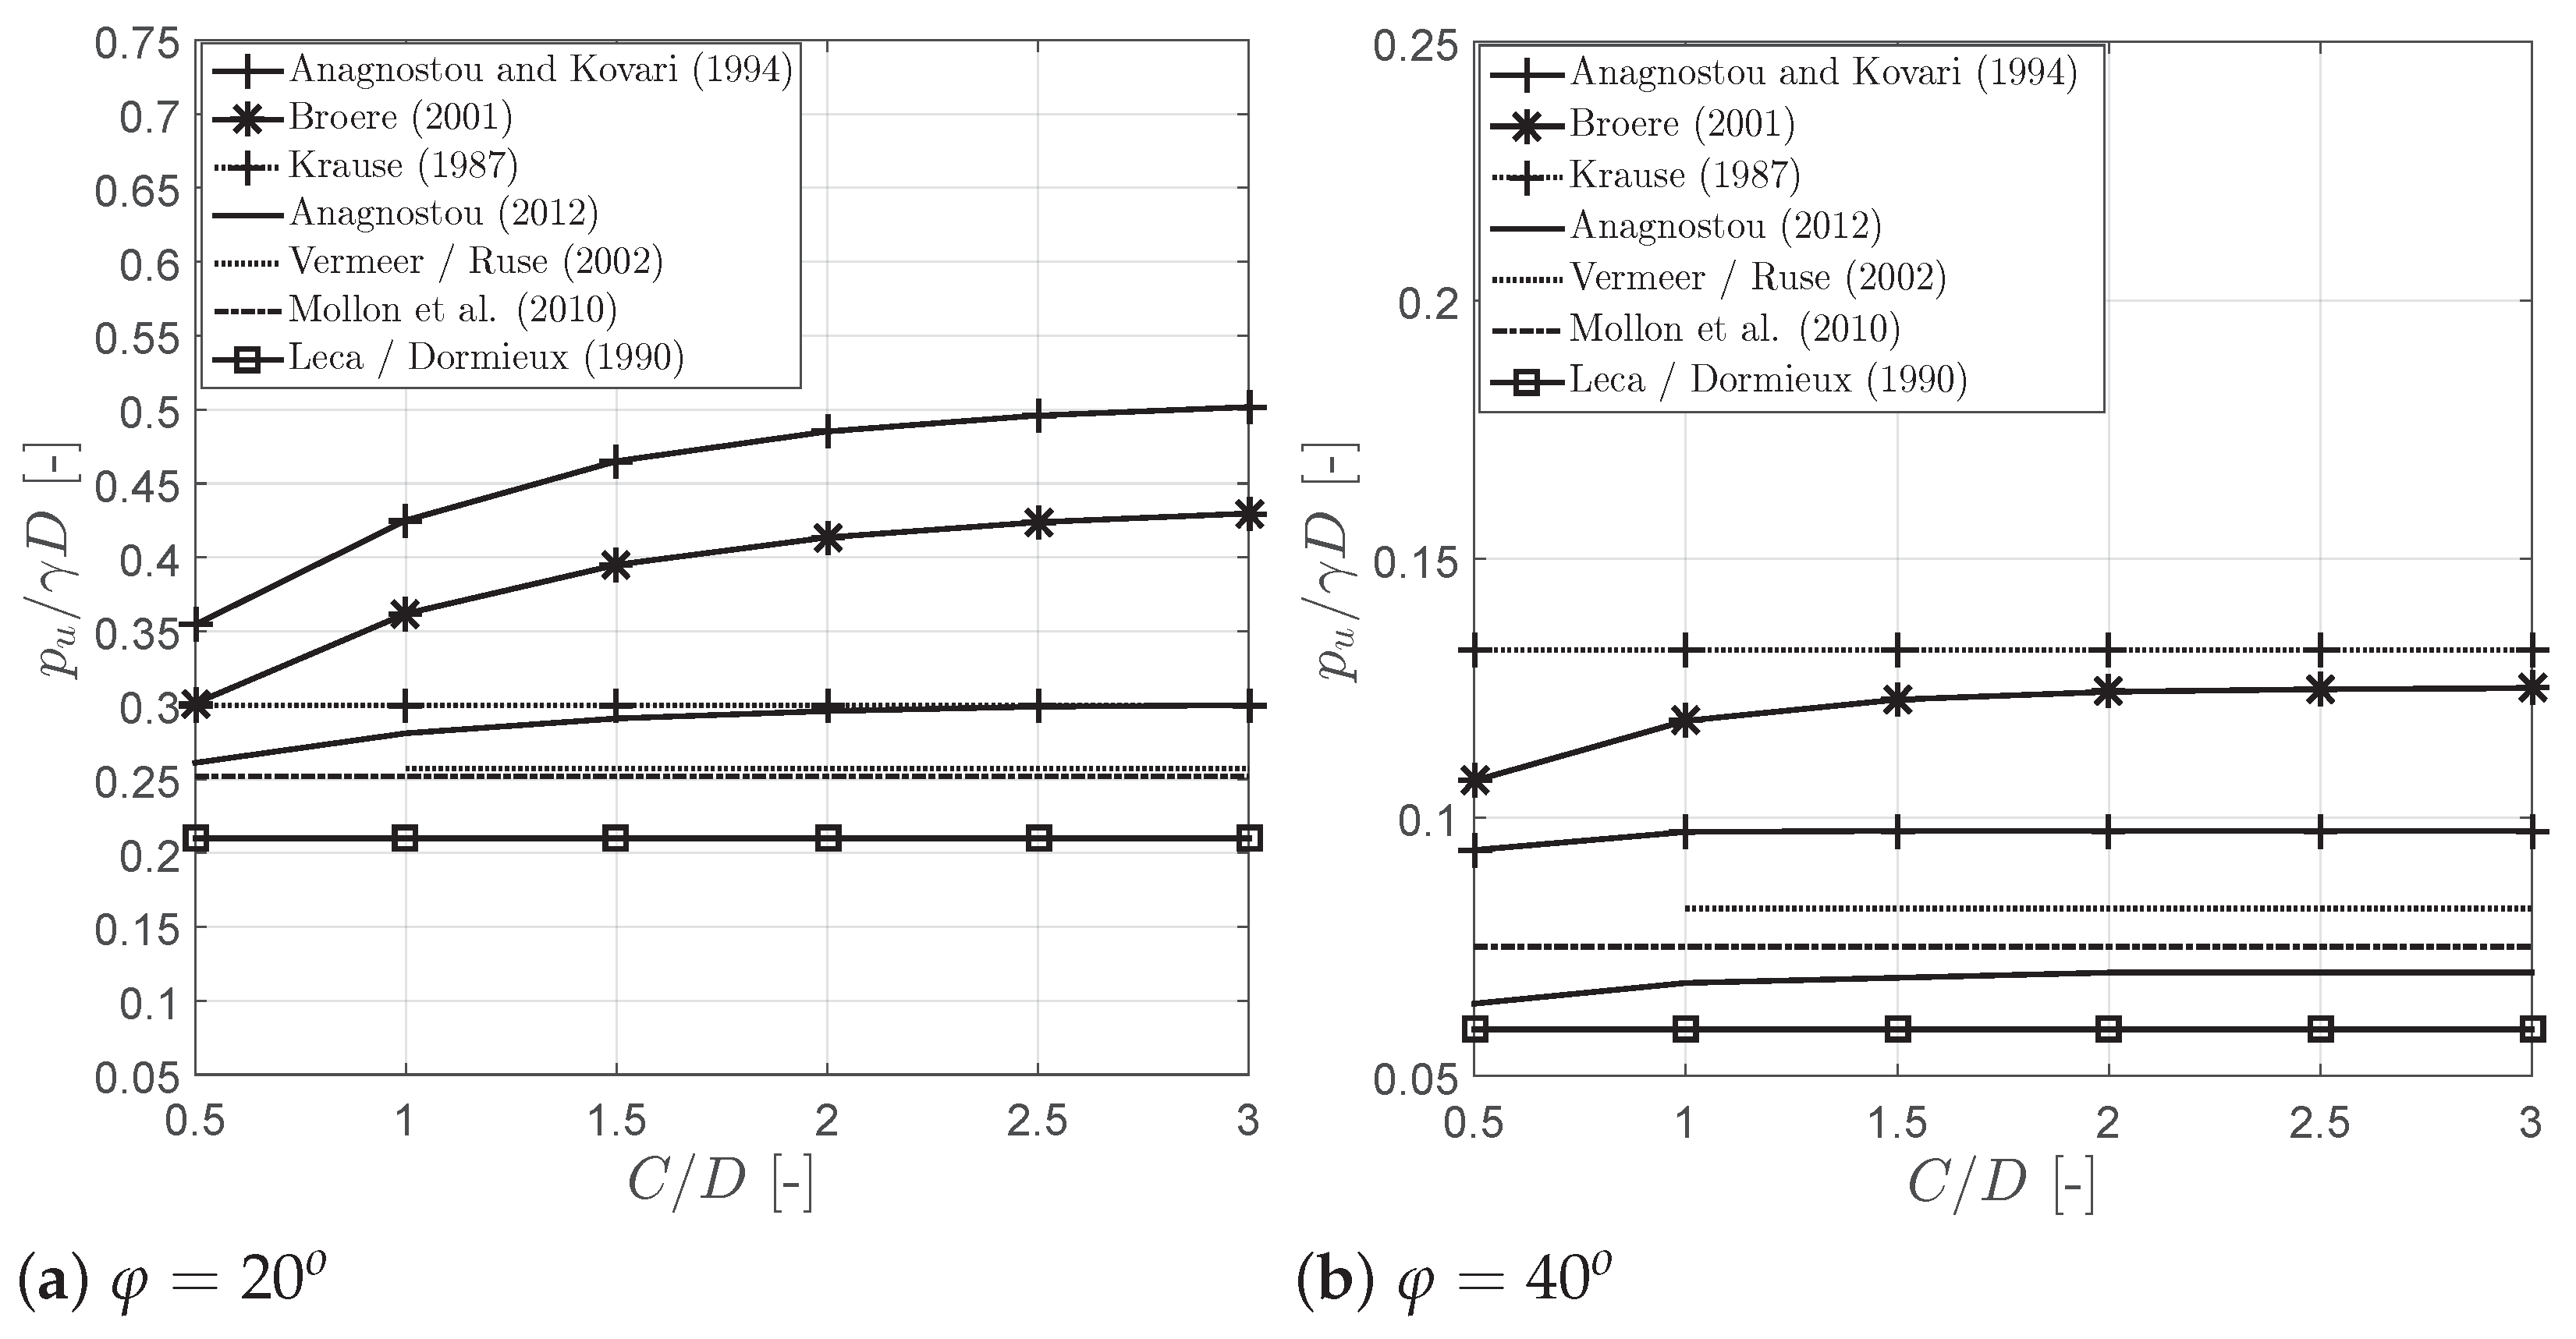
4.1.2. Influence of C/D
Figure 8 presents the influence of cover to diameter ratio (C/D) on normalized support pressure (). From Figure 8, we can see that with any friction angle, the normalized support pressure () predicted from Leca and Dormieux [13] and Mollon et al. [14] solutions remain constant for C/D 1.
The constant support pressure in Leca and Dormieux [13] and Mollon et al. [14] upper bound solutions explained by both failure mechanisms of Leca and Dormieux [13], and Mollon et al. [14] are translational kinematically admissible failure mechanisms, the 3D rigid conical blocks of these mechanisms move with velocities, which are collinear with the cones axes, making an angle with the conical discontinuity surfaces, and fulfilling the normality rule required by the limit analysis theory. Due to this condition, the failure mechanism obtained from the maximization process does not change with C/D 1 ([14]).
In Krause [31] solution, the support pressure is not influenced by the cover to diameter ratio (C/D), which is attributed to the Krause [31] model being based on the internal equilibrium of a half sphere failure mechanism at the front of the tunnel face, where the soil weight of the cover depth is not taken into account in calculating the support pressure. Similarly, in Vermeer et al. [21] numerical results, the normalized support pressure () with C/D ≥ 1 is independent of the cover to diameter ratio.
In limit equilibrium models, the vertical stress tends exponentially to asymptotic value at specific tunnel depth. When the vertical stress reaches its asymptotic value, the minimum support pressure is only dependent on the friction angle and not on the depth of the tunnel, see Equation (1). The rate of approach to the asymptote of the vertical stress is a function of tan and therefore differs in Anagnostou and Kovari [7], Broere [8], and Anagnostou [11] solutions with different friction angles.
For the case of , the normalized support pressure of Anagnostou and Kovari [7], Broere [8] and Anagnostou [11] solutions increase nonlinearly for increasing C/D and the increasing rate became flatter in deeper tunnel depth.
Moreover, for and , the normalized support pressure calculated by Anagnostou [11] model is slightly impacted by the depth ratio if it is less than 2. Once the cover to diameter ratio is bigger than 2, the support pressure gets constant and is no longer influenced by the cover to diameter ratio. We can also conclude from Figure 8, for , in Anagnostou [11] solution, once the cover to diameter ratio is bigger than 2, the support pressure gets constant and is no longer influenced by the cover to diameter ratio. However, in Broere [8], the effect of C/D starts to vanish for C/D > 2.5.
4.1.3. Verification by Physical Model Tests
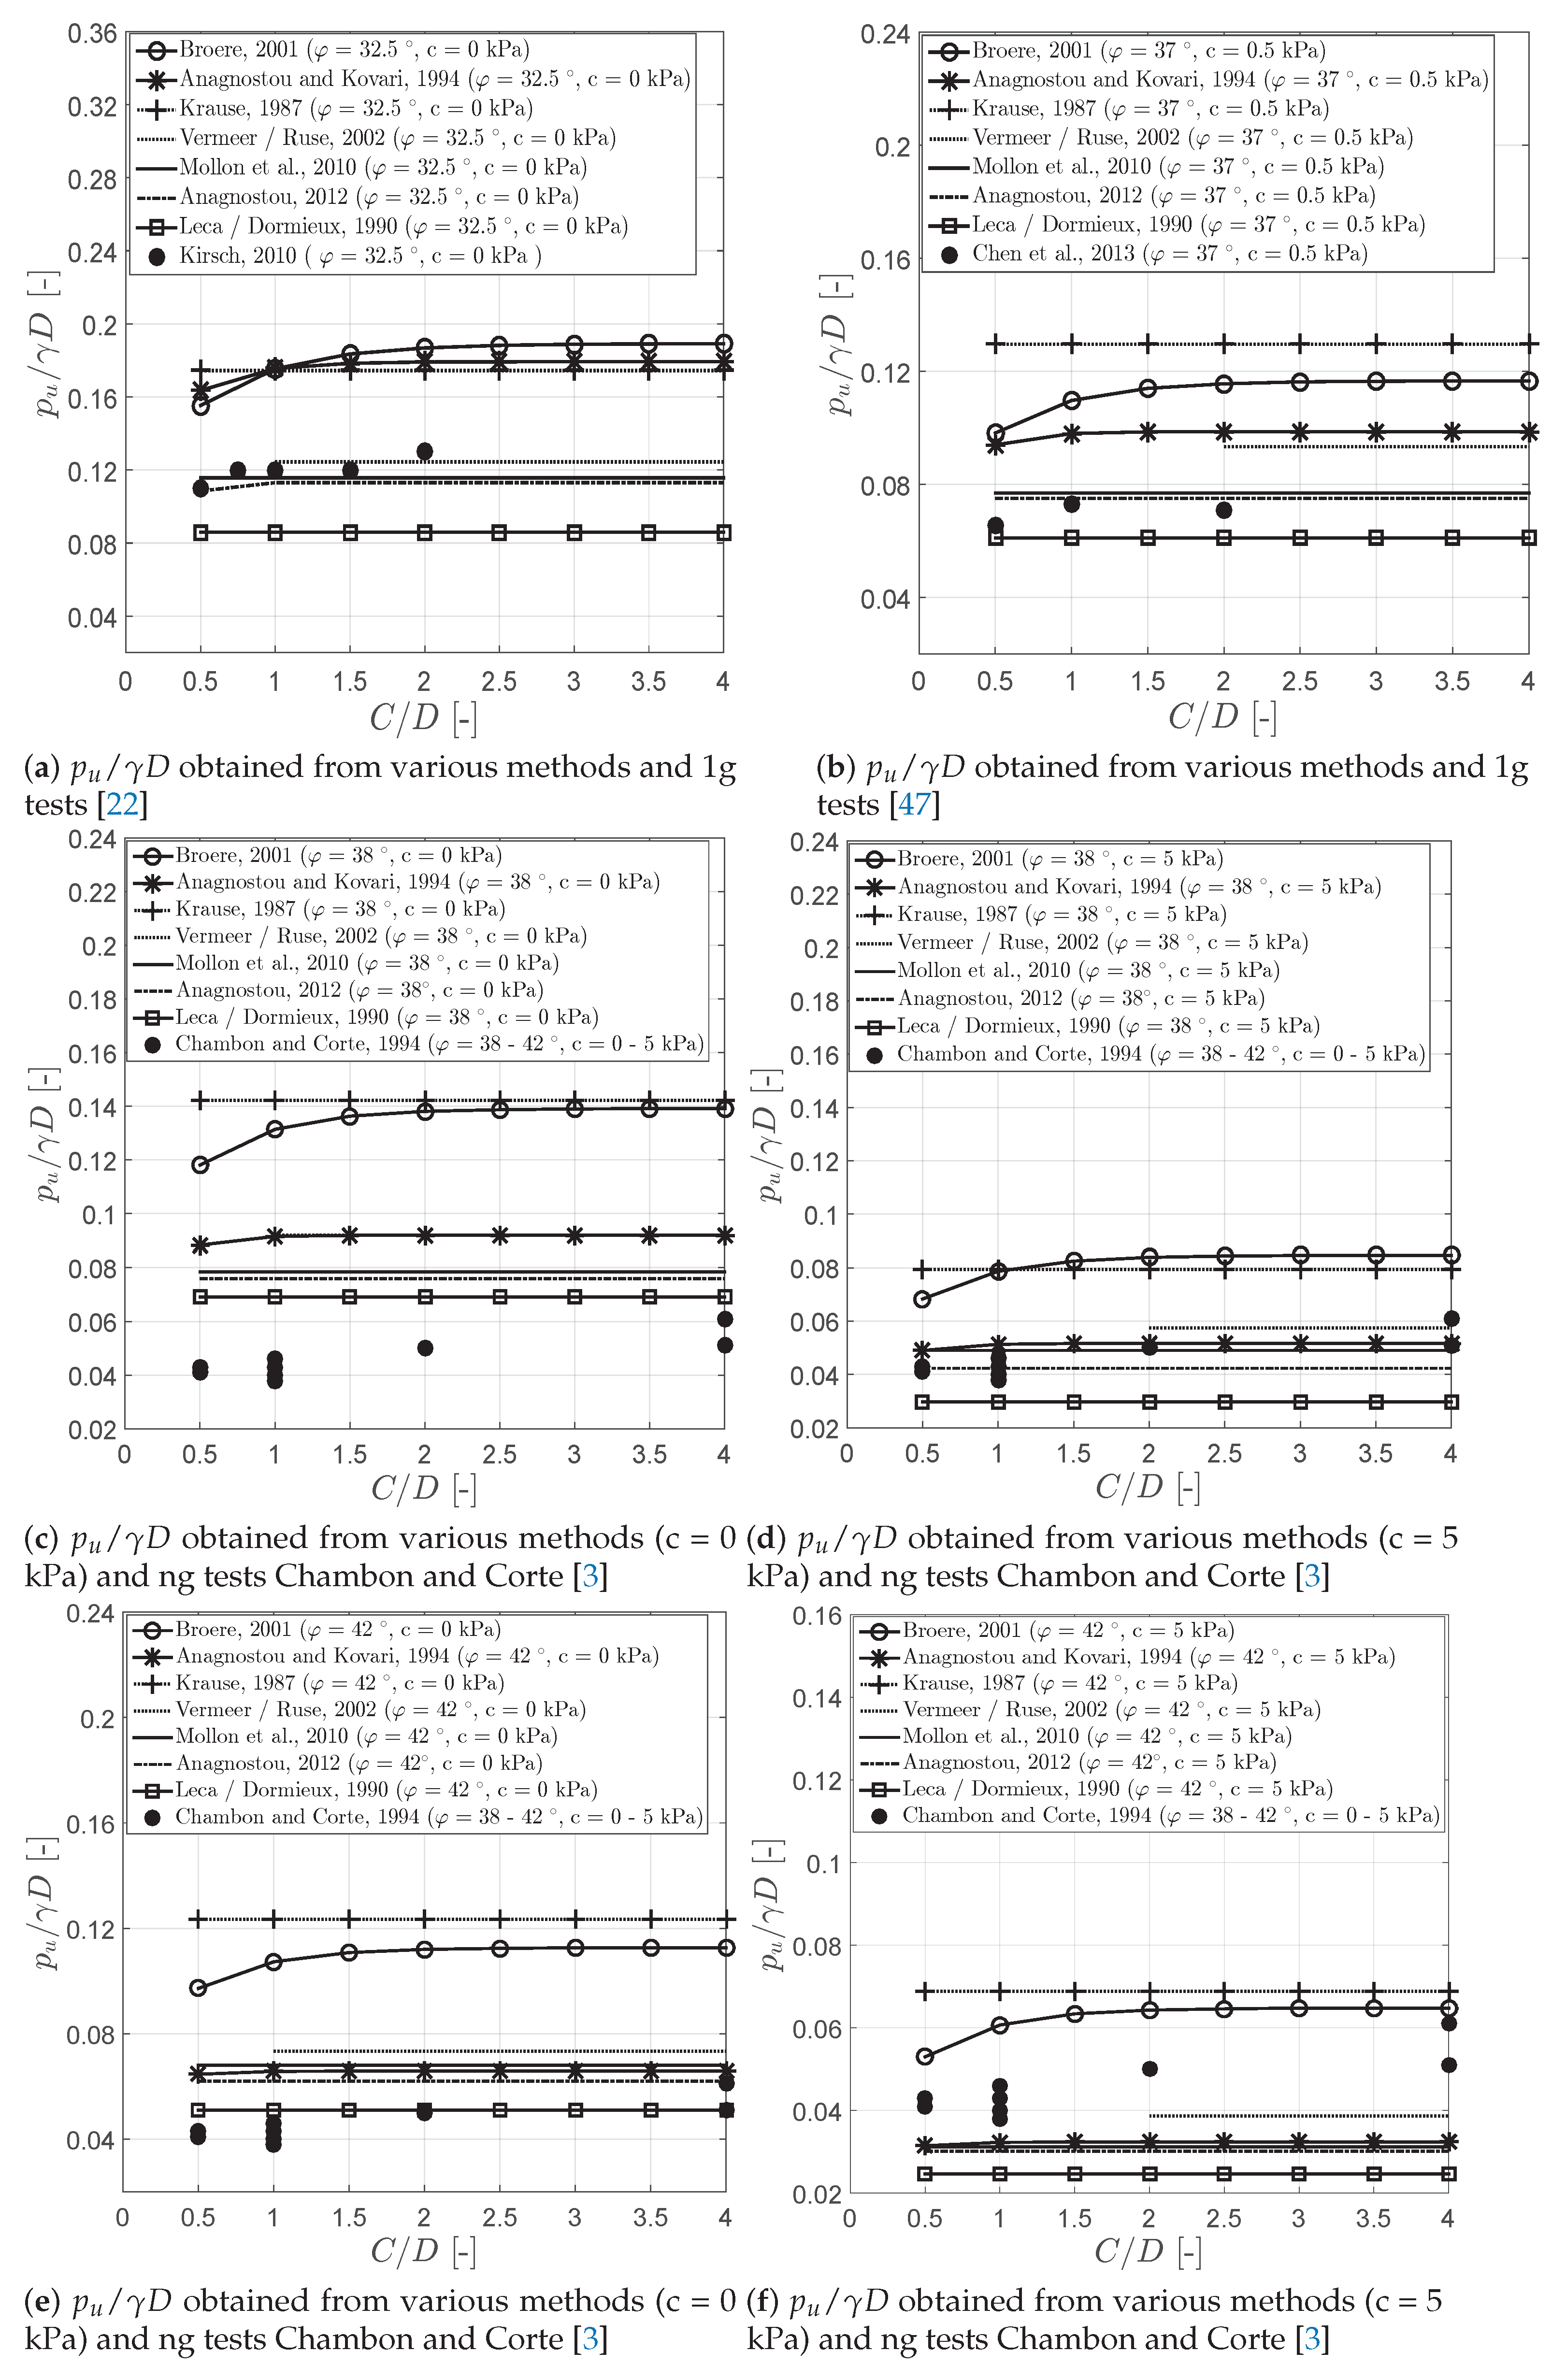
Three series of physical model tests from the literature have been chosen to verify the accuracy of selected models for predicting the minimum support pressure. The specifications of the physical model tests are summarized in Table 1.
The results of normalized support pressure obtained from Chambon and Corte [3], Kirsch [22] and Chen et al. [47] physical models are compared with the results of the wedge-silo models by Anagnostou and Kovari [7], Broere [8], Anagnostou [11], the upper bound solution by Mollon et al. [14], Leca and Dormieux [13], and the finite element method by Vermeer et al. [21]. The predicted results are shown in Figure 9a–f.
From Figure 9a we can see that the normalized support pressure obtained from 1 g tests of Kirsch [22] increases slightly with the increase in C/D ratio. This dependency of C/D ratio was also detected by Anagnostou and Kovari [7] and Broere [8] but is not revealed by Mollon et al. [14], Leca and Dormieux [13], Krause [31], Vermeer et al. [21] and Anagnostou [11]. Besides, the results obtained from Vermeer et al. [21], Mollon et al. [14] and Anagnostou [11] models agree very well with 1g tests of Kirsch [22] results, when the soil is cohesionless soil (c = 0 kPa). According to Figure 9b, we can also see that Leca and Dormieux [13], Mollon et al. [14] and Anagnostou [11] models show a good agreement with the results obtained by the 1g test results of Chen et al. [47] for friction-cohesive soil.
As shown in Figure 9c,e, the normalized pressure () obtained from ng tests of Chambon and Corte [3] are less than the results calculated by the seven stability models in cohesionless soil. However, if the cohesion is considered in the calculation of the pressure (c = 5 kPa), see Figure 9d,f, Leca and Dormieux [13], Anagnostou and Kovari [7], Vermeer et al. [21], Mollon et al. [14] and Anagnostou [11] predict the minimum support pressure much more closer to the 1g test results of Chambon and Corte [3]. Moreover, it can be seen that Anagnostou and Kovari [7], Broere [8], and Krause [31] relatively overestimate the () value compared to the results of Chambon and Corte [3], Kirsch [22] and Chen et al. [47].
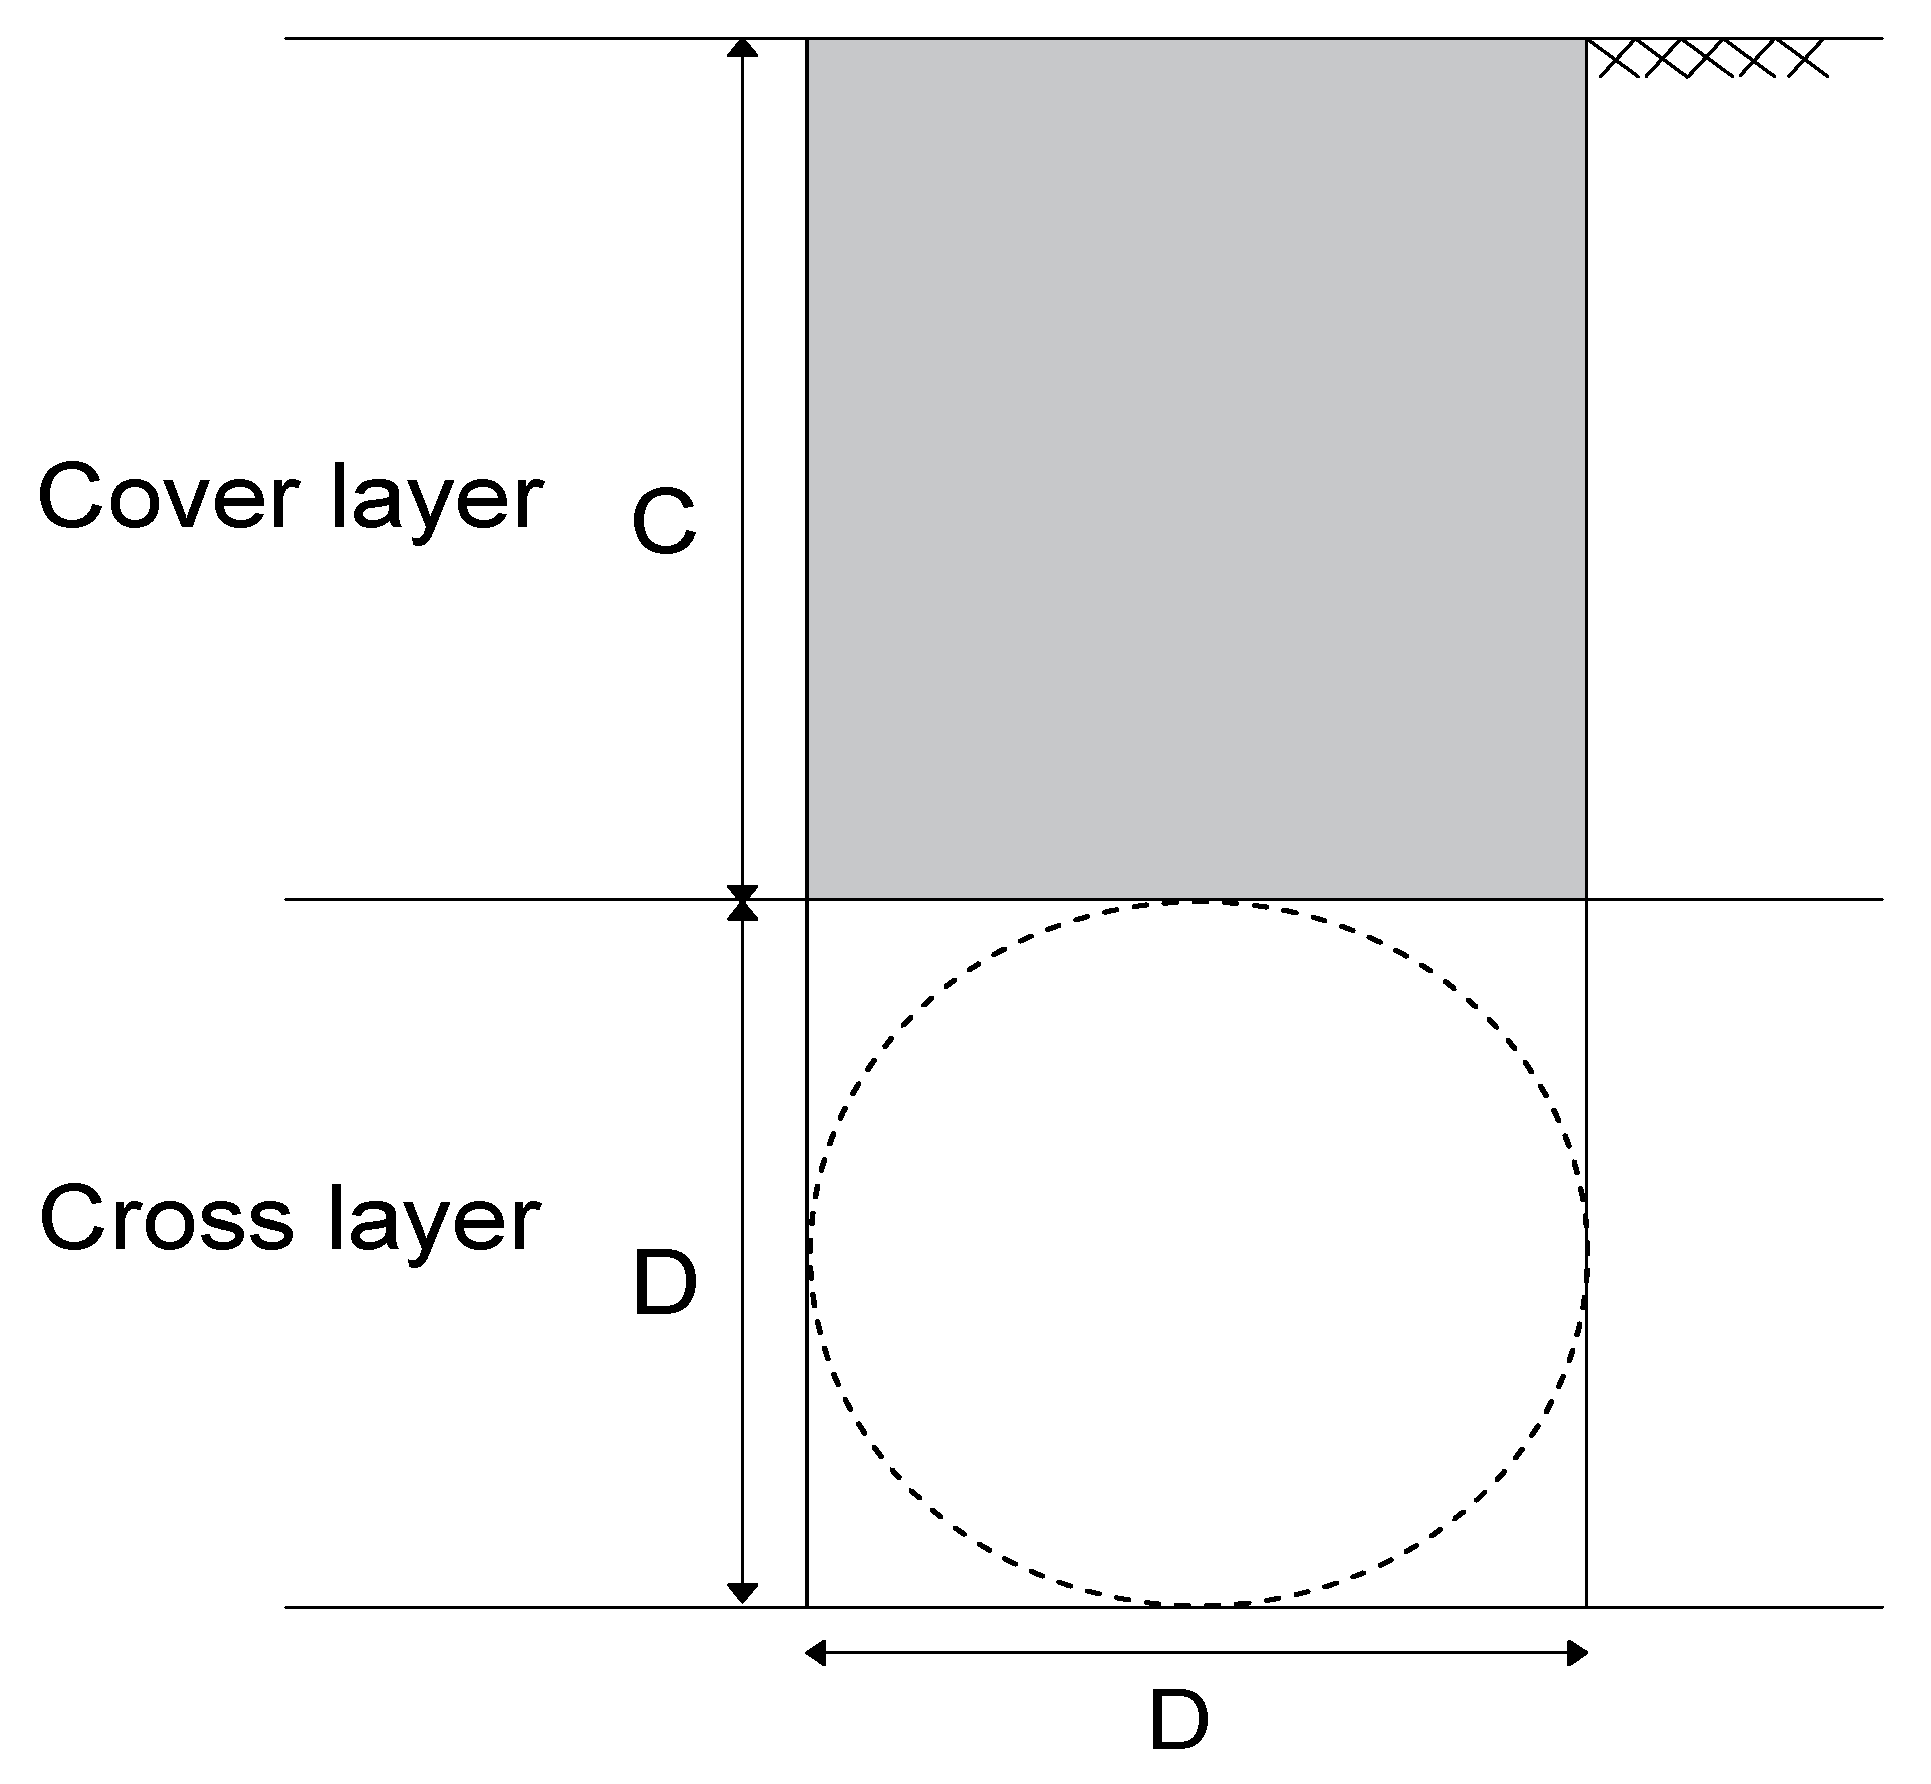
4.2. Layered Soil
In this section, the tunnel face stability in layered soils is investigated using different approaches; the model considers two layers (cover and cross layer) of the soil is shown in Figure 10. The cover and the cross layer are assumed to be located above the groundwater table. The soil strength parameters and geometry of the tunnel are described in Table 2.
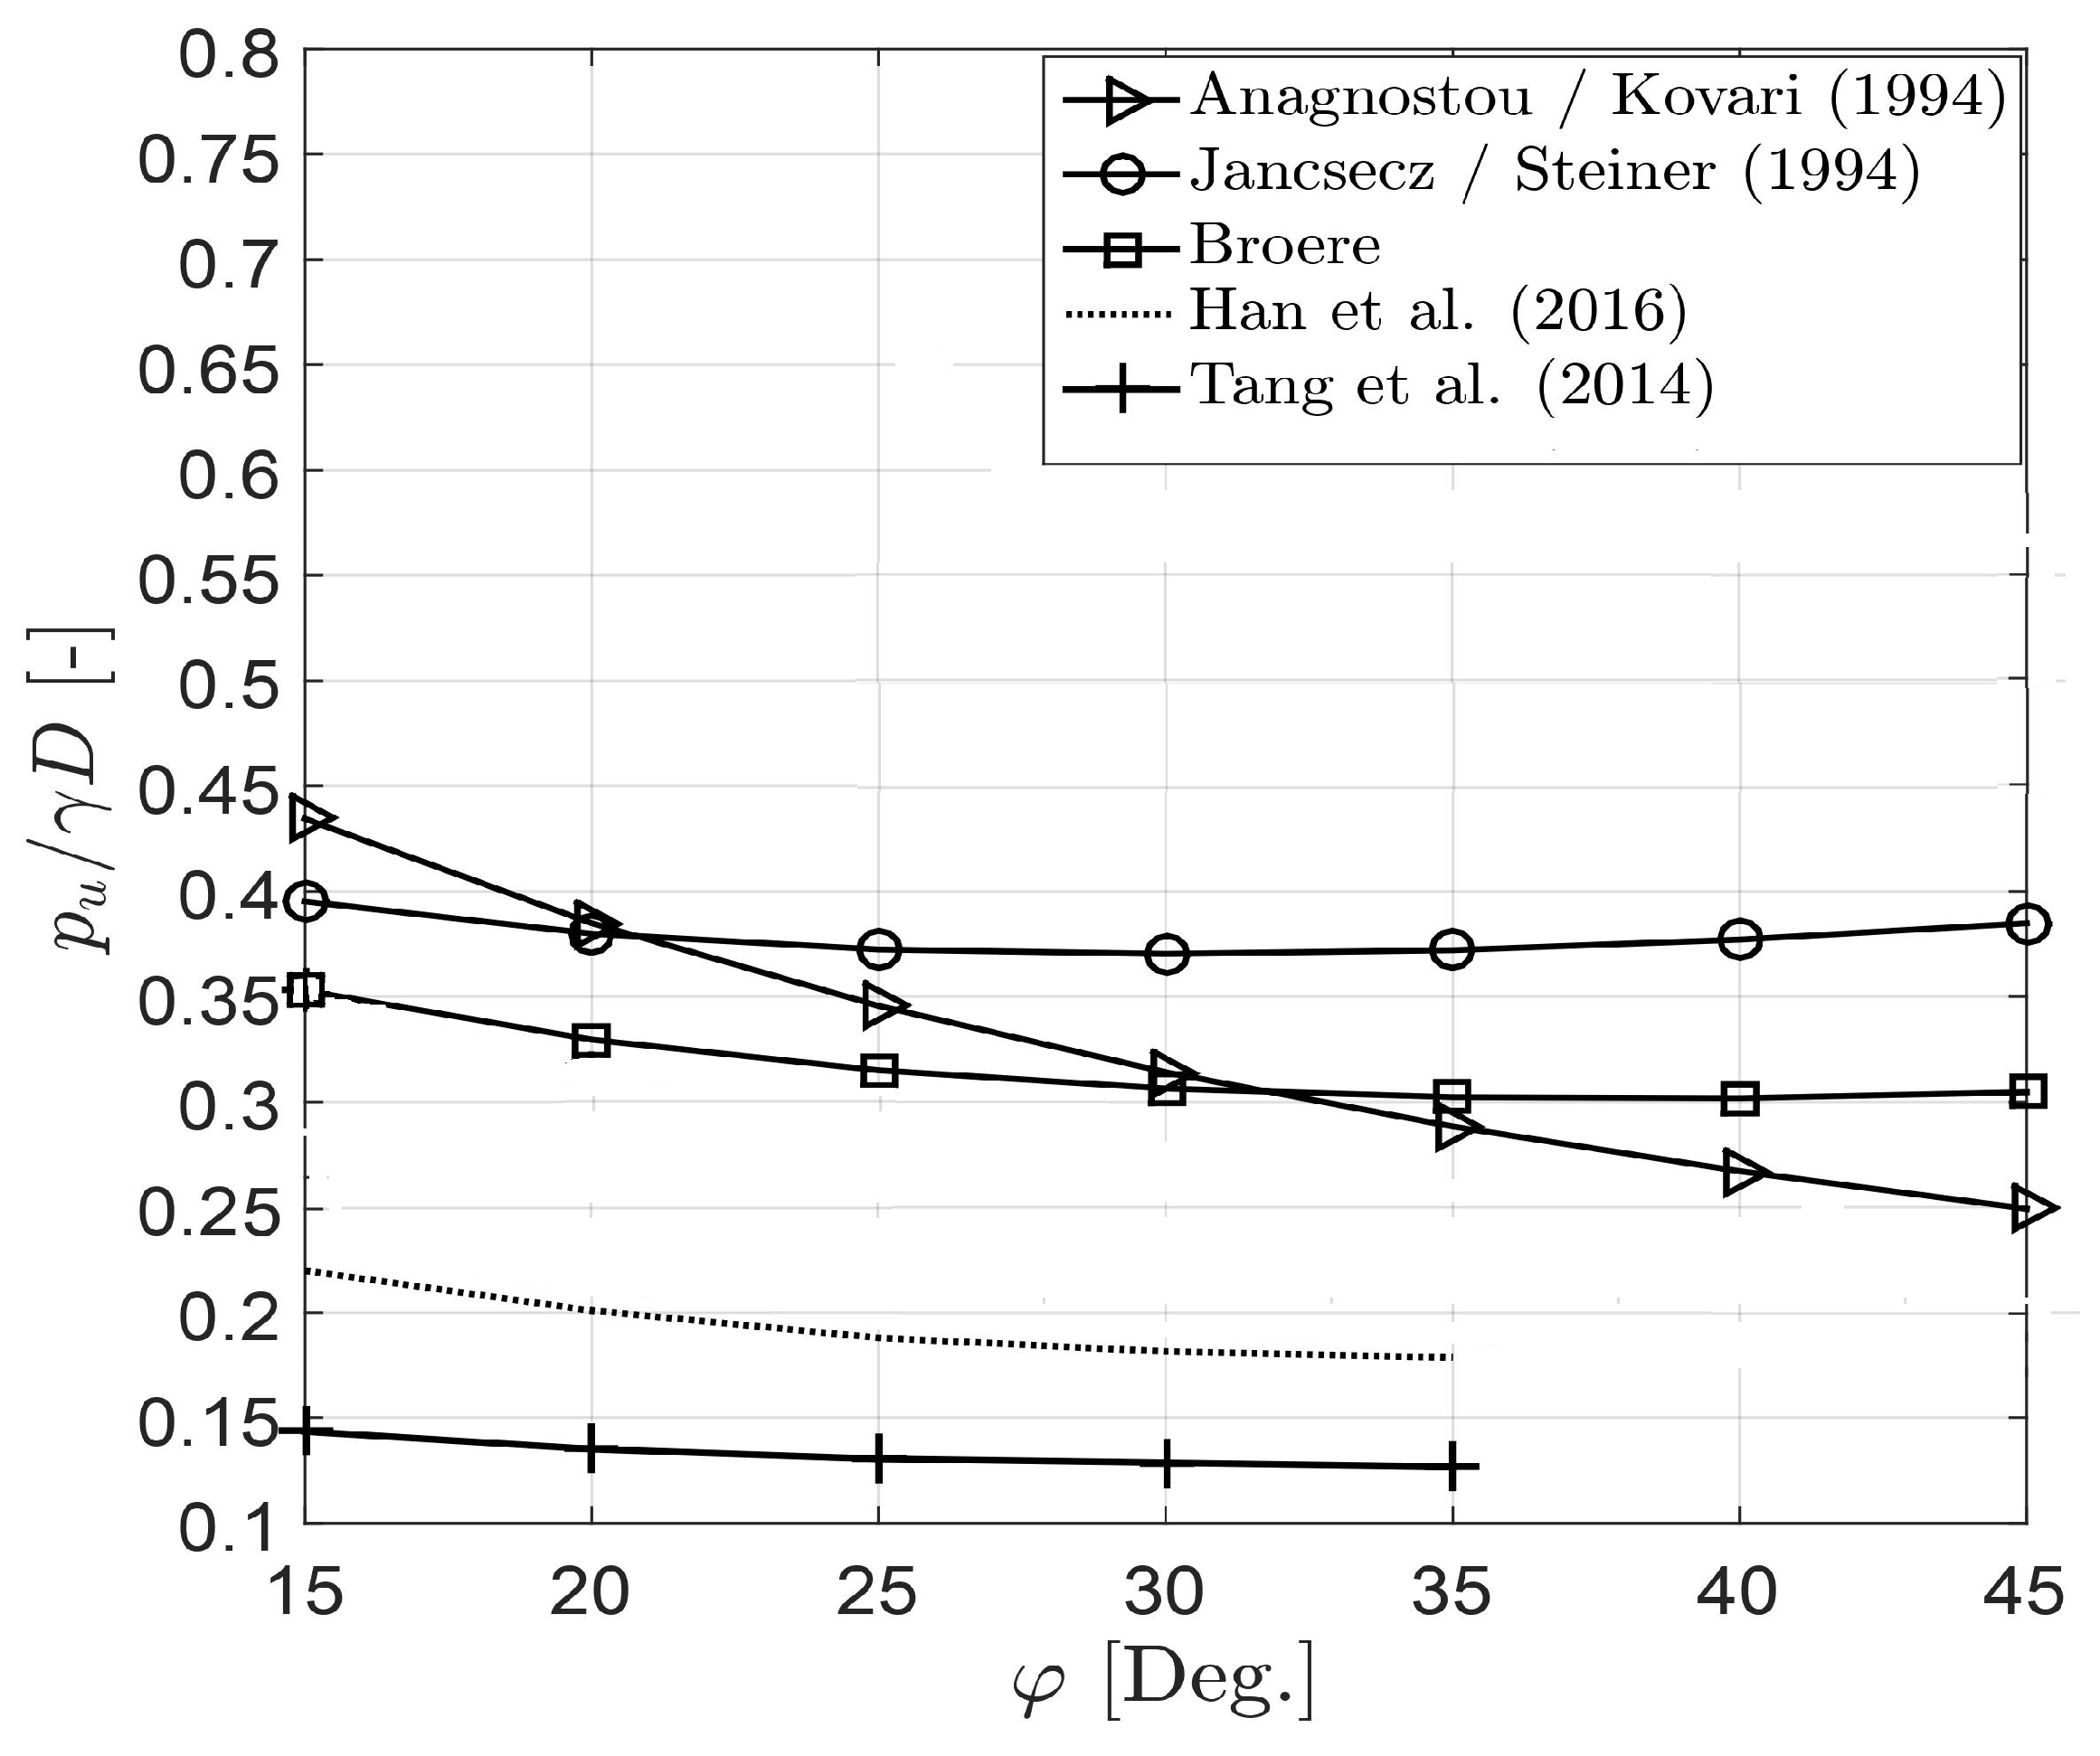
The effect of the soil parameters of the cover layer on the minimum support pressure is investigated by varying the friction angle of the cover layer, while the soil properties of the cross layer are kept constant. The variation of the normalized minimum support pressure with the friction angle of the cover layer is shown in Figure 11.
It is clear from Figure 11 that the results obtained from the different approaches are quite different. It can be noticed that the wedge-silo models (Jancsecz and Steiner [6]; Anagnostou and Kovari [7]; Broere [8]) give much larger support pressures than the limit analysis models (Tang et al. [15]; Han et al. [44]). The results of Han et al. [44] are above the results of Tang et al. [15]. This can be attributed to the fact that the 3D failure mechanism of Han et al. [44] is composed of five truncated cones which offer many more degrees of freedom. However, the failure mechanism assumed by Tang et al. [15] is composed of two cones proposed by Leca and Dormieux [13], which is restricted in the number of degrees of freedom.
Furthermore, it can be seen from Figure 11 that the minimum support pressure decreases with increasing friction angle in the case of the upper bound solution of Han et al. [44], Tang et al. [15] and the Anagnostou and Kovari [7] model. The steepest trend is predicted by the model of Anagnostou and Kovari [7]. Surprisingly, applying the solution of Broere [8], the minimum support pressure decreases up to a minimum value at before increasing again with further increase of . A similar trend is obtained from the approach of Jancsecz and Steiner [6]. In that case, the minimum support pressure decreases slightly to the minimum value at , while it increases subsequently.
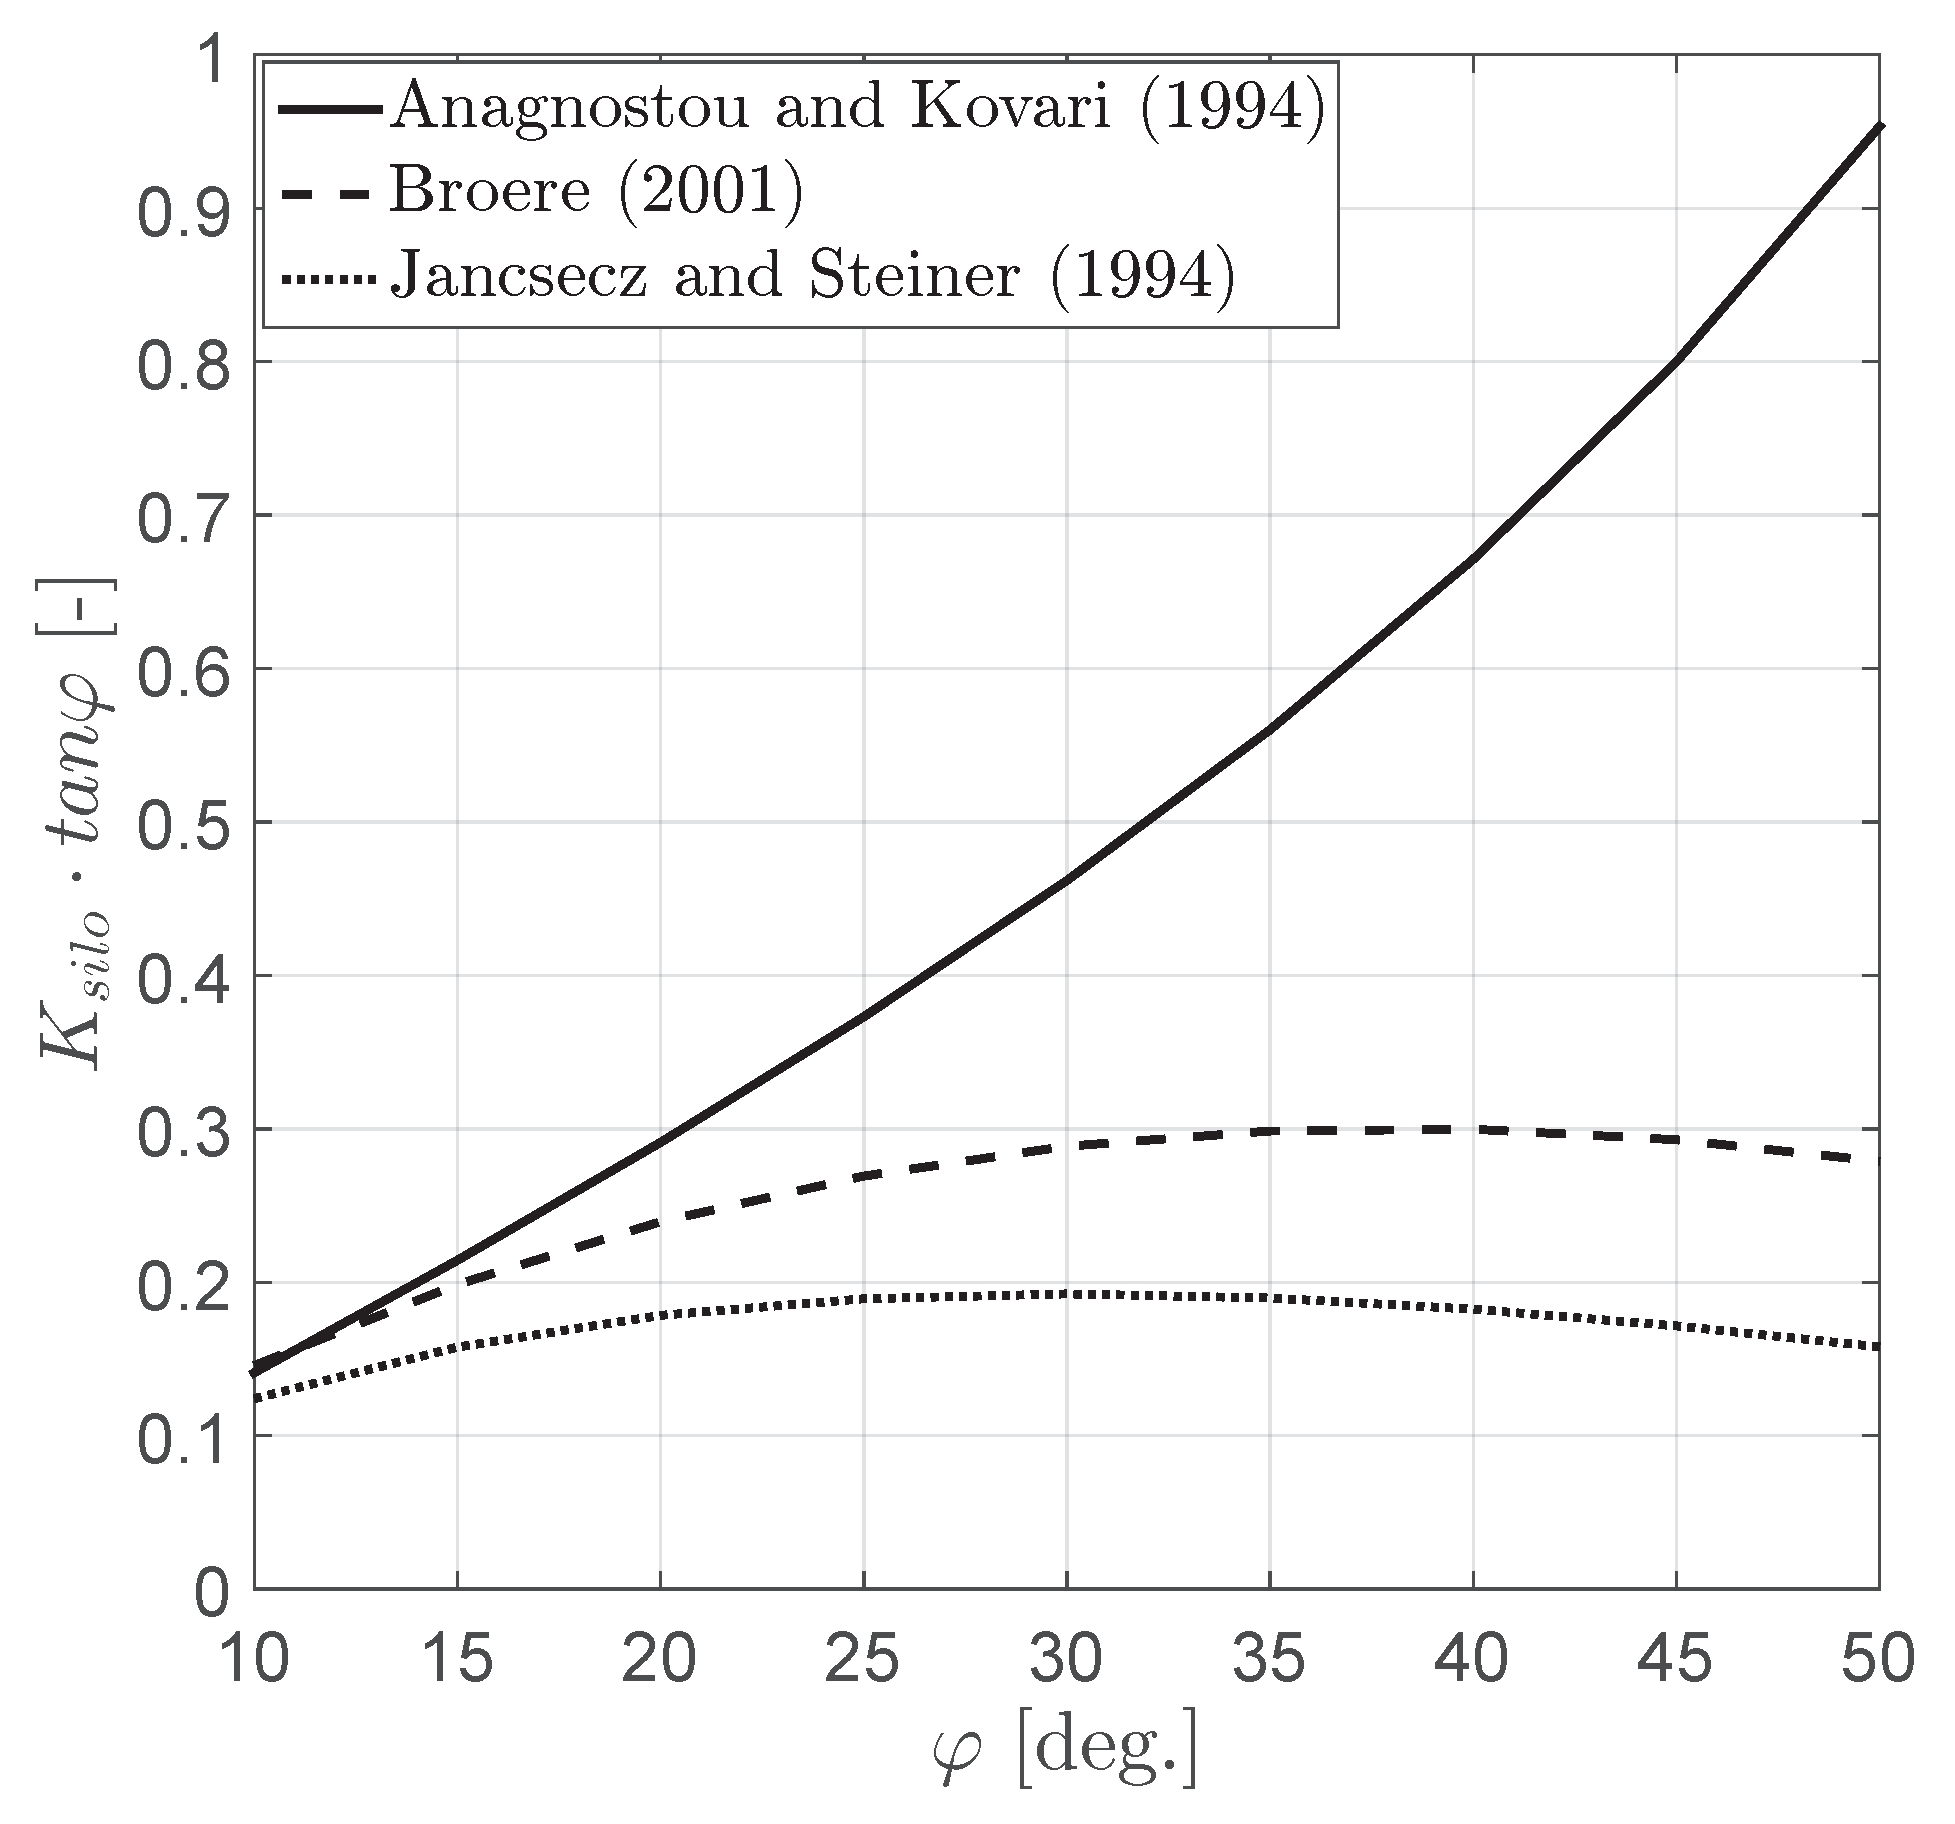
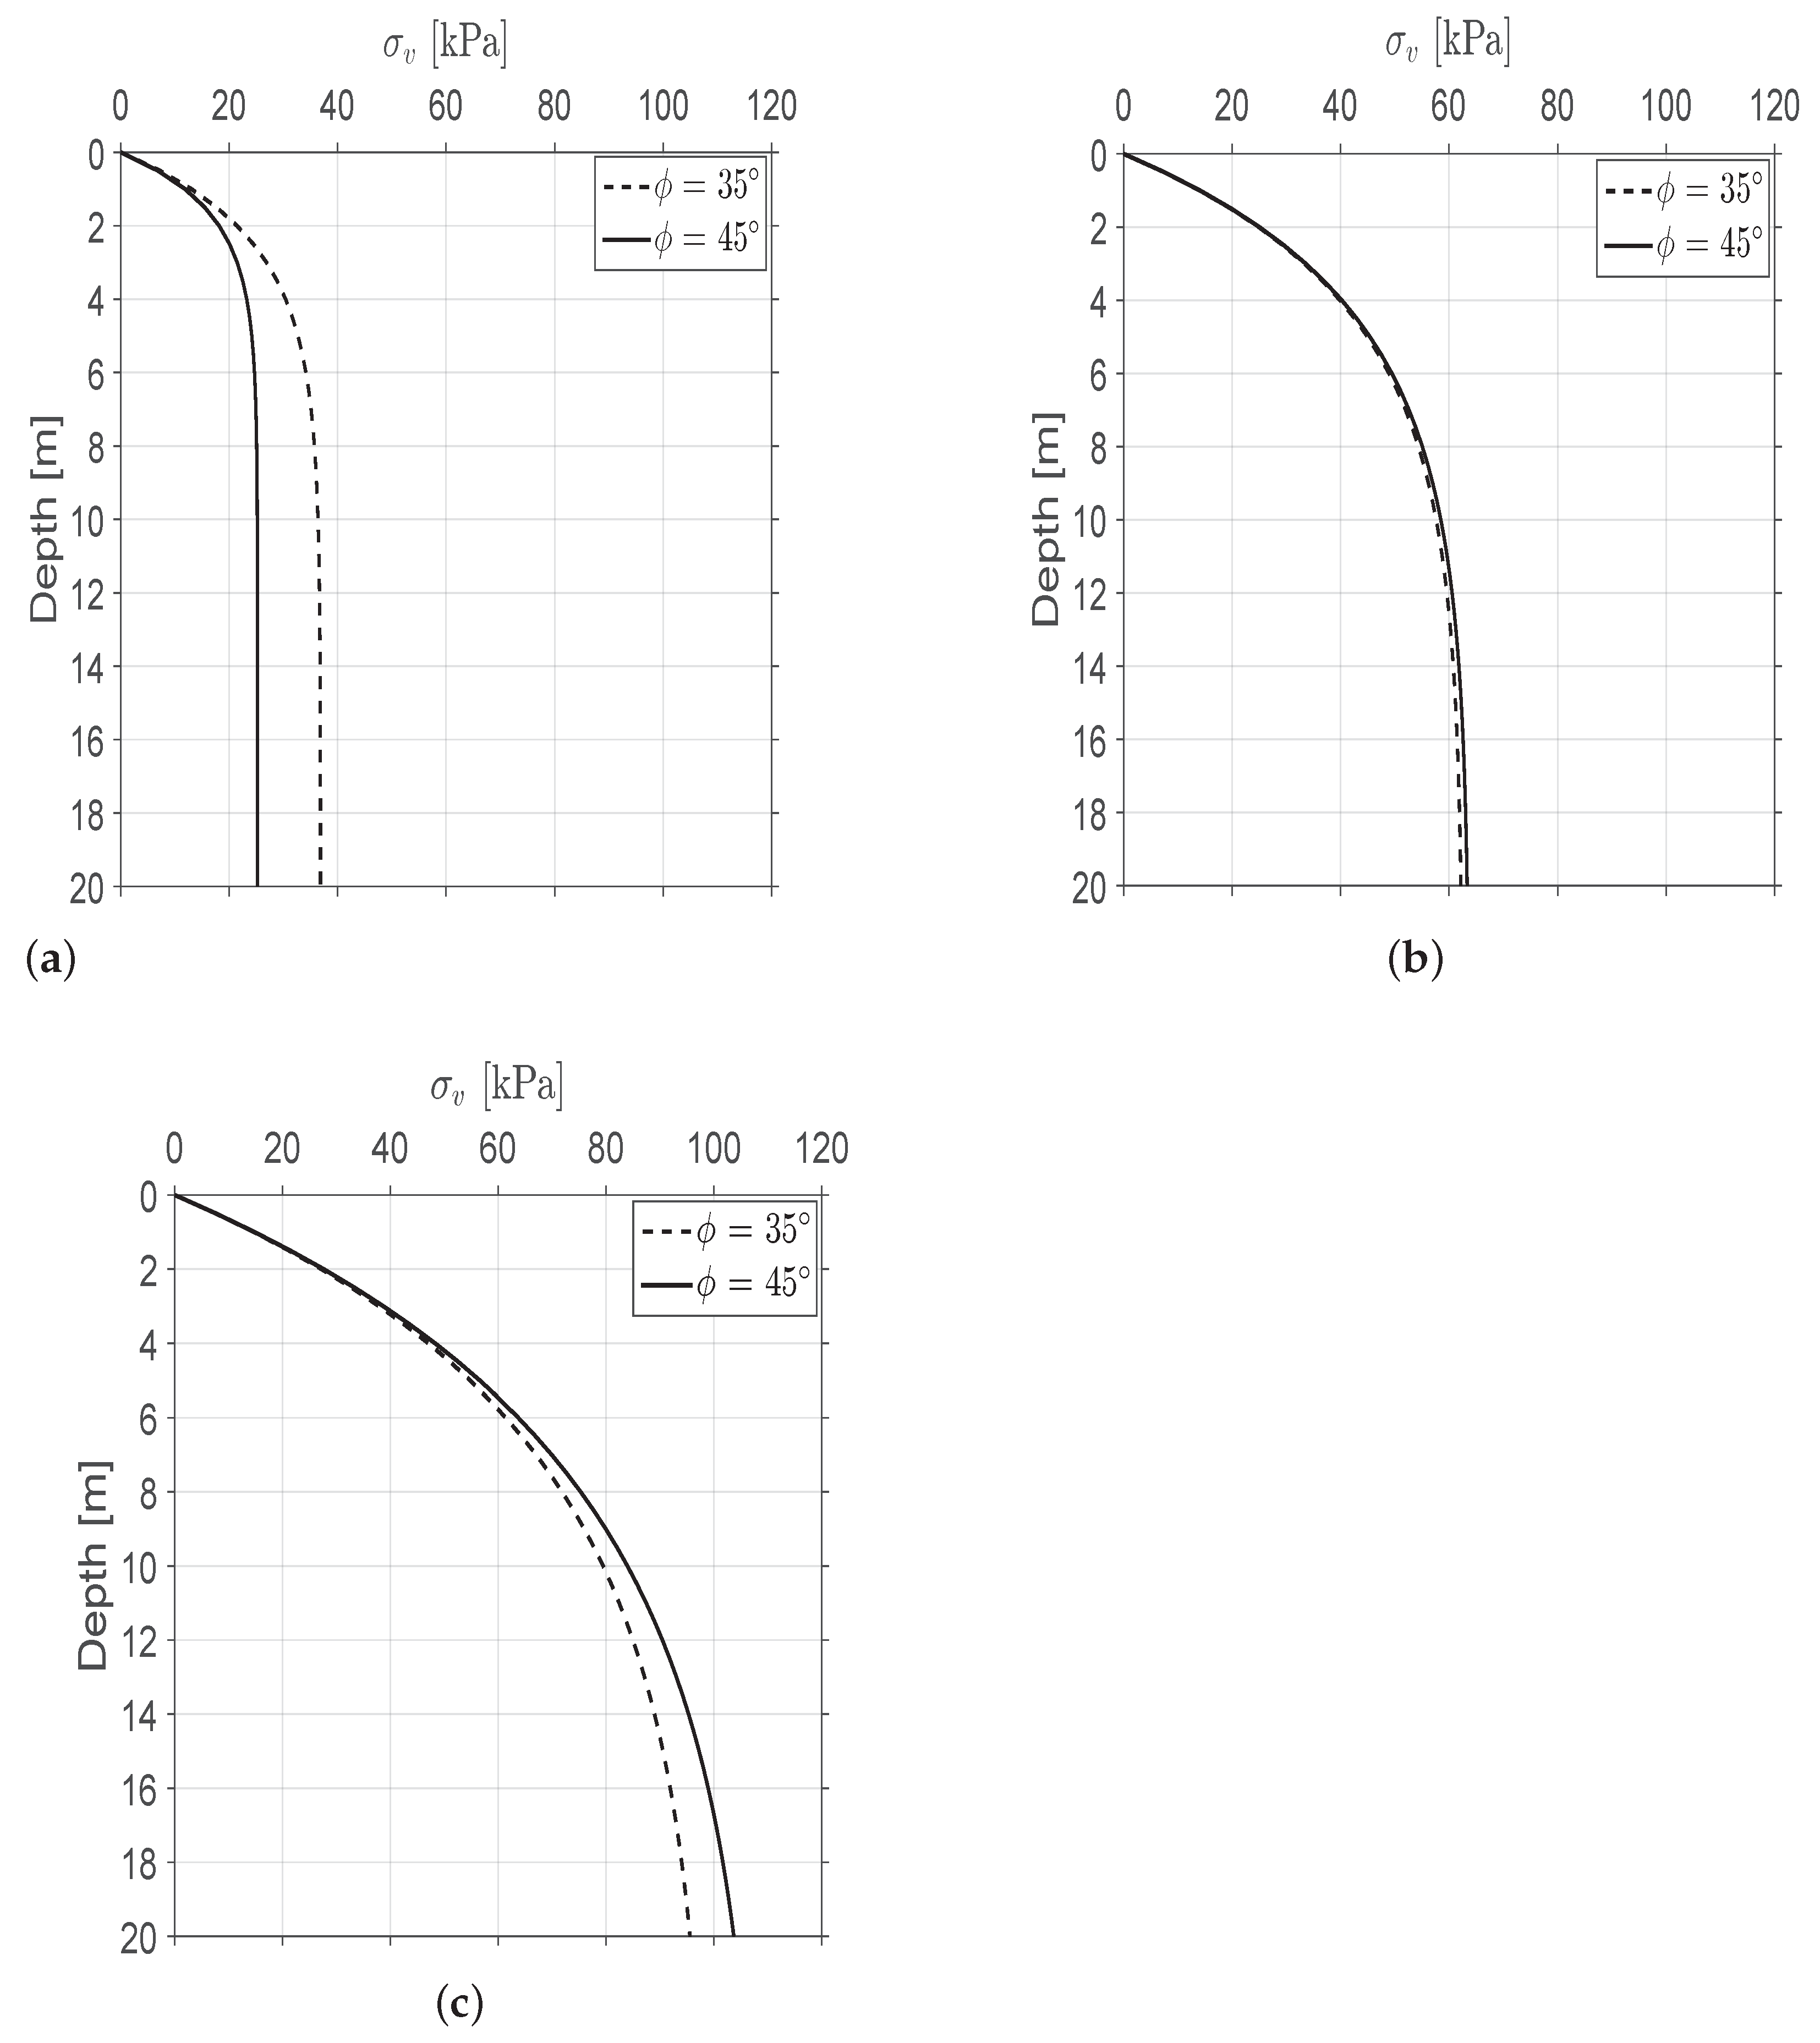
The trends of the support pressure predicted by the wedge-silo models (Jancsecz and Steiner [6]; Anagnostou and Kovari [7]; Broere [8]) can be explained as follows. From silo theory (Equation (1)), the value of vertical stress above the tunnel crown is mainly dependent on the value of (for the same soil strength parameters). For the model of Anagnostou and Kovari [7], this value will be , for the Broere [8] solution it will be (1-, and for the Jancsecz and Steiner [6] solution (. As shown in Figure 12, the value of in the solution of Anagnostou and Kovari [7] increases exponentially. According to the approach of Broere [8], the value of increases up to a maximum value of before it decreases again. The same trend is obtained for the equations of Jancsecz and Steiner [6], where the maximum value is reached at .
The effect of on the vertical stress distribution in the different model is shown in Figure 13. From those diagrams one it conclude that in the models of Jancsecz and Steiner [6] and Broere [8], the vertical stress for is close or slightly higher than that for at any depth. In contrast, in the approach of Anagnostou and Kovari [7], the vertical stress for is always higher than that for .
Based on the previous results, it can be concluded that for the set of soil parameters and geometry of the tunnel used in this study (see in Table 2) the approaches of Jancsecz and Steiner [6] and Broere [8] predict a trend of the minimum support pressure with friction angle which contradicts practical experience. The discrepancies between the support pressure predicted by the different approaches are obvious in Figure 11.
5. Conclusions
This paper presents a review of analytical models based either on the principle of limit equilibrium or the limiting analysis, which have both been used to analyze the stability of the tunnel face for dry frictional and frictional-cohesive soil. The following main conclusions can be drawn:
- 1.
- To use Janssen’s solution in the wedge-silo model, it is required to have explicit value for the lateral earth pressure coefficient of the silo. However, the advised values of it vary in a wide range. Due to this, the face support pressures calculated by the existing wedge-silo models are quite different. So, the question about the proper value for the lateral earth pressure remains unanswered.
- 2.
- According to the results of comparative calculations, the wedge-silo models give higher support pressure than conical block models, but the differences in the two methods for the prediction of the support pressure are small for higher friction angles.
- 3.
- Comparing the results of physical model tests to the results of Anagnostou and Kovari [7] and Broere [8] models, indicating that both models are relatively conservative models for estimating the minimum support pressure. The results obtained from Vermeer et al. [21], Mollon et al. [14], and Anagnostou [11] models show a good agreement with those of the experiments. However, comparing to the experiments results, the upper bound solutions proposed by Leca and Dormieux [13] underestimate the minimum support pressure especially when soil is cohesionless.
- 4.
- The solution of the limit equilibrium method revealed that the cover to diameter ratio has significant influence on the minimum support pressure. This effect is also deduced by Chen et al. [4] and Chambon and Corte [3], whereas the solution of the upper bound theorem for the minimum support pressure is only independent, when the failure mechanism of the upper bound theorem does not intersect at the ground surface in a certain soil condition (e.g., C/D 1), this outcome has also been reported by Vermeer et al. [21].
- 5.
- In the case of a ground composed of two soil layers, the minimum support pressure obtained from wedge-silo models is higher than that predicted by the upper bound solution. In addition, the discrepancies in the results between the support pressure predicted by the different models are obvious.
- 6.
- Finally, the analytical approaches such as the Limit Equilibrium Method (LEM) and Limiting Analysis Method (LAM) are used to assess the stability of the tunnel face assuming various failure mechanisms. However, the results are quite different. Therefore, there are still considerable potential efforts for calculating the support pressure more accurately.
Author Contributions
Conceptualization, M.Q.; methodology, D.K.; software, M.Q.; validation, M.Q., D.K. and T.W.; formal analysis, M.Q.; investigation, M.Q. and D.K.; resources, M.Q. and D.K.; data curation, M.Q. and D.K.; writing—original draft preparation, M.Q., D.K. and T.W.; writing—review and editing, M.Q., D.K. and T.W.; visualization, M.Q.; supervision, T.W.; project administration, D.K.; funding acquisition, T.W. All authors have read and agreed to the published version of the manuscript.
Funding
This research received no external funding.
Data Availability Statement
Not applicable.
Conflicts of Interest
The authors declare no conflict of interest.
References
- Terzaghi, K. Theoretical Soil Geomechanics; Wiley and Sons: New York, NY, USA, 1943. [Google Scholar]
- Terzaghi, K. Stress distribution in dry and saturated sand above a yielding trap-door. In Proceedings of the First International Conference on Soil Mechanics and Foundation Engineering, Cambridge, MA, USA, 1 August 1936; pp. 307–311. [Google Scholar]
- Chambon, P.; Corte, J. Shallow Tunnels in Cohesionless Soil: Stability of Tunnel Face. J. Geotech. Eng. 1994, 120, 1148–1165. [Google Scholar] [CrossRef]
- Chen, R.P.; Tang, L.J.; Ling, D.S.; Chen, Y.M. Face stability analysis of shallow shield tunnels in dry sandy ground using the discrete element method. Comput. Geotech. 2011, 38, 187–195. [Google Scholar] [CrossRef]
- Horn, N. Horizontaler Erddruck auf senkrechte Abschlussflächen von Tunnelröhren. In Proceedings of the National Conference of the Hungarian Civil Engineering Industry, Budapest, Hungary, 18–21 June 1961; pp. 7–16. [Google Scholar]
- Jancsecz, S.; Steiner, W. Face support for a large mix-shield in heterogeneous ground conditions. In Proceedings of the 7th International Symposium Tunnelling, London, UK, 12 June 1994; pp. 189–195. [Google Scholar]
- Anagnostou, G.; Kovari, K. The face stability of slurry-shield-driven tunnels. Tunn. Undergr. Space Technol. 1994, 9, 165–174. [Google Scholar] [CrossRef]
- Broere, W. Tunnel Face Stability and New CPT Application. Ph.D. Thesis, Delft University, Delft, The Netherlands, 2001. [Google Scholar]
- Kirsch, A.; Kolymbas, D. Theoretische Untersuchung zur Ortsbruststabilität. Bautechnik 2005, 82, 449–456. [Google Scholar] [CrossRef]
- Chen, R.P.; Tang, L.J.; Yin, X.S.; Chen, Y.M.; Bian, X.C. An improved 3D wedge prism model for the face stability analysis of the shield tunnel in cohesionless soils. Acta Geotech. 2015, 10, 683–692. [Google Scholar] [CrossRef]
- Anagnostou, G. The contribution of horizontal arching to tunnel face stability. Geotechnik 2012, 35, 34–44. [Google Scholar] [CrossRef]
- Chen, W.F. Limit Analysis and Soil Plasticity; Elsevier Scientific Publishing Company: London, UK, 1975. [Google Scholar]
- Leca, E.; Dormieux, L. Upper and lower bound solutions for the face stability of shallow circular tunnels in frictional material. Geotechnik 1990, 40, 581–606. [Google Scholar] [CrossRef] [Green Version]
- Mollon, G.; Dias, D.; Soubra, A.H. Face stability analysis of circular tunnels driven by a pressurized shield. J. Geotech. Geoenviron. Eng. 2010, 136, 215–229. [Google Scholar] [CrossRef] [Green Version]
- Tang, W.; Liu, W.; Albers, B.; Savidis, S. Upper bound analysis of tunnel face stability in layered soils. Acta Geotech. 2014, 9, 661–671. [Google Scholar] [CrossRef]
- Ibrahim, E.; Soubra, A.H.; Mollon, G.; Raphael, W.; Dias, D.; Reda, A. Three-dimensional face stability analysis of pressurized tunnels driven in a multilayered purely frictional medium. Tunn. Undergr. Space Technol. 2015, 49, 18–34. [Google Scholar] [CrossRef]
- Zou, J.; Chen, G.; Qian, Z.T. Tunnel face stability in cohesion-frictional soils considering the soil arching effect by improved failure models. Comput. Geotech. 2019, 25, 526–542. [Google Scholar] [CrossRef]
- Li, W.; Zhang, C. Face Stability Analysis for a Shield Tunnel in Anisotropic Sands. Int. J. Geomech. 2020, 20, 04020043. [Google Scholar] [CrossRef]
- Peila, D. A theoretical study of reinforcement influence on the stability of a tunnel face. Geotech. Geol. Eng. 1994, 12, 145–168. [Google Scholar] [CrossRef]
- Ohta, T.; Kiya, H. Experimental Study and Numerical Analysis on Stability of Tunnel Face in Sandy Ground; ISRM International Symposium: Tokye, Japan, 2001. [Google Scholar]
- Vermeer, P.A.; Ruse, N.M.; Marcher, T. Tunnel heading stability in drained ground. Felsbau 2002, 20, 8–18. [Google Scholar]
- Kirsch, A. On the Face Stability of Shallow Tunnels in Sand; Logos Verlag Berlin GmbH: Berlin, Germany, 2009. [Google Scholar]
- Qarmout, M.; König, D.; Gussmann, P.; Thewes, M.; Schanz, T. Tunnel face stability analysis using Kinematical Element Method. Tunn. Undergr. Space Technol. 2019, 85, 354–367. [Google Scholar] [CrossRef]
- Qarmout, M.; Schmüdderich, C.; König, D.; Thewes, M.; Wichtmann, T. Face stability of a circular tunnel excavated in dry frictional- cohesive soil. In Proceedings of the ETS Tunnelling and Underground Construction Conference & Exhibition, Luxor, Egypt, 3–5 December 2019. [Google Scholar]
- Takano, D.; Otani, J.; Nagatani, H.; Mukunoki, T. Application of X-ray CT Boundary Value Problems in Geotechnical Engineering-Research on Tunnel Face Failure; ASCE: Reston, VA, USA, 2006; pp. 1–6. [Google Scholar]
- Idinger, G.; Aklik, P.; Wu, W.; Borja, R. Centrifuge model test on the face stability of shallow tunnel. Acta Geotech. 2011, 6, 105–117. [Google Scholar] [CrossRef] [Green Version]
- Lü, X.; Zhou, Y.; Huang, M.; Zeng, S. Experimental study of the face stability of shield tunnel in sands under seepage condition. Tunn. Undergr. Space Technol. 2018, 74, 195–205. [Google Scholar] [CrossRef]
- Janssen, H. Versuche uber Getreidedruck in Silozellen. Z. Des Vereines Dtsch. Ingenieure 1895, 39, 1045–1049. [Google Scholar]
- Jaky, J. The coefficient of earth pressure at rest. J. Soc. Hung. Archit. Eng. 1944, 78, 355–358. [Google Scholar]
- Walz, B.; Prager, J. Der Nachweis der äusseren Standsicherheit suspensionsgestützter Erdwände nach der Elementscheibentheorie. In VerÖffentlichungen des Grundbauinstitutes der Technischen Universität Berlin; Grundbauinst Technology University: Berlin, Germany, 1978. [Google Scholar]
- Krause, T. Schildvortrieb Mit flüssigkeits und Erdgestützter Ortsbrust. Ph.D. Thesis, Delft University, Delft, The Netherlands, 1987. [Google Scholar]
- Perazzelli, P.; Leone, T.; Anagnostou, G. Tunnel face stability under seepage flow conditions. Tunn. Undergr. Space Technol. 2014, 43, 459–469. [Google Scholar] [CrossRef]
- Zingg, S.; Anagnostou, G. An investigation into efficient drainage layouts for the stabilization of tunnel faces in homogeneous ground. Tunn. Undergr. Space Technol. 2016, 58, 49–73. [Google Scholar] [CrossRef]
- Anagnostou, G.; Perazzelli, P. Analysis method and design charts for bolt reinforcement of the tunnel face in cohesive-frictional soils. Tunn. Undergr. Space Technol. 2015, 74, 162–181. [Google Scholar] [CrossRef]
- Anagnostou, G.; Serafeimidis, K. The dimensioning of tunnel face reinforcement. In Proceedings of the ITA-AITES World Tunnel Congress, Prague, Czech Republic, 5–10 May 2007; Volume 1, pp. 291–296. [Google Scholar]
- Dias, T.; Bezuijen, A. A Different View on TBM Face Equilibrium in Permeable Ground; ITA World Tunnel Congress-Uniting an Industry: San Francisco, CA, USA, 2016. [Google Scholar]
- Broere, W. Influence of Infiltration and Groundwater Flow on Tunnel Face Stability; Geotechnical Aspects of Underground Construction in Soft Ground: Tokyo, Japan, 2000; pp. 339–344. [Google Scholar]
- Drucker, D.; Greenberg, W.; Prager, W. The safety factor of an elastic plastic body in plane strain. Trans. ASME J. Appl. Mech. 1951, 73, 371–378. [Google Scholar] [CrossRef]
- Zhang, C.P.; Han, K.H.; Zhang, D.L. Face stability analysis of shallow circular tunnels in cohesive—Frictional soils. Tunn. Undergr. Space Technol. 2015, 50, 345–357. [Google Scholar] [CrossRef]
- Li, W.; Zhang, C.; Zhang, D.; Ye, Z.; Tan, Z. Face stability of shield tunnels considering a kinematically admissible velocity field of soil arching. J. Rock Mech. Geotech. Eng. 2021. [Google Scholar] [CrossRef]
- Senent, S.; Jimenez, R. A tunnel face failure mechanism for layered ground, considering the possibility of partial collapse. Tunn. Undergr. Space Technol. 2015, 47, 182–192. [Google Scholar] [CrossRef]
- Khezri, N.; Mohamad, H.; Hassani, M.; Fatahi, B. The stability of shallow circular tunnels in soil considering variations in cohesion with depth. Tunn. Undergr. Space Technol. 2015, 49, 230–240. [Google Scholar] [CrossRef]
- Pan, Q.J.; Dias, D. Face Stability Analysis for a Shield-Driven Tunnel in Anisotropic and Nonhomogeneous Soils by the Kinematical Approach. Int. J. Geomech. 2016, 16. [Google Scholar] [CrossRef]
- Han, K.; Zhang, C.; Zhang, D. Upper-bound solutions for the face stability of a shield tunnel in multilayered cohesive-frictional soils. Comput. Geotech. 2016, 79, 1–9. [Google Scholar] [CrossRef]
- Lee, M.; Nam, W. Effect of tunnel advance rate on seepage forces acting on the underwater tunnel face. Tunn. Undergr. Space Technol. 2004, 19, 273–281. [Google Scholar] [CrossRef]
- Pan, Q.J.; Dias, D. The effect of pore water pressure on tunnel face stability. Int. J. Numer. Anal. Meth. Geomech. 2016, 40, 2123–2136. [Google Scholar] [CrossRef]
- Chen, R.P.; Li, J.; Kong, L.G.; Tang, L.J. Experimental study on face instability of shield tunnel in sand. Tunn. Undergr. Space Technol. 2013, 33, 12–21. [Google Scholar] [CrossRef]
Figure 1.
3D limit equilibrium model (a) Horn’s failure mechanism (b) Forces acting on the wedge (c) A strip of soil in arching silo.
Figure 1.
3D limit equilibrium model (a) Horn’s failure mechanism (b) Forces acting on the wedge (c) A strip of soil in arching silo.

Figure 2.
and for different friction angles assumed by various approaches (a) Variation of with friction angle (b) Variation of with friction angle.
Figure 2.
and for different friction angles assumed by various approaches (a) Variation of with friction angle (b) Variation of with friction angle.

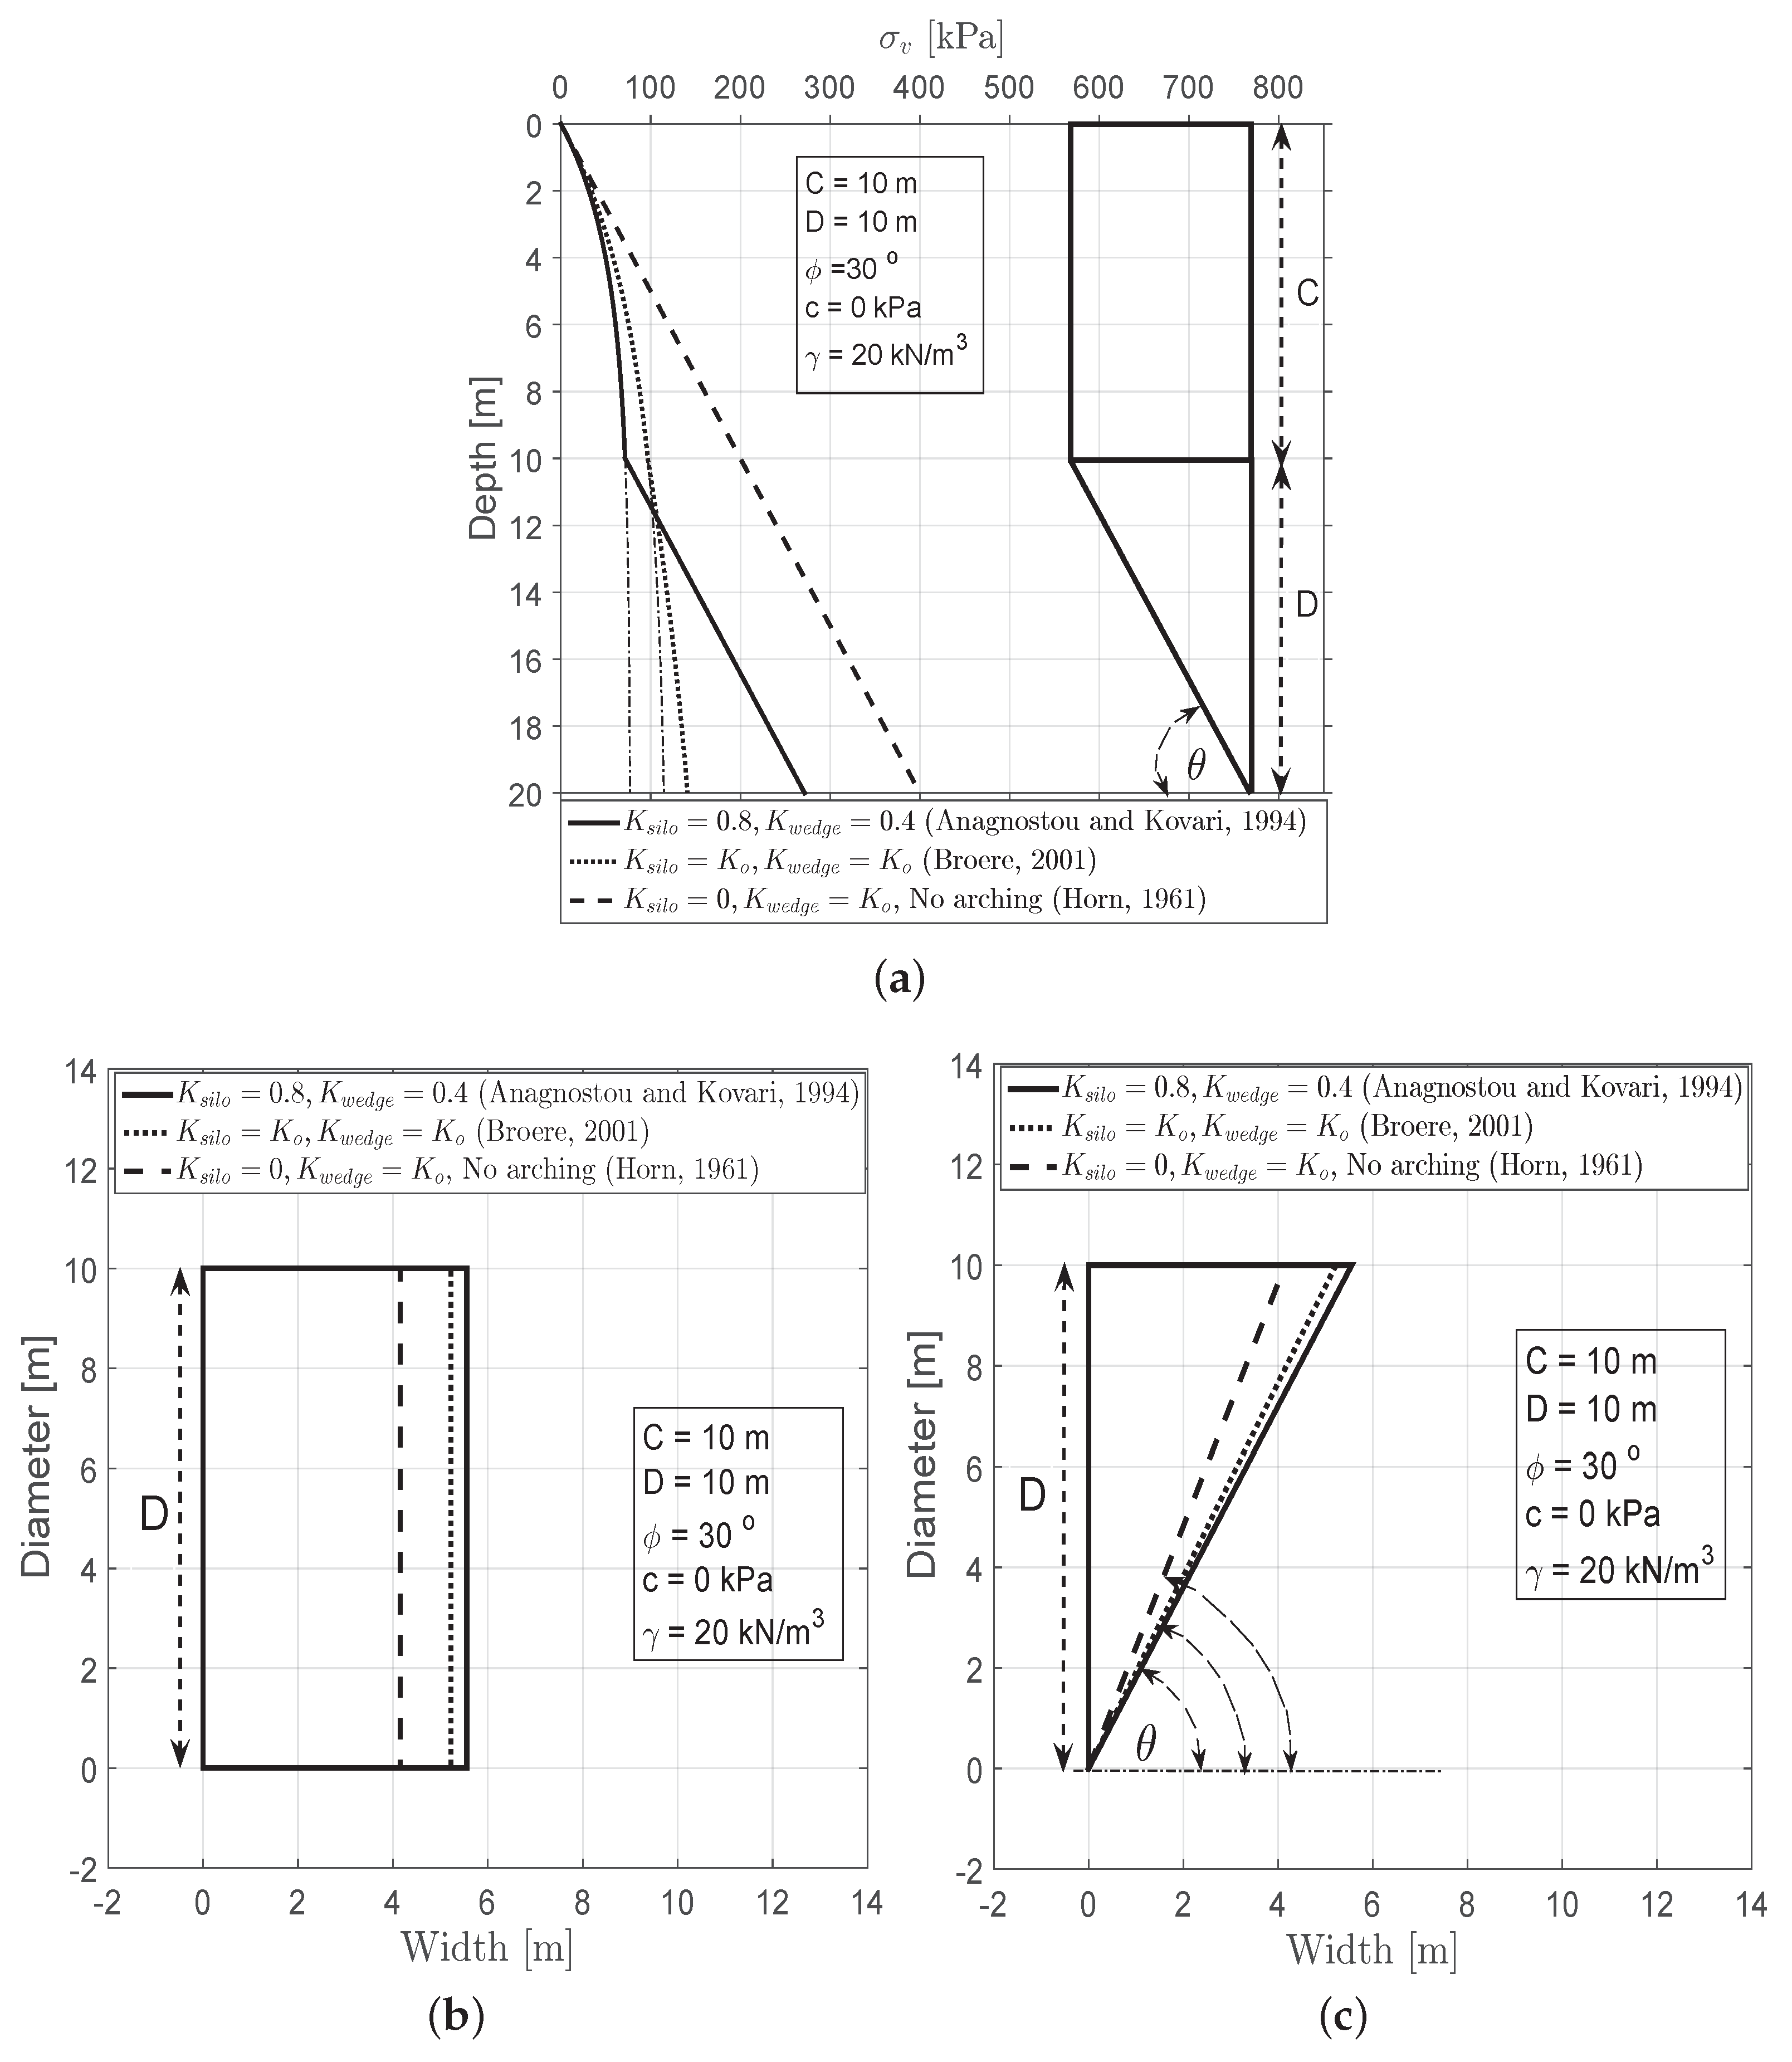
Figure 3.
Vertical stress distribution for different arching implementations (a) Vertical stress distribution (b) Top view of failure mechanism (c) Side view of failure mechanism.
Figure 3.
Vertical stress distribution for different arching implementations (a) Vertical stress distribution (b) Top view of failure mechanism (c) Side view of failure mechanism.

Figure 4.
Upper bound failure mechanisms, Leca and Dormieux [13] (a) One conical failure mechanism (b) Two conical failure mechanisms (c) Cross section of the tunnel face.
Figure 4.
Upper bound failure mechanisms, Leca and Dormieux [13] (a) One conical failure mechanism (b) Two conical failure mechanisms (c) Cross section of the tunnel face.

Figure 5.
Conical multiblocks failure mechanism, Mollon et al. [14].
Figure 5.
Conical multiblocks failure mechanism, Mollon et al. [14].

Figure 6.
Combined multiblocks failure mechanism, Han et al. [44].
Figure 6.
Combined multiblocks failure mechanism, Han et al. [44].

Figure 7.
Normalized support pressure () as a function of normalized cohesion ().

Figure 8.
Normalized support pressure () as a function of cover to diameter ratio (C/D).

Figure 9.
Comparison of values obtained from different methods with physical model tests.

Figure 10.
Model considering two layers of soil.

Figure 11.
Minimum support pressure as a function of different friction angles.

Figure 12.
as a function of the friction angle of the cover layer obtained from different approaches.
Figure 12.
as a function of the friction angle of the cover layer obtained from different approaches.

Figure 13.
Vertical stress distribution in different models: (a) Anagnostou and Kovari [7] model; (b) Broere [8] model; (c) Jancsecz and Steiner [6] model.


Table 1.
Selected physical model tests for he verification of tunnel face stability models.
| Author | Model | Tested Material | c [kPa] | C/D [−] | |
|---|---|---|---|---|---|
| Chambon and Corte [3] | ng test | Fontainebleau sand | 38–42 | 0–5 | 0.5, 1, 2, 4 |
| Kirsch [22] | 1g test | Ottendorf-Okrilla sand | 32.5 | 0 | 0.5, 0.75, 1, 1.5, 2 |
| Chen et al. [47] | 1g test | Yangtze River sand | 37 | 0–0.5 | 0.5, 1, 2 |
Table 2.
Soil parameters and tunnel geometry (soil with two layers).
| Model Description | Parameter | Value | Unit |
|---|---|---|---|
| Cover layer | Cover depth (C) | 9 | [m] |
| Friction angle () | 15–45 | [Deg.] | |
| Unit weight() | 18 | [kN/m] | |
| Cohesion (c) | 2.5 | [kPa] | |
| Cross layer | Tunnel diameter (D) | 6 | [m] |
| Friction angle () | 20° | [Deg.] | |
| Unit weight() | 18 | [kN/m] | |
| Cohesion (c) | 2.5 | [kPa] |
Publisher’s Note: MDPI stays neutral with regard to jurisdictional claims in published maps and institutional affiliations. |
© 2022 by the authors. Licensee MDPI, Basel, Switzerland. This article is an open access article distributed under the terms and conditions of the Creative Commons Attribution (CC BY) license (https://creativecommons.org/licenses/by/4.0/).
Share and Cite
MDPI and ACS Style
Qarmout, M.; König, D.; Wichtmann, T. A Review of Seven Tunnel Face Stability Models. CivilEng 2022, 3, 116-134. https://0-doi-org.brum.beds.ac.uk/10.3390/civileng3010008
AMA Style
Qarmout M, König D, Wichtmann T. A Review of Seven Tunnel Face Stability Models. CivilEng. 2022; 3(1):116-134. https://0-doi-org.brum.beds.ac.uk/10.3390/civileng3010008
Chicago/Turabian StyleQarmout, Mahmoud, Diethard König, and Torsten Wichtmann. 2022. "A Review of Seven Tunnel Face Stability Models" CivilEng 3, no. 1: 116-134. https://0-doi-org.brum.beds.ac.uk/10.3390/civileng3010008