Effect of Martensitic Transformation and Grain Size on the Surface Roughening Behavior in SUS 304 and SUS 316 Thin Metal Foils


Advance Materials Engineering Laboratory (AMPEL), Tokyo Metropolitan University, Hinoshi, 6-6-Asahigaoka, Tokyo 191-0065, Japan
*
Authors to whom correspondence should be addressed.
Eng 2020, 1(2), 167-182; https://0-doi-org.brum.beds.ac.uk/10.3390/eng1020011
Submission received: 25 August 2020
/
Revised: 12 October 2020
/
Accepted: 15 October 2020
/
Published: 29 October 2020
Abstract
:The surface roughening and martensitic phase transformation (MPT) of SUS 304 and SUS 316 were studied through two experiments: a uniaxial tensile stress test, repeated for five cycles, and an Scanning Electron Microscope–Electron Backscaterr Diffraction (SEM-EBSD) investigation. The MPT and martensitic volume fraction (Mf) were evaluated following the tensile test. The correlation between MPT, Mf, and surface roughening behavior was investigated. The experiment showed that an increase in the strain level from 0.4% to 1% increased the MPT and Mf, which transformed from a metastable austenitic phase in SUS 304. The increased strain level increased the surface roughening for various grain sizes (Dg), from fine grain (Dg < 3 μm) to coarse grain (Dg ≥ 3 μm). SUS 304 and SUS 316 are used so that the surface roughening mechanism between SUS 304 and SUS 316, with different phase conditions and at a similar Dg, can be determined. The results showed that the surface roughening increased for both fine and coarse grain at strain levels of 0.4% and 1%; however, a larger increase of surface roughening was obtained for coarse grain. In coarse grain, surface roughening increased significantly not only with a low MPT, but also with a low grain deformation. In coarse grain, the surface roughening increased proportionally to the strain level (εp) because of the low MPT and weak grain. In fine grain, the surface roughening did not increase proportionally to the εp because of the high MPT, which increased the grain strength in SUS 304. In the fine grain of SUS 304, the increase of surface roughening was nearly the same both at strain levels of 0.4% and 1%, because the MPT and Mf were nearly the same. The surface roughening with the same εp and almost the same Dg in SUS 304 and SUS 316 fine grain was nearly the same, because the grain deformation almost produced the same relative inclination between neighboring grains in the initial state direction to the surface. The inter-grain movement changed the grain orientation. Based on kernel average misorientation (KAM) mapping, the local grain misorientation in SUS 304 was higher than that in SUS 316. This indicated that the fine-grain SUS 304 is harder than the fine-grain SUS 316. There is no MPT in SUS 316 because of the higher austenitic phase, which is affected by the austenitic former, such as Ni.
1. Introduction
Austenitic stainless steel (ASS) has excellent corrosion resistance and processability and is widely used in the biomedical, electronic, chemical, electrical power, food, and nuclear industries. Besides that, the high demand for microparts has received much attention in recent decades. Furthermore, microforming technology has many issues, such as limitations in material applications and the requirement for high-cost mass production. When a plastic deformation is applied to the ASS, martensitic-induced transformation occurs in ASS. The martensitic phase volume fraction (Mf) increases in proportion to the increase in plastic deformation [1,2,3]. Martensitic phase transformation (MPT) decreases the toughness but increases the strength of ASS [4,5]. ASS has a body center tetragonal (BCT) crystal structure because of the plastic deformation in ASS, which involves a face center cubic austenite phase at room temperature. Plastic instability, which can occur in thin metal foils, could be delayed, since the work hardening increases because of the MPT occurring in ASS. This means that MPT increases the strength and ductility of ASS [6]. The existence of MPT is affected by the chemical composition, strain level, and grain size (Dg) of ASS thin foils [7,8,9,10,11]. Xue et al. [1] and Qin et al. [12] found that the deformation in a stainless steel strip affects the Mf. The occurrence of the Mf can be controlled by the deformation of the stainless steel strip. After the plastic deformation, the occurrence of MPT in the surface is higher, compared to the interior of the stainless steel strip. When ASS is subjected to plastic deformation MPT, dislocation interaction, and twinning are formed. Twinning occurs more often on the surface, compared with the interior of ASS. The stacking fault energy (SFE) and austenitic phase increase as the temperature rises, thus limiting the MPT. The temperature rise is due to the increasing strain rate. The low strain and low temperature reduce the SFE and the stability of the austenite. This is why the MPT occurs more easily on the surface than on the interior. Furthermore, surface roughening also occurs more easily on the surface than on the interior of thin metal foils. An investigation on the correlation between MPT and surface roughening behavior in thin metal foils is required. Peng et al. [13] and Qin et al. [12] concluded that martensite transformation occurs because of the increase in the strain rate, which increases the local temperature. A high strain rate suppresses MPT. The Olson and Cohen model, called the OC model, represents the basic strain-induced MPT and explains the kinetic energy occurring in conjunction with MPT. The OC model explains that the martensitic nucleation occurs because of the shear band intersection during plastic deformation. Tomita et al. [14] found that MPT nucleation occurs because of the shear band intersection during plastic deformation. When the strain rate increases, the shear band intersection, as the site of MPT nucleation, increases, but the probability of an MPT embryo decreases. This conclusion is considered to apply only to a constant temperature, but high temperatures caused by self-heating in tensile tests were ignored. Zandrahimi et al. [15] found that the transformation of the austenitic phase into MPT in AISI 304 affects surface hardening, leading to the deterioration of wear resistance. An investigation of the surface roughness affected by MPT is required, because surface roughening is caused by grain deformation on the surface and affects the surface properties of thin metal foils. Qin et al. [12] concluded that a high strain rate and temperature decrease the Mf, strength of thin foils, and ductility. Jeom et al. [16] concluded that ε martensite occurs as a consequence of austenitic phase transformation in duplex stainless steel because of plastic deformation, which appeared when it was subjected to a low strain. The austenite phase transformed into ά martensite, which appeared when it was subjected to a high strain.
However, in the metal-forming and miniaturization processes, the prevailing phenomena, when the thickness is decreased the ratio of surface roughness to thickness increases, and this is called a non-uniformity thickness [17,18,19]. The surface-roughening phenomena of sheet or thin material affect the mechanical properties of thin metal foils, such as the fracture behavior and necking phenomena. Surface roughening on a free surface occurs because of inhomogeneous grain deformation in polycrystalline metals. Thus, surface roughening is very important in the field of microforming technology using thin or sheet metal foils. Surface roughening affects the size effect of thin metal foils [20]. The size effect affects the fracture behavior and flow stress and becomes more significant when the number of grains is decreased, especially in the fracture area [21]. Meng et al. [22] and Cheng Cheng et al. [23] concluded that when the thickness of thin foil is uniform, the effect of free surface roughening on the failure behavior and flow stress is significant during plastic deformation. Stoudt et al. [24] concluded that the increase of surface roughness depends on the Dg of Mg–Al alloy. Furushima et al. [25] found that a decreasing thickness from 0.3 to 0.1 mm decreases the fracture strain in several kinds of sheet or thin metal foils, such as titanium and copper. Plastic deformation subjected to thin or sheet metal increases the surface roughness to thickness ratio. Rabee et al. [26] evaluated the relationship between local microstructure and deformation-induced surface roughness, which needs to be clarified. Furushima et al. [27] concluded that dimples do not occur on thin foils, such as copper, with a thickness of ≤0.1 mm. Surface roughening is considered to be one factor that has a huge effect on fracture behavior in copper thin foils when the thickness is ≤0.1 mm. When the thickness decreased in the same area, the surface roughness increased under uniaxial deformation. This means that when the number of grains decreases, the surface roughness increases because of the uniaxial tensile test at the same strain level. In addition, when the quantity of Dg is at least five, the fracture strain is low, and the surface roughness significantly increases under the uniaxial tensile test at the same strain level. Based on this conclusion, it could be predicted that when the Dg increases in the constant area, the surface roughness will increase because of the uniaxial stress state at the same strain level. The surface roughening phenomena with different types of Dg, besides copper metal, with thickness at least 0.1 μm, need to be investigated. Lei Zhang et al. [28] made face center cubic (FCC) polycrystalline metals the object of their recent study on the evolution of surface roughness. Besides the FCC structure, it is very important to study surface roughening. Kengo Yoshida et al. [29] found that surface roughness is mainly affected by Dg. When the Dg increases, the surface roughness to thickness (Ng) ratio decreases. The effect of surface roughness in metal foils with a Dg lower than 10 µm needs to be investigated. The role of surface roughness is very significant when the ratio of thickness to grain size decreases. Surface roughness becomes a defect when the ratio thickness to grain size decreases in thin metal foils. It is very important to study thin metal foils with a Dg below 10 μm. Shimizu et al. [30] concluded that grain deformation affects surface roughness behavior. Furthermore, a different single grain deformation increases the surface roughness in sheet metal. It is very important to investigate the surface roughness with different types of Dg, which may have grain misorientation after deformation. Linfa Peng et al. [31] found that with the increase of Dg, the density in the grain boundary decreases. Since the grain boundary density is not homogenous, inhomogeneous deformation occurs. It is very important to investigate surface roughening phenomena with a uniform Dg and a Dg of different sizes in thin metal foils.
Furushima et al. [32] used pure copper C 10220-O, with a thickness of 0.05 mm. Surface-roughening phenomena occur because of a weak grain deformation. The inhomogeneous grain in polycrystalline metal shows the roughening phenomena. A weak grain will cause a lower flow stress in the grain. It is possible to study these phenomena without considering C 10220-O and rather focusing on weak and strong grains. P. Groche et al. [33] found that by decreasing the Dg, the surface asperities become lower in fine grain because of the higher yield point, compared to coarse grain. The increasing and decreasing of the yield point are in line with the Hall–Petch formula. Cheng et al. [23] found that surface roughening is a single factor that determines the failure of thin metal foils. It is very important to investigate surface roughening in thin metal foils, which may be affected by grain size.
According to previous research, a weak grain deformation has a huge effect on surface roughening. The higher strain level applied to thin metal foils, such as ASS SUS 304 and SUS 316, increased the surface roughness. When the number of grains equals at least five, the surface roughness increases significantly because of the uniaxial tensile stress state. Surface roughness with a constant thickness and various sizes of Dg has not yet been investigated. The correlation between surface roughness and MPT in a grain is still not clear. It can be predicted that if the grain has a high MPT, the grain strength will increase, and grain deformation will become more difficult, compared to a grain with a lower MPT. The grains of SUS 304 or SUS 316 with a lower MPT change into weaker grains, compared to grain with a higher MPT. The purpose of this study is to understand and briefly clarify how MPT affects grain strength, which will be shown by determining the surface roughness behavior of thin metal foils. In this study, the authors used SUS 304 and SUS 316 thin metal foils with various sizes of Dg. SUS 304 and SUS 316 were used to clarify how MPT affects the surface roughness both in SUS 304, which consists of a complicated phase, and SUS 316, which consists of a more uniform phase. No study has yet been conducted on the surface-roughening behavior and phase transformation in various thin metal foils with a FCC and body center cubic (BCC) structure and with different sizes of Dg below 10 μm. First, the aim of this study is to investigate how MPT affects the surface roughening behavior in SUS 304 and SUS 316 thin metal foils. The second aim is to investigate the effect of a fine Dg on surface-roughening behavior, compared to a coarse Dg. In this study, ASS SUS 304 and SUS 316 are subjected to a uniaxial tensile stress state step by step, the surface roughening behavior is measured, and the MPT, local grain misorientation, and deformation are analyzed using Scanning Electron Microscope–Electron Backscaterr Diffraction (SEM-EBSD). Materials and Research Methods
2. Materials and Research Methods
2.1. Materials
Thin metal foils SUS 304 and SUS 316 were heat treated and rolled into a 0.1 mm thickness. The thin metal foils were obtained from Komatsu Seiki Koshakuso Co. Ltd., Suwa City, Nagano, Japan. The chemical compositions of the material were detected by an X-ray fluorescence spectrometer, as listed in Table 1 and Table 2. Different compositions of stainless steel SUS 304 and SUS 316 thin foils materials were used so that the effect of chemical composition, such as nickel element chromium element and carbon element, on the MPT could be investigated. It is well known that the nickel element is an austenite stabilizer, and the chromium element is a ferrite stabilizer. This study investigates how the austenitic stabilizer affects the MPT induced by plastic deformation. Furthermore, based on the chemical composition, SUS 304 thin metal foils consist of more complicated phases in their microstructure than SUS 316 thin metal foils. The microstructure affects the MPT formation and the occurrence of surface roughening.
According to the chemical composition, shown in Table 1 and Table 2, the quantity of carbon in SUS 304 is higher than that in SUS 316. This means that the quantity of martensite phase in SUS 304 will be higher than in SUS 316 because of plastic deformation. The martensitic phase and carbide compound may form in the grain matrix, which will increase the strength of thin foils. Because of plastic deformation or heating and quenching to which the thin metal foils of SUS 304 are subjected, they will affect the MPT and Mf. Plastic deformation affects the dislocation motion. The dislocation motion in the slip band of lattice crystal changes the crystal structure from FCC to BCT (body center tetragonal). The quantity of nickel in SUS 316 is almost 4–5% higher than that in SUS 304 thin metal foils. From this, it could be inferred that the ductility and toughness of SUS 316 is higher than those of SUS 304, because nickel is an austenitic former element that has mechanical properties such as strength and ductility. Moreover, the quantity of the chromium element, such as the ferrite former, in SUS 304 is higher than that in SUS 316 thin metal foils. This means that the chromium carbide more easily forms in the grain matrix or boundary and increases the strength of thin metal foils when plastic deformation is applied. The higher the nickel elements in stainless steel, the more difficult the MPT or the more difficult the transformation of austenite into martensite, because nickel is an austenitic stabilizer—it needs more energy to change the austenitic phase into martensite.
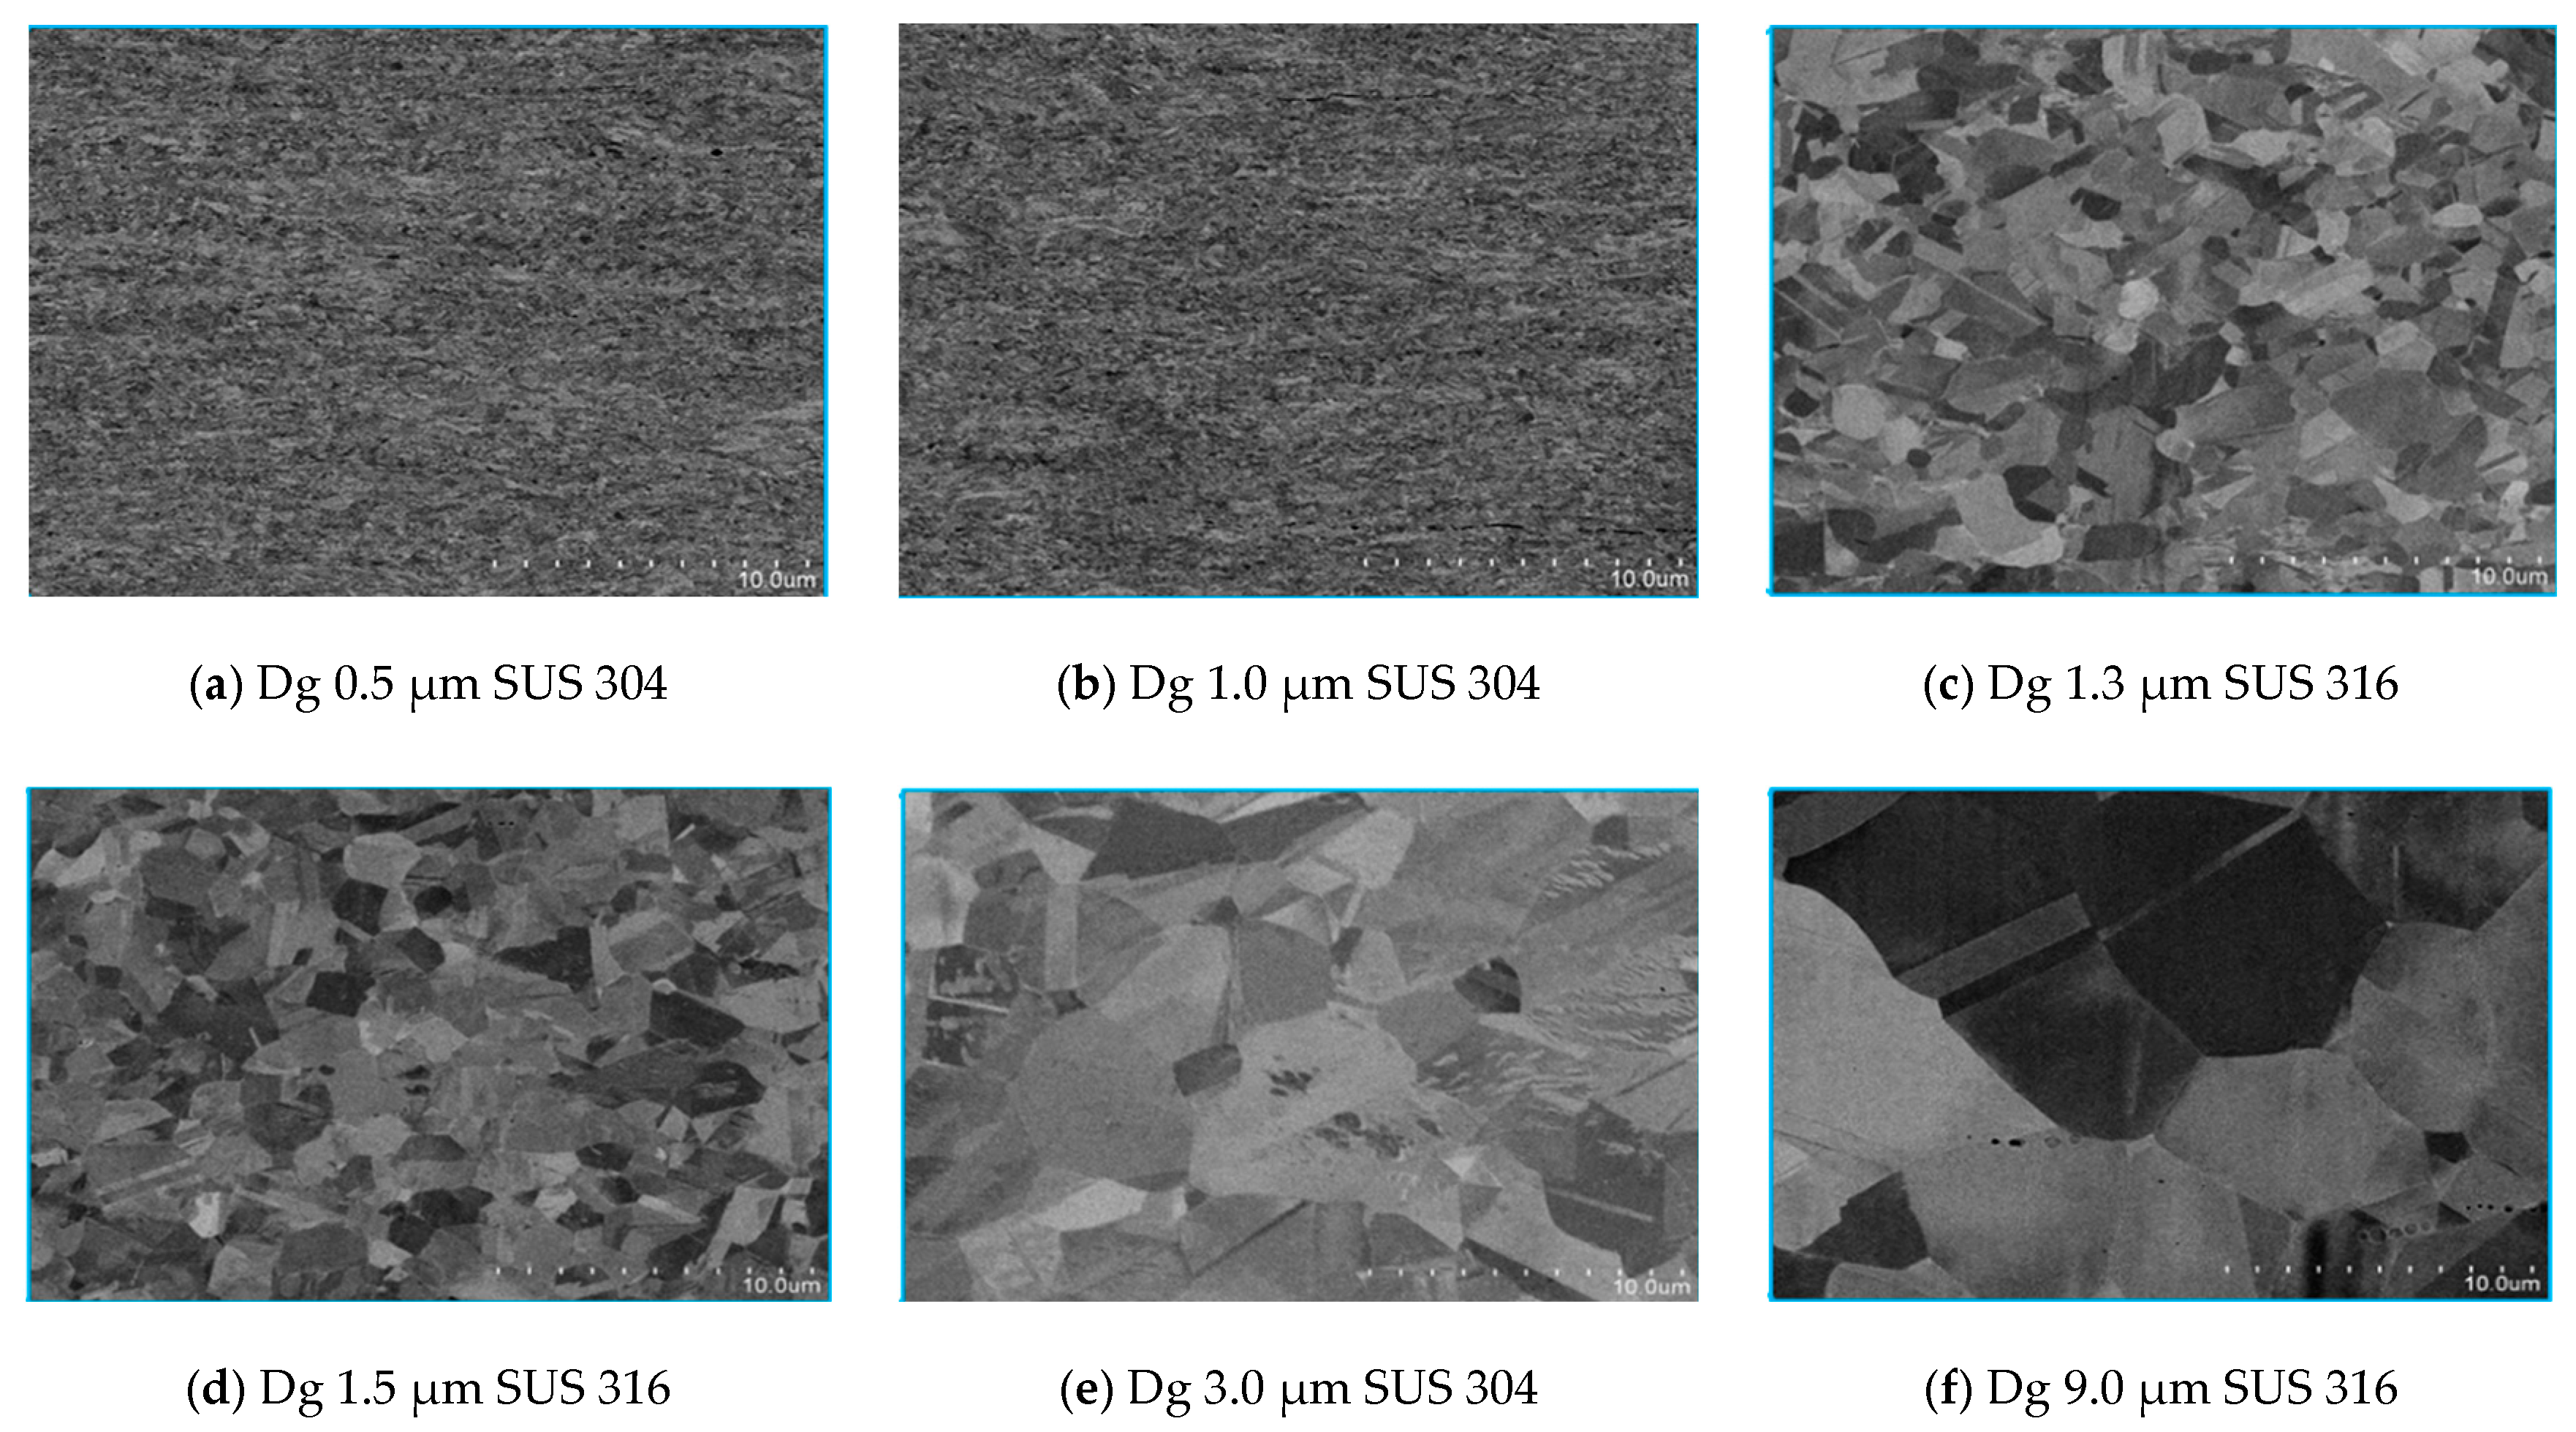
This study used different sizes of Dg to investigate the surface roughness behaviors with various sizes of Dg. It is known that surface roughness increases proportionally with a grain larger than 10 µm in size, when plastic deformation is applied to thin metal foils. However, it is still not clear yet how the surface roughness behaves in thin metal foils with a Dg lower than 10 µm, especially in SUS 304 and SUS 316, which have a BCC and FCC crystal structure. It is very important to clarify the surface roughness behavior and mechanism in thin metal foils SUS 304 and SUS 316 with various sizes of Dg lower than 10 µm, such as 0.5, 1.0, 1.4, 1.5, 3.0, and 9.0 µm, in size.
Figure 1 shows a typical microstructure with various sizes of Dg, from fine grain to coarse grain. According to the Hall–Petch equation, it is well known that Dg affects the mechanical properties of materials. Materials that have a fine grain will have a higher tensile and yield strength than materials that have a coarse grain. The surface roughness in thin metal foils of SUS 304 and SUS 316 will be different, because the thin metal foils with various sizes of Dg are subjected to the same tensile stress state.
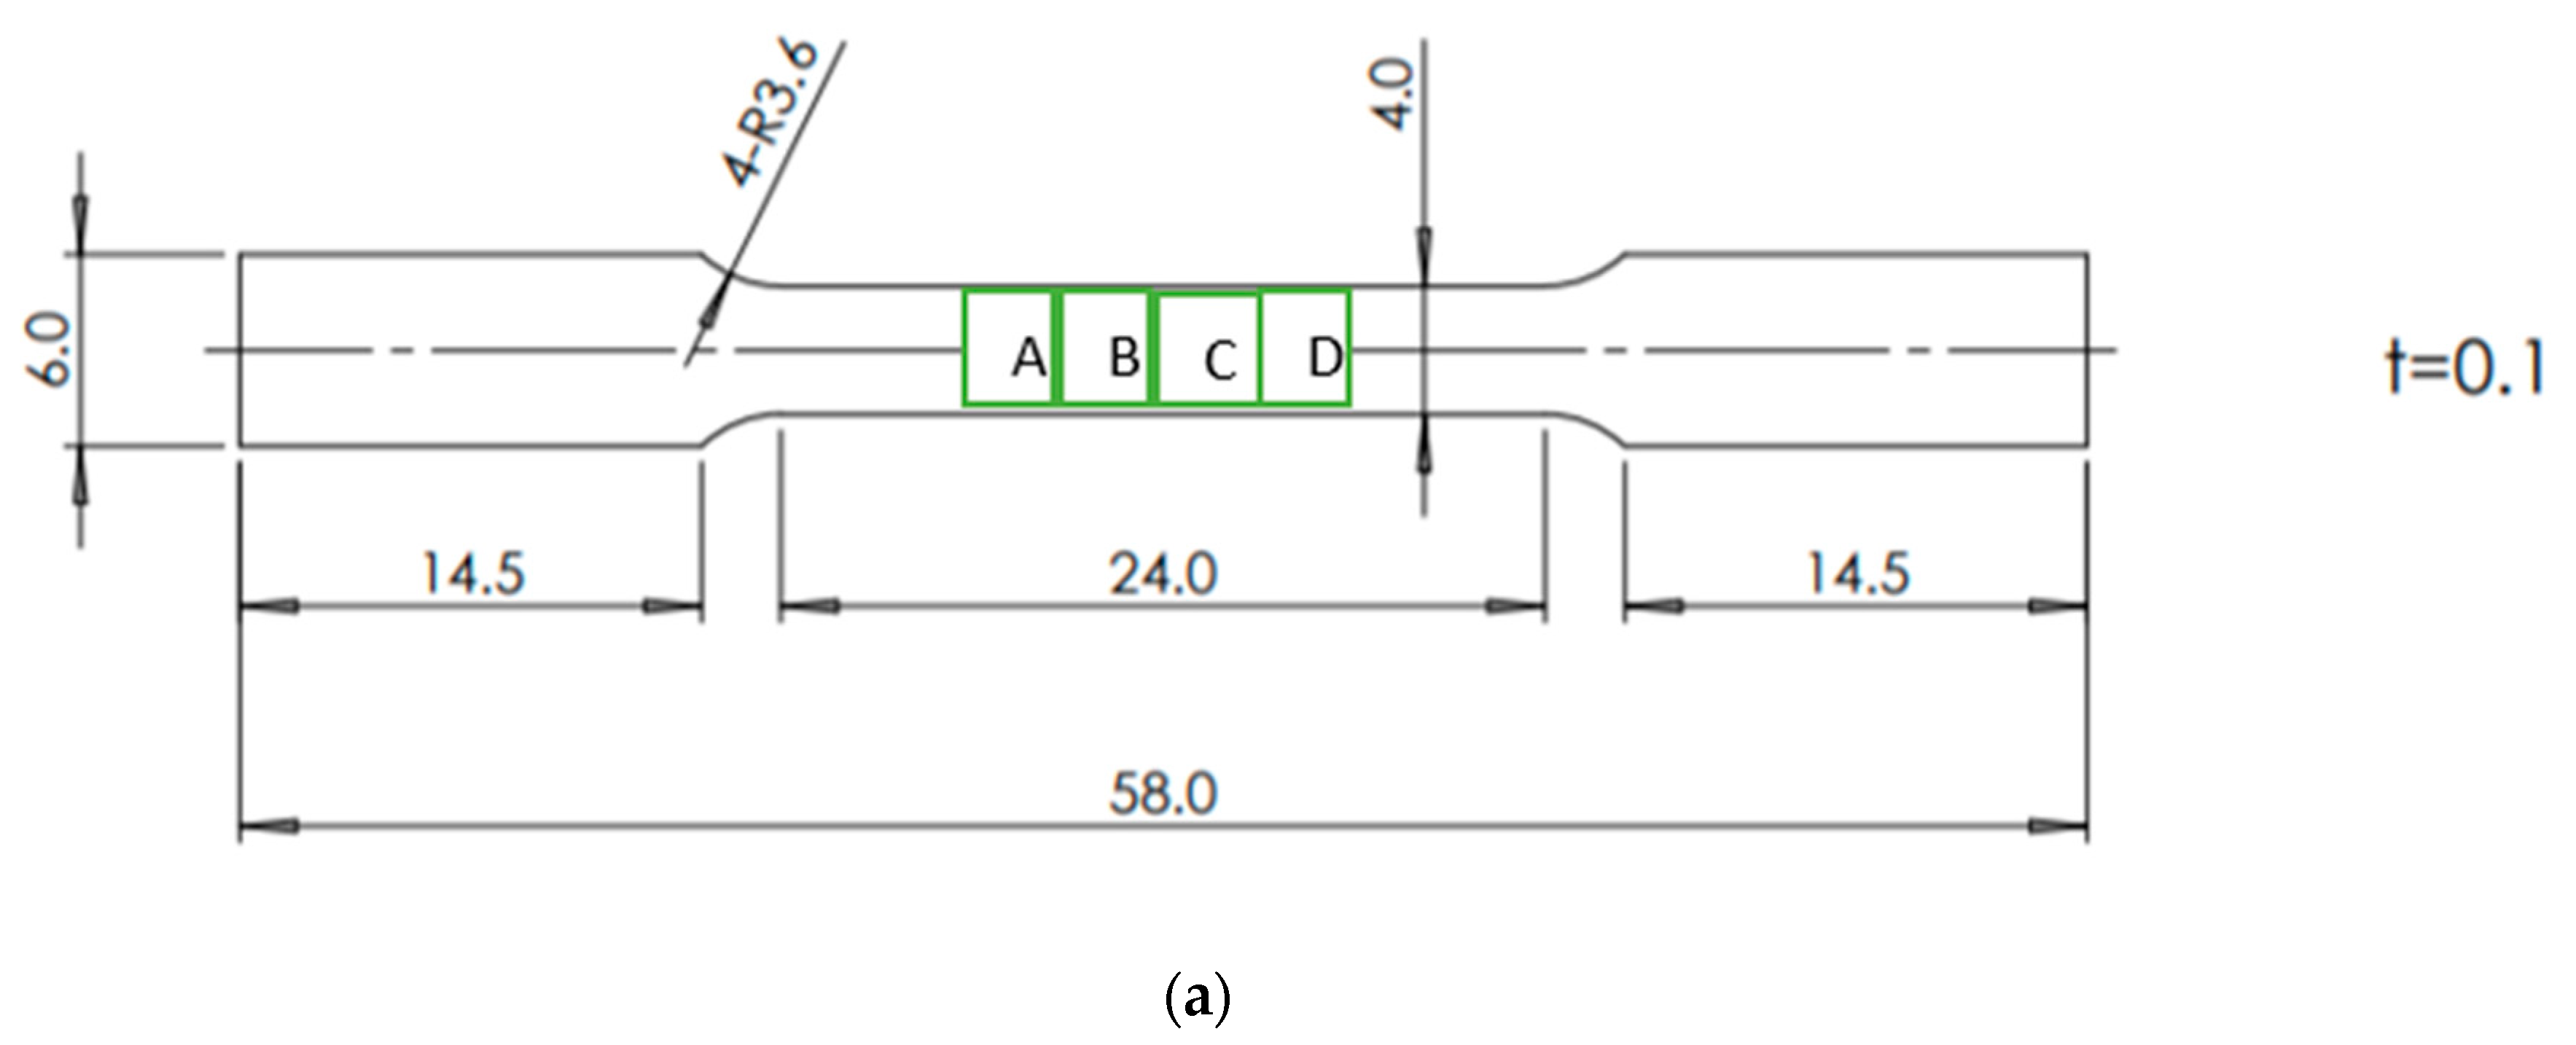
The entire dimension shown in Figure 2a is in millimeters. Based on Figure 2a, the surface roughness behavior is investigated in points A, B, C, and D. The purpose of measuring the surface roughness in various areas is to compare the surface roughness behavior in thin metal foils because of plastic deformation and its mechanism. The thin metal foils shown in Figure 2a are of commercial SUS 304 and SUS 316 with a 4.0 mm width, 0.1 mm thickness, and 20.0 mm gauge length. The standard used is DIN 50125. The sample made of the dog bone type is shown in Figure 2a.
2.2. Method
Before the materials are subjected to the uniaxial tensile stress state, they are cleaned using ethanol and combined with ultrasonic vibration for 30 min to increase the cleaning of the surface. The samples are subjected to the uniaxial tensile stress state for five steps, with constant strain. After the samples are subjected to the uniaxial tensile stress state, the surface roughness is measured using a confocal laser microscope, the Keyence Confocal Laser Microscope (VE 8800, Keyence Co., Japan). The uniaxial tensile test was conducted using a commercial tensile test machine, Autograph AG-IS 50 kN, produced by Shimadzu Corp., Japan, with capacity of 50 kN.
The surface roughening behavior of SUS 304 and SUS 316 with various sizes of Dg were investigated using a uniaxial tensile test. The uniaxial tensile test was run step by step using a constant strain over the yield point of the thin metal foils. The gauge length of the thin metal foils was 20 mm. The width and thickness of the thin foil were 4 mm and 0.1 mm, respectively. The bevelled radius was 3.6 mm. In order to maintain consistency, the uniaxial tensile test was conducted using the commercial tensile test machine, Autograph AG-IS 50 kN (Shimadzu Corp., Japan). The strain rate of the uniaxial tensile test was 1.6 × 10⁻³ s−1. The measured and observed surface roughness used different sizes of Dg, different materials, and a constant thickness. The elongation was measured optically with a video non-contact extensiometer (DVE-201, Shimadzu Corp., Japan), since the contact extensiometer could not be affixed to the metal foil. The surface roughness during the deformation was measured using a uniaxial tensile testing machine that halted at every step. In the universal tensile testing machine, the sample was subjected to a uniaxial tensile stress state at each step, and the tensile test was stopped. Then, the sample was taken out from the clamp tensile testing machine, and the surface roughness behavior was measured using a Keyence Confocal Laser Microscope (VE 8800, Keyence Co., Japan). The area of the surface roughness measurement was in the center points of A, B, C, and D, according to the direction of the rollers at each step using contact surface roughness measurement. The surface roughness was measured for five steps in the same position, with constant strain. Besides the surface roughness, the Rz value was evaluated. The area of the surface roughness measurement had a length of 0.7 mm.
The microstructure behavior was investigated using the SEM SU-70, produced by the Hitachi High Technology corporation, in normal mode. The acceleration voltage was 5 kV, the emission current 16 μA, and the working distance 10 mm. The phase transformation was investigated using an EBSD Digi View (EDAX) in field-free mode, with an acceleration voltage of 15 KV, emission current of 16 μA, and working distance of 20 mm. The sample was observed in a 30 μm × 50 μm area. The step (resolution) of the EBSD machine is 0.1 μm, and the pixel binning is 8 × 8.
The Dg was measured using the JIS G0551 standard. The technical methods for measuring Dg were to draw a line (length is L) on a photomicrograph, as shown in Figure 2b. Then, the number of crystals on the line were counted, and the end of the line was counted as ½. Figure 2b is an analogy of the crystal structure photomicrograph. Last, we calculated the Dg using the following formula. Average grain size = .
3. Result and Discussion
3.1. Result
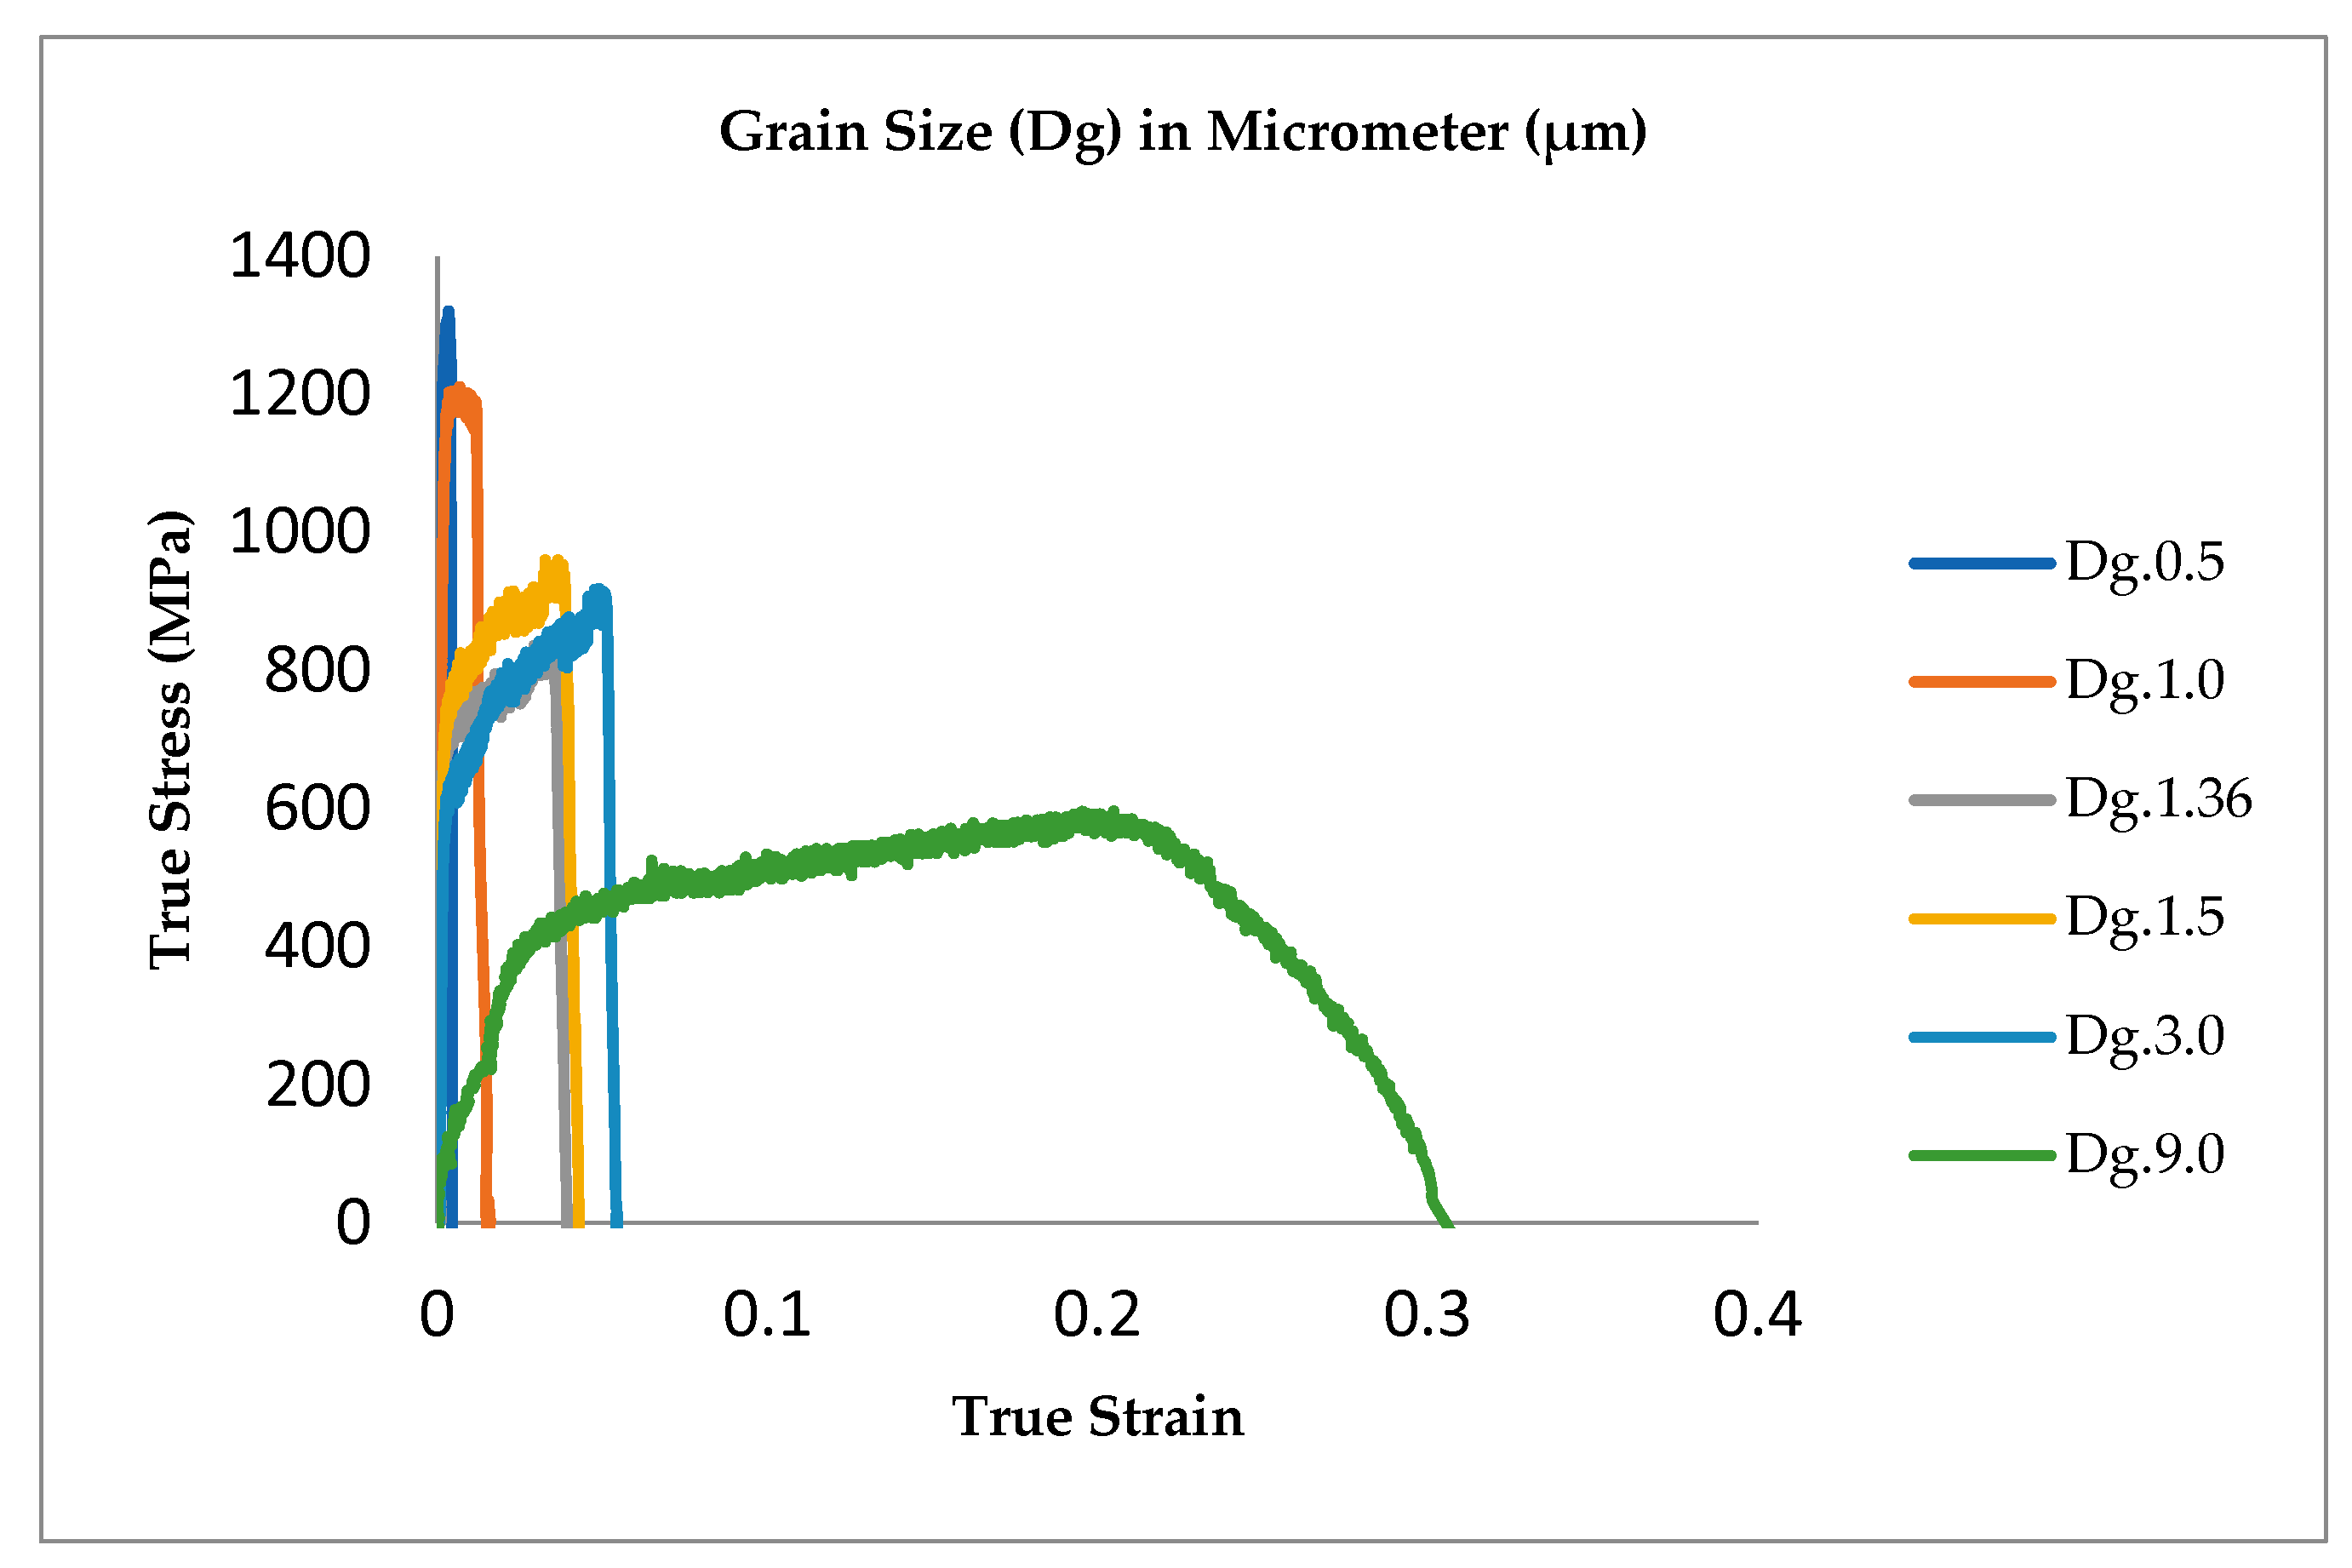
Figure 3 shows the true stress–strain curve of the thin metal foils SUS 304 and SUS 316 with various sizes of Dg. When the Dg increases, the fracture strain of the metal foils increases. When the Dg increases, the strength of the thin metal foils of SUS 304 decrease. A low fracture strain and low tensile strength are obtained in the thin metal foils of SUS 316 with a fine grain. Different fracture strains and tensile strengths of the thin metal foils may affect the surface roughness in SUS 304 thin metal foils.
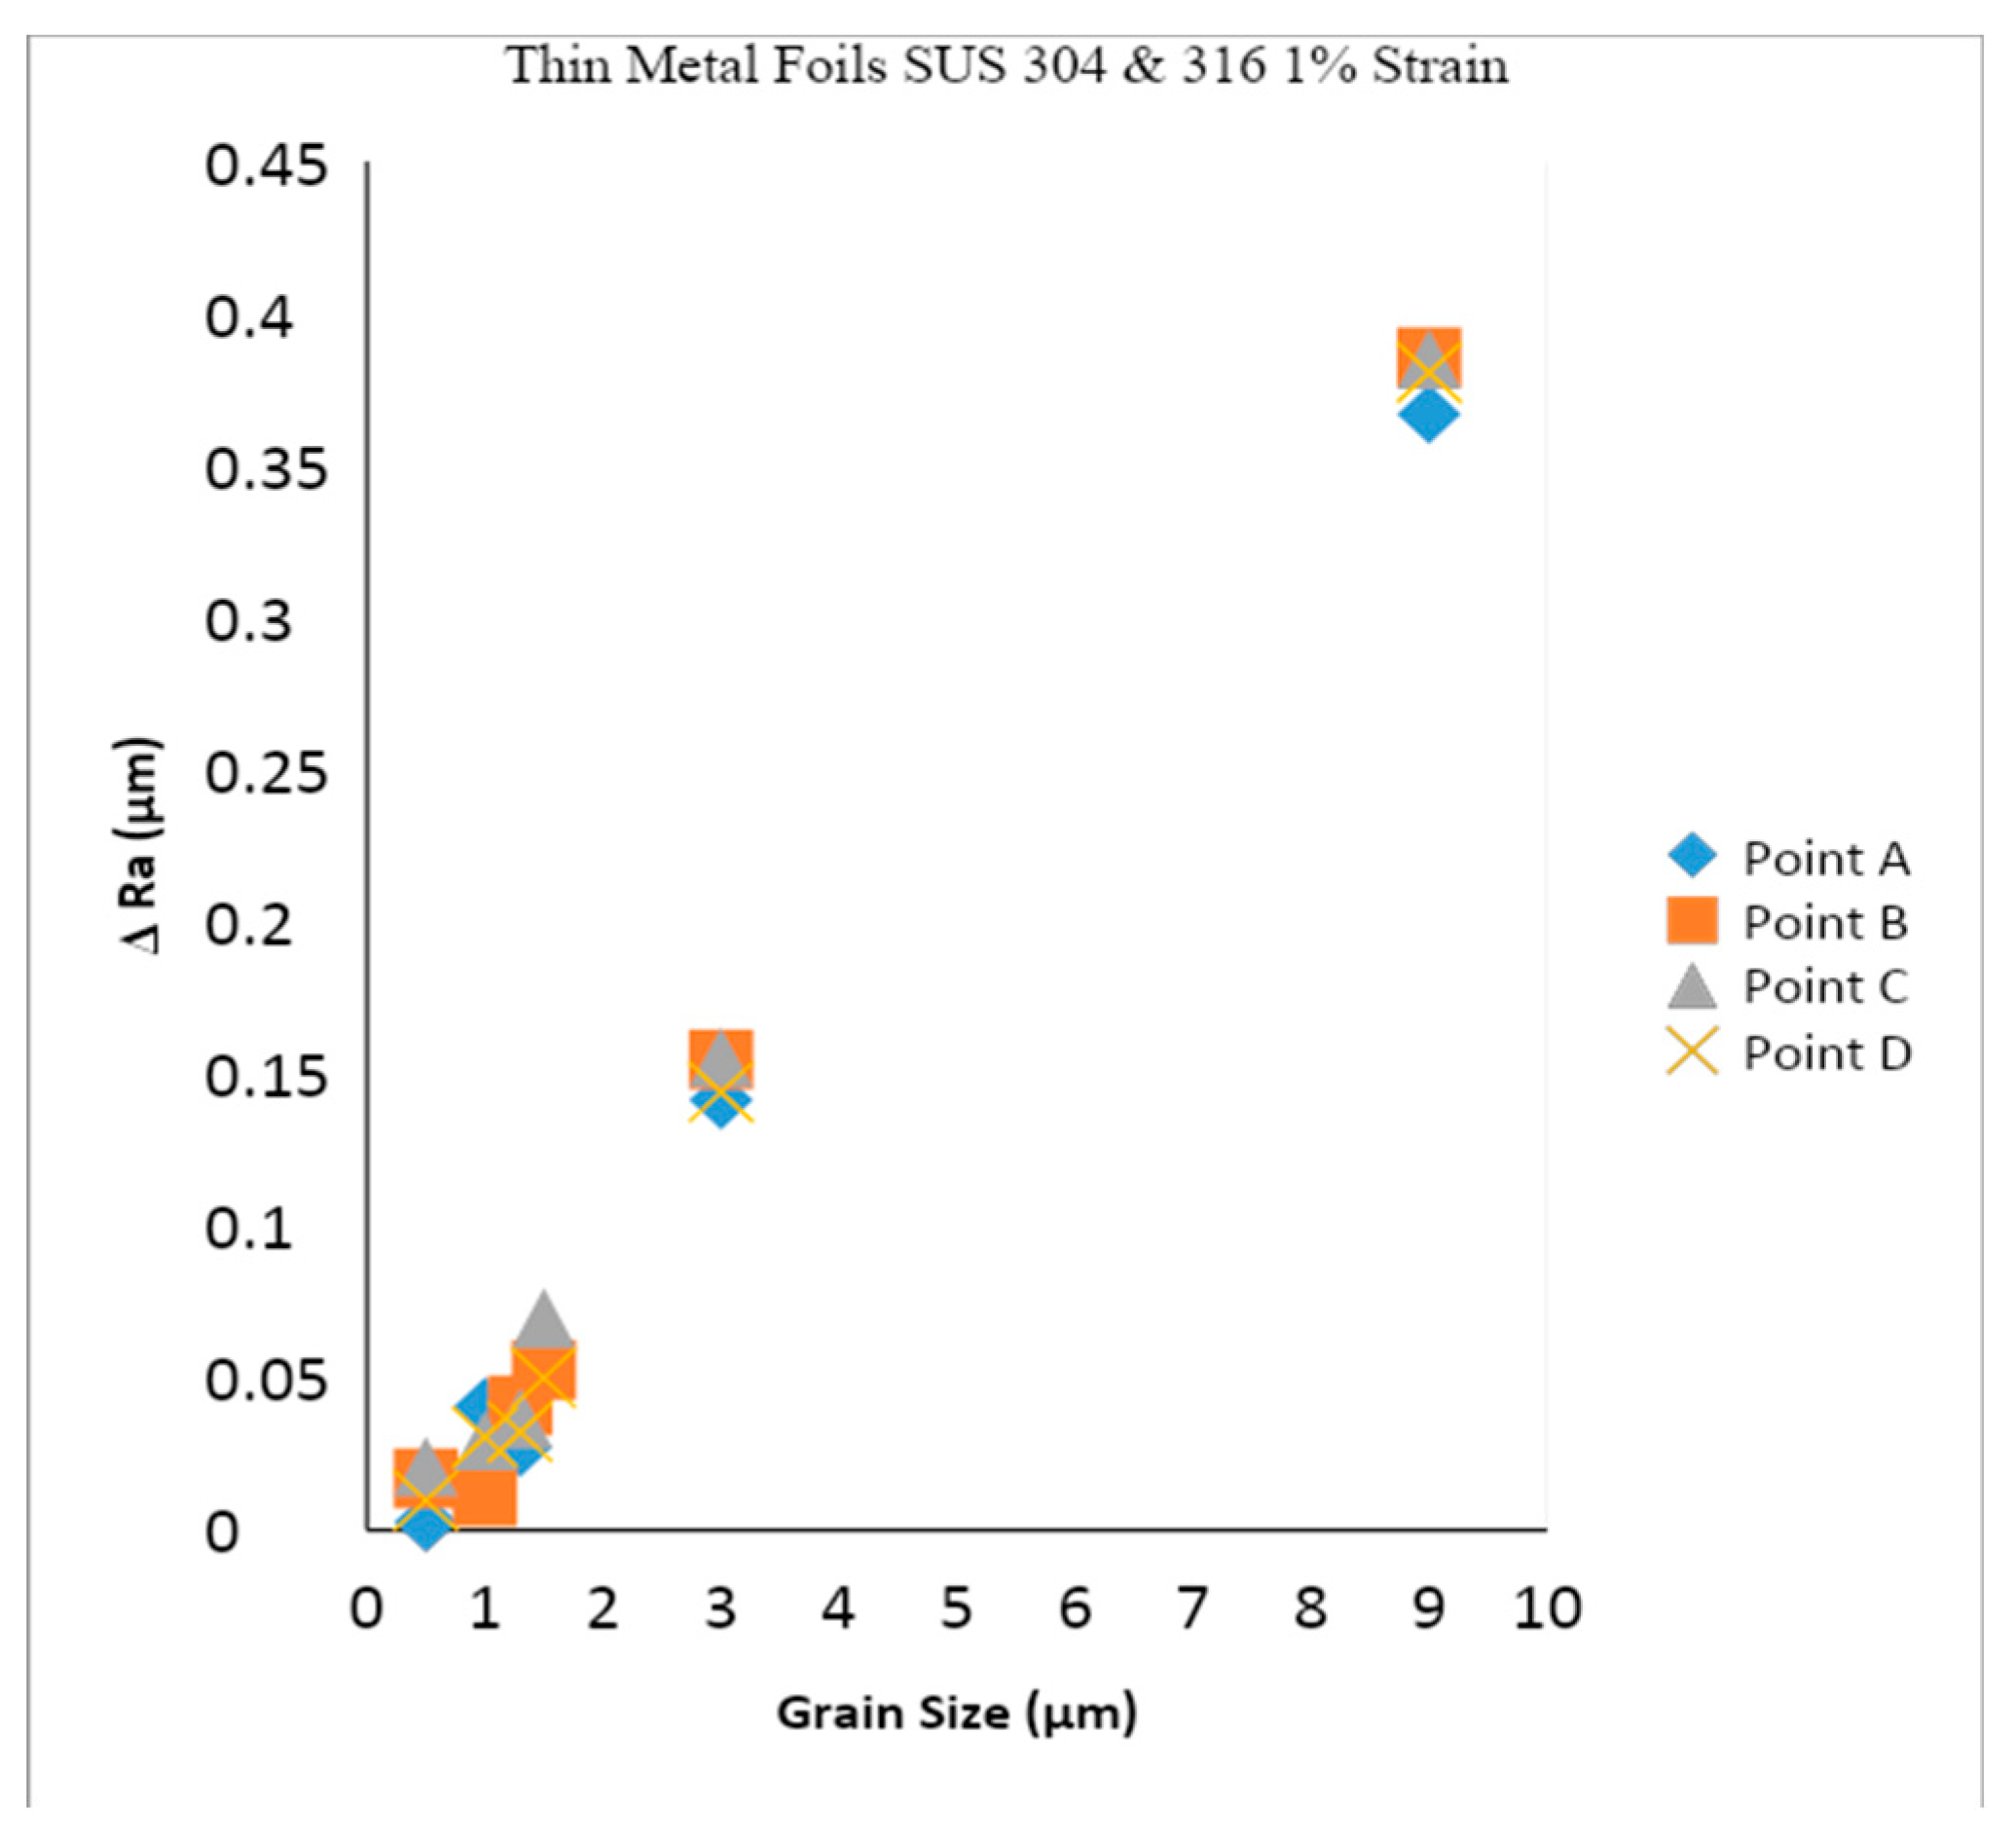
The samples were subjected to the uniaxial tensile stress state for five steps, with the number of one-time strain levels at 1.0%. Then, after the sample was subjected to the uniaxial tensile stress state for five stages, the amount of surface roughness was calculated at points A, B, C, and D. The results for the total increase in the value of surface roughness, after subjecting the thin metal foils to a tensile test for five stages, are shown in Figure 4.
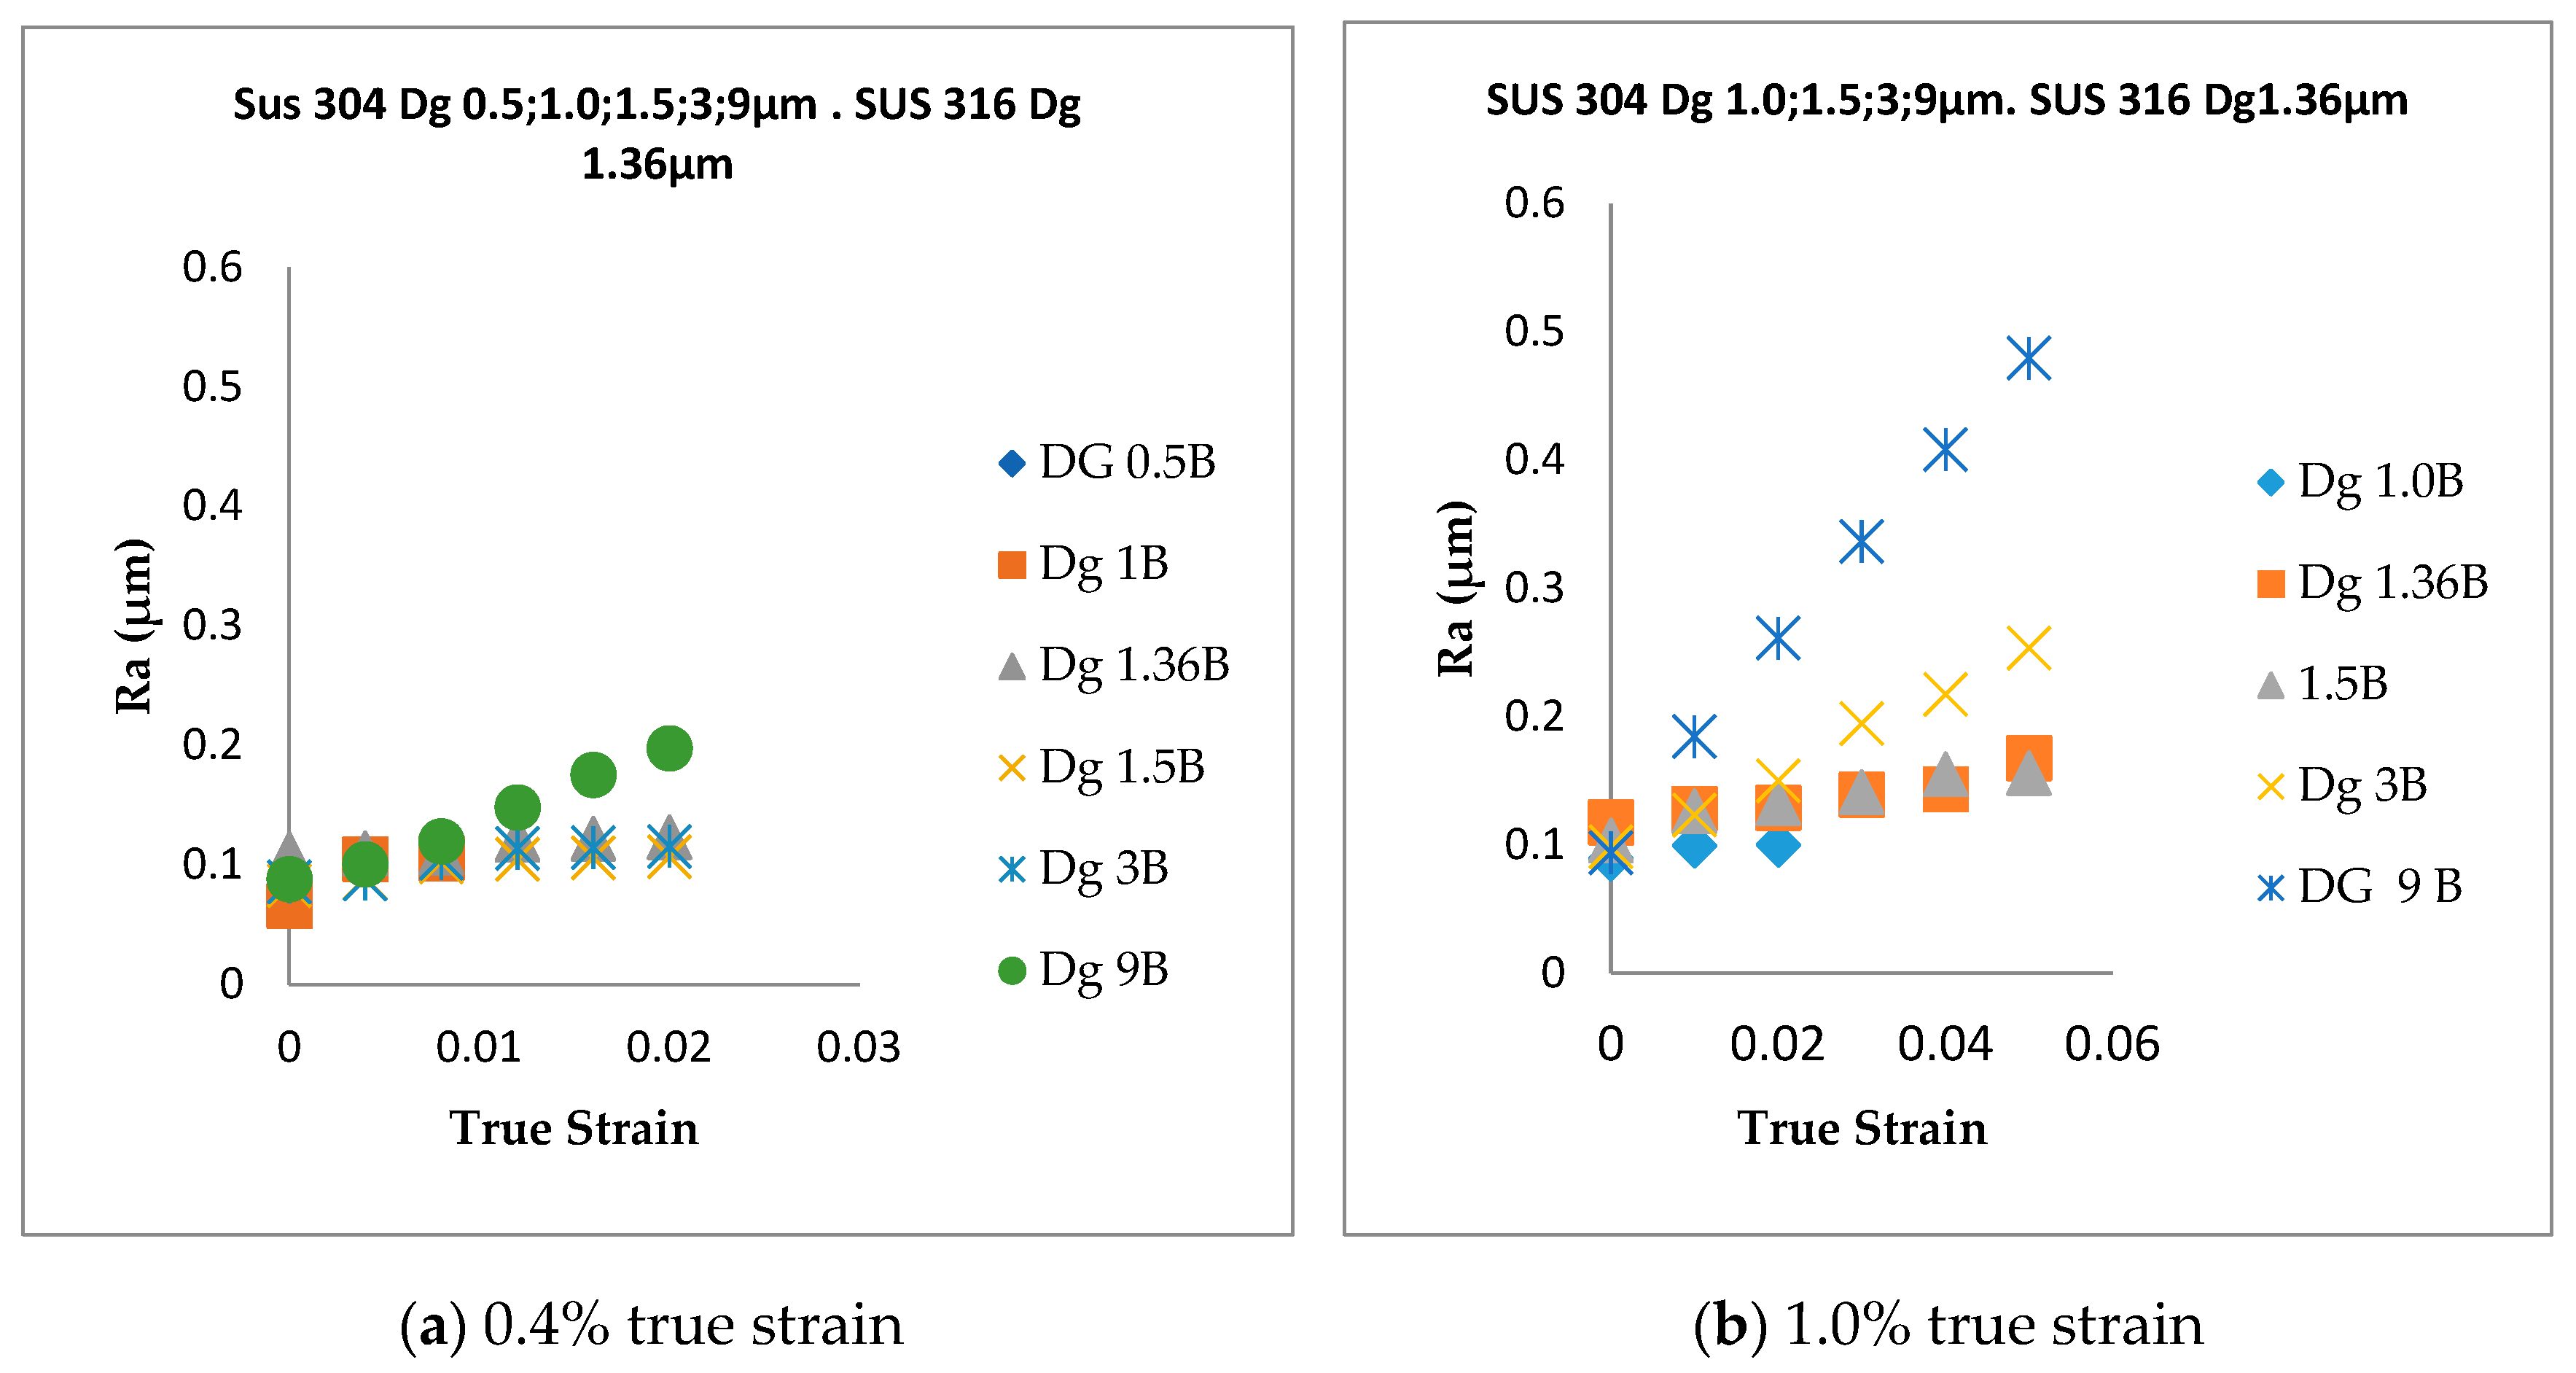
Ra is the absolute average value of the roughness of the metal surface over the measurement area at a certain radius. Rz is the mean roughness of the five consecutive maximum peaks and valleys in a certain area. Figure 4 shows the surface roughness with various sizes of Dg. As the Dg increases, the surface roughness increases. The surface roughness increase was higher for coarse grain, compared to fine grain. The increase in surface roughness goes hand in hand with an increase in the fracture strain, but it is inversely proportional to the increase in the strength of SUS 304 thin metal foils. The fine grain fracture of SUS 316 thin metal foil has a low fracture strength, and the increase in surface roughness is also low. SUS 304 and SUS 316 with a fine grain have the same tendency in terms of fracture strain and increasing surface roughness.
The factor that affected the yield stress of the thin metal foils SUS 304 and 316 was the loading direction, which depends on the orientation of the grain. Hence, besides Dg, surface roughening and the inhomogeneous yield also depend on the grain orientation and distribution. As shown in Figure 3, thin foil materials have a higher ductility for coarse grain, which indicates a higher fracture strain, compared to fine grain. As shown in Figure 3, fine-grain thin metal foils have a lower fracture strain. Furthermore, for fine-grain SUS 304, the strength and yield point are higher, compared to coarse grain, and are in good agreement with the Hall–Petch equation. Fracture strain and tensile strength may affect surface roughening with various sizes of Dg. Based on Figure 4, the surface roughness increase is higher for coarse-grain SUS 304, compared to fine-grain SUS 304 and SUS 316 thin foils, which is due to the ductility and grain share of the coarse Dg being higher, compared to that of the fine Dg. Furthermore, when the grain is larger, the grain surface increases. When the grain surface increases, the flow stress decreases, along with the ductility. The consequences are that the dislocation density and flow stress are lower for coarse Dg, compared to fine Dg [23,31,32,33,34,35]. The increasing surface roughness at points A, B, C, and D in fine grain is similar. The increase of surface roughness in points A, B, C, and D for coarse grain are nearly the same. This means that the surface roughness behaviors are the same in the whole area of the gauge length because of the same fracture strain at points A, B, C, and D. Finally, the increase of the surface roughness in the entire area at points A, B, C, and D is the same.
Figure 5 shows the surface roughness behaviors at point B of thin metal foils SUS 304 and SUS 316. The low strain is 0.4%, which is applied to samples of thin metal foils SUS 304 and SUS 316. The high strain is 1.0%, which is applied to samples of thin metal foils SUS 304 and SUS 316. Each sample was subjected to tensile stress at low and high strain levels for five stages. The surface roughness was investigated at each stage of the tensile stress state. Thus, five surface roughness measurements were obtained from the uniaxial tensile stress state. The surface roughness with a low strain is shown in Figure 5a. The surface roughness with a high strain is shown in Figure 5b. The result shows that the surface roughness increased proportionally in coarse grain, and the increase was not proportional in fine grain. Thin foil materials were subjected to uniaxial tensile stress at a low strain (0.4%) and high strain (1.0%). The uniaxial tensile stress process was step by step. The thin foil materials were taken out from the tensile machine after one step of the tensile test, and then the surface roughness was measured. This test was repeated for five stages. The surface roughness values are shown in Figure 5a,b.
The Ra increase is linear, with an increasing plastic strain at both the 0.4% and 1% strain levels (Figure 5). The Dg of 0.5 μm was only measured at 0.4% strain, because the sample was fractured at one stage during the tensile test at 0.4% strain. Surface roughening did not increase proportionally for fine grain, both at 0.4% and 1% strains, because of the lower ductility and lower increasing surface roughness for fine grain, compared to coarse grain. The lower ductility in thin metal foils occurs in fine grain, which is indicated by the higher work hardening after the uniaxial tensile stress state. The increase in work hardening coincided with the thin foil material changing into a harder one. When a grain changes into a harder one, surface roughening becomes more difficult. A low ductility and low increasing surface roughness in fine-grain SUS 316 are nearly the same as that in fine-grain SUS 304; thus, the grain strength of SUS 316 is nearly the same as that of SUS 304. The surface roughening increases proportionally in coarse grain both at the 0.4% and 1% strain levels because of the higher ductility and higher increasing roughness. The higher ductility and higher increasing surface roughness indicate that the grain in coarse grain is weaker, compared to that in the fine-grain thin metal foils. As a consequence, coarse grain is easier to deform than fine grain, so the surface roughness in coarse grain is higher, compared to that in fine grain. Furthermore, with the increase of the Dg, the flow stress decreases because of the increasing surface area [35]. The grain rotation caused by plastic deformation increases the surface roughness. Different deformation behaviors of individual grains increase the surface roughness of thin metal foils [30].
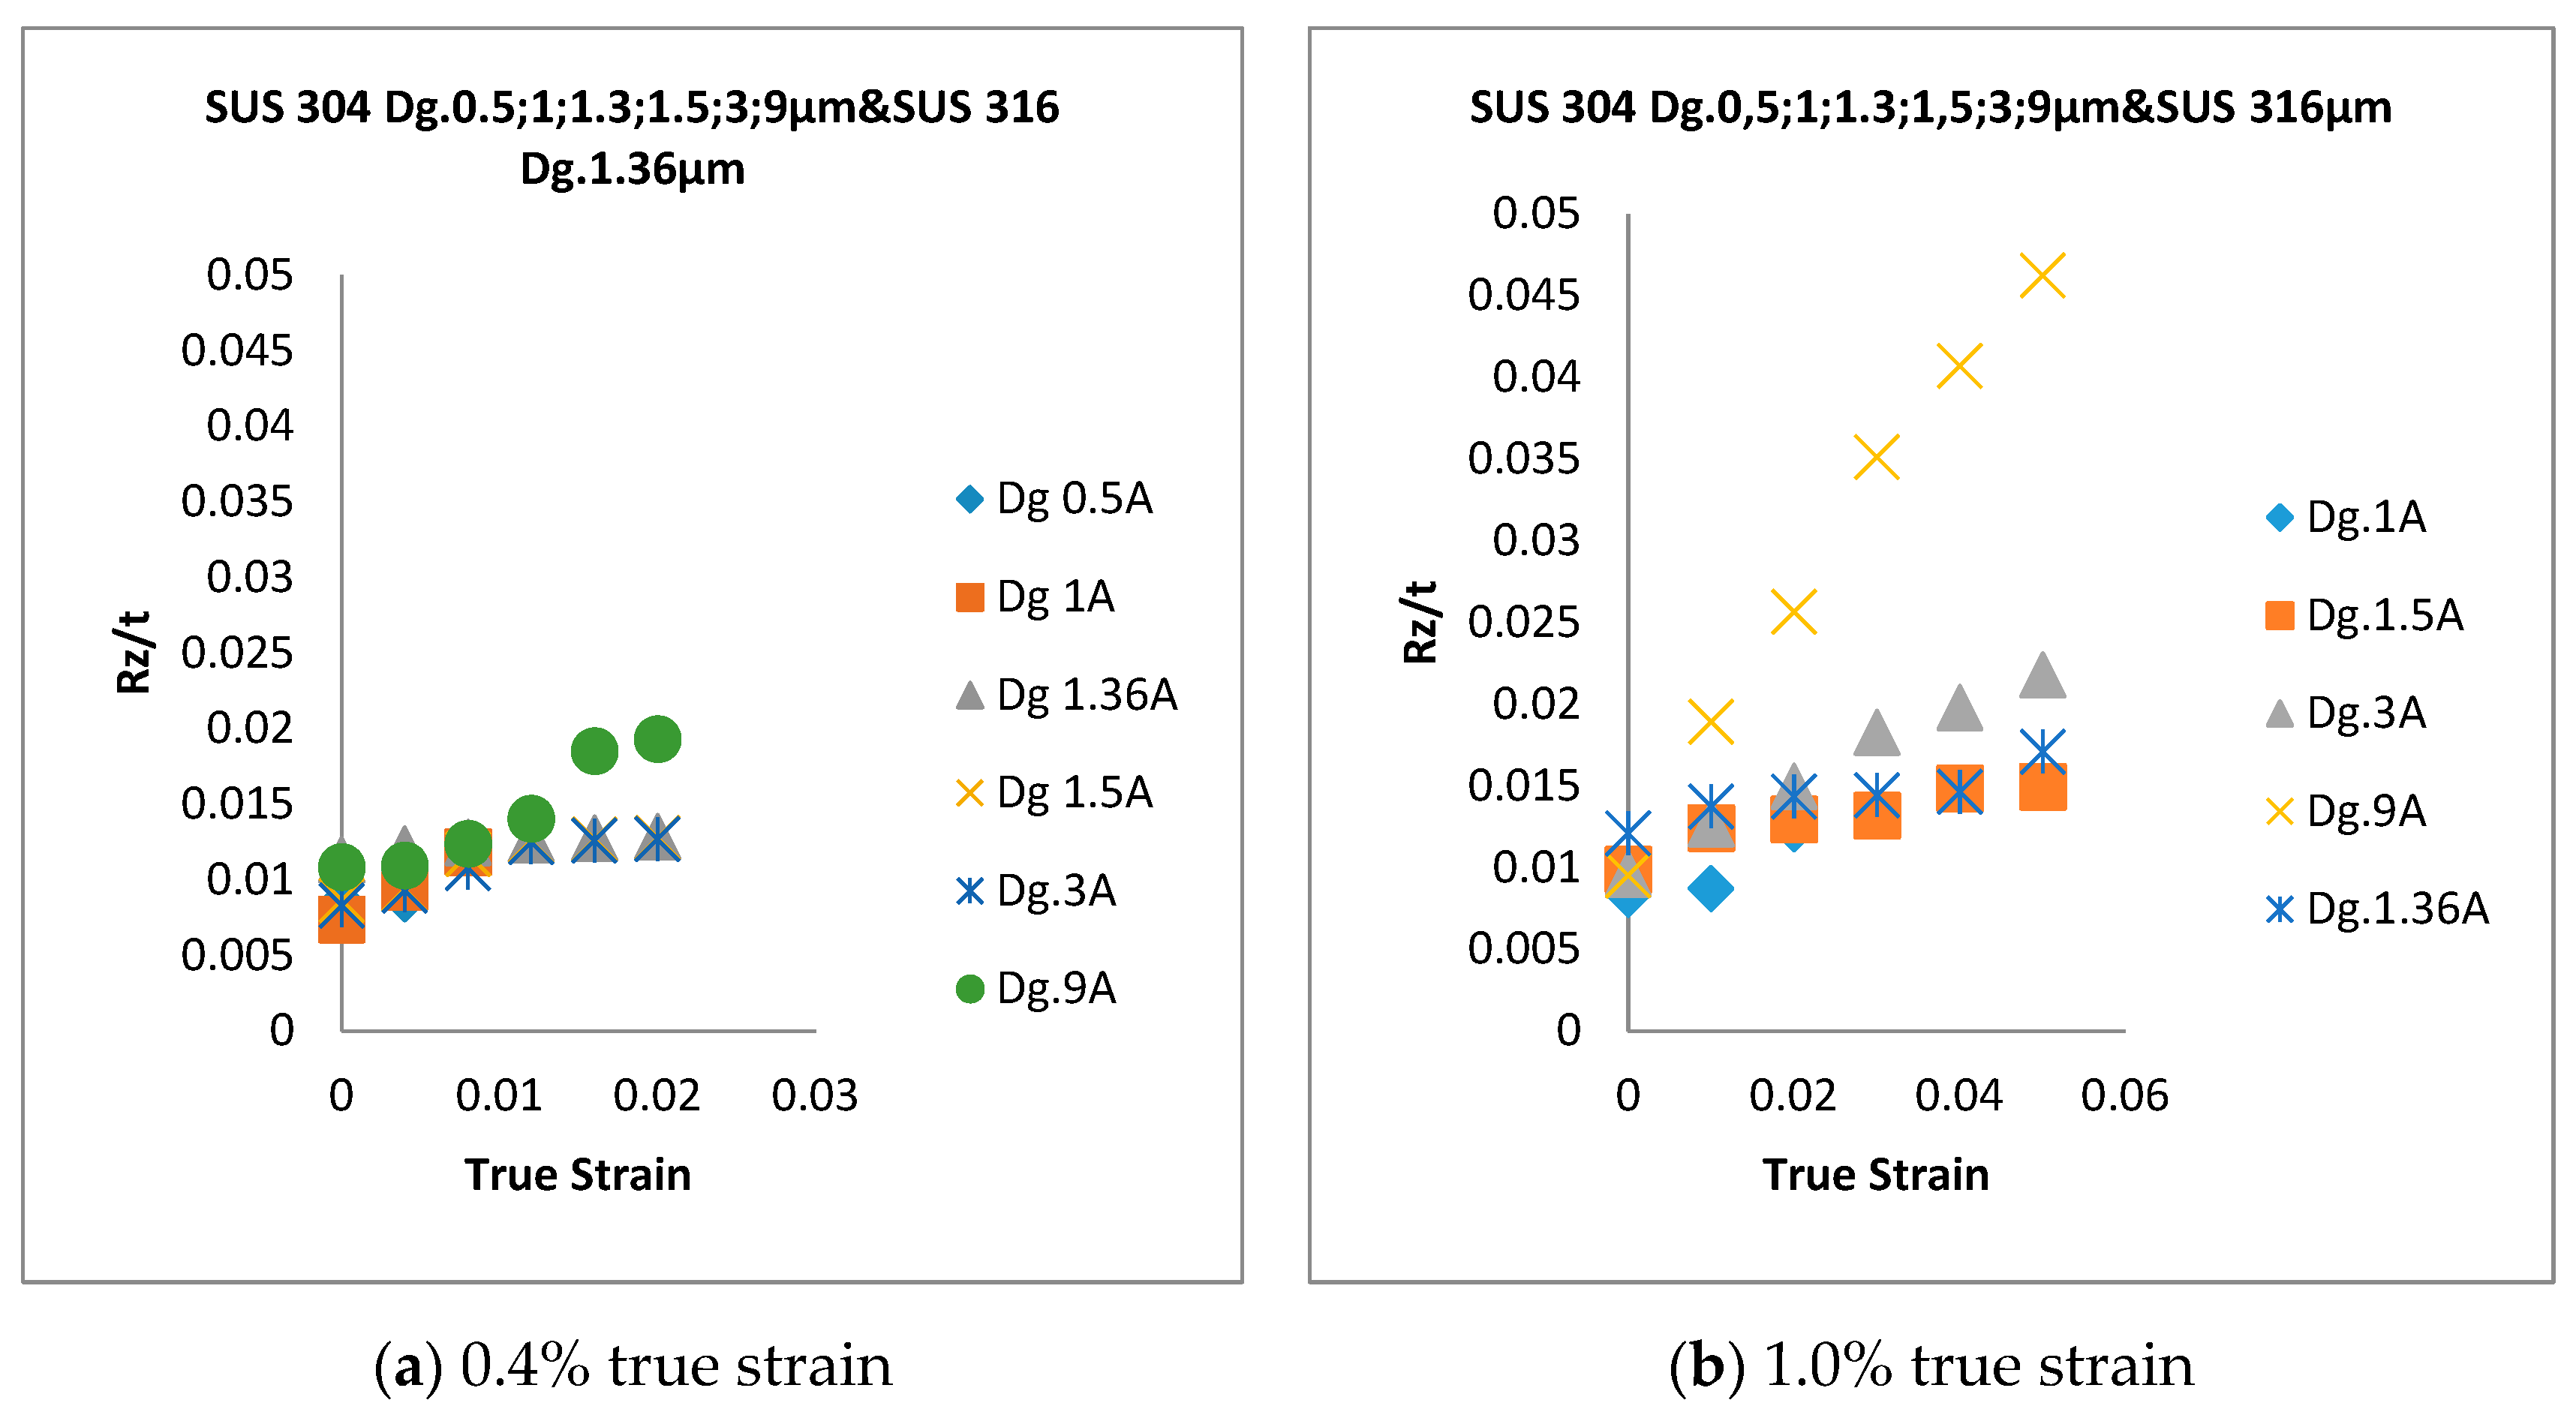
The surface roughness (Rz/t) with a low strain is shown in Figure 6a, and the Rz/t with a high strain is shown in Figure 6b. The Rz/t increases proportionally for coarse grain and not proportionally for fine grain, both at low and high strains.
Rz/t is measured both at a low strain (0.4%) for one step of the tensile test and at a high strain (1.0%) for another step of the tensile test. The thin foil materials are subjected to the same strain level, both low strain and high strain, for every step during the step-by-step uniaxial tensile stress state. The total of the five-step uniaxial tensile stress states, both at a low strain and high strain, are shown in Figure 6a,b, respectively. The result shows that for coarse grain, the Rz/t increases proportionally during the uniaxial tensile stress state for five stages, both with the low and high strains. However, the Rz/t increase is not proportional both for the low and high strains in fine grain. The Rz/t mechanism is correlated with the fracture strain and increased surface roughness behavior for coarse grain and fine grain. The Rz/t shown in Figure 6b is compared to the results of Furushima et al. [27]. It is shown that for coarse grain with the same thickness, for both the previous findings using Dg = 65.6 μm and the current result with Dg = 9.0 μm, the Rz/t increases proportionally during the uniaxial tensile stress state. This result is correlated with the weak grain deformation during the uniaxial tensile stress state [25]. For the coarse grain, the scattering of the flow stress increases, along with the surface roughness [31]. In addition, a weak deformation of a coarse grain changes its orientation, with a large inclination angle from the normal direction [30]. The surface roughening behaviors have the same tendency both in Ra and Rz, with the same Dg and strain level, during the plastic deformation.
Based on Figure 6, the Rz/t increases in line with the increase of the plastic strain, both at the low and high strains, due to the uniaxial tensile stress state. For the fine Dg, the increase of the surface roughness for SUS 304 and 316 is nearly the same, because the increasing surface roughness and ductility are relatively similar. The lower fracture strain and lower increasing surface roughness caused by the higher work hardening in fine grain are compared to those in coarse grain. In fine grain, the dislocation density increases, and the dislocation becomes more difficult to move during plastic deformation. When the Dg is changed from 1.4 to 1.5 μm, the Rz and grain deformation may only slightly change the orientation of the fine grains themselves, which affects the surface roughness behavior. Furthermore, the grain deformation might change the inter-grain rotation and inter-grain orientation. Thus, for SUS 304 thin metal foils, the fracture strain has an important role in showing the surface roughness behavior. Both fine-grain SUS 304 and SUS 316 thin metal foils have nearly the same surface roughness because of their relatively similar ductility and increasing surface roughness.
3.2. Discussion
Figure 7a shows the EBSD result of the SEM-EBSD experiment for fine-grain SUS 316. The red color is gamma (γ) iron, known as FCC metastable ASS, and the green color is alpha (α) iron, known as MPT. The type of crystal lattice shown in Figure 7b,d,f consists of (101) lattice crystal, shown in green, (001) lattice crystal, shown in red, and (111) lattice crystal, shown in blue. The austenite phase crystal structure transformation shown in Figure 7b,d,f is known as the FCC crystal structure, and the transformation into martensite is known as the BCT crystal structure. No MPT occurs in SUS 316, both at the low and high strain levels, because there is not a color change from red to green in SUS 316, as shown in the Figure 7a. Grain deformation occurs in the fine-grain SUS 316 thin metal foils, because there is a grain change in the as-received sample, both as the low strain and high strain, as shown in Figure 7b. From the SEM result, the grain deformation at the high strain level is larger than that at the low strain level, as shown by the grain change morphology, from the low strain up to the high strain level. No MPT occurs both at the low and high strains in the thin metal foil SUS 316, because the SUS 316 thin metal foil consists of more nickel as the austenitic stabilizer, compared to SUS 304 thin metal foil. It is difficult to transform the austenitic phase in SUS 316 into MPT, even at the high strain, because of the high austenitic stabilizer, such as nickel elements. The surface roughening in the fine-grain SUS 316 and SUS 304 are almost the same, both at the low and high strain levels, because the grain strength is affected by the very high MPT, local grain misorientation in SUS 304, and high local grain misorientation in SUS 316. When the quantity of MPT increases in a grain, the Mf increases. Plastic deformation occurs in the hard fine-grain SUS 316 thin metals and very hard fine-grain SUS 304 thin metals. The deformation mechanism in the fine grain is the inter-grain deformation mechanism, which gives a low grain inclination to the normal direction and slightly increases the surface roughness.
The SEM-EBSD results shown in Figure 7c are the EBSD results for fine-grain SUS 304. The result shows that MPT transformations occur at the low-strain and high-strain levels. The MPT and Mf are very high, which is indicated by the very high color change, from red as the austenitic phase to green as the MPT at the high-strain level. That grain deformation occurs in SUS 304 thin metal foils was indicated by the grain change as the strain increased from low to high. The SEM result shown in Figure 7d shows that the grain deformation at the high strain is larger than that at the low strain, which is indicated by the grain change morphology. Based on the SEM results, the grain deformation at the high strain is higher than that at the low strain.
The grain deformation in the coarse-grain SUS 304 is larger than that in the fine-grain, and a more severe grain deformation occurs in coarse grain, as shown in Figure 7f, compared to fine grain. This result is the reason for the higher increase in surface roughness in coarse grain, compared to fine grain. Furthermore, the surface roughness increases proportionally with the same strain level in coarse grain, unlike in fine grain, during the uniaxial tensile stress state. Based on the EBSD results, the MPT in coarse grain is lower than that in fine grain. Thus, the grain strength is lower, compared to that in fine grain, and the surface roughness becomes higher, because coarse grain is easier to deform.
The MPT in fine-grain SUS 304 is higher than that in coarse-grain SUS 304 thin metal foils. In fine grain, the slip band intersection is higher than that in coarse grain, with the same plastic deformation. The slip band intersection is the site of martensitic embryo and nucleation. The more there is slip band intersection, the higher the MPT in a grain. In fine grain, the probability of slip band intersection is higher, compared to that in coarse grain, at the same strain level. The higher MPT results in the grain becoming stronger, which is indicated by the lower surface roughening value at the same strain level. Both in fine grain and coarse grain, there is obvious grain deformation at the same strain level. There are larger grain deformations in coarse grain, compared to those in fine grain, which is indicated by the fact that coarse grain has a weaker strength, compared to fine grain [25].
When the strain increases, the surface hardening increases. The Mf increases in proportion to the increase in plastic deformation The Mf increases in proportion to the increasing plastic deformation [12]. This conclusion is consistent with the current result. When the strain increases, the slip band intersection increases, and the Mf increases. The effect of the increase of Mf and MPT in hardening the surface of the grain causes fine grain to have a lower Ra or Rz value. With the strain increase, the adiabatic heating increases in the grain, which leads to MPT. Adiabatic heating activates the movement of slip bands and intersections that promote martensitic nucleation. Furthermore, when the grain is larger, the share of surface grain is increased, which results in a decreasing flow stress [35]. The lower dislocation density weakens the grain, which is indicated by the lower flow stress. The lower MPT lowers the flow stress after the tensile test for five steps, both for fine and coarse grain. Based on the Olson–Cohen (OC) model and theory, the slip band intersection becomes a martensitic embryo and nucleation. Thus, the greater the intersection, the higher the embryo and nucleation and, hence, the higher the Mf in a grain. The plastic strain function or environmental temperature is the mean constituent of the transformation curve in the OC model. The OC equation is only for the austenitic condition, which will transform into martensite after plastic deformation [34]. SUS 304 thin foil materials with the same thickness will have a decreased number of grains, as the size of the grains increases. When the Dg increases in the same area, the grain obstacle decreases, and it becomes easier to change the orientation of the grain because of plastic deformation. In consequence, the surface roughening increases because of plastic deformation with the same strain level. The OC model is in accordance with current research using the function of plastic strain. ε martensite occurs at a low strain, which is caused by the occurrence of Strain Induced Martensitic Transformation (SIMT) that changes the austenite phase into ε martensite. ά martensite occurs at a high strain, causing the austenite to be transformed into ά martensite [16].
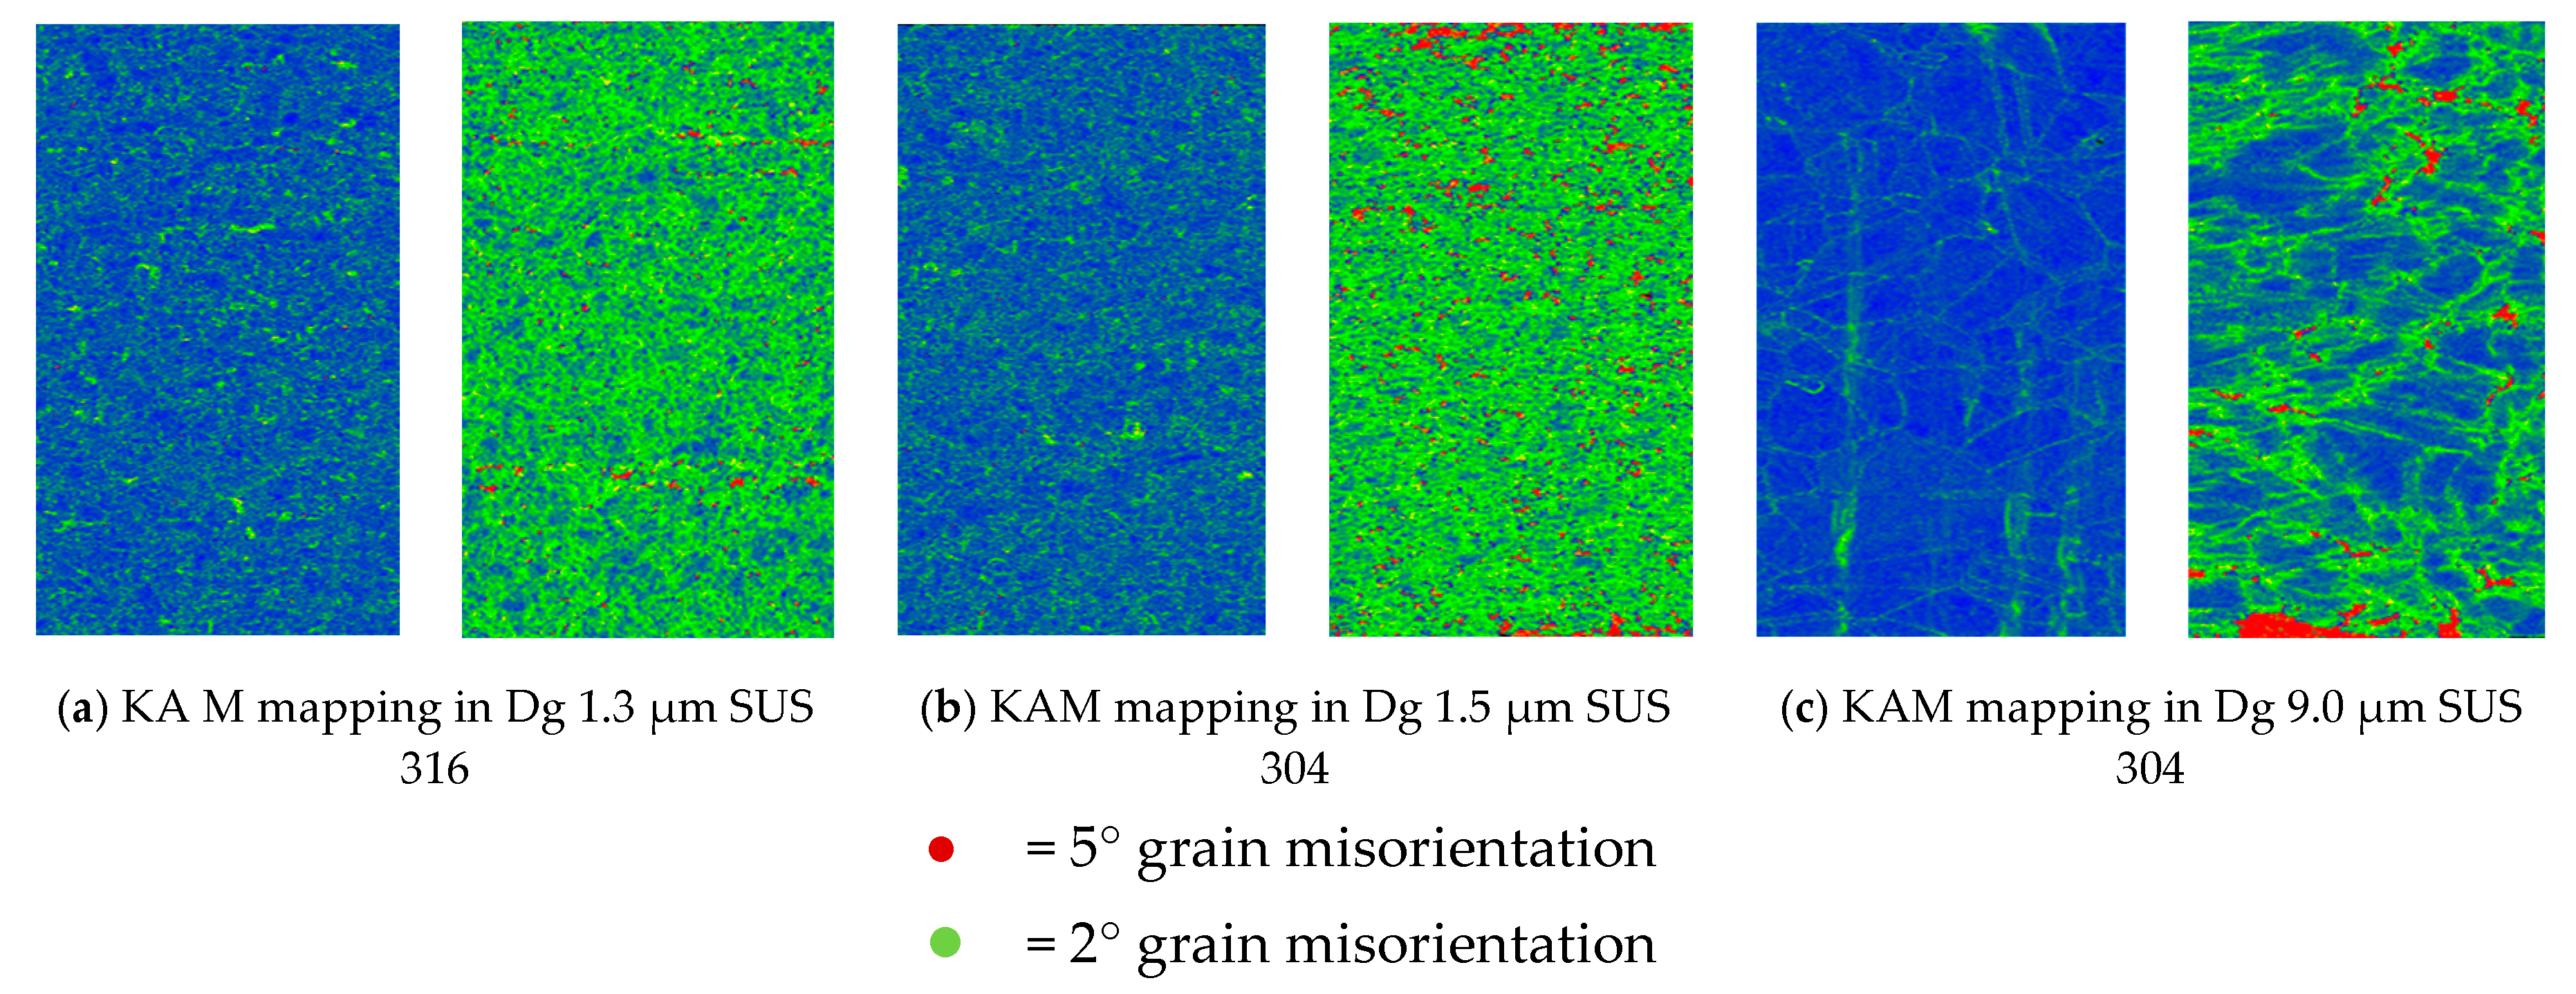
The kernel average misorientation (KAM) obtained from the calculation of the misorientation between the center point and all the surrounding points in the kernel are calculated and averaged. The result shows a local misorientation value of the center point. The KAM calculation that is obtained in two degrees of grain misorientation is indicated in green, and the KAM calculation that is obtained in five degrees of grain misorientation is indicated in red. Grain that has a green color has a high-strength mechanical property, and grain that has a red color has a very-high-strength grain property. Based on Figure 8a, the grain misorientation is highly indicated by the two degrees of grain misorientation. This indicates that the grain strength in SUS 316 thin metal foils is high. The grain misorientation is highest in SUS 304 fine-grain thin metal foil, which has a very high grain misorientation that is indicated by two full degrees of grain misorientation and five degrees of grain misorientation, as shown in Figure 8b. The red color volume in fine-grain SUS 304 thin metal foils (Figure 8b) is higher than the red color volume in fine-grain SUS 316 (Figure 8a) and coarse-grain SUS 304 (Figure 8c) thin metal foils. The green color in fine-grain SUS 304 thin metal foils is equal to the green color in fine-grain SUS 316 thin metal foils. The green color in coarse-grain SUS 304 thin metal foils is lower than that in other materials. This means that the grain strength in fine-grain SUS 304 thin metal foils is higher than that in the other materials.
Based on Figure 8b, the red color is 5°, and the green color is 2°, which indicates that the red color has a higher misorientation than the green color. The local misorientation in both fine-grain SUS 304 and 316 are different, as shown in Figure 8. The degree of grain misorientation, represented by the red color, is higher than the green color, meaning that SUS 304 materials with a fine grain have a higher misorientation than SUS 316 materials with a fine grain. As shown in the EBSD in Figure 8, there is a higher number of red misorientations in SUS 304 thin metal foils than in SUS 316 thin metal foils. This means that the grain of SUS 304 is harder than the grain of SUS 316. The grain deformation mechanism for both ASS fine-grain SUS 304 and SUS 316 thin metal foils is inter-grain deformation (29.32). Inter-grain deformation almost does not change the surface roughness of thin metals with a fine grain. Thus, the surface roughness in fine-grain SUS 304 thin metal is almost the same as that in fine-grain SUS 316 thin metal, even though the grain of SUS 304 is harder than the grain of SUS 316. The uniaxial tension, with the same strain applied to the thin metal foils, increases the average roughness.
The onset of diffuse necking occurred when the rate of average roughness increased. The relative inclination between neighboring grains in the original direction to the surface implies the roughening of the free surface. On a rough surface, there is a single grain with a mountain and valley that extend towards a state of uniaxial tensile stress. In a similar area, the difference in grain deformation in a low population is higher, compared to that in a high population of grain, at the same strain level. When strain is applied, the change in the direction and mean value of the grain angle increases, compared to the initial state. This is a very important factor in increasing the roughness of the metal surface. An inhomogeneous deformation inside the grain increases in proportion to the strain level, as shown by the average roughness of the grain [30]. When the inclination is large, the surface roughness becomes high. In fine-grain thin metal foils, the relative inclination between neighboring grains is low. Thus, the surface roughness becomes low, even at the large strain. For the fine-grain SUS 304 and SUS 316 thin metal foils, the difference in grain deformation is low, and the effect on the relative inclination between neighboring grains in the original direction to the surface is low; thus, the surface roughness increase is low. This is the reason why the surface roughness in fine-grain SUS 304 and SUS 316 thin metal foils is the same. The local misorientation in fine grain is higher than that in coarse grain. The higher local misorientation increases the strength of a grain, because the dislocation density increases, and dislocation movement becomes more difficult. Thus, it is more difficult to deform fine grain, compared to coarse grain, at the same strain level. In consequence, the surface roughness in fine grain is lower than that in coarse grain.
4. Conclusions
- MPT only occurs in SUS 304 thin metal foils, both with a fine or coarse grain, because of the high chromium element, as the ferrite stabilizer, and the carbon element, as the martensite element. Chromium could become a carbide compound that increases the strength of a grain.
- MPT does not occur in SUS 316 up to a strain level of 1.0% because of the high nickel element, as an austenite stabilizer. It is very difficult to transform austenite into MPT at the same strain level. The local misorientation in SUS 316 thin metal foils is high. This indicates that the mechanical property of a grain is hard. The local misorientation in SUS 304 thin metal foils is very high. This indicates that the mechanical property of the grain in SUS 304 thin metal foils is very hard.
- In SUS 304 thin foils, the surface roughness increases proportionally in coarse grain because of the lower slip band intersection, which lowers the MPT and Mf in coarse grain, compared to fine grain. The slip band intersection increases more in fine grain, compared to coarse grain. As result, the MPT increases more in fine grains than in coarse grains. As the MPT increases, the Mf increases.
- The surface roughness does not increase proportionally in fine grain because of the higher slip band intersection and higher MPT in SUS304. There are higher local misorientations both in fine-grain SUS 316 and SUS 304 thin metal foils, compared to the coarse-grain foils. The higher MPT or higher local misorientation in the fine grain gives the grain higher strength, compared to the coarse grain, with a lower MPT or lower local misorientation, which weakens the grain. Based on the SEM EBSD analysis, the MPT and Mf increase in proportion with the increase of the strain level. The MPT and Mf decrease in proportion with the increase of Dg. MPT and Mf increase in proportion with the decrease of Dg.
- The local grain misorientation in SUS 304 thin metal foils is higher than in SUS 316 thin metal foils.
Author Contributions
A.A. was responsible for making the research plan, doing the experiment, analyzing the data, conducting the discussion and drawing the conclusion. M.Y. was responsible for supervising the author through making the research plan, doing the experiment, and conducting the discussion until the result was obtained. All authors have read and agreed to the published version of the manuscript.
Funding
This research was not financed by external funding sources.
Acknowledgments
The authors would like to express their sincere gratitude and appreciation to Komatsuseiki Kosakusho Co. Ltd., especially to Yohei Suzuki San, and Tomoaki Yoshino San for providing supporting samples, and Associate Professor Tsuyoshi FURUSHIMA, Institute of Industrial Science, The University of Tokyo for lending the authors the Shimadzu Tensile Machine and Keyence Confocal Laser Microscope (VE 8800, Keyence Co.). The current work was supported by the advanced materials processing engineering laboratory (AMPEL) of TMU, Japan and IsDB—UNTIRTA, Indonesia.
Conflicts of Interest
The authors hereby declare that there is no conflict of interest that needs to be disclosed in connection with the publication of this study.
References
- Xue, Z.Y.; Zhou, S.; Wei, X.C. Influence of pre-transformed martensite on work-hardening behavior of SUS 304 metastable austenitic stainless steel. J. Iron Steel Res. Int. 2010, 17, 51–55. [Google Scholar] [CrossRef]
- Engel, U.; Eckstein, R. Microforming—From basic research to its realization. J. Mater. Process. Technol. 2002, 125–126, 35–44. [Google Scholar] [CrossRef]
- Furushima, T.; Manabe, K. Experimental and Numerical Study on Deformation Behavior in Dieless Drawing Process of Superplastic Microtubes. J. Mater. Process. Technol. 2007, 191, 59–63. [Google Scholar] [CrossRef]
- Milad, M.; Zreiba, N.; Elhalouani, F.; Baradai, C. The effect of Cold Work on Structure and Properties of AISI 304 Stainless Steel. J. Mater. Process. Technol. 2008, 203, 80–85. [Google Scholar] [CrossRef]
- Jha, A.K.; Sivakumar, D.; Sreekumar, K.; Mittal, M.C. Role of Transformed Martensite in the Cracking of Stainless Steel Plumbing Lines. Eng. Fail. Anal. 2008, 15, 1042–1051. [Google Scholar] [CrossRef]
- Lo, K.H.; Shek, C.H.; Lai, J.K.L. Recent developments in stainless steels. Mater. Sci. Eng. R 2009, 65, 39–104. [Google Scholar] [CrossRef]
- Nohara, K.; Ono, Y.; Ohashi, N. Composition and grain size dependencies of strain-induced martensitic transformation in metastable austenitic stainless steels. Tetsu-To-Hagane 1977, 63, 772–782. [Google Scholar] [CrossRef] [Green Version]
- Diani, J.M.; Parks, D.M. Effects of strain state on the kinetics of strain-induced martensite in steels. J. Mech. Phys. Solids 1998, 46, 1613–1635. [Google Scholar] [CrossRef]
- Iwamoto, T.; Tsuta, T.; Tomita, Y. Investigation on deformation mode dependence of strain-induced martensitic transformation in TRIP steels and modelling of transformation kinetics. Int. J. Mech. Sci. 1998, 40, 173–182. [Google Scholar] [CrossRef]
- Iwamoto, T.; Tsuta, T. Computational simulation of the dependence of the austenitic grain size on the deformation behavior of TRIP steels. Int. J. Plast. 2000, 16, 791–804. [Google Scholar] [CrossRef]
- Huang, J.X.; Ye, X.N.; Xu, Z. Effect of cold rolling on microstructure and mechanical properties of AISI 301LN metastable austenitic stainless steels. Iron Steel Res. Int. 2012, 19, 59–63. [Google Scholar] [CrossRef]
- Qin, Z.; Xia, Y. Role of strain–induced martensitic phase transformation in mechanical response of 304L steel at different strain–rates and temperatures. J. Mater. Process. Technol. 2020, 280, 116613. [Google Scholar] [CrossRef]
- Peng, F.; Dong, X.H.; Liu, K.; Xie, H.Y. Effects of strain rate and plastic work on martensitic transformation kinetics of austenitic stainless steel 304. J. Iron Steel Res. Int. 2015, 22, 931–936. [Google Scholar] [CrossRef]
- Tomita, Y.; Iwamoto, T. Constitutive modeling of TRIP steel and its application to the improvement of mechanical properties. Int. J. Mech. Sci. 1995, 37, 1295–1305. [Google Scholar] [CrossRef]
- Zandrahimi, M.; Bateni, M.R.; Poladi, A.; SJerzy, A.S. The formation of martensite during wear of AISI 304 stainless steel. Wear 2007, 263, 674–678. [Google Scholar] [CrossRef]
- Choi, J.Y.; Ji, J.H.; Hwang, S.W.; Park, K.T. Strain induced martensitic transformation of Fe-20Cr-5Mn-0,2Ni duplex stainless steel during cold rolling: Effects of nitrogen addition. Mater. Sci. Eng. A 2011, 528, 6012–6019. [Google Scholar] [CrossRef]
- Yamaguchi, K.; Mellor, P.B. Thickness and Grain Size Dependence of Limit Strains in Sheet Metal Stretching. Int. J. Mech. Sci. 1976, 18, 85–90. [Google Scholar] [CrossRef]
- Osakada, K.; Oyane, M. On the Roughening Phenomena of Free Surface in Deformation Process. Trans. Jpn. Soc. Mech. Eng. 1970, 36, 1017–1022. [Google Scholar] [CrossRef] [Green Version]
- Fukuda, M.; Yamaguchi, K.; Takakura, N.; Sakano, Y. Roughening Phenomenon on Free Surface of Products in Sheet Metal Forming. J. Jpn. Soc. Technol. Plast. 1974, 15, 994–1002. [Google Scholar]
- Yamaguchi, K.; Takakura, N.; Fukuda, M. FEM simulation of surface roughening in FCC metals Using Direct Numerical Simulation. Acta Mater. 2004, 52, 5791–5804. [Google Scholar]
- Vollertsen, F.; Nichoff, H.S.; Hu, Z. State of the art in micro forming. Int. J. Mach. Tools Manuf. 2006, 46, 1172–1179. [Google Scholar] [CrossRef]
- Meng, B.; Fu, M.W. Size effect on deformation behavior and ductile fracture in microforming of pure copper sheets considering free surface roughening. Mater. Des. 2015, 83, 400–412. [Google Scholar] [CrossRef]
- Cheng, C.; Wan, M.; Meng, B. Size Effect on the forming limit of sheet metal in micro-scaled plastic deformation considering free surface roughening. Procedia Eng. 2017, 207, 1010–1015. [Google Scholar] [CrossRef]
- Stoudt, M.R.; Hubbard, J.B.; Leigh, S.D. On the relationship between deformation-induced surface roughness and plastic strain in AA5052. Metall Mater. Trans A 2011, 42A, 2668–2679. [Google Scholar] [CrossRef]
- Furushima, T.; Tsunezaki, H.; Manabe, K.I.; Yang, M.; Alexandrov, S. Influence of Free Surface Roughening on Ductile Fracture Behavior Under Uni-axial Tensile State For Metal Foils. In Proceedings of the 13th International Conference on Fracture, Beijing, China, 16–21 June 2013. [Google Scholar]
- Raabe, D.; Sachtleber, M.; Weiland, H.; Scheele, G.; Zhao, Z. Grain-scale micromechanics of polycrystal surfaces during plastic straining. Acta Mater. 2003, 51, 1539–1560. [Google Scholar] [CrossRef]
- Furushima, T.; Tsunezaki, H.; Manabe, K.-I.; Alexandrov, S. Ductile fracture and free surface roughening behaviors of pure copper foils for micro/meso-scale forming. Int. J. Mach. Tools Manuf. 2014, 76, 34–48. [Google Scholar] [CrossRef]
- Zhang, L.; Xu, W.; Liu, C.; Ma, X.; Long, J. Quantitative Analysis of Surface Roughness Evolution in FCC Polycrystalline Metal during Uniaxial Tension. Comput. Mater. Sci. 2017, 132, 19–29. [Google Scholar] [CrossRef]
- Yoshida, K. Effect of Grain Scale Heterogeneity on Surface Roughness and Sheet Metal Necking. Int. J. Mech. Sci. 2014, 83, 48–56. [Google Scholar] [CrossRef]
- Shimizu, I.; Okuda, T.; Abe, T.; Tani, H. Surface Roughening and Deformation of Grains during Uniaxial Tension of Polycrystalline Iron. JSME Int. J. Ser. A 2001, 44, 499–506. [Google Scholar] [CrossRef] [Green Version]
- Peng, L.; Xu, Z.; Gao, Z.; Fu, M.W. A Constitutive Model for Metal Plastic Deformation At Micro/Meso Scale With Consideration of Grain Orientation And Its Evolution. Int. J. Mech. Sci. 2018, 138–139, 74–85. [Google Scholar] [CrossRef]
- Furushima, T.; Tsunezaki, H.; Nakayama, T.; Manabe, K.; Alexandrov, S. Sergei Alexandrov, Prediction of Surface Roughening and Necking Behavior for Metal Foils by Inhomogeneous FE material Modelling. Key Eng. Mater. 2013, 554–557, 169–173. [Google Scholar] [CrossRef]
- Groche, P.; Schafer, R.; Justinger, H.; Ludwig, M. On the correlation between crystallographic grain size and surface evolution in metal forming process. Int. J. Mech. Sci. 2010, 52, 523–530. [Google Scholar] [CrossRef]
- Olson, G.B.; Cohen, M. Kinetics of strain-induced martensitic nucleation. Met. Trans. 1975, A6, 791–795. [Google Scholar] [CrossRef]
- Xu, J.; Guo, B.; Shan, D.; Li, M.; Wang, Z. Specimen Dimension, Grain Size Effect and Deformation Behavior in Micro Tensile of SUS 304 Stainless Steel Foil. Mater. Trans. 2013, 54, 984–989. [Google Scholar] [CrossRef] [Green Version]
Figure 1.
SUS 304 and 316 thin metal foils with different sizes of Dg (as received). (a) Dg 0.5 μm SUS 304; (b) Dg 1.0 μm SUS 304; (c) Dg 1.3 μm SUS 316; (d) Dg 1.5 μm SUS 316; (e) Dg 3.0 μm SUS 304; (f) Dg 9.0 μm SUS 316.
Figure 1.
SUS 304 and 316 thin metal foils with different sizes of Dg (as received). (a) Dg 0.5 μm SUS 304; (b) Dg 1.0 μm SUS 304; (c) Dg 1.3 μm SUS 316; (d) Dg 1.5 μm SUS 316; (e) Dg 3.0 μm SUS 304; (f) Dg 9.0 μm SUS 316.

Figure 2.
(a) Specimen for the tensile test. (b) Photo micrograph of the crystal structure.


Figure 3.
Deformation behavior of thin metal foils.

Figure 4.
Ra with a 1% strain.

Figure 5.
Surface roughening (Ra) behavior of thin metal foils SUS 304 and SUS 316. (a) 0.4% true strain; (b) 1.0% true strain.
Figure 5.
Surface roughening (Ra) behavior of thin metal foils SUS 304 and SUS 316. (a) 0.4% true strain; (b) 1.0% true strain.

Figure 6.
Rz/t behavior of thin metal foils SUS 304 and SUS 316. (a) 0.4% true strain; (b) 1.0% true strain.
Figure 6.
Rz/t behavior of thin metal foils SUS 304 and SUS 316. (a) 0.4% true strain; (b) 1.0% true strain.

Figure 7.
SEM-EBSD Mapping for SUS 304 and SUS 316 thin metal foils. (a) EBSD phase mapping in Dg 1.36 μm SUS 316; (b) EBSD IPF Mapping in Dg 1.36 μm SUS 316; (c) EBSD phase mapping in Dg 1.5 μm SUS 304; (d) EBSD IPF mapping in Dg 1.5 μm SUS 304; (e) EBSD phase mapping in Dg 9.0 μm SUS 304; (f) EBSD IPF mapping in Dg 9.0 μm SUS 304.


Figure 8.
Kernel average misorientation (KAM) mapping for SUS 304 and SUS 316 thin metal foils. (a) KAM mapping in Dg 1.3 μm SUS 316; (b) KAM mapping in Dg 1.5 μm SUS 304; (c) KAM mapping in Dg 9.0 μm SUS 304.
Figure 8.
Kernel average misorientation (KAM) mapping for SUS 304 and SUS 316 thin metal foils. (a) KAM mapping in Dg 1.3 μm SUS 316; (b) KAM mapping in Dg 1.5 μm SUS 304; (c) KAM mapping in Dg 9.0 μm SUS 304.


Table 1.
Chemical composition of thin metal foils of SUS 304.
| Cr | Ni | S | P | C | Si | Mn | |
|---|---|---|---|---|---|---|---|
| Min | 18.00 | 8.00 | - | - | - | - | - |
| Max | 20.00 | 10.50 | 0.030 | 0.045 | 0.08 | 1.00 | 2.00 |
| - | 18.01 | 8.03 | 0.004 | 0.030 | 0.05 | 0.39 | 1.10 |
Table 2.
Chemical composition of SUS 316 thin metal foils with a grain size (Dg) of 1.36 μm.
| Mo | Cr | Ni | P | S | C | Si | Mn | |
|---|---|---|---|---|---|---|---|---|
| Min | 2.00 | 16.00 | 12.00 | - | - | - | - | - |
| Max | 3.00 | 18.00 | 15.00 | 0.045 | 0.030 | 0.030 | 1.00 | 2.00 |
| - | 2.07 | 17.41 | 12.22 | 0.035 | 0.001 | 0.012 | 0.66 | 1.20 |
Publisher’s Note: MDPI stays neutral with regard to jurisdictional claims in published maps and institutional affiliations. |
© 2020 by the authors. Licensee MDPI, Basel, Switzerland. This article is an open access article distributed under the terms and conditions of the Creative Commons Attribution (CC BY) license (http://creativecommons.org/licenses/by/4.0/).
Share and Cite
MDPI and ACS Style
Aziz, A.; Yang, M. Effect of Martensitic Transformation and Grain Size on the Surface Roughening Behavior in SUS 304 and SUS 316 Thin Metal Foils. Eng 2020, 1, 167-182. https://0-doi-org.brum.beds.ac.uk/10.3390/eng1020011
AMA Style
Aziz A, Yang M. Effect of Martensitic Transformation and Grain Size on the Surface Roughening Behavior in SUS 304 and SUS 316 Thin Metal Foils. Eng. 2020; 1(2):167-182. https://0-doi-org.brum.beds.ac.uk/10.3390/eng1020011
Chicago/Turabian StyleAziz, Abdul, and Ming Yang. 2020. "Effect of Martensitic Transformation and Grain Size on the Surface Roughening Behavior in SUS 304 and SUS 316 Thin Metal Foils" Eng 1, no. 2: 167-182. https://0-doi-org.brum.beds.ac.uk/10.3390/eng1020011