Limitations of Modern Diagnostic and Prognostic Systems for a Hydraulic Unit’s Health

Center of Design and Technological Innovation, LLC, 197376 Saint-Petersburg, Russia
Eng 2021, 2(1), 27-42; https://0-doi-org.brum.beds.ac.uk/10.3390/eng2010003
Submission received: 28 December 2020
/
Revised: 22 January 2021
/
Accepted: 27 January 2021
/
Published: 1 February 2021
Abstract
:Modern diagnostic systems for the hydraulic unit’s health play an important role in ensuring the reliability and safety of the hydroelectric power plant (HPP). However, they cannot provide timely detection of such dangerous operational defects as fatigue cracks. This article reflects two main reasons for this problem. The first one is a high level of the individuality of hydraulic units, which does not allow the effective use of statistical methods of information processing, including BIG DATA and MACHINE LEARNING technologies. The second is the fundamental impossibility to identify cracks in some key components of hydraulic units only on the basis of data analysis from a standard diagnostic system usually used at the HPP. Developed computational studies on the example of Francis turbines confirmed this. It is proposed to supplement the functionality of standard diagnostic systems with a prognostic block for an individual analytical forecast of the unit’s residual lifetime based on the calculated assessment of fatigue strength. This article presents the developed conceptual diagram and the demonstration version of the proposed analytical predictive system. The comparison of the standard vibration diagnostic system and the proposed solution as a tool for the early detection of cracks in a Francis turbine runner shows some advantages of the proposed approach.
1. Introduction
The modern systems for monitoring and diagnostics of the equipment technical state installed at hydroelectric power plants (HPP) should help to improve the reliability and safety of hydraulic unit’s operation due to the timely detection of damages and emerging defects in the operating equipment. At present, such systems at HPPs mainly perform the role of warning and alarm signaling [1,2]. They are almost never used to predict changes in the technical state in terms of lifetime assessment or planning repairs based on condition.
It should be noted that the systems for monitoring and diagnostics of HPP’s equipment are constantly evolving, taking into account the tightening requirements for the conditions of the unit’s usage [3,4,5,6] and the changing regulatory framework [7,8,9]. In recent years, predictive self-learning systems using artificial intelligence and based on BIG DATA and MACHINE LEARNING (ML) technologies [10,11,12] have been actively introduced at various energy facilities.
The successful ML’s applications in the hydropower sector are aimed at the forecast of the inflow, streamflow, consumption, generation projections, cavitation problems [13,14], and do not concern the lifetime prediction or crack propagation. Nowadays, predicting cracks in runners and lifetime issues are only solved by remote diagnostic centers or experts. As a result, large through cracks in critical components of a hydraulic unit are often detected only during planned shutdowns for repairs when their elimination requires a lot of time and money. In the worst case, the development of a defect can cause an emergency shutdown of the equipment due to the destruction of some elements, damaging rotating and stationary elements, or the unit’s operating parameters going beyond the permissible values. As a rule, an emergency shutdown causes a long downtime of the hydraulic unit due to a full revision, replacement of damaged elements, and the necessary restorative repairs.
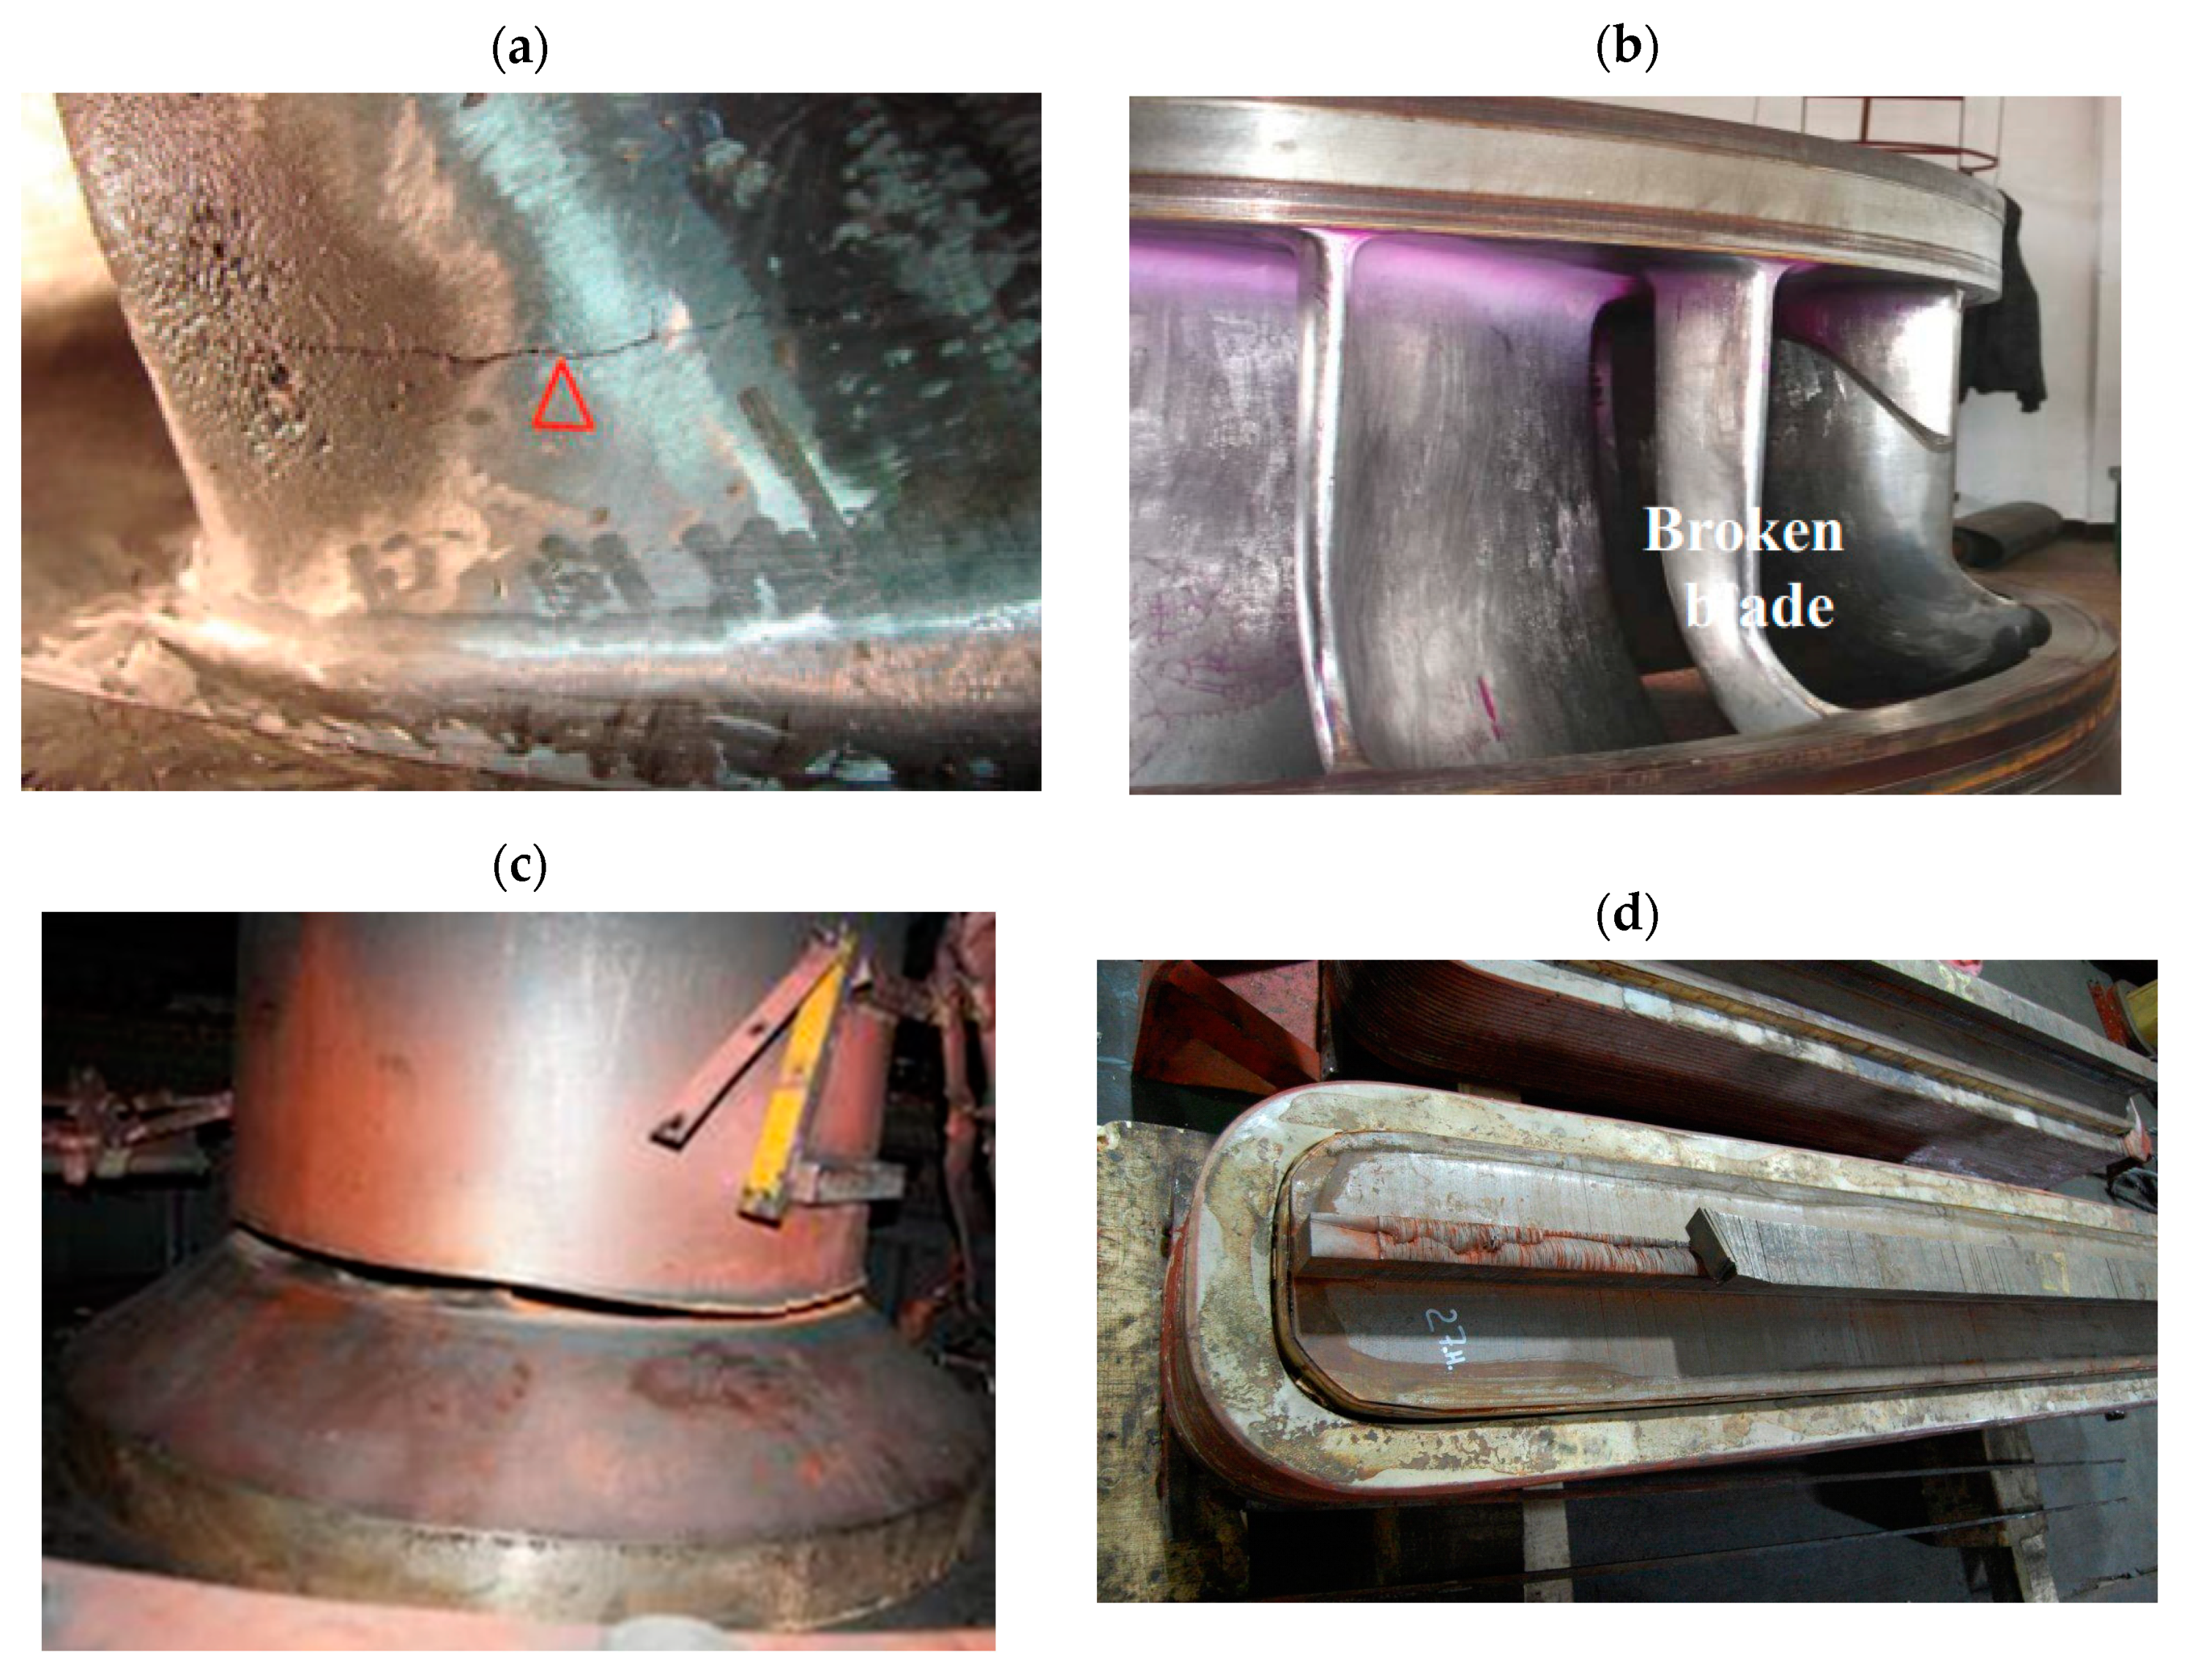
You can find many examples in literature of serious damage to the runner, shaft, spider, and rotor poles of a generator [15,16,17,18,19]. Figure 1 shows some examples that were not timely identified by the existing monitoring or diagnostic systems.
Thus, we have to admit that, despite significant recent achievements in the development of monitoring, diagnostic, and prognostic systems of the technical condition, the problem of detecting dangerous cracks in the critical components of the hydraulic unit under real operations is still relevant and unresolved.
This article discusses the most important trends that have determined the development of diagnostic and predictive systems for the main hydropower equipment in recent years, highlights the main reasons for the inefficiency of currently used systems in terms of early detection of cracks on the example of a Francis turbine runner, and confirms the fundamental impossibility of identifying cracks in runners by analysis of changing the measured standard vibration parameters based on the results of numerical modeling of the cracks’ influence on the vibration state of the unit.
Here, the term “standard vibration diagnostics” or “standard diagnostic systems” means any stationary or portable system for monitoring and diagnosing the condition of hydraulic units in accordance with the requirements of Standards ISO 20816-5:2018 [7], ISO 19283:2020 [8], and ISO 13373-7:2017 [9].
The proposed concept of an analytical predictive system based on the technology of numerical individual prediction of the timing up to the limit state by the fatigue criteria can solve the problem of the early detection of cracks. The capabilities of the proposed solution illustrate by a comparative assessment of the detection timing of a dangerous crack in a Francis turbine runner using the standard vibration diagnostic system and the proposed analytical predictive system.
2. Main Trends in Hydropower That Determine Development Directions of Diagnostic and Prognostic Systems
The cost of maintaining and repairing the main equipment of a hydroelectric power plant is one of the most important operational indicators. Cost minimization is possible on the basis of effective technical condition monitoring for the units under operation and reasonable forecasting of the timing of necessary repairs. These functions should be performed by the modern diagnostic and/or prognostic systems installed in the hydraulic units. In recent years, the following major trends in hydropower have determined the development directions of these systems.
Firstly, the rapid aging of hydroelectric units, despite the large-scale modernization and equipment replacement programs, have been implemented by many energy companies. Usually, the project lifetime of the hydraulic units is 30-40 years. At present, many HPPs hold very old units—their lifetime exceeds 50–60 years. Obviously, the risk of failure of such outdated equipment increases with every year of operation and is especially dangerous for large high-head units.
Secondly, there has been a significant expansion of the operating ranges of the hydraulic units [20,21]. Due to their high maneuverability, hydraulic units are widely used to maintain the stability of electrical networks and to compensate for uneven energy production from new renewable sources (wind, sun, waves, tides, etc.). As a result, instead of operating under base load conditions, which provides for long-term operation near the best efficiency point with a small number of starts and stops, hydraulic units operate for a long time in off-design modes. Off-design modes are characterized by an increased level of dynamic load of the unit and accelerated wear of its components [22,23,24,25,26,27,28,29] and traditionally include speed-no-load, low and medium partial power modes, synchronous compensator mode, as well as all transition processes including starts/stops.
Thirdly, modern methods of numerical optimization that are widely used in designing new hydropower units lead to a significant decrease in the metal consumption of a structure and the expansion of the design operating range. However, as practice shows, such units are often less reliable than those designed more than 30–40 years ago. This is partly due to the fact that the elements of the unit are subjected to higher stresses, higher external loads, and may fail prematurely.
Fourthly, hydraulic units, especially old ones, have a long history of repairs. Repairs help to extend the individual lifetime and improve efficiency, but each repair makes significant changes to the technical state of the unit. As a rule, during the repair, the lifetime parameters are partially restored by eliminating incipient defects, returning the design geometry, replacing worn out and damaged elements. At the same time, repair operations can reduce the residual lifetime, for example, due to a high level of residual stresses in the welding and repair zones or distortion of the gaps between the unit’s rotating and stationary components.
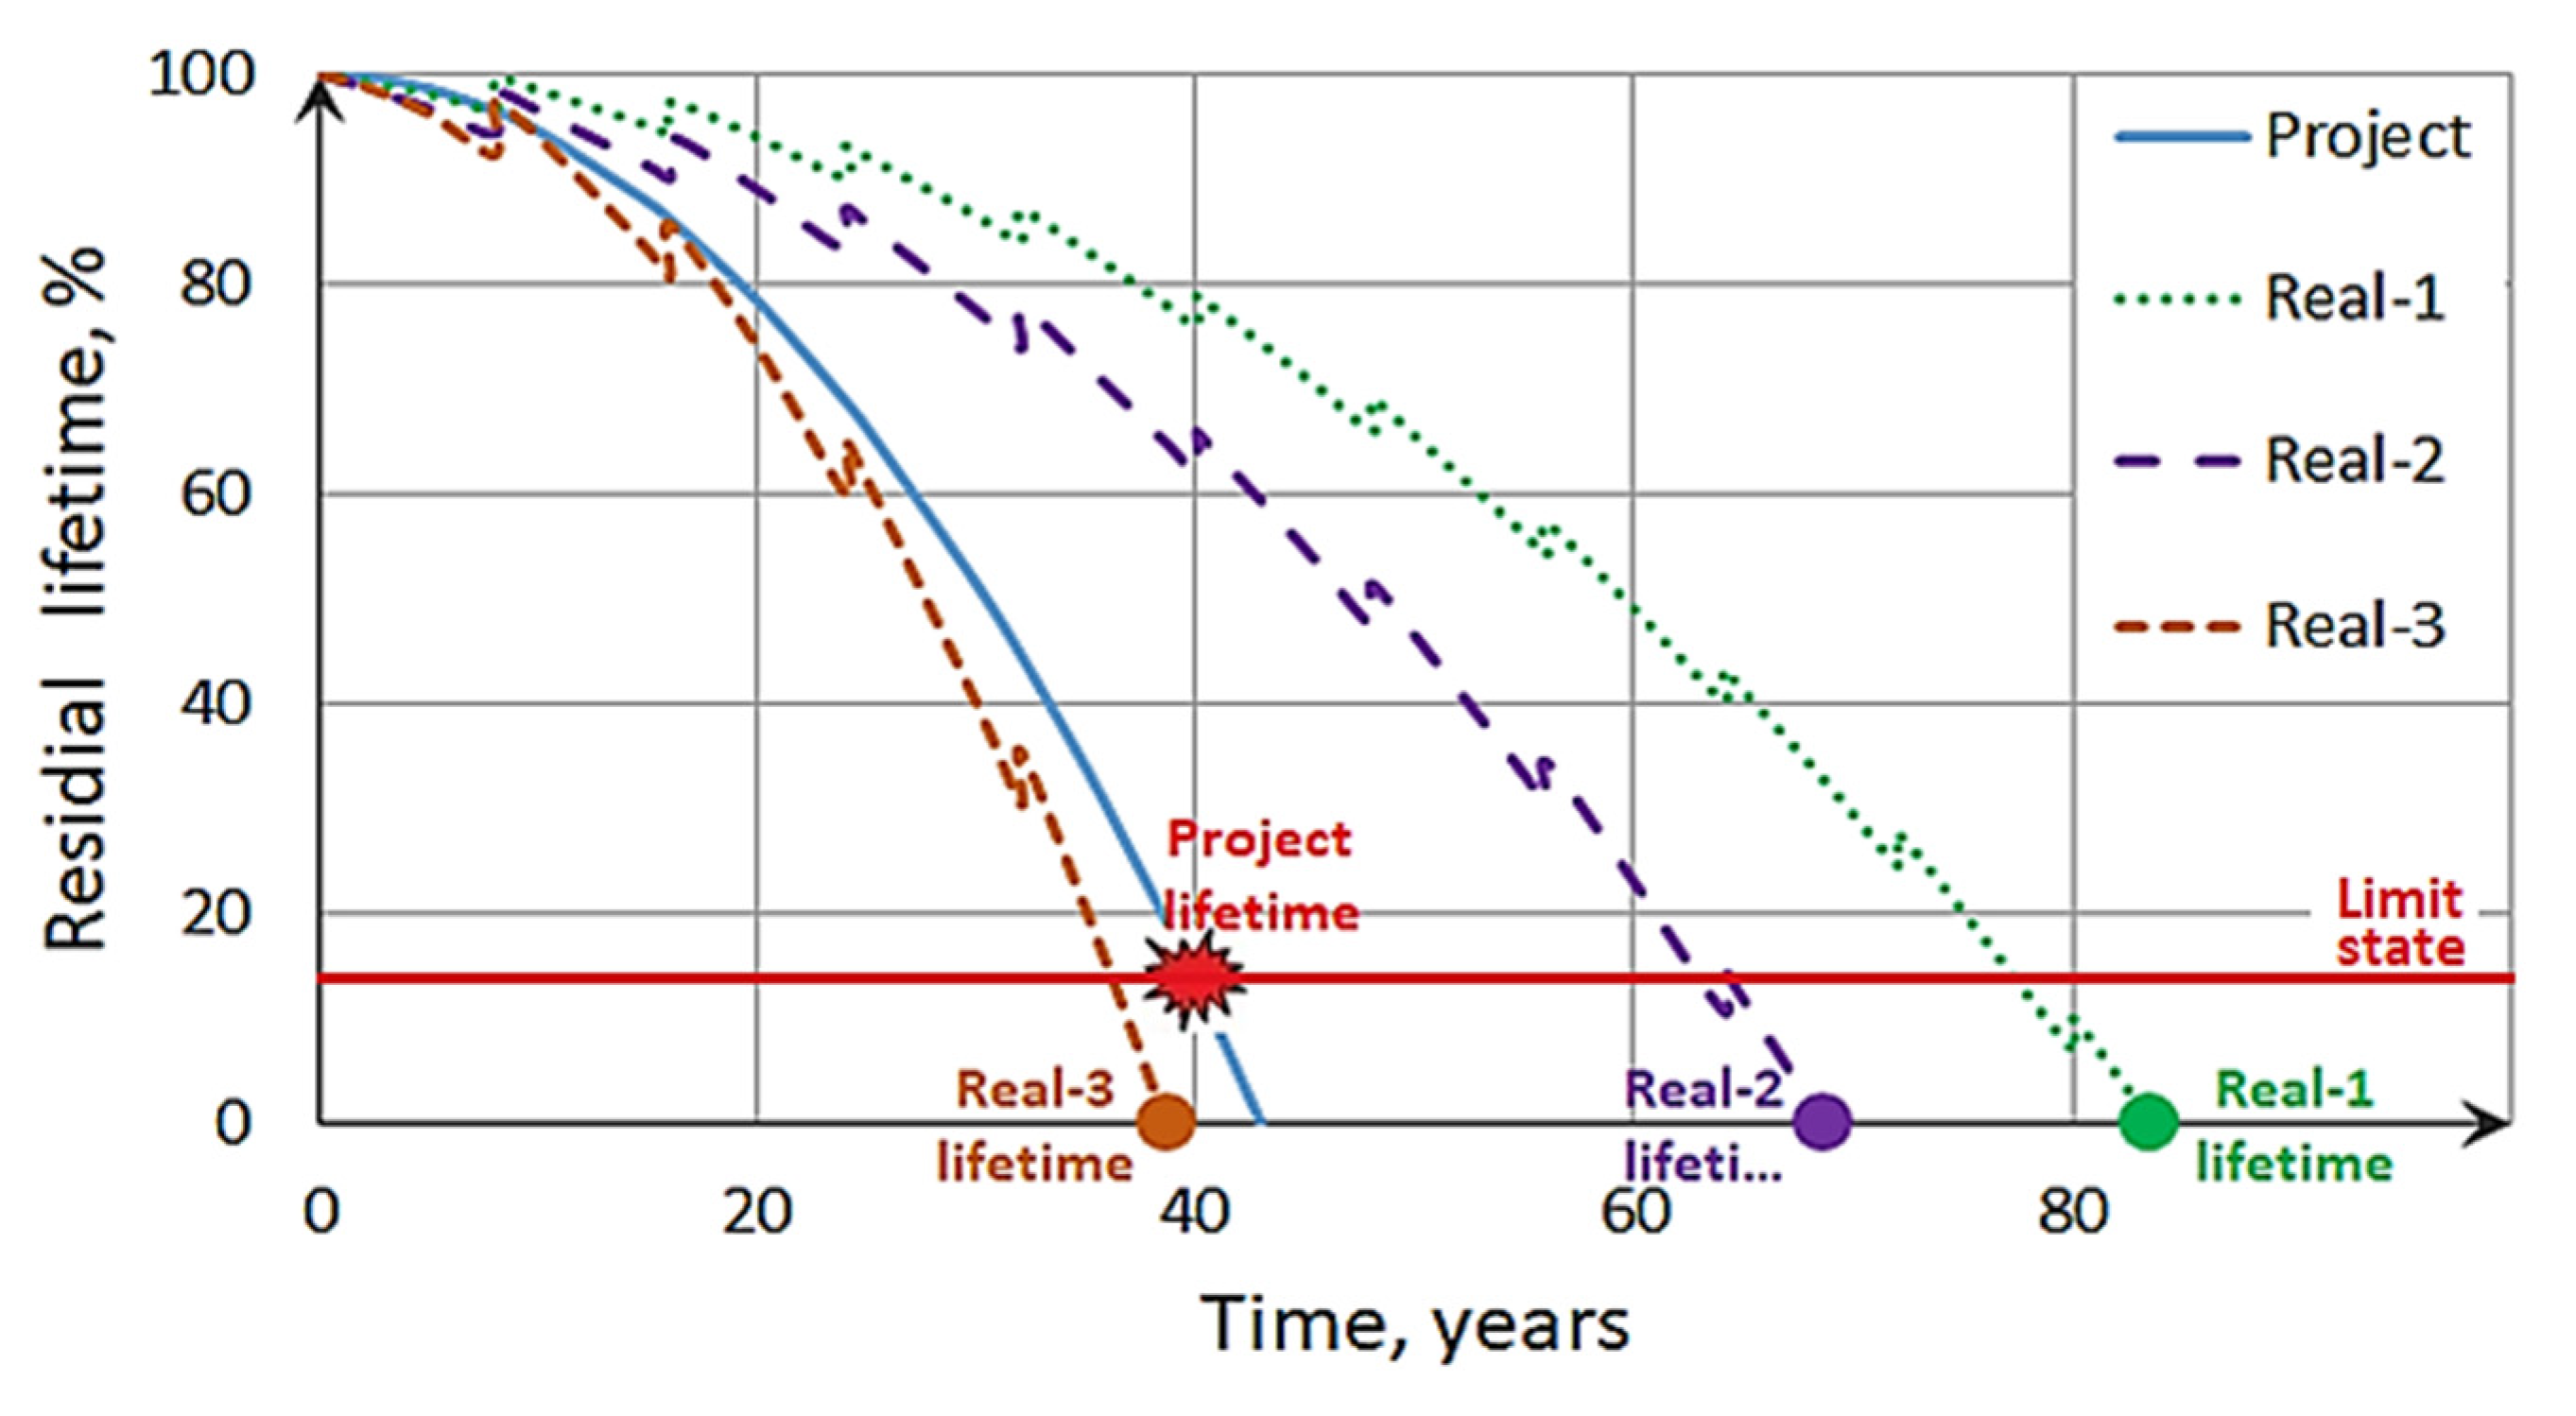
As a result, after a long-term operation, the project expectations about the lifetime of typical units and actual individual residual lifetime (see Figure 2) may differ significantly depending on the features of the unit’s usage, accumulated damage, and repair operations. The curves “Real-1”, “Real-2”, and “Real-3” in Figure 2 reflect the effect of repairs by steps in a zigzag shape in contrast to the smooth curve “Project”. Under real operation, the task of the system for diagnosing and predicting the technical state is to identify the transition point to a dangerous (pre-emergency) state timely in order to avoid the development of dangerous defects to a critical level and to prevent damage to equipment, personnel, and environment as much as possible.
3. Reasons for Ineffectiveness of Existing Diagnostic and Prognostic Systems
3.1. Current Situation
Today, most medium and large hydraulic units have stationary diagnostic systems that continuously monitor the technical condition by many sensors. In case of their absence, the vibration state of the unit is monitored regularly, usually at least twice a year, using a portable system. Traditionally, the quality of operation of rotary machines, including hydraulic units, is assessed by their vibration state. The main part of vibration sensors measures absolute vibration on stationary parts of the unit, such as a load-carrying spider, a hydro turbine cover, a support cone, guide bearing housings, and a hydro generator stator. Other sensors are installed on rotating components and measure the relative vibration. Additionally, diagnostic systems monitor the unit rotation speed, the temperature of some elements, the pressure in the servomotors, the clearance values, and some other parameters. Detailed descriptions of existing diagnostic systems and a list of monitored parameters can be found on the manufacturers’ websites and in special literature, for example [30,31].
The vibration parameters controlled by modern diagnostic systems do not always reflect the dynamic processes that determine the individual lifetime of the equipment. In addition, the algorithms used for processing monitoring data often do not allow for identifying the initiation and development of dangerous cracks. The examples in Figure 1 can illustrate the current situation: the diagnostic systems do not detect some cracks in the critical elements of the runners, shafts, spiders, poles, etc. The absence of a direct correlation between the vibration parameters measured at the hydraulic unit and the level of dynamic stresses, which are responsible for the development of fatigue cracks, is described in detail on the example of the blade system in the article [32].
3.2. Reasons for Ineffectiveness of Existing Diagnostic Systems
Diagnostics of the technical condition is based on comparing the parameters measured in a full-scale unit with their maximum permissible values corresponding to the normal operation of typical equipment. One of the key things that prevents the development of diagnostic and especially prognostic methods based on the analysis of vibration processes is the high level of the individuality of hydraulic units.
Large and medium-sized hydroelectric units can be classified as unique technical objects that have no analogs. Hydroelectric units designed for similar technical parameters often have significant design differences. They are also operated in different power ranges, which does not allow for their comparison with each other. The number of typical units installed at one HPP usually does not exceed 10–20 pieces. At the same time, after a long-term operation, they can differ greatly from each other in terms of technical conditions:
The individuality of the hydraulic units is determined by a number of objective factors, including:
- equipment placement site
- characteristic hydrological regimes
- the region’s need for energy supply
- design features of a specific unit
- modes of equipment use, including participation in primary and secondary regulation
- adopted installation technologies
- numerous repair operations
- carried out modernization and refurbishment
- the influence of building structures that determine the stator part of the unit
- service lifetime of the unit.
The individuality of hydraulic units prevents the use of any statistical methods of data processing, including the analysis of vibration diagnostics results. The updated regulatory documents, for example, ISO/DIS 19,283 [8], also point out the need for an individual approach to each hydraulic unit.
Individuality is also a formidable barrier to the creation of a correct representative sample of reference data. It hinders the penetration of artificial intelligence methods based on BIG DATA and MACHINE LEARNING technologies, which are currently widely implemented in other branches of energy and mechanical engineering. When applied to hydraulic units, these approaches are now ineffective due to the high probability of using so-called “dirty data”, i.e., initially unreliable, inaccurate, or incomplete information regarding the limiting values of key technological parameters. The use of “dirty data” can lead to untimely detection of incipient defects, erroneous conclusions about the rate of their development, unplanned shutdown of the unit, or another emergency situation. The problem of “dirty data” has become so urgent that it was included in the traditional collection of 20 technology trends in 2020 published by the Norwegian company Telenor [33].
Another significant reason for the ineffectiveness of diagnostic systems in the detection of fatigue cracks is the high structural rigidity of the unit and its individual components. It determines low sensitivity to incipient defects. This is especially true for Francis turbine runners with a blade cascade rigidly fixed between a massive lower band and a thick crown.
The main vibration parameters of a runner are eigenfrequencies and corresponding vibration modes, as well as damping coefficients. The appearance and development of a defect provoke a change in vibration parameters (first of all, frequency). It can be recorded by the diagnostic system as changes in the values of absolute vibrations on the housings of the guide bearings and relative vibrations of the shaft near the bearings.
It should be noted that the eigenfrequencies of a structure are integral characteristics of the considered oscillating system, i.e., many factors influence their values. For hydraulic units, the most important are the damping characteristics of a full-scale unit, the effect of the added masses of water, and the stiffness of the support. All of them are not constants for a particular unit but significantly depend on the operating modes. As the crack develops, changes in the eigenfrequency spectrum occur very slowly and can be invisible against the background of the influence of other factors, for example, pressure fluctuations or power changes. Usually, even extended through cracks in Francis runners do not lead to any noticeable shift in the frequency of the recorded oscillations by the diagnostic system. Therefore, such cracks remain invisible to the diagnostic system.
Obviously, with the growth of the cracks, the eigenmodes also undergo changes, but these changes are of a local nature. It greatly complicates the possibility to identify them on equipment under operating. The set of sensors currently used by modern diagnostic systems does not imply the ability to track local runner geometry changes.
The possibility of identifying cracks on a runner using existing diagnostic systems and the effect of a developing crack on the vibration parameters recorded by the diagnostic system have been studied with the example of a powerful Francis hydraulic unit by numerical simulation methods with the ANSYS software.
3.3. Design Model
To solve the set tasks, a computational 3D model was developed and a series of computational experiments were carried out for a defect-free (in the absence of cracks) runner and for a runner with cracks of various lengths in the blades. At the same time, the options for a single crack and massive cracking affecting all blades were considered. All calculations were carried out for the air environment, since the vibration modes in air and in water are identical, although they differ in frequency [22,34,35,36,37,38].
The computational model simulates the rotating part of the unit (runner, shaft, generator rotor with a thrust bearing disc) supported by guide bearings in the radial direction and the thrust bearing in the vertical direction. The nominal rotational speed is 200 rpm, the total model mass is 768.8 tons, and the total model vertical size is 16.7 m.
The guide bearings were modeled by elements of the “elastic damper” type while easily varying the fastening rigidity. For the current simulation, the following bearing stiffness values were taken: turbine bearing CTB = 1,3·109 N/m, upper generator bearing CUGB = 1,4·109 N/m, and lower generator bearing CLGB = 1,72·109 N/m. It should be noted that the selected stiffness values do not greatly affect the results presented in the article since the basic eigenforms remain unchanged for any adequate set of stiffnesses.
The generator rotor was modeled as a set of cylindrical volumes (bushing, generator shaft, spoke set, rotor rim, and rotor poles) with equivalent material properties taking into account the actual mass distribution in a full-scale unit and the rigidity of its structural elements. The total mass of the generator rotor in the model is 676.2 tons, the outer diameter of poles –9.3 m, rim –8.43, and spokes –7.38 m. A model of this type allows us to take into account the main eigenmodes of the generator and excludes many modes of oscillations of its components (spokes, rim, poles, baffles, etc.) which do not play a significant role in solving the problem of identifying cracks in the runner.
The shaft and the runner were modeled by advanced shell elements with corresponding thickness and curvature. The total mass of the turbine shaft and the runner is 92.6 tons, and the outer diameter of the runner near the crown –4.5 m.
For Francis turbines, fatigue cracks are most often formed along the lines of the junction blades to a runner crown. The total length of the junction line in the model consists of 1.84 m. The cracks usually start from the side of the more loaded trailing edge. The most dangerous are through cracks. Therefore, in the numerical calculations, the cracks in the blade system were modeled through ruptures along the welding line of the blades to the runner crown starting from the trailing edge. The phased growth of cracks was simulated by the length of the rupture. The model length of the cracks during mass cracking was the same on all blades. It is obvious that the simultaneous appearance of cracks of the same length on all blades is unlikely, but the results obtained are interesting for the purposes of this study.
All design model parameters correspond to the real large vertical hydraulic unit installed at one of the Russian HPP. The research methodology was tested in advance by comparing the numerical and experimental data on the study of the vibration and stress state of the runner blades for a similar hydraulic unit [39]. The purpose of the computational experiment was to determine the possibility of identifying the presence of cracks by changing the eigenfrequencies of the runner.
3.4. Calculation Results
There are 29 first eigenfrequencies in the air environment and corresponding vibration modes were determined in the range of 0–160 Hz for the defect-free design. The considered range overlaps the fundamental frequencies of external loads. The corresponding frequencies in the water environment were obtained by using the decreasing coefficients [22,34,35,36,37,38] depending on the mode’s number and vibration form.
Table 1 presents the main calculation results: frequency, participation factor, and effective mass for three translational degrees of freedom for every eigenmode. The X and Y are radial (horizontal) directions, and Z is vertical. There is similar information about three rotational degrees of freedom, but it is less interesting for the purposes of the study.
Participation factor and effective mass determine the contribution of each mode to the total strain–stress state. Their values characterize the dynamic parameters of the calculation model and affect the response at the support point. If the participation factor and effective mass are zero (or very low), the reaction of bearing in the corresponding direction will be zero (or very low) too. Therefore, you cannot find any detectable displacements at the support point for this frequency in the considered direction and cannot use measured displacement for the determination of the stresses in a runner.
Depending on the deformation state and the values of the participation factors, all eigenmodes can be divided into five key types: bending with shaft deformation (I), bending without shaft deformation (II), torsional (III), axial (IV), and mixed (V) forms (see Table 1).
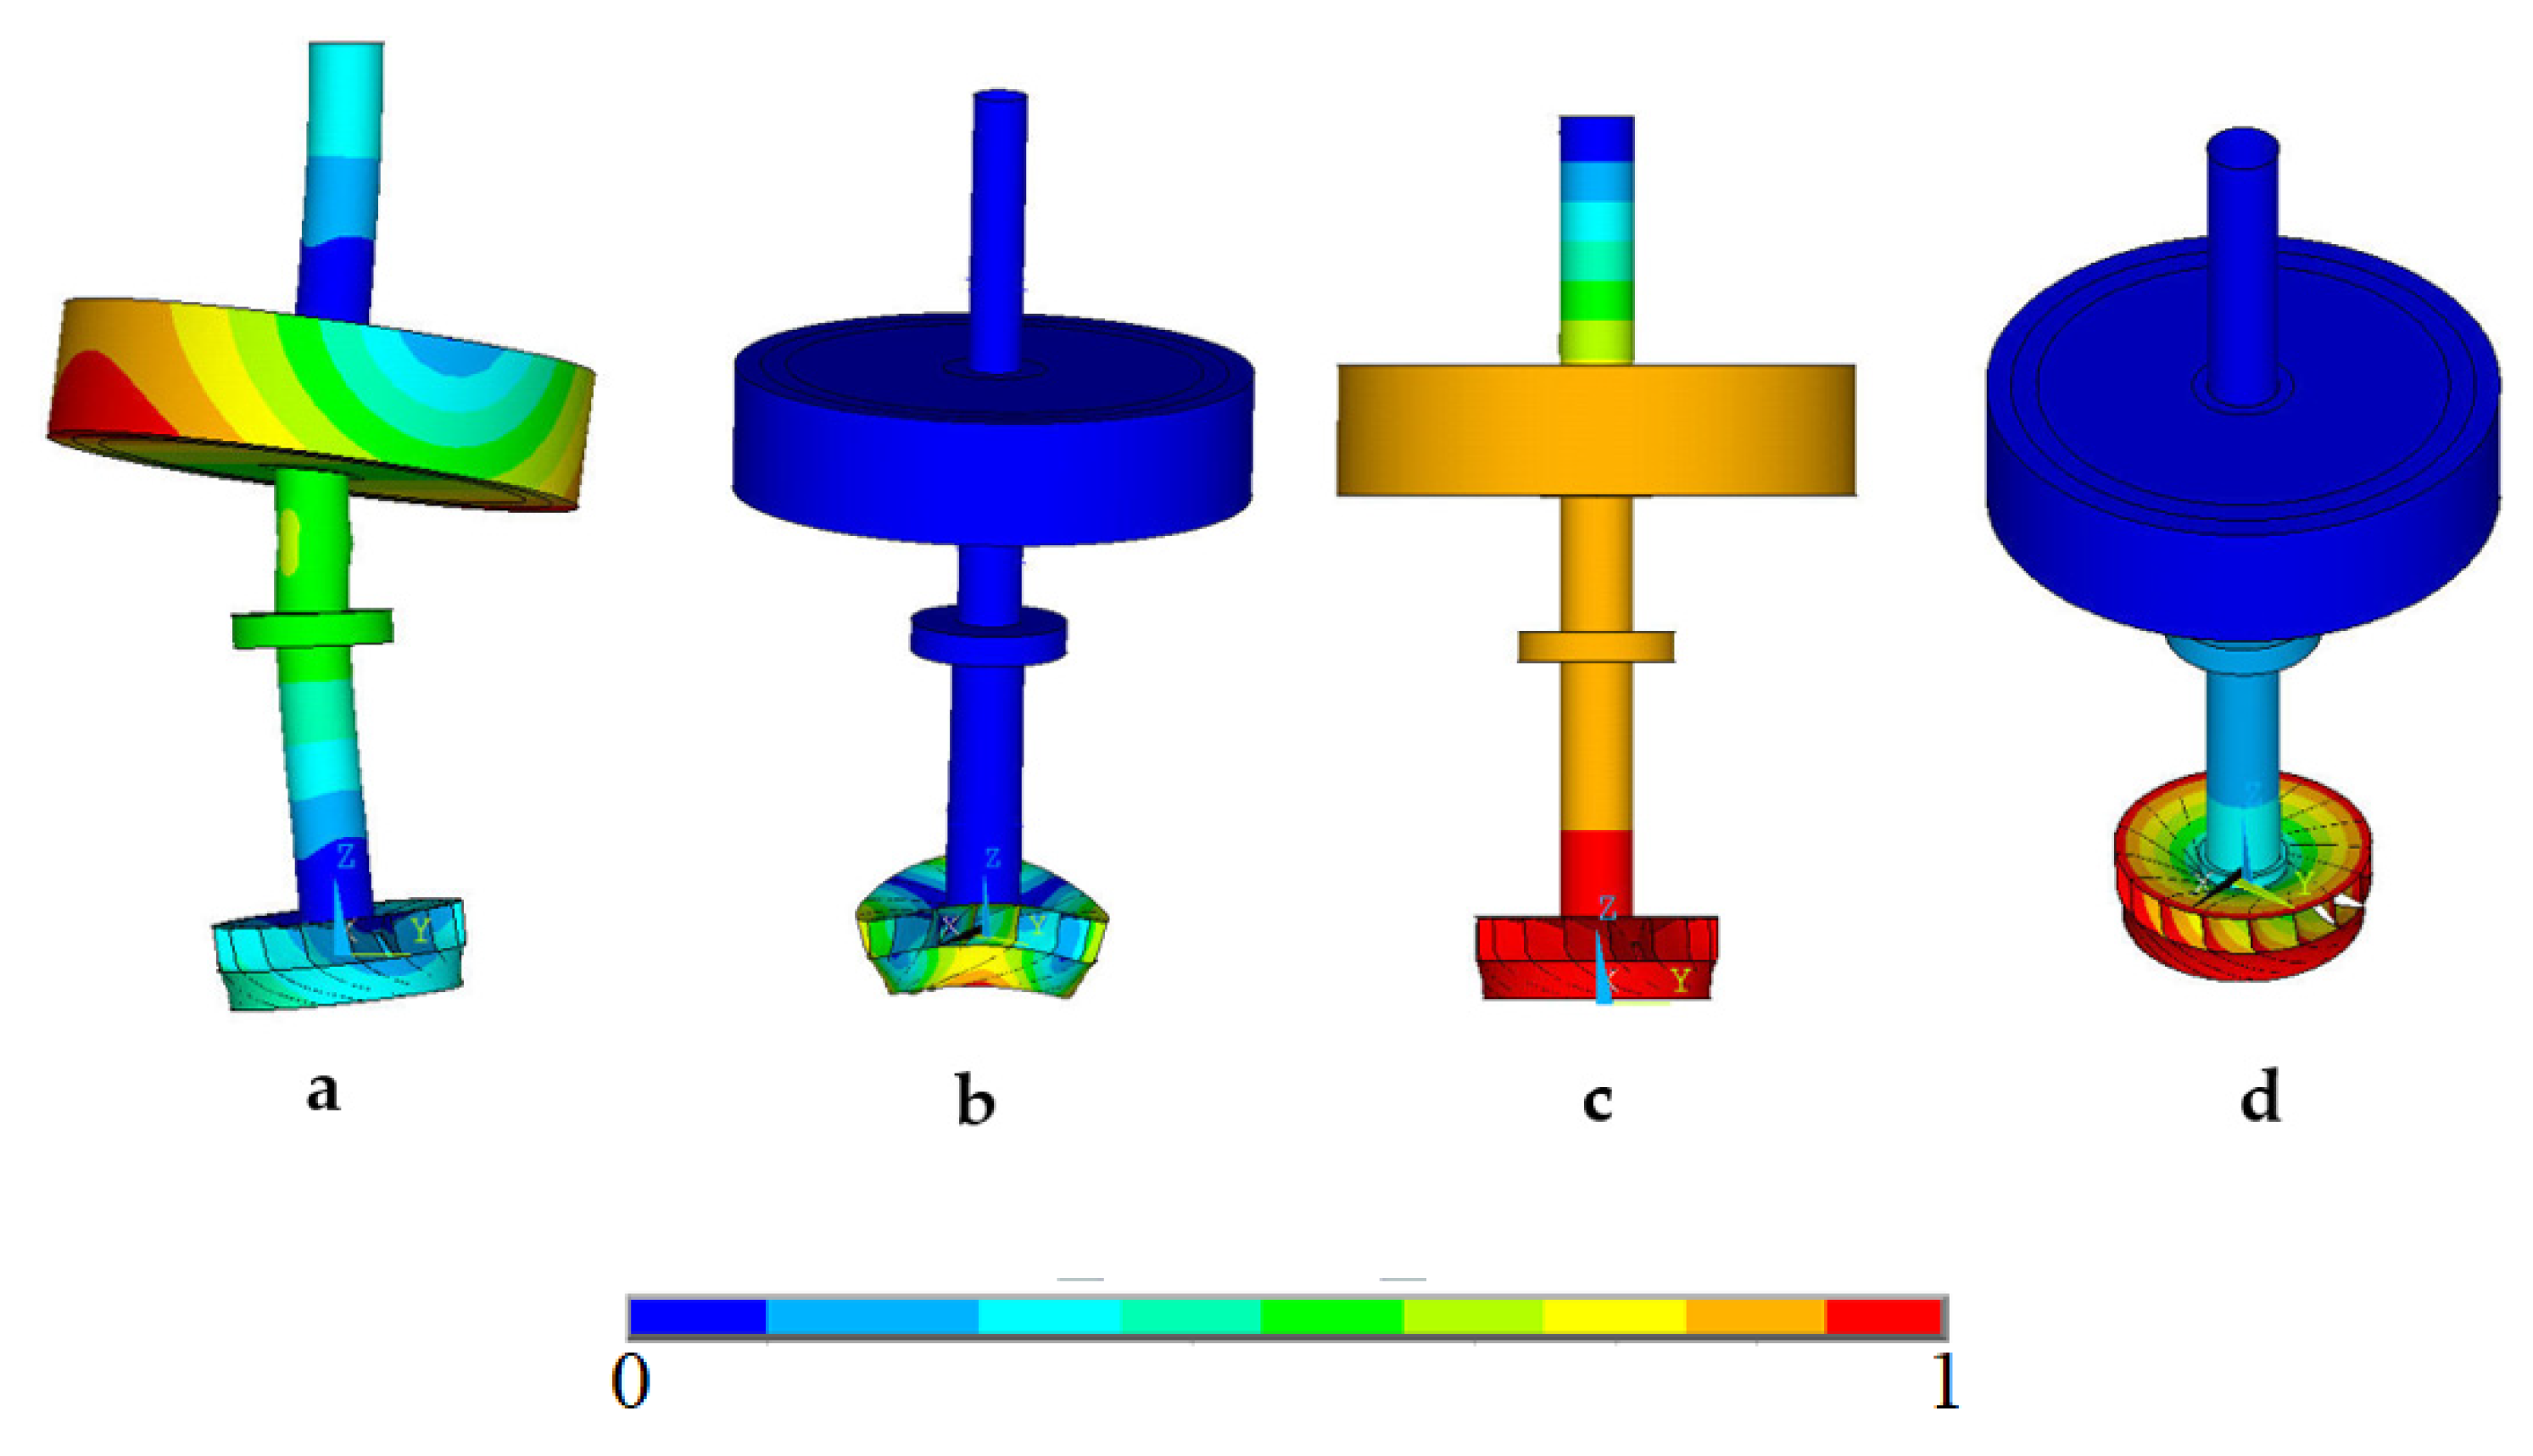
Figure 3 shows examples of key types of eigenmodes in the form of a displacement distribution for the defect-free model. All displacements are normalized to 1.0 since the displacements corresponding to the eigenmodes are determined only up to a constant. The deformation scale has been increased to improve the visualization of the results. Similar results, based on numerical simulations and confirmed by experimental studies, were presented in articles [40,41] only for the runners.
To investigate the impact of crack on dynamic characteristics of the model, the eigenfrequencies and eigenmodes were calculated for the runner with single and multiple through cracks at the junction blade-crown zone. The crack length increases step by step from 2 mm up to 340 mm along the blade-to-crown weld.
Table 2 presents the calculation results for maximal crack length 340 mm. The eigenfrequency shift is presented in absolute (Df) and relative (Δf) units (in percent with respect to the corresponding eigenvalue for the defect-free design):
where f0 is the eigenfrequency of the defect-free structure, and fc is the eigenfrequency in the presence of a crack (cracks) for the same eigenmode.
Df = f0 − fc,
Δf = (f0 − fc)/f0,
The calculation fc for the runner with single or multiple cracks is similar to the previously presented calculation for the runner without a crack. All initial parameters of the design model excluding the length of the crack remain the same.
3.5. Discussion of Results
The results shown in Figure 3 indicate that the excitation of oscillations at eigenfrequency is not always accompanied by the presence of displacements near the bearings. For example, there are no shaft displacements with bending vibrations of the runner without deformation of the unit shaft (see Figure 3b). Therefore, such bending vibrations cannot be identified by any sensor installed near the guide bearings. A similar situation is also typical for axial and torsional vibrations (see Figure 3c,d). These shapes remain invisible to standard diagnostic systems, despite the existing runner deformations. Accordingly, crack detection, the development of which is due to the excitation of such forms, will also be beyond the capabilities of vibration diagnostics. There is a similar statement in the article [41]: “it is sometimes difficult to detect cracks in time using the current monitoring system, even when they are very large”.
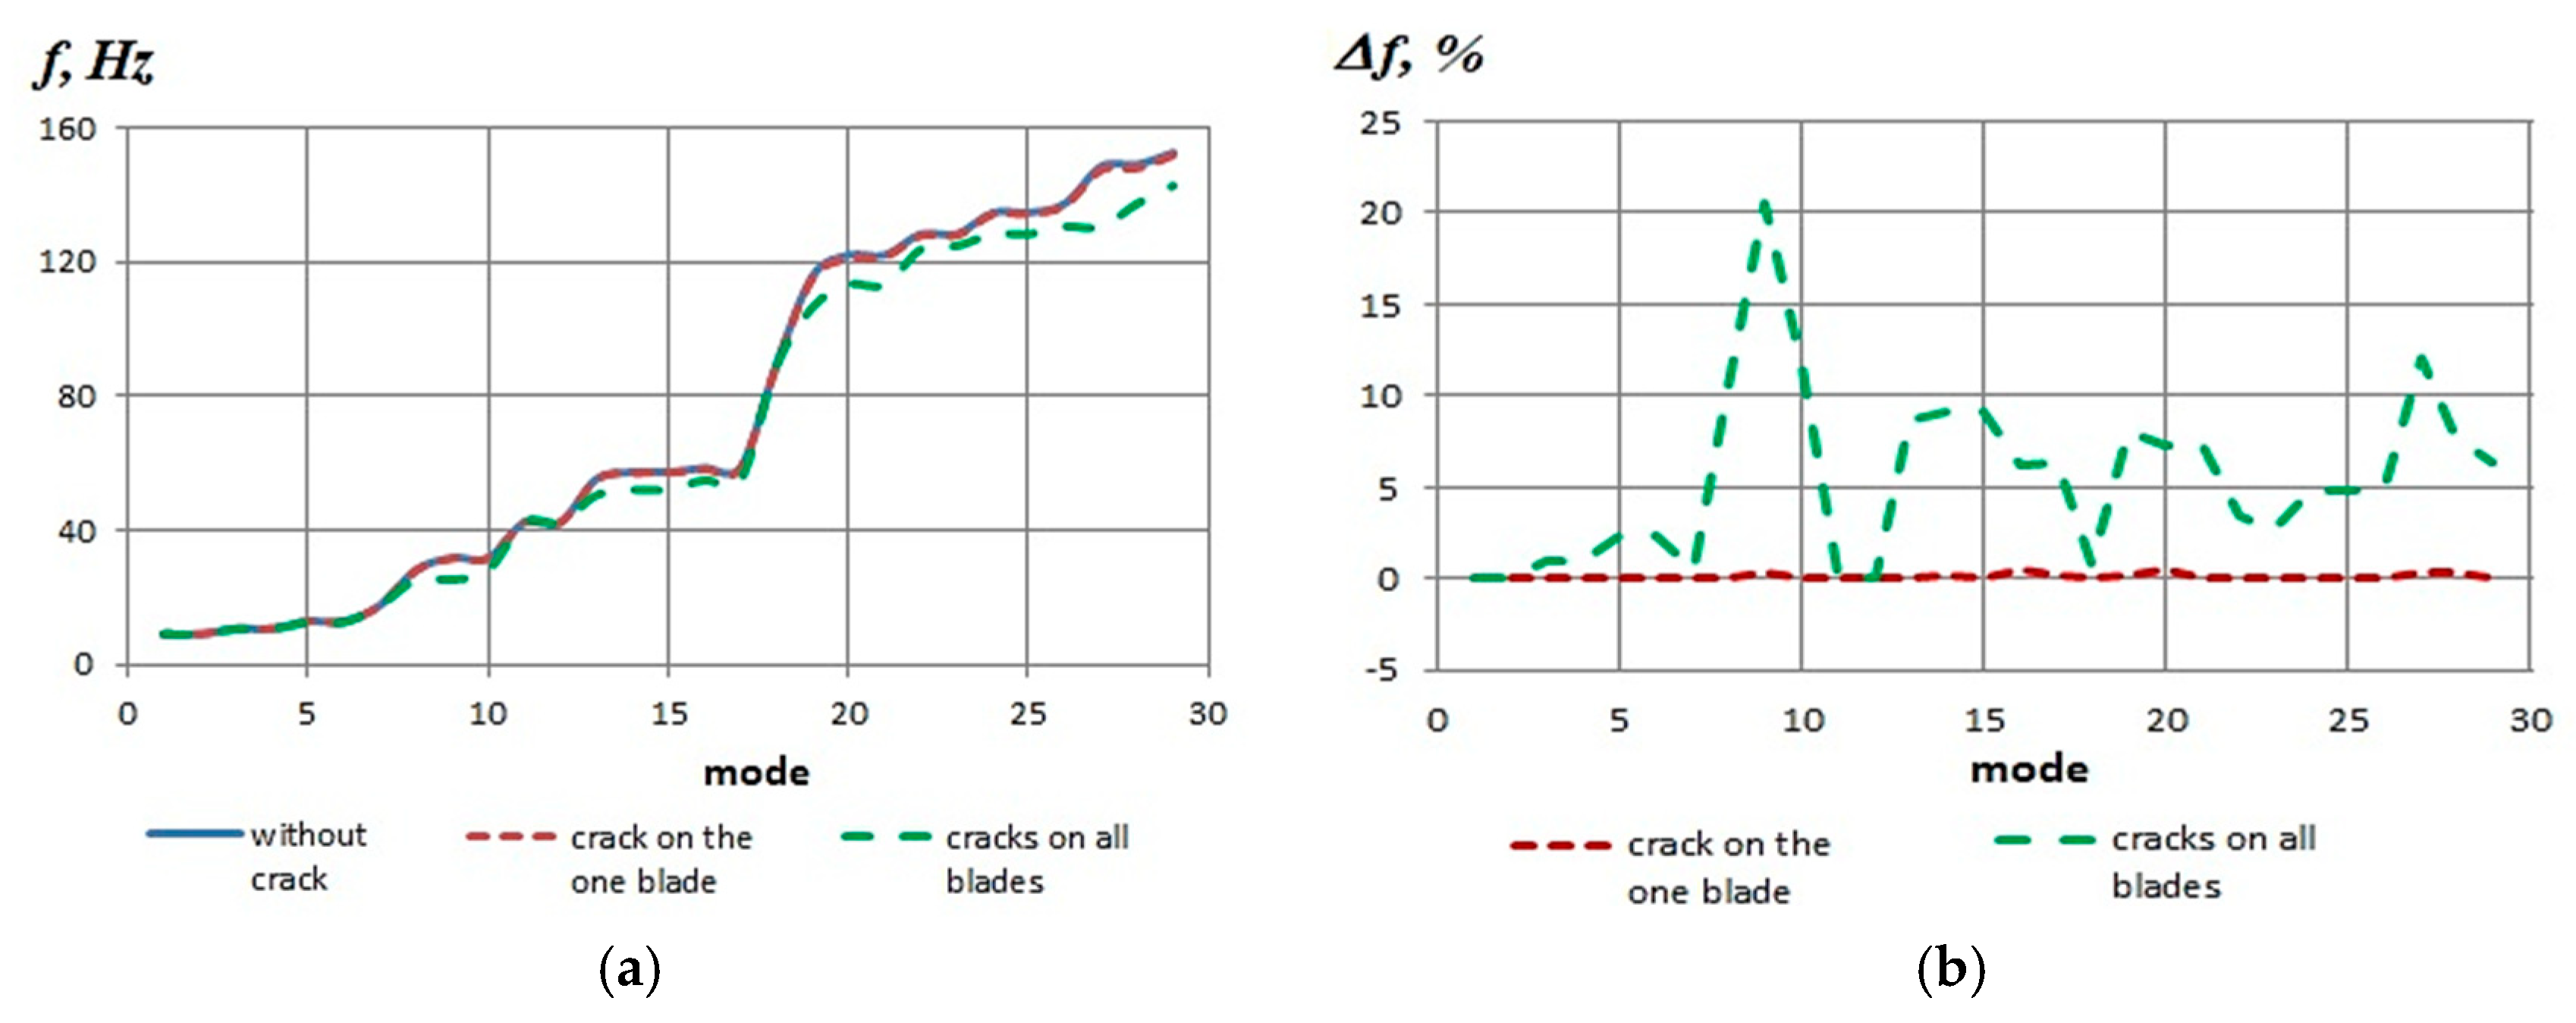
At the same time, due to the high rigidity of the Francis units design, the appearance and development of cracks, as follows from the analysis presented in Figure 4 results, has very little effect on the change in the frequency spectrum or the amplitude of oscillations recorded by existing diagnostic systems. It is important to note that, in the presence of cracks, the eigenmodes of the blade practically do not affect the band and crown of the runner, not to mention the guide bearings. The presence of a single through crack with a length of up to 10% from the welding length of the blade to the crown has almost no effect on the change in the frequency spectrum. In addition, only the appearance of such cracks on all blades will lead to any noticeable change in the frequency spectrum, but, in practice, such a situation is extremely unlikely. This means that the existing diagnostic and monitoring systems do not allow for detecting sufficiently extended single cracks in the blade system of the Francis turbine and correctly assessing the time of safe operation before the necessary repair.
4. Prospects for Development of Diagnostic and Prognostic Systems
The above-mentioned limitations of diagnostic systems from the point of view of effective cracks detection in runners at an early stage can be overcome by expanding the number of monitored parameters, multiplying the number of sensors installed on the unit, increasing the cost of sensors by improving their sensitivity, introducing new methods of data processing, and revising of used estimation algorithms. However, this is a very costly and long way, which, moreover, may not give the expected effect.
The unit’s reaction to various external forces under operation as the dynamic response of the unit (static and dynamic strains and stresses) can be obtained by direct experimental strain measurements on prototype runners in situ. This data helps to understand the real local strain–stress state and get complete information for assessing crack propagation.
In recent decades, experimental strain gauges have been significantly improved [26,40,42,43,44,45]. However, the widespread use of this method as part of a stationary diagnostic system for aging hydraulic units is not available due to serious technical and economic problems:
- the complexity of installing measuring system on rotating components
- presence of uncertainties in strain gauge measurements [46]
- the need to install sensors on many blades to detect the bending form of impeller vibration [47]
- periodic calibration of sensors
- long-term downtime for assembling measuring system
- high cost of conducting an experiment and processing its results and so on.
Thus, strain gauge is very useful in situ for deep understanding of the runner’s behavior in various operating modes and for using this information for accurate numerical calculations. However, it is not suitable for regular measurements on operating equipment.
An alternative is the development and implementation of a fundamentally different approach based on analytical methods for assessing the timing of the onset of crack initiation according to fatigue strength criteria. Similar approaches are actively used in other fields of power and mechanical engineering. They have also been successfully used for many years at the design stage of hydraulic equipment. Unlike modern diagnostic systems, which are able to identify existing damage by changing the measured parameters, analytical methods make it possible to predict the potential appearance of a defect long before any changes in the unit have occurred. In addition, the important advantages of the analytical approach include the ability to take into account all the features of the hydraulic unit individually and no need to install any additional sensors and devices.
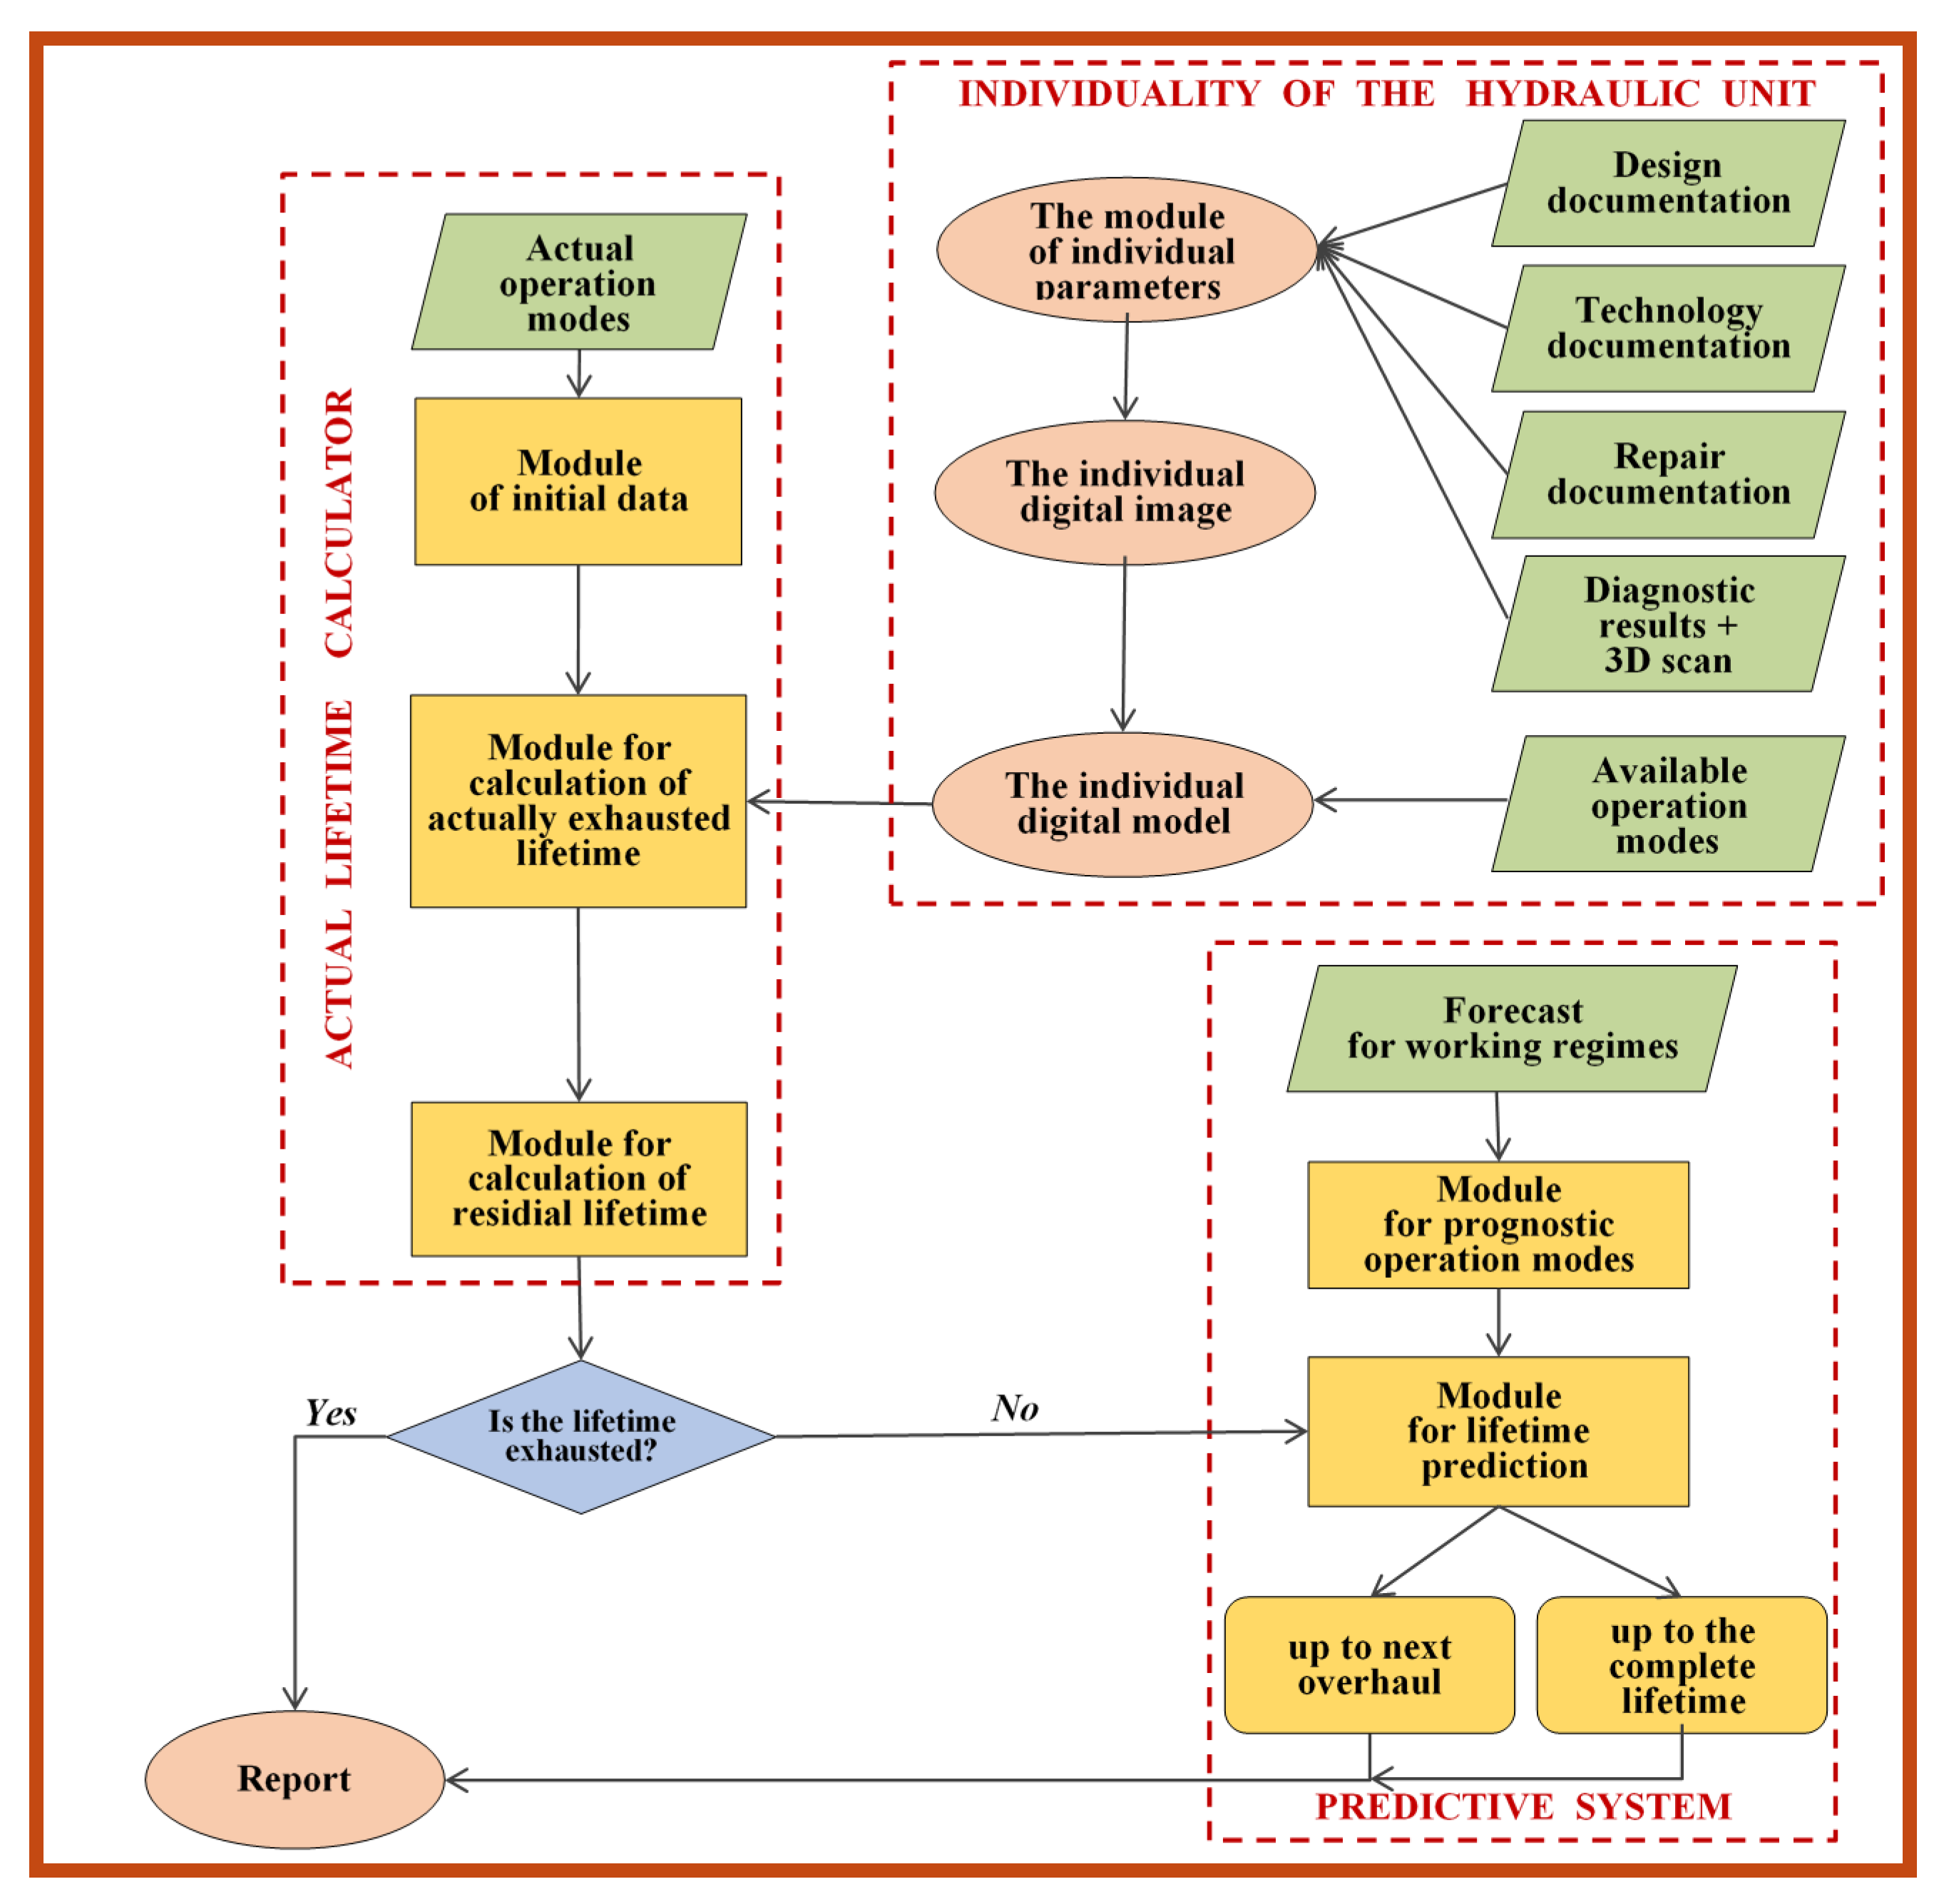
The concept of such an alternative approach is presented here. Figure 5 shows the principal scheme of the proposed analytical solution [48]. This is a peculiar lifetime calculator that implements a relatively simple algorithm for calculating the individual lifetime based on the known stress–life (S–N) method and Miner’s rule. It is suitable for any type and any construction of hydraulic units.
The core feature of the proposed approach is separating a common lifetime prediction algorithm from the strong individuality of the hydraulic unit—an individual digital model. It is a quite useful perspective as future research directions because a common algorithm can be easily integrated into any online diagnostic/prognostic system. It takes a little time to forecast the lifetime for the desired combination of operating modes.
In contrast, the account of individual characteristics and peculiarities requires a lot of time and a high computer performance to solve all scientific challenges related to the mechanical and hydrodynamic load data for all operating conditions, a global and local stress–strain state in each operating point, analysis of modal and harmonic response, behavior of materials and the rate of crack propagation in the water environment, initial defects in the unit’s components, mismatches during mounting, and much more. Now, the accumulated experience and state of the scientific knowledge allows us to solve successfully most of the above problems in application to the definite hydraulic unit. However, it is not yet possible to share such a solution with all types and all designs of hydraulic units.
For online lifetime estimation and prediction, it is reasonable to use digital models that combine two contradictory properties: taking into account all individual features and the possibility of obtaining a quick result about internal equipment reaction to external loading in the whole operating range. The proposed approach involves the use of a previously developed (pre-designed) matrix as a digital model of the unit instead of traditional three-dimensional computational models in computer-aided engineering. This matrix should be developed offline by a comprehensive study of the investigated unit. You can combine any experimental data, numerical modeling of processes and construction behavior, material examination, and so on. The methods that you implement to obtain necessary information about the individual responses to external influences in different operating points don’t matter in principle. They may be different for different units depending on the actual capabilities available.
In the process of lifetime calculations, the algorithm refers to this pre-designed matrix. The matrix cells contain information about the individual responses of a given hydraulic unit to external influences corresponding to the operation at each point of the operating range.
This matrix defines the individual digital model of the hydraulic unit. It is developed based on the results of variant calculations to determine the stress–strain state of the unit’s components at various regime points. Subsequently, it is reused by the algorithm many times.
To start the algorithm, it is enough to set only the data on the unit’s operating time in each operating range and the number of starts/stops. The output data is a total fatigue and residual lifetime. You can take into account the predicted operating modes for the upcoming period, for example, until the next overhaul.
This approach helps to make a management decision on the possibility and terms of further equipment operation quickly and economically, without complex calculations and large computer resources. The proposed analytical system can be easily integrated into any diagnostic system already installed at the HPP and used as an additional lifetime assessment block.
The key advantage is the ability to compare different potential equipment usage scenarios based on lifetime criteria easily and rapidly, considering various regime combinations and achieving maximum lifetime indicators. This is especially important for multi-unit HPPs because the owner of the equipment has the ability to vary the load of the units within the station. The effectiveness of the proposed approach can be assessed on the example of a large Francis turbine using the developed Demo-version (see http://bi.vdi-service.ru:443). The individual digital model for the Demo-version was developed on the basis of stress–strain state numerical calculation that was verified by existing prototype experimental data.
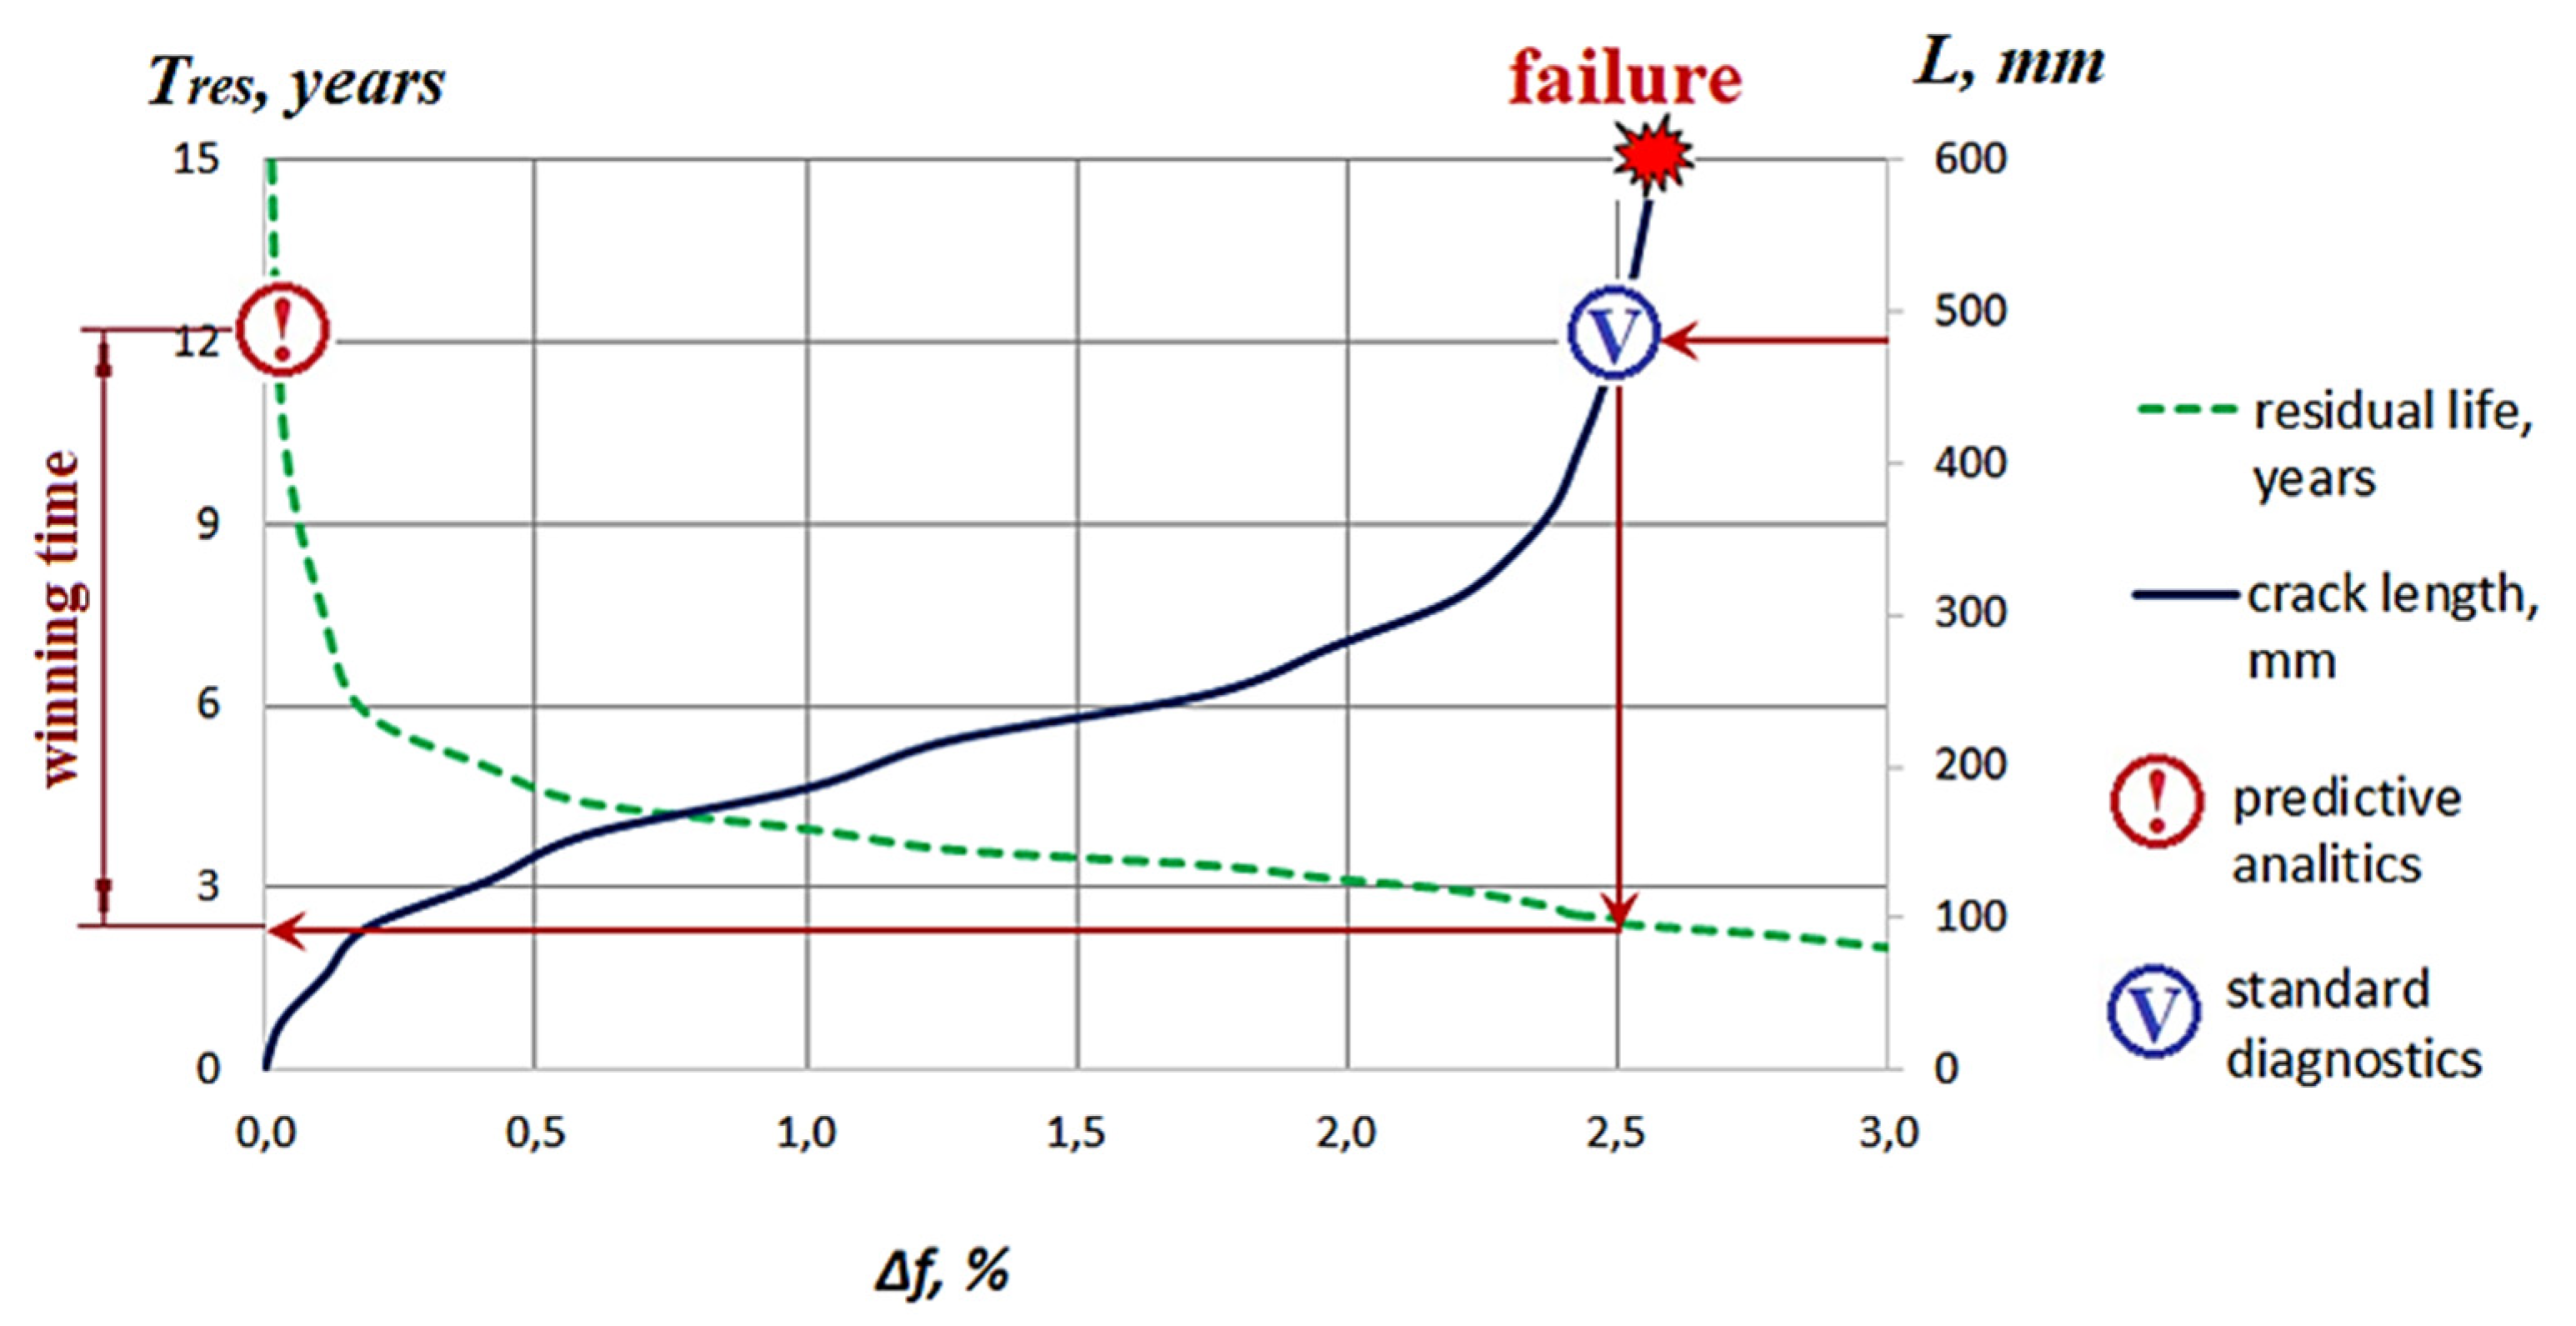
Figure 6 shows a comparison of the capabilities of analytical and vibrodiagnostic methods applied to the early detection of cracks in the runner of the Francis turbine [48]. The abscissa is a relative change in frequency on the turbine guide bearing; Δf is calculated as Δf in formula (2), but f0 and fc are the vibration frequencies near the guide bearing for the defect-free runner and the runner with one crack. Curve “Tres” presents the residual lifetime of a runner with a single-blade cracked. It is based on the lifetime assessment for the metallic structure with an existing crack in accordance with Paris’s equation and BS 7910 [49] recommendations. The model crack is a through crack propagating along blade-to-crown welded junction zone from output edge to input edge. For demonstration purposes, the calculation takes into account only one load cycle with equivalent stress amplitude 12 MPa reduced to the rotational frequency 2.08 Hz. Curve “L” shows the correspondence of crack length to frequency shift Δf. The calculation Δf is based on modal analysis of the turbine runner with a single crack as previously described in Section 3. The calculations show that the residual lifetime for the runner with a 10 mm-crack consists of 11.8 years. Taking into account runner dimensions and limited access to control zones, a crack on a blade with a length of more than 10 mm can be reliably detected by color flaw detection during planned repairs.
Taking into account the influence of many objective factors on the measured frequency of vibration parameters under operations, it can be argued that modern standard vibration diagnostic systems make it possible to reliably identify a change in the eigenfrequency of the unit of about 2.5%. It corresponds to a crack of almost 500 mm long and a residual lifetime of about 2.3 years. In this example, the analytical system will detect the crack more than nine years earlier than vibration monitoring. It means that the staff of HPP will not have to take emergency measures to decommission the equipment or to carry out unplanned expensive and longtime repairs.
It should be noted that similar principles for the life cycle prediction of a Francis runner are proposed in the paper [50]. The authors used the “Weakest Link” method to determine the critical point (the welded T-joint region), strain gauges’ measurements on the prototype of Francis turbine, finite element calculations to define the stresses on the whole runner, the rainflow matrix for the loading cycles’ ranking, the S–N curve for calculation of the partial damage at each operating point, and then summing the partial damages to obtain the total damage as a criterion of turbine lifetime.
5. Conclusions
Modern diagnostic and prognostic systems for the technical state of hydraulic units often do not allow timely identification of existing cracks or predicting the appearance of new cracks in its critical components such as a runner. The main reasons are the design features of hydraulic units and the absence of the direct correlation between the local strain–stress state in runner’s blades and controlled online parameters—first of all, vibration displacements on the support points.
The developed numerical investigation revealed the specific eigenfrequency forms of the rotating part accompanied by runner’s torsional or bending deformation without any shaft displacements. These forms, along with other forms, contribute to the runner’s overall dynamic response to external forces and have an impact on crack initiation and propagation. However, they do not affect the shaft vibrations or other parameters (vibration of generator stator, temperature, air gap, etc.) controlled by standard diagnostics systems in real time. Thus, we do not obtain useful information about the actual strain–stress state and crack growth in the runner from standard diagnostic systems.
Advances in strain gauge technology allow for more correct determination of deformation in the runner component, but the widespread use of strain gauges as part of a stationary on-site diagnostic system is impractical due to the complexity of implementation and the high cost of the experiment.
The high rigidity of the runner construction results in very minor frequency shifts at an early stage of crack propagation. These shifts are not identified by any diagnostic systems due to negligible values against the background of natural frequency fluctuations depending on operating modes, changes in bearing stiffness, and so on. The presented calculation results confirm that even a large through crack (340 mm) in a single runner blade has little effect on the frequency spectrum and is not detected by vibration sensors. Similar cracks in all blades could change the measured frequencies for several eigenmodes, but this situation is improbable for the real operation.
The additional difficulties can be explained by the strong individuality of the hydraulic units that leads to significant differences in local stress and eigenfrequency spectrum. As a result, the lifetime for similar units, including identical units at the same HPP, may differ by two or more times. It excludes the use of any statistical lifetime estimations.
Thus, a solution to the problem of early crack detecting only by expanding the hardware base (e.g., increasing the number of measured values, using new types of sensors, improving the sensor sensitivity) or changing the algorithms for processing measurement results is not effective.
In this situation, the most promising direction in the development of diagnostic and prognostic systems for the near future is combining them with analytical blocks that implement the technology of individual numerical prediction of the unit’s lifetime according to the fatigue criteria. The concept of such a solution and its benefits are briefly presented in this article.
Funding
This research was funded by the Foundation for Assistance to Small Innovative Enterprises in Science and Technology (FASIE), Russia, Grant No. 3288ΓC1/55639, 27 November 2019, and the Skolkovo Innovation center, Grant No. 40113/07002/0329-2020, 22 April 2020.
Conflicts of Interest
The authors declare no conflict of interest.
References
- Datasheet. VSM-ZOOM/HYDRO. ZOOM System for Hydroelectric Generators. Available online: https://www.vibrosystm.com/en/documents/pdf?f=en/Datasheets/96VT-HYD1A-101.pdf&d=ZOOM%20System%20for%20Hydroelectric%20Generators&n=Datasheet%20%7C%20VSM-ZOOM%2FHYDRO (accessed on 24 September 2020).
- Andritz Hydro: DIA TECH Monitoring and Diagnosis System. Available online: https://www.andritz.com/hy-diatech-monitoring-diagnosis.pdf (accessed on 1 February 2017).
- Zhou, X.; Shi, C.; Miyagawa, K.; Wu, H.; Yu, J.; Ma, Z. Investigation of pressure fluctuation and pulsating hydraulic axial thrust in Francis turbines. Energies 2020, 13, 1734. [Google Scholar] [CrossRef] [Green Version]
- Duparchy, F.; Brammer, J.; Thibaud, M.; Favrel, A.; Lowys, P.Y.; Avellan, F. Mechanical impact of dynamic phenomena in Francis turbines at off design conditions. IOP Conf. Ser. J. Phys. Conf. Ser. 2017, 813, 012035. [Google Scholar] [CrossRef] [Green Version]
- Salles, C.; Quaranta, E. HYDROPOWER. The Next Frontier; Prescouter: Chicago, IL, USA, 2020; pp. 3–6. [Google Scholar]
- Trudel, A.; Turgeon, M.; Lanctôt, I. Recent trends in the design of hydropower components subjected to cycling and fatigue; towards improved technical design specifications. In Proceedings of the Hydrovision International Conference 2017, Denver, CO, USA, 27–30 June 2017; Available online: https://www.researchgate.net/publication/320310804_Recent_trends_in_the_design_of_hydropower_components_subjected_to_cycling_and_fatigue_towards_improved_technical_design_specifications/citations (accessed on 7 August 2020).
- ISO 20816-5:2018. Mechanical Vibration—Measurement and Evaluation of Machine Vibration—Part 5: Machine Sets in Hydraulic Power Generating and Pump-Storage Plants; ISO Copyright Office: Geneva, Switzerland, 2018. [Google Scholar]
- ISO 19283:2020. Condition Monitoring and Diagnostics of Machines—Hydroelectric Generating Units; ISO Copyright Office: Geneva, Switzerland, 2020. [Google Scholar]
- ISO 13373-7:2017. Condition Monitoring and Diagnostics of Machines—Vibration Condition Monitoring—Part 7: Diagnostic Techniques for Machine Sets in Hydraulic Power Generating and Pump-Storage Plants; ISO Copyright Office: Geneva, Switzerland, 2017. [Google Scholar]
- Andritz. Engineered Success. Intelligence for Machine and Process Control. Available online: https://www.andritz.com/products-en/separation/separation/control-systems/metris-addiq (accessed on 30 September 2020).
- Analytics Insight. Deploying Predictive Analytics into Action to Keep Up with Energy Demand. By Kamalika Some. Available online: https://www.analyticsinsight.net/deploying-predictive-analytics-action-keep-energy-demand/ (accessed on 12 September 2020).
- Hopf, K. Predictive Analytics for Energy Efficiency and Energy Retailing. Doctoral Thesis, Otto-Friedrich-Universität Bamberg, Bamberg, Germany, 2019. [Google Scholar] [CrossRef]
- Bordin, C.; Skjelbred, H.I.; Kong, J.; Yang, Z. Machine learning for hydropower scheduling: State of the art and future research directions. Procedia Comput. Sci. 2020, 176, 1659–1668. [Google Scholar] [CrossRef]
- Gregg, S.W.; Steele, J.P.H.; Van Bossuyt, D.L. Machine learning: A tool for predicting cavitation erosion rates on turbine runners. Hydro. Rev. 2017, 36, 28–36. [Google Scholar]
- Balauntescu, I.; Panaitescu, V. Low frequency pressure pulsations at high load in a Francis turbine. U.P.B. Sci. Bull. 2016, Series D, 78. Available online: https://www.scientificbulletin.upb.ro/rev_docs_arhiva/rezaa3_741805.pdf (accessed on 20 November 2020).
- Egusquiza, E.; Valero, C.; Xingxing, H.; Jou, E.; Guardo, A.; Rodriguez, C. Failure investigation of a large pump-turbine runner. Eng. Fail. Anal. 2012, 23, 27–34. [Google Scholar] [CrossRef] [Green Version]
- Frunzăverdel, D.; Muntean, S.; Mărginean, G.; Câmpiani, V.; Marşavina, L.; Terzi, R.; Şerban, V. Failure analysis of a Francis turbine runner. IOP Conf. Ser. Earth Environ. Sci. 2010, 12, 012115. [Google Scholar] [CrossRef]
- HydroReview. Whitepapers. Top Ten Reasons Generators Fail. Hydrogenerator Edition. Available online: https://www.hydroreview.com/whitepapers/top-ten-reasons-generators-fail-hydrogenerator-edition-2/ (accessed on 9 December 2019).
- Fotin, S.V. Experience in practical application of magnetic diagnostics. In Hydropower. New Developments and Technologies; IX NTC: Saint Petersburg, Russia, 2015. [Google Scholar]
- Trivedi, C.; Gandhi, B.; Michel, C.J. Effect of transients on Francis turbine runner life: A review. J. Hydraul. Res. 2013, 51, 112–132. [Google Scholar] [CrossRef]
- Monette, C.; Marmont, H.; Chamberland-Lauzon, J.; Skagerstrand, A.; Coutu, A.; Carlevi, J. Cost of enlarged operating zone for an existing Francis runner. IOP Conf. Ser. Earth Environ. Sci. 2016, 49, 072018. [Google Scholar] [CrossRef]
- Seidel, U.; Mende, C.; Hübner, B.; Weber, W.; Otto, A. Dynamic loads in Francis runners and their impact on fatigue life. IOP Conf. Ser. Earth Environ. Sci. 2014, 22, 32054–32062. [Google Scholar] [CrossRef] [Green Version]
- Zouhar, J.; Obrovsky, J.; Feilhauer, M.; Skotak, A. Case study and numerical analysis of vibration and runner cracks for the Lipno I hydroelectric project. IOP Conf. Ser. Earth Environ. Sci. 2016, 49, 072011. [Google Scholar] [CrossRef] [Green Version]
- Goyal, R.; Cervantes, M.J.; Gandhi, B.K. Vortex rope formation in a high head model Francis turbine. J. Fluids Eng. 2017, 139, 041102. [Google Scholar] [CrossRef]
- Valentín, D.; Presas, A.; Egusquiza, E.; Valero, C.; Egusquiza, M.; Bossio, M. Power swing generated in Francis turbines by part load and overload instabilities. Energies 2017, 10, 2124. [Google Scholar] [CrossRef] [Green Version]
- Presas, A.; Luo, Y.; Wang, Z.; Guo, B. Fatigue life estimation of Francis turbines based on experimental strain measurements: Review of the actual data and future trends. Renew. Sustain. Energy Rev. 2019, 102, 96–110. [Google Scholar] [CrossRef]
- Trivedi, C.; Cervantes, M.J. Fluid-structure interactions in Francis turbines: A perspective review. Renew. Sustain. Energy Rev. 2017, 68, 87–101. [Google Scholar] [CrossRef]
- Zhang, Y.; Liu, K.; Xian, H.; Du, X. A review of methods for vortex identification in hydroturbines. Renew. Sustain. Energy Rev. 2018, 81, 1269–1285. [Google Scholar] [CrossRef]
- Gomes, P.A., Jr.; Favrel, C.; Nicolet, F. Avellan part load resonance risk assessment of Francis hydropower units. In Proceedings of the 13th European Conference on Turbomachinery Fluid dynamics & Thermodynamics, ETC13, Lausanne, Switzerland, 8–12 April 2019. Paper ID: ETC2019-381. [Google Scholar]
- Poll, H.G.; Zanutto, J.C.; Ponge-Ferreira, W. Hydraulic power plant machine dynamic diagnosis. Shock Vib. 2006, 13, 409–427. [Google Scholar] [CrossRef]
- Husnjak, O.; Orešković, O.; Tonković, F.; Cesta, N. Dynamic Behavior of Hydro Units in the Rough Load Zone, with Case Studies. Available online: https://veski.hr/public/brochures/Dynamic_behavior_of_hydro_units_in_the_rough_load_zone_with_case_studies_Hydro2019_Husnjak_Oreskovic_Tonkovic.pdf (accessed on 24 September 2020).
- Georgievskaia, E. Effect of cracks on dynamic parameters and lifetime of hydraulic units. Procedia Struct. Integr. 2019, 22, 229–234. [Google Scholar] [CrossRef]
- Telenor Group. Telenor: 20 Technology Trends that Will Shape 2020. Available online: https://www.telenor.com/media/press-release/telenor-20-technology-trends-that-will-shape-2020 (accessed on 24 September 2020).
- Valentín, D.; Ramos, D.; Bossio, M.; Presas, A.; Egusquiza, E.; Valero, C. Influence of the boundary conditions on the natural frequencies of a Francis turbine. IOP Conf. Ser. Earth Environ. Sci. 2016, 49, 072004. [Google Scholar] [CrossRef] [Green Version]
- Huang, X.; Oram, C.; Sick, M. Static and dynamic stress analyses of the prototype high head Francis runner based on site measurement. IOP Conf. Ser. Earth Environ. Sci. 2014, 22, 32052–32061. [Google Scholar] [CrossRef] [Green Version]
- Monette, C.; Nennemann, B.; Seeley, C.; Coutu, A.; Marmont, H. Hydro-dynamic damping theory in flowing water. IOP Conf. Ser. Earth Environ. Sci. 2014, 22, 032044. [Google Scholar] [CrossRef]
- Pochylý, P.; Fialová, S.; Kozubková, M.; Bojko, M. Tensors of added damping, stiffness and mass in a thin gap of hydrodynamic machine. IOP Conf. Ser. Earth Environ. Sci. 2012, 15, 072027–072034. [Google Scholar] [CrossRef]
- Flores, M.; Urquiza, G.; Rodríguez, J.M. A fatigue analysis of a hydraulic Francis turbine runner. World J. Mech. 2012, 2, 28–34. [Google Scholar] [CrossRef] [Green Version]
- Georgievskaia, E.V. O svyazi vibracij i dinamicheskih napryazhenij v lopastnoj sisteme gidroturbin. Izv. VNIIG im. B.E. Vedeneeva 2017, 283, 54–65. [Google Scholar]
- Valentín, D.; Presas, A.; Bossio, M.; Egusquiza, M.; Egusquiza, E.; Valero, C. Feasibility of detecting natural frequencies of hydraulic turbines while in operation, using strain gauges. Sensors 2018, 18, 174. [Google Scholar] [CrossRef] [PubMed] [Green Version]
- Zhang, M.; Valentin, D.; Valero, C.; Egusquiza, M.; Zhao, W. Numerical study on the dynamic behavior of a Francis turbine runner model with a crack. Energies 2018, 11, 1630. [Google Scholar] [CrossRef] [Green Version]
- Gagnon, M.; Jobidon, N.; Lawrence, M.; Larouche, D. Optimization of turbine startup: Some experimental results from a propeller runner. IOP Conf. Ser. Earth Environ. Sci. 2014, 22, 032022. [Google Scholar] [CrossRef]
- Goyal, R.; Gandhi, B.K.; Cervantes, M.J. Experimental investigation on a high head Francis turbine model during shutdown operation. IOP Conf. Ser. Earth Environ. Sci. 2019, 240, 022028. [Google Scholar] [CrossRef]
- Valentin, D.; Presas, A.; Valero, C.; Egusquiza, M.; Egusquiza, E. Influence of the hydrodynamic damping on the dynamic response of Francis turbine runners. J. Fluids Struct. 2019, 90, 71–89. [Google Scholar] [CrossRef]
- Unterluggauer, J.; Sulzgruber, V.; Doujak, E.; Bauer, C. Experimental and numerical study of a prototype Francis turbine startup. Renew. Energy 2020, 157, 1212–1221. [Google Scholar] [CrossRef]
- Arpin-Pont, J.; Gagnon, M.; Tahan, S.A.; Coutu, A.; Thibault, D. Methodology for estimating strain gauge measurement biases and uncertainties. J. Strain Anal. Eng. Des. 2014, 50, 40–50. [Google Scholar] [CrossRef]
- Baril, Y.; Léonard, F.; Ireq, H.Q. On the Use of Static and Rotating Coordinate Measurements to Understand Transient Behaviours in Hydroelectric Turbines. 2014. Available online: https://www.researchgate.net/publication/281777278_ON_THE_USE_OF_STATIC_AND_ROTATING_COORDINATE_MEASUREMENTS_TO_UNDERSTAND_TRANSIENT_BEHAVIOURS_IN_HYDROELECTRIC_TURBINES (accessed on 15 December 2020).
- Georgievskaia, E. Predictive analytics as a way to smart maintenance of hydraulic turbines. In Proceedings of the 1st Virtual European Conference on Fracture VECF1, Online, 29 June–1 July 2020; Available online: https://www.youtube.com/watch?v=T3HUEWAzv_4&list=PLqdhWx9Ll8U7Hrv_Hu-qLFAXE7QM-A2RT&index=149 (accessed on 24 September 2020).
- BS 7910:2019. Guide to Methods for Assessing the Acceptability of Flaws in Metallic Structures; BSI: London, UK, 2019. [Google Scholar]
- Åsnes, A.; Willersrud, A.; Kretz, F.; Imsland, L. Predictive Maintenance and Life Cycle Estimation for Hydro Power Plants with Real-Time Analytics. Predict. Maint. Life Cycle Estim. Hydro Power Plants with Real-Time Anal. 2018. Available online: https://www.researchgate.net/publication/328879561 (accessed on 20 November 2020).
Figure 1.
Examples of damage to hydraulic unit components: (a) crack on a trailing edge of a runner near the band [15]; (b) broken blade [17]; (c) broken shaft of the large hydraulic unit; (d) a hydro-generator pole with a broken dovetail.

Figure 2.
Comparison of the project and the actual individual lifetime. Project—lifetime assessment at the design stage, Real-1, Real-2, Real-3—lifetime assessment under various scenarios of actual operating conditions and performed repairs.
Figure 2.
Comparison of the project and the actual individual lifetime. Project—lifetime assessment at the design stage, Real-1, Real-2, Real-3—lifetime assessment under various scenarios of actual operating conditions and performed repairs.

Figure 3.
The key types of eigenmodes (the distribution of displacements normalized to 1.0) for the defect-free design: (a) type I—bending vibrations with deformation of the unit shaft, f3 = 10.6 Hz; (b) type II—bending vibrations of the runner without deformation of the unit shaft, f16 = 58.5 Hz; (c) type IV—axial (longitudinal) vibrations without radial displacement of the unit shaft, f8 = 28.1 Hz; (d) type III—torsional vibrations without axial and radial displacement, f7 = 17.6 Hz.

Figure 4.
The influence of cracks on the eigenfrequencies of the unit: (a) change in absolute values; (b) change in relative values.
Figure 4.
The influence of cracks on the eigenfrequencies of the unit: (a) change in absolute values; (b) change in relative values.

Figure 5.
Conceptual diagram of the proposed analytical predictive system.

Figure 6.
Comparison of the capabilities of analytical and vibrodiagnostic methods for detecting cracks in the Francis turbine runner.
Figure 6.
Comparison of the capabilities of analytical and vibrodiagnostic methods for detecting cracks in the Francis turbine runner.


Table 1.
The eigenfrequencies and dynamic parameters for the defect-free model.
| Mode | Frequency, Hz | Mode Type | Participation Factor | Effective Mass, kg | to Total Mass, % | |||||||
|---|---|---|---|---|---|---|---|---|---|---|---|---|
| Direction | Direction | Direction | ||||||||||
| Air | Water | X | Y | Z | X | Y | Z | X | Y | Z | ||
| 1 | 8.96 | 6.40 | I | 1.000 | 0.807 | 0.000 | 220 173 | 143 357 | 0 | 28.64 | 18.65 | 0.00 |
| 2 | 8.96 | 6.40 | I | 0.807 | 1.000 | 0.000 | 143 357 | 220 173 | 0 | 18.65 | 28.64 | 0.00 |
| 3 | 10.6 | 8.09 | I | 0.908 | 0.433 | 0.000 | 181 641 | 41 202 | 0 | 23.63 | 5.36 | 0.00 |
| 4 | 10.6 | 8.09 | I | 0.433 | 0.908 | 0.000 | 41 202 | 181 643 | 0 | 5.36 | 23.63 | 0.00 |
| 5 | 12.8 | 10.7 | I | 0.820 | 0.328 | 0.000 | 148 188 | 23 751 | 0 | 19.27 | 3.09 | 0.00 |
| 6 | 12.8 | 10.7 | I | 0.328 | 0.820 | 0.000 | 23 750 | 148 186 | 0 | 3.09 | 19.27 | 0.00 |
| 7 | 17.6 | 17.6 | III | 0.000 | 0.000 | 0.006 | 0 | 0 | 31 | 0.00 | 0.00 | 0.00 |
| 8 | 28.1 | 28.1 | IV | 0.000 | 0.000 | 1.000 | 0 | 0 | 745 179 | 0.00 | 0.00 | 96.92 |
| 9 | 31.7 | 26.4 | I | 0.166 | 0.043 | 0.000 | 6 077 | 413 | 0 | 0.79 | 0.05 | 0.00 |
| 10 | 31.7 | 26.4 | I | 0.043 | 0.166 | 0.000 | 413 | 6 076 | 0 | 0.05 | 0.79 | 0.00 |
| 11 | 42.3 | 38.5 | I | 0.070 | 0.070 | 0.000 | 1 093 | 1 092 | 0 | 0.14 | 0.14 | 0.00 |
| 12 | 42.3 | 38.5 | I | 0.070 | 0.070 | 0.000 | 1 092 | 1 093 | 0 | 0.14 | 0.14 | 0.00 |
| 13 | 55.2 | 55.2 | V(III + IV) | 0.000 | 0.000 | 0.098 | 0 | 0 | 7 159 | 0.00 | 0.00 | 0.93 |
| 14 | 57.2 | 57.2 | III | 0.065 | 0.060 | 0.000 | 943 | 797 | 0 | 0.12 | 0.10 | 0.00 |
| 15 | 57.2 | 57.2 | III | 0.060 | 0.065 | 0.000 | 797 | 943 | 0 | 0.10 | 0.12 | 0.00 |
| 16 | 58.5 | 53.2 | II | 0.000 | 0.000 | 0.000 | 0 | 0 | 0 | 0.00 | 0.00 | 0.00 |
| 17 | 58.6 | 53.3 | II | 0.000 | 0.000 | 0.000 | 0 | 0 | 0 | 0.00 | 0.00 | 0.00 |
| 18 | 89.6 | 89.6 | III | 0.000 | 0.000 | 0.001 | 0 | 0 | 1 | 0.00 | 0.00 | 0.00 |
| 19 | 116 | 116 | IV | 0.000 | 0.000 | 0.002 | 0 | 0 | 3 | 0.00 | 0.00 | 0.00 |
| 20 | 122 | 111 | II | 0.000 | 0.000 | 0.000 | 0 | 0 | 0 | 0.00 | 0.00 | 0.00 |
| 21 | 122 | 111 | II | 0.000 | 0.000 | 0.000 | 0 | 0 | 0 | 0.00 | 0.00 | 0.00 |
| 22 | 128 | 116 | II | 0.000 | 0.000 | 0.000 | 0 | 0 | 0 | 0.00 | 0.00 | 0.00 |
| 23 | 128 | 116 | II | 0.000 | 0.000 | 0.000 | 0 | 0 | 0 | 0.00 | 0.00 | 0.00 |
| 24 | 135 | 122 | I | 0.004 | 0.005 | 0.000 | 3 | 5 | 0 | 0.00 | 0.00 | 0.00 |
| 25 | 135 | 122 | I | 0.005 | 0.004 | 0.000 | 5 | 3 | 0 | 0.00 | 0.00 | 0.00 |
| 26 | 137 | 125 | II | 0.000 | 0.000 | 0.000 | 0 | 0 | 0 | 0.00 | 0.00 | 0.00 |
| 27 | 148 | 148 | V(III + IV) | 0.000 | 0.000 | 0.012 | 0 | 0 | 114 | 0.00 | 0.00 | 0.01 |
| 28 | 149 | 135 | II | 0.000 | 0.000 | 0.000 | 0 | 0 | 0 | 0.00 | 0.00 | 0.00 |
| 29 | 152 | 139 | II | 0.000 | 0.000 | 0.000 | 0 | 0 | 0 | 0.00 | 0.00 | 0.00 |
Table 2.
The eigenfrequencies for the defect-free model and for the runner with cracks 340 mm long.
| Mode | Frequency, Hz | Eigenfrequency Shift | |||||
|---|---|---|---|---|---|---|---|
| Without Crack | Crack on the One Blade | Cracks on All Blades | Crack on the One Blade | Cracks on All Blades | Crack on the One Blade | Cracks on All Blades | |
| f0 | fc | Df, Hz | Δf, % | ||||
| 1 | 8.96 | 8.96 | 8.96 | 0.00 | 0.00 | 0.00 | 0.00 |
| 2 | 8.96 | 8.96 | 8.96 | 0.00 | 0.00 | 0.00 | 0.00 |
| 3 | 10.6 | 10.6 | 10.5 | 0.00 | 0.10 | 0.00 | 0.94 |
| 4 | 10.6 | 10.6 | 10.5 | 0.00 | 0.10 | 0.00 | 0.94 |
| 5 | 12.8 | 12.8 | 12.5 | 0.00 | 0.30 | 0.00 | 2.34 |
| 6 | 12.8 | 12.8 | 12.5 | 0.00 | 0.30 | 0.00 | 2.34 |
| 7 | 17.6 | 17.6 | 17.5 | 0.00 | 0.10 | 0.00 | 0.57 |
| 8 | 28.1 | 28.1 | 25.2 | 0.00 | 2.90 | 0.00 | 10.32 |
| 9 | 31.7 | 31.6 | 25.2 | 0.10 | 6.50 | 0.32 | 20.50 |
| 10 | 31.7 | 31.7 | 28 | 0.01 | 3.71 | 0.03 | 11.70 |
| 11 | 42.3 | 42.3 | 42.3 | 0.00 | 0.00 | 0.00 | 0.00 |
| 12 | 42.3 | 42.3 | 42.3 | 0.00 | 0.00 | 0.00 | 0.00 |
| 13 | 55.2 | 55.2 | 50.4 | 0.00 | 4.80 | 0.00 | 8.70 |
| 14 | 57.2 | 57.1 | 52 | 0.10 | 5.20 | 0.17 | 9.09 |
| 15 | 57.2 | 57.2 | 52 | 0.00 | 5.20 | 0.00 | 9.09 |
| 16 | 58.5 | 58.2 | 54.9 | 0.30 | 3.60 | 0.51 | 6.15 |
| 17 | 58.6 | 58.5 | 54.9 | 0.10 | 3.70 | 0.17 | 6.31 |
| 18 | 89.6 | 89.5 | 88.9 | 0.10 | 0.70 | 0.11 | 0.78 |
| 19 | 115.7 | 115.4 | 106.4 | 0.30 | 9.30 | 0.26 | 8.04 |
| 20 | 121.8 | 121.2 | 113 | 0.60 | 8.80 | 0.49 | 7.22 |
| 21 | 121.8 | 121.7 | 113 | 0.10 | 8.80 | 0.08 | 7.22 |
| 22 | 128.1 | 128.1 | 123.6 | 0.00 | 4.50 | 0.00 | 3.51 |
| 23 | 128.1 | 128.1 | 124.6 | 0.00 | 3.50 | 0.00 | 2.73 |
| 24 | 134.5 | 134.5 | 128.1 | 0.00 | 6.40 | 0.00 | 4.76 |
| 25 | 134.5 | 134.5 | 128.1 | 0.00 | 6.40 | 0.00 | 4.76 |
| 26 | 137.2 | 137.2 | 130.3 | 0.00 | 6.90 | 0.00 | 5.03 |
| 27 | 148.2 | 147.7 | 130.3 | 0.50 | 17.90 | 0.34 | 12.08 |
| 28 | 148.8 | 148.2 | 137.2 | 0.60 | 11.60 | 0.40 | 7.80 |
| 29 | 152.3 | 152.1 | 142.5 | 0.20 | 9.80 | 0.13 | 6.43 |
Publisher’s Note: MDPI stays neutral with regard to jurisdictional claims in published maps and institutional affiliations. |
© 2021 by the author. Licensee MDPI, Basel, Switzerland. This article is an open access article distributed under the terms and conditions of the Creative Commons Attribution (CC BY) license (http://creativecommons.org/licenses/by/4.0/).
Share and Cite
MDPI and ACS Style
Georgievskaia, E. Limitations of Modern Diagnostic and Prognostic Systems for a Hydraulic Unit’s Health. Eng 2021, 2, 27-42. https://0-doi-org.brum.beds.ac.uk/10.3390/eng2010003
AMA Style
Georgievskaia E. Limitations of Modern Diagnostic and Prognostic Systems for a Hydraulic Unit’s Health. Eng. 2021; 2(1):27-42. https://0-doi-org.brum.beds.ac.uk/10.3390/eng2010003
Chicago/Turabian StyleGeorgievskaia, Evgeniia. 2021. "Limitations of Modern Diagnostic and Prognostic Systems for a Hydraulic Unit’s Health" Eng 2, no. 1: 27-42. https://0-doi-org.brum.beds.ac.uk/10.3390/eng2010003