
Study of the Effect of an Environmentally Friendly Flood Risk Reduction Approach on the Oman Coastlines during the Gonu Tropical Cyclone (Case Study: The Coastline of Sur)


Abstract
:1. Introduction
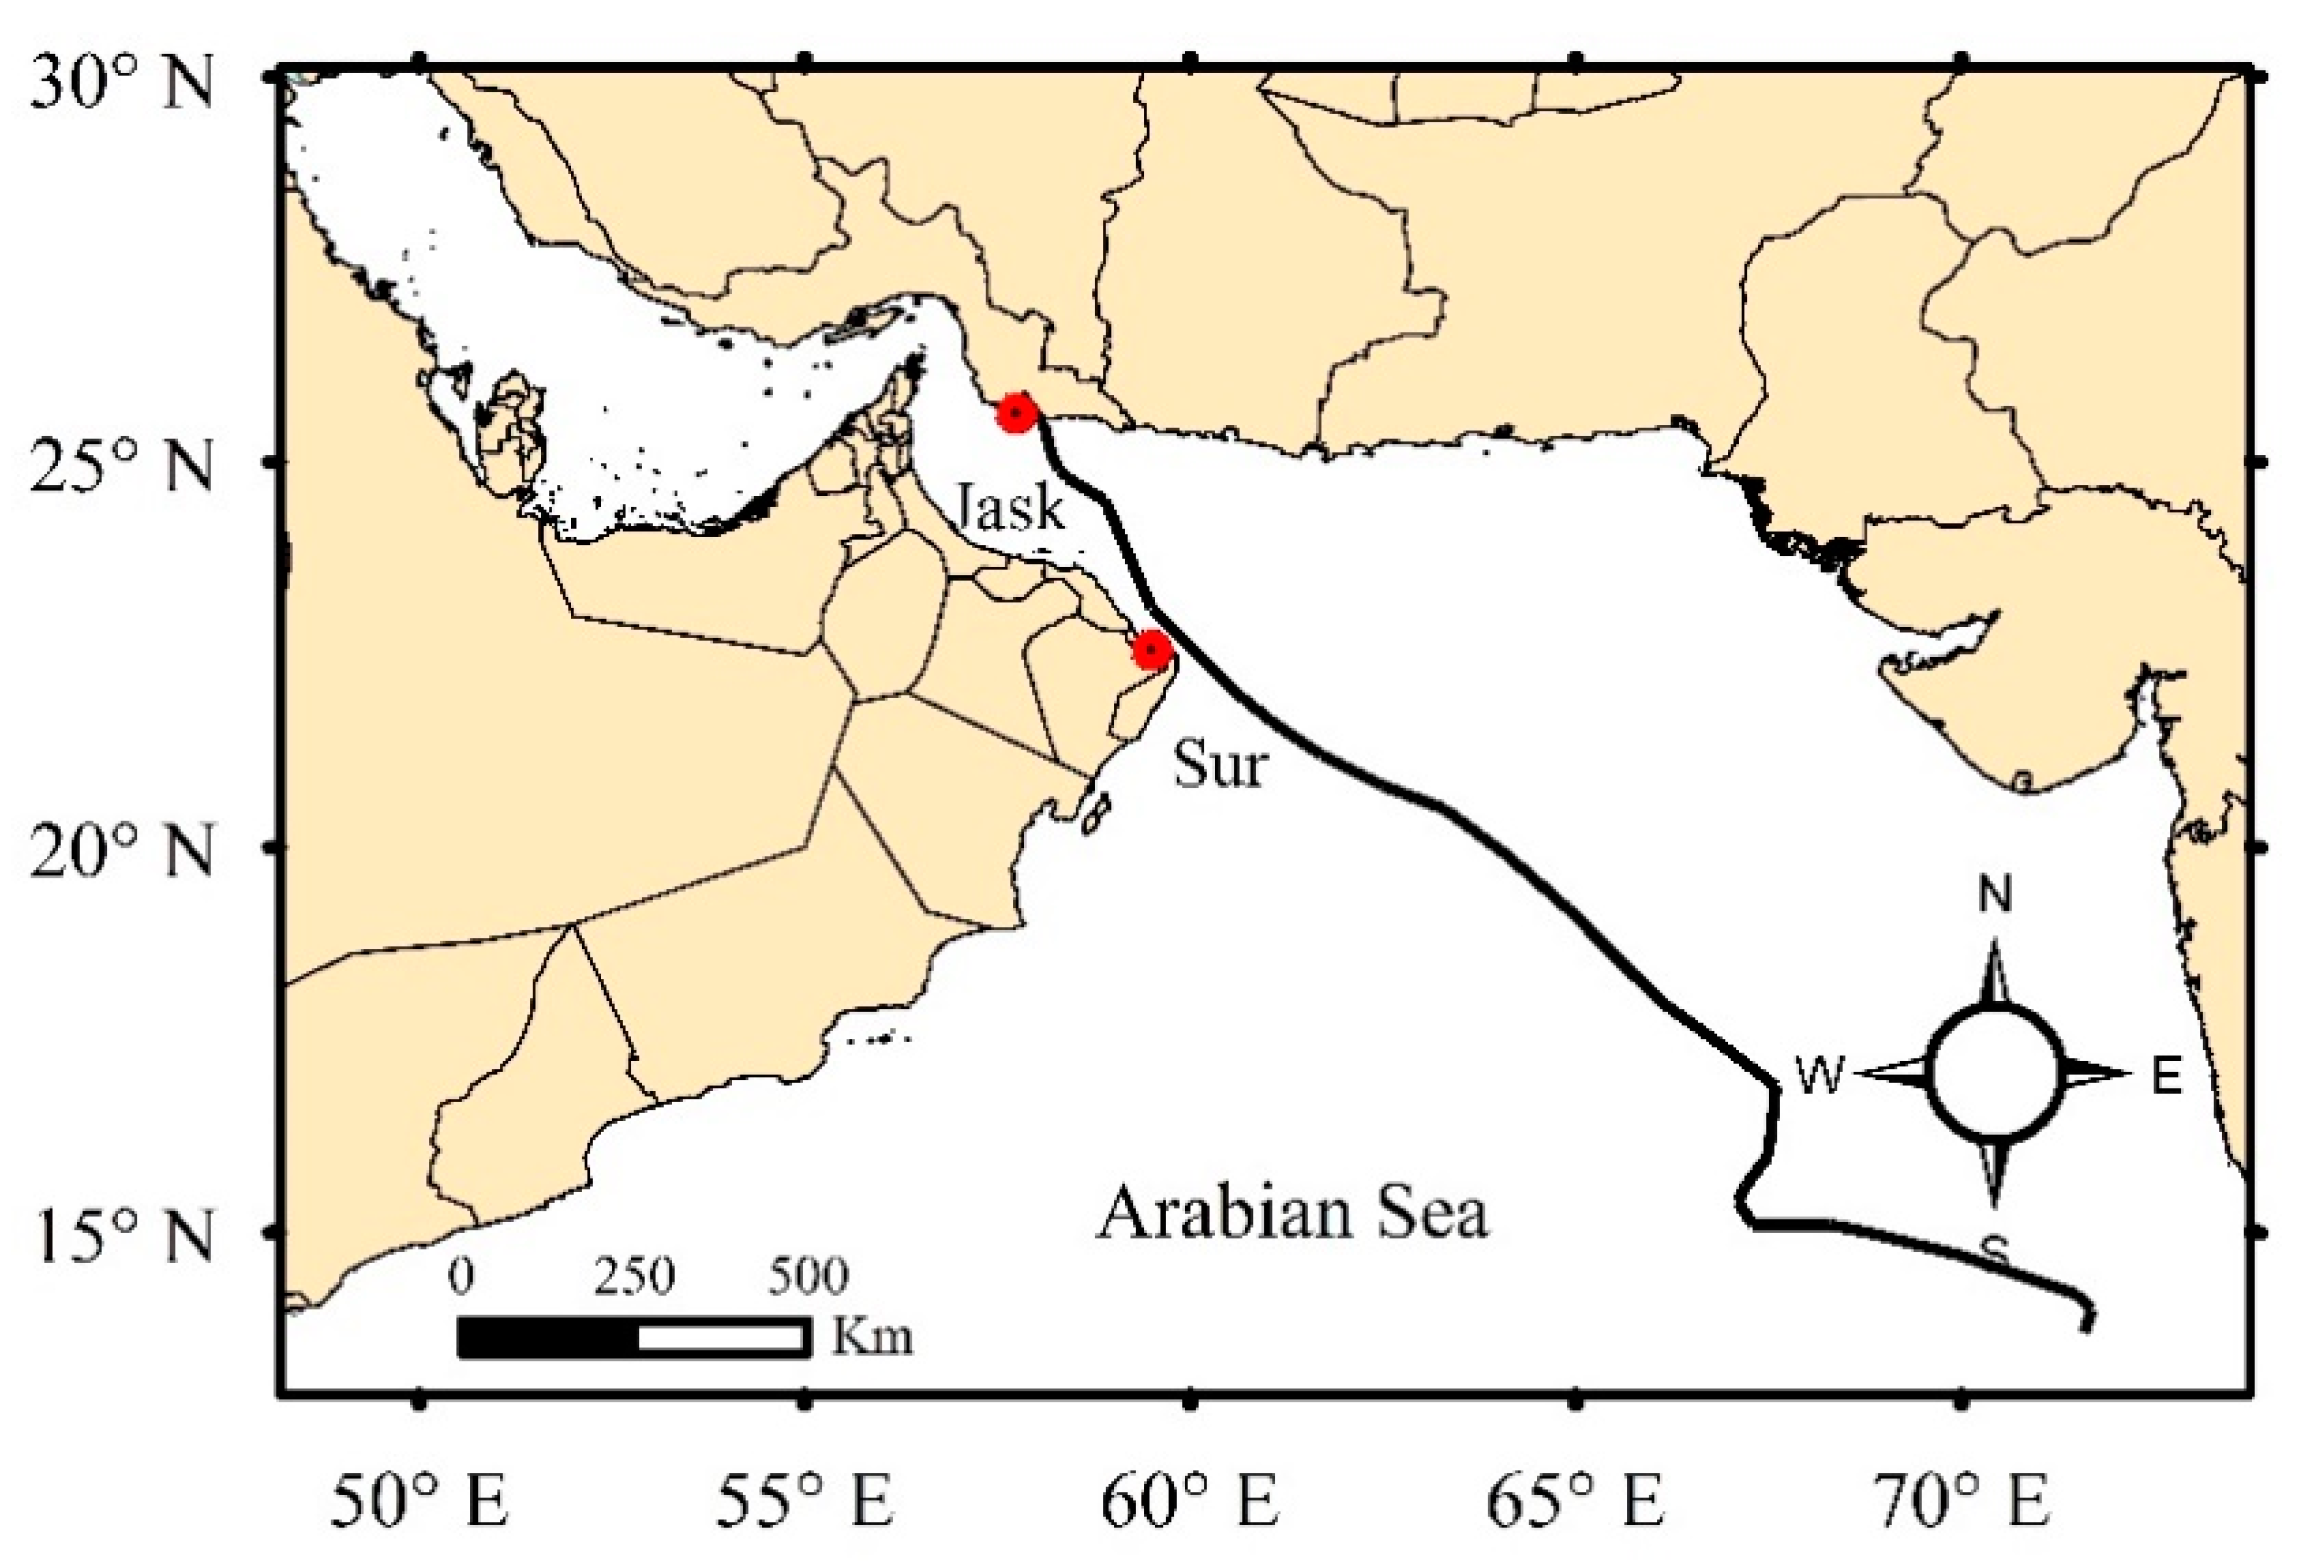
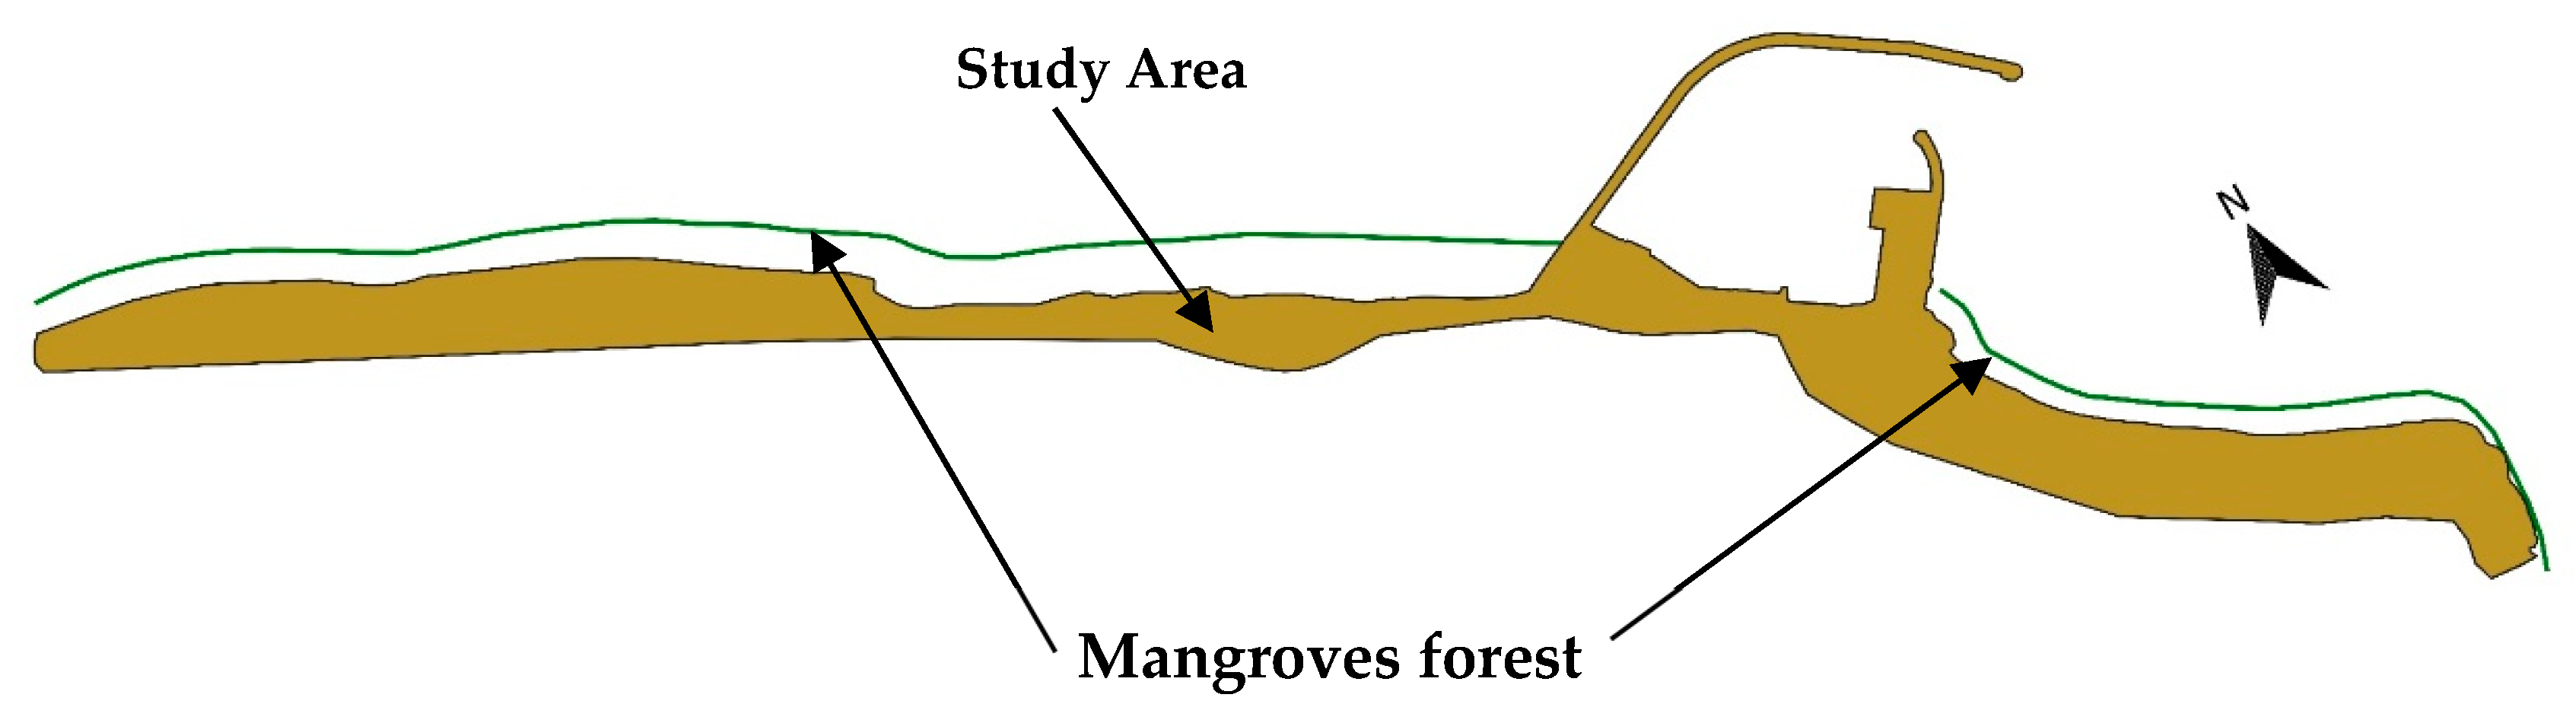
2. Case Study
3. Materials and Methods
3.1. The Governing Equation of MIKE21 SW
3.2. The Governing Equation of MIKE21 FM
3.3. Data and Modeling
4. Results and Discussion
4.1. Inundation Model Results
4.2. Mangroves for Mitigation Scenario
5. Conclusions
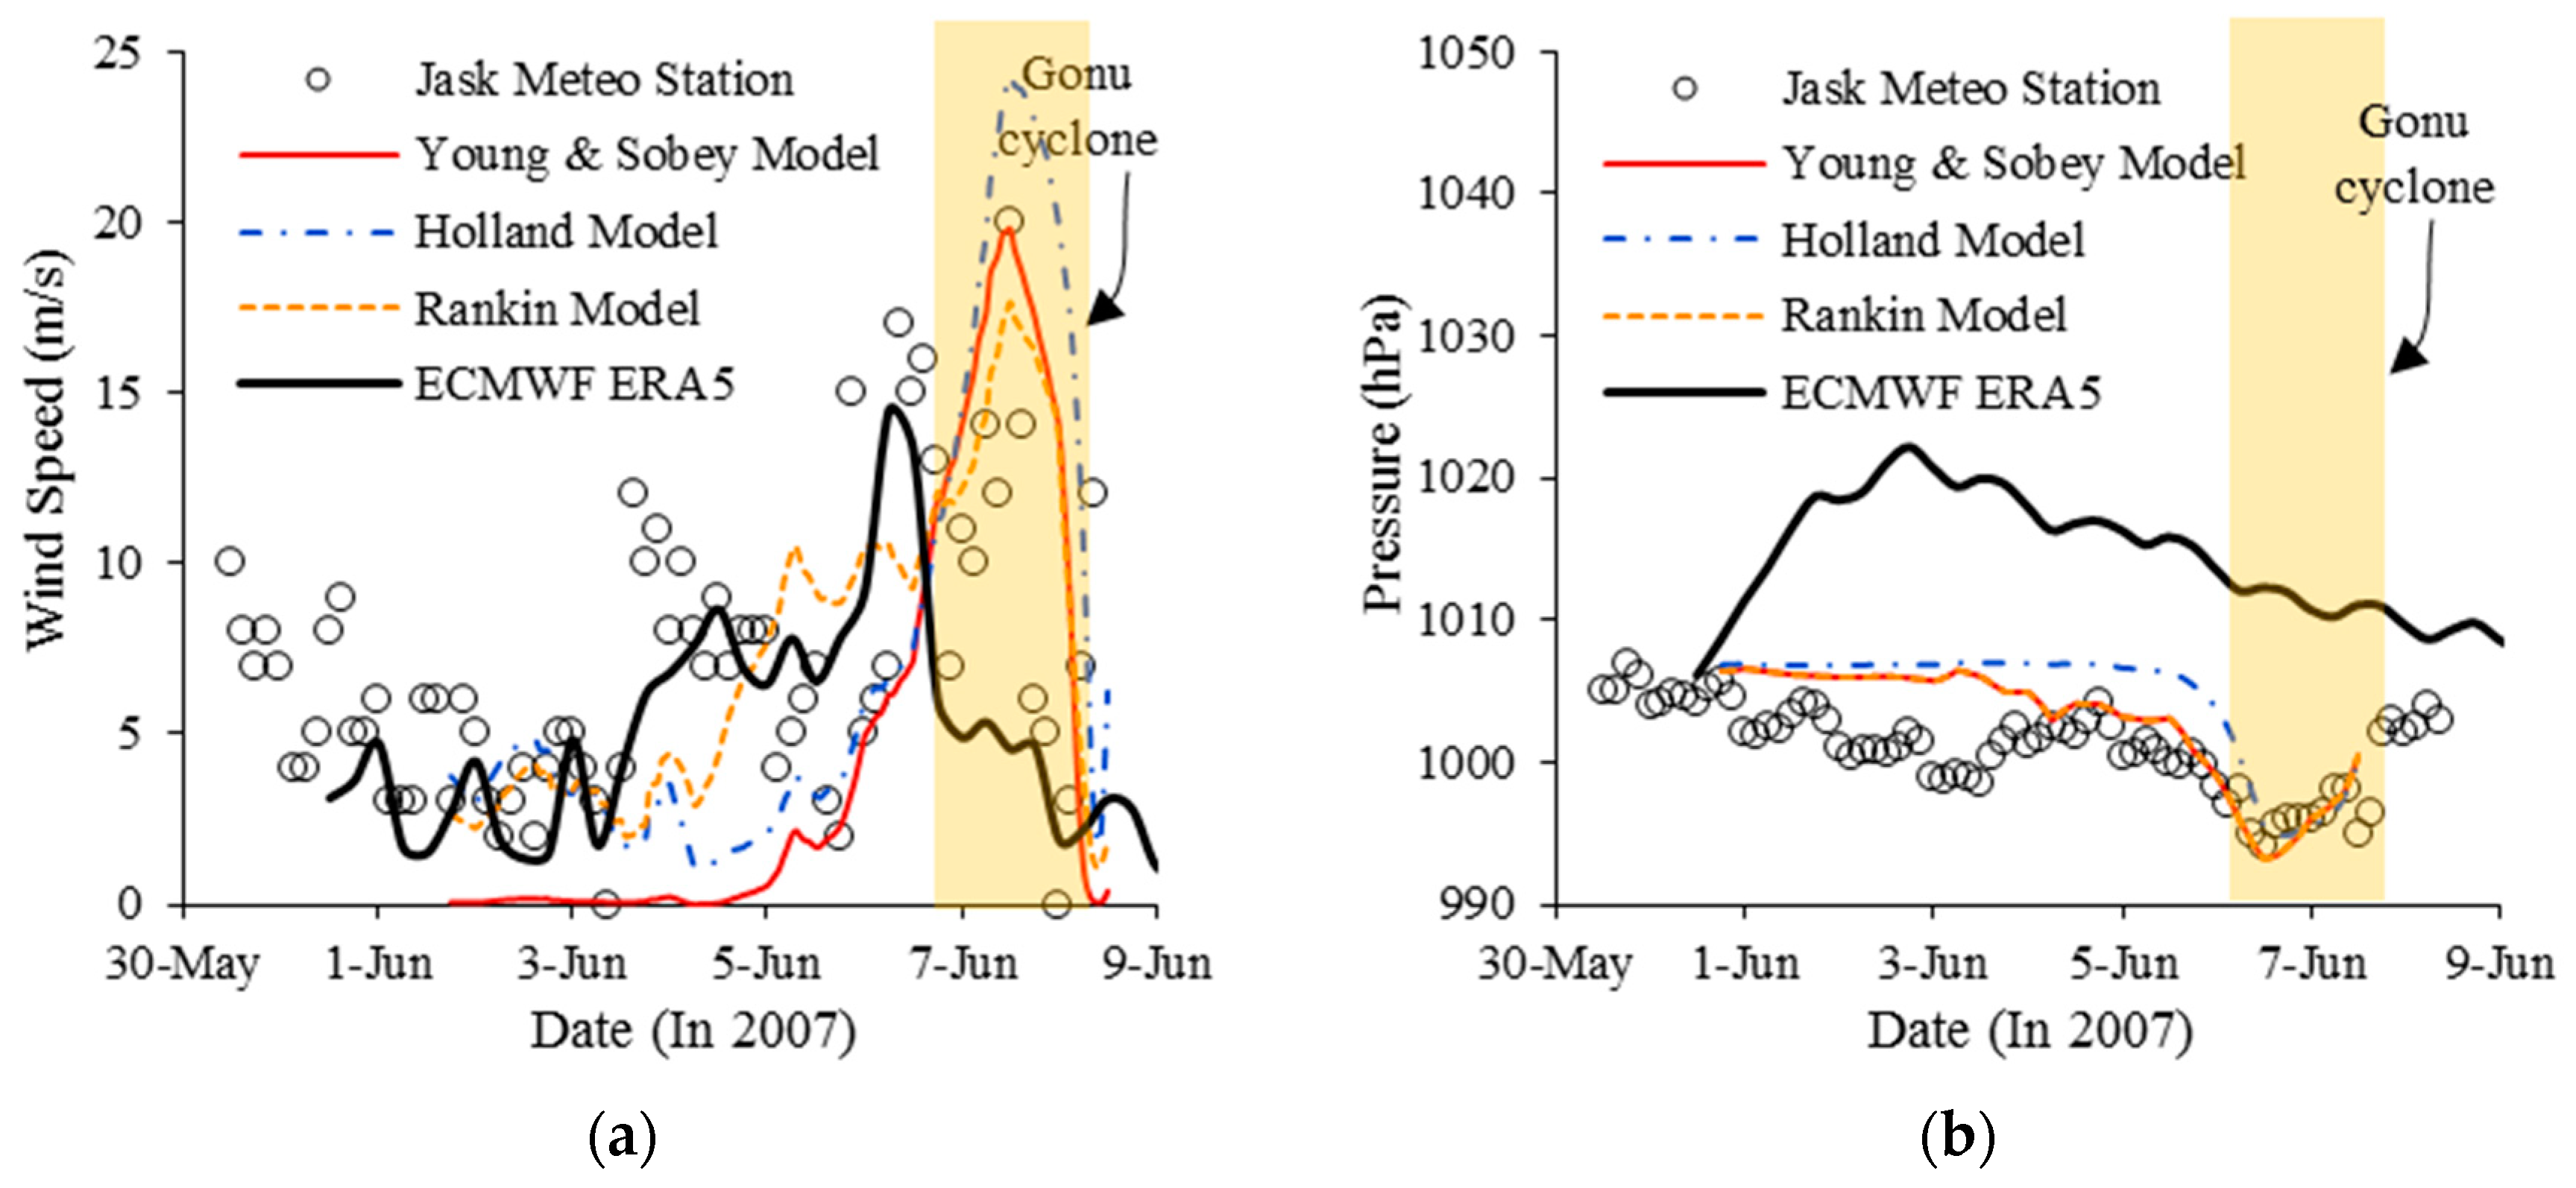
- The analytical vortex models well captured the wind and pressure field during the storm event. However, the ECMWF ERA5 data did not accurately capture the wind and pressure field due to the proximity of the Gonu cyclone track to the study area. However, the ECMWF ERA5 data are accurate enough in non-cyclonic weather conditions.
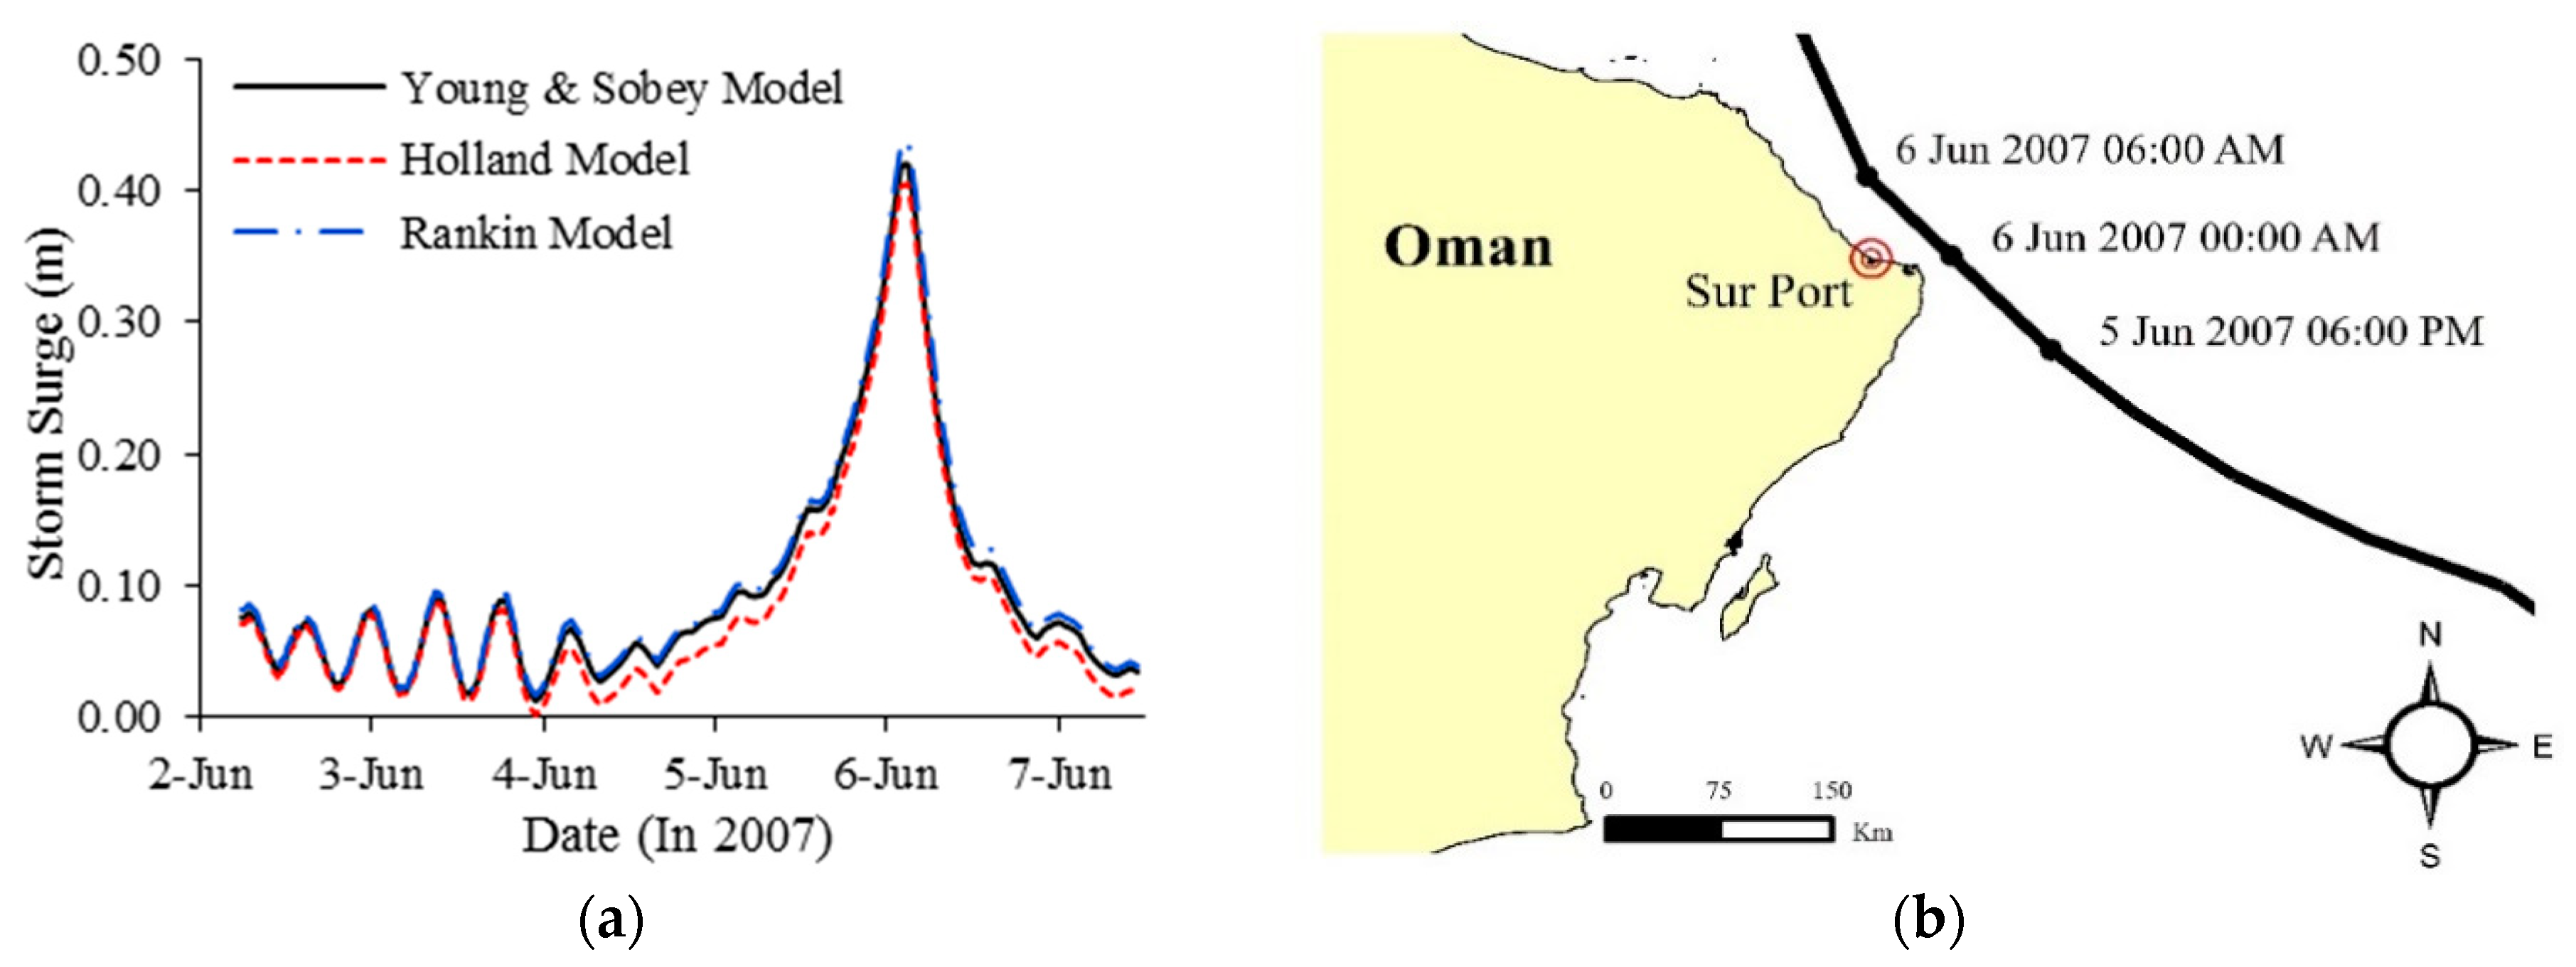
- The storm surge near the Sur shore achieved its peak value of 0.44 m (by the Rankine vortex model). While the maximum surge in the normal condition was almost less than 0.1 m. This indicates that the Gonu cyclone led to a significant rise in seawater level that caused inland flooding. Meanwhile, it seems that there are no significant differences among the results of storm surge from different analytical vortex models.
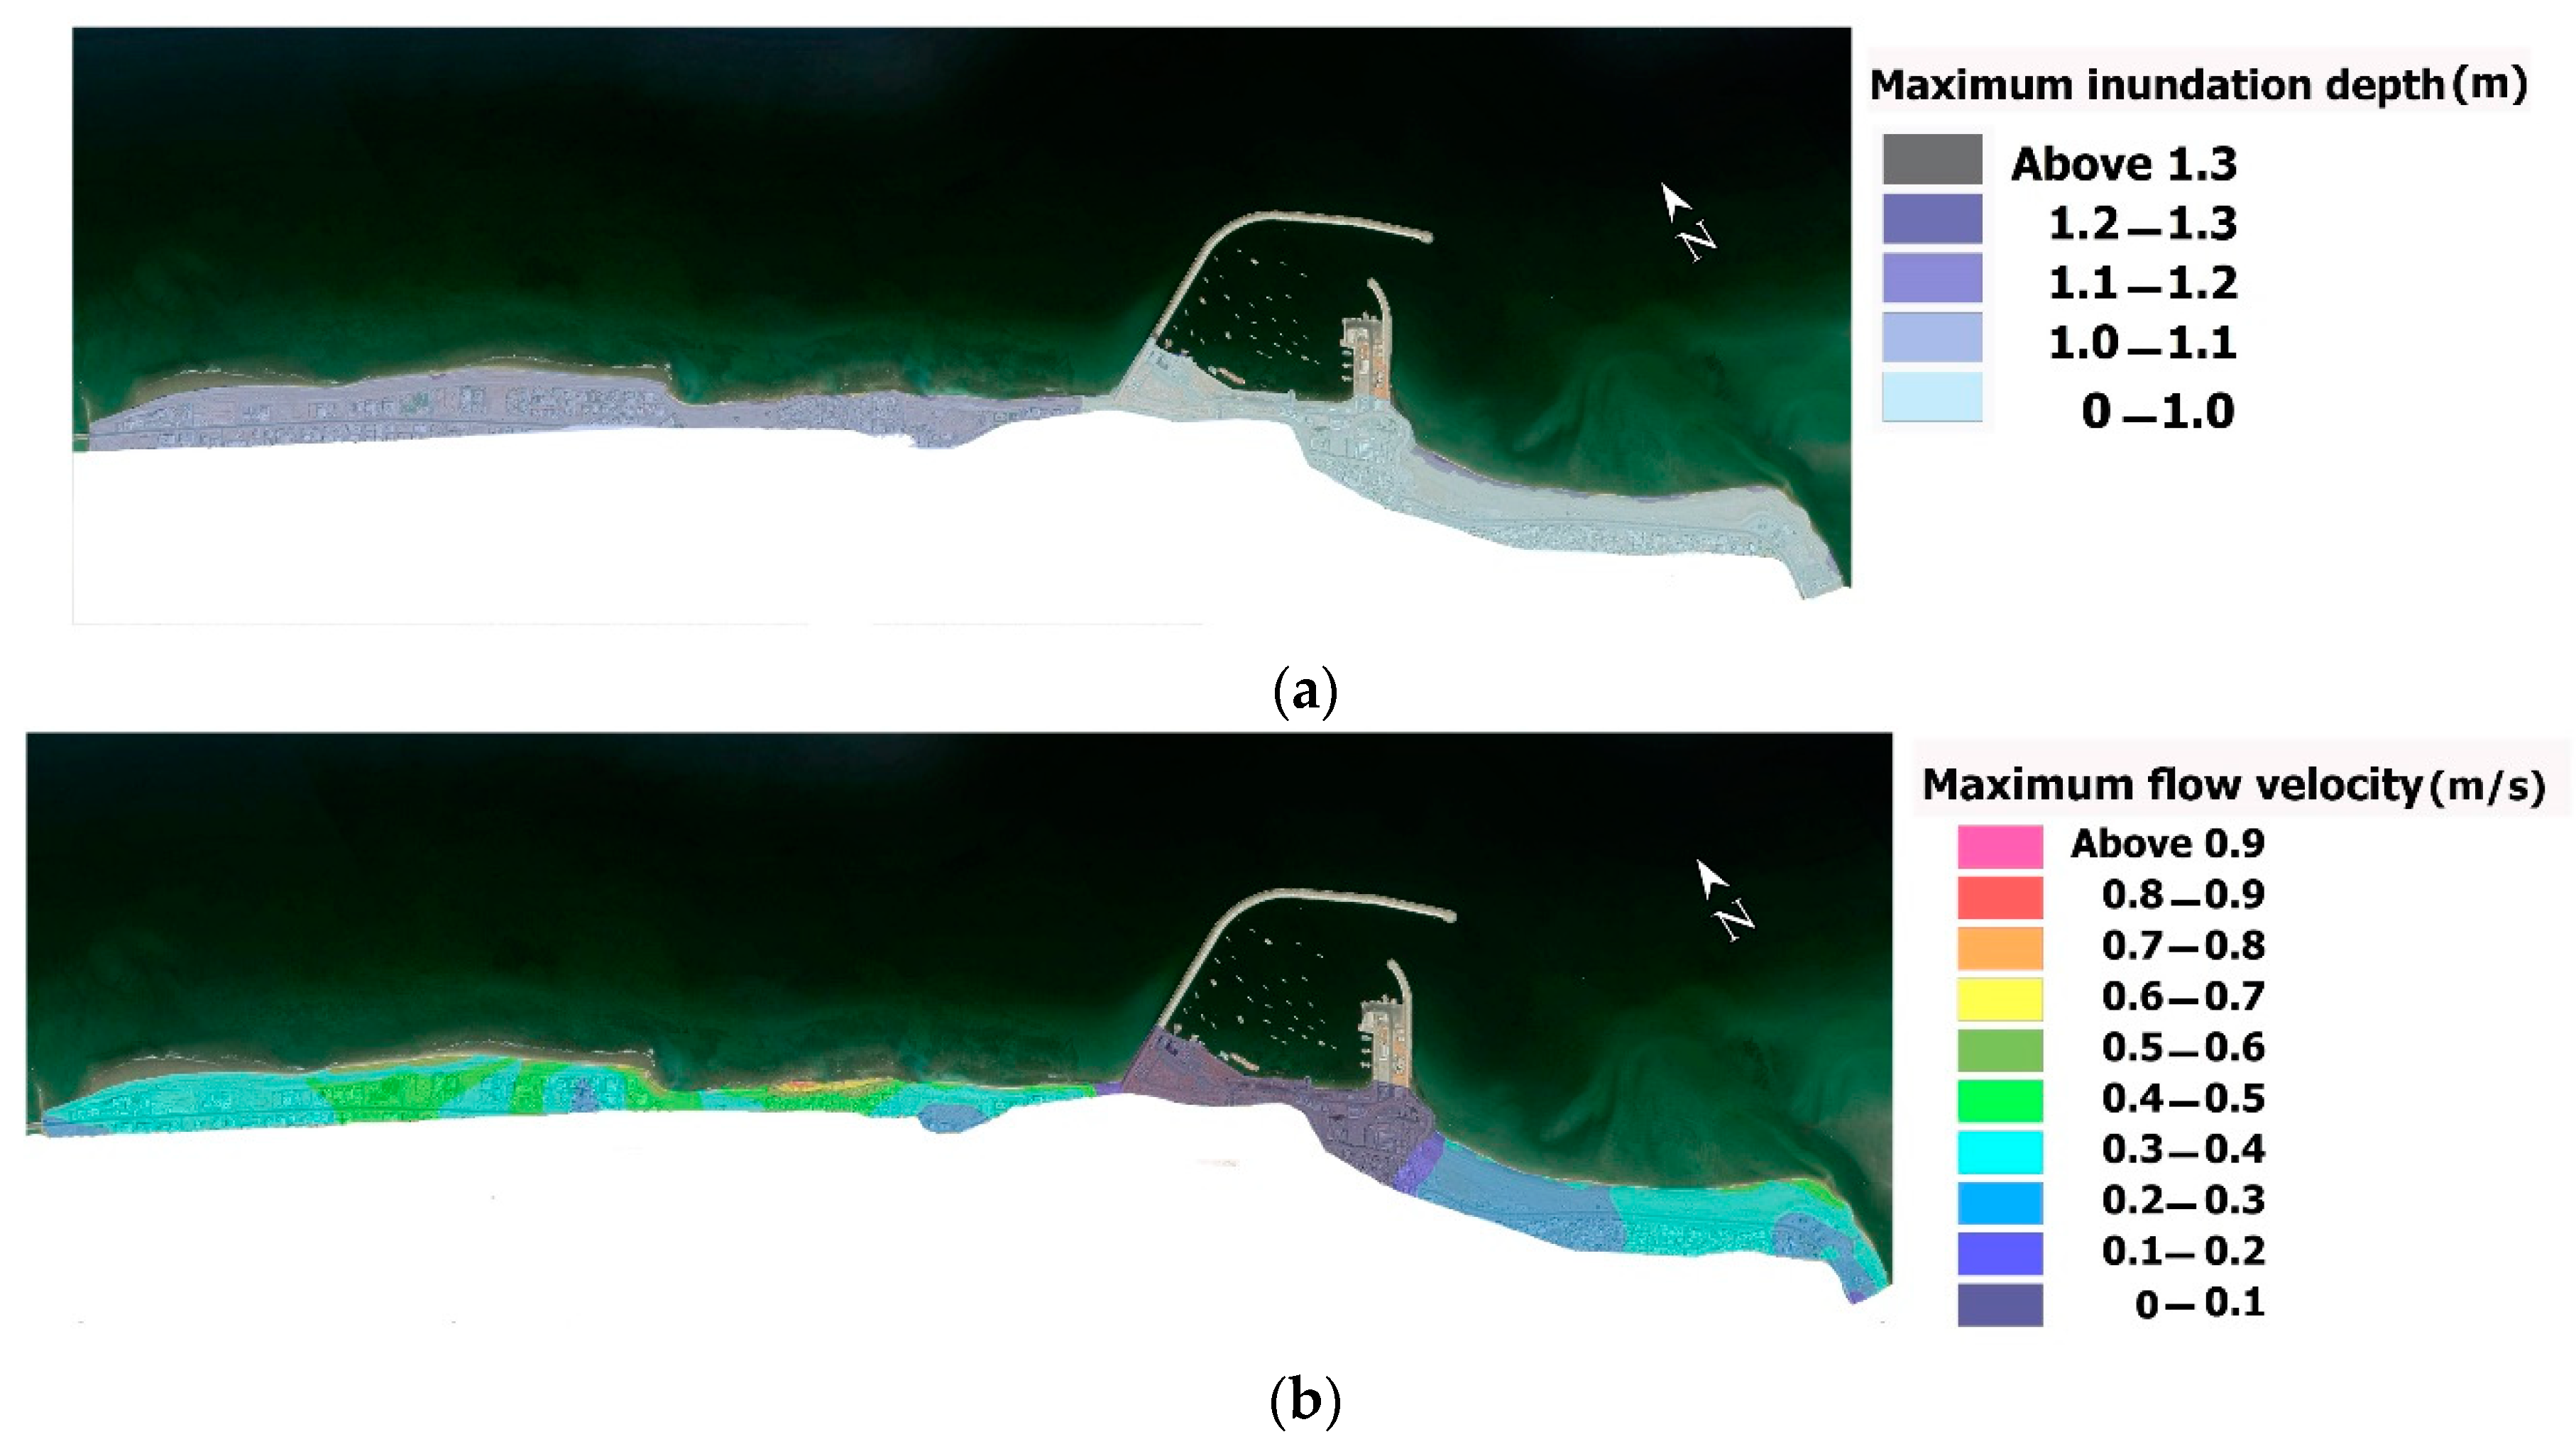
- Maximum inundation depth occurs along the shoreline over the central part of the study area with the values ~1.3 m for the flood scenario without Mangroves. Moreover, in this scenario, for most of the western part of the model, the inundation depth increases up to ~1.1 m, while breakwater affects the inland flooding. The maximum inundation depth in the eastern part of the model is approximately less than 1 m.
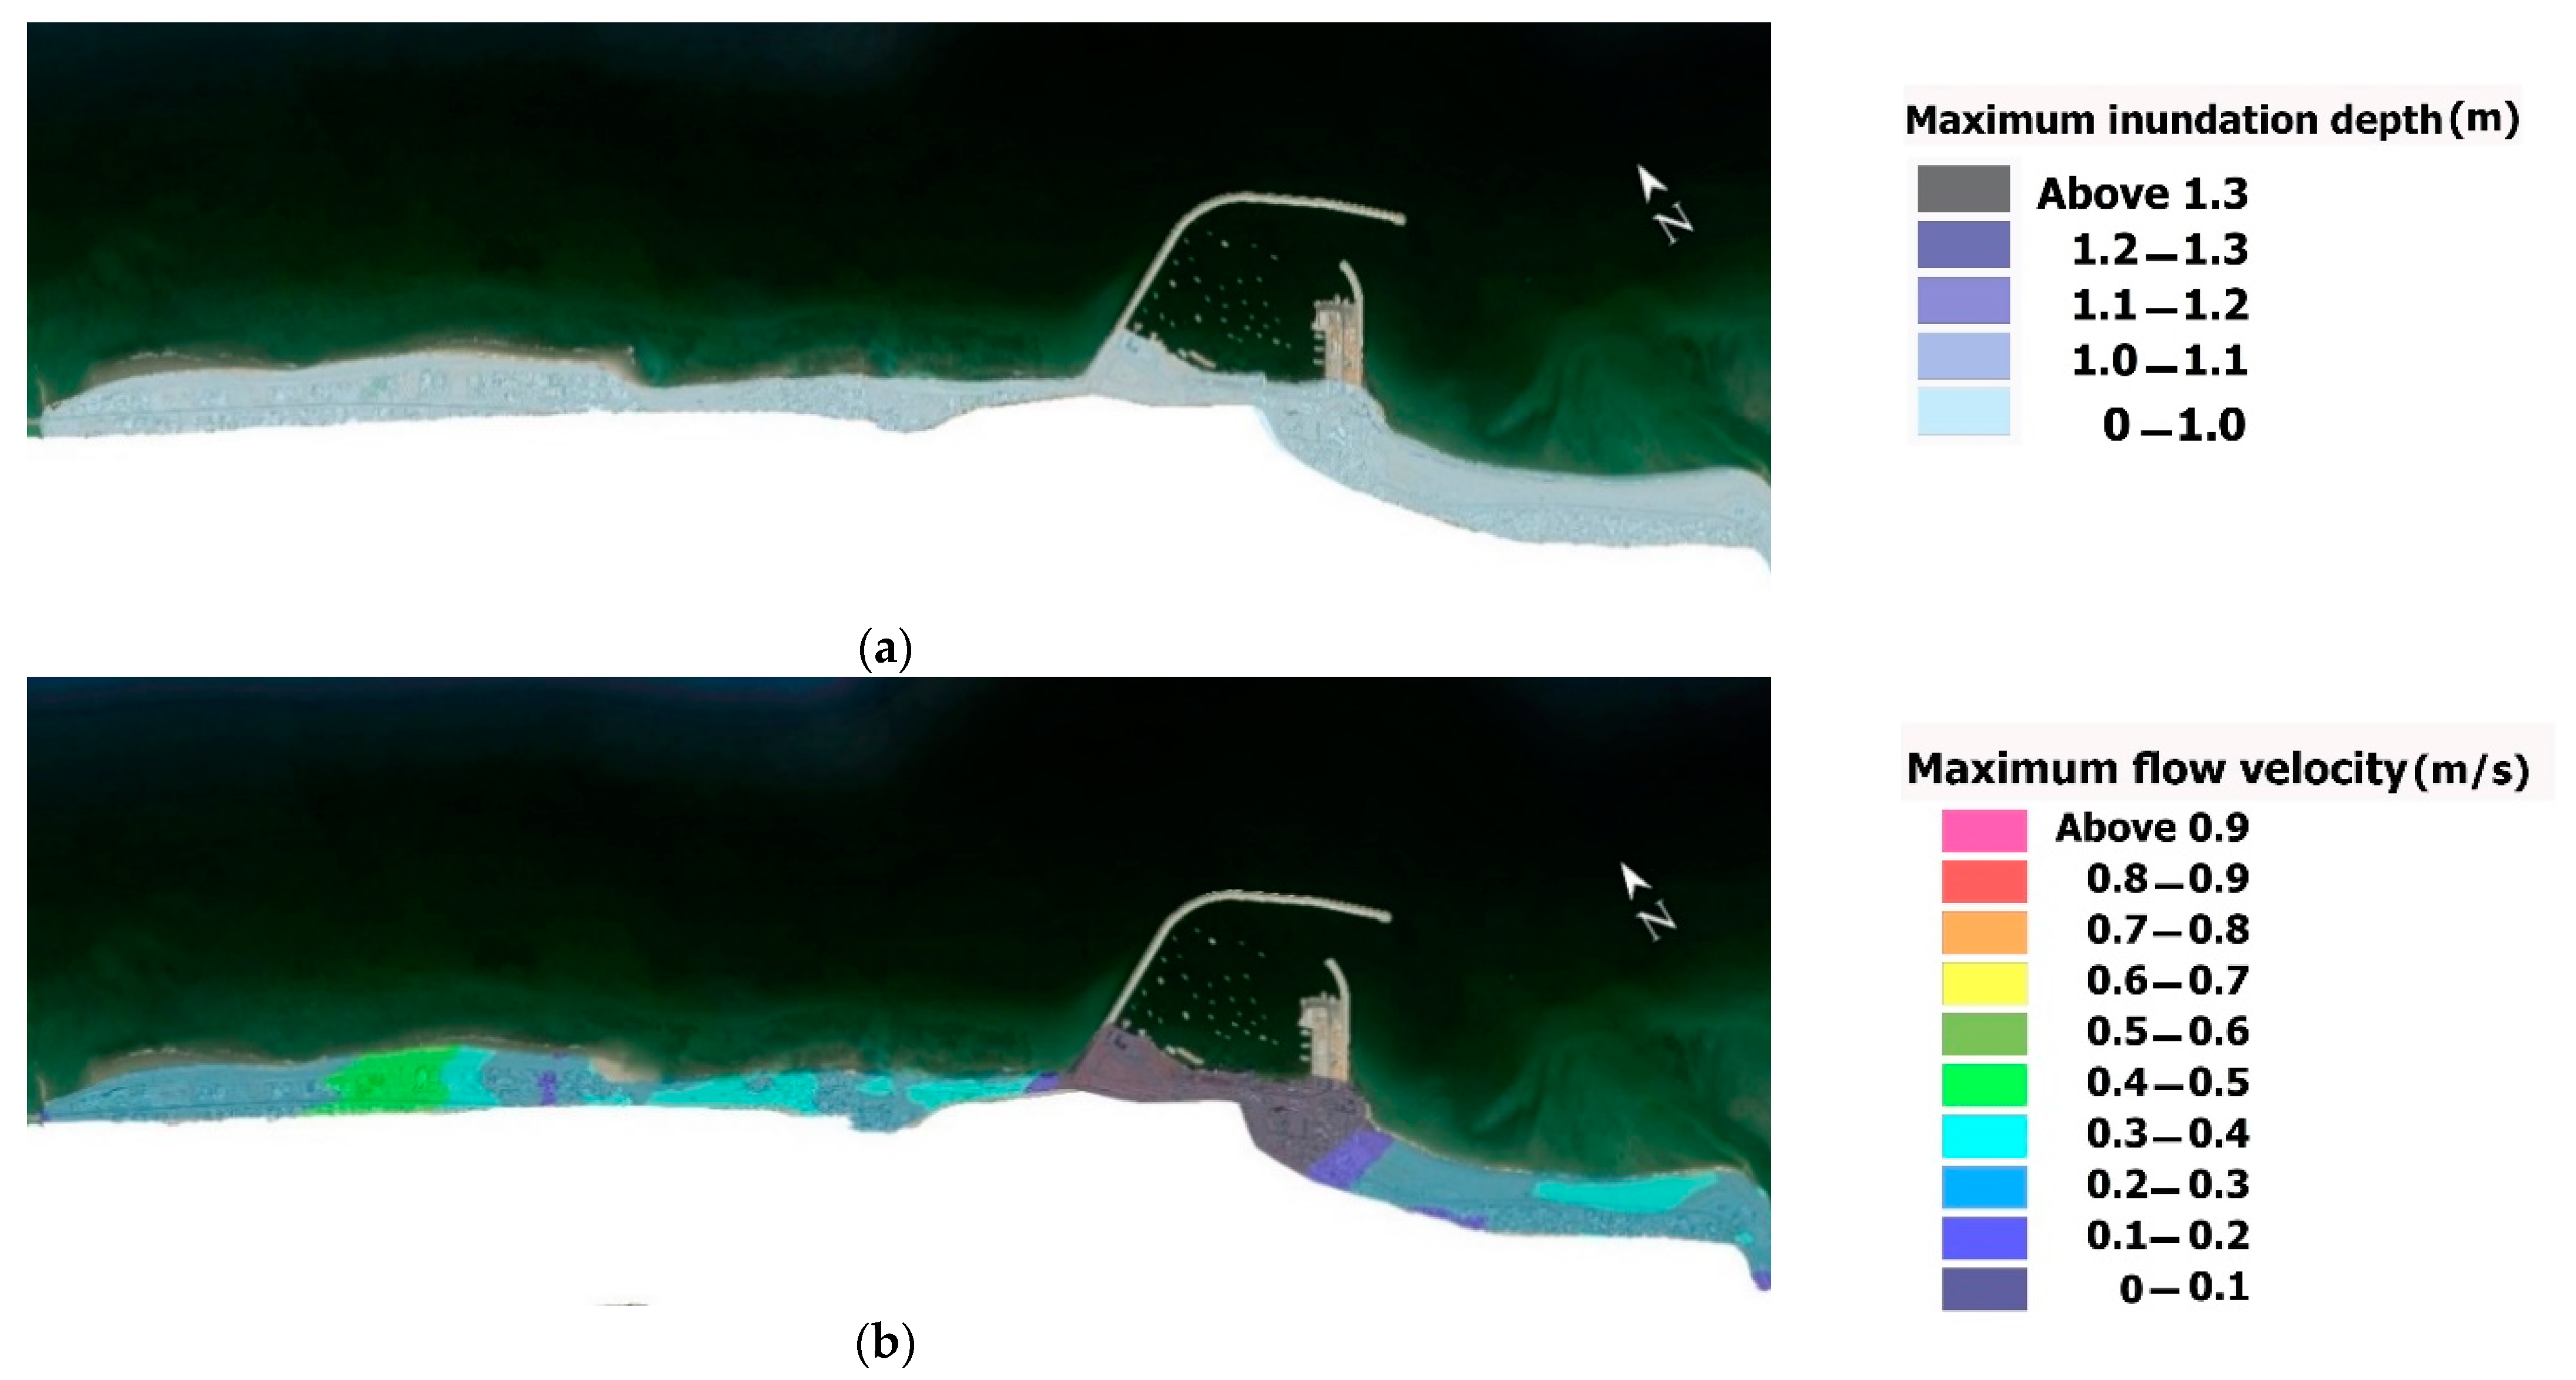
- The maximum inundation all over the computational domain is almost less than 1 m for the flood scenario with Mangroves.
- The maximum flow velocity varies all over the study area with its maximum magnitude of more than 0.9 m/s for the flood scenario without Mangroves. While for the flood scenario with Mangroves, the maximum flow velocity is less than 0.5 m/s.
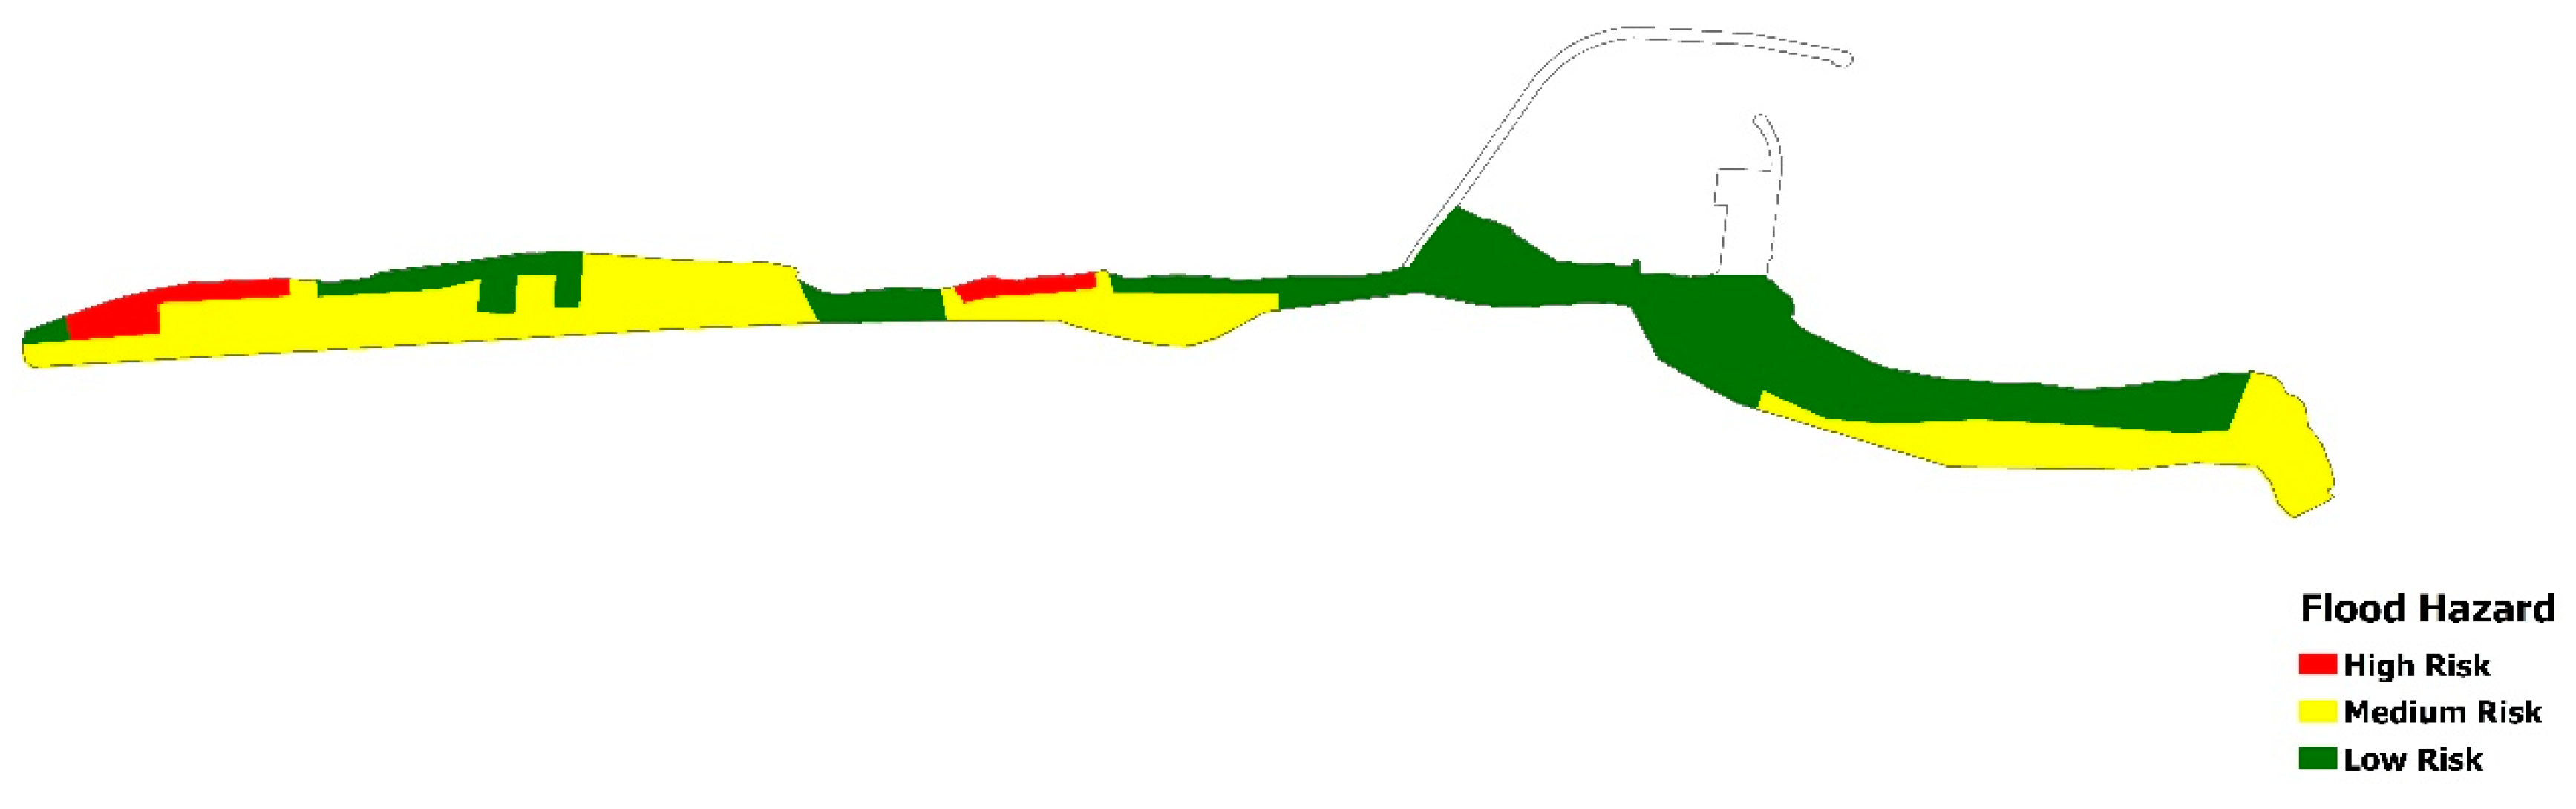
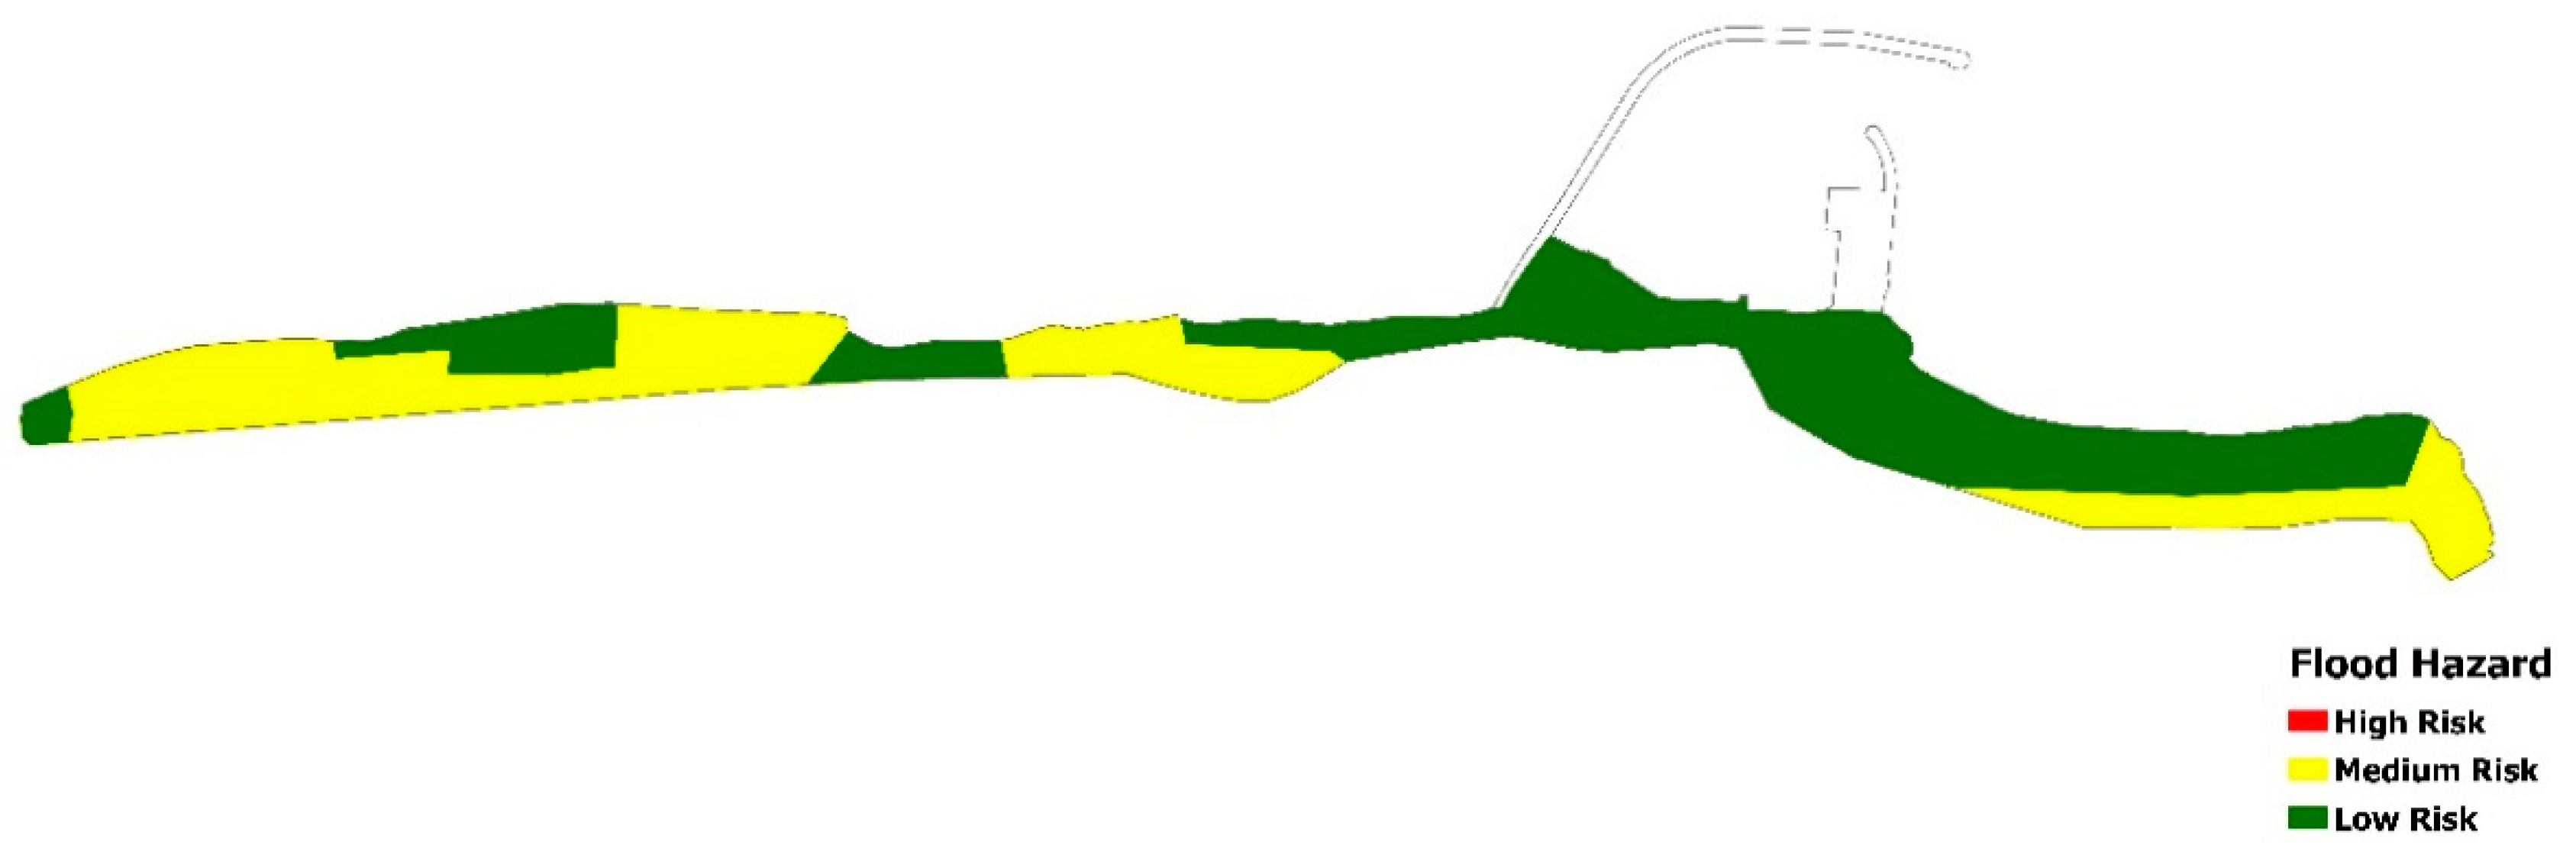
- The flood hazard map shows that 5% of the coast is at high-risk, 49% is at medium-risk, and 46% is at low-risk class for the flood scenario without Mangroves.
- By applying Mangroves as flood risk reduction, the flood hazard map shows that the high-risk area almost removes completely. However, medium and low-risk zones increase by 50% and 50%, respectively.
- The eastern part of the coast of Sur port seems to be well protected by the breakwater. While most parts of the west coast are unprotected and exposed to damage from storms and cyclones.
- Impact of large flood in urban and critical facilities and infrastructure can be reduced by timely and correct action before a disastrous storm, so managers and governments should be considered appropriate methods to mitigate cyclones’ destructive effects. The use of artificial mangrove forests as an environmentally friendly method of protecting the coast can be an effective way to protect the Sur port against climate change and extreme environmental conditions.
Author Contributions
Funding
Institutional Review Board Statement
Informed Consent Statement
Data Availability Statement
Acknowledgments
Conflicts of Interest
References
- Bergillos, R.J.; Rodriguez-Delgado, C.; Medina, L.; Iglesias, G. Coastal cliff exposure and management. Ocean Coast. Manag. 2020, 198, 105387. [Google Scholar] [CrossRef]
- Bergillos, R.J.; Rodriguez-Delgado, C.; Cremades, J.; Medina, L.; Iglesias, G. Multi-criteria characterization and mapping of coastal cliff environments: A case study in NW Spain. Sci. Total Environ. 2020, 746, 140942. [Google Scholar] [CrossRef]
- Bergillos, R.J.; Ortega-Sánchez, M. Assessing and mitigating the landscape effects of river damming on the Guadalfeo River delta, southern Spain. Landsc. Urban Plan. 2017, 165, 117–129. [Google Scholar] [CrossRef]
- Mojtahedi, A.; Beiragh, M.S.; Farajpour, I.; Mohammadian, M. Investigation on hydrodynamic performance of an environmentally friendly pile breakwater. Ocean Eng. 2020, 217, 107942. [Google Scholar] [CrossRef]
- Emanuel, K. Increasing destructiveness of tropical cyclones over the past 30 years. Nature 2005, 436, 686. [Google Scholar] [CrossRef] [PubMed]
- Henderson-Sellers, A.; Zhang, H.; Berz, G.; Emanuel, K.; Gray, W.; Landsea, C.; Holland, G.; Lighthill, J.; Shieh, L.; Webster, P.; et al. Tropical cyclones and global climate change: A post-IPCC assessment. Bull. Am. Meteor. Soc. 1998, 79, 19–38. [Google Scholar] [CrossRef] [Green Version]
- Golshani, A.; Taebi, S. Numerical modeling and warning procedure for Gonu super cyclone along Iranian Coastlines. In Proceedings of the Solutions to Coastal Disasters 2008 Conference, Turtle Bay, Oahu, NI, USA, 13–16 April 2008; pp. 268–275. [Google Scholar]
- Dibajnia, M.; Soltanpour, M.; Nairn, R.; Allahyar, M. Cyclone Gonu: The most intense tropical cyclone on record in the Arabian Sea. In Indian Ocean Tropical Cyclones and Climate Change; Springer: Dordrecht, The Netherlands, 2010; pp. 149–157. [Google Scholar]
- Banan-Dalalian, M.; Shokatian-Beiragh, M.; Golshani, A.; Mojtahedi, A.; Lotfollahi-Yaghin, M.A. Study of the Effect of Gonu Tropical Cyclone on the Oman Coastlines Inland Flooding (Case Study: The Coastline of Sur). In Proceedings of the 2nd International Conference on Oceanography for West Asia (RCOWA 2020), Tehran, Iran, 16–17 September 2020; p. 11. [Google Scholar]
- Fritz, H.M.; Blount, C.D.; Albusaidi, F.B.; Al-Harthy, A.H.M. Cyclone Gonu storm surge in Oman. Estuar. Coast. Shelf Sci. 2010, 86, 102–106. [Google Scholar] [CrossRef]
- Khaniki, A.; Meshkati, A.; Bidokhti, A. Tropical cyclone Induced waves in the Chabahar Bay area. In Proceedings of the 11th MIC, Kish Island, Iran, 9–11 November 2009. (In Persian). [Google Scholar]
- Mashhadi, L.; Zaker, N.H.; Soltanpour, M.; Moghimi, S. Study of the Gonu Tropical Cyclone in the Arabian Sea. J. Coast. Res. 2013, 31, 616–623. [Google Scholar] [CrossRef]
- Bakhtiari, A.; Allahyar, M.R.; Jedari Attari, M.; Haghshenas, S.A.; Bagheri, M. Modeling of Last Recent Tropical Storms in the Arabian Sea. J. Mar. Sci. Eng. 2018, 1, 58–66. [Google Scholar]
- Wang, Z.; DiMarco, S.F.; Stössel, M.M.; Zhang, X.; Howard, M.K.; Vall, K.D. Oscillation responses to tropical Cyclone Gonu in northern Arabian Sea from a moored observing system. Deep Sea Res. I Oceanogr. Res. Pap. 2012, 64, 129–145. [Google Scholar] [CrossRef]
- Jayakrishnan, P.R.; Babu, C.A. Study of the oceanic heat budget components over the Arabian Sea during the formation and evolution of super cyclone, Gonu. Atmos. Clim. Sci. 2013, 3, 282–290. [Google Scholar] [CrossRef] [Green Version]
- Allahdadi, M.N.; Chaichitehrani, N.; Allahyar, M.; McGee, L. Wave spectral patterns during a historical cyclone: A numerical model for cyclone Gonu in the northern Oman Sea. Open J. Fluid Dyn. 2017, 7, 131–151. [Google Scholar] [CrossRef] [Green Version]
- Allahdadi, M.N.; Chaichitehrani, N.; Jose, F.; Nasrollahi, A.; Afshar, A.; Allahyar, M. Cyclone-generated storm surge in the northern Gulf of Oman: A field data analysis during cyclone Gonu. Am. J. Fluid Dyn. 2018, 8, 10–18. [Google Scholar]
- Al-Awadhi, T. The Use of RS and GIS to Evaluate the Effects of Tropical Cyclones: A Case Study from A’Seeb, Muscat after GONU Cyclone. In Proceedings of the 1st WMO International Conference on Indian Ocean Tropical Cyclones and Climate Change, Muscat, Oman, 8–11 March 2009; p. 95. [Google Scholar]
- Jedari, M.; Bakhtiari, A.; Dibajnia, M.; Golshani, A.S.; Shafieefar, M. Study Reports of Monitoring and Modelling Studies of Markan Coastlines; Ports and Maritime Organization (PMO): Tehran, Iran, 2017. [Google Scholar]
- Siahsarani, A.; Khaniki, A.K.; Bidokhti, A.A.A.; Azadi, M. Sensitivity analysis of the numerical aspect of the SWAN for the tropical cyclone wave simulations in the Gulf of Oman. Arab. J. Geosci. 2020, 13, 1–14. [Google Scholar] [CrossRef]
- DHI. MIKE 21 Spectral Wave Model User Guide; DHI: Hørsholm, Denmark, 2014. [Google Scholar]
- DHI. MIKE 21 Flow Model FM User Guide; DHI: Hørsholm, Denmark, 2014. [Google Scholar]
- Morin, V.; Warnitchai, P.; Weesakul, S. Storm surge hazard in Manila Bay: Typhoon Nesat (Pedring) and the SW monsoon. Nat. Hazards 2016, 81, 1569–1588. [Google Scholar] [CrossRef]
- Dong, S.; Stephenson, W.J.; Wakes, S.; Chen, Z.; Ge, J. Meso-scale Simulation of Typhoon Generated Storm Surge: Methodology and Shanghai Case Study. Nat. Hazards Earth Syst. 2017. [Google Scholar] [CrossRef] [Green Version]
- DHI. MIKE 21 Cyclone wind Generation Tool Scientific Documentation; DHI: Hørsholm, Denmark, 2014. [Google Scholar]
- Young, I.R.; Sobey, R.J. The Numerical Prediction of Tropical Cyclone Wind-Waves; Department of Civil & Systems Engineering, James Cook University of North Queensland: Townsville, QLD, Australia, 1981. [Google Scholar]
- Holland, G.J. An Analytic Model of the Wind and Pressure Profiles in Hurricanes. Mon. Weather Rev. 1980, 108, 1212–1218. [Google Scholar] [CrossRef]
- Rankine, W.J.M. A Manual of Applied Mechanics; Charles Griffin and Company: London, UK, 1872. [Google Scholar]
- Nash, J.E.; Sutcliffe, J.V. River flow forecasting through conceptual models part I—A discussion of principles. J. Hydrol. 1970, 10, 282–290. [Google Scholar] [CrossRef]
- Ritter, A.; Munoz-Carpena, R. Performance evaluation of hydrological models: Statistical significance for reducing subjectivity in goodness-of-fit assessments. J. Hydrol. 2013, 480, 33–45. [Google Scholar] [CrossRef]
- McLachlan, A.; Fisher, M.; Al-Habsi, H.N.; Al-Shukairi, S.S.; Al-Habsi, A.M. Ecology of sandy beaches in Oman. J. Coast. Conserv. 1998, 4, 181–190. [Google Scholar] [CrossRef]
- Chow, V.T. Open-Channel Hydraulics; McGraw-Hill: New York, NY, USA, 1959. [Google Scholar]
- Kaiser, G.; Scheele, L.; Kortenhaus, A.; Løvholt, F.; Römer, H.; Leschka, S. The influence of land cover roughness on the results of high resolution tsunami inundation modeling. Nat. Hazards Earth Syst. Sci. 2011, 11, 2521–2540. [Google Scholar] [CrossRef] [Green Version]
- Priest, S.J.; Wilson, T.; Tapsell, S.M.; Penning-Rowsell, E.C.; Viavattene, C.; Fernandez Bilbao, A. Building a Model to Estimate Risk to Life for European Flood Events; Project Report; HR Wallingford: Wallingford, UK, 2007. [Google Scholar]
- Liu, H.; Zhang, K.; Li, Y.; Xie, L. Numerical study of the sensitivity of mangroves in reducing storm surge and flooding to hurricane characteristics in southern Florida. Cont. Shelf Res. 2013, 64, 51–65. [Google Scholar] [CrossRef]
- Machineni, N.; Sinha, V.S.; Singh, P.; Reddy, N.T. The impact of distributed landuse information in hydrodynamic model application in storm surge inundation. Estuar. Coast. Shelf Sci. 2019, 231, 106466. [Google Scholar] [CrossRef]


| Parameter | Description | Unit |
|---|---|---|
| u, v | Depth average velocity components in the x, y direction | m/s |
| S | Magnitude of the discharge due to point sources | - |
| h | Total water depth | m |
| η | Surface elevation | m |
| t | Time | s |
| x, y | Cartesian coordinates | m |
| f | Coriolis parameter | s−1 |
| g | Gravitational acceleration | m/s2 |
| ρ0 | Reference density of water | kg/m3 |
| pa | Atmospheric pressure | kg/m/s2 |
| ρ | Density of water | kg/m3 |
| τsx, τsy, τbx, τby | Components of the surface wind and bottom stress | kg/m2 |
| sxx, sxy, syx, syy | Components of the surface wind and bottom stress | kg/m2 |
| Txx, Txy, Tyy | Lateral stresses | kg/m2 |
| vs | Velocity by which the water is discharged into the ambient water | m/s |
| Input Datasets | Calibration Datasets | ||
|---|---|---|---|
| Wind | International Best Track Archive for Climate Stewardship (IBTrACS) datasets, (http://ibtracs.unca.edu/, accessed date: 7 March 2020) | European Centre for Medium-Range Weather Forecasts (ECMWF) datasets, (https://www.ecmwf.int/, accessed date: 10 April 2020) | |
| Jask synoptic station | |||
| Topographic | Bathymetry | General Bathymetric Chart of the Ocean (GEBCO) datasets, (https://www.gebco.net/, accessed date: 22 April 2020) | - |
| Hypsometry | United States Geological Survey (USGS) datasets, (https://www.usgs.gov/, accessed date: 22 April 2020) | ||
| Water level | Study reports of Monitoring and Modelling Studies of Markan Coastlines [19] | HYbrid Coordinate Ocean Model (HYCOM) datasets, (https://www.hycom.org/, accessed date: 29 May 2020) | |
| Performance Rating | ||||
|---|---|---|---|---|
| Very Good | Good | Acceptable | Unsatisfactory | |
| NSE | ≥0.90 | 0.80–0.90 | 0.65–0.80 | <0.65 |
| Surface Class | Manning’s Coefficient (n) | Manning’s Coefficient (M) in m1/3 s−1 |
|---|---|---|
| Barren Land, Sand, Beach, Roads | 0.031 | 32 |
| Urban Area | 0.060 | 17 |
| Buildings | 0.090 | 11 |
| Open Sea | 0.020 | 50 |
| Nature of Area | |||
|---|---|---|---|
| Inundation Depth × Flow Velocity (m2/s) | Low Vulnerability | Medium Vulnerability | High Vulnerability |
| <0.25 | Low Risk | Low Risk | Low Risk |
| 0.25–0.50 | Low Risk | Medium Risk | Medium Risk |
| 0.50–1.10 | Medium Risk | Medium Risk | High Risk |
| 1.10–7.00 | Medium Risk | High Risk | Extreme Risk |
| >7.00 | Extreme Risk | Extreme Risk | Extreme Risk |
Publisher’s Note: MDPI stays neutral with regard to jurisdictional claims in published maps and institutional affiliations. |
© 2021 by the authors. Licensee MDPI, Basel, Switzerland. This article is an open access article distributed under the terms and conditions of the Creative Commons Attribution (CC BY) license (https://creativecommons.org/licenses/by/4.0/).
Share and Cite
Banan-Dallalian, M.; Shokatian-Beiragh, M.; Golshani, A.; Mojtahedi, A.; Lotfollahi-Yaghin, M.A.; Akib, S. Study of the Effect of an Environmentally Friendly Flood Risk Reduction Approach on the Oman Coastlines during the Gonu Tropical Cyclone (Case Study: The Coastline of Sur). Eng 2021, 2, 141-155. https://0-doi-org.brum.beds.ac.uk/10.3390/eng2020010
Banan-Dallalian M, Shokatian-Beiragh M, Golshani A, Mojtahedi A, Lotfollahi-Yaghin MA, Akib S. Study of the Effect of an Environmentally Friendly Flood Risk Reduction Approach on the Oman Coastlines during the Gonu Tropical Cyclone (Case Study: The Coastline of Sur). Eng. 2021; 2(2):141-155. https://0-doi-org.brum.beds.ac.uk/10.3390/eng2020010
Chicago/Turabian StyleBanan-Dallalian, Masoud, Mehrdad Shokatian-Beiragh, Aliasghar Golshani, Alireza Mojtahedi, Mohammad Ali Lotfollahi-Yaghin, and Shatirah Akib. 2021. "Study of the Effect of an Environmentally Friendly Flood Risk Reduction Approach on the Oman Coastlines during the Gonu Tropical Cyclone (Case Study: The Coastline of Sur)" Eng 2, no. 2: 141-155. https://0-doi-org.brum.beds.ac.uk/10.3390/eng2020010