
Analysis of Electric Power Generation Growth in Pakistan: Falling into the Vicious Cycle of Coal


1
Department of Chemical Engineering, University of Engineering and Technology, Peshawar 25120, Pakistan
2
National Institute of Urban Infrastructure Planning (NIUIP), University of Engineering and Technology, Peshawar 25120, Pakistan
*
Author to whom correspondence should be addressed.
Eng 2021, 2(3), 296-311; https://0-doi-org.brum.beds.ac.uk/10.3390/eng2030019
Submission received: 4 April 2021
/
Revised: 18 July 2021
/
Accepted: 19 July 2021
/
Published: 23 July 2021
(This article belongs to the Special Issue Stylistic Design Engineering (SDE))
Abstract
:This paper aims to analyze national policies of Pakistan taking into account the complexity of electric power generation, growth, and complying with multilateral agreements. Systems thinking has been applied to understand the complexity of energy scenario of Pakistan by representing it with a causal loop diagram (CLD) which displays the interconnectedness and feedbacks of the system. Analysis is based on systems archetypes to diagnose the system behavior, i.e., falling into the vicious cycle of coal. A stock-and-flow model was employed to capture dynamics of energy generation quantitatively, indicating that a 5% GDP growth rate could be sustained based on current planning to increase electric power generation in Pakistan. Thus, in order to achieve a 7% GDP growth rate, as targeted in Vision 2025 of Pakistan, energy generation targets would need to be revised in the view of the sensitivity of increase in energy demand associated with GDP growth rate, while ensuring compliance with multilateral agreements.
1. Introduction
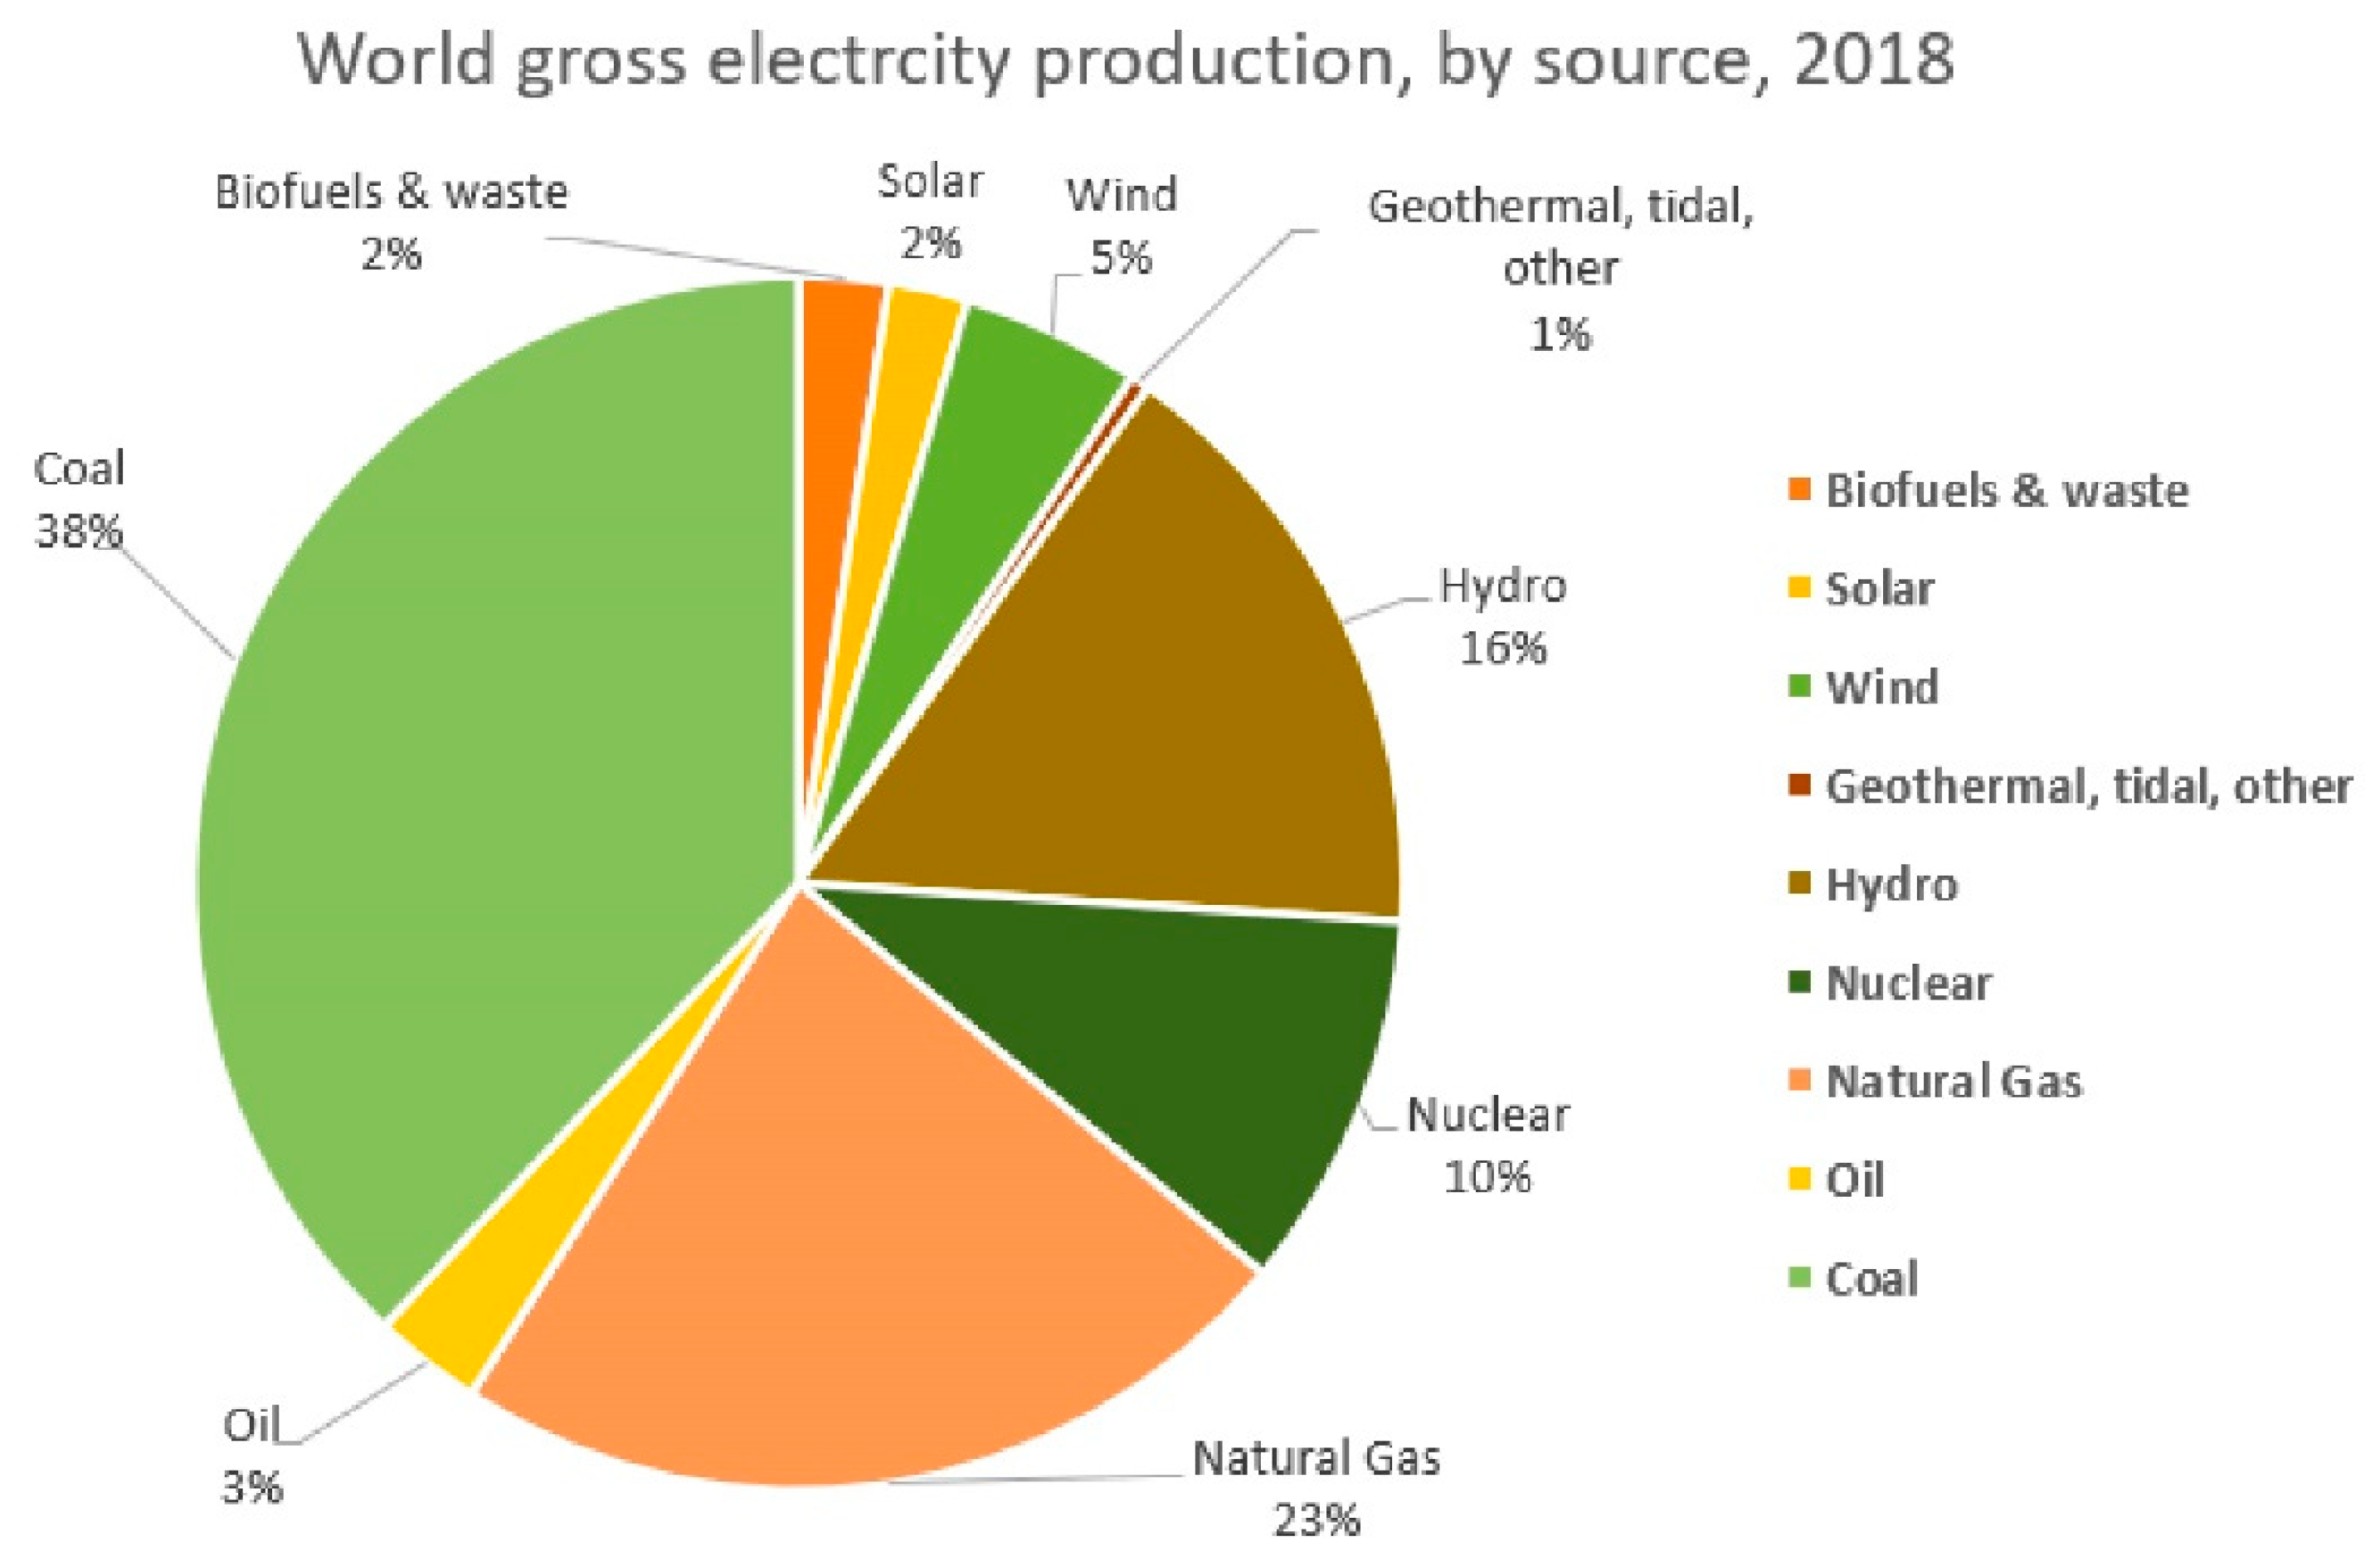
Energy is vital to achieve progress in the modern age [1]. To fulfill the energy demands of economic and social growth, focus on low-carbon power-generating sources has come into the limelight, causing a shift from conventional fossil fuels to non-fossil fuels to minimize the harmful ecological and environmental impacts. Renewable energy sources have been showing promising prospects in fulfilling the energy needs of the future which may compensate for the depletion of fossil fuels in the near future [2]. In 2035, nearly half or more electricity will be provided by renewables and nuclear [3]. The global energy mix, i.e., gross electricity production for 2018 is shown in Figure 1.
Figure 1 shows that, in 2018, the overall energy mix consisted of 10% nuclear, 64% fossil fuels, 24% renewables, and 2% biofuels [4]. Nuclear power generation technology has seen significant growth in recent years because of various factors including energy supply security and an ability to provide a consistent base load power [5]. However, it has been observed that nuclear disasters such as Fukushima in 2011 may have negative impacts on the growth of nuclear [6], and few countries including Belgium, Germany, and Switzerland plan to phase out nuclear [7].
The global journey towards sustainable energy generation and consumption comprises of important milestones such as the creation of Inter-governmental Panel on Climate Change (IPCC) in 1988 and the Kyoto Protocol which was adopted in 1997, ratified in 2001, and concluded in 2012, known as the 1st commitment period. The second period was agreed in 2012 till 2020, known as the Doha amendment to the Kyoto protocol with countries committing to reduce their emissions by at least 5.2% below 1990 levels [8]. In 2015, the Paris Agreement was adopted and ratified in 2016, binding each member country to submit a Intended Nationally Determined Contributions (INDC) report, outlining every country’s commitments towards attaining the goal of limiting global temperature rise between 1.5–2 °C as set by the Paris Agreement and aligned with the Sustainable Development Goals (SDGs) [9]. In 2018, the Katowice Climate package set the rule book for the operational framework for tracking and evaluating the efforts at national and international levels with well-established outlines for INDC reporting including mitigation and adaptation measures [10]. Finally, in 2019, the COP25 took place which was referred to as a disappointment in terms of achieving the desired goals such as raising the countries’ ambitions in order to deal with climate change, establishing a foundation for international cooperation to combat climate change, and developing rules for financing and transferring funds for the reduction in GHG emissions to green climate fund (GCF) [11].
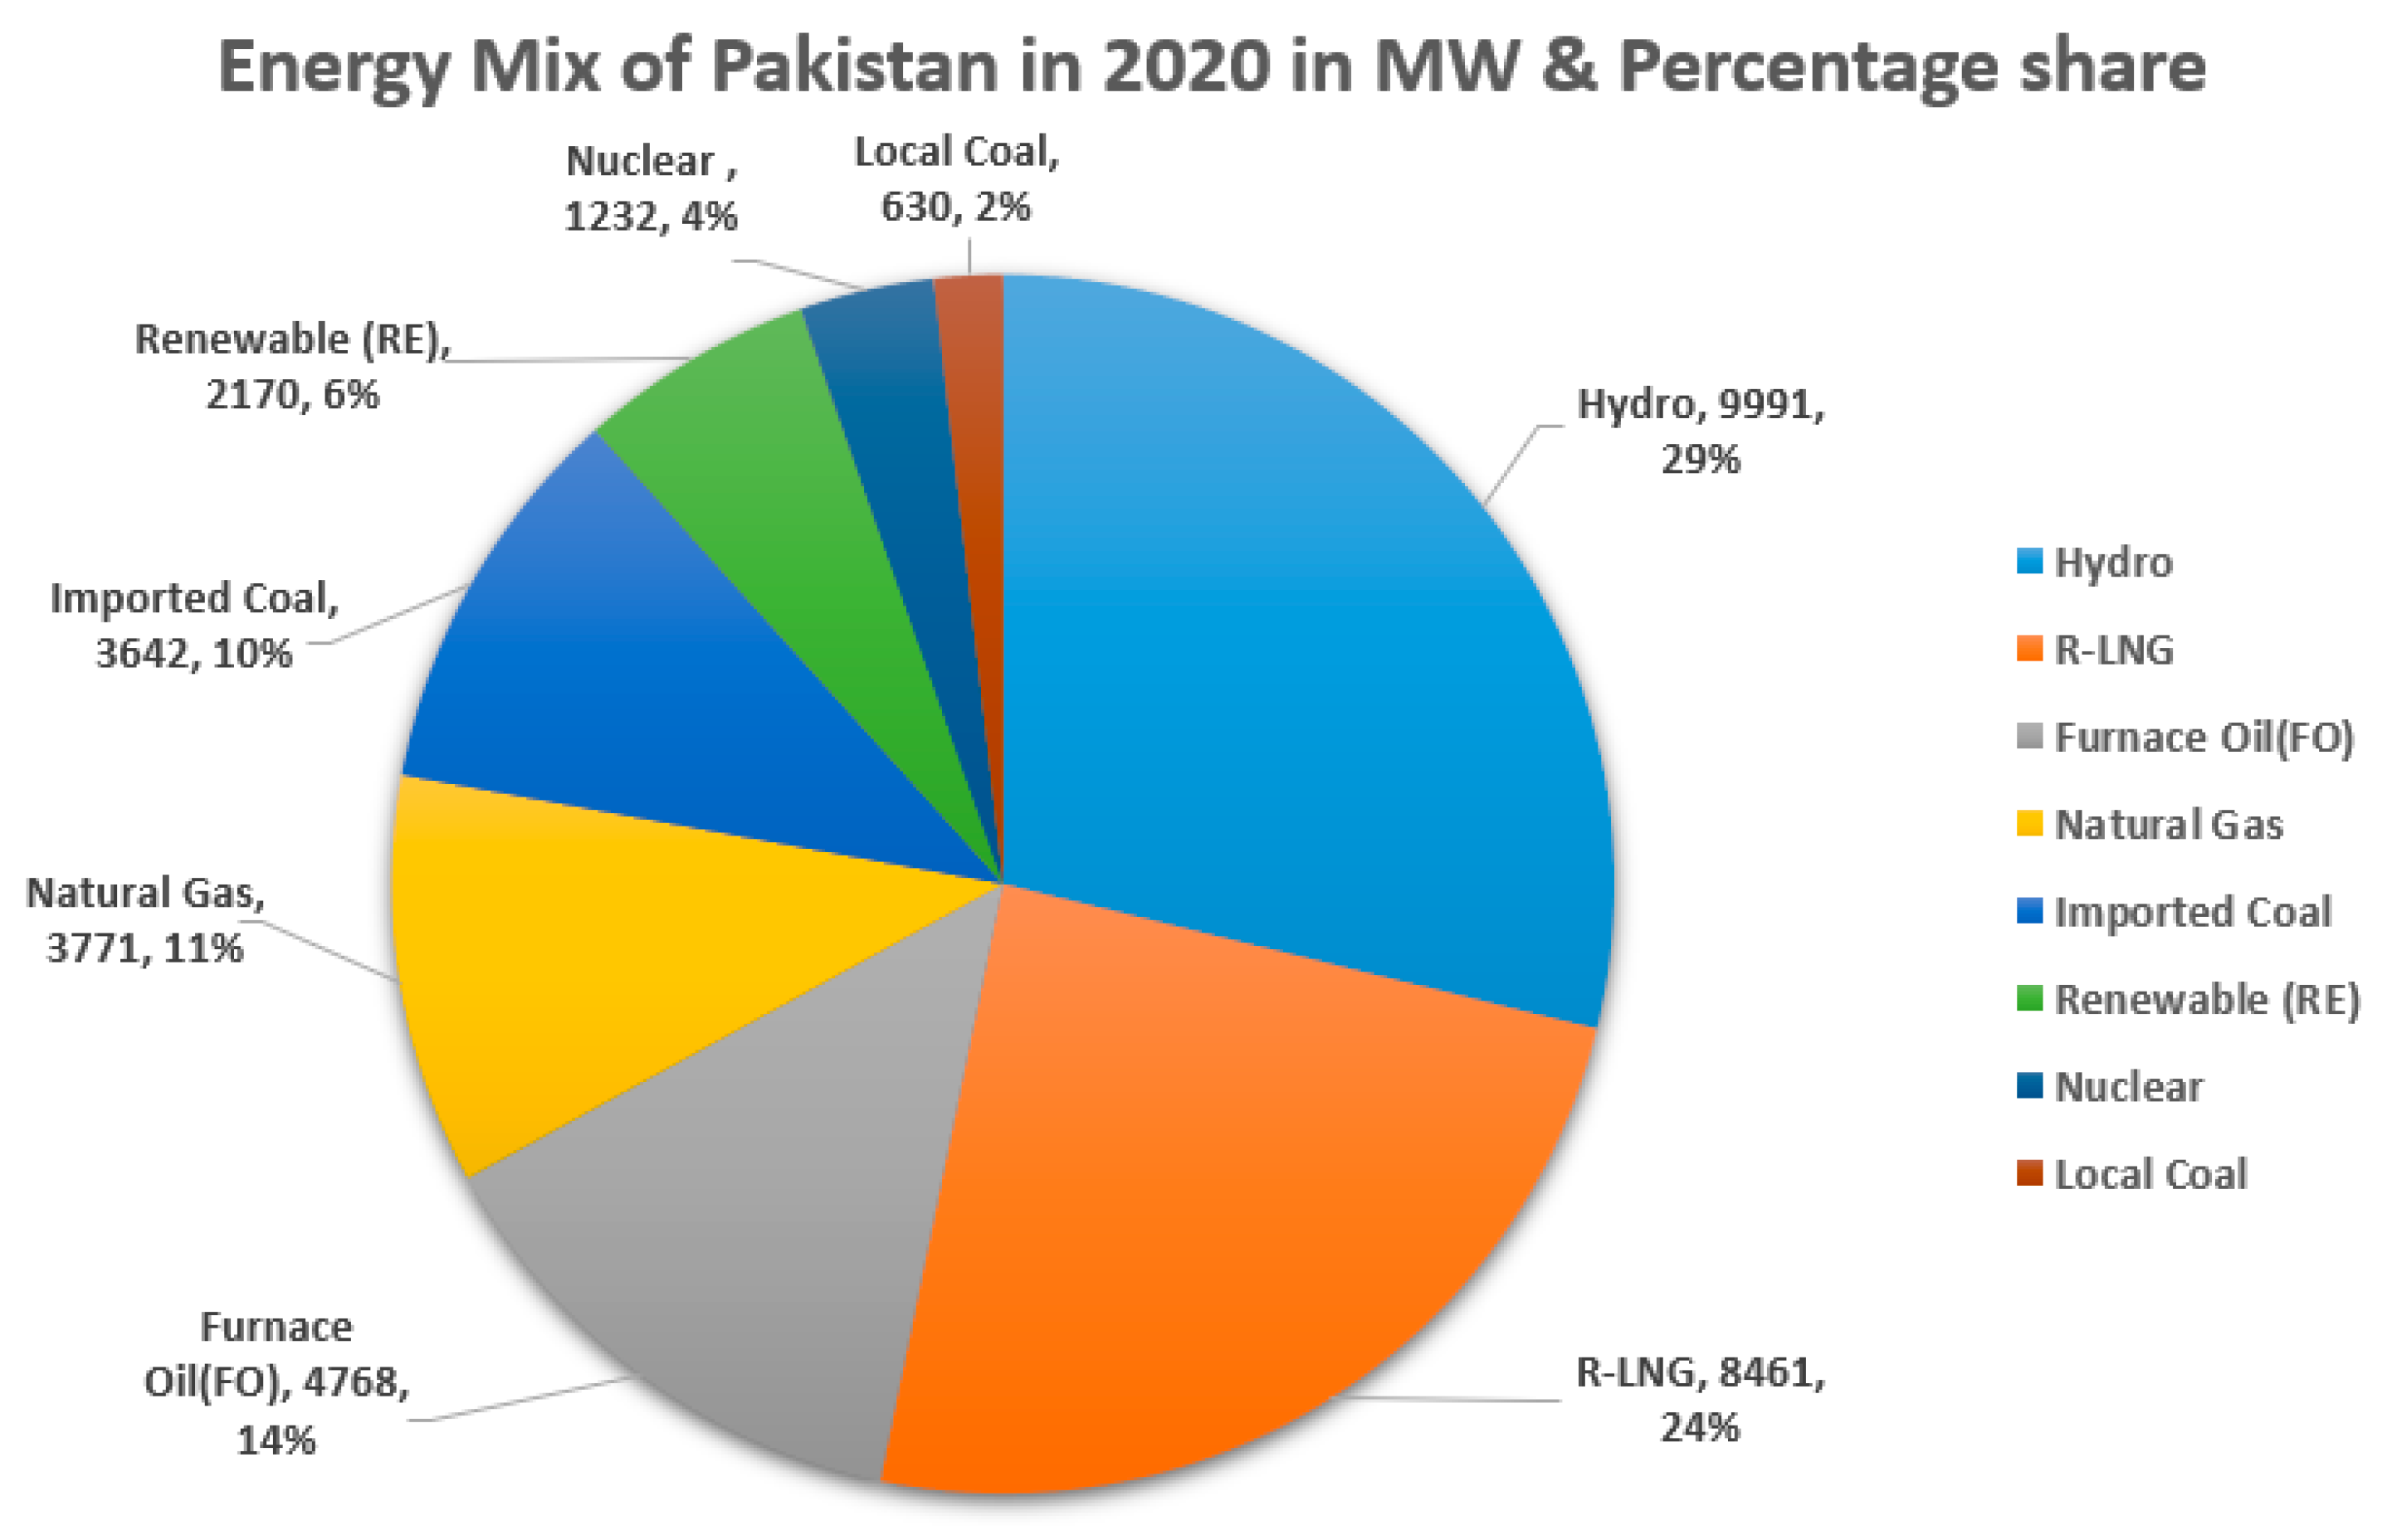
Pakistan signed the Kyoto Protocol and Paris Agreement as a pledge to fulfill obligations to the UN and its sustainable development goals (SDGs). Pakistan is having annual per capita energy consumption of 457 kWh which lies way below the world average of 2892 kWh [1]. Whereas, developed countries such as USA (13,361 kWh), Australia (10,063 kWh), France (7756 kWh), Germany (7217 kWh), and other countries have significantly higher per capita use, with the highest per capita energy consumption lead by Iceland (51,447 kWh) [1]. The electricity generation mix of Pakistan is shown in Figure 2 for 2020.
The overall energy mix of Pakistan consists of 4% nuclear, 29% hydro, 61% fossil-based fuels, and 6% others [12]. Pakistan has an untapped potential of electricity generation of 100,000 MW (Thar coal), 56,000 MW (hydro), 150,000 MW (wind), and ~50,000 MW (solar) [13]. A significant increase in the share of hydro power and local coal are projected with minimal growth in nuclear sector. Hydro power share is expected to increase from 29% in 2018 to 40% by 2040. Local coal share is negligible (2018), which will be increased to 25% by 2040. Whereas, the share of nuclear is expected to increase during 2020–2025 and may remain the same till 2040 [12]. Ministry of Planning, Development & Reforms of Government of Pakistan presented the Vision 2025, which involved setting a target to generate uninterrupted, affordable, and accessible 42,000MW electricity by 2025 with a reduction in average cost per unit, diversifying generation mix, reducing distribution losses, using energy efficient appliances, and ending load shedding by 2018 [14]. Vision 2025 set a target for Pakistan to become one of the largest 25 economies in the world by attaining and sustaining an average of 7–8% GDP growth rate by 2025, to be classified as an upper middle-income country, to reduce poverty by half, and to increase direct investments [14].
Recent studies on energy scenarios in Pakistan focus on including renewables into the energy mix of Pakistan, particularly by emphasizing wind, hydro, solar, and biomass [15]. Energy security aspects were highlighted by using 4-A framework, i.e. availability, applicability, acceptability, and affordability to reduce nearly one-third of imported fuels for energy generation, adopt smart metering, promote solar technology, and develop building insulation standards to gain energy security [16]. However, previous studies have analyzed energy scenarios in Pakistan without any particular focus on the dynamics and complexity of electric power generation and growth.
Therefore, this paper aims to develop a qualitative mapping, i.e. causal loop diagram of electric power generation in Pakistan by capturing feedbacks and interconnectedness of sub-systems. The system behavior is diagnosed using systems archetypes to help identify high leverage interventions. Finally, a quantitative model, i.e. stock-and-flow model was developed to represent dynamics of electric power generation in Pakistan and predict the growth in electric power generation using coal, hydro, and nuclear.
The remaining paper is structured to review relevant research on systems thinking in electric power generation in Section 2, and research methodology adopted in this work is presented in Section 3 along with qualitative mapping of electric power generation in Pakistan. Systems archetypes were employed to diagnose the system behavior in Section 4. Section 5 presents the simulation results obtained from the quantitative model validating the insights obtained by qualitatively using causal mapping of key variables in electric power generation in Pakistan. Finally, conclusions are drawn regarding growth in electric power generation in Pakistan.
2. Previous Work on Systems Thinking in Electric Power Generation
This work relies on the body of knowledge founded by Forrester in 1961 [17]. Barry Richmond was the originator of the term “systems thinking” in 1987 [18]. The systems approach focuses on arrangements and relationships between parts, which connect to a whole. Therefore, its application is diverse and fosters a holistic approach to model complex phenomena which allow individuals to understand systems where they are existing [19]. Causal loop diagrams are used to capture the overall structure of the system and understand the behaviors resulting from the interaction of the variables.
A systems thinking approach was adopted to study minimum energy performance standards in New Zealand focused on efficiency to reduce energy consumption in order to transition into a low-carbon energy economy [20]. System dynamics offers a holistic approach, taking into account the uncertainties, time delays, and feedbacks of a system, facilitating better systems understanding for developing energy policy development [21]. Research in different areas of energy systems were suggested, such as energy behavior [22], social acceptance [23], economic costs [24], network and infrastructure issues, innovation, security and reliability, markets, and governance issues [25]. In Finland, energy security alternative sources were studied in order to see how renewables, fossil fuels, and nuclear can contribute in reducing dependency on external energy sources [26]. In South Africa, they studied the effects of increasing embedded generation systems and their impact on centralized power distribution company profits [27]. Economics and safety of nuclear power plants (NPPs) were mapped to assess risks and to increase the safety level [28].
Looking at the national scenario, Pakistan introduced reforms in order to incentivize the private sector and encourage investments in power sectors based on enhancing energy supply, evaluation of resources, and CO2 emissions which resulted in the encouragement of fossil-based power generation but hampered the utilization of hydro [29]. The Hubbert peak in Pakistan for crude oil has been achieved in 2013 and natural gas production is expected to peak in 2024, whereas coal production will peak in 2080 [30].
3. Methodology
System dynamics methodology is adopted with a causal loop diagram to represent the complexity of electric power generation in Pakistan (Section 3.3). The causal mapping is then probed using systems archetypes for diagnosis (Section 4), and quantitatively evaluated in simulation results (Section 5).
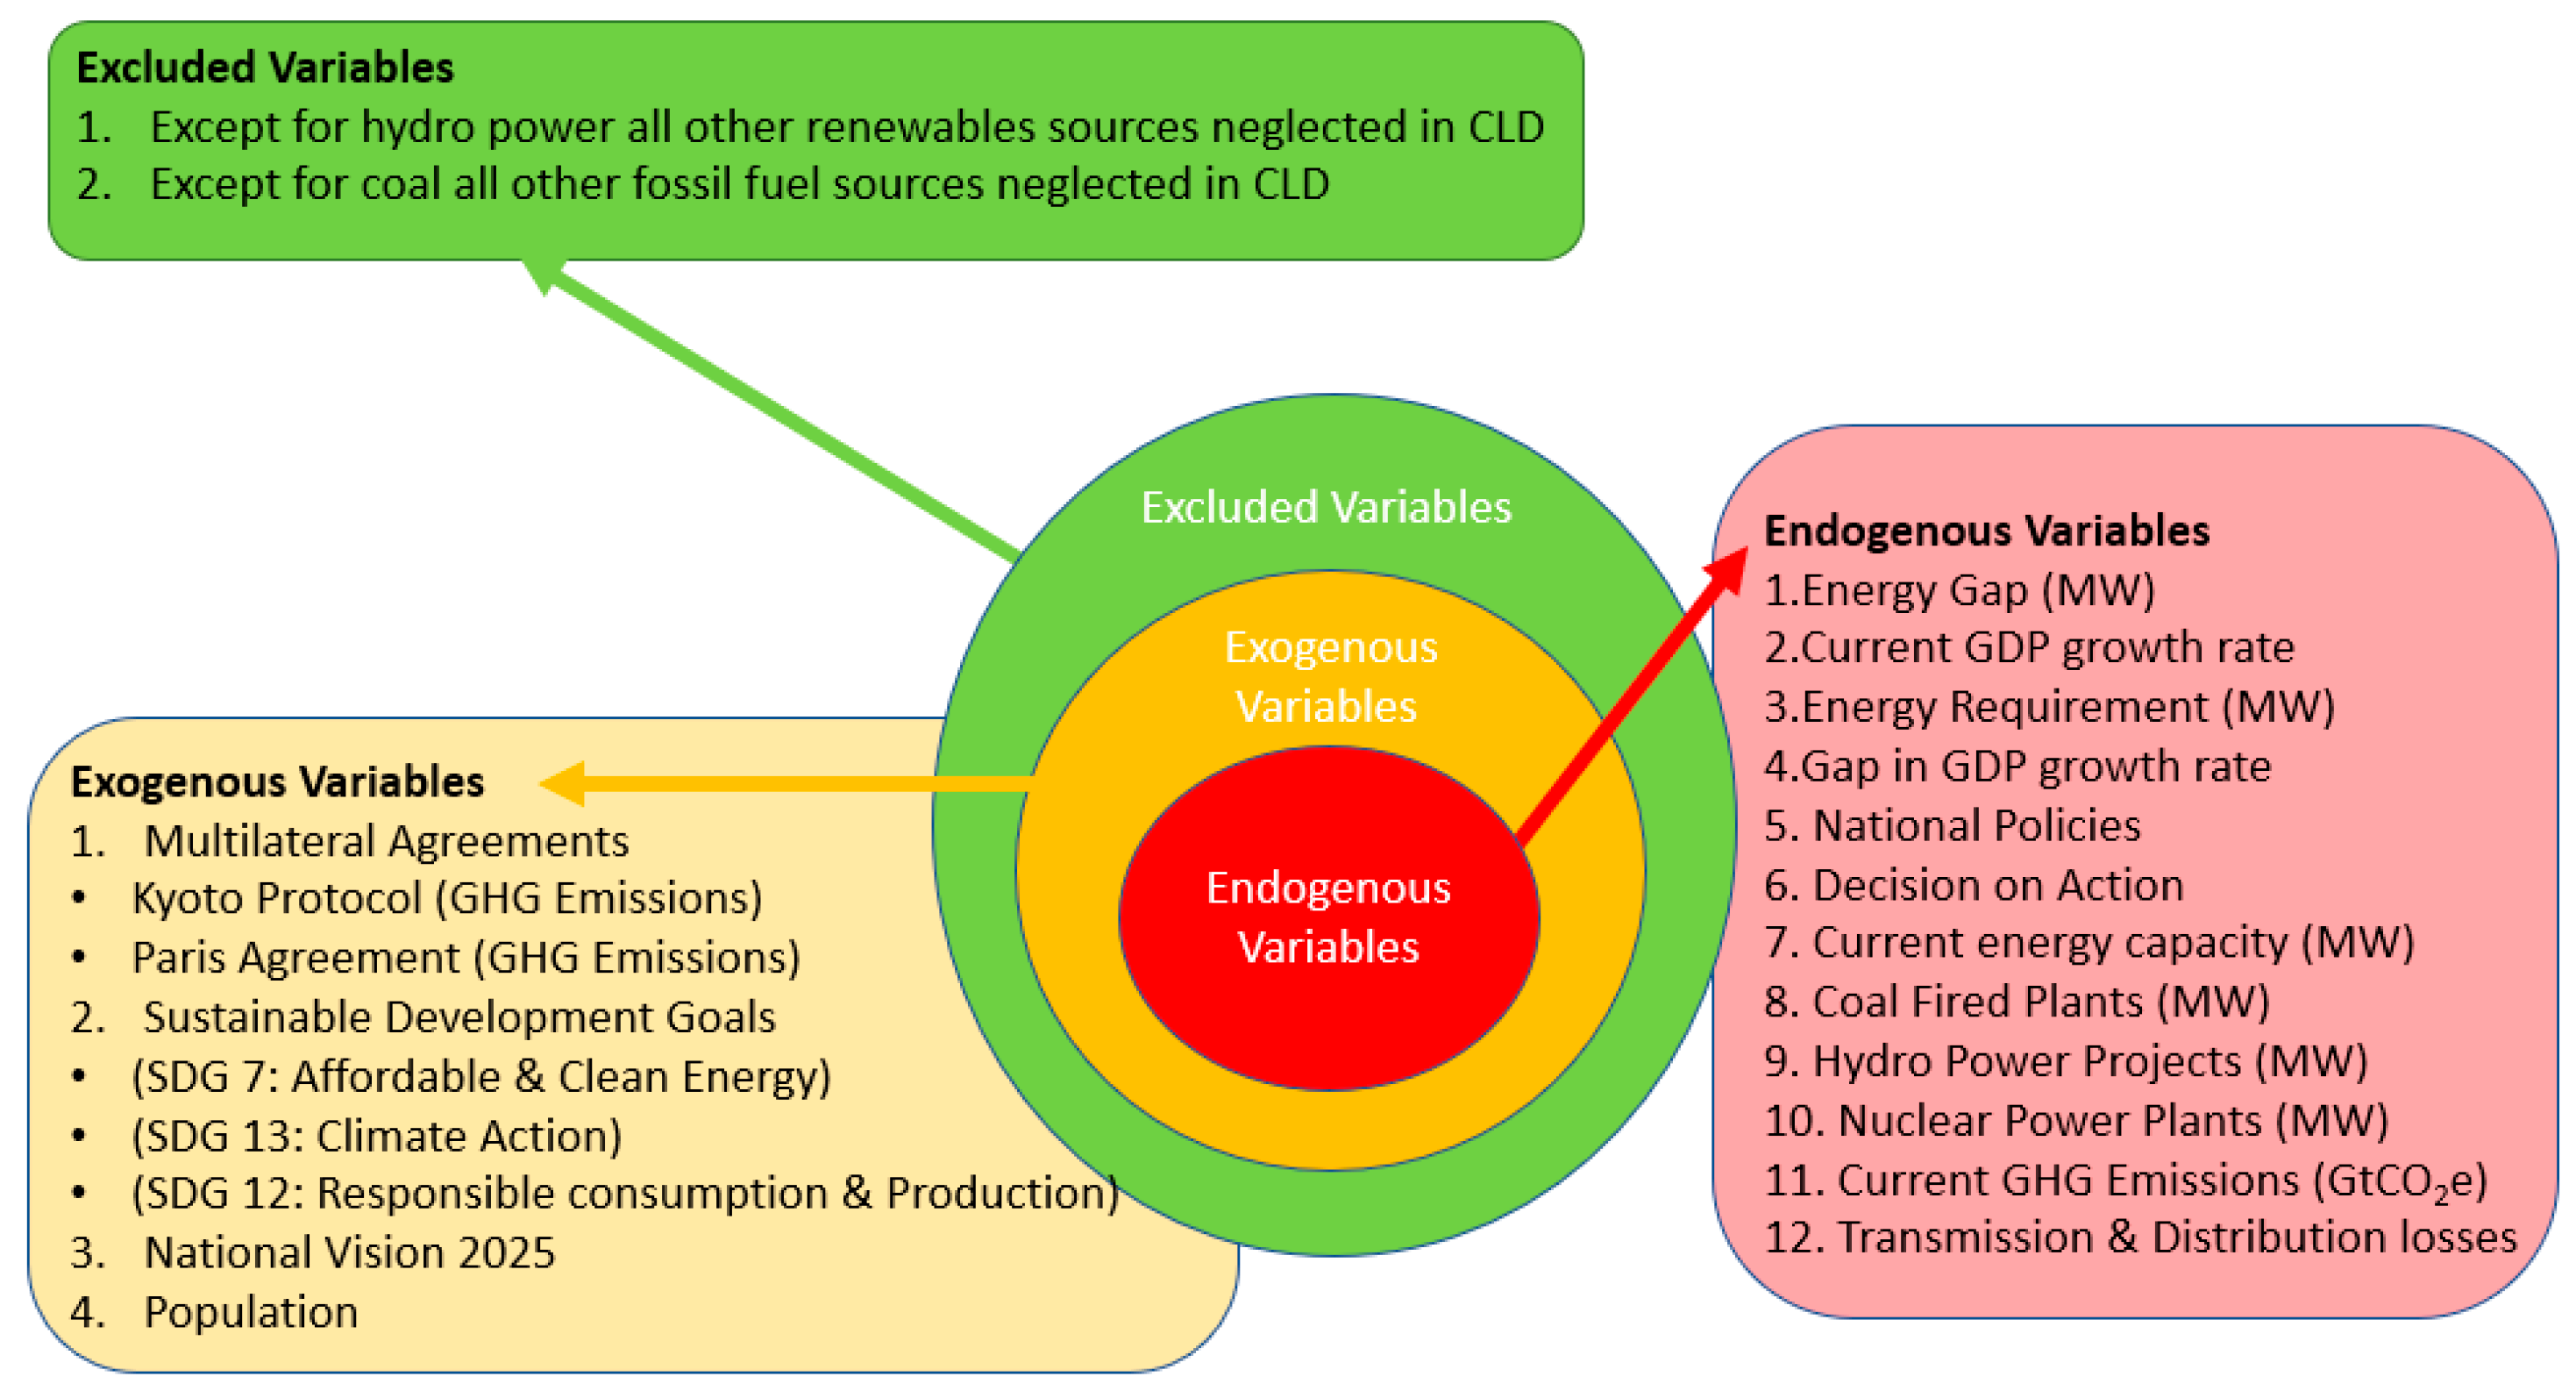
The system boundary is identified by using bull’s eye diagram [31]. The bull’s eye diagram for electric power generation in Pakistan is shown in Figure 3.
The system under consideration is electric power generation in Pakistan with a focus on power generation sources such as coal, hydro, and nuclear energy. National policies and multilateral agreements set targets for GHG emissions and economic growth which are taken as desired goals for the system to achieve. Key variables are elaborated here.
3.1. Endogenous Variables
Energy requirement is the demand for energy while the supply is power generation by various sources such as coal, hydro, and nuclear. Due to the increasing energy gap between supply and demand, the energy requirements of current GDP growth rate and population cannot be met. Thus, to increase current GDP growth rate to 7%, as envisioned in Vision 2025 [14], more energy is required. Hence, to reduce the gap in GDP growth rate different enabling national policies are developed in view of multilateral agreements. These national policies enable decisions on actions in the form of establishing more coal power plants, hydro power plants, and nuclear power plants [9], resulting in minimizing the energy gap.
3.2. Exogenous Variables
The Kyoto Protocol and Paris agreement are mutually agreed global agreements for reducing GHG emissions while SDGs reflect the global goals set for a better future. The following SDGs are taken into account [14]:
SDG 7: Affordable and Clean Energy
SDG 12: Responsible consumption and production
SDG 13: Climate Action
Moreover, Vision 2025 set a target to achieve average a 7% GDP growth rate by 2030. Our system boundary is limited to the power generation sector only. In renewable technologies, only hydro is considered, while in fossil fuels only coal is considered within our study.
3.3. Causal Loop Diagram of Electric Power Generation in Pakistan
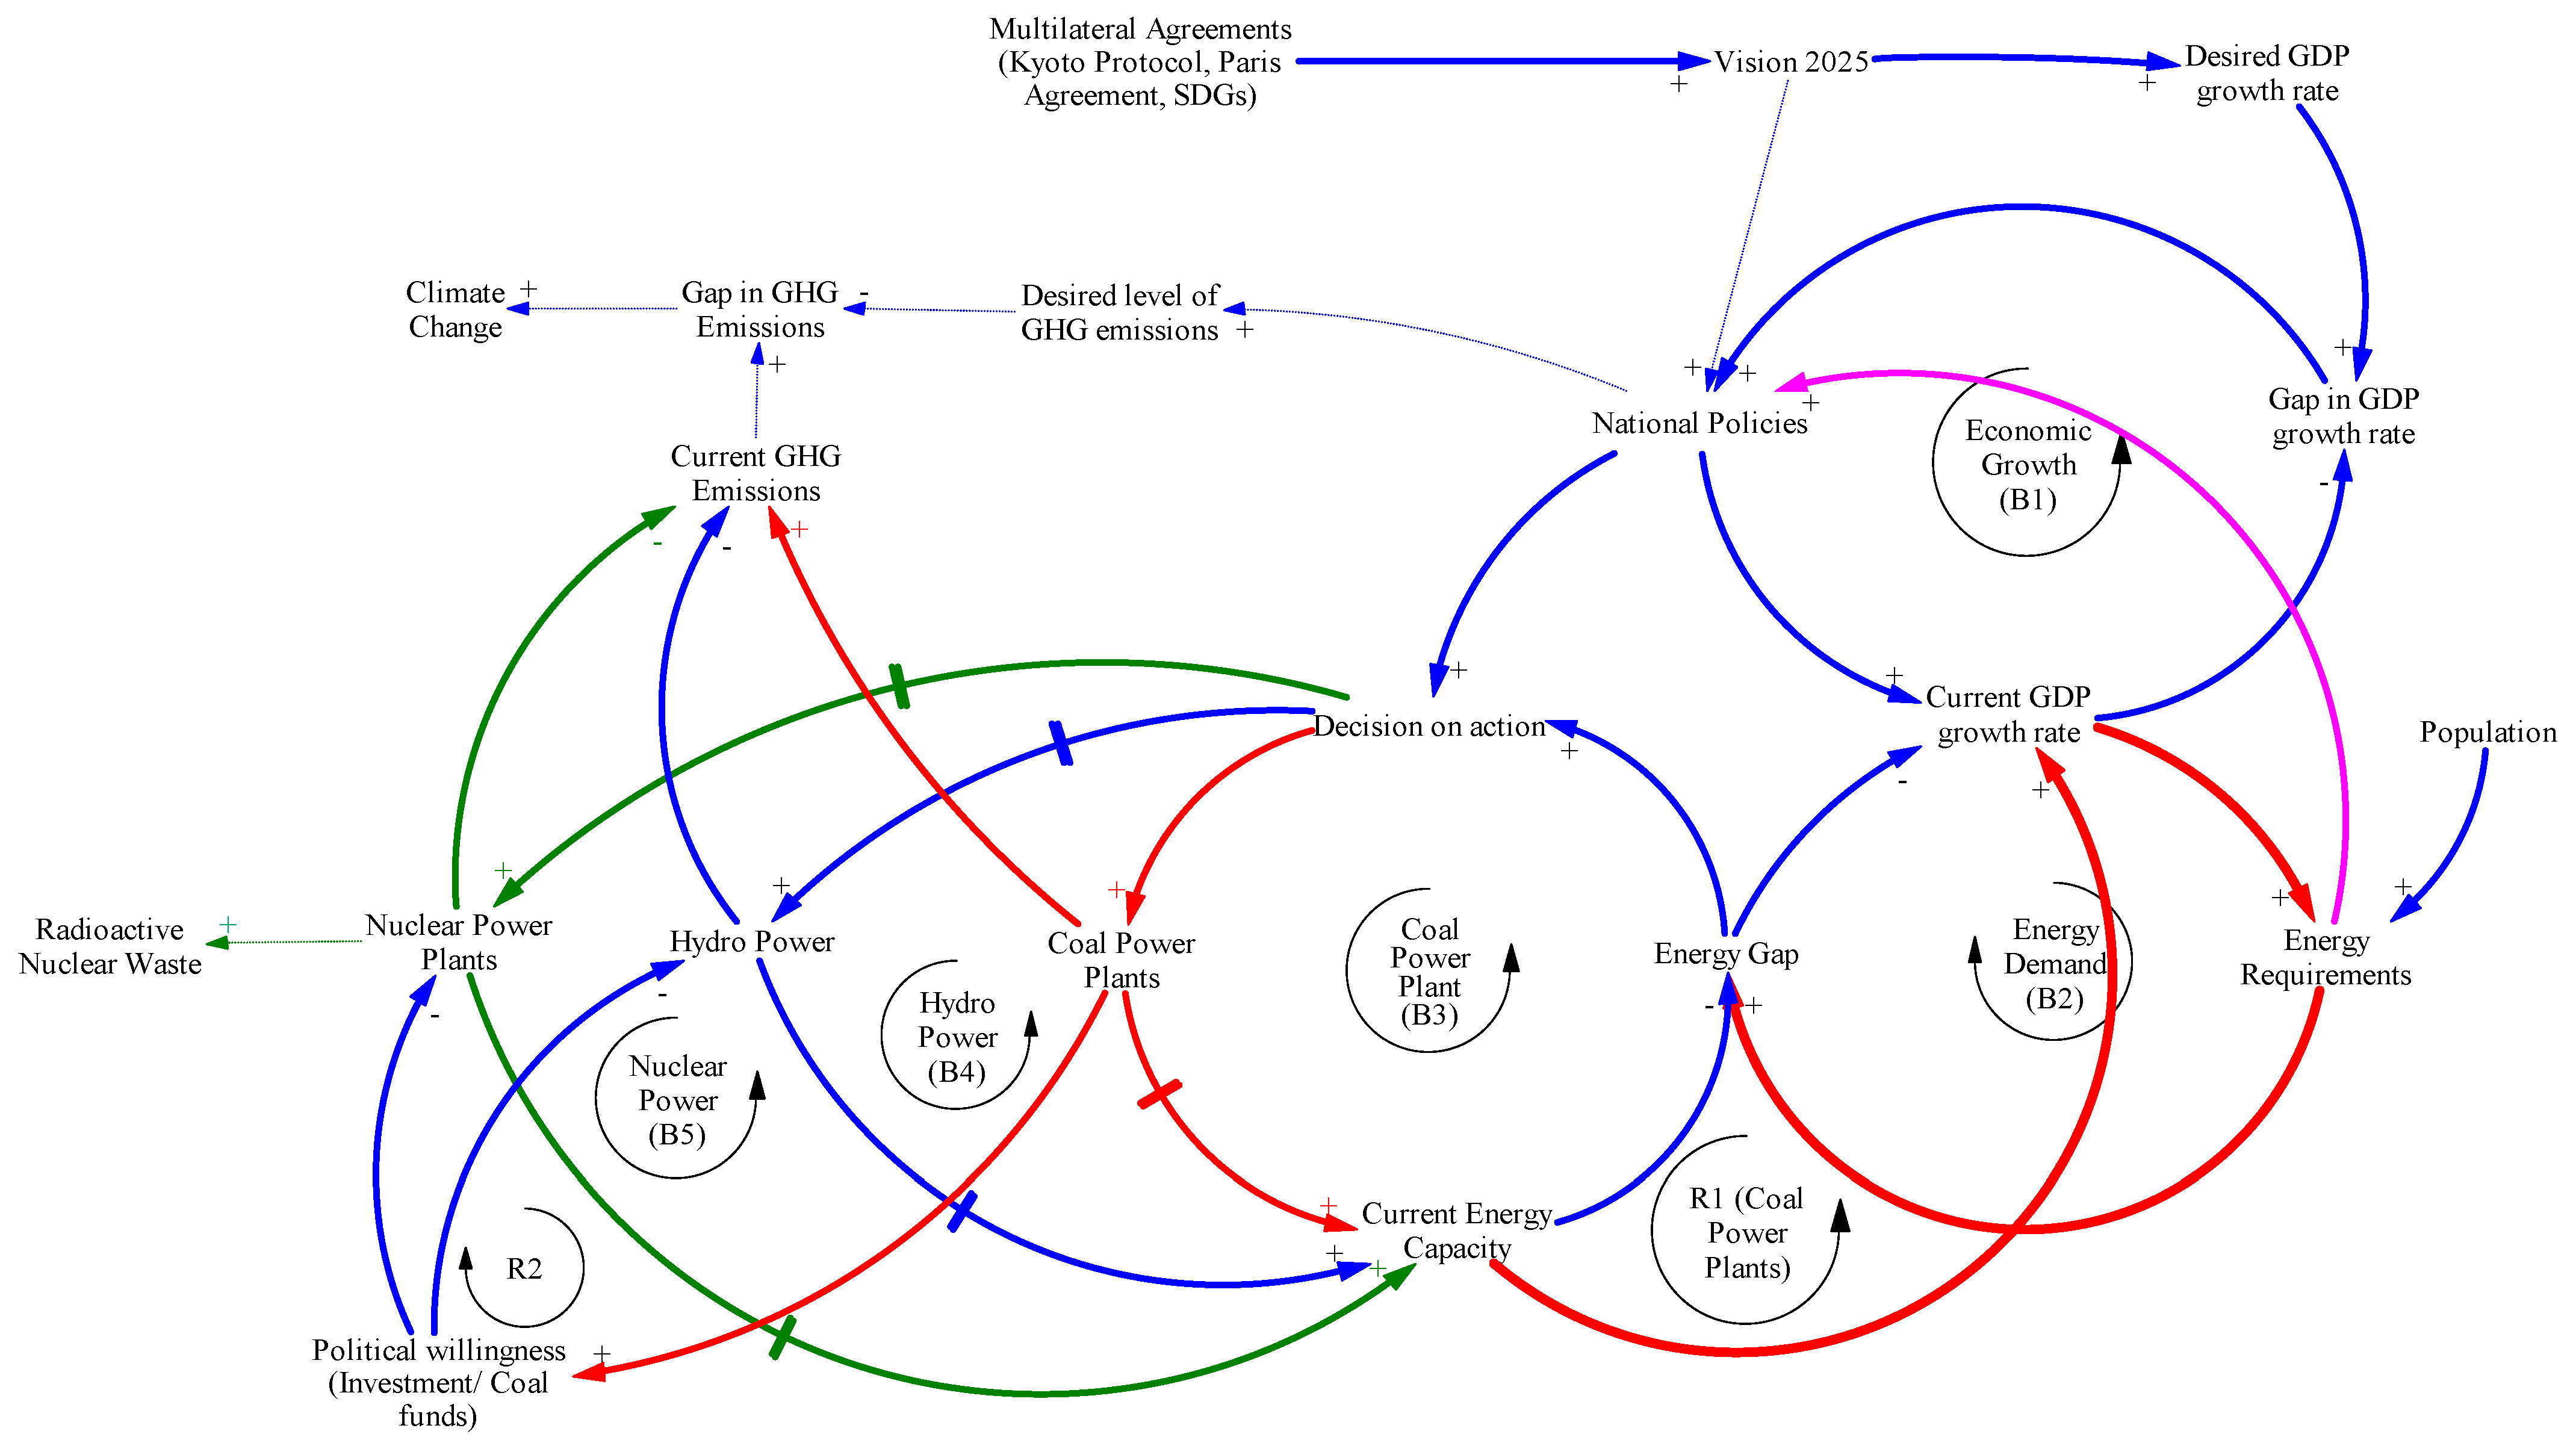
The causal loop diagram, developed using the guidelines described elsewhere [32], for electric power generation of Pakistan is shown in Figure 4.
Loop B1 concerns the economic growth comprising of endogenous variables and influenced by exogenous variables. Endogenous variables are current GDP Growth rate, Gap in GDP growth rate, and national policies. Whereas, the exogenous variables are Desired GDP growth rate, Vision 2025, the Kyoto Protocol, and the Paris Agreement. As envisioned in Vision 2025, GDP growth rate of 7–8% is desired to be sustained by 2030 [14]. This desired GDP growth rate, increases the gap in GDP growth rate as compared to current GDP growth rate in 2020 [33]. In order to achieve this target, different national policies, frameworks, reforms, and actions plans were developed with further developments in progress such as the National Climate Change Policy, 2012 [34]; the Pakistan Climate Change Act, 2017 [35]; the National Environmental Policy, 2005 [36]; the Pakistan Environmental Protection Act, 1997 [37]; the New Governance Paradigm (Pillar 3) of Vision 2025 [14]; and the National Action Plan, 2019 [38], while incorporating the targets agreed to or committed as in the multilateral agreements. These national policies facilitate and enable current GDP growth rates to improve in a sustainable manner, in turn reducing the Gap in GDP growth rate. Our commitments to multilateral agreements are described in the Pak-INDC report in which Pakistan sets its desired levels of GHG emission with aims to reduce upto 20% of its 2030 projected GHG emissions accounted to be nearly 1603 (MtCO2e), subject to availability of international financial support amounting $40 billion.
Pakistan is amongst the top 10 most climate-affected countries in the world as per German-watch [39], compelling the country into forced adaptation needing US$7 billion to US$14 billion per annum. Whereas, Pakistan merely emitted 0.8% in total global GHG emissions in 2010 [40]. From 1994–2015, overall emissions have increased by about 123% and, for years 2015–2030, are projected to increase by nearly 300%. The energy sector emissions alone in 1994, 2015, and 2030 (projected) were 85.8 (MtCO2e), 185.97 (MtCO2e), and 898 (MtCO2e) (projected), respectively, showing an increase of 117% in 2015 and 383% in 2030 [9].
Loop B2 reflects on the energy demand of the system. The endogenous variables involved are current GDP growth rate, energy requirements, and energy gap. Population acts as an exogenous variable to loop B2. In order to increase current GDP growth rate, the energy requirements caused by the current GDP growth rate and population growth need to be fulfilled. Otherwise, the energy requirement will annually increase the energy gap, causing a negative impact as observed in the trend in GDP growth rate, i.e., 2017 (5.4%), 2018 (5.2%), 2019 (3.9%), and 2020 (about 3.6%) [33]. Employing the rule of 70 [41], the energy requirements would be expected to double in approximately 10 years for a 7% GDP growth rate.
Loop B3 shows the vicious cycle of coal. The endogenous variables involved are energy gap, decision on action, coal power plants, current energy capacity, current GHG emissions, political willingness, and national policies. Due to the increased energy demand in loop B2, the energy gap intensifies, causing a severe energy crisis and resulting in factories, industries, and organizations to shutdown, affecting the livelihood of thousands of families [42]. An energy crisis has adversely affected the economy with an estimated 10% loss to the overall GDP [43]. As the energy gap increases, more decisions on actions are taken in the form of establishment of coal power plants.
Pakistan is believed to have huge potential of energy sources; if properly utilized it can fulfill the current and future requirements, providing energy security, environmental protection, and sustainable economic growth [44]. Pakistan possesses huge coal reserves, but unfortunately imports coal due to relatively high ash and sulfur content [45]. These coal reserves of Pakistan have the potential to produce as much as 100,000 MW electricity for a lifetime of 30 years [46]. The production of coal in Pakistan has been significantly low because power policies since the early 1990s encouraged thermal power plants based on imported fossil fuels; however, they are gradually picking up in order to reduce reliance on imported fossil fuels with peak production to occur in 2080 with an estimated production of 134.06 million tons [30].
As the number of coal power plants increases, the generated power is added to the current energy capacity which in turn reduces the energy gap. Growth in electric power generation through coal power plants will result in increasing GHG emissions and require large quantities of water, mainly contradicting to at least three SDGs which seek to reduce water scarcity, increase the incorporation of renewable energy sources, and address climate change [47].
Loop B4 shows one fundamental solution in the form of hydro power. The endogenous variables included are energy gap, decision on action, hydro power plants, current energy capacity, and current GHG emissions. As the energy gap increases, policy makers take decision on action, in the form of constructing hydro power plants. The power generated is added to the current energy capacity, resulting in minimizing the energy gap.
Pakistan has an estimated potential of 60,000 MW on Chenab, Jhelum, Indus, and Ravi, in which 57,000 MW is suitable for hydro power projects with a capacity above 50 MW and the remaining is suitable for hydro power projects with a power generation capacity of less than 50 MW [48]. Hydropower projects have multiple benefits as they offer clean and renewable energy, water for irrigation and can control floods [13]. Pakistan has added less than 25% to its hydropower base over the past two decades. Major factors hindering the growth in hydro power projects are lack of political will, delays in civil works, delay in fund release by the government, projects without proper site investigation, and force majeure [49].
Loop B5 shows nuclear power plants as an alternative to fulfilling the energy demands in loop B2. The endogenous variables as well as their causal relations are similar to loop B3 and B4.
Pakistan’s energy crisis is mainly rooted in poor policy decisions, i.e. having an incomplete and inconsistent short-term planning approach, lack of modelling tools to assess available resources as well as future demands [43], lack of stakeholders’ involvement, training and expertise on behalf of decision makers and policy makers, and proper allotment and utilization of funds [50].
Loop R1 represents the feedbacks which reinforce the vicious cycle of coal (loop B3). The endogenous variables involved are energy gap, decision on action, coal power plants, current energy capacity, current GDP growth rate, and energy requirements. Due to the energy demand in loop B2, the energy gap intensifies, causing pressure on policy makers and planners to take decisions on actions in the form of establishing more coal power plants. The power generated from the plants directly added to the current energy capacity in-turn making energy available for current GDP growth rate to flourish. However, as the current GDP growth rate increases, more energy is required to fulfill the needs for growth causing the energy gap to further increase and forcing the system to take the same action in the form of establishing more coal power plants.
Loop R2 reinforces the effect of applying a short-term solution (loop B3). The variables involved are energy gap, decision on action, coal power plants, political willingness, hydro power plants, nuclear power plants, and current energy capacity. Energy demand in loop B2 influences the energy gap positively which compels the system to take decision on action in the form of increasing coal power plants. As the number of coal power plants increases, the current energy capacity also increases, resulting in a reduction in the energy gap. On the other hand, as the number of coal power plants increases, political willingness also increases towards supporting, facilitating, and promoting coal as a solution to energy crisis. Hydro power plants and nuclear power plants are usually considered in long-term planning as time delays are accompanied during the process with requirement of huge investments. Due to these delays and financial constraints, the allotted funds are shifted towards coal and growth in fundamental solution is hampered.
Loop R3 reinforces the efforts for economic growth in loop B1. The variables involved are national policies, current GDP growth rate, and energy requirements. As envisioned in Vision 2025, a GDP growth rate of 7–8% is desired to be sustained by 2030 [14], based on which national policies were developed to align growth in electric power generation. These national policies facilitate economic growth, which in turn increases the energy requirements.
4. Applying Systems Archetypes for Diagnosis
This research is a unique contribution to qualitatively understand the complex nature of a prevailing energy crisis in Pakistan. The complexity of the system presented in the causal loop diagram is attributed to interconnectedness in the electric power generation system, influenced by national policies and multilateral agreements. In literature, Danial H. Kim describes the behavior of a system using eight archetypes [51]. In order to diagnose systemic issues and design high leverage interventions, three of the various archetypes described are employed in order to elucidate behavior exhibited by electric power generation in Pakistan.
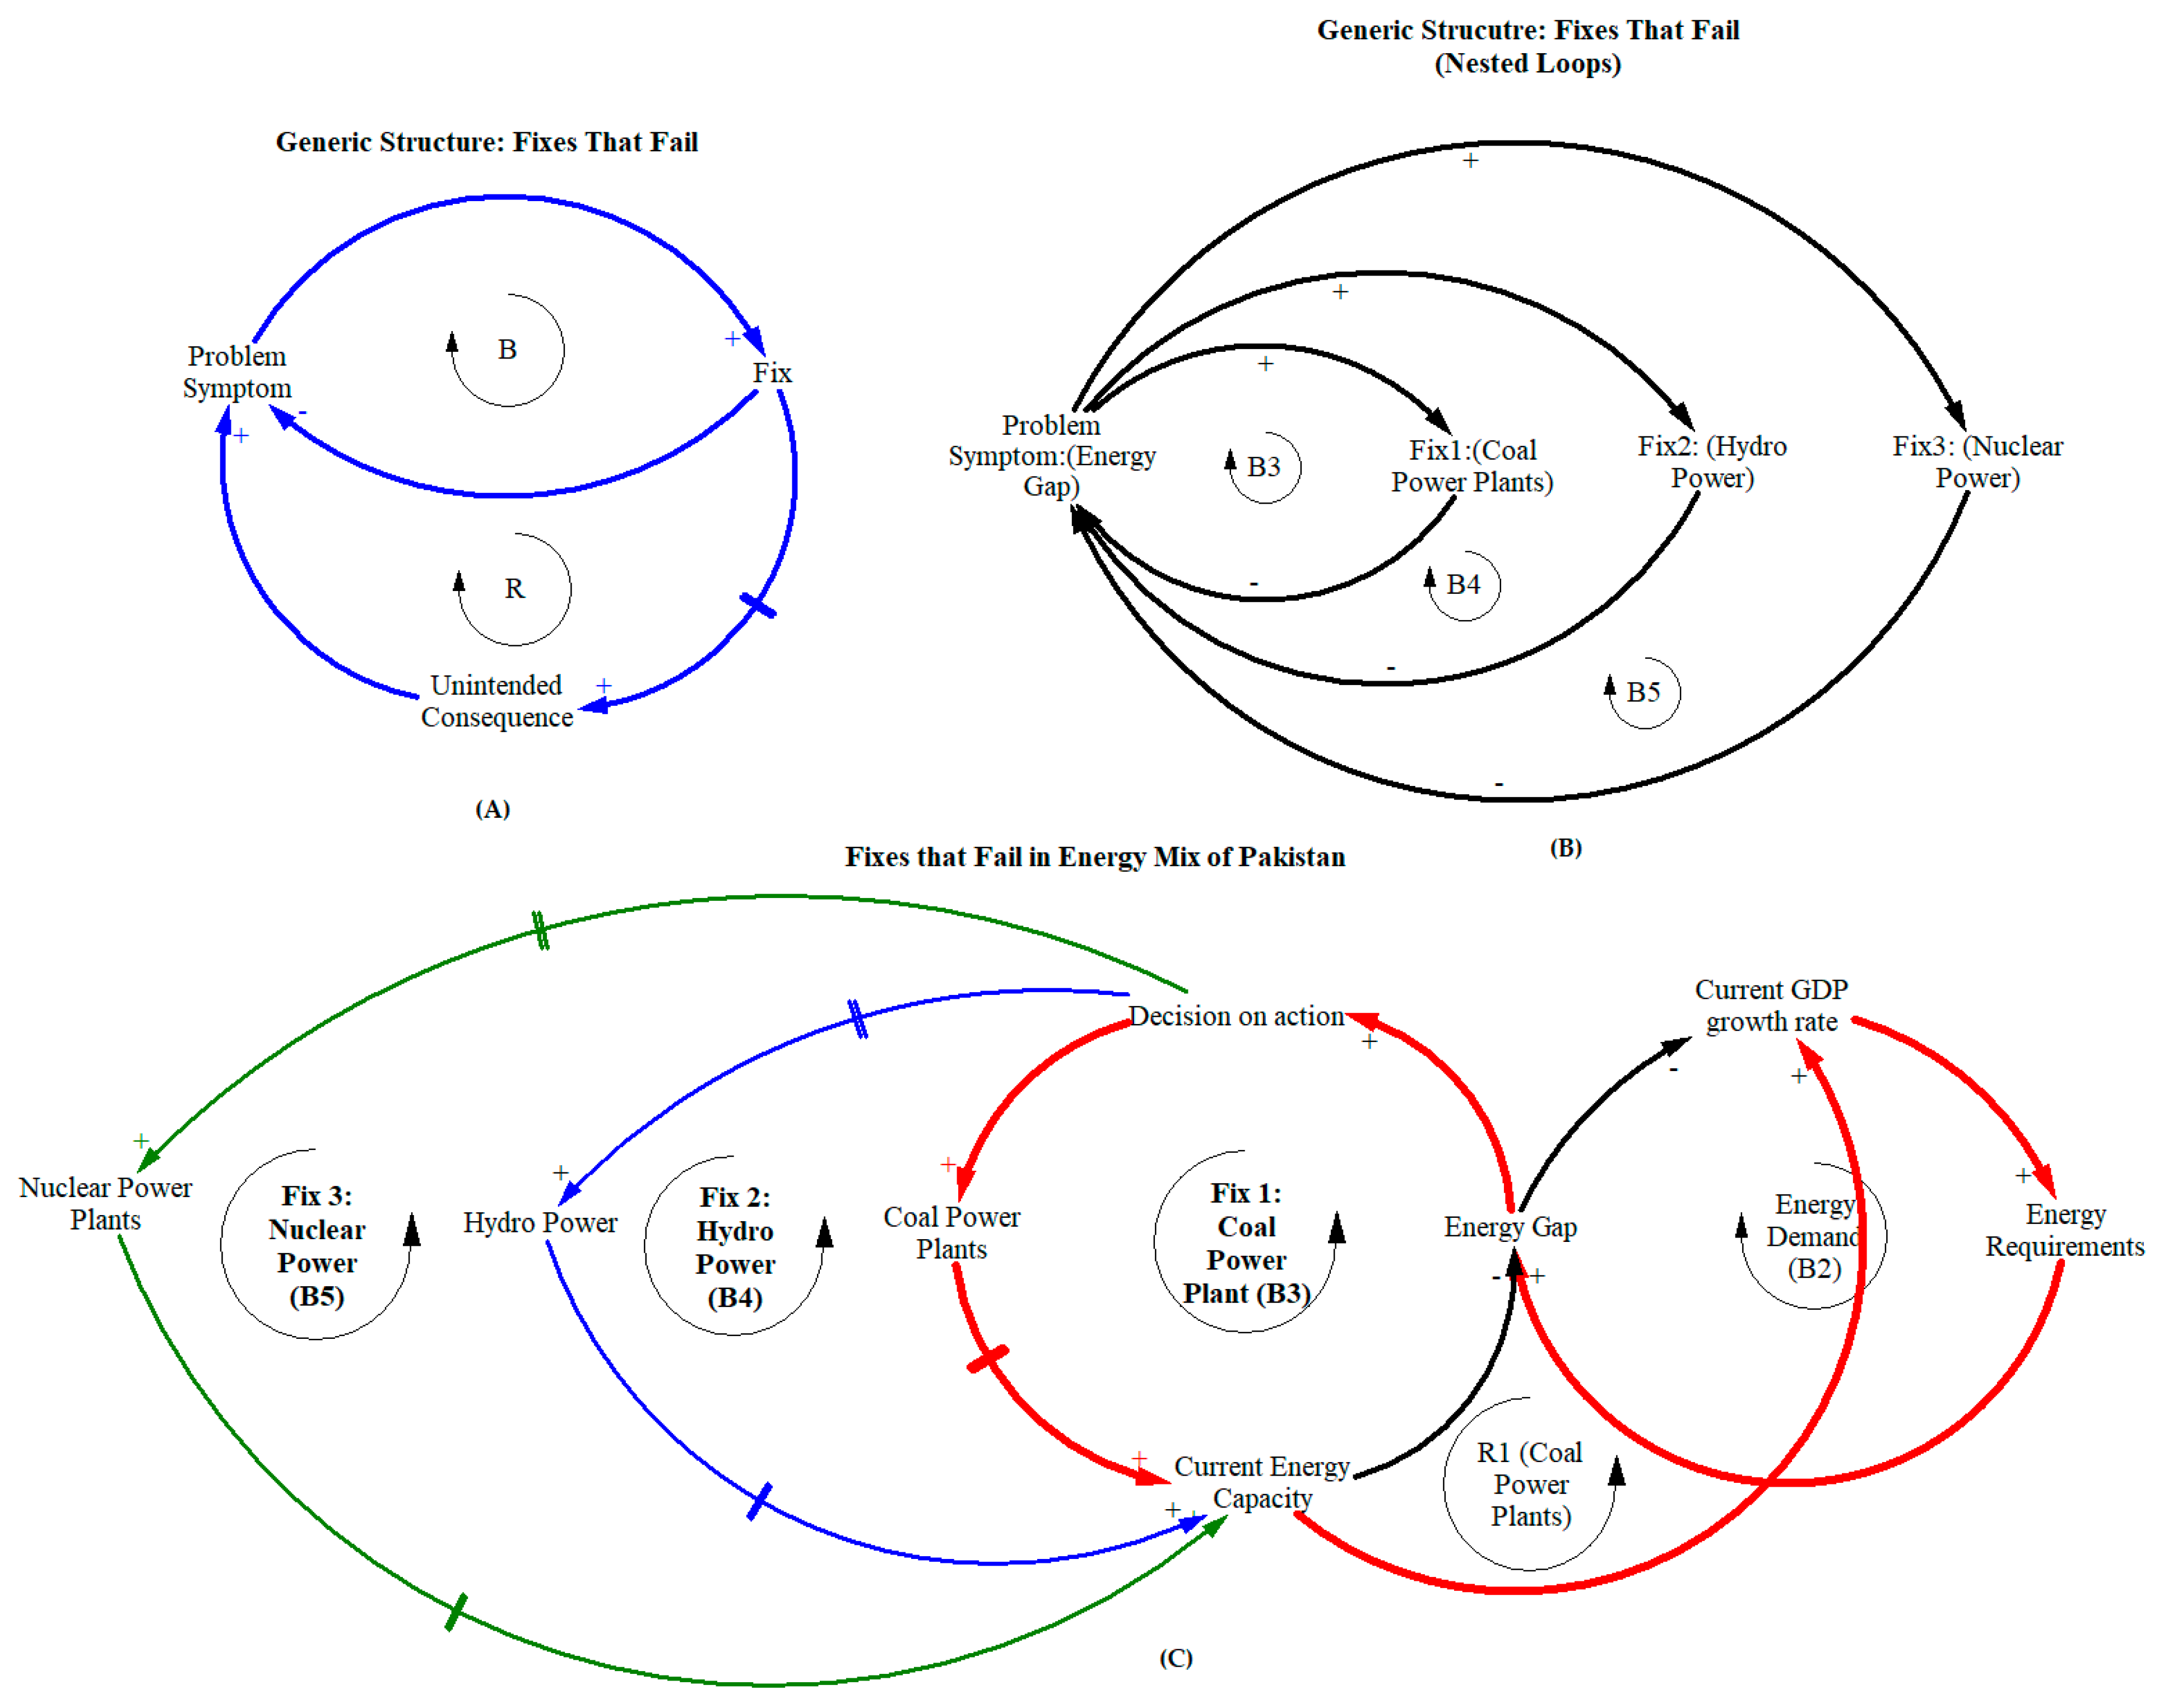
4.1. Fixes That Fail
The systems archetype “fixes that fail” employed to diagnose electric power generation in Pakistan is shown in Figure 5.
In Figure 5A,B, the structures depict the behavior of the archetype “fixes that fail”. In this archetype, a problem symptom needs immediate solution. However, by applying a quick solution, the problem symptom is dealt with temporarily without taking into consideration the unintended consequences which arise after a delay with the original problem symptom recurring. This recurring nature of the problem leads the system into a crisis. Thus, to ease the problem symptom, the fix is applied again. The delay has a destructive impact on the overall system as the causes of unintended consequences go unaccounted for. In Figure 5C, loop B3 and loop R1 show a similar behavior to the archetype ‘fixes that fail’ in which the increase in energy gap encourages policy makers and decision makers to take decision on action, which results in establishing more coal power plants as a quick fix. The power generated from the coal power plants is added to the current energy capacity, which in turn reduces the energy gap. Unintended consequences arise from growth of coal power plants in the form of an increase in current GHG emission and in current energy capacity, resulting in the increase of current GDP growth rate. Furthermore, increasing the energy requirement and energy gap forcing the system to come back to the same position where action was required. This increase in current GDP growth rate reinforces the system to apply the same fix again. Hence, these solutions can provide short-term relief but cannot be sustained in longer terms forcing the system into a vicious cycle of coal. Solution for such a behavior is to identify and acknowledge that the quick fix is not solving the problem instead its elevating the problem.
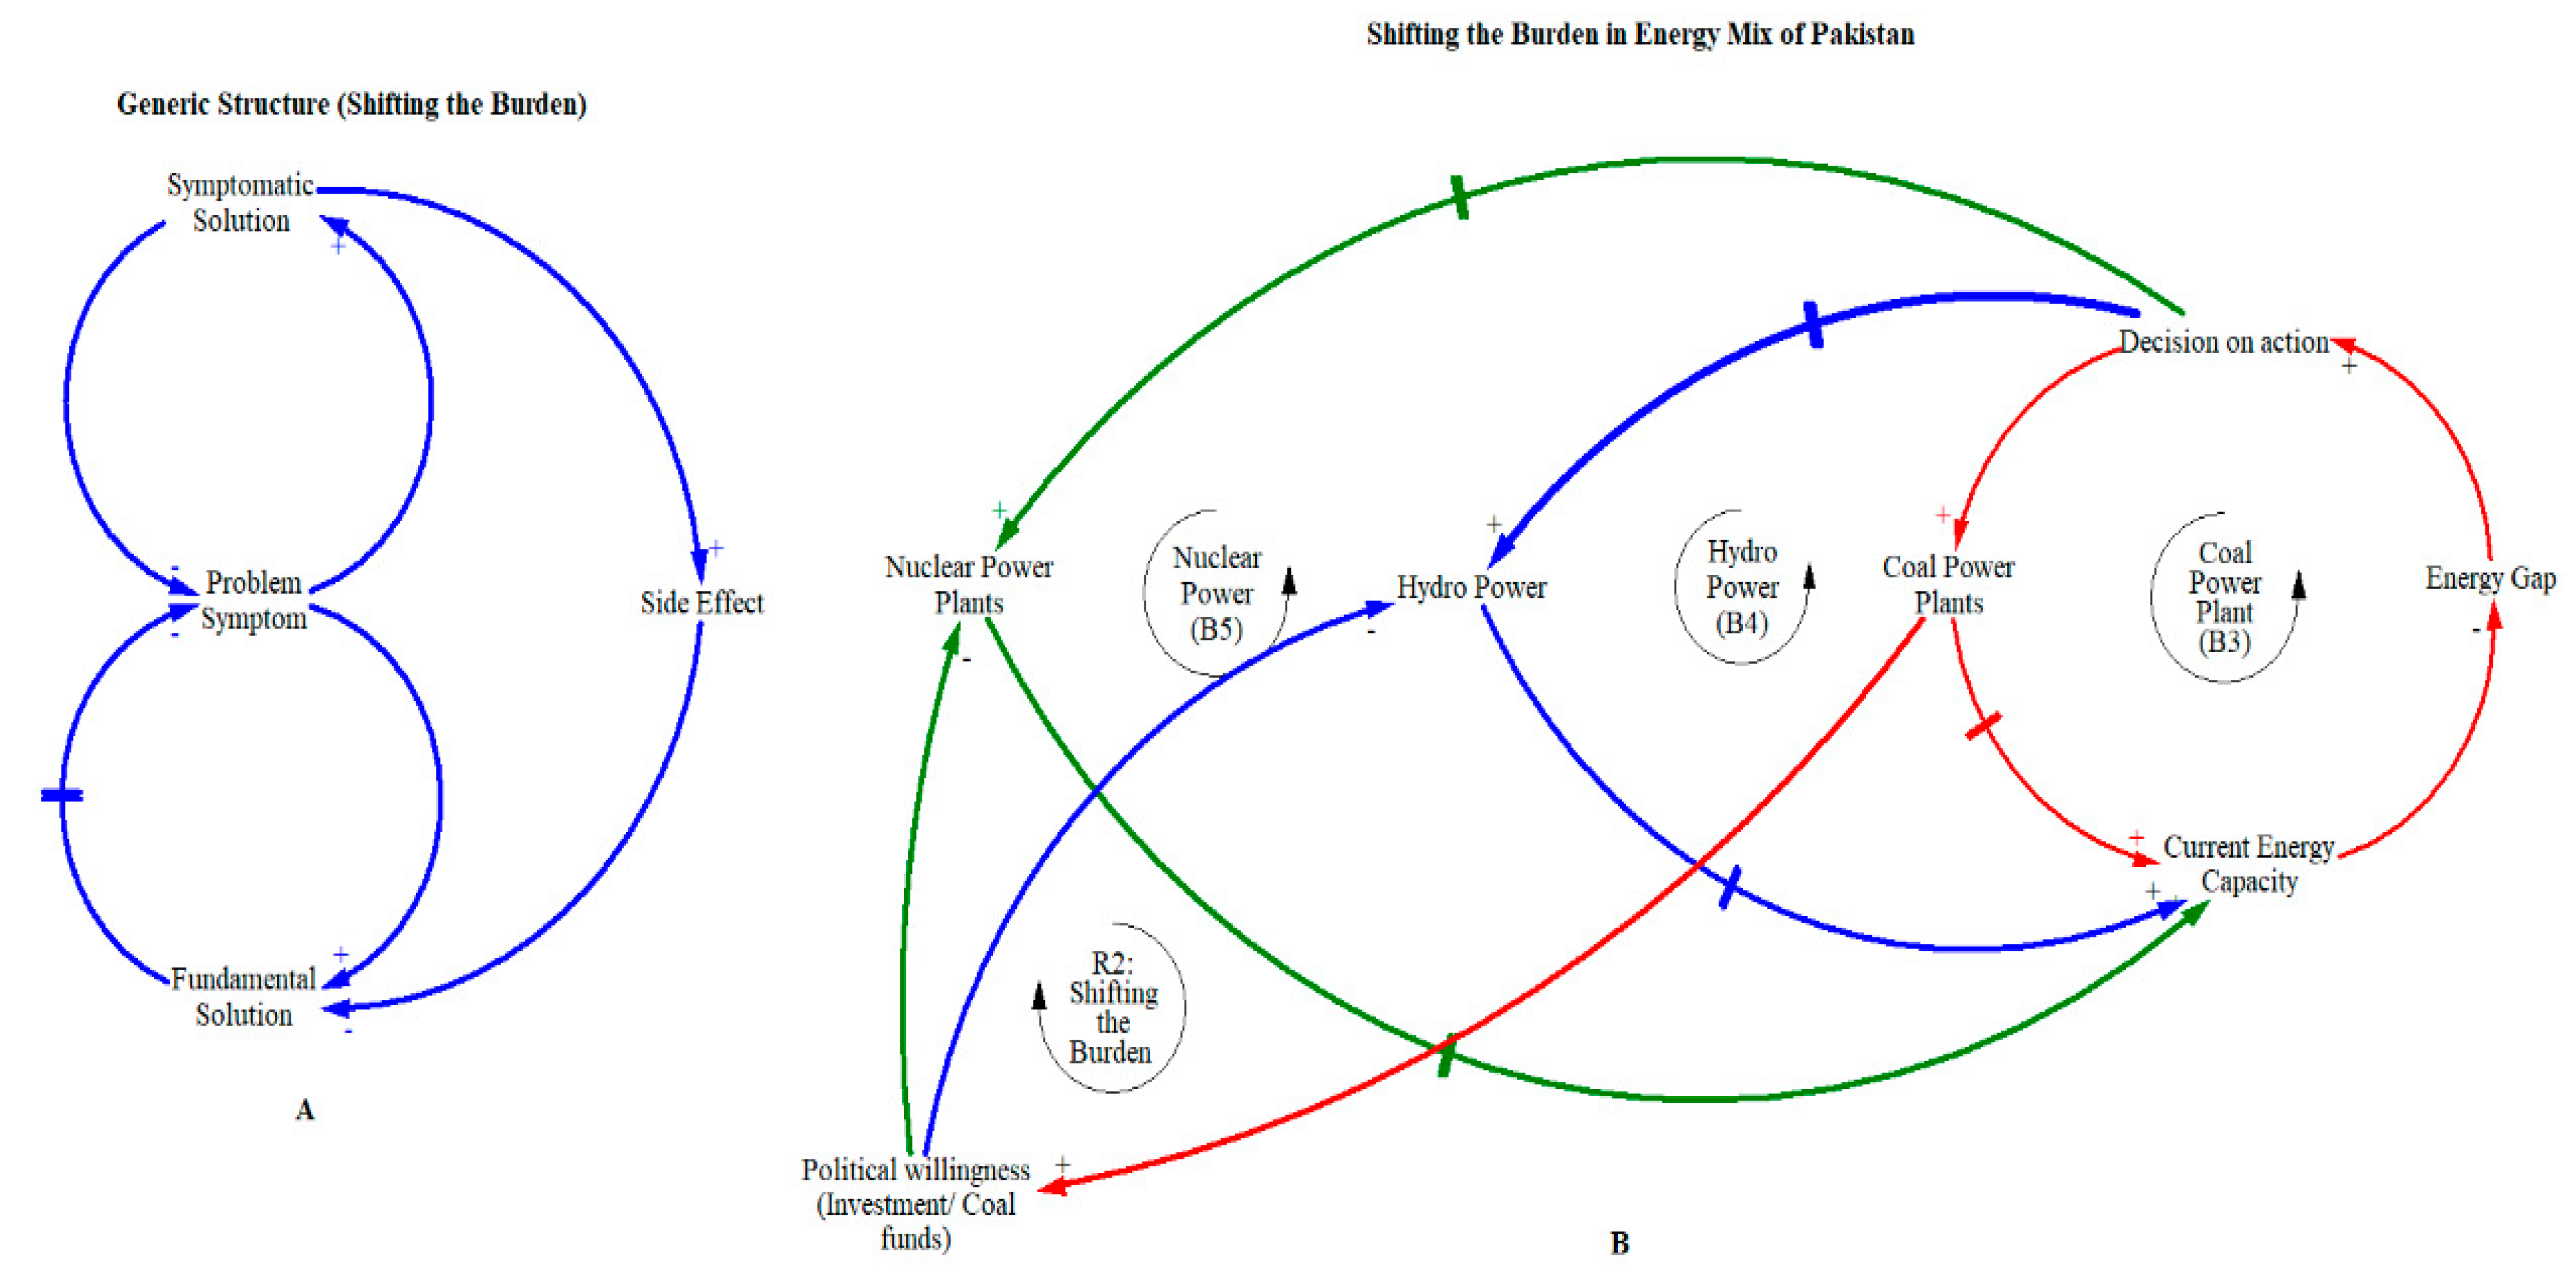
4.2. Shifting the Burden
The behavior shown in Figure 6A,B reflects the archetype “shifting the burden”. In this archetype, as shown in Figure 6A, the problem symptom can be dealt with by applying symptomatic solutions. In case of applying a symptomatic solution, the focus on fundamental solution diminishes. Thus, symptomatic solutions lead the symptomatic problem to recur in a vicious cycle. Hence, limiting the efforts needed to implement a fundamental solution. It may be observed from Figure 6B that Pakistan’s energy crisis is a result of a huge energy gap between power supply and demand. The energy gap can be reduced with short-term solution (coal power plants) or fundamental solution (hydro). By applying a quick fix in the form of establishing more coal power plants, more energy is generated in lesser time, causing an increase in political willingness, resulting in more fund allocation for coal and shifting focus from fundamental solution such as hydro power. Such unfavorable conditions for a fundamental solution keep reinforcing in a vicious cycle due to applying a quick fix. Solution for such a behavior is commitment to solve the real problem by identifying the root causes and plans for fundamental solution.
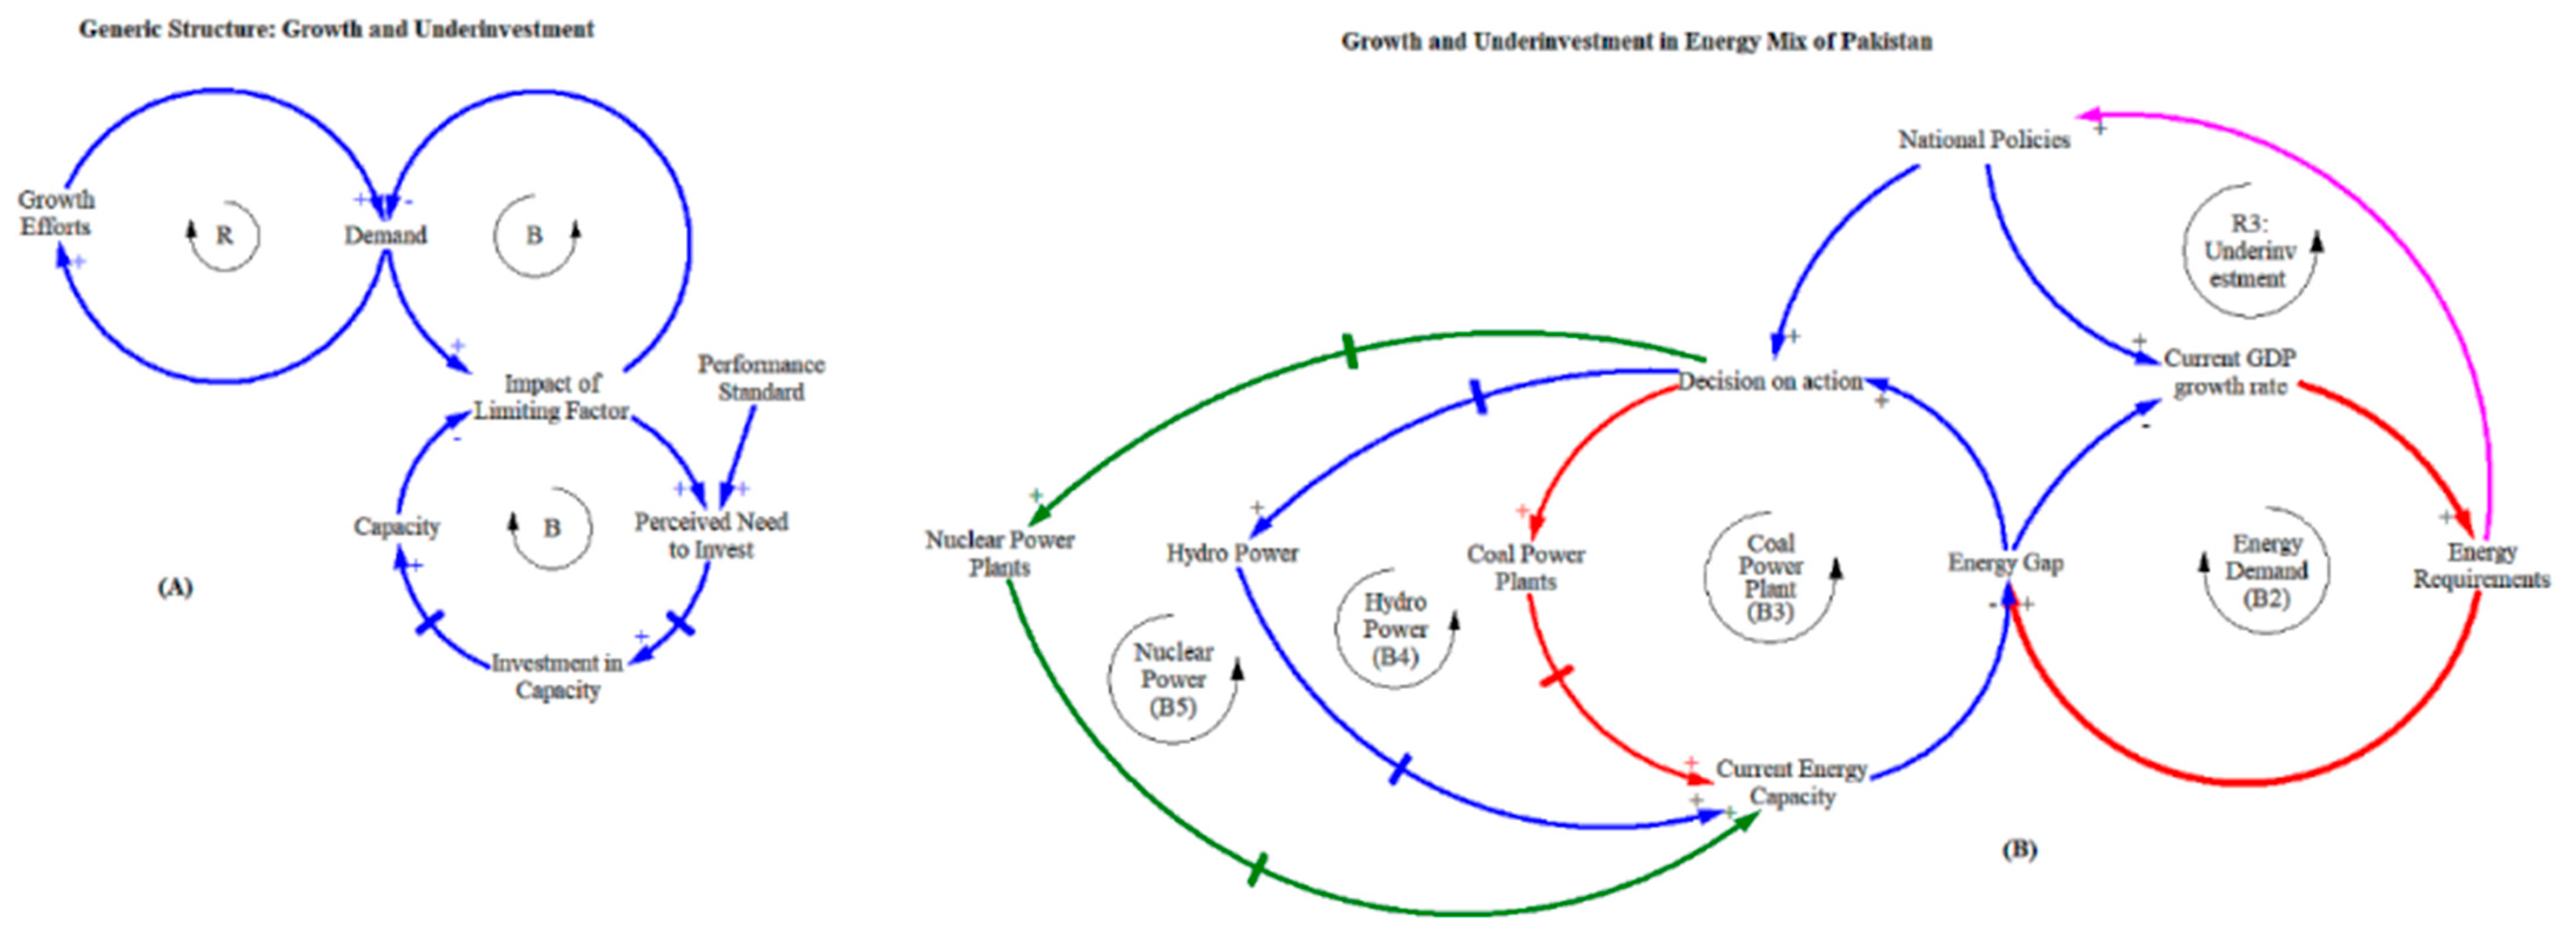
4.3. Growth and Under-Investment
The archetype “Growth and under-investment” can be seen in Figure 7A,B, as growth reaches a limit due to lack of investment. Instead, if policies are developed and delays are reduced, the performance of the overall system will improve and enable growth. If these investments are not made timely, the performance will degrade further and withhold investments, causing the system performance to worsen. In Figure 7B, loop B1 represents the goal of the system, i.e., to improve the current GDP growth rate. In order to do so, the gap in GDP growth rate, caused by the difference in current GDP growth rate and desired GDP growth rate, needs to be minimized. Therefore, enabling policies are developed to support and enhance current GDP growth rate and achieve the set goals. The economic goals in loop B1 are subjected to constraints from loop B2 in the form of energy requirements caused by current GDP growth rate and population. These ever-increasing energy requirements further increase the energy gap and impact the current GDP growth rate adversely. Loop B3, loop B4, and loop B5 reflect on the actions taken in order to minimize the constraints caused by the energy demand loop B2 and maximize the goal attainment in loop B1. Action in the form of addition of more power generation sources takes place from coal, hydro, and nuclear power. These power generation sources add their megawatts generated into the current energy capacity but with certain delays. As energy requirements are minimized for the time being, it encourages more economic growth, causing an energy gap to further increase, thereby widening the energy gap once again and hindering the current GDP growth rate. Thus, the energy gap leads to underinvestment into a fundamental solution, i.e., hydro (loop B4) resulting in setback to economic goals. Hence, by increasing investments into the fundamental solution, the current energy capacity will increase in the form of available, affordable, and accessible power with zero or minimum environmental impacts. Whereas, if current energy capacity is not enough to fulfill the energy requirements, investment will seize and further growth will see a negative trend. Therefore, proper energy planning is required in order to assess and take into account current and future energy requirements and to take appropriate actions in order to ensure energy security in the country.
The qualitative modeling of electric power generation in Pakistan and its diagnosis using systems archetypes is validated quantitatively with the help of simulation results presented in next section.
5. Simulation Results
This section presents results of the simulation to quantify the behavior as diagnosed by using systems archetypes based on the causal loop diagram. A system dynamics model was developed in STELLA version 9.0, the details of which may be found elsewhere [52]. Key model equations to represent the dynamics of electric power generation in Pakistan are presented here.
The cumulative energy demand is calculated by using Equation (1):
where,
- = Cumulative energy demand (MW),
- = Overall energy demand (MW/yr),
- = Delta time,
- = Time (yr).
The overall energy demand is calculated by using Equation (2):
where,
- (MW/yr),
- in year 2018 = 26,714 MW,
The overall energy generation is calculated by using Equation (3):
where,
OEG = T&D losses ∗ (CEGFO + CEGH + CEGIC + CEGLC + CEGNG + CEGN + CEGR + CEGRLNG + CC)
- OEG = Overall Energy Generation (MW),
- T&D losses = Transmission and Distribution losses (20%),
- CEDFO = Cumulative Energy Generation from Furnace Oil (MW)
- CEDH = Cumulative Energy Generation from Hydro (MW)
- CEDIC = Cumulative Energy Generation from Imported Coal (MW)
- CEDLC = Cumulative Energy Generation from Local Coal (MW)
- CEDNG = Cumulative Energy Generation from Natural Gas (MW)
- CEDN = Cumulative Energy Generation from Nuclear (MW)
- CEDR = Cumulative Energy Generation from Renewable (MW)
- CEDRLNG = Cumulative Energy Generation from Re-Gasified Liquefied Natural Gas (MW)
- CC = Current Capacity (22,715 MW energy generated in 2018).
It may be worthwhile to note here that, while only coal, hydro, and nuclear power is focused in the causal loop diagram, different energy generation sources corresponding to energy mix in Pakistan (Figure 2) were taken into account in the quantitative model. Key parameters and assumptions made are shown in Table 1.
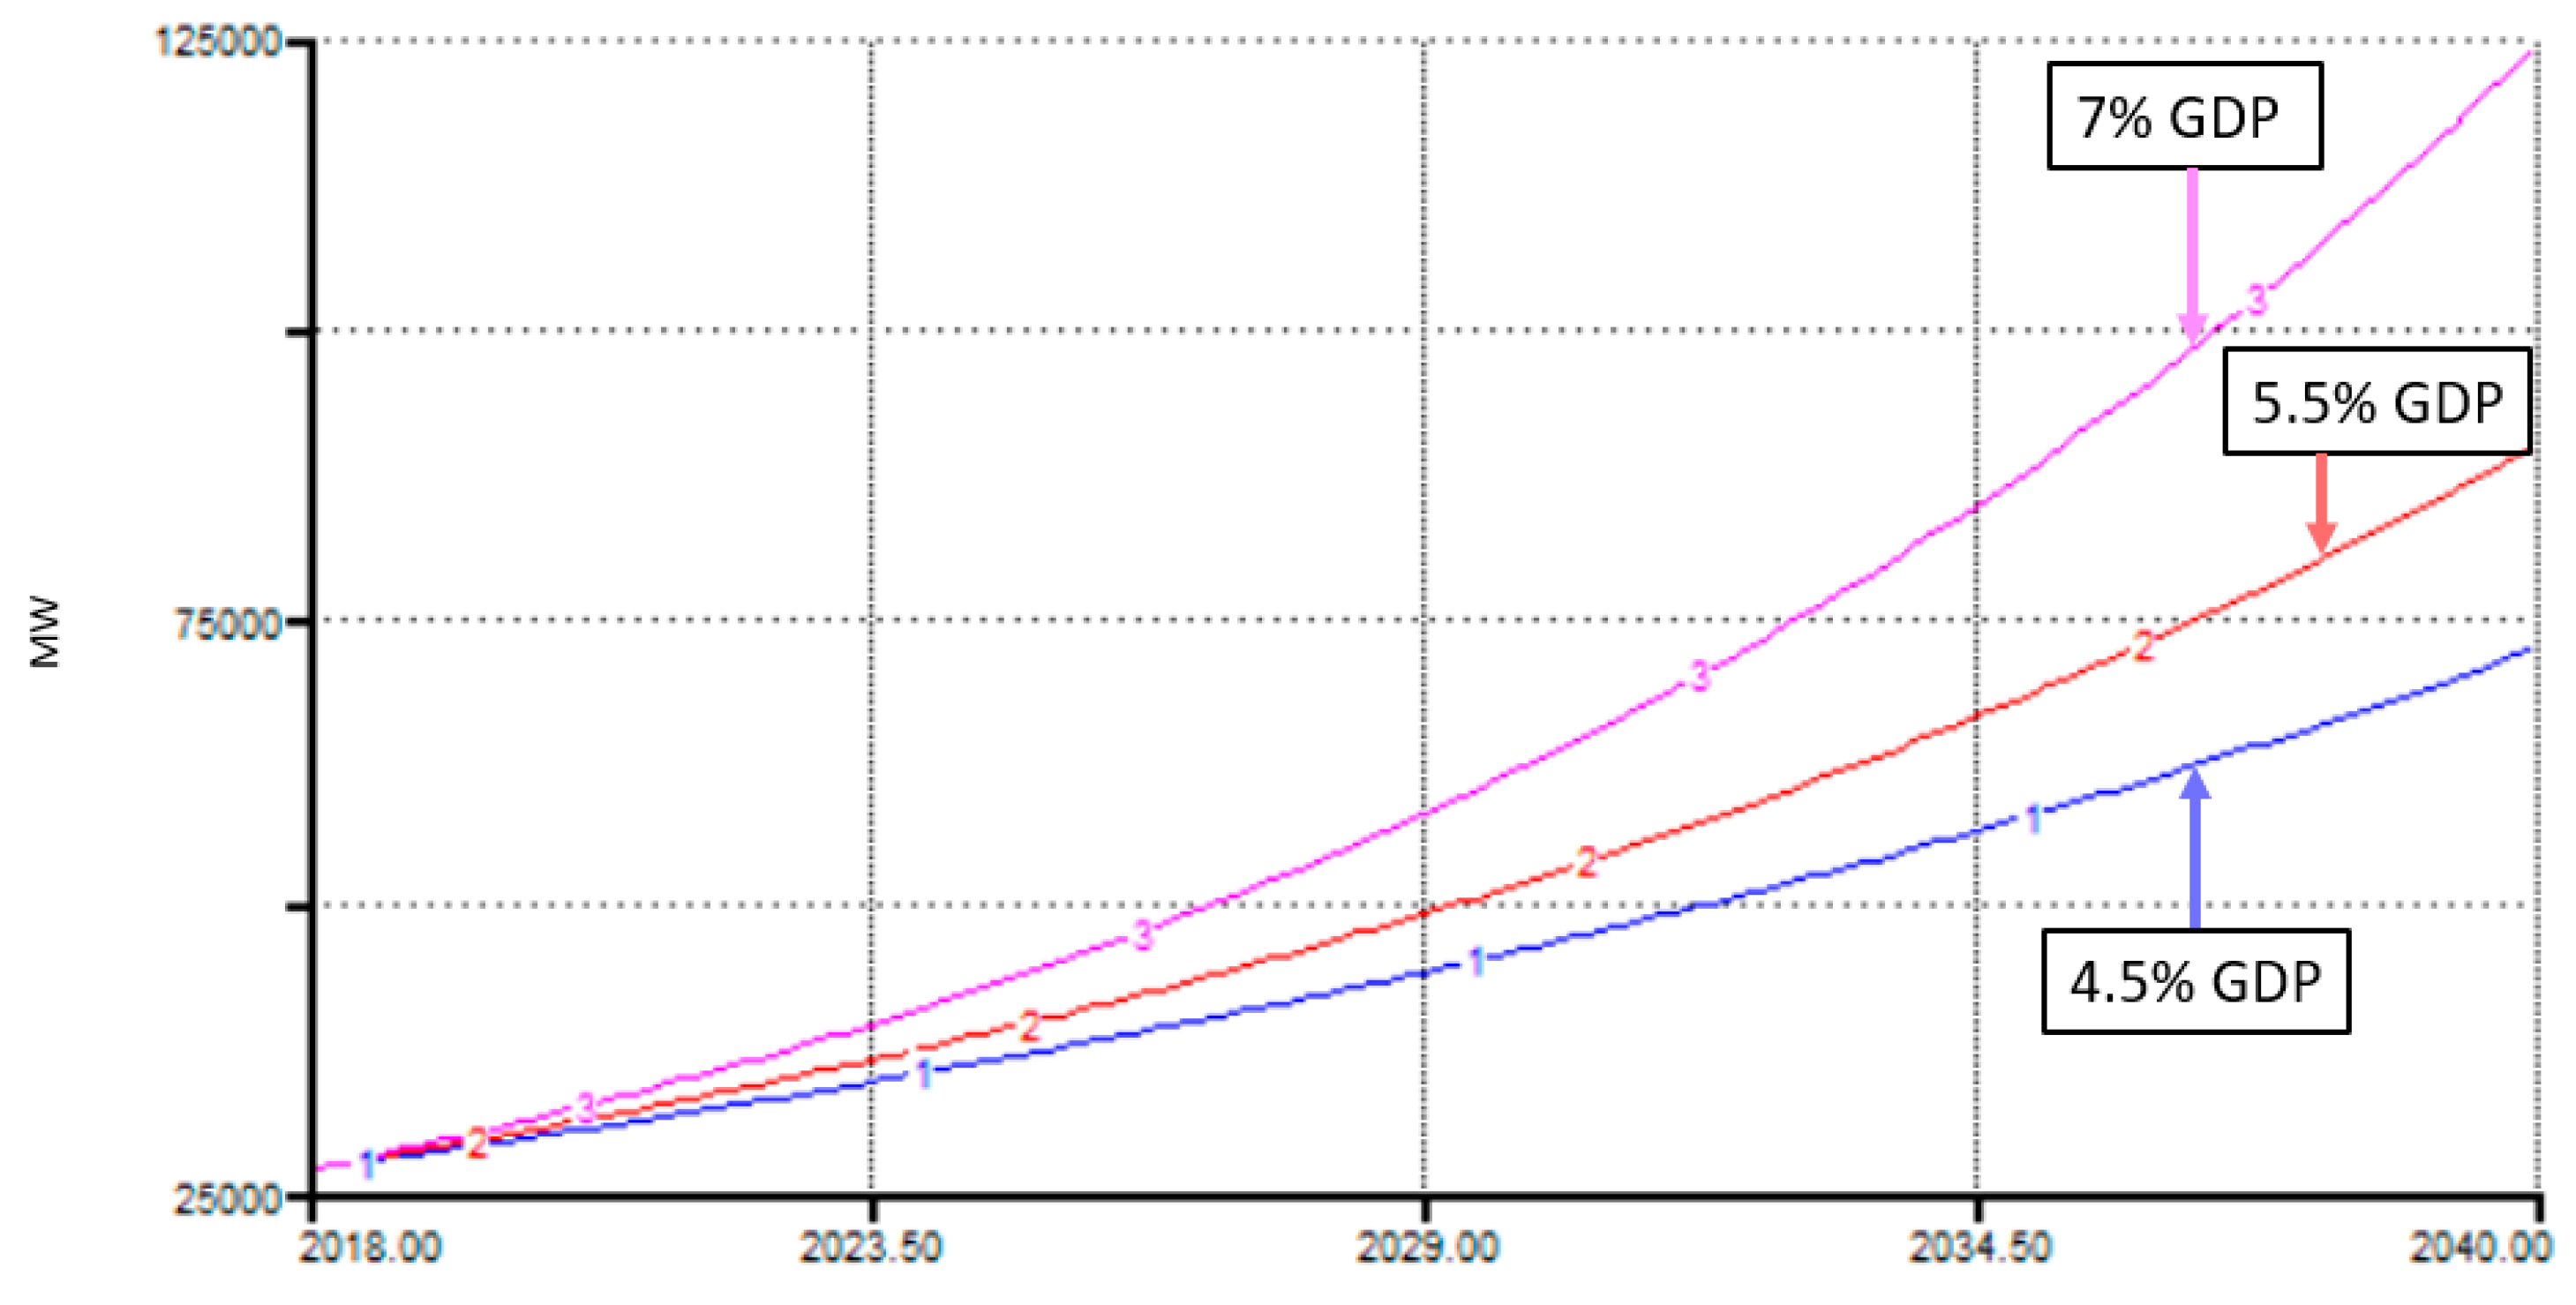
Three different scenarios were simulated based on GDP growth rate, resulting in varying dynamics of overall energy demand in Pakistan, viz. 4.5, 5.5, and 7% GDP growth rate. Cumulative energy demand in Pakistan for GDP growth rate 4.5–7% from 2018 till 2040 is shown in Figure 8.
It may be observed from Figure 8 that for a GDP growth rate of 4.5% the energy demand doubled over approximately 15 years and for a GDP growth rate of 5.5% the energy demand may double in approximately 13 years, while for a 7% GDP growth rate, the energy demand may double in 10 years, as compared to 2018. Furthermore, a comparison of the increasing energy demand for various GDP growth rates as shown in Figure 8 indicates the sensitivity of energy demand associated with GDP growth rates, resulting in significantly different doubling periods.
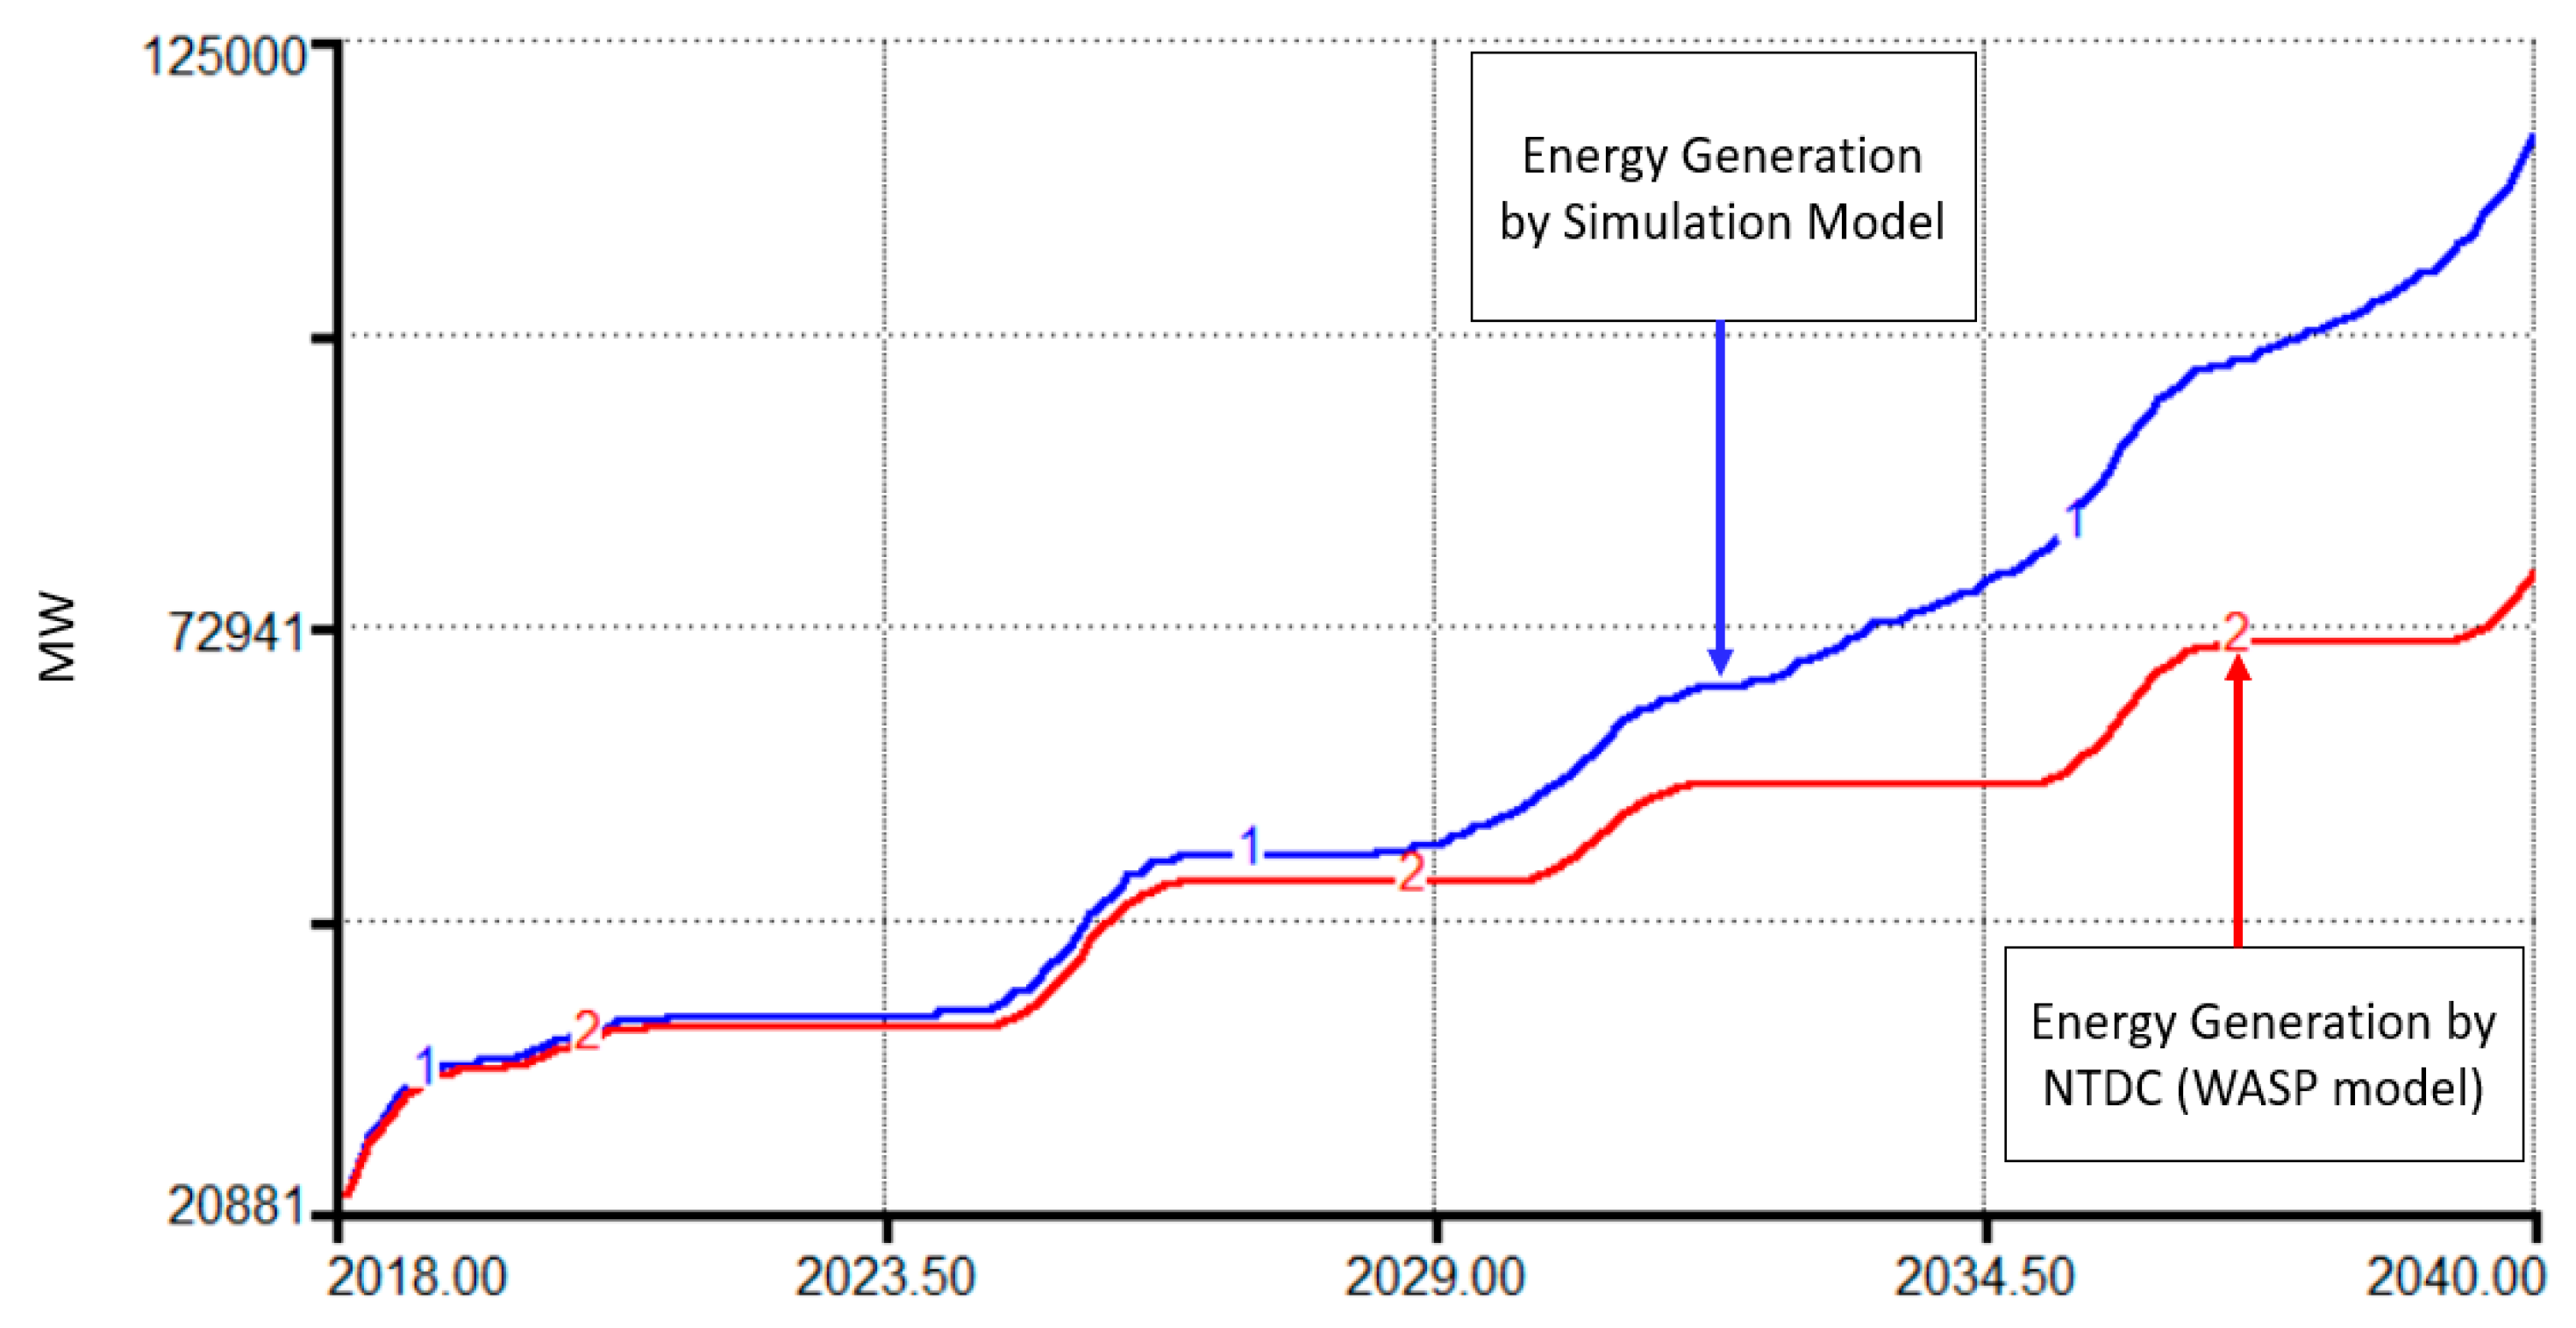
The overall energy generation in Pakistan, as predicted by the simulation model, is shown in Figure 9.
It may be observed from Figure 9, as reported by NTDC, that the overall energy generation in Pakistan is planned to double in approximately 7 years and triple by 2035, as compared to the 2018 value. Our simulation model predicts that the overall energy generation may double in approximately 7 years and triple by 2031. Comparing the energy generation as reported by NTDC with the energy demands associated for various GDP growth rates, it may be observed that a GDP growth rate of 7% cannot be sustained based on the current plans to increase electric power generation in Pakistan. However, a GDP growth rate of 5% may be sustained till 2040. Specifically looking into the electric power generation through coal power plants shown in Figure 10.
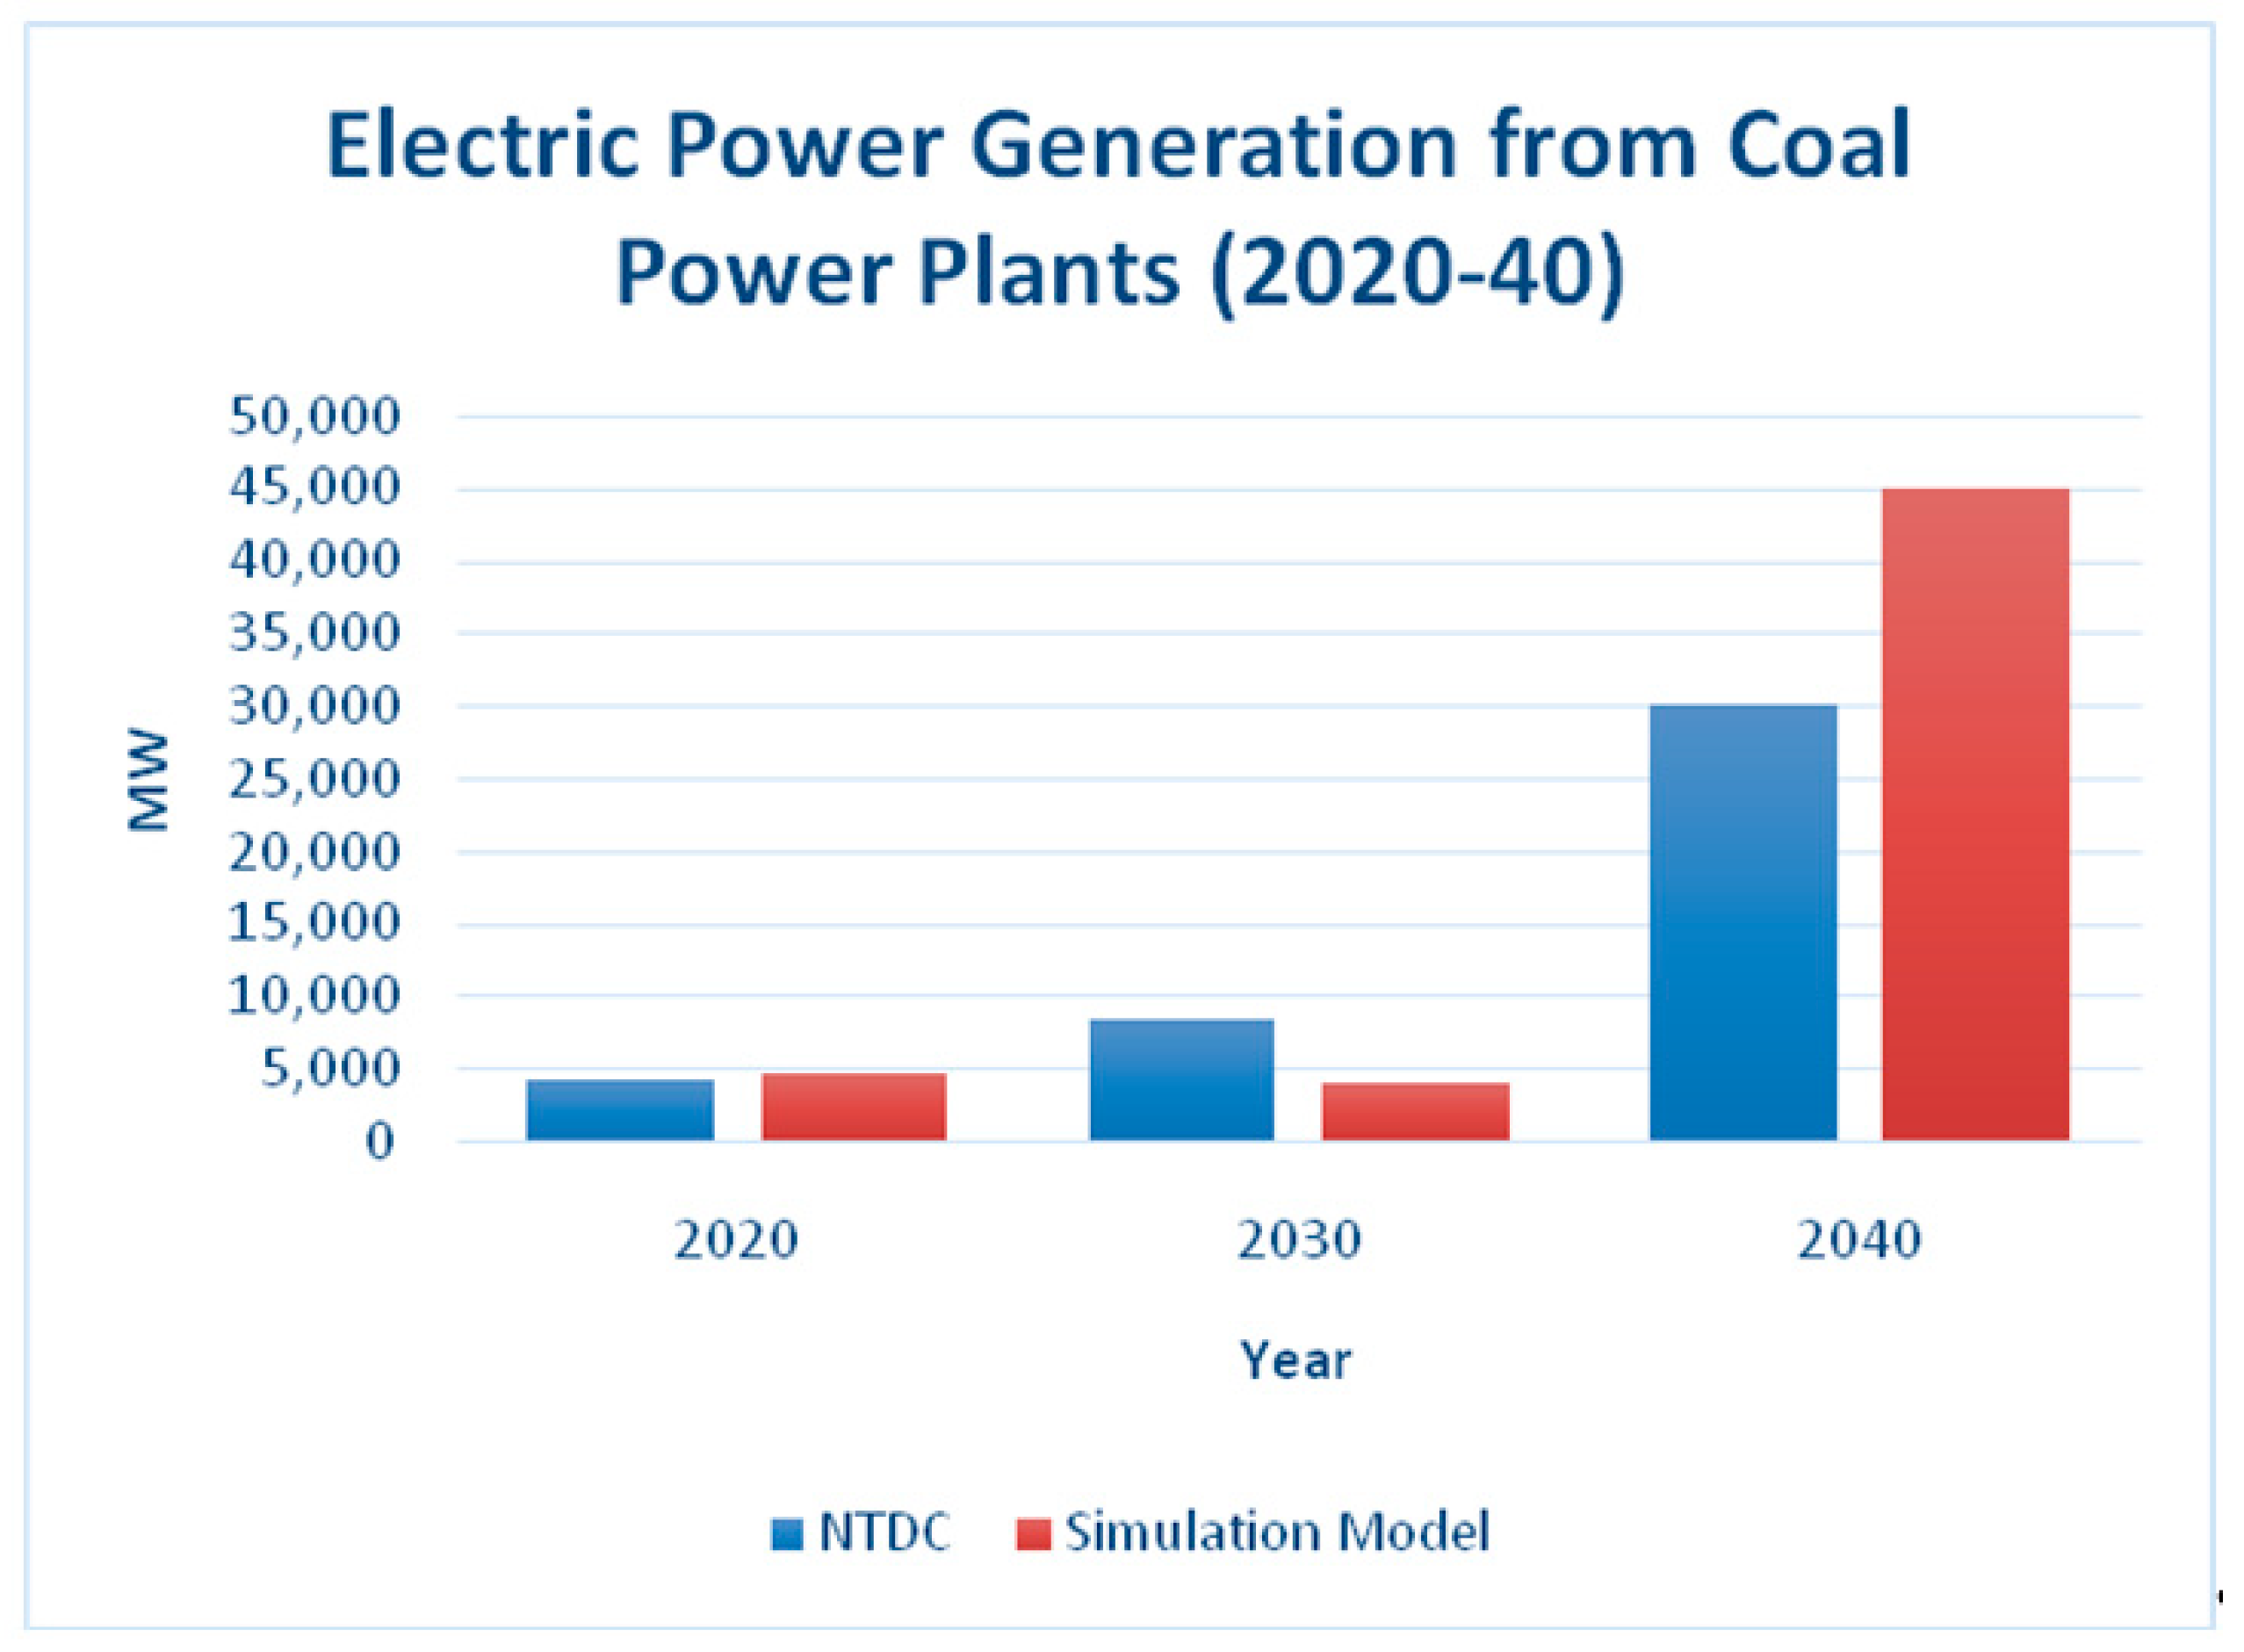
It may be observed from Figure 10 that electric power generation from coal power plants, as forecasted by NTDC, is approximately 8000 MW in 2030 and 30,000 MW in 2040. Our simulation model predicts electric power generation from coal power plants as 4000 MW in 2030 and 45,000 MW in 2040. It may be worthwhile to note here that a non-linear behavior is exhibited by the growth in electric power generation from coal power plants in Pakistan consistent with the systems archetype “fixes that fail”, indicating falling into the vicious cycle of coal.
Moreover, difference between our simulation results and NTDC forecast is attributed to the logic incorporated in our quantitative model to represent system behavior as captured in the causal loop diagram shown in Figure 5. Decision-variables are energy deficit, fund allocation, and time of construction. Amongst the variables, time of construction has an overriding effect in capturing the political mindset in Pakistan, which ubiquitously reflects the archetype quick fixes that fail, as shown in Figure 5. This quick-fix short-term approach erodes the fundamental solution, i.e. hydro power generation to address both short- and long-term energy requirements, as diagnosed earlier in the systems archetype “Shifting the Burden”, as shown in Figure 6. Similarly, an under-investment in hydro power leads to recurring energy deficit which cannot be addressed again by applying the same fundamental solution, hence resorting to quick fix (coal power plants) again, as shown in Figure 7.
6. Conclusions
In this paper, qualitative analysis of electric power generation in Pakistan was carried out by using a causal loop diagram, then system behavior was diagnosed using three systems archetypes, viz. fixes that fail, shifting the burden, growth and under-investment. Based on the causal loop diagram, a quantitative model was developed, mapping different endogenous, exogenous variables, time delays, and feedbacks in order to validate the system behavior and investigate dynamics. It was observed that the increase in energy demand is sensitive to GDP growth rate and requires timely actions in the form of investment in power plants. Hence, the system is compelled into the vicious cycle of coal based on short-term solutions. This quick fix of using coal power plants to fulfill energy needs, i.e., fixes that fail, diverts the attention from a fundamental solution such as hydro power generation. Simulation results indicate that a GDP growth rate of 7%, as targeted in Vision 2025, may not be sustained through the current plans to increase electric power generation in Pakistan.
Author Contributions
Conceptualization and supervision, I.A.K.; Supervision and writing—review and editing M.I.A.; Formal analysis, investigation, and writing—original draft, A.A.D. All authors have read and agreed to the published version of the manuscript.
Funding
This research received no external funding.
Institutional Review Board Statement
Not applicable.
Informed Consent Statement
Not applicable.
Data Availability Statement
Not applicable.
Conflicts of Interest
The authors declare no conflict of interest.
References
- Mahmood, A.; Javaid, N.; Zafar, A.; Ali Riaz, R.; Ahmed, S.; Razzaq, S. Pakistan’s overall energy potential assessment, comparison of LNG, TAPI and IPI gas projects. Renew. Sustain. Energy Rev. 2014, 31, 182–193. [Google Scholar] [CrossRef]
- Zou, C.; Zhao, Q.; Zhang, G.; Xiong, B. Energy revolution: From a fossil energy era to a new energy era. Nat. Gas Ind. B. 2016, 3, 1–11. [Google Scholar] [CrossRef] [Green Version]
- Tryggestad, C.; Sharma, N.; Rolser, O.; Smeets, B.; van de Staaij, J. Global Energy Perspective 2019: Reference Case. January 2019. Available online: https://www.mckinsey.com/ (accessed on 15 June 2021).
- International Energy Agency (IEA). World Gross Electricity Production, by Source. 2018. Available online: https://www.iea.org/data-and-statistics/charts/world-gross-electricity-production-by-source-2018 (accessed on 27 April 2021).
- Qureshi, K. Role of advanced nuclear reactor technologies in meeting the growing energy demands. In Proceedings of the 2015 Power Generation Systems and Renewable Energy Technologies, PGSRET 2015, Islamabad, Pakistan, 10–11 June 2015. [Google Scholar] [CrossRef]
- Geist, E.M. What Three Mile Island, Chernobyl, and Fukushima Can Teach about the Next One. 28 April 2014. Available online: https://thebulletin.org/2014/04/what-three-mile-island-chernobyl-and-fukushima-can-teach-about-the-next-one/ (accessed on 29 April 2021).
- Goldsmith, C. Nuclear Power Continues Its Decline As Renewable Alternatives Steam Ahead. 15 October 2018. Available online: https//www.worldfinance.com/markets/nuclear-power-continues-its-decline-as-renewable-alternatives-steam-ahead (accessed on 29 April 2021).
- Korhola, E.-R. The Rise and Fall of the Kyoto Protocol: Climate Change As a Political Process. Ph.D. Thesis, Faculty of Biological and Environmental Sciences of The University of Helsinki, Helsinki, Finland, 2014. [Google Scholar]
- Government of Pakistan (GoP). Pakistan Intended Nationally Determined Contribution (Pak-INDC). Pakistan. 2016. Available online: https://www4.unfccc.int/sites/ndcstaging/PublishedDocuments/Pakistan%20First/Pak-INDC.pdf (accessed on 16 June 2021).
- United Nations. United NationsClimate Change Annuual Report 2018. 2019. Available online: https://unfccc.int/sites/default/files/resource/UN-Climate-Change-Annual-Report-2018.pdf (accessed on 16 June 2021).
- Rafael, R. De Summary of COP 25: What Now for the Climate? 18 December 2021. Available online: https://eco-act.com/climate-change/summary-of-cop-25/ (accessed on 16 June 2021).
- Power Systems Planning. Indicative Generation Capacity Expansion Plan (2018-40). 2019. Available online: https://nepra.org.pk/Admission%20Notices/2019/09-September/IGCEP%20Plan%20(2018-40).pdf (accessed on 16 June 2021).
- Akhtar, J.; Yaqub, M.I.; Iqbal, J.; Sheikh, N. Way forward in meeting energy challenges in Pakistan Way forward in meeting energy challenges in Pakistan. Int. J. Ambient Energy 2017, 39, 904–908. [Google Scholar] [CrossRef]
- Planning Commission. Pakistan Vision 2025 (One Nation-One Vision). 2015. Available online: https://www.pc.gov.pk/uploads/vision2025/Pakistan-Vision-2025.pdf (accessed on 16 June 2021).
- Kanwal, S.; Khan, B.; Rauf, M.Q. Infrastructure of Sustainable Energy Development in Pakistan: A Review. J. Mod. Power Syst. Clean Energy 2020, 8, 206–218. [Google Scholar] [CrossRef]
- Malik, S.; Qasim, M.; Saeed, H.; Chang, Y.; Taghizadeh-Hesary, F. Energy security in Pakistan: Perspectives and policy implications from a quantitative analysis. Energy Policy 2020, 144, 111552. [Google Scholar] [CrossRef]
- Greene, M.T.; Gonzalez, R.; Papalambros, P.Y.; McGowan, A.M. Design Thinking vs. Systems Thinking for Engineering Design: What’s the Difference? In Proceedings of the 21st International Conference on Engineering Design, Vancouver, BC, Canada, 21–25 August 2017. [Google Scholar]
- Arnold, R.D.; Wade, J.P. A definition of systems thinking: A systems approach. Procedia Comput. Sci. 2015, 44, 669–678. [Google Scholar] [CrossRef] [Green Version]
- Capra, F. Criteria of systems thinking. Futures 1985, 17, 475–478. [Google Scholar] [CrossRef]
- Energy Efficiency & Conservation Authority(EECA). Systems Thinking A New Approach to Minimum Energy Performance Standards. April 2020. Available online: https://www.eeca.govt.nz/assets/EECA-Resources/Research-papers-guides/Systems-thinking_A-new-approach-to-minimum-energy-performance-standards.pdf (accessed on 16 June 2021).
- Qudrat-Ullah, H. Modelling and Simulation in Service of Energy Policy. Energy Procedia 2015, 75, 2819–2825. [Google Scholar] [CrossRef] [Green Version]
- Khansari, N.; Darabi, H.R.; Mansouri, M.; Mostashari, A. Case study of energy behavior: Systems thinking approach. In Proceedings of the 2015 Annual IEEE Systems Conference (SysCon) Proceedings, Vancouver, BC, Canada, 13–16 April 2015; pp. 373–376. [Google Scholar] [CrossRef]
- Robertson Munro, F.; Cairney, P. A systematic review of energy systems: The role of policymaking in sustainable transitions. Renew. Sustain. Energy Rev. 2020, 119, 109598. [Google Scholar] [CrossRef]
- Taylor, P.; Chia, E.S.; Lim, C.K.; Ng, A.; Hoang, N.; Nguyen, L. The System Dynamics of Nuclear Energy in Singapore The System Dynamics of Nuclear Energy in Singapore. Int. J. Green Energy 2015, 12, 73–86. [Google Scholar] [CrossRef]
- Ekins, P. Step changes for decarbonising the energy system: Research needs for renewables, energy efficiency and nuclear power. Energy Policy 2004, 32, 1891–1904. [Google Scholar] [CrossRef]
- Aslani, A.; Helo, P.; Naaranoja, M. Role of renewable energy policies in energy dependency in Finland: System dynamics approach. Appl. Energy 2014, 113, 758–765. [Google Scholar] [CrossRef]
- Musango, J.; Bassi, A.; Brent, A. South African Energy Model: A System Dynamics Approach. In Proceedings of the 27th International Conference of the System Dynamics Society, Albuquerque, NM, USA, 26–31 July 2009; pp. 1–32. [Google Scholar]
- Woo, T.H. Effects Safety Assessment for Power Uprate in the Nuclear Power Plant Using a System Dynamics (SD) Method by Monte Carlo Software. Energy Sources Part A Recovery Util. Environ. 2015, 37, 649–654. [Google Scholar] [CrossRef]
- Qudrat-Ullah, H.; Davidsen, P.I. Understanding the dynamics of electricity supply, resources and pollution: Pakistan’s case. Energy 2001, 26, 595–606. [Google Scholar] [CrossRef]
- Ur Rehman, S.A.; Cai, Y.; Mirjat, N.H.; Das Walasai, G.; Shah, I.A.; Ali, S. The future of sustainable energy production in Pakistan: A system dynamics-based approach for estimating hubbert peaks. Energies 2017, 10, 1858. [Google Scholar] [CrossRef] [Green Version]
- Ford, A. Modeling the Environment: An Introduction to System Dynamics Models of Environmental Systems; Island Press: Washington, DC, USA, 1999. [Google Scholar]
- Bala, B.K.; Arshad, F.M.; Noh, K.M. System Dynamics (Modeling Simulation); Springer: Singapore, 2017; ISBN 978-981-10-2043-8. [Google Scholar]
- Asian Development Bank (ADB). Asian Development Outlook 2018 (How Technology Affects Jobs). 2018. Available online: https://www.adb.org/sites/default/files/publication/411666/ado2018.pdf (accessed on 16 June 2021).
- Mumtaz, M. The National Climate Change Policy of Pakistan: An Evaluation of Its Impact on Institutional Change. Earth Syst. Environ. 2018, 2, 525–535. [Google Scholar] [CrossRef]
- Ministry of Climate Change, Government of Pakistan. Pakistan Climate Change Act 2017. 2017. Available online: https://policy.asiapacificenergy.org/sites/default/files/Pakistan%20Climate%20Change%20Act%2C%202017.pdf (accessed on 16 June 2021).
- Ministry of Environment, Government of Pakistan. National Environmental Policy 2005. Available online: https://mowr.gov.pk/wp-content/uploads/2018/05/National-Environmental-Policy-2005.pdf (accessed on 16 June 2021).
- Government of Pakistan. Pakistan Environmental Protection Act. 1997. Available online: http://www.na.gov.pk/uploads/documents/Pakistan=Environmental-Protection-Act-1997.pdf (accessed on 16 June 2021).
- Government of Pakistan, Ministry of Planning, Development & Reform. National Action Plans; Government of Pakistan: Islamabad, Pakistan, 2019.
- Eckstein, D.; Künzel, V.; Schäfer, L. Global Climate Risk Index 2021. 2021. Available online: https://germanwatch.org/sites/default/files/Global%20Climate%20Risk%20Index%202021_1.pdf (accessed on 16 June 2021).
- Planning Commission, Government of Pakistan. Task Force on Climate Change Final Report. February 2010. Available online: http://www.gcisc.org.pk/TFCC%20Final%20Report.pdf (accessed on 16 June 2021).
- Sterman, J.D. Business Dynamics: Systems Thinking and Modeling for a Complex World; McGraw-Hill Higher Education: Boston, MA, USA, 2000. [Google Scholar]
- Mirjat, N.H.; Uqaili, M.A.; Harijan, K.; Valasai, G.D.; Shaikh, F.; Waris, M. A review of energy and power planning and policies of Pakistan. Renew. Sustain. Energy Rev. 2017, 79, 110–127. [Google Scholar] [CrossRef] [Green Version]
- Mirjat, N.H.; Uqaili, M.A.; Harijan, K.; Mustafa, M.W.; Rahman, M.M.; Khan, M.W.A. Multi-criteria analysis of electricity generation scenarios for sustainable energy planning in Pakistan. Energies 2018, 11, 757. [Google Scholar] [CrossRef] [Green Version]
- Sheikh, M.A. Renewable energy resource potential in Pakistan. Renew. Sustain. Energy Rev. 2009, 13, 2696–2702. [Google Scholar] [CrossRef]
- Malkani, M.S. A review of coal and water resources of Pakistan. Sci. Technol. Dev. 2015, 3, 202–218. [Google Scholar]
- Javaid, M.A.; Hussain, S.; Arshad, Z.; Arshad, M.; Idrees, M. Electrical Energy Crisis in Pakistan and Their Possible Solutions. Int. J. Basic Appl. Sci. 2011, 11, 5–38. [Google Scholar]
- Alkon, M.; He, X.; Paris, A.R.; Liao, W.; Hodson, T.; Wanders, N.; Wang, Y. Water security implications of coal-fired power plants financed through China’s Belt and Road Initiative. Energy Policy 2019, 132, 1101–1109. [Google Scholar] [CrossRef]
- Alternative Energy Development Board. Data Collection Survey on Renewable Energy Development in Pakistan. January 2013. Available online: https://openjicareport.jica.go.jp/pdf/12086740_01.pdf (accessed on 15 June 2021).
- Batool, A.; Abbas, F. Reasons for delay in selected hydro-power projects in Khyber Pakhtunkhwa (KPK), Pakistan. Renew. Sustain. Energy Rev. 2017, 73, 196–204. [Google Scholar] [CrossRef]
- Rauf, O.; Wang, S.; Yuan, P.; Tan, J. An overview of energy status and development in Pakistan. Renew. Sustain. Energy Rev. 2015, 48, 892–931. [Google Scholar] [CrossRef]
- Kim, D.H.; Anderson, V. Systems Archetypes Basics: From Story to Structure; Pegasus Communications, Inc.: Waltham, MA, USA, 2011. [Google Scholar]
- Durrani, A.A. Dynamics of Increasing Share of Nuclear Energy in Energy Sector of Pakistan. Master’s Thesis, University of Engineering and Technology, Peshawar, Pakistan, 2020. [Google Scholar]
- AQPER. Available online: https://www.aqper.com/en/how-long-does-it-take-to-build-a-hydroelectric-power-station (accessed on 5 May 2021).
- Akber, M.Z.; Thaheem, M.J.; Arshad, H. Life cycle sustainability assessment of electricity generation in Pakistan: Policy regime for a sustainable energy mix. Energy Policy 2017, 111, 111–126. [Google Scholar] [CrossRef]
- Finance Division, Government of Pakistan. Federal Budget in Brief 2018-19. 2018. Available online: https://www.finance.gov.pk/fb_2018_19.html (accessed on 16 June 2021).
- Finance Division, Government of Pakistan. Federal Budget in Brief 2016-17. 2016. Available online: https://www.finance.gov.pk/fb_2016_17.html (accessed on 16 June 2021).
Figure 1.
World gross electricity generation by source, 2018 [4].
Figure 1.
World gross electricity generation by source, 2018 [4].

Figure 2.
Energy mix of Pakistan in 2020 [12].
Figure 2.
Energy mix of Pakistan in 2020 [12].

Figure 3.
Bull’s Eye diagram of energy mix of Pakistan.

Figure 4.
Causal loop diagram of electric power generation of Pakistan.

Figure 5.
(A) Generic causal loop diagram of fixes that fail. (B) Nested causal loop diagram of fixes that fail. (C) Causal loop diagram of fixes that fail in electric power generation of Pakistan.
Figure 5.
(A) Generic causal loop diagram of fixes that fail. (B) Nested causal loop diagram of fixes that fail. (C) Causal loop diagram of fixes that fail in electric power generation of Pakistan.

Figure 6.
(A) Generic causal loop diagram of shifting the burden. (B) Causal loop diagram of shifting the burden in electric power generation in Pakistan.
Figure 6.
(A) Generic causal loop diagram of shifting the burden. (B) Causal loop diagram of shifting the burden in electric power generation in Pakistan.

Figure 7.
(A) Generic causal loop diagram of growth and under-investment. (B) Causal loop diagram of growth and under-investment in electric power generation in Pakistan.
Figure 7.
(A) Generic causal loop diagram of growth and under-investment. (B) Causal loop diagram of growth and under-investment in electric power generation in Pakistan.

Figure 8.
Cumulative energy demand (CED) in Pakistan forecasted at 4.5, 5.5 and 7% GDP Growth Rate.

Figure 9.
Increase in energy generation (2018–2040).

Figure 10.
Electric power generation from coal power plants (2020–2040).


Table 1.
Key parameters and assumptions for the simulation.
| S.No. | Parameters/Assumptions | Coal (CPPs) | Hydro (HPPs) | Nuclear (NPPs) | Ref. Source |
|---|---|---|---|---|---|
| 1 | Capacity Factor | 70% | 50% | 80% | [12] |
| 2 | Construction time | 3 years | 7 years 1 | 7 years | [12,53] |
| 3 | Plant Capacities | 660 MW | 1240 MW 2 | 1100 MW | [12] |
| 4 | Plant life | 30 years | 150 years | 40 years | [54] |
| 5 | T&D losses | 20% | [54] | ||
| 6 | Initial Budget 3 | 1650BPKR | [55] | ||
| 7 | Fund Increase Rate 4 | 20%(Est) | [55,56] | ||
NOTE: 1 Assumed construction time for hydro power plants based on durations reported. 2 Assumed hydro power to have an average of 1240MW based on literature. 3 The value for initial budget is taken from the Public Sector Development Program for 2018–2019. 4 Federal Budget Reports (2008–2018).
Publisher’s Note: MDPI stays neutral with regard to jurisdictional claims in published maps and institutional affiliations. |
© 2021 by the authors. Licensee MDPI, Basel, Switzerland. This article is an open access article distributed under the terms and conditions of the Creative Commons Attribution (CC BY) license (https://creativecommons.org/licenses/by/4.0/).
Share and Cite
MDPI and ACS Style
Durrani, A.A.; Khan, I.A.; Ahmad, M.I. Analysis of Electric Power Generation Growth in Pakistan: Falling into the Vicious Cycle of Coal. Eng 2021, 2, 296-311. https://0-doi-org.brum.beds.ac.uk/10.3390/eng2030019
AMA Style
Durrani AA, Khan IA, Ahmad MI. Analysis of Electric Power Generation Growth in Pakistan: Falling into the Vicious Cycle of Coal. Eng. 2021; 2(3):296-311. https://0-doi-org.brum.beds.ac.uk/10.3390/eng2030019
Chicago/Turabian StyleDurrani, Ali Ahmed, Irfan Ahmed Khan, and Muhammad Imran Ahmad. 2021. "Analysis of Electric Power Generation Growth in Pakistan: Falling into the Vicious Cycle of Coal" Eng 2, no. 3: 296-311. https://0-doi-org.brum.beds.ac.uk/10.3390/eng2030019