Nervous Activity of the Brain in Five Dimensions
by
 , and
, and
Arturo Tozzi
1,* ,
,
James F. Peters
2,3, 
Norbert Jausovec
4,
Arjuna P. H. Don
5,
Sheela Ramanna
6,
Irina Legchenkova
7 and
and
Edward Bormashenko
7
1
Center for Nonlinear Science, Department of Physics, University of North Texas, Denton, TX 76203, USA
2
Department of Electrical and Computer Engineering, University of Manitoba, 75A Chancellor’s Circle, Winnipeg, MB R3T 5V6, Canada
3
Department of Mathematics, Faculty of Arts and Sciences, Adıyaman University, 02040 Adıyaman, Turkey
4
Ruperce 46, 2229 Malecnik, Slovenia
5
Computational Intelligence Laboratory, University of Manitoba, Winnipeg, MB R3T 2N2, Canada
6
Applied Computer Science, University of Winnipeg, Winnipeg, MB R3B 2E9, Canada
7
Chemical Engineering Department, Engineering Faculty, Ariel University, P.O. Box 3, Ariel 407000, Israel
*
Author to whom correspondence should be addressed.
Biophysica 2021, 1(1), 38-47; https://0-doi-org.brum.beds.ac.uk/10.3390/biophysica1010004
Submission received: 11 January 2021
/
Revised: 9 February 2021
/
Accepted: 18 February 2021
/
Published: 22 February 2021
Abstract
:The nervous activity of the brain takes place in higher-dimensional functional spaces. It has been proposed that the brain might be equipped with phase spaces characterized by four spatial dimensions plus time, instead of the classical three plus time. This suggests that global visualization methods for exploiting four-dimensional maps of three-dimensional experimental data sets might be used in neuroscience. We asked whether it is feasible to describe the four-dimensional trajectories (plus time) of two-dimensional (plus time) electroencephalographic traces (EEG). We made use of quaternion orthographic projections to map to the surface of four-dimensional hyperspheres EEG signal patches treated with Fourier analysis. Once achieved the proper quaternion maps, we show that this multi-dimensional procedure brings undoubted benefits. The treatment of EEG traces with Fourier analysis allows the investigation the scale-free activity of the brain in terms of trajectories on hyperspheres and quaternionic networks. Repetitive spatial and temporal patterns undetectable in three dimensions (plus time) are easily enlightened in four dimensions (plus time). Further, a quaternionic approach makes it feasible to identify spatially far apart and temporally distant periodic trajectories with the same features, such as, e.g., the same oscillatory frequency or amplitude. This leads to an incisive operational assessment of global or broken symmetries, domains of attraction inside three-dimensional projections and matching descriptions between the apparently random paths hidden in the very structure of nervous fractal signals.
1. Introduction
The activity of the nervous system takes place in dimensions higher than the conventional spatial three plus time. This counterintuitive claim has been put forward in terms of multidimensional approaches such as simplicial complexes encompassing synaptic connections [1], neural codes for navigating cognition [2], and rhythm and synchrony in cortical network models [3]. For a review, see Tozzi [4]. Karl Friston [5] highlighted how “invariances or symmetries afforded by projections onto high dimensional spaces... may not reveal themselves through local scrutiny of the surface data acquired from the brain in action, but may require…” the use of high-dimensional manifolds. Higher-dimensional nervous trajectories have been located in phase spaces consisting of genus-zero hypersphere S3 or genus-one Clifford torus [6]. It has been suggested that brain functions such as mind-wandering and memory retrieval could be explained by the functional occurrence of imperceptible further spatial dimensions [7]. Here we ask, starting from the standard neurodata available in three dimensions plus time, does there exist an operational procedure to assess the corresponding four-dimensional trajectories? Is it feasible to assess in higher dimensions the three-dimensional paths detected during customary data collection? We describe here a viable option, i.e., the projection of three-dimensional data achieved from real experimental series to a four-dimensional hypersphere. In particular, we aim to map electroencephalographic (EEG) oscillations to an S3 hypersphere or, in other words, to achieve orthographic projections of brain signal patches via quaternions.
The development of quaternions, first proposed by Hamilton [8], has been quite slow, due to the painstaking issue of the non-commutativity of quaternion multiplicity [9]. In recent years, technical improvements to avoid non-commutativity have made quaternions feasible to explore quantum mechanics, attitude control, computer graphics, and robust image hashing [10,11]. Quaternions have been also useful in neural network research and modeling patterns of EEG signals. Quaternion-based signal analysis techniques have been used to extract features related to motor imagery in various mental states, granting signals classification in decision trees, in support vector machine and in k-nearest neighbor techniques [12]. Li and Wang [13] assessed drive-response synchronization for quaternion-valued shunting inhibitory cellular neural networks with mixed delays: the occurrence of almost periodic solutions, achieved through the Banach fixed point theorem, led to novel state-feedback controllers that ensured global exponential synchronization. The last, but not the least, a novel quaternion-valued singular spectrum analysis for EEG multichannel analysis has been introduced to solve the excruciating problem of noise in extracted sources [14]. In this paper, we explore the possibility to use global visualization methods for exploiting quaternion maps of EEG traces. We describe how a quaternionic description of brain activity provides many operational benefits apart from the assessment of the multidimensional brain activity. We describe how these operational benefits greatly improve the extraction of useful information from neurodata.
2. Materials and Methods
We provided a methodological effort to map two- and three-dimensional EEG oscillations extracted from real neurodata to four-dimensional S3 hyperspheres. We used four-dimensional quaternions to represent orthographic projections of brain signals’ images onto the manageable surface of a three-dimensional sphere.
2.1. EEG Traces
We analyzed EEG traces of subjects at rest. EEG was recorded using a Quick-Cap with sintered (silver/silver chloride; 8 mm diameter) electrodes. Using the Ten-twenty Electrode Placement System of the International Federation, the EEG activity was monitored over 19 scalp locations (Fp1, Fp2, F3, F4, F7, F8, T3, T4, T5, T6, C3, C4, P3, P4, O1, O2, Fz, Cz, and Pz). ll leads were referenced to linked mastoids (A1 and A2), and a ground electrode was applied to the forehead. Additionally, vertical eye movements were recorded with electrodes placed above and below the left eye. The digital EEG data acquisition and analysis system (SynAmps) had a bandpass of 0.15–100.0 Hz. At cutoff frequencies, the voltage gain was approximately −6 dB. The 19 EEG traces were digitized online at 1000 Hz with a gain of 1000 (resolution of 084 μV/bit in a 16 bit A to D conversion) and stored on a hard disk. Epochs were automatically screened for artifacts. All epochs showing amplitudes above ±50 microV (less than 3%) were excluded, to avoid that the traces could be artifacts of the visualizing algorithm while plotting the EEG power maps. The EEG study was done according with Declaration of Helsinki and was approved by the Ethics Committee of the University of Maribor, Slovenia.
The traces assessed in this study were extracted from three scalp areas, corresponding to the central electrodes Cz, Fz, and Pz. We choose these vertex locations because they are known to display the lowest occurrence of extra-cerebral artifacts.
2.2. Quaternion Maps
A vast assortment of feasible quaternion-driven variants and higher-dimensional visual representation strategies is available, resulting in the technical achievement of very intricate quaternion maps. The two most widely used classes of quaternion visualization are based on: (a) visual geometric context and (b) parallel coordinates [15]. In this paper, we favor the more manageable geometric view. Since the mathematical procedures have been thoroughly described, in this paper, we choose a plain approach for non-technical readers. The website https://quaternions.online/ (accessed on 22 September 2020) provides an introduction to three-dimensional quaternion graphics. See also, for an affordable treatment of quaternions, Hart (2014) [16].
In the EEG trace illustrated in Figure 1A, every single point of the plot (amplitude versus time) can be described by three vectors, each lying on a different spatial coordinate x, y, or z (depicted in Figure 1A as green, red, and blue arrows, respectively). We will term these three vectors “triad.” In the case of the two-dimensional EEG plots, we assume that one of the three coordinates equals zero. Figure 1B illustrates a triad of vectors (standing for a single point of the EEG plot) embedded in a cubic manifold. Further, the quaternion trajectories of a triad of vectors can be depicted as arcs moving inside a three-dimensional spheric frame encompassing the axes x, y, and z (Figure 1C). The movements of the arc are dictated by the constraints of the axis rotation and the Euler angle (Hart, 2014) [16]. All the single triads from EEG traces can be projected to a hyperspheric manifold, either using punctiform (Figure 1D) or uniform orthographic projections.
The multidimensional concept of “n-sphere” is crucial to grasp the concept of quaternions. A n-sphere is a n-dimensional structure embedded in n + 1 spaces termed n + 1 balls [17]. To make an example, a circumference (1-dimensional sphere) surrounds a cd-rom (2-dimensional ball), while a plastic surface (2-dimensional sphere) surrounds a beach ball (3-dimensional ball). A 3-sphere (also called glome or hypersphere) is a 3-dimensional elliptic surface embedded in a 4-dimensional ball. In other words, a glome is an object with positive curvature in a Euclidean 4-dimensional space, formed by all the points at constant distance from a fixed central point [18]. It is noteworthy that three-dimensional data, such as, e.g., different activated cortical areas in fMRI pictures, can be approached in terms of circular trajectories on 3-spheres. The use of hyperspheres in data analysis and data mining displays several advantages, since information extrapolated from three-dimensional manifolds can be visualized by a single mathematical structure, the glome. See Figure 2 for further details.
In more technical terms, a map of a glome equipped with Sp(1) or SU(2) Lie groups can be projected onto a three-dimensional surface [6]. The circular trajectories on the 3-sphere match the compact, simply connected symplectic Lie group Sp(1) equipped with quaternionic 1 × 1 unitary matrices. The 3-sphere is parallelizable as a differentiable manifold, with a principal U(1) bundle over the 2-sphere. The 3-sphere’s Lie group structure is Sp(1), which is equipped with quaternionic 1 × 1 unitary matrices [21]. The symmetries of the quaternionic manifold display a number system like the complex numbers, but with three imaginary quantities, instead of just one Orthographic projections derived from a sphere with center (0,0,0) with unit vectors , express the excess in any shape as an orthographic projection on the surface of a sphere (Tait 1867). We express an arc as DF and an angle on the surface of the sphere the quaternion as , i.e., .
Summarizing, the use of quaternions makes it possible to utilize the spatial coordinates of every point placed inside a three-dimensional plot. The three spatial coordinates become single points, i.e., triads, inside four-dimensional hyperspheres. In the sequel, we will describe how brain signal patches derived from Fourier analysis can be represented geometrically as inputs to quaternions.
2.3. Fourier Analysis
Through Fourier analysis, quaternions provide a cumulative fractal view of multiple brain signals, described in terms of orthogonal projections on the surface of the brain viewed as a sphere. Indeed, it has been demonstrated that a Fourier analysis extracted by raw EEG data is able to describe the scale-free dynamics endowed in nervous oscillations [22,23,24], since cortical electric waves observed at different spatiotemporal scales exhibit a frequency spectrum characterized by scale-invariant behavior and power spectrum [25,26,27].
Fourier analysis was achieved through a designed MATLAB-based software. The frequencies were obtained with resolution of 0.25 Hz (Figure 3A).
Once achieved a three-dimensional counterpart of the two-dimensional brain signal patches treated with Fourier analysis (Figure 3B), we took a step further, i.e., we used three-dimensional fractal quaternionic orthographic projections and mapped the triads in four dimensions.
3. Results
We performed simulations to show how it is feasible to achieve four-dimensional quaternionic projections from the two-dimensional data of the Fourier analysis that depicts the scale-free activity of the brain.
The three-dimensional triads achieved through Fourier analysis (Figure 3B) were projected to a four-dimensional quaternionic manifold, illustrated in terms of orthographic projections in three-dimensional spaces (Figure 3C). These ortographic projections are described by points (triads) on three-dimensional arcs located inside a sphere. Note that the triads with matching description in the three-dimensional plot (e.g., the two identical triads depicted in Figure 3B) converge towards a single triad in the four-dimensional hypersphere. This means that temporally distant three-dimensional trajectories equipped with the same features (say, the same amplitude or the same frequency) come to be superimposed inside the quaternionic map. Therefore, repetitive spatiotemporal patterns undetectable in three dimensions plus time are easily enlightened in four dimensions plus time.
Next, we simulated the temporal progression of Fourier analysis’ EEG scale-free dynamics in four dimensions plus time. Figure 4 portrays models of four-dimensional quaternionic orthographic projections of nervous fractal paths extracted from EEGs’ Fourier analysis. The bumps illustrated in the four-dimensional fractal quaternionic plot (see, e.g., Figure 4D,E) stand for varying brain signal amplitudes crossing the surfaces of the nervous phase spaces.
4. Conclusions
We simulated quaternion orthographic projections of brain signals, using fractal traces from Fourier analysis of EEG plots. The recent, exciting innovations in quaternion-valued neural networks, such as, e.g., the ones suggested by [13,28], pave the way to test an intriguing hypothesis, i.e., the recently proposed claim that the brain activity takes place in multidimensional spaces. It is noteworthy that, apart from the quaternionic maps described in this paper, other methods are available to assess higher dimensional activities of nervous networks. It has been recently suggested that hidden spatial dimensions of nervous activity could be methodologically assessed and quantified in terms of oscillations inside two-dimensional superlattices equipped with quantum Hall effects [29]. The superimposition of waves of different wavelengths gives rise to both (two-dimensional) linear and (four-dimensional) nonlinear dynamics [30,31]. Both the approaches, i.e., quantum Hall effects and quaternion-valued neural networks, would allow the transfer of mathematical/physical issues to the realm of neuroscience in order to: (a) describe the real multidimensional brain dynamics and (b) implement synthetic nervous networks equipped with four spatial dimensions (plus time), instead of the classical three (plus time). A crucial question is still unanswered: apart from the assessment of the multidimensional brain model, may quaternionic maps provide other insights that could be useful to describe the conventional three-dimensional neural dynamics? The answer is positive. Quaternionic mapping stands for a versatile technique that has been widely used in different experimental contexts. To make a few examples, Hanson and Thakur [15] used quaternion to expose global spatial relationships among amino acid residue structures within proteins, allowing them to assess global residue alignment in crystallographic data and statistical orientation properties in nuclear magnetic resonance. The visualizations resulting from quaternion spaces enables comparisons of absolute as well as relative orientations, because it permits, e.g., either to ascertain the stereochemical nature of proteins or to visualize global and local residue orientation properties of nucleic acids.
Importantly, quaternionic views of brain activity lead to a descriptive proximity topological characterization [32] of the activities of different neural functions that are descriptively close. This is made possible by the recent introduction of approximate descriptive proximity [33], which facilitates the computation of the distance between feature vectors used to represent and describe the shapes of brain signal patches. Thanks to the description of a fourth spatial dimension, quaternion-based feature vectors provide a formal basis for the approximate descriptively proximal assessment of the closeness of spatially separated brain activities, either by the same brain or by different brains at different times. A quaternion mapping embodies the full three degree-of-freedom transformation from the three-dimensional identity frame triad to a four-dimensional frame triad. This means that a quaternionic representation is much simpler than the usual representation using a triple of orthogonal three-dimensional vectors [15]. The three spatial coordinates of every point inside a three-dimensional plot become a single point inside a four-dimensional hypersphere. In particular, the points located close to each other on the hypersphere’s surface (although temporally distant) display similar coordinates in three dimensions: in other words, these points are equipped with matching description. This allows quaternions to naturally expose global similarities among spatially far apart residues in a protein complex, no matter how near or how distant, extending the analysis to far between components of multi-part structures [15]. Quaternion mappings onto a hypersphere disclose properties of the dynamic systems’ spatial orientation, making easier to detects hidden features such as global or broken symmetries, zones of speed convergence, domains of attraction inside three-dimensional projections, convergence among apparently random paths [28]. Therefore, quaternions provide an alternative methodology to the widely diffused methods of time-lagged mutual information and autocorrelation functions that have been used to evaluate the periodic features of the continuous EEG signal [34,35]. The last, but not the least, an intriguing hypothesis can be raised: as well as Fruchart et al. [36] investigated hidden non-commutative dualities (i.e., mathematical mappings that reveal links between apparently unrelated systems) in twisted kagome lattices, quaternionic movements could be used to detect neural responses not predicted by standard symmetry analysis. This would allow the assessment of self-dualities in brain dynamics, which are dictated by non-commuting responses.
In sum, mapping EEG oscillations to an S3 hypersphere is accomplished with orthographic projections of vectors inherent in brain signal patches via quaternions; this relatively straightforward approach leads to the possibility to enlighten hidden symmetries, in particular, in nervous neurodata.
Author Contributions
All the Authors had full access to all the data in the study and take responsibility for the integrity of the data and the accuracy of the data analysis. All the Authors equally contributed to: study concept and design, acquisition of data, analysis and interpretation of data, drafting of the manuscript, critical revision of the manuscript for important intellectual content, statistical analysis, obtained funding, administrative, technical, and material support, study supervision. All authors have read and agreed to the published version of the manuscript.
Funding
This research received no external funding.
Conflicts of Interest
The authors declare no conflict of interest.
References
- Reimann, M.W.; Nolte, M.; Scolamiero, M.; Turner, K.; Perin, R.; Chindemi, G.; Dłotko, P.; Levi, R.; Hess, K.; Markram, H. Cliques of Neurons Bound into Cavities Provide a Missing Link between Structure and Function. Front. Comput. Neurosci. 2017, 11, 48. [Google Scholar] [CrossRef] [Green Version]
- Bellmund, J.L.S.; Gardenfors, P.; Moser, E.I.; Doeller, C.F. Navigating cognition: Spatial codes for human thinking. Science 2018, 362, eeat6766. [Google Scholar] [CrossRef] [Green Version]
- Chariker, L.; Shapley, R.; Young, L.-S. Rhythm and Synchrony in a Cortical Network Model. J. Neurosci. 2018, 38, 8621–8634. [Google Scholar] [CrossRef] [Green Version]
- Tozzi, A. The multidimensional brain. Phys. Life Rev. 2019, 31, 86–103. [Google Scholar] [CrossRef] [PubMed]
- Friston, K. The Emperor’s new topology: Comment on “Topodynamics of metastable brains” by Arturo Tozzi et al. Phys. Life Rev. 2017, 21, 26–28. [Google Scholar] [CrossRef]
- Tozzi, A.; Peters, J.F. Towards a Fourth Spatial Dimension of Brain Activity. Cogn. Neurodyn. 2016, 10, 189–199. [Google Scholar] [CrossRef] [PubMed]
- Peters, J.F.; Ramanna, S.; Tozzi, A.; İnan, E. Bold-Independent Computational Entropy Assesses Functional Donut-Like Structures in Brain fMRI Images. Front. Hum. Neurosci. 2017, 11, 38. [Google Scholar] [CrossRef] [Green Version]
- Hamilton, W.R. On Quaternions; or on a new System of Imaginaries in Algebra (letter to John T. Graves). Philos. Mag. 1844, 25, 489–495. [Google Scholar]
- Tate, P.G. An Elementary Treatise on Quaternions; Clarendon Press: Oxford, UK, 1867. [Google Scholar]
- Hosny, K.M.; Khedr, Y.M.; Khedr, W.I.; Mohamed, E.R. Robust Color Image Hashing Using Quaternion Polar Complex Exponential Transform for Image Authentication. Circuits Syst. Signal Process. 2018, 37, 5441–5462. [Google Scholar] [CrossRef]
- Ayzenberg, A. Torus action on quaternionic projective plane and related spaces. arXiv 2019, arXiv:1903.03460. [Google Scholar]
- Batres-Mendoza, P.; Montoro-Sanjose, C.R.; Guerra-Hernandez, E.I.; Almanza-Ojeda, D.L.; Rostro-Gonzalez, H.; Romero-Troncoso, R.J.; Ibarra-Manzano, M.A. Quaternion-Based Signal Analysis for Motor Imagery Classification from Electroencephalographic Signals. Sensors 2016, 16, 336. [Google Scholar] [CrossRef] [Green Version]
- Li, Y.; Wang, H. Almost periodic synchronization of quaternion-valued shunting inhibitory cellular neural networks with mixed delays via state-feedback control. PLoS ONE 2018, 13, e0198297. [Google Scholar] [CrossRef] [Green Version]
- Enshaeifar, S.; Kouchaki, S.; Took, C.C.; Sanei, S. Quaternion Singular Spectrum Analysis of Electroencephalogram with Application in Sleep Analysis. IEEE Trans. Neural Syst. Rehabil. Eng. 2016, 24, 57–67. [Google Scholar] [CrossRef] [PubMed] [Green Version]
- Hanson, A.J.; Thakur, S. Quaternion maps of global protein structure. J. Mol. Graph. Model. 2012, 38, 256–278. [Google Scholar] [CrossRef] [PubMed]
- Hart, V.; Segerman, H. The Quaternion Group as a Symmetry Group. arXiv 2014, arXiv:1404.6596v1. [Google Scholar]
- Giblin, P. Graphs, Surfaces and Homology; Cambridge University Press: Cambridge, UK, 2010. [Google Scholar]
- Weeks, J.R. The shape of space: How to visualize surfaces and three-dimensional manifolds. Pure Appl. Math. 1985, 96, 197–210. [Google Scholar]
- Hopf, H. Collected Papers/Gesammelte Abhandlungen; Springer: Berlin, Germany; New York, NY, USA, 2001. [Google Scholar]
- Johnson, N. A Visualization of the Hopf Fibration. 2015. Available online: https://nilesjohnson.net/hopf.html (accessed on 22 September 2020).
- Ozdemir, F.; Özekes, H. On the Homomorphisms of the Lie Groups SU(2) and S3. Abstr. Appl. Anal. 2013, 2, 1–5. [Google Scholar] [CrossRef]
- Pritchard, W.S. The brain in fractal time: 1/f-like power spectrum scaling of the human electroencephalogram. Int. J. Neurosci. 1992, 66, 119–129. [Google Scholar] [CrossRef]
- Fingelkurts, A.A.; Fingelkurts, A.A.; Neves, C.F.H. Natural world physical, brain operational, and mind phenomenal space-time. Phys. Life Rev. 2010, 7, 195–249. [Google Scholar] [CrossRef] [Green Version]
- Buzsáki, G.; Watson, B.O. Brain rhythms and neural syntax: Implications for efficient coding of cognitive content and neuropsychiatric disease. Dialogues Clin. Neurosci. 2012, 4, 345–367. [Google Scholar]
- Van de Ville, D.; Britz, J.; Michel, C.M. EEG microstate sequences in healthy humans at rest reveal scale-free dynamics. Proc. Natl. Acad. Sci. USA 2010, 107, 18179–18184. [Google Scholar] [CrossRef] [PubMed] [Green Version]
- Jirsa, V.K.; Stacey, W.C.; Quilichini, P.P.; Ivanov, A.I.; Bernard, C. On the nature of seizure dynamics. Brain 2014, 137 Pt 8, 2210–2230. [Google Scholar] [CrossRef] [Green Version]
- de Arcangelis, L.; Herrmann, H.J. Learning as a phenomenon occurring in a critical state. Proc. Natl. Acad. Sci. USA 2010, 107, 3977–3981. [Google Scholar] [CrossRef] [PubMed] [Green Version]
- Oliveros-Muñoz, J.M.; Jiménez-Islas, H. Hyperspherical path tracking methodology as correction step in homotopic continuation methods. Chem. Eng. Sci. 2013, 97, 413–429. [Google Scholar] [CrossRef]
- Tozzi, A.; Ahmad, M.Z.; Peters, J.F. Neural computing in four spatial dimensions. Cogn. Neurodyn. 2020. [Google Scholar] [CrossRef]
- Lohse, M.; Schweizer, C.; Price, H.M.; Zilberberg, O.; Bloch, I. Exploring 4D quantum Hall physics with a 2D topological charge pump. Nature 2018, 553, 55–58. [Google Scholar] [CrossRef]
- Zilberberg, O.; Huang, S.; Guglielmon, J.; Wang, M.; Chen, K.P.; Kraus, Y.E.; Rechtsman, M.C. Photonic topological boundary pumping as a probe of 4D quantum Hall physics. Nature 2018, 553, 59–62. [Google Scholar] [CrossRef]
- Di Concilio, A.; Guadagni, C.; Peters, J.F.; Ramanna, S. Descriptive proximities, properties and interplay between classical proximities and overlap. Math. Comp. Sci. 2018, 12, 91–106. [Google Scholar] [CrossRef]
- Peters, J.F. Computational Geometry, Topology and Physics of Digital Images with Applications. Shape Complexes, Optical Vortex Nerves and Proximities; Springer Nature: Cham, Switzerland, 2020; p. xxv+440. [Google Scholar] [CrossRef]
- von Wegner, F. Partial Autoinformation to Characterize Symbolic Sequences. Front. Physiol. 2018, 9, 1382. [Google Scholar] [CrossRef]
- von Wegner, F.; Laufs, H.; Tagliazucchi, E. Mutual information identifies spurious Hurst phenomena in resting state EEG and fMRI data. Phys. Rev. E 2018, 97, 022415. [Google Scholar] [CrossRef]
- Fruchart, M.; Zhou, Y.; Vitelli, V. Dualities and non-Abelian mechanics. Nature 2020, 577, 636–640. [Google Scholar] [CrossRef]
Figure 1.
Quaternion mappings of a three-dimensional electroencephalographic traces (EEG) wave to a four-dimensional hypersphere. (A). EEG oscillations mean detected from the three central electrodes Cz, Fz, and Pz. The plot displays time in milliseconds (axis x) versus amplitude in mV (axis y). The three vectors standing for a single point of the plot are depicted by green, red, and blue arrows, respectively. (B). A barebones quaternionic projection relative to the three vectors making a triad. (C). Three-dimensional quaternion projection inside a sphere. (D). Punctiform orthographic projection of a brain signal spike (amplitude) onto the surface of a sphere via quaternion sphere. (E). Uniform orthographic projection of brain signals onto the surface of a sphere, achieved after projecting signal vectors via quaternionic maps.

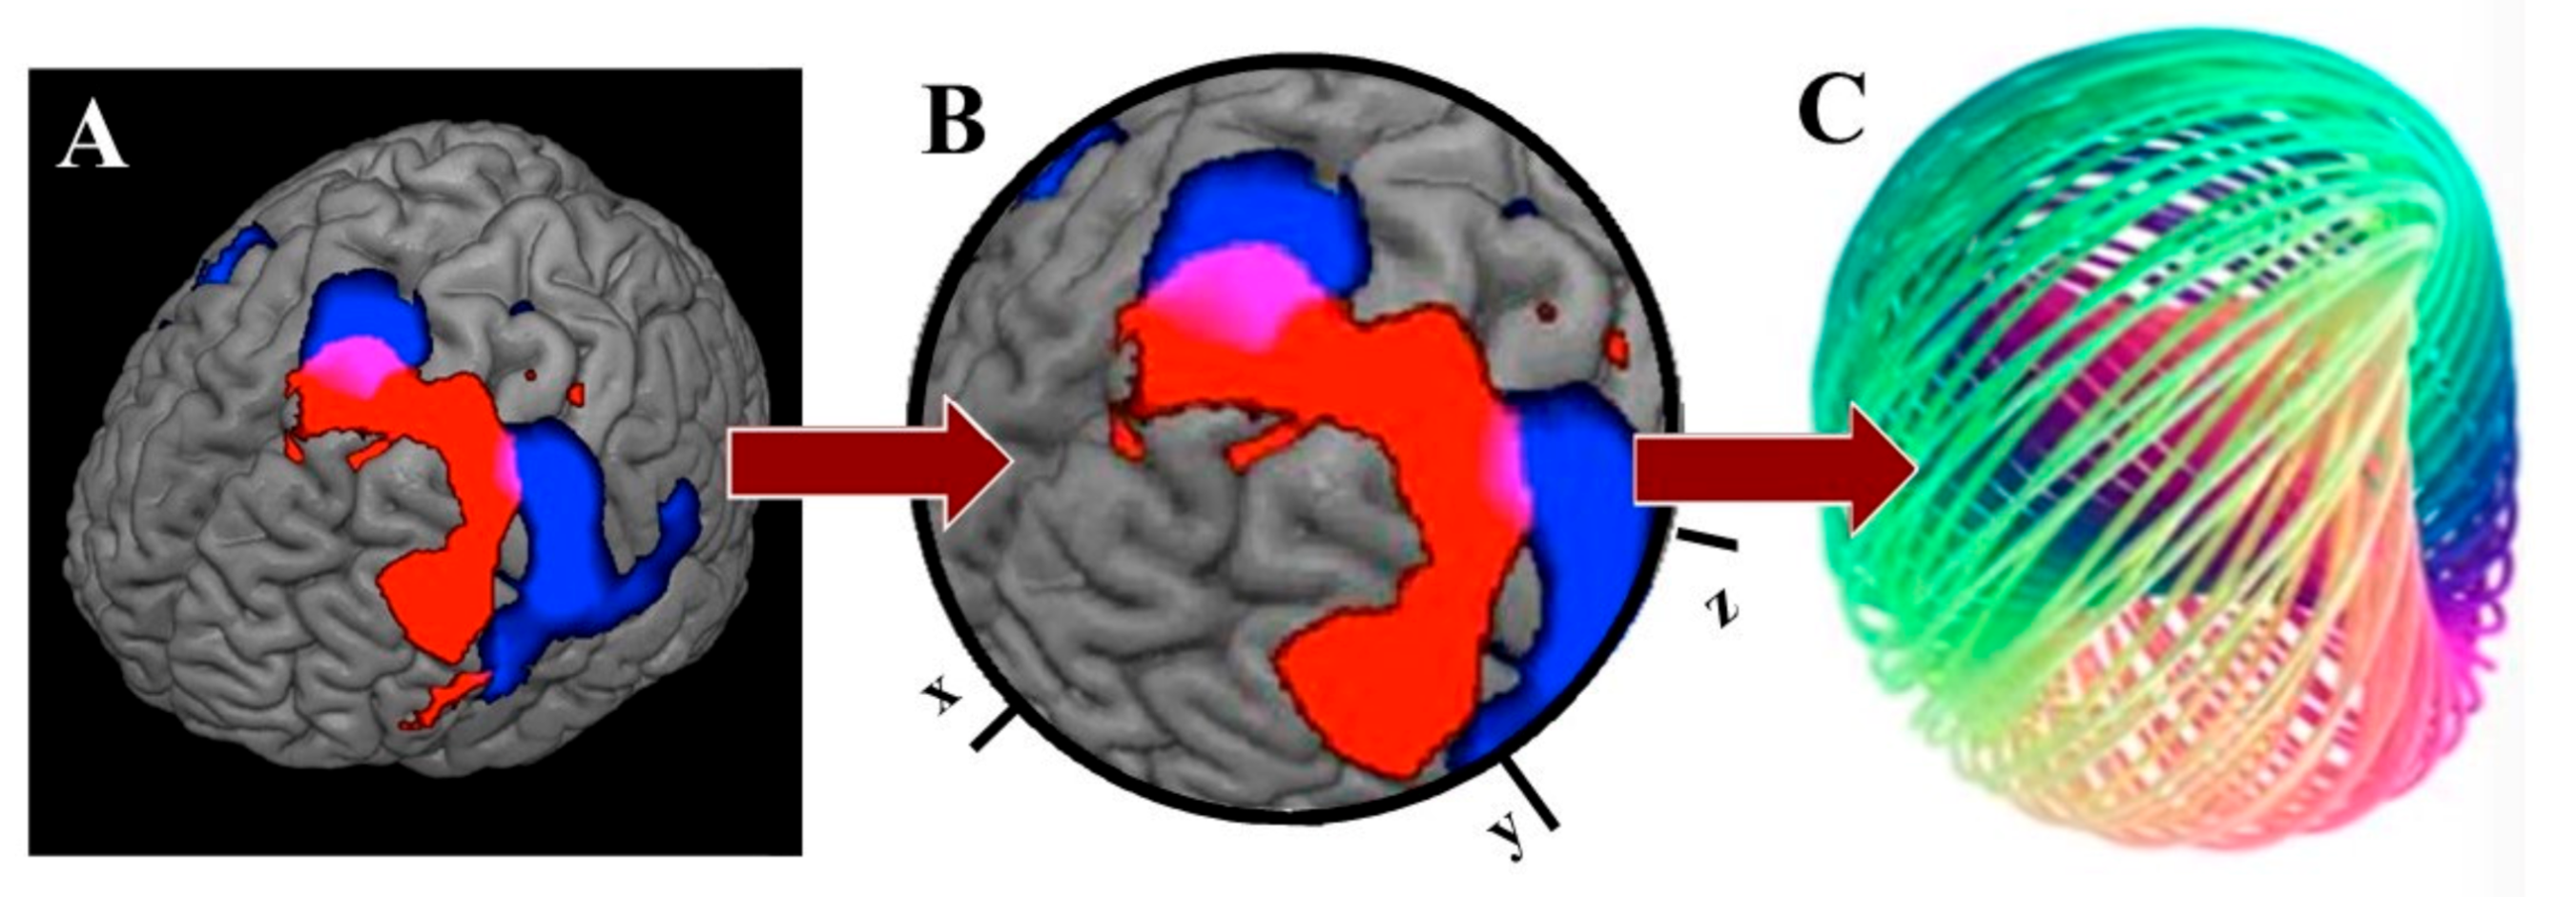
Figure 2.
Feature extraction from a three-dimensional dataset to a four-dimensional hypersphere. (A). A three-dimensional fMRI (Functional Magnetic Resonance Imaging) neuroimage displays different activated areas, painted as blue and red spots on the surface of the cortical hemispheres. (B). The blue and red spots are mapped to the surface of a three-dimensional ball equipped with the canonical axes x, y, and z. (C). A technique termed Hopf fibration [19] allows the projection of the spots from the 2-sphere onto a glome, so that every point on the 2-sphere matches a single circular trajectory on the 3-sphere. Modified from [20].

Figure 3.
Quaternion simulation of non-uniform orthographic projection of brain fractal signals onto a fragmented sphere. (A) Two-dimensional Fourier analysis of an EEG trace. The x axis displays the frequencies in Hertz and the y axis, the amplitude in mV. (B). Three-dimensional magnification of a short trace from the plot in (A). (C) View of the orthographic projection of scale-free brain signal patches on continuous curves (represented by green threads and their shadows) via a quaternion. Note that two triads with matching description in three dimensions (i.e., equipped with the same orientation of the three axes) illustrated in (B) project (yellow arrows) to a single triad in four dimensions.
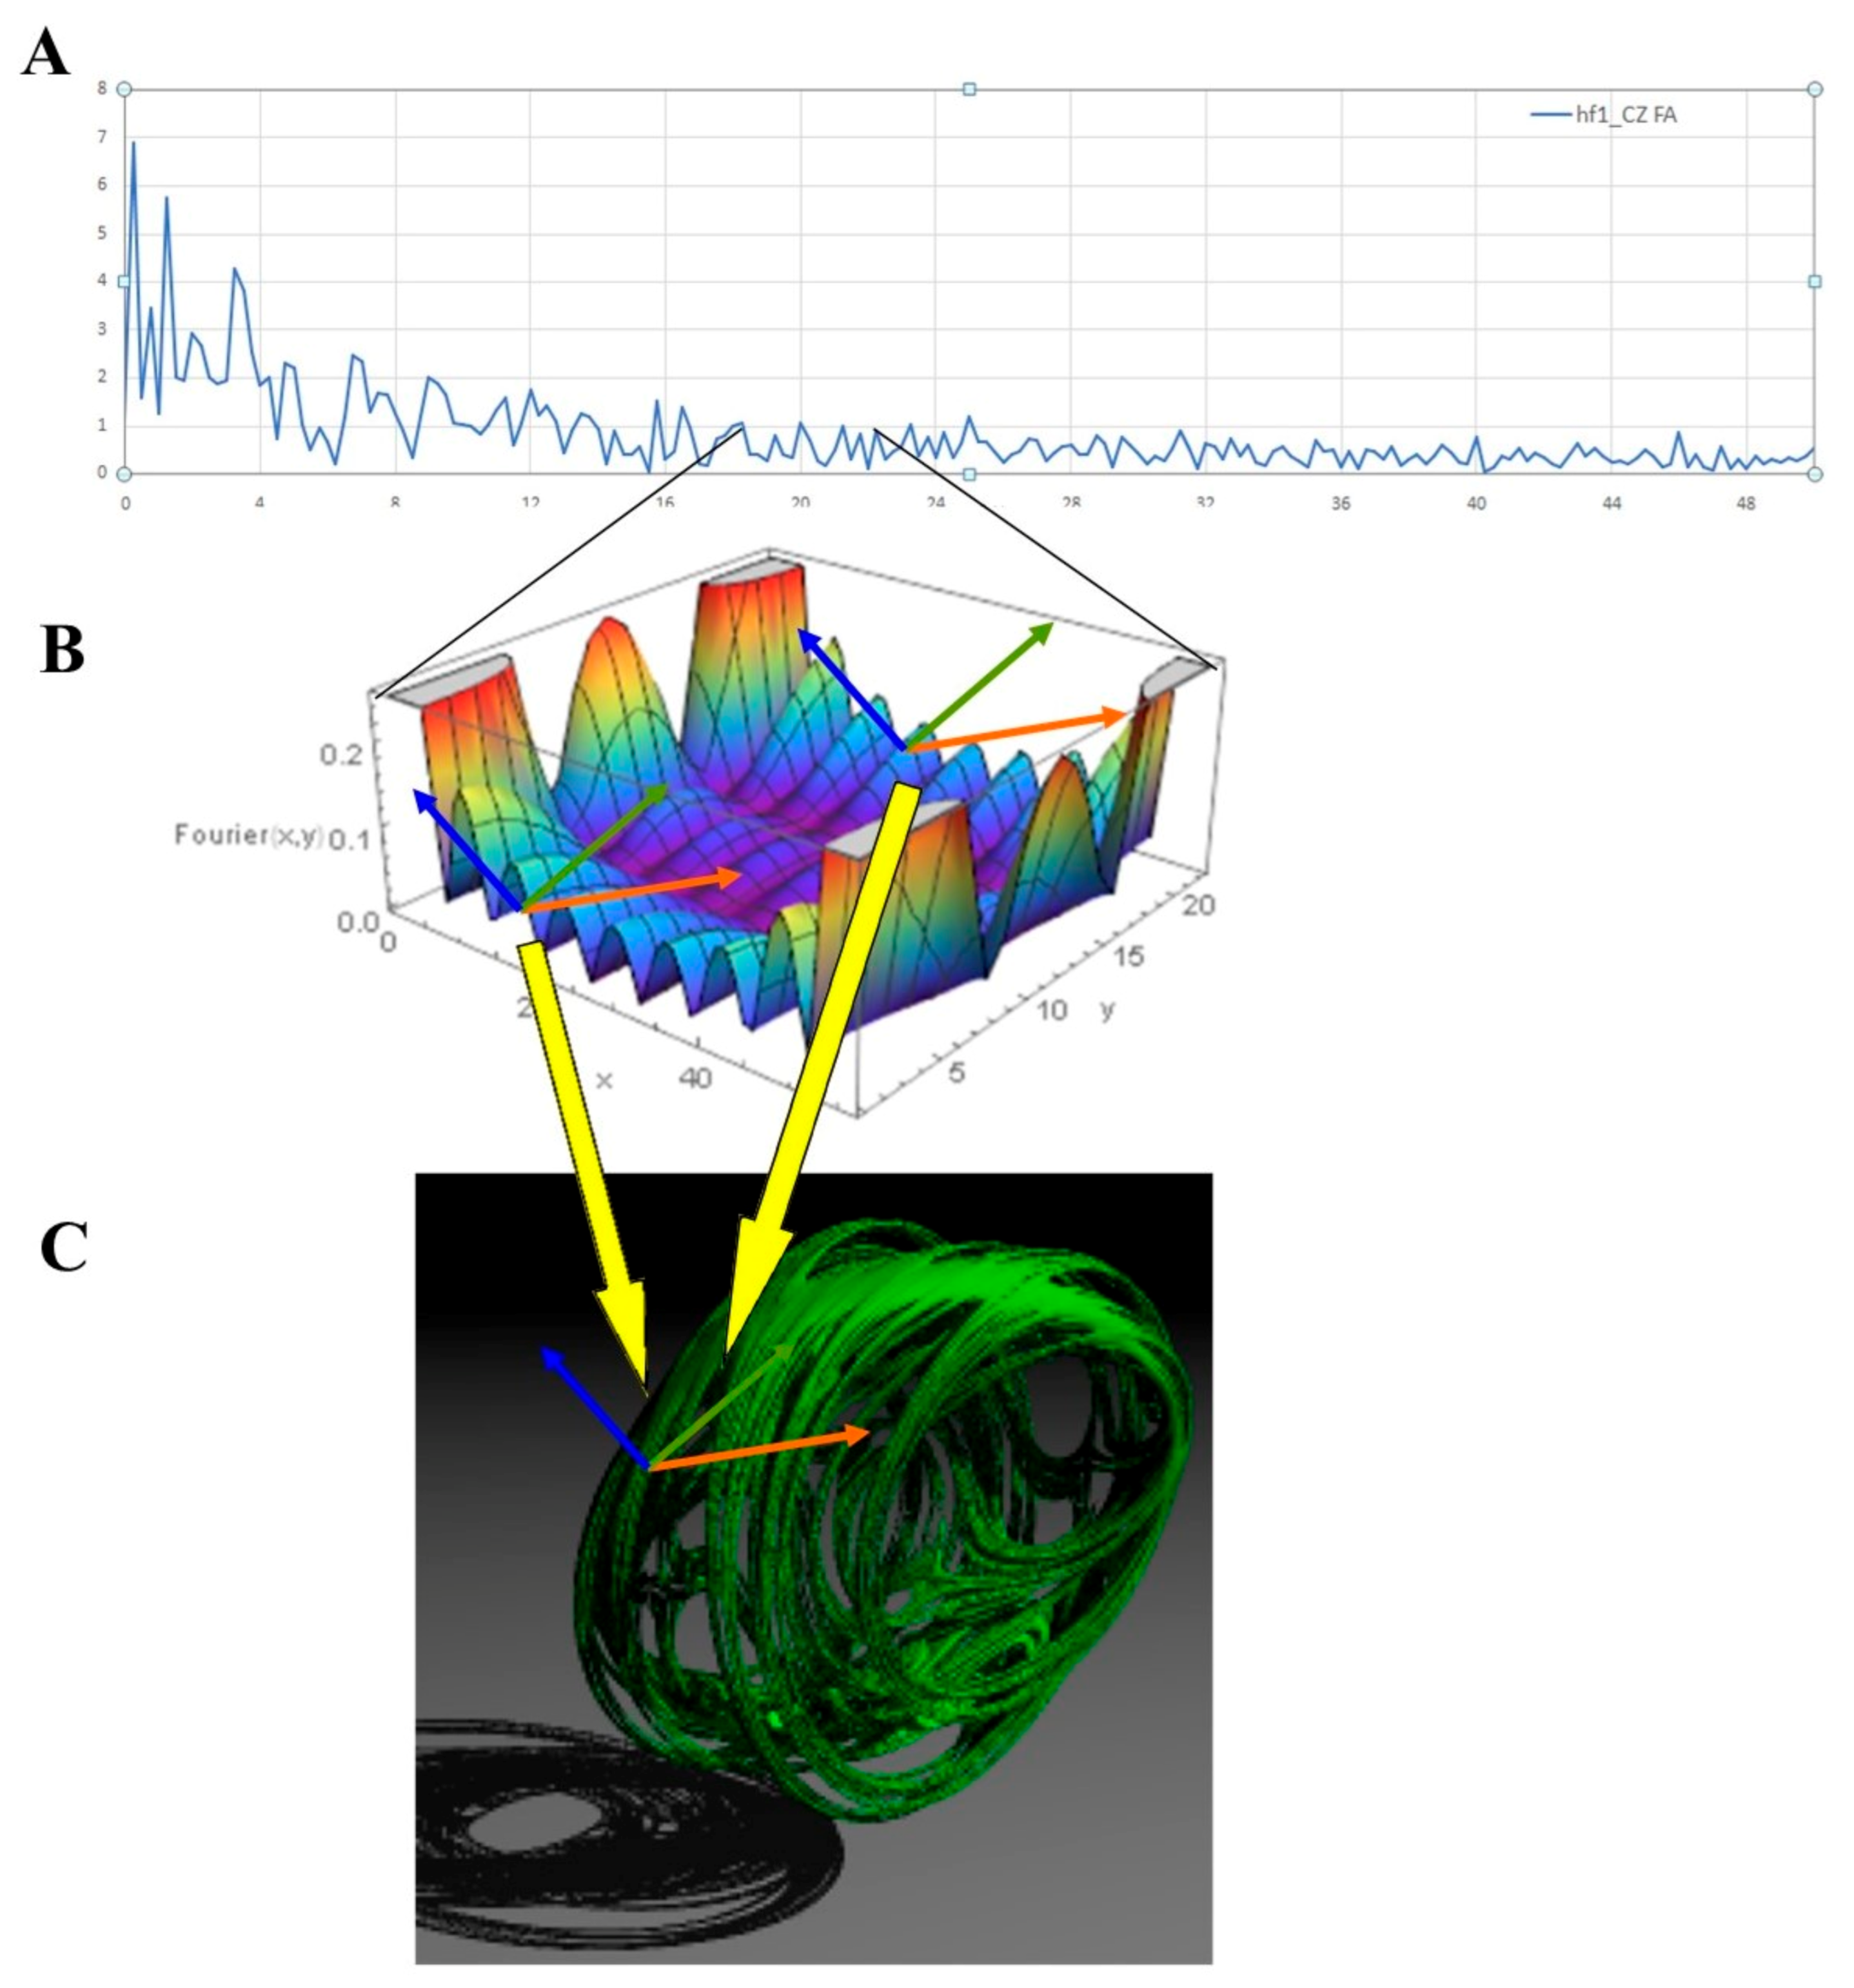
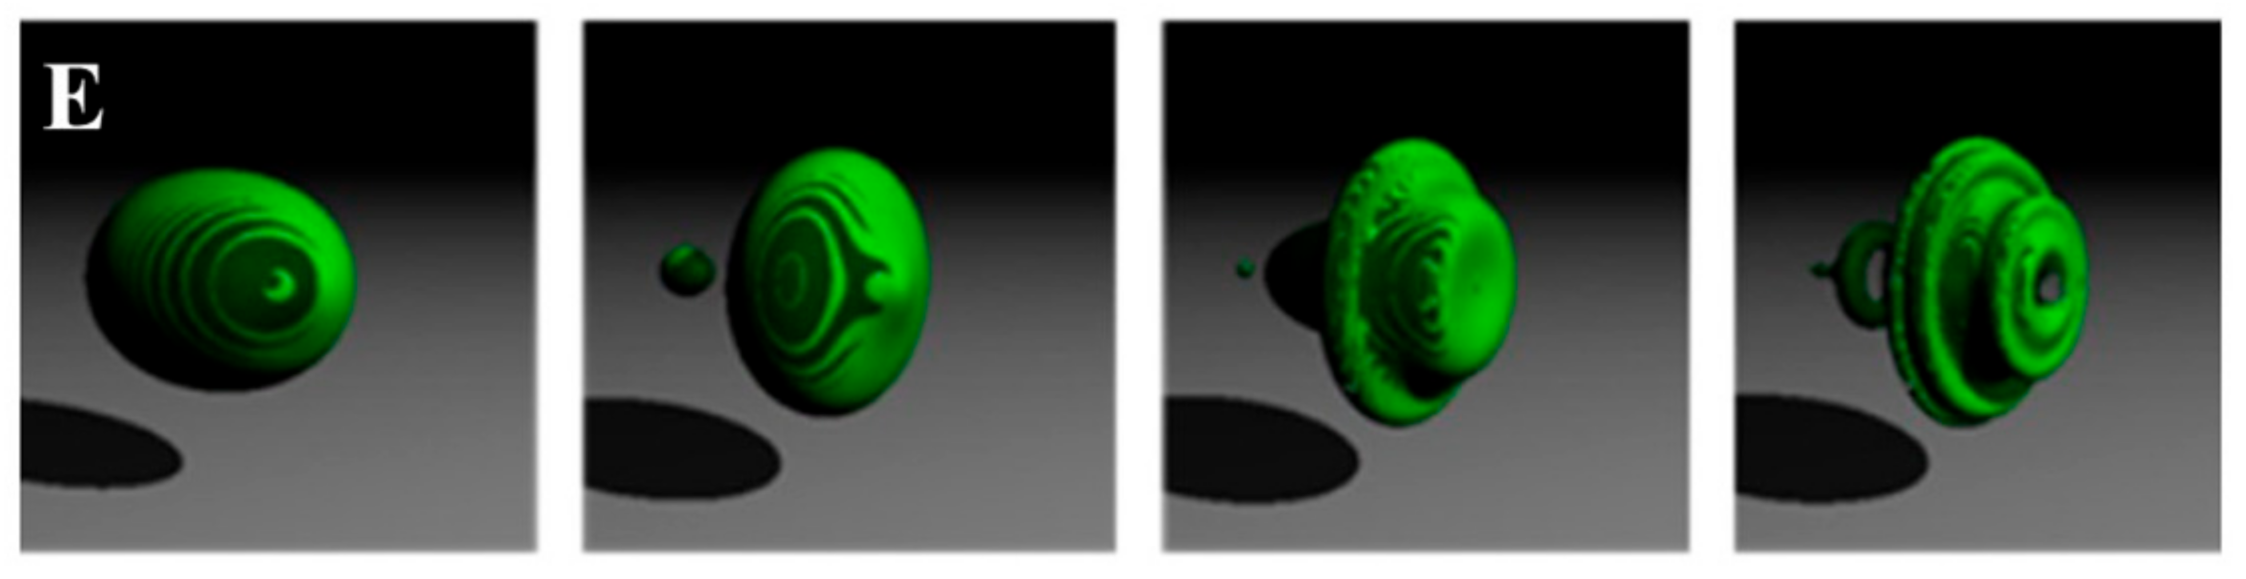
Figure 4.
(A–D) Simulations of orthographic projections of scale-free brain signal patches onto the surface of a sphere via quaternions. Every picture stands for a quaternion surface closeup, where magnifications of the fractal structure of the hypersphere, depicted as three-dimensional views of the quaternion, can be seen. To make an example, (A) illustrates a planetary view of a non-uniform orthographic projection of brain signals onto a fragmented sphere. (E) Fractal-view (from the top to the bottom) of the orthographic projection of temporal sequences of brain signals patches on continuous curves represented by pulsating (vibrating) green threads and their shadows via a quaternion. This sequence stands for a spacetime view of the quaternionic mappings and encompasses a hidden time scale for the sequence of orange orthographic projections. No scale bar is needed, since the orthographic projections are scale-free.

Publisher’s Note: MDPI stays neutral with regard to jurisdictional claims in published maps and institutional affiliations. |
© 2021 by the authors. Licensee MDPI, Basel, Switzerland. This article is an open access article distributed under the terms and conditions of the Creative Commons Attribution (CC BY) license (http://creativecommons.org/licenses/by/4.0/).
Share and Cite
MDPI and ACS Style
Tozzi, A.; Peters, J.F.; Jausovec, N.; Don, A.P.H.; Ramanna, S.; Legchenkova, I.; Bormashenko, E. Nervous Activity of the Brain in Five Dimensions. Biophysica 2021, 1, 38-47. https://0-doi-org.brum.beds.ac.uk/10.3390/biophysica1010004
AMA Style
Tozzi A, Peters JF, Jausovec N, Don APH, Ramanna S, Legchenkova I, Bormashenko E. Nervous Activity of the Brain in Five Dimensions. Biophysica. 2021; 1(1):38-47. https://0-doi-org.brum.beds.ac.uk/10.3390/biophysica1010004
Chicago/Turabian StyleTozzi, Arturo, James F. Peters, Norbert Jausovec, Arjuna P. H. Don, Sheela Ramanna, Irina Legchenkova, and Edward Bormashenko. 2021. "Nervous Activity of the Brain in Five Dimensions" Biophysica 1, no. 1: 38-47. https://0-doi-org.brum.beds.ac.uk/10.3390/biophysica1010004