
Modelling the Activation Pathways in Full-Length Src Kinase


1
Department of Chemistry, Sapienza University of Rome, 00185 Rome, Italy
2
Department of Information Engineering, Electronics and Telecommunications, Sapienza University of Rome, 00185 Rome, Italy
*
Author to whom correspondence should be addressed.
Biophysica 2021, 1(2), 238-248; https://0-doi-org.brum.beds.ac.uk/10.3390/biophysica1020018
Submission received: 18 May 2021
/
Revised: 28 May 2021
/
Accepted: 7 June 2021
/
Published: 11 June 2021
Abstract
:Src kinases play fundamental roles in several crucial cell processes. Their activity is tightly regulated by conformational transitions between the active and the inactive forms, which are carried out by complex protein structural rearrangements. Here, we present an in-depth study of such structural transitions coupling extensive all-atoms molecular dynamic simulations coupled to an algorithm able to drive the system between defined conformational states. Our results, in line with the available experimental data, confirm the complexity of such a process indicating the main molecular determinants involved. Moreover, the role of an Src inhibitor—able to bind to the protein inactive state—is discussed and compared with available experimental data.
1. Introduction
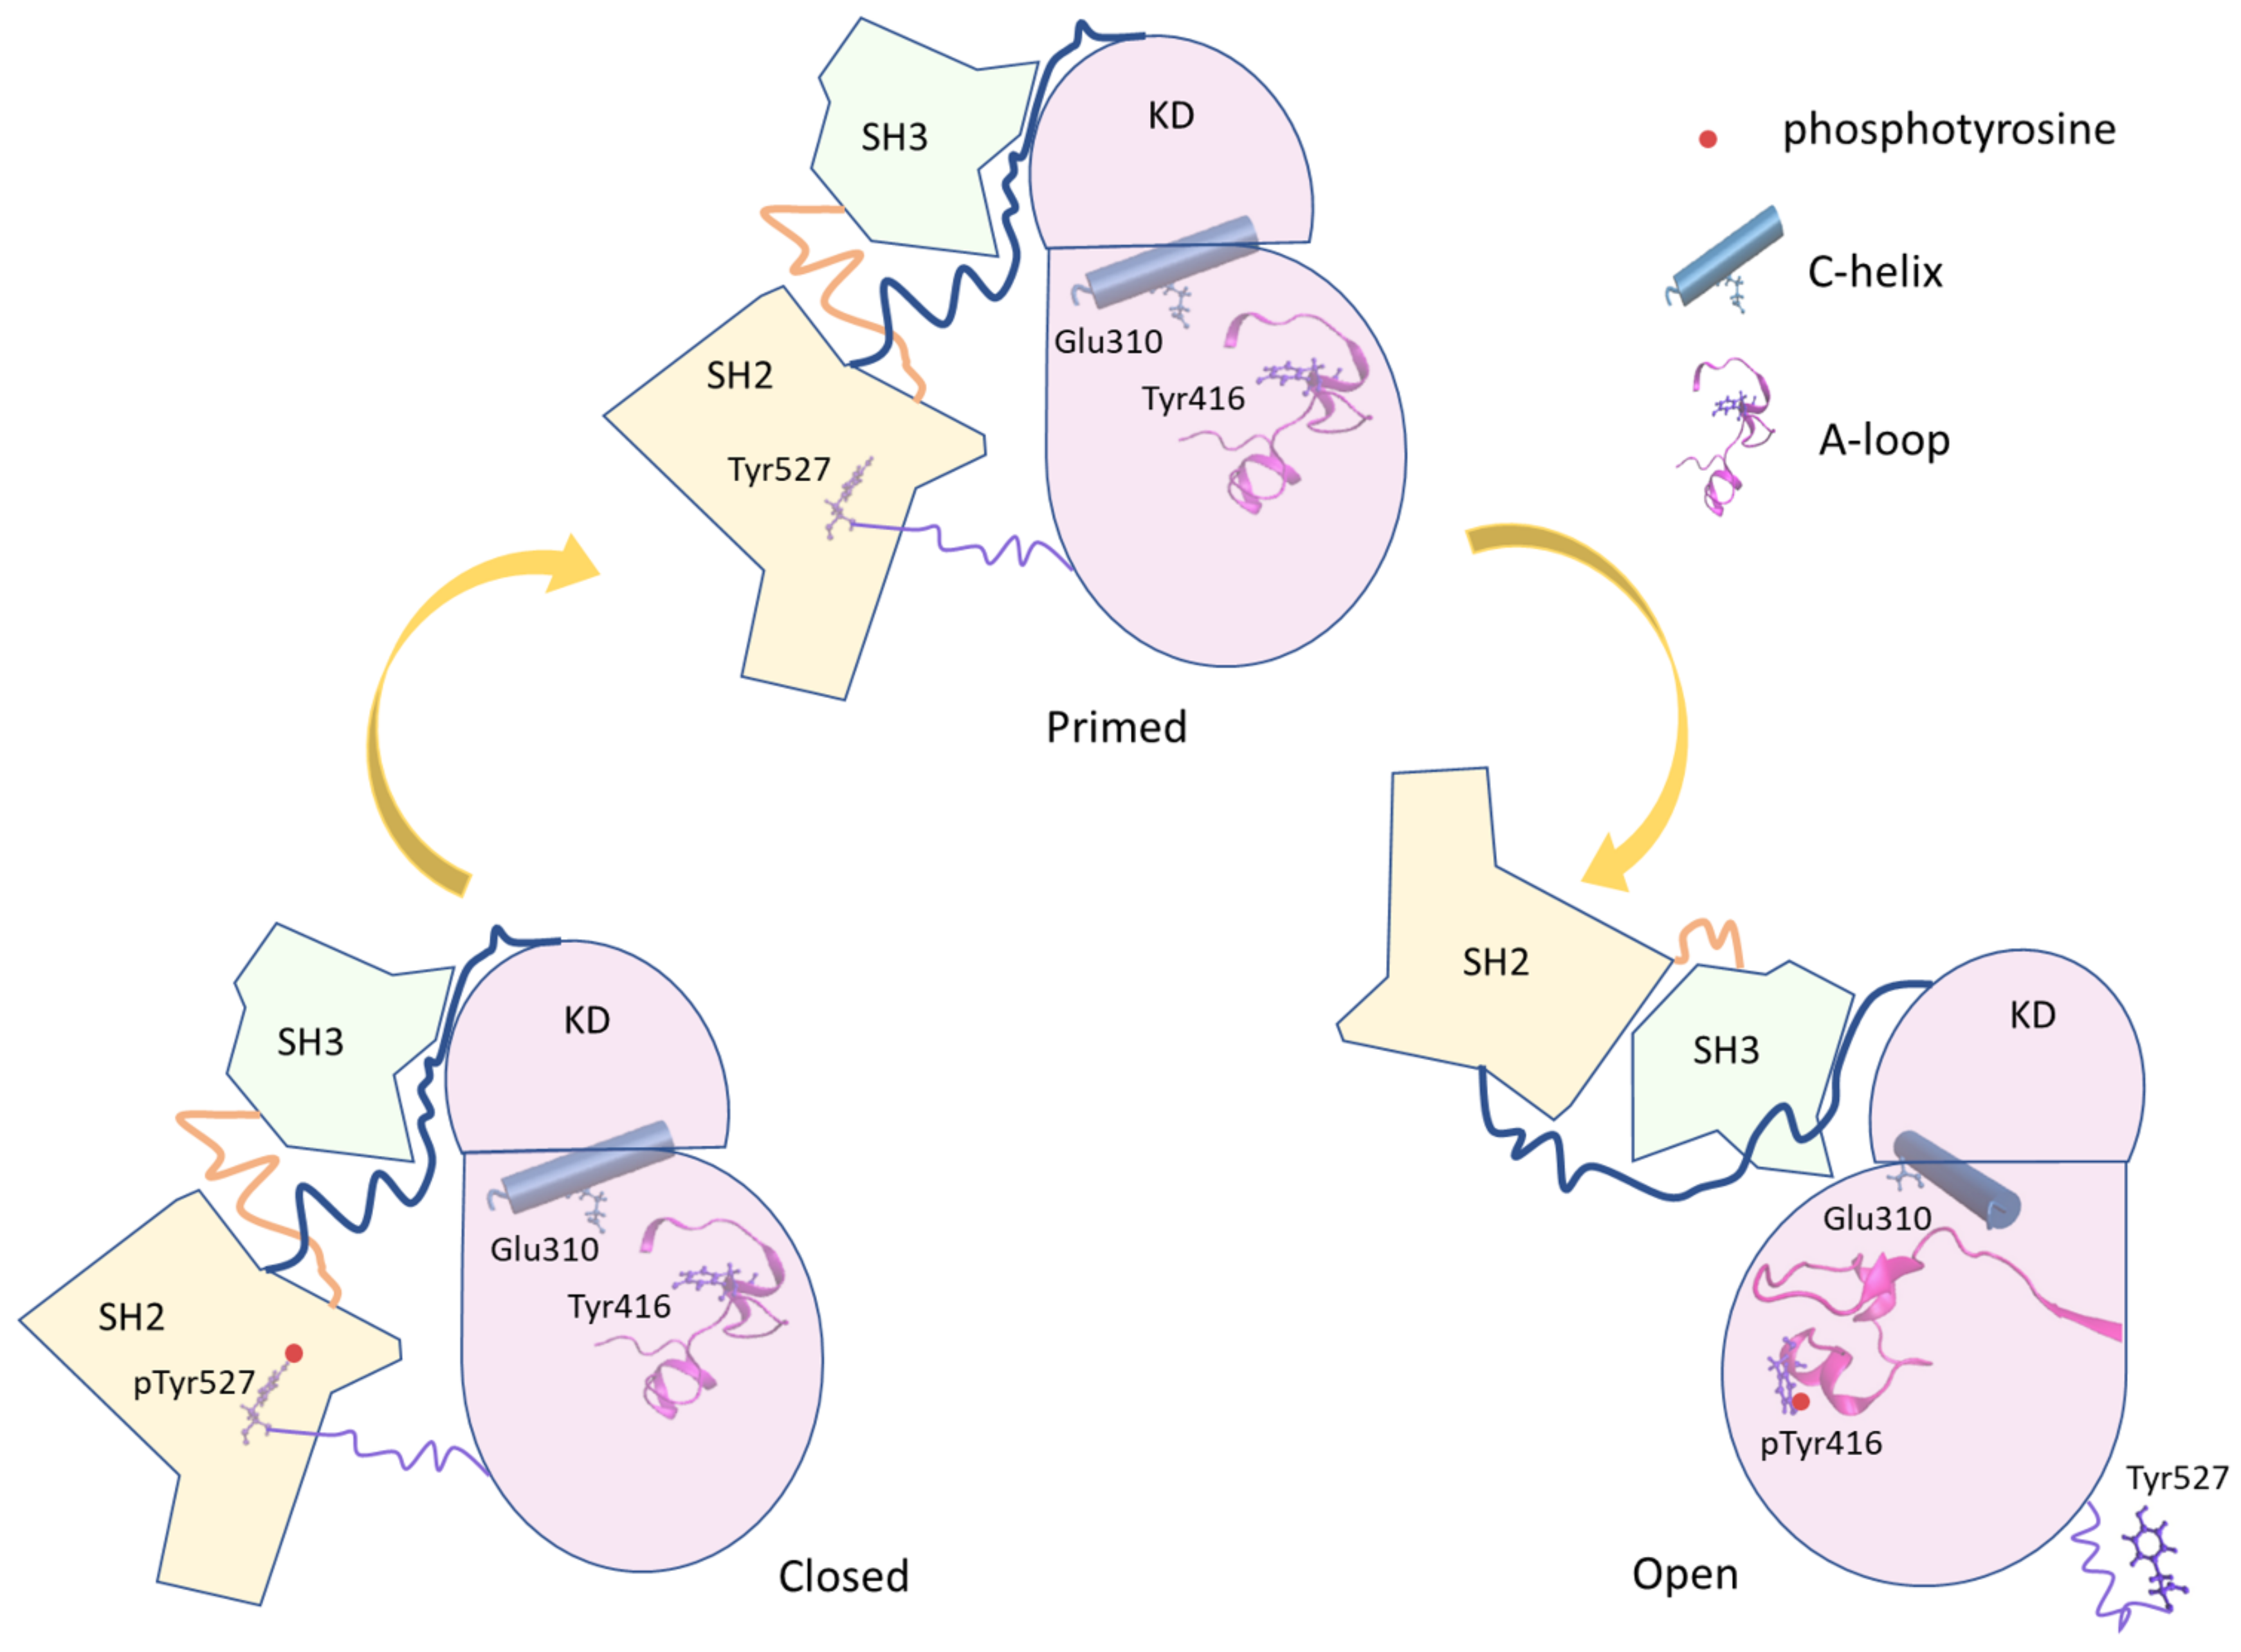
c-Src is a tyrosine kinase protein that regulates many intracellular processes such as cell growth, differentiation, and proliferation phosphorylating intracellular proteins. c-Src is expressed in most the human cells, and a dysfunction [1,2,3] in its activation is related to the onset of neoplastic progression [4,5,6,7,8,9]. Such a protein is formed by a myristoylated SH4 domain that anchors the kinase on the membrane surface, the Unique domain, the structural SH3 and SH2 domains and the kinase domain (KD), which contains the active site [10,11,12] (see Figure 1). As other kinase proteins, c-Src lives at least in three conformations [7]: (i) a close-inactive form, stabilized by the phosphorylation of Tyr 527, located in the C-terminus region; (ii) an unphosphorylated primed form; and (iii) an open-active form, characterized by the phosphorylation of Tyr 416 in the kinase domain (KD). The SH2 and SH3 domains participate in the regulation of the conformational equilibrium between the structurally different open and closed forms by intermolecular interactions. The catalytic site [13,14] is located in the cleft between the C-lobe and the N-lobe of the KD. The phosphorylation of Tyr 527, belonging to the C-terminal tail of the KD, results in the KD-SH2 binding that stabilizes, together with additional interactions between the SH3 domain and linker located between the SH2 and the KD domain, the closed form of the protein [15,16]. The dephosphorylation of Tyr 527 triggers a conformational rearrangement leading to the open/active form, where the interaction between the C-terminal tail and the SH2 domain vanished. The successive autophosphorylation of Tyr 416 further stabilizes the active form [2,17]. Therefore, the conformational equilibrium between the active and inactive states is tightly regulated by different molecular interactions that are dependent on different input signals (Figure 1).
To this end, we characterize these interaction patterns and their role in the conformational pathways in the c-Src full construct at the atomic level by means of a computational study performed by means of Molecular Dynamics (MD) simulations and an enhanced sampling technique, the Essential Dynamic sampling (EDS) [18]. By such an approach, we were able to describe c-Src full-length activation/inactivation paths and to characterize the crucial movements of the different protein regions that lead to the conformational transitions.
Due to the fact that the deregulation of protein tyrosine kinase activities leads to several pathologies, such a protein family represents an important target from a medical perspective. Therefore, several inhibitors have been developed so far. Among others, imatinib (gleveec) [19,20,21], belonging to the type II class of inhibitors, was one of the most effective for a closely related kinase, the Abl tyrosine kinase. The differences in the inhibitory power of imatinib with respect to c-Src and Abl tyrosine kinases—which showed a high degree of similiarity in terms of both sequence and structure—stimulated structural investigations to explain this issue [22,23]. From a structural point of view, imatinib binds to the c-Src kinases in the closed conformation, as illustrated by crystallographic studies of the c-Src-imatinib bound structure [24]. In this respect, we study here the effect of imatinib binding to the closed form of the c-Src kinase to highlight its role in conformational transitions. We anticipated that, in line with the literature, such an inhibitor does not affect the conformational behavior and/or transitions, thus supporting previous studies [22,23,25,26] indicating that imatinib’s main effect is to stabilize the relative population of the closed form, thus lowering the c-Src activity.
2. Materials and Methods
2.1. MD Simulations
From the human c-Src crystallographic structures of the closed (PDB ID:2src) and the open (PDB ID:1y57) states, the phosphate groups were removed from the phosphorylation sites to obtain the primed conformations [27,28,29]. The imatinib coordinates were taken from the DRUGBANK [30] database, and through the superimposition on the crystal structure of the chicken c-Src in complex with imatinib (PDB ID: 2oiq), the drug was docked into the closed form of the human c-Src kinase domain. The imatinib topology has been generated using the Antechamber package [31] implemented to be used with GAFF [32], with the RESP charge method [33]. In order to convert the Amber topology in the Gromacs format, the acpype (AnteChamber PYthon Parser interfacE) tool [34] has been used. The systems (c-Src closed state, c-Src open state, and c-Src closed state bound to imatinib) were solvated with the TIP3P water model [35] in a cubic box, imposing a minimum distance of 1.5 nm between the protein and the box. Sodium ions were added to neutralize the systems. The particle mesh Ewald method [36], with a cut-off of 1.2 nm, was adopted to treat the electrostatic interactions, and the Verlet cut-off scheme was used for the van der Waals interactions (with a cut-off of 1.2 nm). The MD simulations were performed in the NVT ensemble using the velocity rescale algorithm [37], imposing a = 0.1 and a temperature of 300 K. The Gromacs 2018 Software [38] was used to carry out the simulations using the Amber99sb force field. For the apo states, seven simulations of the open structures, each lasting ≈600 ns, and two simulations of the closed forms of ≈800 ns each were performed. The holo state was simulated for 500 ns for both the configurations.
2.2. Principal Component Analysis (PCA) and Essential Dynamics Sampling (EDS)
Principal component analysis (PCA) [39] was performed in order to extract the more relevant motions from the trajectory. In particular, the diagonalization of the covariance matrix of the C- fluctuations, provides a set of eigenvectors that are ordered according to the corresponding eigenvalues. The eigenvectors with the largest eigenvalues describe the largest-amplitude collective motions of the protein. PCA was performed on the combined trajectories of both the open and close conformational states. In this way, the eigenvectors describe the main motion directions connecting the close and the open forms of the protein, and they can be used in the Essential Dynamics Sampling (EDS) procedure [18] to model the transition pathways between the two conformational states, i.e., the closed and the open states. The EDS technique is based on the idea of driving the sampling towards a target structure rejecting modes that are not in the desired direction. In this procedure, two unbiased simulations of the starting and final states, describing the two equilibrium basins are required together with a certain number of short simulations that drive the system to the final state. For each MD step, if the distance between the intermediate and the reference configuration decreases in the selected subspace, the step is accepted; otherwise, a correction is applied on the atomic coordinates projected on the essential subspace. The mathematical details of such a procedure are reported in previous works [18,39]. Following this protocol, the possible transition paths that connect the closed and open protein conformations as well as the structural changes involved in the activation/deactivation mechanism are identified.
3. Results and Discussion
3.1. Conformational Equilibria
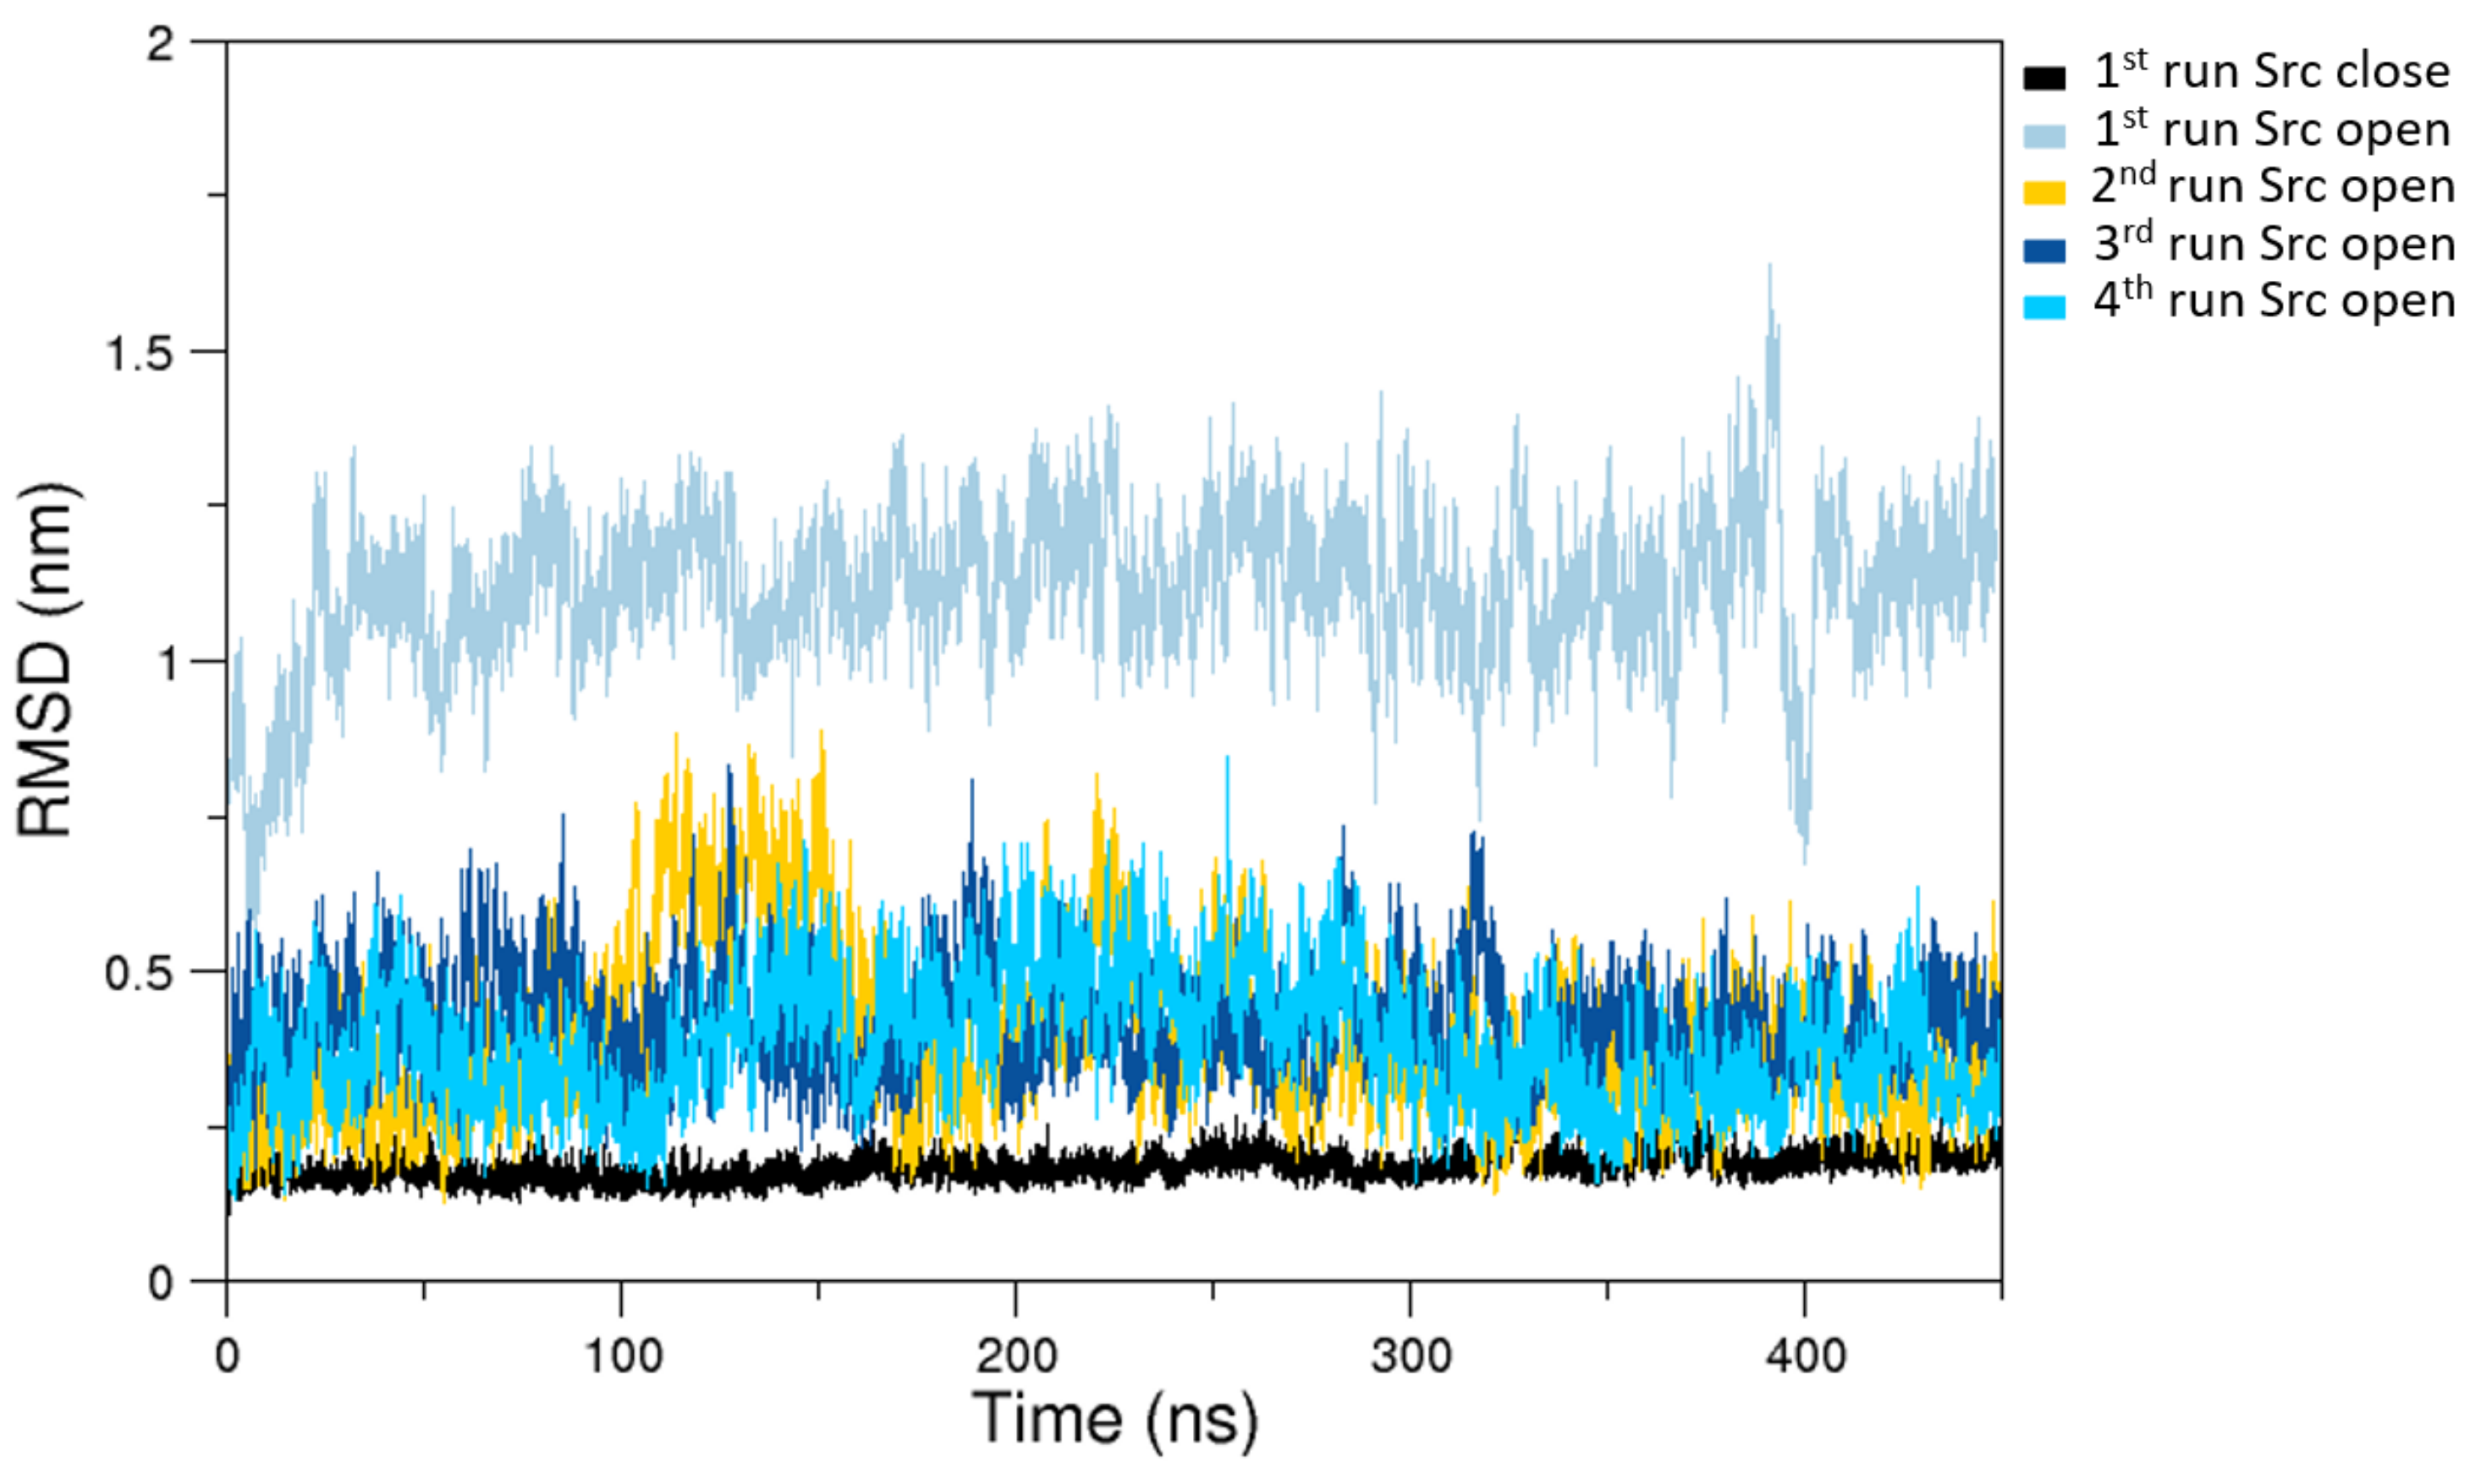
The analysis of the MD simulations of the closed state indicates that the sampled configuration is structurally similar to the starting crystallographic structure (Figure 2).
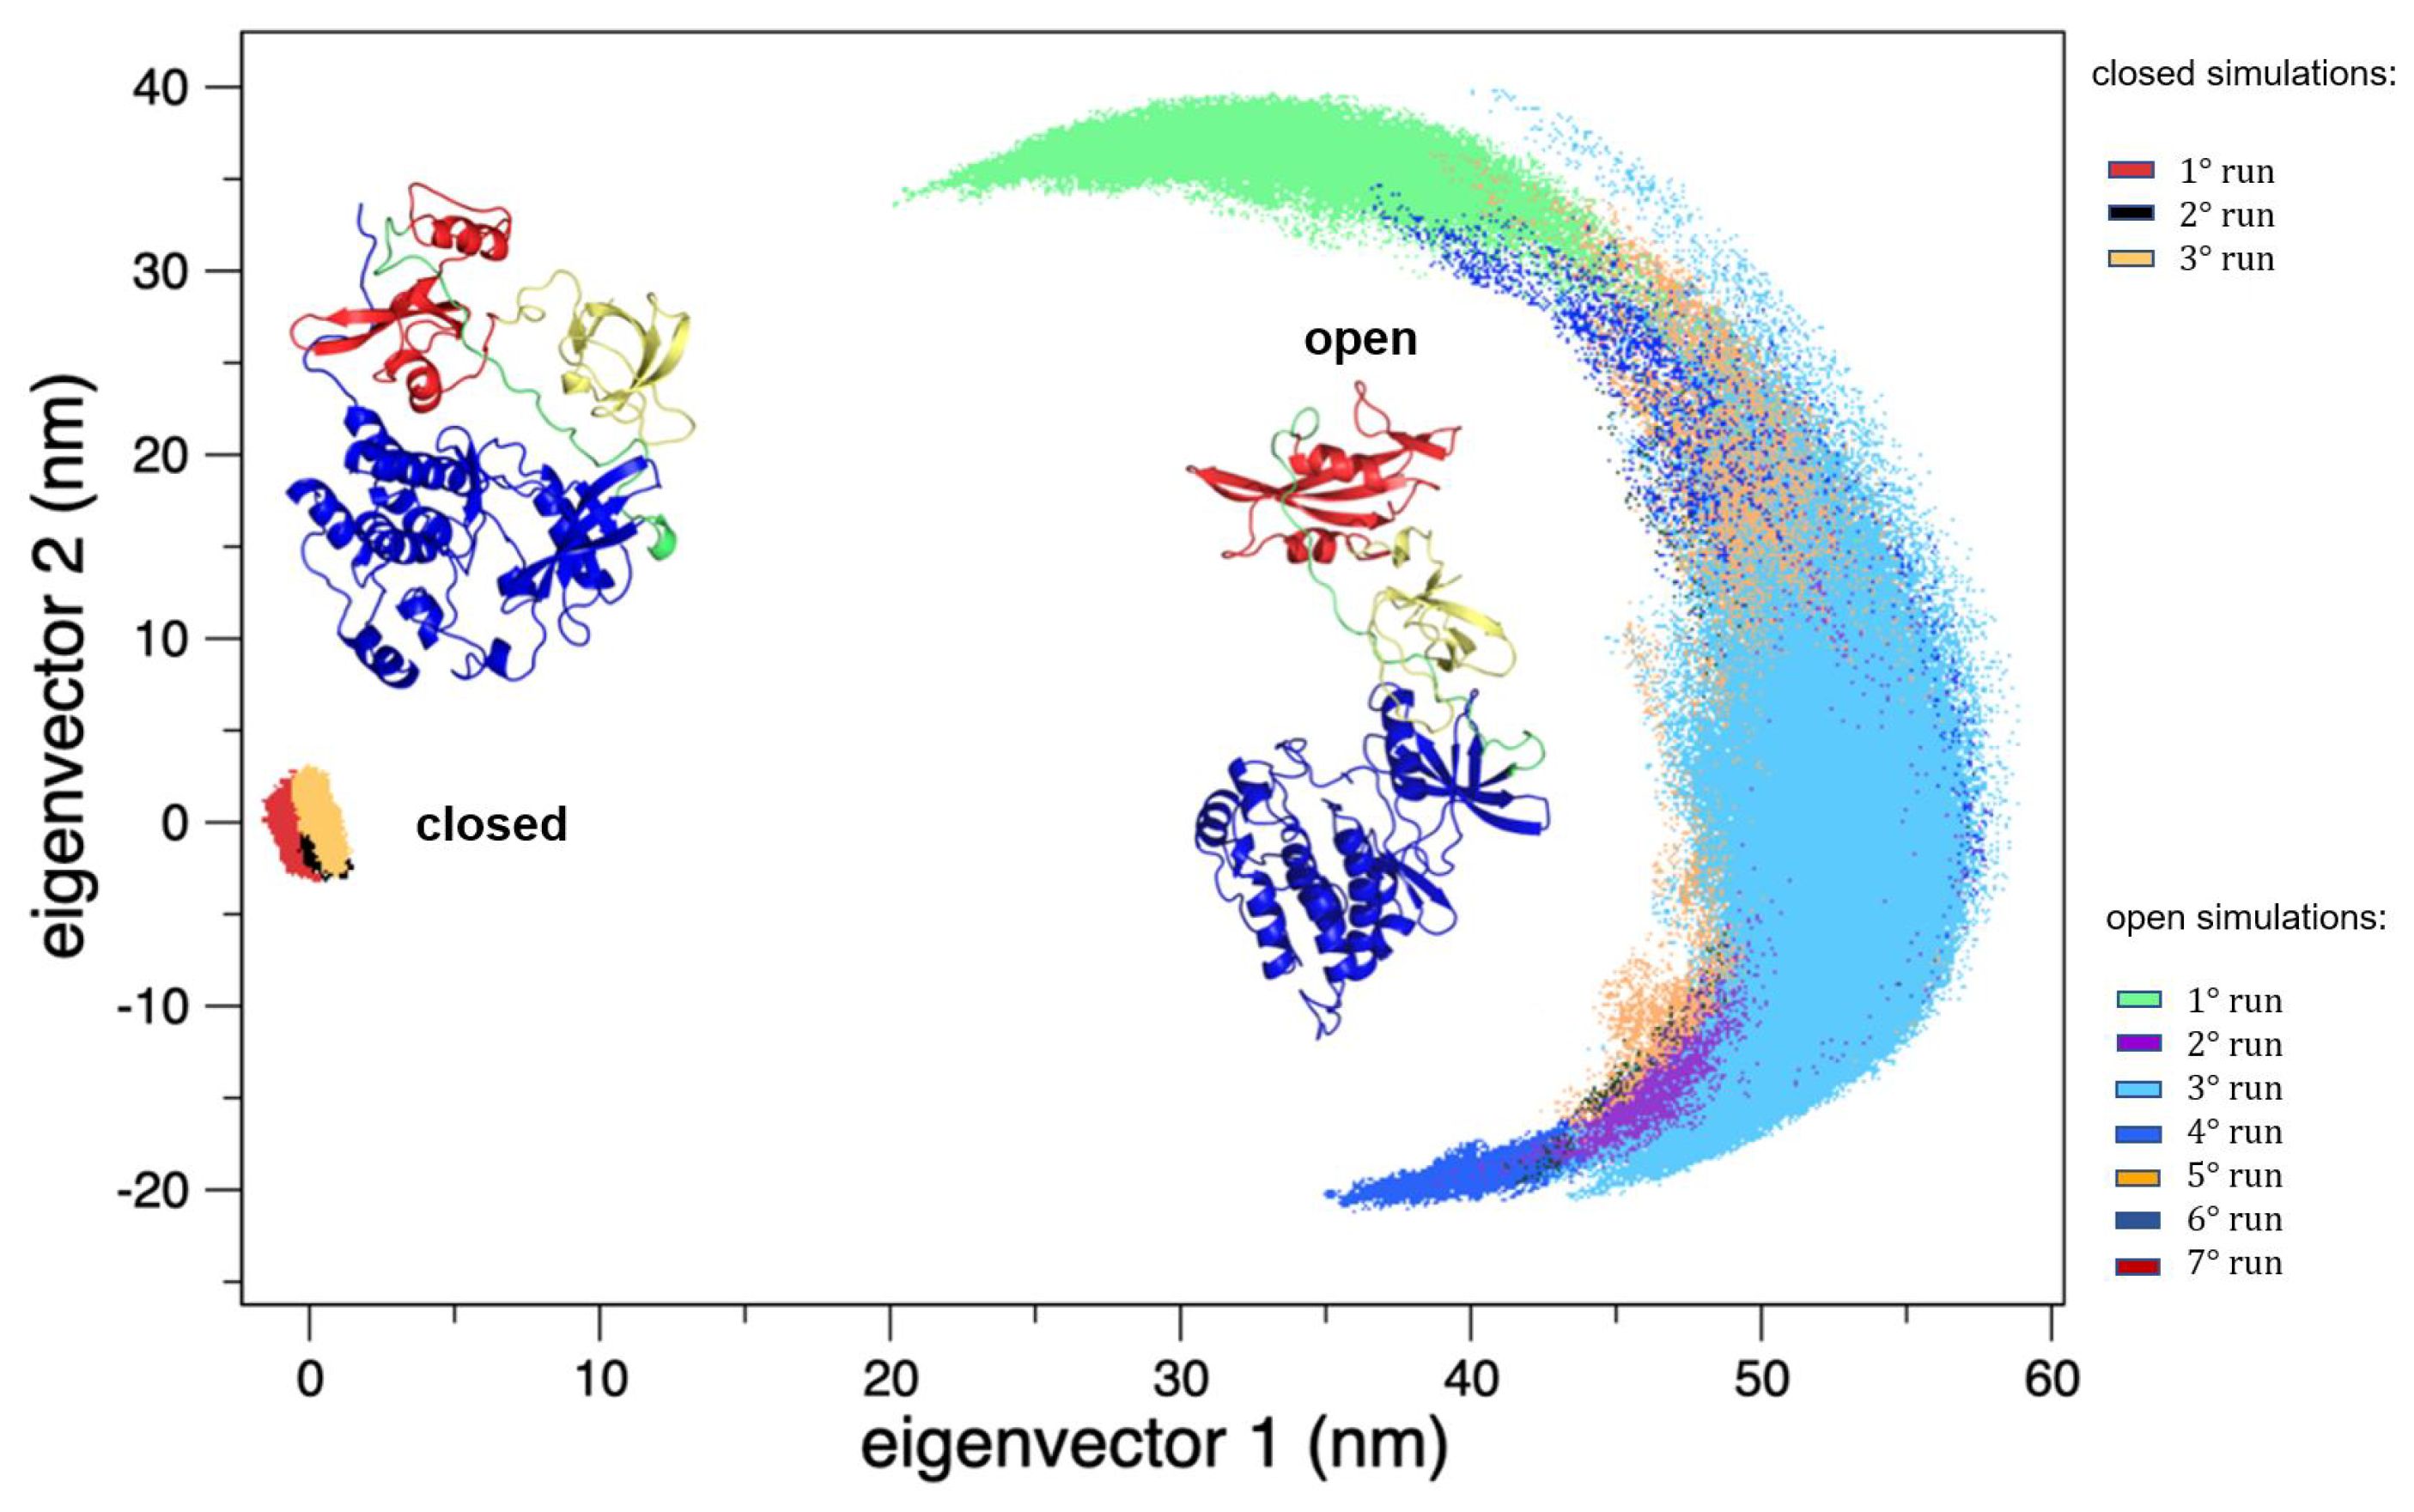
On the other hand, the trajectories of the open (active) state show a pronounced conformational variability (Figure 2), mainly due to mutual orientation of the three protein domains—SH3, SH2, and KD—occurring along the MD trajectories. The fluctuation analysis indicates that they are more pronounced in the SH2 and KD and in the linker region connecting these two domains (data not shown) as also confirmed by hydrogen bond analysis (see Supplementary Materials). This large conformational variability is even more evident using principal component analysis (PCA). In fact, combining open and closed trajectories and applying the PCA, the protein projection on the essential plane defined by the first two eigenvectors clearly shows that the space explored by the open states is much wider than the closed state MDs (Figure 3). The eigenvalue associated with the first eigenvector—which clearly discriminates between the two states—is very high, describing the 87% of the total variance, thus indicating that the two states sample very different region of the common essential conformational space.
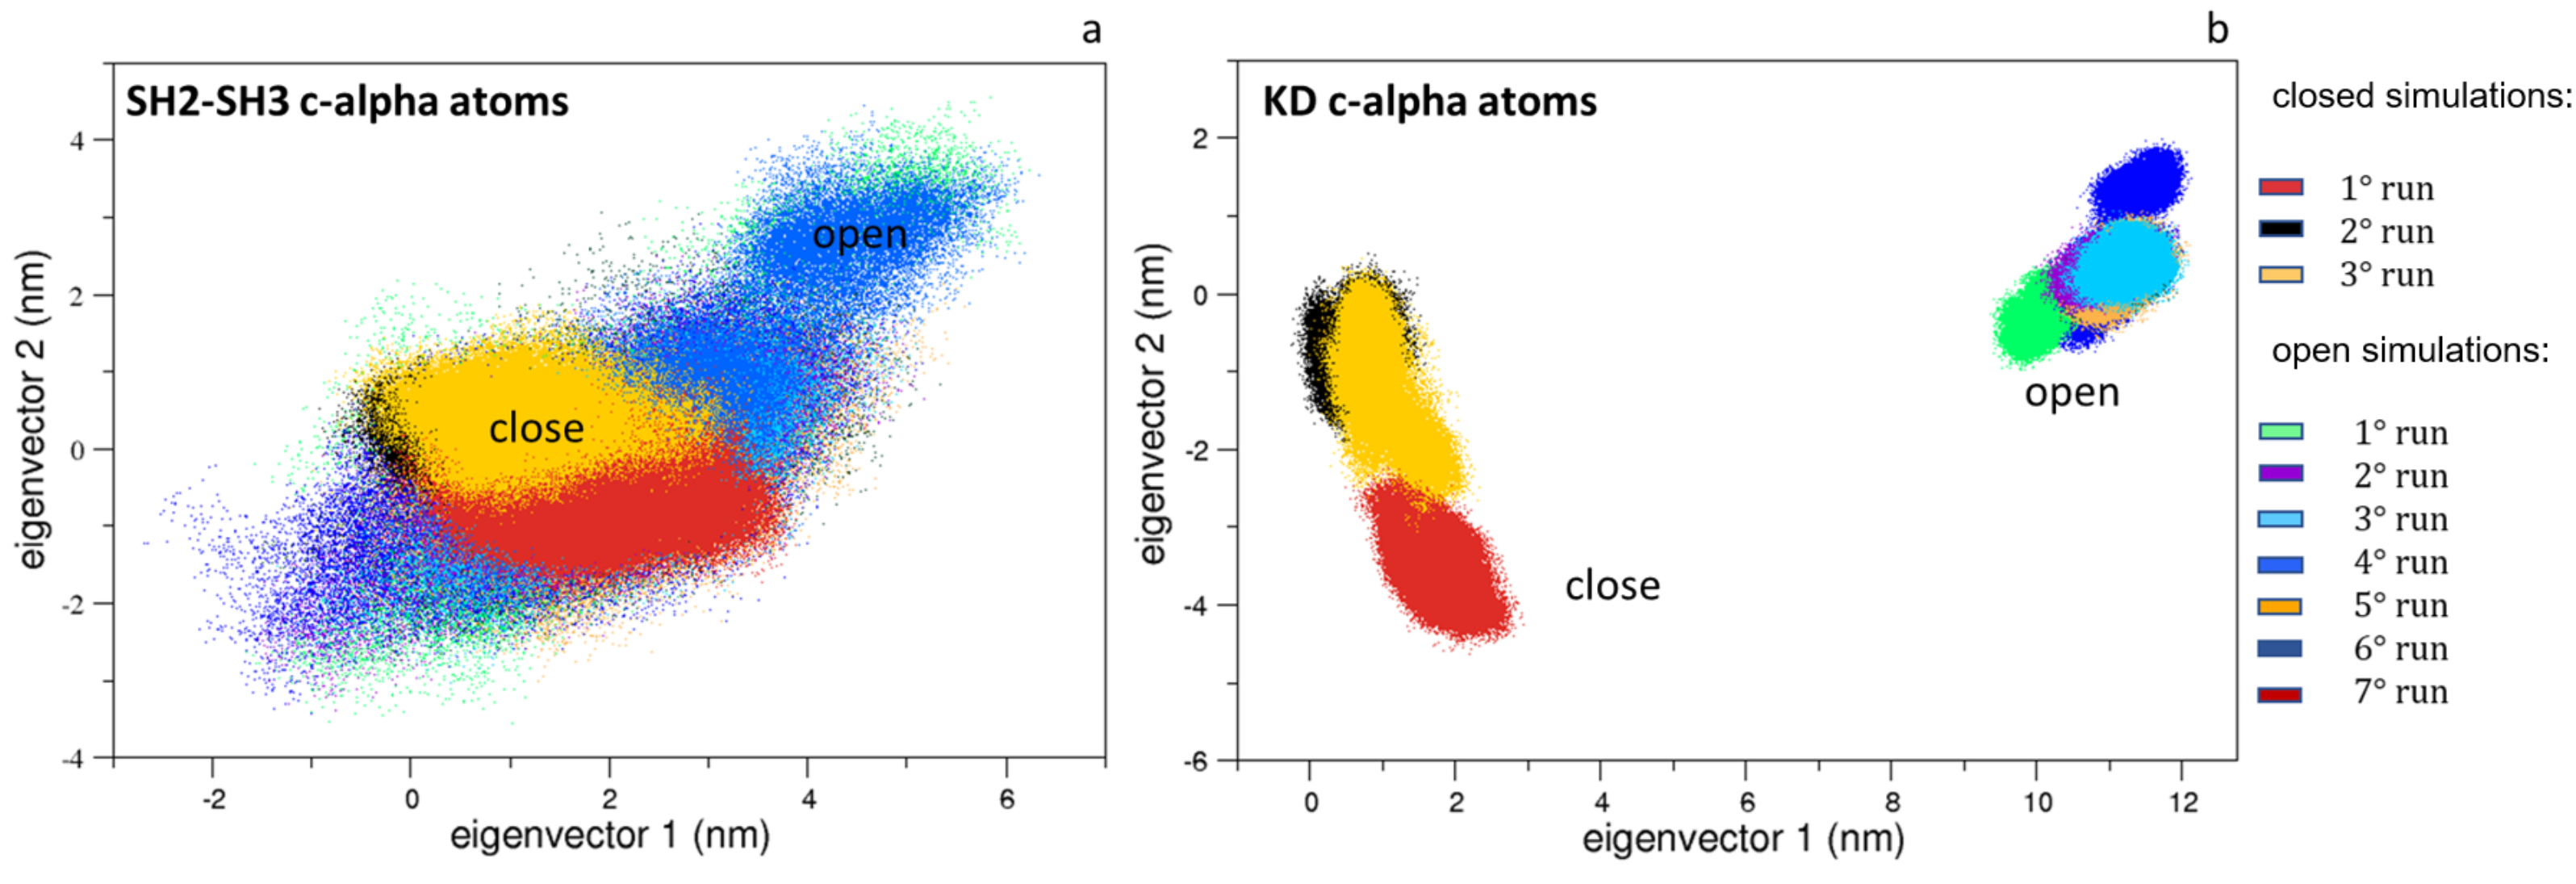
Interestingly, the same analysis applied to the SH3 and SH2 domains shows limited differences, indicating that the most relevant protein motions are due to the mutual domain rearrangements and/or to the KD domains (Figure 4a). Indeed, the ED projections of the KD domains reveal that they are confined in conformational regions near those explored by the corresponding starting structures (Figure 4b).
3.2. Activation and Inactivation Pathways
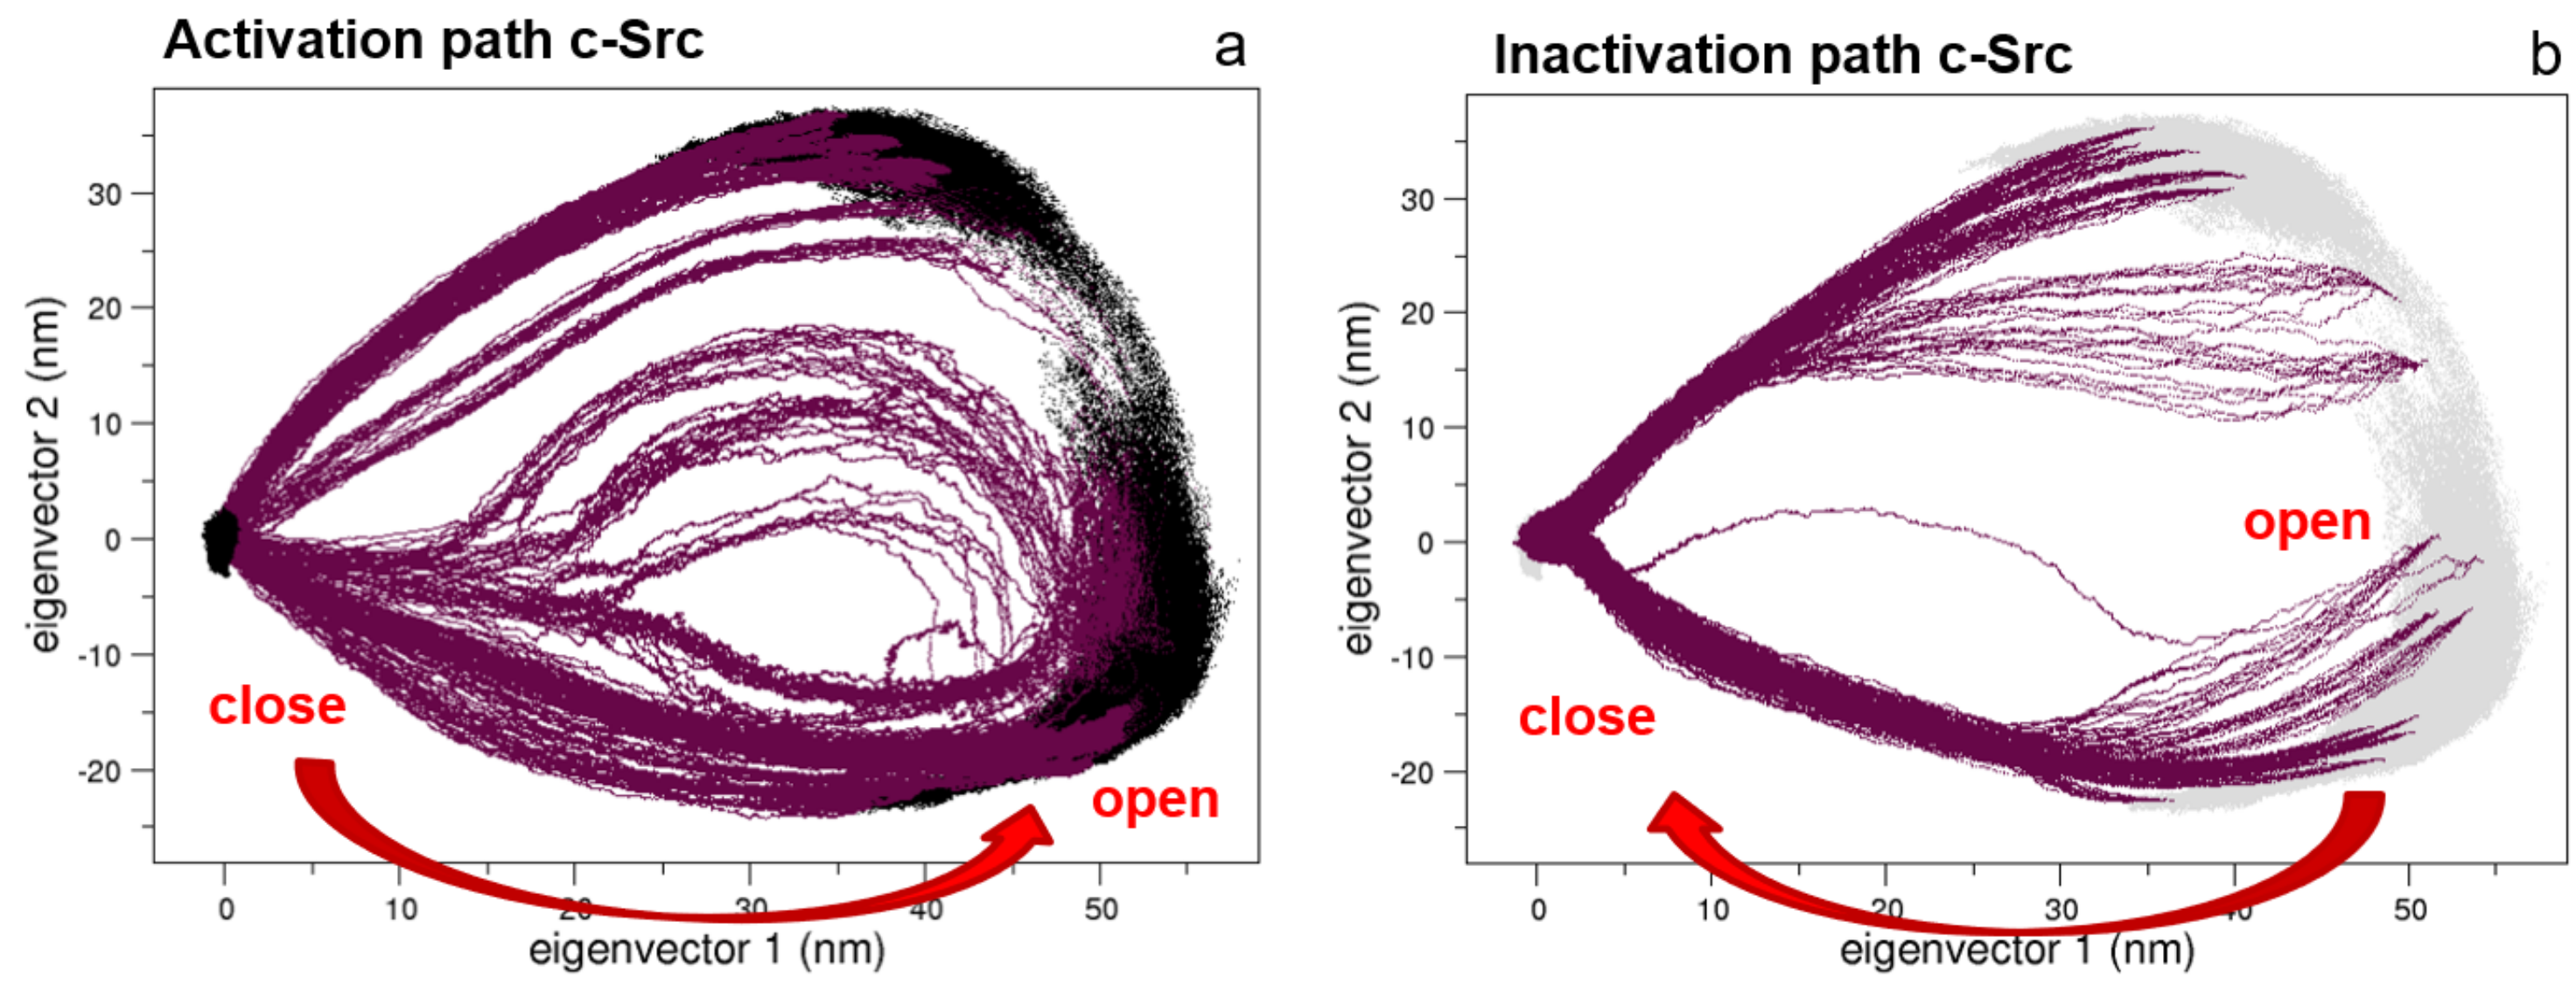
Following our previous approach, where the conformational pathways connecting the open and the closed states of Src protein kinase domains have been described [27,28], here, we apply the same procedure to the full-length c-Src construct. The EDS trajectories describing the activation and the inactivation pathways are represented in Figure 5. Interestingly, the two pathways are quite similar in the essential subspace described by the first two eigenvectors.
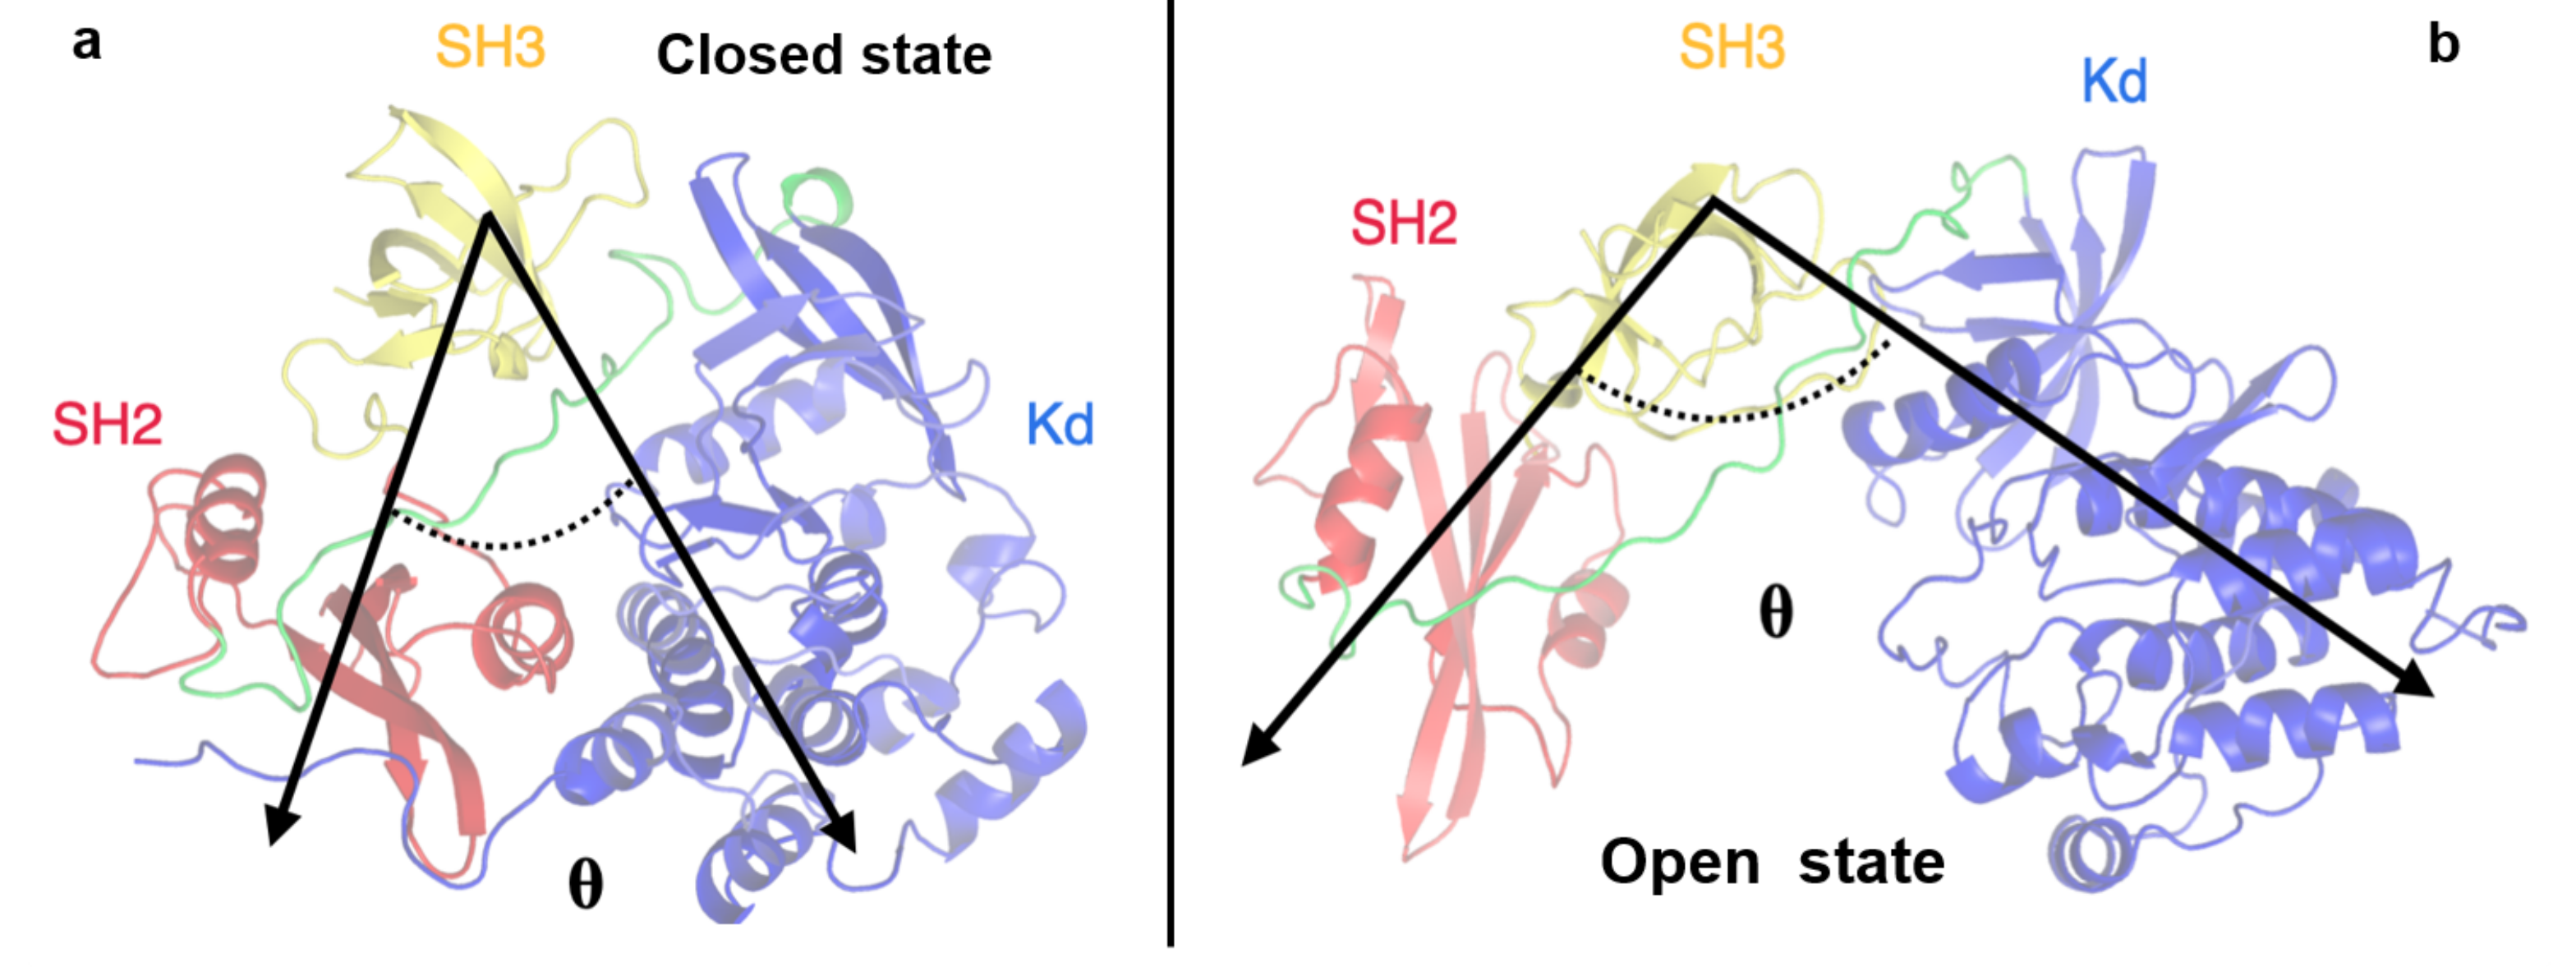
To better describe these pathways, we monitored some structural observables such as the angle between the three protein domains (defined by their center of mass) and the distance between the SH2 and KD domains, computed considering two specific residues: the Asp117 located in the SH2 domain and the Arg318 in the KD. These residues were selected because they form an hydrogen bond that stabilizes the closed conformation and such an interaction is disrupted in the open state (see Figure 6).
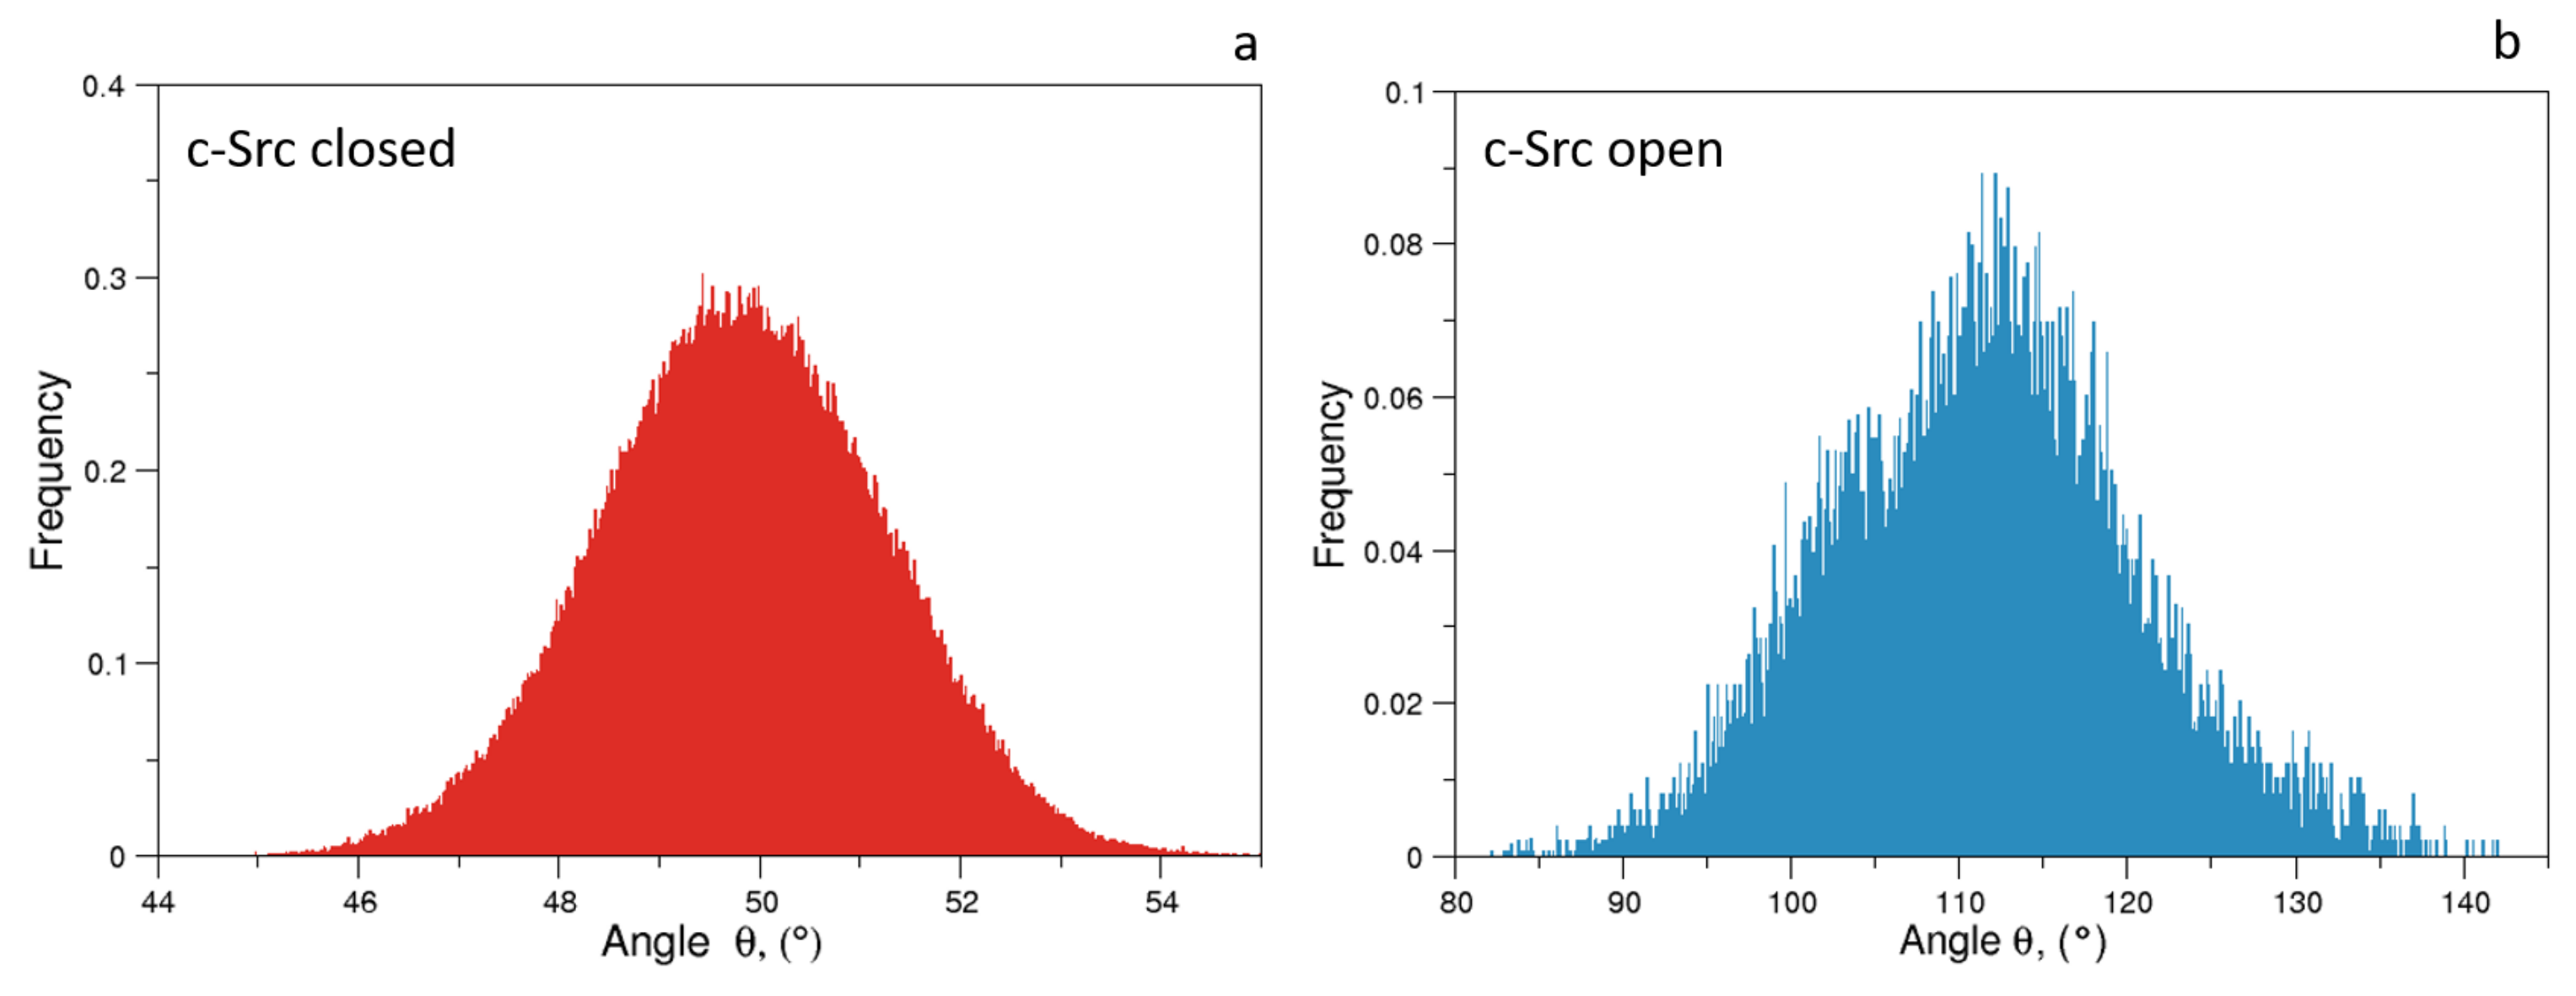
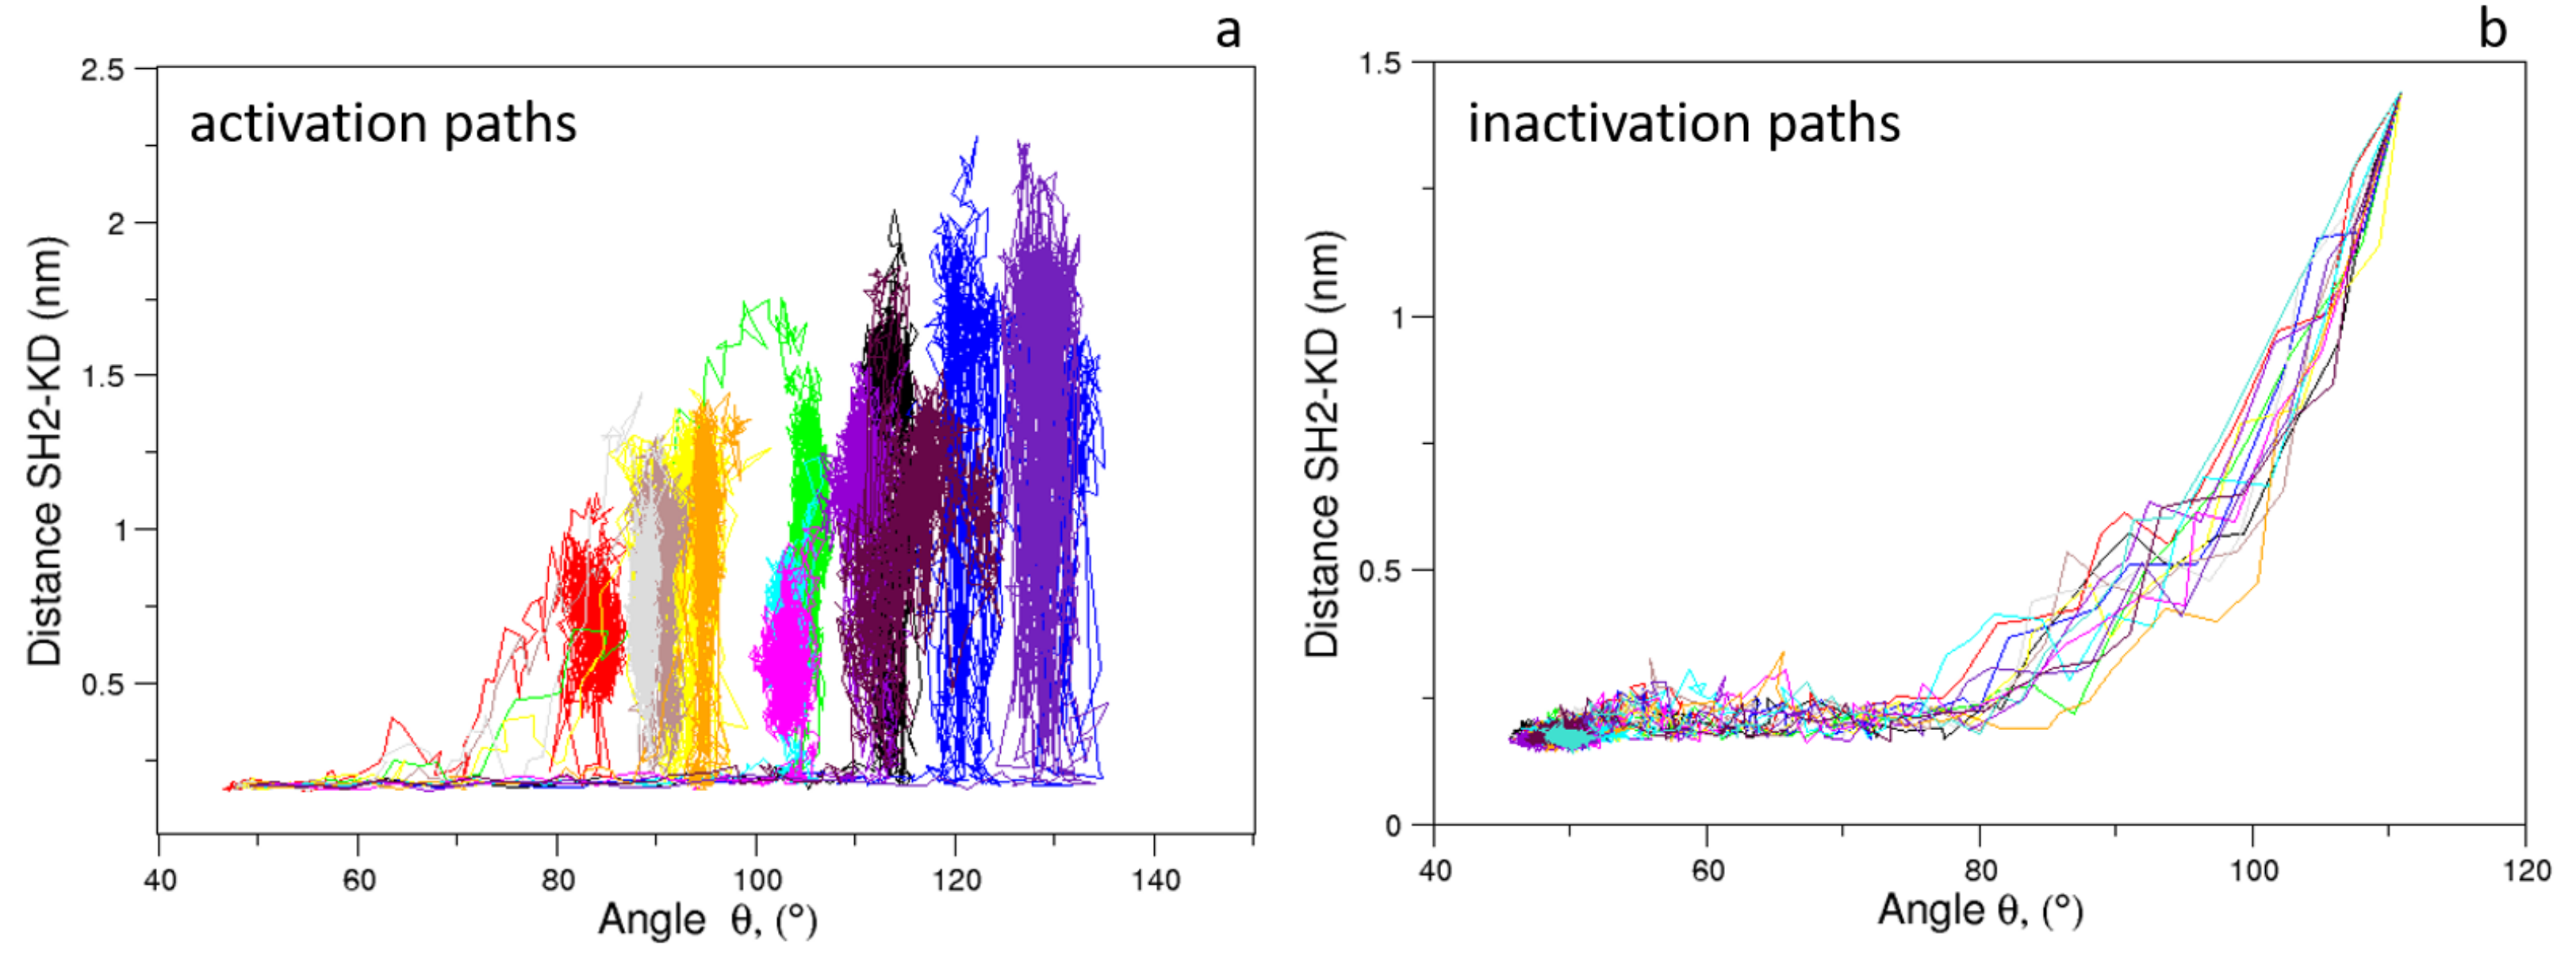
As expected, the distributions of of the unbiased MDs of the closed and the open c-Src (Figure 7) reveal a difference in the corresponding mode values, being ≈50 and ≈115 for the closed and open state, respectively. The distribution is wider in the case of the open state, where higher conformational variability has been observed by ED and RMSF analyses (see above). A similar behavior is observed for the values, for which the values are below 0.6 nm in the closed form and greater than 2.0 nm in the open one (data not shown). The analysis of the trajectory evolution of these two observables, and on the EDS trajectories, reveals two distinct pathways. As shown in Figure 8a, in the activation pathways, the angle approaches the final value interval (between 80–140) faster than the distance . On the contrary, during the inactivation process, such observables decrease almost simultaneously until the distance reaches a stable plateau at ≈0.25 nm. Near this value, reaches values close to those typically observed in the closed form (Figure 8b).
These results point out that, during the activation process, the mutual orientation between the three domains starts to change without affecting their inter-domain contacts. Once the domains begin to separate, these interactions disappear, allowing the protein to reach the open/active state. Similarly, in the inactivation process, the formation of favorable contacts between the domains is already observed when the values are outside of the range of the closed form. In summary, a certain degree of conformational variability in the mutual domain arrangements is observed even in the presence of specific local contacts between the protein domains.
3.3. Src-Imatinib
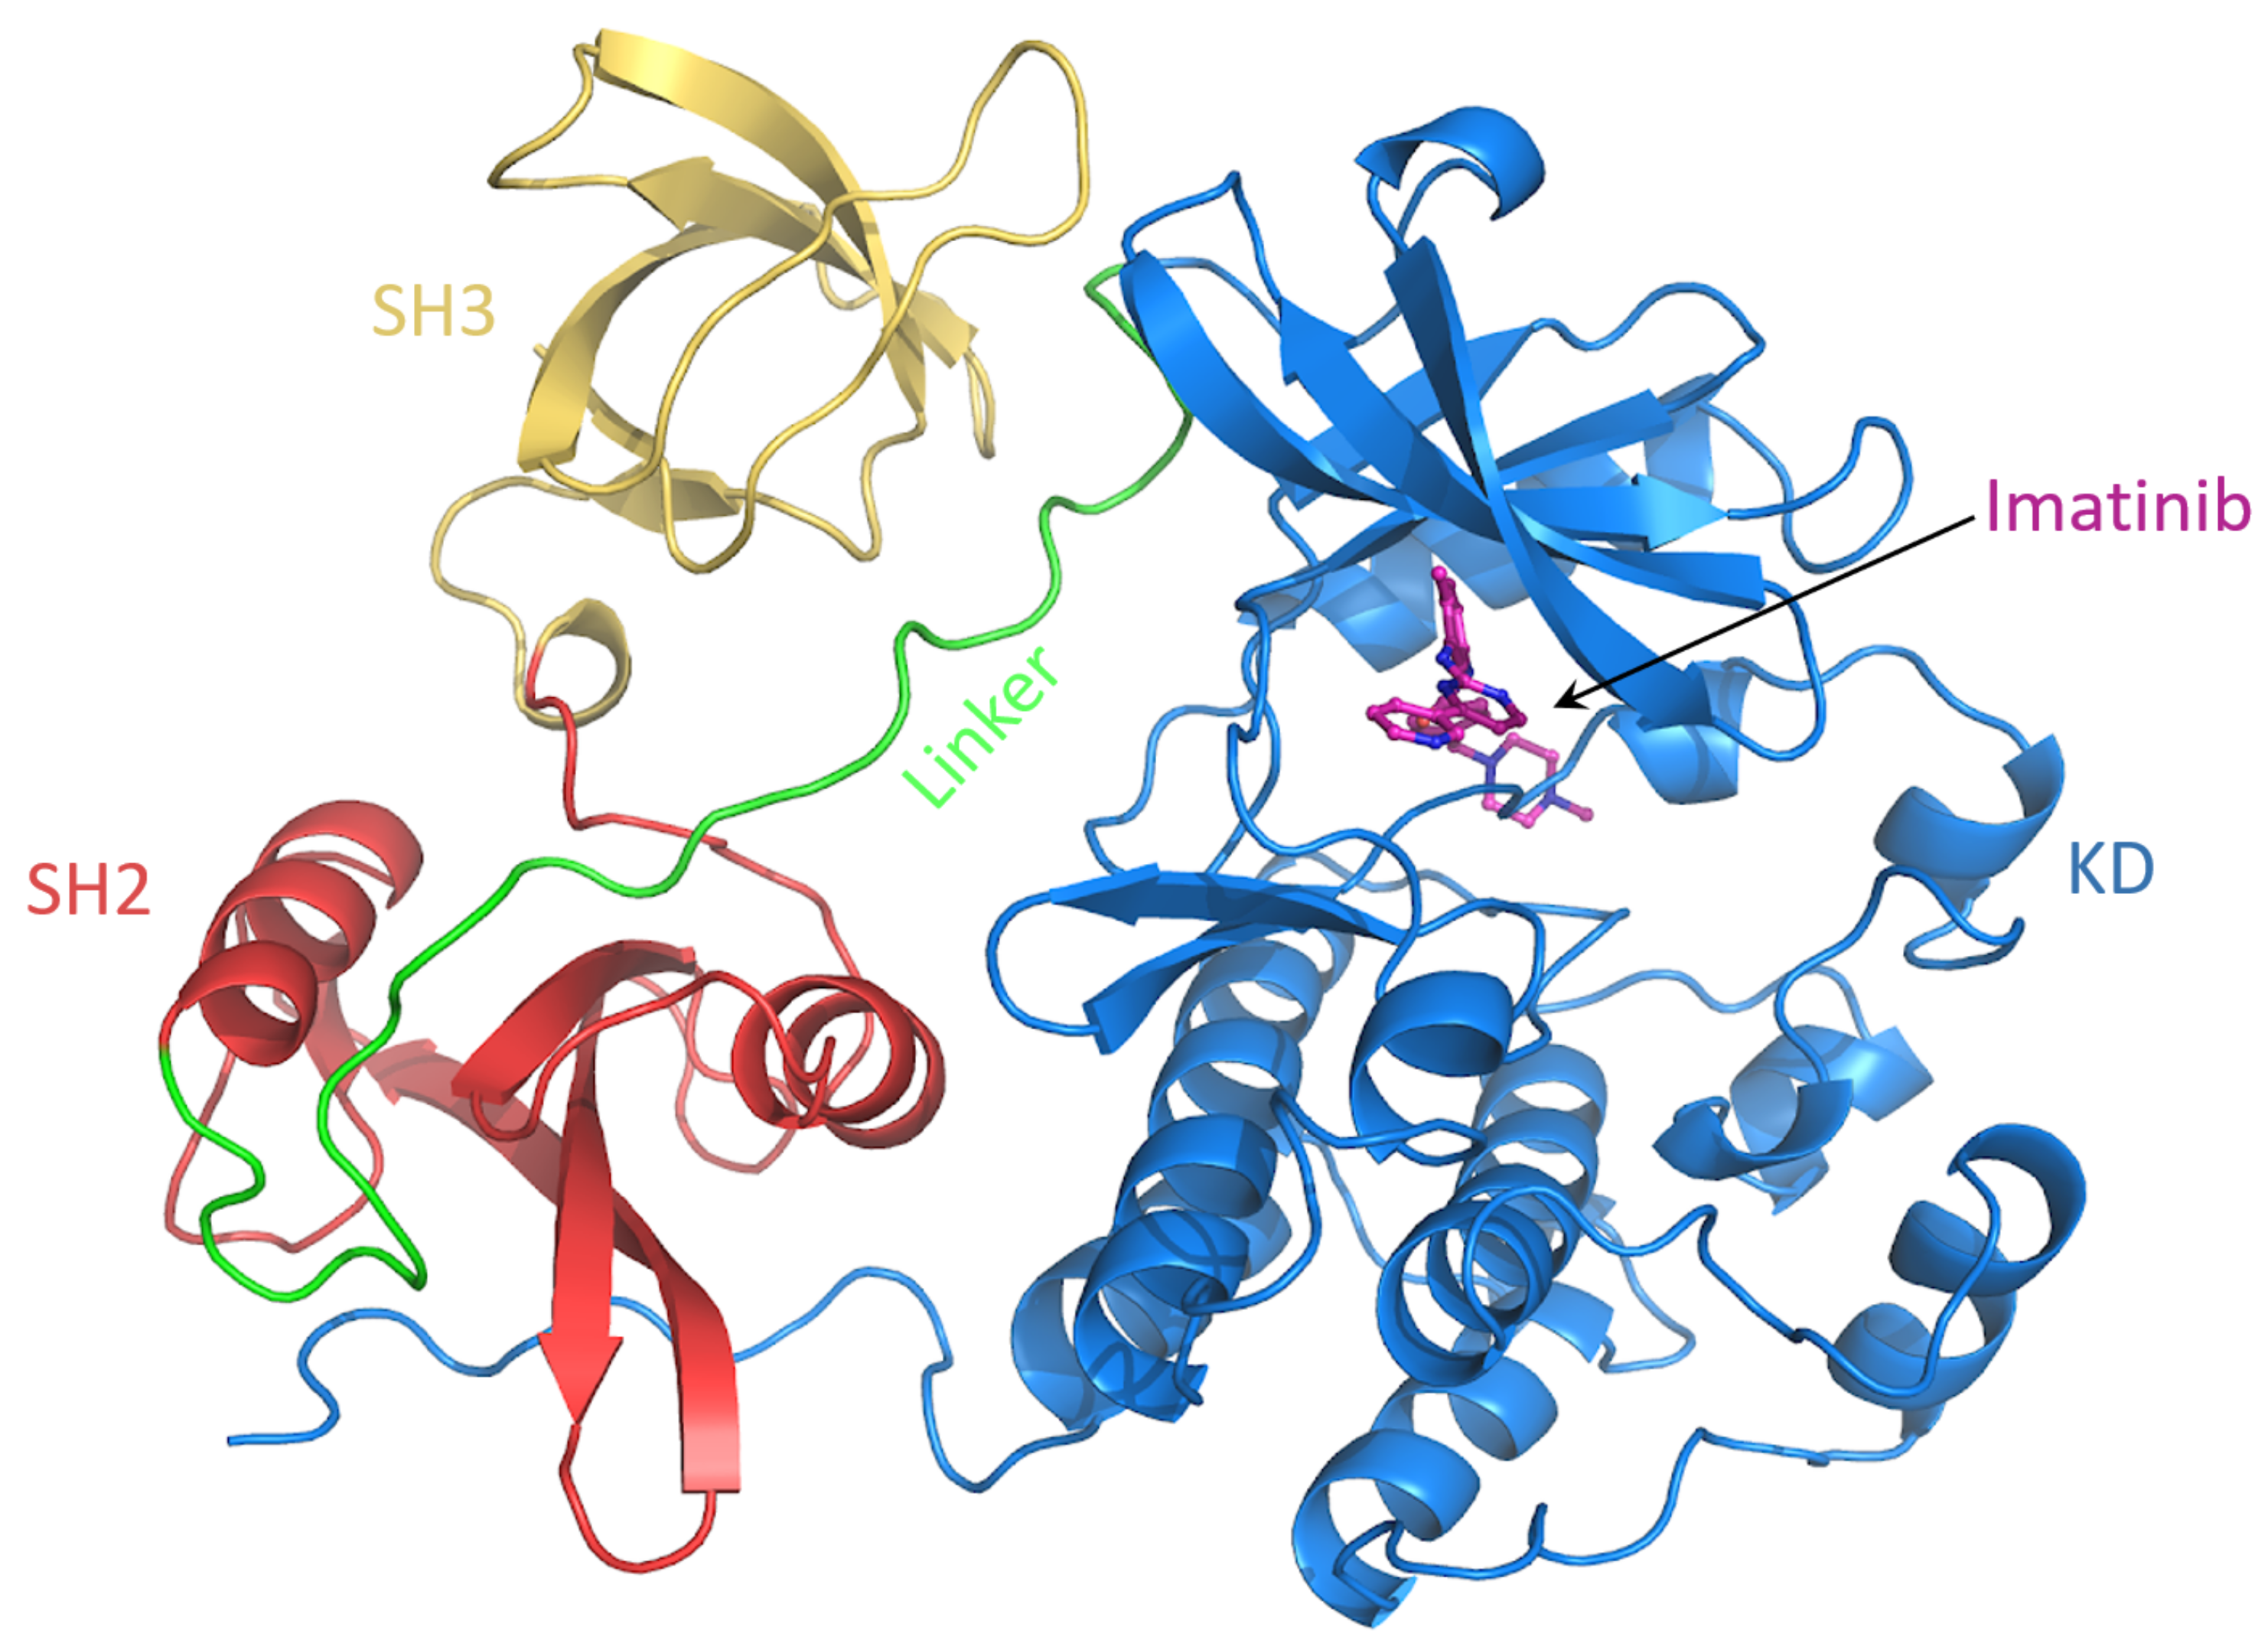
To characterize the conformational behaviour of c-Src bound to imatinib, a MD simulation of 500 ns of such a system was performed (Figure 9). The rationale here is to investigate how the imatinib binding affects the conformational behavior of specific regions of c-Src. In particular, it is known that imatinib does not only affect the binding site, but it also changes the dynamics of distant protein regions, suggesting an allosteric regulation [40].
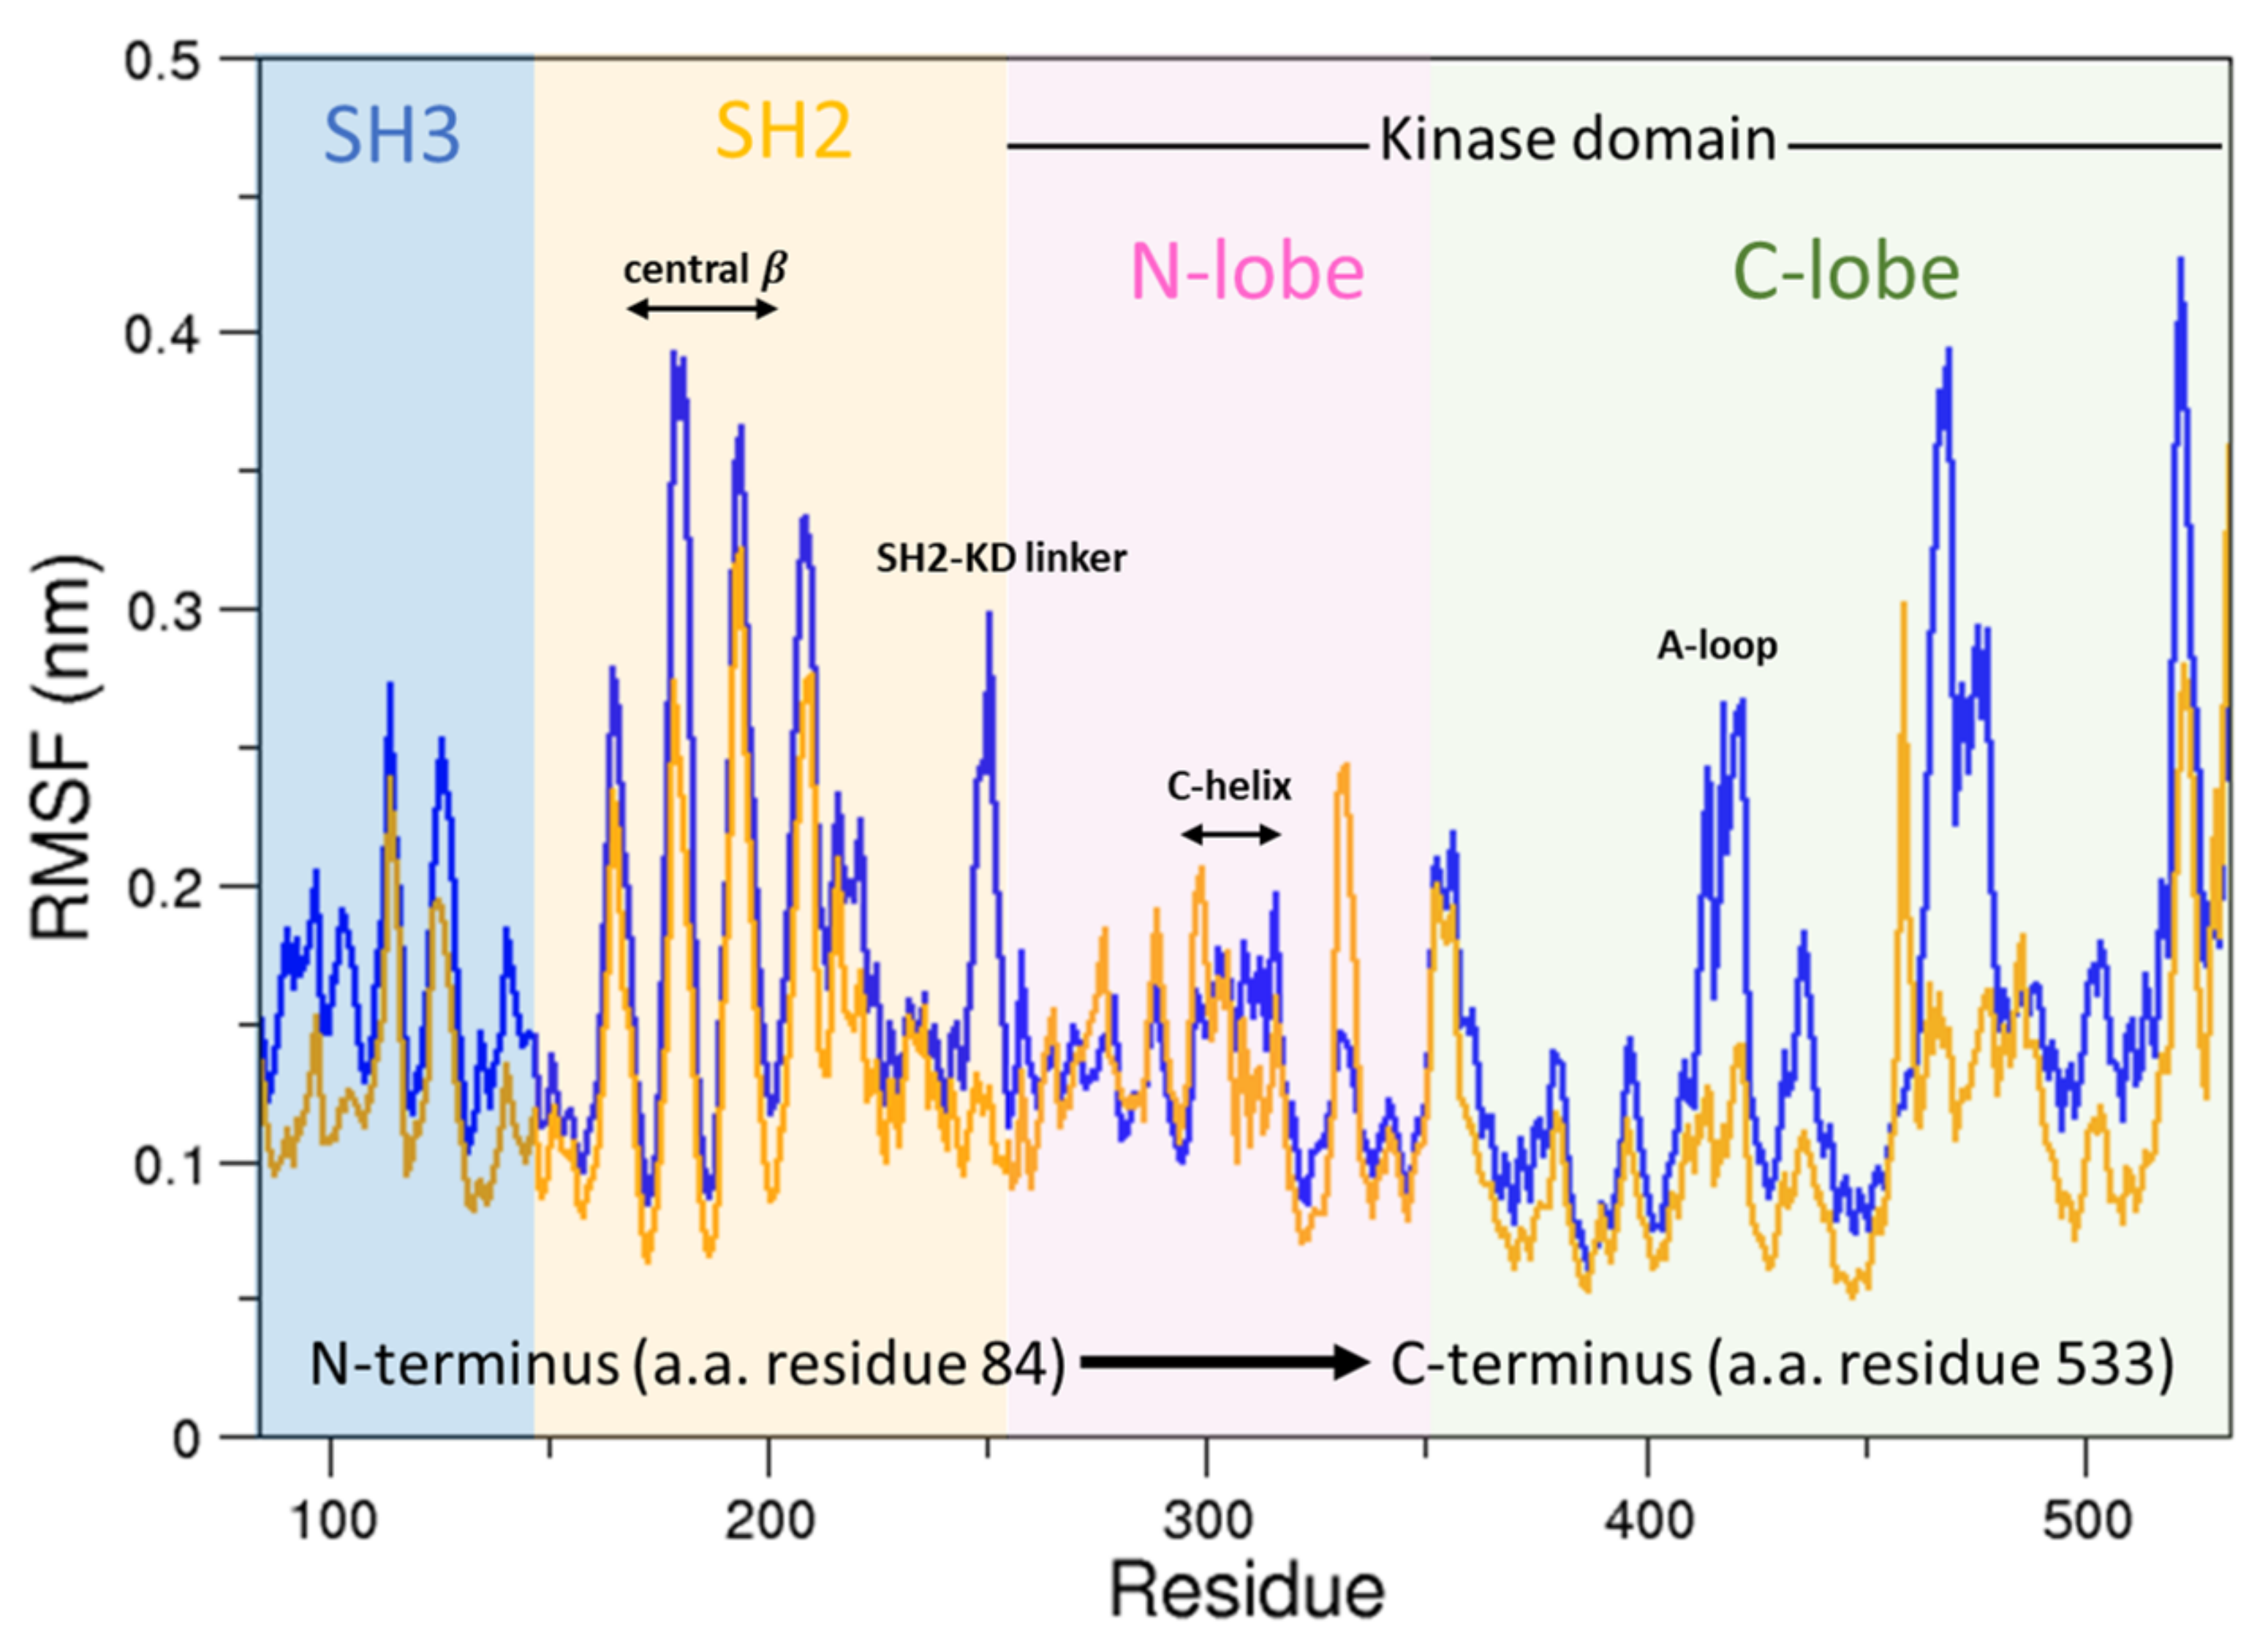
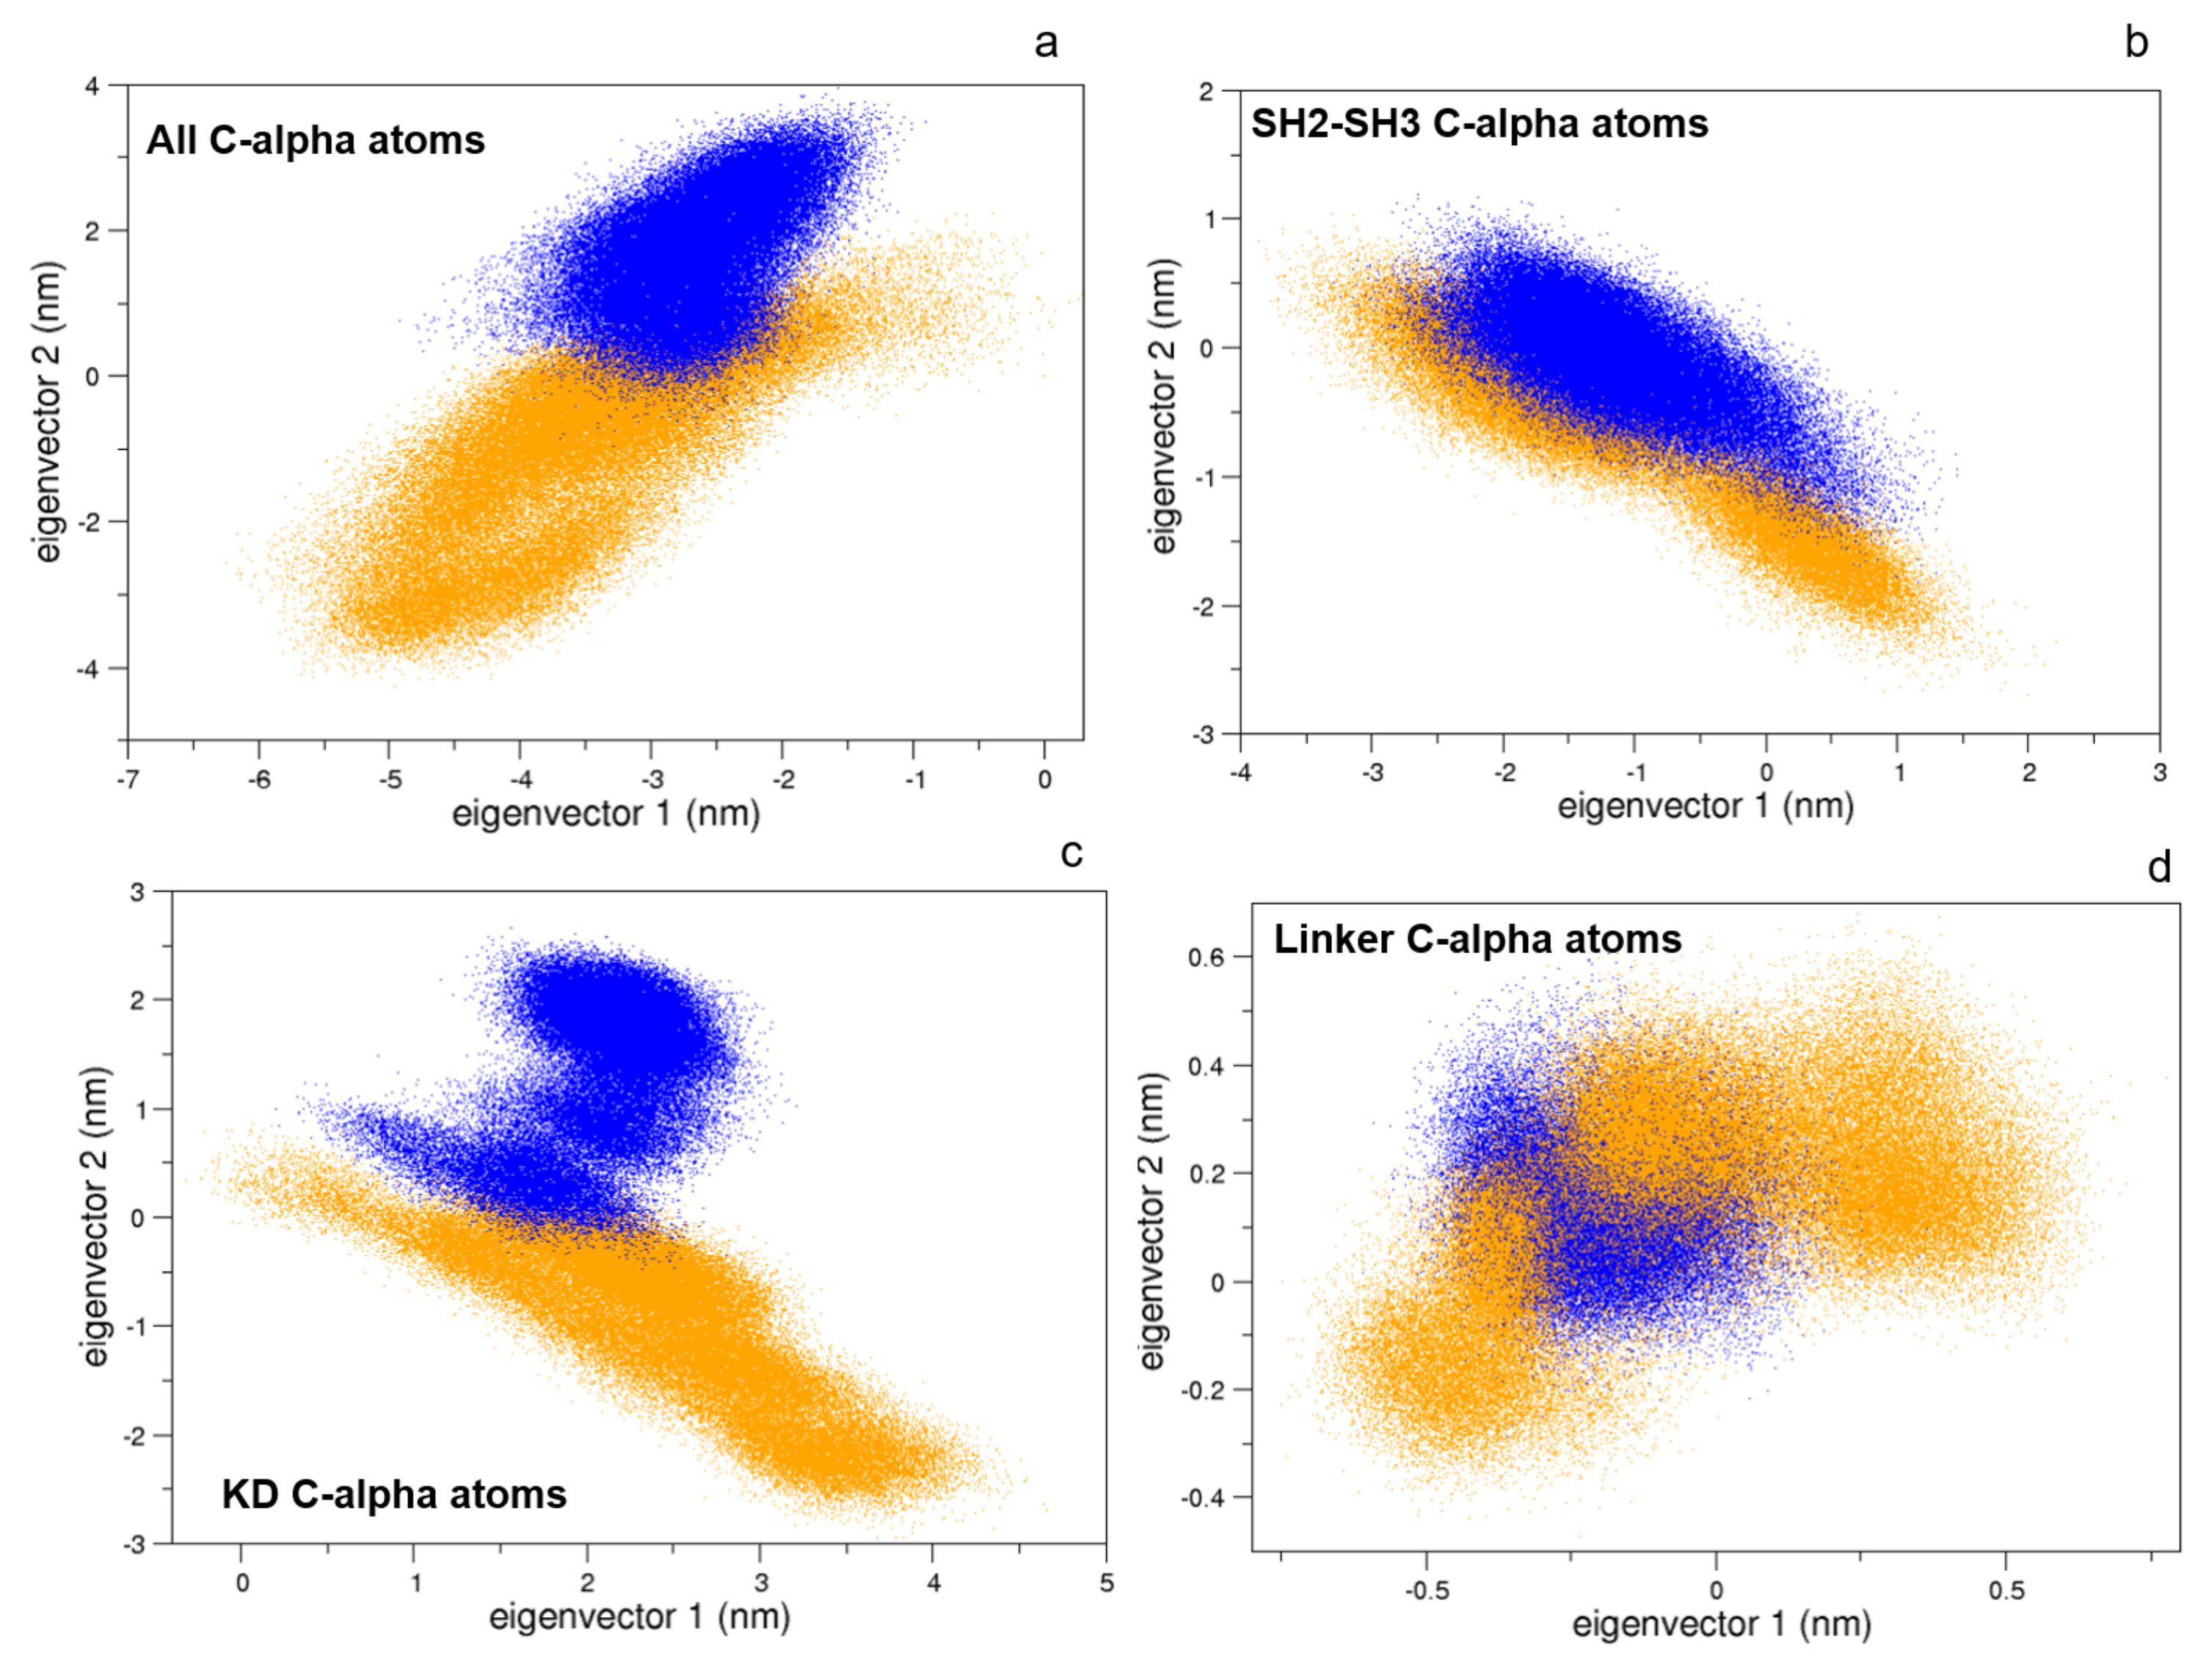
To this end, we compared the atomic fluctuations of the apo and holo forms of the c-Src as provided by the corresponding MD simulations (see Figure 10). Very interestingly, a remarkable increase of the fluctuations is observed in the Activation loop (A-loop) well matching the hydrogen–deuterium exchange experiments recently reported [40]. In line with that experimental paper, the C-helix as well as the regions connecting the three domains are all influenced by the presence of imatinib, as it is shown by the corresponding RMSF increases. It is worth mentioning that, by means of free MD simulations, we observed here also a significant growth of the fluctuations in protein regions far from the inhibitor, thus corroborating the idea that imatinib acts on the structural dynamics of the whole protein construct, stabilizing the inactive form [24]. The other possible inhibition mechanism, i.e., that such an inhibitor affects the conformational pathways, is ruled out by our EDS data (see below). When the collective c-Src conformational behavior is investigated by means of principal component analysis, we observe the effect of the inhibitor shifting the protein in a different region of the conformational space (Figure 11, panel a). Interestingly, imatinib leaves the conformational dynamics of the SH2 and the SH3 domains almost unaltered, but it affects the kinase domain and the linker region motions (Figure 11, panels b, c, and d). As highlighted by the fluctuations analysis, the inhibitor increases the protein flexibility as indicated by the wider regions of the essential subspace sampled by the c-Src bound form with respect to the unbound one for all of the protein regions investigated (Figure 11).
3.4. Activation/Inactivation Pathways of c-Src:Imatinib
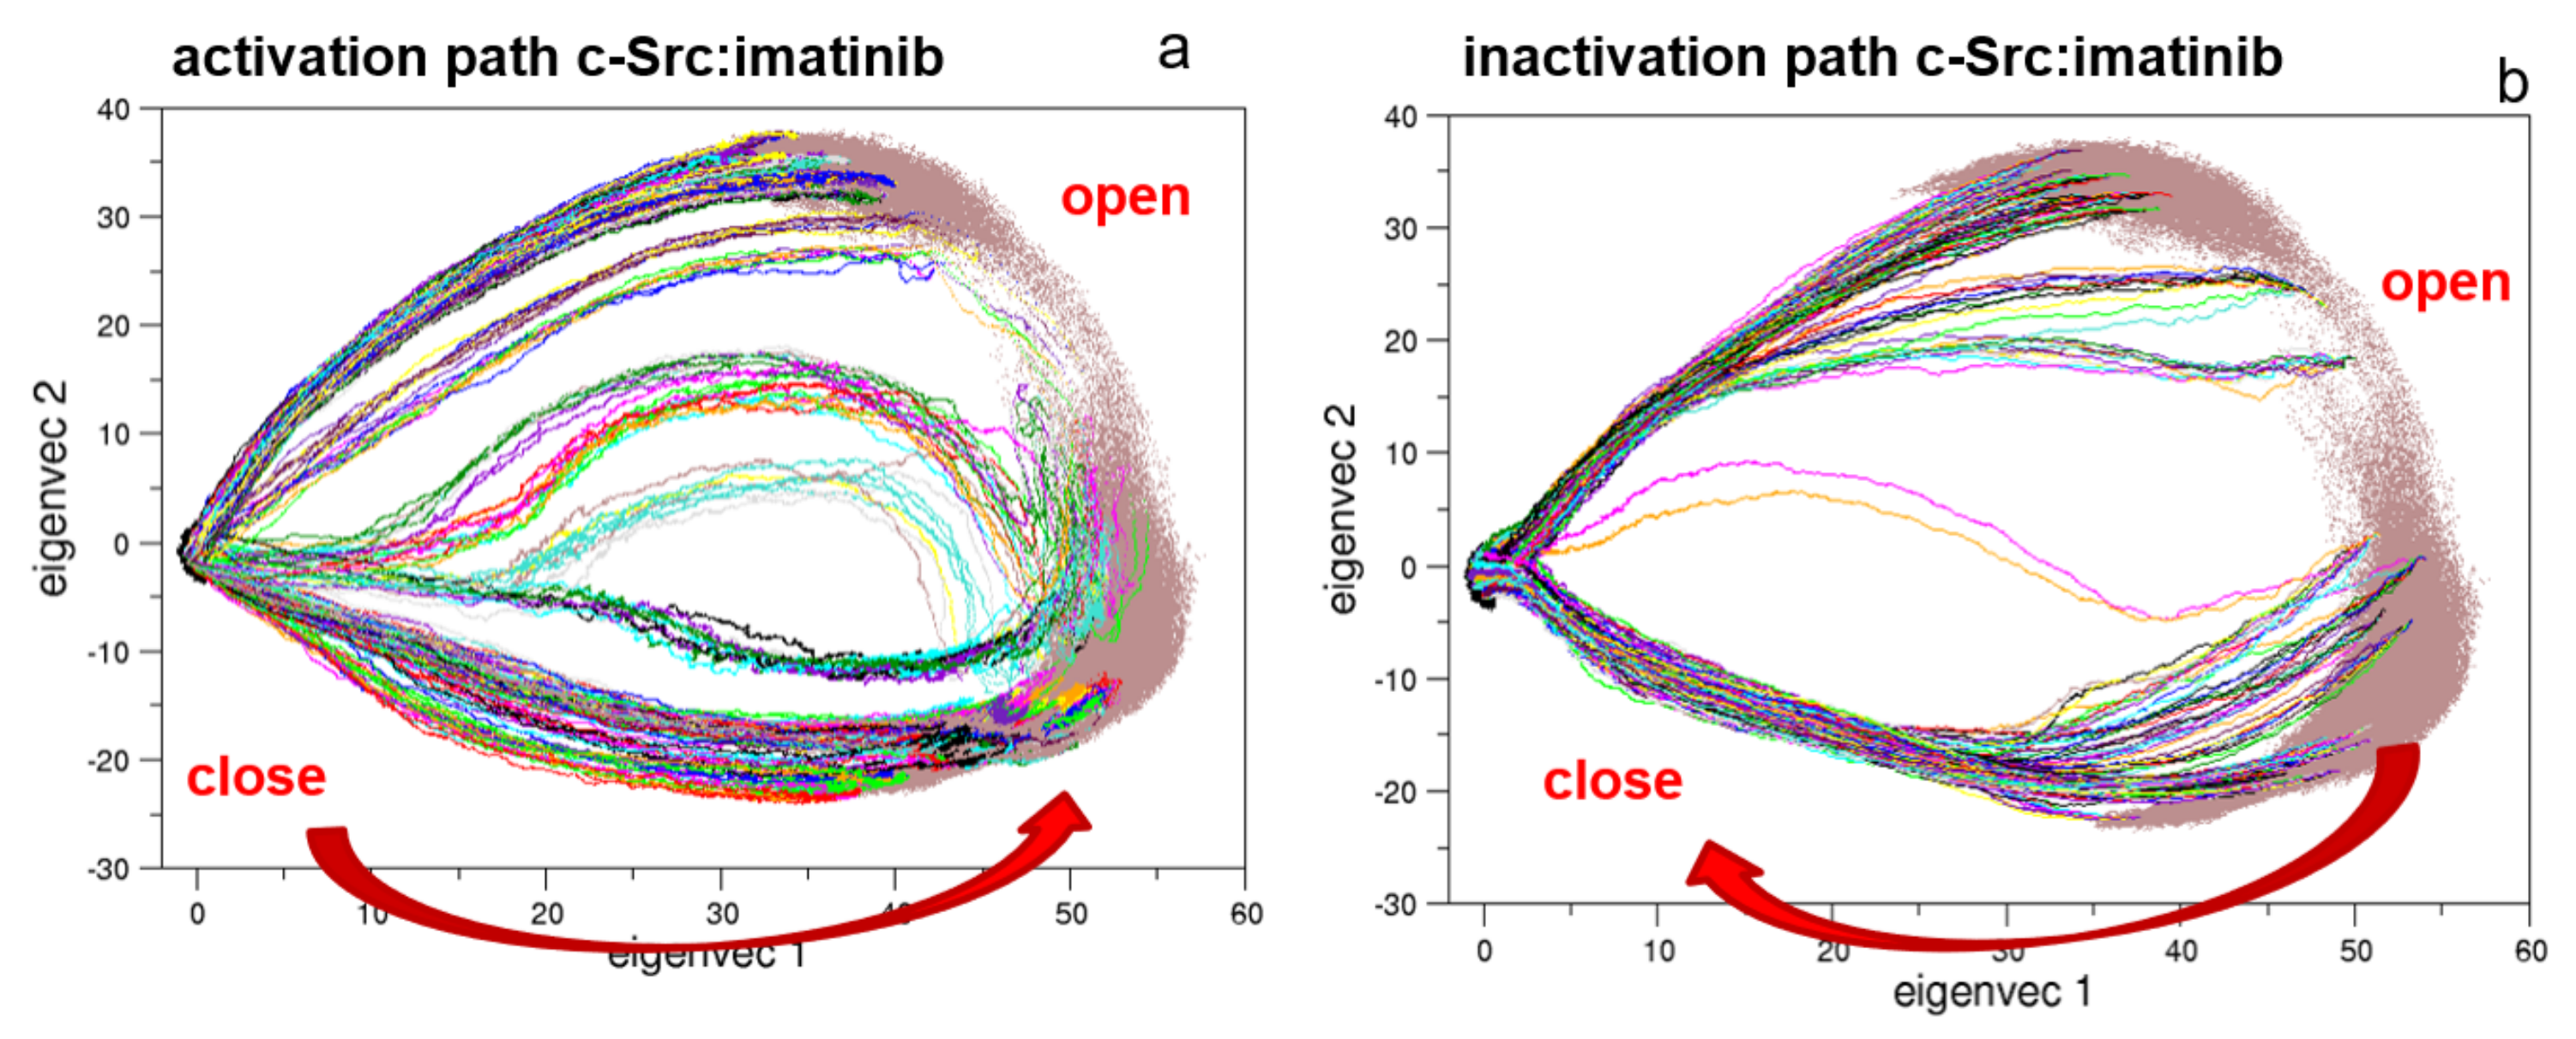
To describe the effect of the inhibitor on the activation/inactivation pathways, 322 EDS trajectories for both the activation and the deactivation processes were calculated (Figure 12). Interestingly, the EDS trajectories of the bound form show almost identical pathways for the activation and the inactivation processes when compared to the corresponding pathways of the unbound forms, at least in the essential subspace.
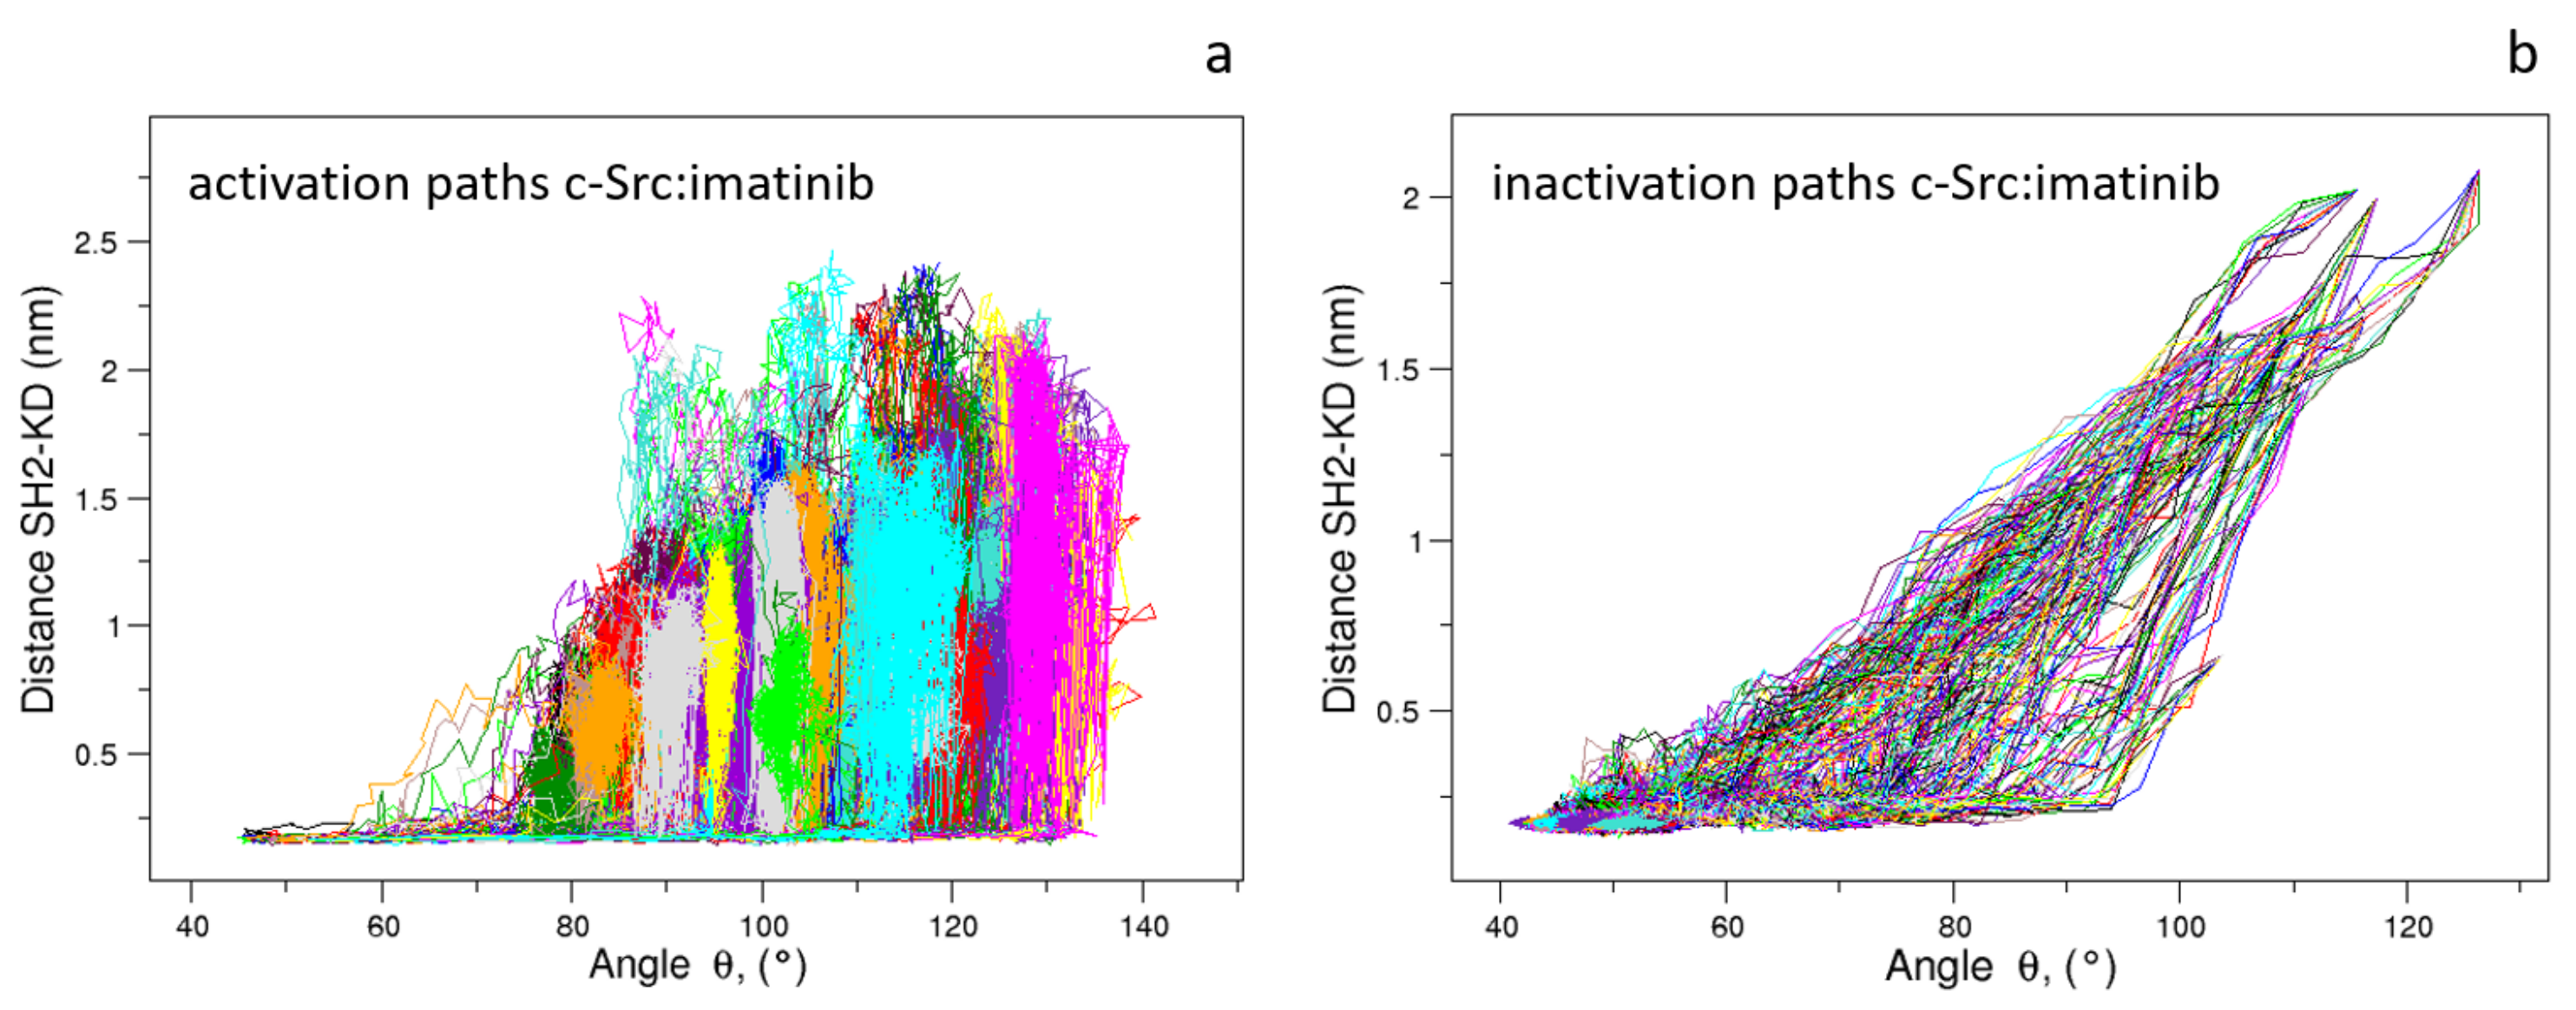
When these pathways are compared through the structural descriptors and used in the characterization of the pathways in the unbound form (see above), a similar behavior is observed. This suggests that the presence of the inhibitor does not influence the evolution of these descriptors: the activation paths reported in Figure 13 show a sudden increase in the , the angle between the three domains and, then the successive disappearance of the interaction between the Asp117 located in the SH2 domain and the Arg318 in the KD as described by the increase in the values. Similarly, the inactivation pathways in the presence of the imatinib are described by the concurrent variation in and up to values compatible with the inactivate form, followed by the limited decrease in the value (Figure 13).
In other words, the effect of the inhibitor, although clear by the alteration in both the fluctuations and the principal component analysis, is almost absent in the conformational changes describing the transition pathways. These results strongly support the picture—corroborated by experimental evidences [24]—that such an inhibitor affects the turnover of kinase, shifting the pool of conformations towards the inactive states.
Videos showing the conformational transitions as obtained by means of EDS approach in both the holo- and apo-states are available in the Supplementary Materials.
4. Conclusions
Here, we reported the description of the conformational behavior of full-length c-Src kinase in both the unbound and imatinib-bound forms as obtained by means of molecular dynamics simulations. As expected, the conformational variability of the open/active forms is more pronounced compared to the unbound ones. This effect is mainly due to both the mutual domain orientations and to the kinase domain dynamics as revealed by principal component analysis, which also show how the SH2 and the SH3 domains are quite unaffected by the protein conformation. Very interestingly, the effect of the inhibitor in the c-Src closed state is the movement of the essential conformational space in a different region as well as an increase in the fluctuations of some particular regions of the proteins well matching the experimental data based on hydrogen–deuterium exchange experiments. It is worth noting that the presence of the inhibitor increases the fluctuations of regions that are quite far from the binding pocket, thus confirming an allosteric effect. These unbiased molecular dynamics trajectories were then used to apply the essential dynamics sampling procedure to describe the pathways connecting two structurally different protein forms. In line with experimental evidences [24], the corresponding pathways seem quite unaffected by the presence of the inhibitor at both the global and local levels In summary, we have shown how it is possible—by means of extended molecular dynamics simulations and an enhanced sampling algorithm—to describe the conformational equilibria of an important protein member of the tyrosine kinase family and to accurately model the conformational rearrangements occurring during the activation and inactivation processes also in the presence of an inhibitor. The agreement with the available experimental evidences strongly indicates the reliability of such an approach, suggesting its applicability to a wide range of complex molecular systems.
Supplementary Materials
The following are available online at https://0-www-mdpi-com.brum.beds.ac.uk/article/10.3390/biophysica1020018/s1, Figure S1: HB between the residues 179T-527Y (black box) and 160R-365D (red box) stabilizing c-Src in close conformation, Figure S2: HB between the residues 11R-221E belonging, respectively, to the SH3 and KD domains for c-Src in open conformation, Table S1: Hydrogen bonds (HB) in c-Src domains for the closed Apo conformation, Table S2: Hydrogen bonds (HB) among c-Src domains for the open conformation. Videos 1 and 2: Videos showing the conformational transition between close and open states for the apo (Video 1) and holo states (Video 2) as obtained by means of EDS.
Author Contributions
Conceptualization, M.D.; methodology, J.A. and M.M.; validation, M.M., and J.A.; writing—original draft preparation, J.A. and M.D.; writing—review and editing, M.D. All authors have read and agreed to the published version of the manuscript.
Funding
This research received no external funding.
Data Availability Statement
The data presented in this study are available on request from the corresponding author.
Conflicts of Interest
The authors declare no conflict of interest.
References
- Warmuth, M.; Damoiseaux, R.; Liu, Y.; Fabbro, D.; Gray, N. Src Family Kinases: Potential Targets for the Treatment of Human Cancer and Leukemia. Curr. Pharm. Des 2003, 9, 2043–2059. [Google Scholar] [CrossRef]
- Irtegun, S.; Akcora-Yıldız, D.; Gulsum Pektanc, G.; Karabulut, C. Deregulation of c-Src tyrosine kinase and its downstream targets in pre-eclamptic placenta. J. Obstet. Gynaecol. Res. 2017, 43, 1278–1284. [Google Scholar] [CrossRef]
- Benati, D.; Baldari, C.T. SRC family kinases as potential therapeutic targets for malignancies and immunological disorders. Curr. Med. Chem. 2008, 15, 1154–1165. [Google Scholar] [CrossRef] [PubMed]
- Guarino, M. Src signaling in cancer invasion. J. Cell. Physiol. 2010, 223, 14–26. [Google Scholar] [CrossRef]
- Frame, M.C. Src in cancer: Deregulation and consequences for cell behaviour. Biochim. Biophys. Acta (BBA) Rev. Cancer 2002, 1602, 114–130. [Google Scholar] [CrossRef]
- Wheeler, D.L.; Iida, M.; Dunn, E.F. The Role of Src in Solid Tumors. Oncologist 2009, 14, 667–678. [Google Scholar] [CrossRef]
- Dehm, S.M.; Bonham, K. SRC gene expression in human cancer: The role of transcriptional activation. Biochem. Cell Biol. 2004, 82, 263–274. [Google Scholar] [CrossRef] [PubMed]
- Bromann, P.A.; Korkaya, H.; Courtneidge, S.A. The interplay between Src family kinases and receptor tyrosine kinases. Oncogene 2004, 23, 7957–7968. [Google Scholar] [CrossRef] [Green Version]
- Parsons, S.J.; Parsons, J.T. Src family kinases, key regulators of signal transduction. Oncogene 2004, 23, 7906–7909. [Google Scholar] [CrossRef] [Green Version]
- Boggon, T.J.; Eck, M.J. Structure and regulation of Src family kinases. Oncogene 2004, 23, 7918. [Google Scholar] [CrossRef] [PubMed] [Green Version]
- Engen, J.R.; Wales, T.E.; Hochrein, J.M.; Meyn, M.A.; Banu Ozkan, S.; Bahar, I.; Smithgall, T.E. Structure and dynamic regulation of Src-family kinases. Cell. Mol. Life Sci. 2008, 65, 3058–3073. [Google Scholar] [CrossRef]
- Yamaguchi, H.; Hendrickson, W.A. Structural basis for activation of human lymphocyte kinase Lck upon tyrosine phosphorylation. Nature 1996, 384, 484–489. [Google Scholar] [CrossRef] [PubMed]
- Kinnings, S.L.; Jackson, R.M. Binding Site Similarity Analysis for the Functional Classification of the Protein Kinase Family. J. Chem. Inf. Model. 2009, 49, 318–329. [Google Scholar] [CrossRef]
- Thomas, S.M.; Brugge, J.S. Cellular functions regulated by Src family kinases. Annu. Rev. Cell. Dev. Biol. 1997, 13, 513–609. [Google Scholar] [CrossRef] [PubMed] [Green Version]
- Cooper, J.A.; Gould, K.L.; Cartwright, C.A.; Hunter, T. Tyr527 is phosphorylated in pp60c-src: Implications for regulation. Science 1986, 231, 1431–1434. [Google Scholar] [CrossRef]
- Patwardhan, P.; Miller, W.T. Processive phosphorylation: Mechanism and biological importance. Cell. Signal 2007, 19, 2218–2226. [Google Scholar] [CrossRef] [Green Version]
- Xu, W.; Doshi, A.; Lei, M.; Eck, M.J.; Harrison, S.C. Crystal structures of c-Src reveal features of its autoinhibitory mechanism. Mol. Cell 1999. [Google Scholar] [CrossRef]
- Amadei, A.; Linssen, A.B.; de Groot, B.L.; van Aalten, D.M.; Berendsen, H.J. An Efficient Method for Sampling the Essential Subspace of Proteins. J. Biomol. Struct. Dyn. 1996, 13, 615–625. [Google Scholar] [CrossRef]
- Roskoski, R., Jr. Src protein-tyrosine kinase structure, mechanism, and small molecule inhibitors. Pharmacol Res. 2015, 94, 9–25. [Google Scholar] [CrossRef] [PubMed]
- Luttrell, D.K.; Luttrell, L.M. G-protein-coupled receptors and Src family kinases. Oncogene 2004, 23, 7969–7978. [Google Scholar] [CrossRef] [Green Version]
- Tong, M.; Seeliger, M.A. Targeting Conformational Plasticity of Protein Kinases. ACS Chem. Biol. 2015, 10, 190–200. [Google Scholar] [CrossRef]
- Agafonov, R.V.; Wilson, C.; Otten, R.; Buosi, V.; Kern, D. Energetic dissection of Gleevec’s selectivity toward human tyrosine kinases. Nat. Struct. Mol. Biol. 2014. [Google Scholar] [CrossRef] [PubMed] [Green Version]
- Lin, Y.L.; Meng, Y.; Jiang, W.; Roux, B. Explaining why Gleevec is a specific and potent inhibitor of Abl kinase. Proc. Natl. Acad. Sci. USA 2013, 110, 1664–1669. [Google Scholar] [CrossRef] [Green Version]
- Seeliger, M.A.; Nagar, B.; Frank, F.; Cao, X.; Henderson, M.N.; Kuriyan, J. c-Src Binds to the Cancer Drug Imatinib with an Inactive Abl/c-Kit Conformation and a Distributed Thermodynamic Penalty. Structure 2007. [Google Scholar] [CrossRef] [PubMed] [Green Version]
- Lovera, S.; Morando, M.; Pucheta-Martinez, E.; Martinez-Torrecuadrada, J.L.; Saladino, G.; Gervasio, F.L. Towards a Molecular Understanding of the Link between Imatinib Resistance and Kinase Conformational Dynamics. PLoS Comput. Biol. 2015, 11, 1–11. [Google Scholar] [CrossRef] [PubMed] [Green Version]
- Nagar, B.; Hantsche, O.; Young, M.A.; Scheffzek, K.; Veach, D.; Bornmann, W.; Clarkson, B.; Superti-Furga, G.; Kuriyan, J. Structural Basis for the Autoinhibition of c-Abl Tyrosine Kinase. Cell 2003, 112, 859–871. [Google Scholar] [CrossRef] [Green Version]
- Milanetti, E.; Trandafir, A.G.; Alba, J.; Raimondo, D.; D’Abramo, M. Efficient and Accurate Modeling of Conformational Transitions in Proteins: The Case of c-Src Kinase. J. Phys. Chem. B 2018, 122, 8853–8860. [Google Scholar] [CrossRef]
- Alba, J.; Milanetti, E.; D’Abramo, M. On the activation and deactivation pathways of the Lck kinase domain: A computational study. J. Comput. Aided Mol. Des. 2019, 1–7. [Google Scholar] [CrossRef] [PubMed]
- Nika, K.; Soldani, C.; Salek, M.; Paster, W.; Gray, A.; Etzensperger, R.; Fugger, L.; Polzella, P.; Cerundolo, V.; Dushek, O.; et al. Constitutively active lck kinase in T cells drives antigen receptor signal transduction. Immunity 2010. [Google Scholar] [CrossRef] [PubMed] [Green Version]
- Wishart, D.S.; Knox, C.; Guo, A.C.; Shrivastava, S.; Hassanali, M.; Stothard, P.; Chang, Z.; Woolsey, J. Drugbank: A comprehensive resource for in silico drug discovery and exploration. Nucleic Acids Res. 2006, 34, D668–D672. [Google Scholar] [CrossRef] [PubMed]
- Wang, J.; Wang, W.; Kollman, P.A.; Case, D.A. Automatic atom type and bond type perception in molecular mechanical calculations. J. Mol. Graph. Model. 2006, 2, 247–260. [Google Scholar] [CrossRef] [PubMed]
- Wang, J.; Wolf, R.M.; Caldwell, J.W.; Kollman, P.A.; Case, D.A. Development and testing of a general amber force field. J. Comput. Chem. 2004, 9, 1157–1174. [Google Scholar] [CrossRef] [PubMed]
- Bayly, C.I.; Cieplak, P.; Cornell, W.; Kollman, P.A. A well-behaved electrostatic potential based method using charge restraints for deriving atomic charges: The RESP model. J. Phys. Chem. 1993, 40, 10269–10280. [Google Scholar] [CrossRef]
- Sousa da Silva, A.W.; Vranken, W.F. ACPYPE—AnteChamber PYthon Parser interfacE. BMC Res. Notes 2013, 367, 2–8. [Google Scholar] [CrossRef] [PubMed] [Green Version]
- Mark, P.; Nilsson, L. Structure and Dynamics of the TIP3P, SPC, and SPC/E Water Models at 298 K. J. Phys. Chem. A 2001, 105, 9954–9960. [Google Scholar] [CrossRef]
- Darden, T.; York, D.; Pedersen, L. Particle mesh Ewald: An N log N method for Ewald sums in large systems. J. Chem. Phys. 1993, 98, 10089–10092. [Google Scholar] [CrossRef] [Green Version]
- Bussi, G.; Donadio, D.; Parrinello, M. Canonical sampling through velocity rescaling. J. Chem. Phys. 2007, 126, 014101. [Google Scholar] [CrossRef] [PubMed] [Green Version]
- Abraham, M.K.; Murtola, T.; Schulz, R.; Páll, S.; Smith, J.C.; Hess, B.; Lindahl, E. GROMACS: High performance molecular simulations through multi-level parallelism from laptops to supercomputers. SoftwareX 2015, 1–2, 19–25. [Google Scholar] [CrossRef] [Green Version]
- Bešker, N.; Amadei, A.; D’abramo, M. Molecular mechanisms of activation in CDK2. J. Biomol. Struct. Dyn. 2014, 32. [Google Scholar] [CrossRef] [PubMed]
- Tsutsui, Y.; Deredge, D.; Wintrode, P.L.; Hays, F.A. Imatinib binding to human c-Src is coupled to inter-domain allostery and suggests a novel kinase inhibition strategy. Sci. Rep. 2016, 6, 1–11. [Google Scholar] [CrossRef]
Figure 1.
Scheme of the principal conformational states of the full-length Src. The three Src domains are represented in different colors (SH2 in yellow, SH3 in light green, and Kinase Domain (KD) in pink). The linker regions are represented by lines. Important protein elements (phosphotyrosine, C-helix, and A-loop) are added to the representation.

Figure 2.
C- RMSDs (Root Mean Square Deviations) computed on the last 400 ns of selected MD trajectories. In black is the closed state RMSDs and in colors (according to the label) are the open states RMSDs as obtained from a subset of representative MD trajectories.
Figure 2.
C- RMSDs (Root Mean Square Deviations) computed on the last 400 ns of selected MD trajectories. In black is the closed state RMSDs and in colors (according to the label) are the open states RMSDs as obtained from a subset of representative MD trajectories.

Figure 3.
The 2D trajectory projections on the common conformational space. On the left, the region explored by the closed states, and on the right the region explored by the open states. The structures of both the forms are reported as the reference.
Figure 3.
The 2D trajectory projections on the common conformational space. On the left, the region explored by the closed states, and on the right the region explored by the open states. The structures of both the forms are reported as the reference.

Figure 4.
The 2D trajectory projections on the Src domain’s common conformational space. In panel (a) is the SH2-SH3 domain projections along the first two eigenvectors; in panel (b) is the KD projections along the first two eigenvectors. The projections for the closed and the open states are labeled.

Figure 5.
Essential Dynamic Sampling (EDS) trajectory projections along the first two principal components. Panels (a,b) describe the activation and the inactivation pathways, respectively.
Figure 5.
Essential Dynamic Sampling (EDS) trajectory projections along the first two principal components. Panels (a,b) describe the activation and the inactivation pathways, respectively.

Figure 6.
Representation of the angle defined by the SH2-SH3-KD domains. The angle describing the closed (panel a) and open states (panel b) is indicated by black arrows. The domains are labelled.
Figure 6.
Representation of the angle defined by the SH2-SH3-KD domains. The angle describing the closed (panel a) and open states (panel b) is indicated by black arrows. The domains are labelled.

Figure 7.
Normalized distributions of the angle for the closed (panel a) and open state (panel b).

Figure 8.
Evolution of the distance vs. angle as observed in the c-Src EDS trajectories for the activation (a) and inactivation processes (b).
Figure 8.
Evolution of the distance vs. angle as observed in the c-Src EDS trajectories for the activation (a) and inactivation processes (b).

Figure 9.
Snapshot of the c-Src–imatinib complex. The domains are labeled.

Figure 10.
RMSFs of the c-Src unbound compared to c-Src–imatinib. In orange is the RMSF of c-Src unbound; in blue is the RMSF of c-Src bound to imatinib.
Figure 10.
RMSFs of the c-Src unbound compared to c-Src–imatinib. In orange is the RMSF of c-Src unbound; in blue is the RMSF of c-Src bound to imatinib.

Figure 11.
Projections of the MD sampled structures on the essential eigenvectors of the combined trajectories of c-Src (blue) and c-Src:imatinib (orange). Alpha carbons were used. (a) Whole protein, (b) SH2-SH3 domains, (c) kinase domain, and (d) linker.
Figure 11.
Projections of the MD sampled structures on the essential eigenvectors of the combined trajectories of c-Src (blue) and c-Src:imatinib (orange). Alpha carbons were used. (a) Whole protein, (b) SH2-SH3 domains, (c) kinase domain, and (d) linker.

Figure 12.
Projection along the first and second principal components of the EDS trajectories of c-Src bound to imatinib. In panels (a,b) are the projections of the 322 EDS trajectories describing the activation and the inactivation pathways, respectively.
Figure 12.
Projection along the first and second principal components of the EDS trajectories of c-Src bound to imatinib. In panels (a,b) are the projections of the 322 EDS trajectories describing the activation and the inactivation pathways, respectively.

Figure 13.
Evolution of the distance vs. angle as observed in the c-Src:imatinib EDS trajectories for the activation (a) and inactivation processes (b).
Figure 13.
Evolution of the distance vs. angle as observed in the c-Src:imatinib EDS trajectories for the activation (a) and inactivation processes (b).

Publisher’s Note: MDPI stays neutral with regard to jurisdictional claims in published maps and institutional affiliations. |
© 2021 by the authors. Licensee MDPI, Basel, Switzerland. This article is an open access article distributed under the terms and conditions of the Creative Commons Attribution (CC BY) license (https://creativecommons.org/licenses/by/4.0/).
Share and Cite
MDPI and ACS Style
Alba, J.; Montagna, M.; D’Abramo, M. Modelling the Activation Pathways in Full-Length Src Kinase. Biophysica 2021, 1, 238-248. https://0-doi-org.brum.beds.ac.uk/10.3390/biophysica1020018
AMA Style
Alba J, Montagna M, D’Abramo M. Modelling the Activation Pathways in Full-Length Src Kinase. Biophysica. 2021; 1(2):238-248. https://0-doi-org.brum.beds.ac.uk/10.3390/biophysica1020018
Chicago/Turabian StyleAlba, Josephine, Maria Montagna, and Marco D’Abramo. 2021. "Modelling the Activation Pathways in Full-Length Src Kinase" Biophysica 1, no. 2: 238-248. https://0-doi-org.brum.beds.ac.uk/10.3390/biophysica1020018